Abstract
The Nile River stretches from south to north throughout the Nile River Basin (NRB) in Northeast Africa. Ethiopia, where the Blue Nile originates, has begun the construction of the Grand Ethiopian Renaissance Dam (GERD), which will be used to generate electricity. However, the impact of the GERD on land deformation caused by significant water relocation has not been rigorously considered in the scientific research. In this study, we develop a novel approach for predicting large-scale land deformation induced by the construction of the GERD reservoir. We also investigate the limitations of using the Gravity Recovery and Climate Experiment Follow On (GRACE-FO) mission to detect GERD-induced land deformation. We simulated three land deformation scenarios related to filling the expected reservoir volume, 70 km3, using 5-, 10-, and 15-year filling scenarios. The results indicated: (i) trends in downward vertical displacement estimated at −17.79 ± 0.02, −8.90 ± 0.09, and −5.94 ± 0.05 mm/year, for the 5-, 10-, and 15-year filling scenarios, respectively; (ii) the western (eastern) parts of the GERD reservoir are estimated to move toward the reservoir’s center by +0.98 ± 0.01 (−0.98 ± 0.01), +0.48 ± 0.00 (−0.48 ± 0.00), and +0.33 ± 0.00 (−0.33 ± 0.00) mm/year, under the 5-, 10- and 15-year filling strategies, respectively; (iii) the northern part of the GERD reservoir is moving southward by +1.28 ± 0.02, +0.64 ± 0.01, and +0.43 ± 0.00 mm/year, while the southern part is moving northward by −3.75 ± 0.04, −1.87 ± 0.02, and −1.25 ± 0.01 mm/year, during the three examined scenarios, respectively; and (iv) the GRACE-FO mission can only detect 15% of the large-scale land deformation produced by the GERD reservoir. Methods and results demonstrated in this study provide insights into possible impacts of reservoir impoundment on land surface deformation, which can be adopted into the GERD project or similar future dam construction plans.
1. Introduction
The Nile River stretches from south to north (length: 6853 km) throughout the Nile River Basin (NRB; area: 3.4 × 10⁶ km2) in Northeast Africa. The Nile’s primary tributaries are the White and Blue Niles (Figure 1a). The White Nile flows from Lake Victoria, and then runs through Uganda into Sudan. It meets the Blue Nile (which originates from Lake Tana in Ethiopia; Figure 1b) at the city of Khartoum in Sudan, then flows through Egypt into the Mediterranean Sea (Figure 1a).
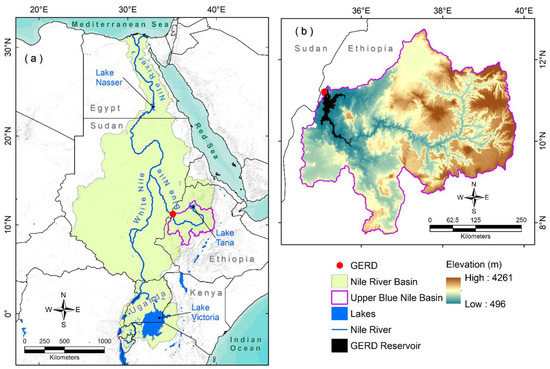
Figure 1.
(a) Spatial distribution of the Nile River Basin (NRB) in Northeast Africa, encompassing the Blue Nile originating from Ethiopia, the White Nile originating from Uganda, and the Nile River flowing through Egypt and draining into the Mediterranean Sea. The locations of the Grand Ethiopian Renaissance Dam (GERD), Lake Nassar, Lake Tana, Lake Victoria, and Upper Blue Nile sub-basin are also shown. (b) Elevation of the Upper Blue Nile sub-basin. The locations of the GERD and the GERD reservoir are also shown.
The NRB extends over 11 African countries and represents a home for more than 300 million people, the majority of whom live in rural areas. However, the NRB is extremely vulnerable to both natural climatic and anthropogenic forces. Natural factors include climatic cyclicity that affects flow volumes and timing, such as changes in precipitation and temperature patterns, and changes in the frequency and severity of floods and drought events [1,2,3,4]. Anthropogenic forces include population growth as well as hydrologic alteration projects. Examples of these projects include, but are not limited to, the construction of new and heightening of existing irrigation and hydropower dams [5,6,7,8].
In 2011, Ethiopia began the construction of the Grand Ethiopian Renaissance Dam (GERD), which will generate 6.45 gigawatts of electricity upon completion [9]. The construction of the GERD will significantly affect the surface water allocation of downstream countries (such as Egypt and Sudan) [7,10,11].
The GERD, formerly known as the Millennium Dam, is located on the Blue Nile (Figure 1b) in the Benishangul-Gumuz region of Ethiopia, about 15 km east of the border with Sudan (Figure 1). The Blue Nile runs north–south and then east–west through the Upper Blue Nile Basin (area: 173,000 km2; Figure 1b). The construction of the GERD was approximately 70% complete as of October 2019 [12].
It is anticipated that the GERD reservoir will have an active capacity of up to 70 km3 [13]. Reservoir volume and filling time are critical issues for the downstream countries, because both of these factors will affect their Nile water allocation. Reservoir volume and filling time will also affect the spatial and temporal land surface deformation below and around the reservoir area. Media reports suggest different reservoir volumes to be filled in different time periods (e.g., filling 16, 63, 67, 70, and 74 km3 in 3, 5, 7, 10, and 15 years, respectively [14]). A shorter filling period could lead to significant water scarcity, because less water will be released to the downstream countries. In addition, a large-scale land deformation caused by significant water relocation is likely to be observed around the GERD area [15]. The hydrostatic pressure of a reservoir could cause a permanent horizontal displacement which is perpendicular to the center line of the dam [16].
Current research has overlooked monitoring and/or predicting large-scale land deformations around the GERD. Despite the fact that several approaches can be used to monitor large-scale land deformation [17,18,19,20,21], none of them have been used to detect the GERD-induced land deformation. The Global Positioning System (GPS), for example, is regularly used to monitor land surface deformation rates and locations [22,23]. However, the high cost of operation and maintenance of GPS stations means that the number of permanent stations in the NRB is limited. Remote sensing techniques can be also used to monitor land deformation with reasonable accuracy and spatial detail [24]. Radar interferometry, for example, is a technique that uses multi-temporal radar images to infer topographic relief as well as subtle topographic changes. This technique has been successfully used to map and measure dam-induced land deformation [25,26,27], aquifer compaction from pumping [28], and land subsidence in urban areas [18,29,30,31]. The Gravity Recovery and Climate Experiment (GRACE) and its successor, GRACE-Follow On (GRACE-FO), missions were used to derive large-scale land deformation as well as terrestrial water storage anomalies [32,33,34,35]. Both missions measure temporal variability in the Earth’s global gravity field [36,37,38]. Despite their coarser spatial resolution compared to radar interferometry, GRACE and GRACE-FO have been successfully used to map large-scale land deformation in, for example, North China [39], Nepal [40], Southern Alaska [17], Europe [41], and Southeast Asia [15,42]. It is foreseen that the GRACE-FO mission will be primarily used to monitor the impoundment effect when the GERD is in operation. This study is the first to forecast land deformation by simulating GRACE-FO data and provides an evaluation of strengths and limitations of using satellite gravity data.
The key considerations while monitoring and quantifying land deformation associated with the GERD construction are reservoir area, volume, inflow based on hydroclimatic conditions, and outflow based on impoundment/release strategies, as well as evaporation rates. For example, higher land deformation rates are expected with larger reservoir volumes and areas. In this study, we develop a novel approach to predict the land deformation induced by the construction of a new surface reservoir. The GERD reservoir in Ethiopia is selected as a test site. The study focuses mainly on large-scale deformation caused by the mass of the GERD reservoir (Figure 1b). Because several reservoir volumes and filling times are reported, we provide three land deformation scenarios related to filling 70 km3 in 5, 10, and 15 years, respectively. These scenarios represent the minimum, average, and maximum filling periods of the GERD reservoir.
2. Study Area
The GERD site is underlain by Archaean igneous and metamorphic rock units. Igneous rocks include granite and diorite, whereas the metamorphic units include amphibolite, schist, quartzite, and meta sediments. In some parts, the basement rocks were covered by sedimentary sequence of conglomerate, sand, and sandstone [43]. The rock units in the GERD site are affected by group of faults and shear zones trending mainly in NNE–SSW, NE–SW, and NNW–SSE directions and aligning with the African Rift [43,44,45,46].
Previous studies have investigated how the GERD will affect water resources in downstream countries (e.g., Egypt and Sudan). For example, Sultan et al. [10] found that Egypt will lose 25–30% of its surface water allocation (55 km3) annually to fill the 70 km3 GERD reservoir in seven years. Zhang et al. [47] reported that the four-, six-, and eight-year filling strategies would result in sharp reductions in the downstream countries’ surface water resources—by 35%, 24%, and 18%, respectively. However, Mulat and Moges [48] reported that if the mean inflow to the GERD reservoir is around the long-term mean (49,944 km3/year), the six-year filling strategy would be adequate to fill the GERD reservoir without causing significant impacts on the surface water resources of downstream countries. Wheeler [49] indicated that the GERD’s risks in Sudan could be managed, whereas the risks to Egyptian population could be minimized by integrating agreed-upon annual releases of the Blue Nile’s water from the GERD, a drought-management policy for Lake Nasser (Figure 1a), and a basin-wide cooperative agreement.
3. Data and Methods
The data processing used in this study follows five steps (Figure 2). First, we calculated the monthly reservoir volume, surface area, and water thickness based on different filling strategies (e.g., 5, 10, and 15 years). Secondly, a global map (pixel size: 0.1°) was generated; the pixels inside the GERD were filled with monthly water thickness values and the others were filled with zeros. The resolution (e.g., 0.1°) of the global map was found to be computationally efficient and was sufficient to accurately delineate the GERD reservoir during different filling scenarios. Thirdly, the global water thickness maps were converted to spherical harmonic coefficients (SHC) to a maximum degree/order of 1800. Fourthly, the equivalent water height (EWH) and the deformation components (vertical and horizontal displacement) were computed from the SHC. Finally, time series and annual trends of deformation components were extracted over the GERD reservoir.
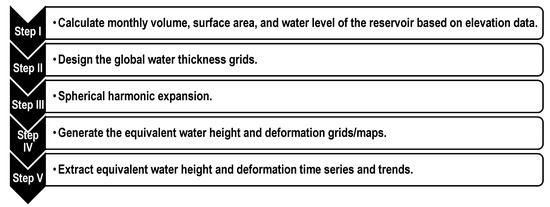
Figure 2.
Data processing steps used in this study.
3.1. Prediction of Reservoir Levels
The digital elevation model (DEM; spatial resolution: 30 m; Figure 1b) data derived from the Shuttle Radar Topography Mission (SRTM) were used to estimate the monthly reservoir volume, surface area, and water thickness of each filling scenario as follows: (i) the average monthly filling volumes corresponding to the fast (5-year), medium (10-year), and slow (15-year) filling scenarios were estimated; (ii) the monthly surface area under each volume was calculated using ArcGIS tools; (iii) the monthly water thickness was calculated by dividing the monthly filling volume by surface area; and (iv) monthly global maps (pixel size: 0.1°) were generated for each filling scenario, where the pixels inside the GERD were filled with monthly water thickness values, and the others were filled with zeros.
3.2. Estimation of EWH and Surface Deformation
The global water thickness grids, generated in Section 3.1 (iv), were converted to SHC [38] as follows:
where Δσ(θ,φ) is the water thickness, θ is the colatitude, φ is the longitude, a is the radius of the Earth, ρw is the average density of water, is the normalized associated Legendre function of the first kind of degree n and order m, and and are the dimensionless SHC variations of degree n and order m. The Nmax was set to 1800. The SHTools python package, developed by Wieczorek and Meschede [50], was used in SHC conversion.
The monthly SHC, together with load Love numbers, are used to compute the EWH and the deformation with three-dimensional displacement (vertical, east, and north) caused by the mass load variations as follows [15,51]:
where (Δv, Δn, Δe) are the displacement of the Earth’s surface in the vertical, north, and east directions, respectively; (kn, hn, ln) are the unitless load Love numbers of degree n; and ρe is the average density of the Earth. This study used the load Love numbers generated by Wang et al. [52].
4. Results
4.1. Reservoir Area, Volume, and Water Thickness
Figure 3 shows temporal variations of the simulated reservoir volume, area, and water thickness based on 5-, 10-, and 15-year filling strategies. Examination of Figure 3 reveals that the larger the filling period, the smaller the monthly water thickness, volume, and surface area of the GERD reservoir. For example, monthly average volumes of 1.17, 0.58, and 0.39 km3 are required to completely fill the GERD reservoir during 5-, 10-, and 15-year scenarios, respectively. In addition, the monthly change of water thickness is estimated to be 0.68, 0.34, and 0.23 m for the 5-, 10-, and 15-year scenarios, respectively. The average monthly changes of the reservoir area are 28.15, 14.10, and 9.38 km2 for the 5-, 10-, and 15-year scenarios, respectively.
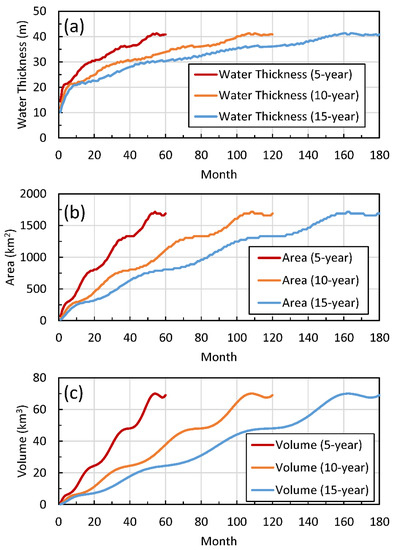
Figure 3.
Monthly simulation of the GERD reservoir (a) water thickness, (b) area, and (c) volume, based on 5-, 10-, and 15-year filling strategies.
Figure 4 demonstrates the spatial and temporal variability in reservoir volume, area, and water thickness at different phases of each filling strategy. Figure 4 indicates that the first filling month of the 5-year scenario generates a 68.2 km2 reservoir with a 1.0 km3 water storage and 14.4 m average water thickness. Estimates from the 10- and 15-year filling scenarios are lower, given the longer time it would take to fill the reservoir (10 years: 24.1 km2, 0.3 km3, 11.8 m; 15 years: 14.9 km2, 0.2 km3, 10.3 m). Regardless of the filling strategy, the reservoir will reach an area of 1113.7 km2, a volume of 37.8 km3, and an average water thickness of 34.0 m halfway to the filling time, or the equivalent of the 30th, 60th, and 90th month, corresponding to the 5-, 10-, and 15-year strategies, respectively. In addition, during the 60th month, which is the end of the 5-year filling strategy, only ~50% and ~32% of the GERD reservoir will be filled for the 10-, and 15-year filling strategies, respectively. At the end of each filling scenario, the GERD reservoir will reach a 70 km3 volume, a 1689 km2 area, and a 41 m average water thickness.
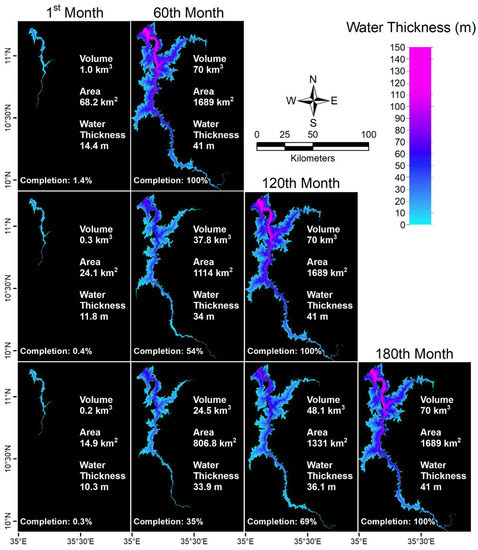
Figure 4.
Spatiotemporal variability of the GERD reservoir volume, area, water thickness, and completion percentage for months 1 and 60 in the 5-year filling strategy (top row); months 1, 60, and 120 in the 10-year filling strategy (middle row); and months 1, 60, 120, and 180 in the 15-year filling strategy (bottom row).
4.2. Equivalent Water Height
Figure 5 shows the smoothing effects of SHC conversion. Figure 5a shows the reservoir basin map of the final month, where the water thickness value for each cell inside the reservoir is 41 m, the area is 1689 km2, and the reservoir volume is 70 km3. Figure 5b is the EWH of the same month. Examination of Figure 5b reveals how the signal is smoothed, damped, and extended slightly beyond the reservoir boundary due to SHC conversion. The maximum and minimum EWH values are 42 and −9 m, respectively. Unlike Figure 5a, the water thickness signal shown in Figure 5b is not uniformly distributed across the GERD reservoir. The signal maximum is centered over the reservoir’s center, and it decreases toward the reservoir boundaries. The SHC conversion effect decreases with increasing the reservoir area, water thickness, and volume.
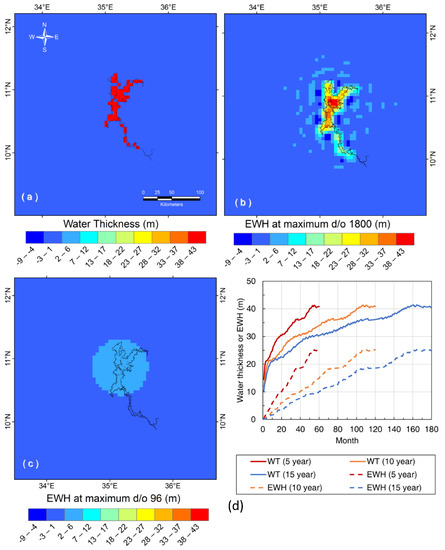
Figure 5.
Water thickness and equivalent water height (EWH) for the last month (water thickness: 41 m; area: 1689 km2; volume: 70 km3): (a) Water thickness with a constant value of 41 m inside the GERD reservoir and 0 outside; (b,c) EWH estimates from SHC truncated to a maximum degree/order of 1800 and 96, respectively; and (d) temporal variations of water thickness (WT) and EWH for different filling strategies (5, 10, and 15 years).
Figure 5d shows the temporal variations in water thickness and EWH averaged over the GERD reservoir for the three filling strategies. Examination of Figure 5d reveals that the ratio between EWH and water thickness ranges from 3% (first filling month) to 60% (last filling month). We also investigated a scenario in which the EWHs were obtained from GRACE-FO observations.
Figure 5c illustrates the SHC truncation effects caused by a limited resolution of GRACE-FO. The deformation was generated by truncating the SHC to a maximum degree/order of 96, consistent with GRACE-FO data. In this case, the maximum and minimum EWH values are 1.3 and −0.17 m. This signal represents ~3% of the original water thickness (e.g., 41 m). It is evident that SHC truncation caused reallocation and damping of the signal in the spatial domain. These findings are in line with previous studies [15,53]. Thus, use of raw GRACE-FO data results in an underestimation of EWH signals over the GERD reservoir, because it only able to restore 3% of the original reservoir signal.
4.3. Large-Scale Land Deformation
The spatial distribution of vertical, east, and north displacements for the last month (water thickness: 41 m; area: 1689 km2; volume: 70 km3) are shown in Figure 6. The vertical displacement component of all grid cells near the GERD mass center points toward the Earth’s center of mass, as indicated by negative vertical displacement values (Figure 6a). For the last month, the vertical displacement ranges between 0.10 and −131.71 mm. The maximum vertical displacement value is located at the center of the GERD reservoir and decreases toward the reservoir boundaries. Although not shown, the truncated GRACE-FO-like vertical displacement (maximum degree/order: 96) is significantly smoothed with damped amplitude (range: 0 and −17.53 mm), representing only 15% of the true vertical displacement signal.
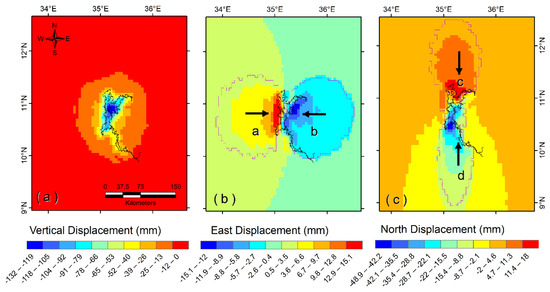
Figure 6.
Deformation estimates in (a) vertical, (b) east, and (c) north directions, computed using the final month (water thickness: 41 m; area: 1689 km2; volume: 70 km3) in each filling strategy. The black arrows in Figure 6b,c indicate directions of horizontal motion. Polygons a, b, c, and d represent the projected extent of the west, east, north, and south displacements, respectively. Different color scales are used for different deformation components.
East displacement varies depending on the location relative to the GERD’s center of mass. For example, the cells in the west part of the GERD reservoir (polygon a; Figure 6b) show eastward movement, as represented by positive east displacement values; in contrast, the cells in the east part of the GERD reservoir (polygon b; Figure 6b) show westward movement (i.e., negative east displacement values). The east displacement component values range between −15.15 and +15.95 mm, indicating that the reservoir is symmetrical in the east–west direction. Inspection of Figure 6b reveals that the east displacement values decreased (polygon a) or increased (polygon b) away from the center of the GERD reservoir. The east displacement component ranges between −2.43 and +2.43 mm for the truncated GRACE-FO-like grid (maximum degree/order: 96). The truncated amplitude of the east component is reduced by ~86% compared to the true amplitude.
Similar to the east displacement, the north displacement varies depending on the location relative to the mass center of the GERD reservoir. For example, the cells in the north part of the GERD reservoir (polygon c; Figure 6c) show southward movement, as represented by positive north displacement values. In contrast, the cells in the south part of the GERD reservoir (polygon d; Figure 6c) show northward movement (i.e., negative north displacement values). However, given that the GERD reservoir has a larger area in the northern portion than in the southern portion, the mass loading produces larger tensile stress on the cells in the southern portion compared to those in the northern portion. This is indicated by the maximum and minimum north displacement values of +18.10 and −48.91 mm, respectively (Figure 6c). The north displacement also decreases away from the GERD center. The north displacement of the truncated GRACE-FO-like grid ranges between −6.57 and +3.00 mm, representing only ~15% of the true north deformation signal.
Figure 7 shows the trends (in mm/year) in the vertical, east, and north defamation components for the 5-year, 10-year, and 15-year filling strategies. This figure is generated by fitting a linear trend for each deformation time series, then plotting these linear trend values. Trend errors were calculated using the approach developed by Ahmed and Wiese [6]. Figure 8, however, shows the temporal variability in averaged vertical deformation (Figure 8a), east deformation (Figure 8b), and north deformation (Figure 8c) for each of the three filling strategies. These averages were generated by summing the results of all grid points lying within the GERD reservoir domain (vertical deformation) or within polygons a and b (shown in Figure 7b; east deformation) or polygons c and d (shown in Figure 7c; north deformation).
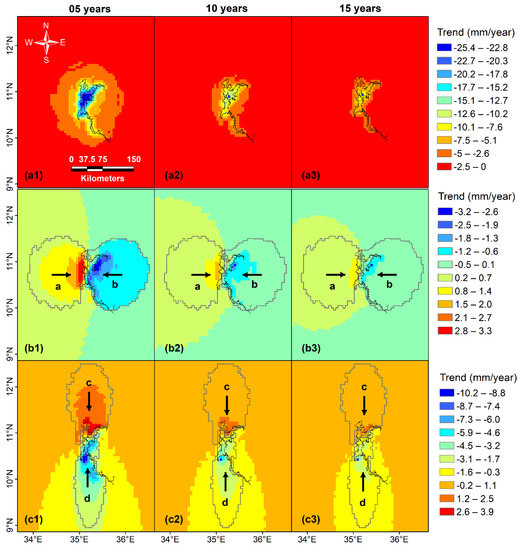
Figure 7.
Trends in vertical (top row), east (middle row), and north (bottom row) components of land deformation, computed based on 5-year (left column), 10-year (middle column), and 15-year (right column) GERD reservoir filling strategies. Different color scales are used for different components.
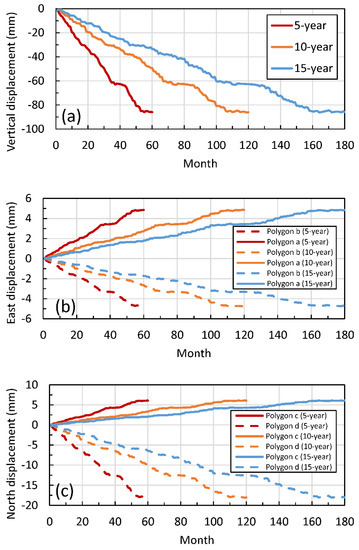
Figure 8.
Monthly averaged deformation estimates in (a) vertical, (b) east, and (c) north directions over the GERD reservoir. The average values were computed by summing the results of all grid points inside the GERD reservoir (vertical deformation), polygons a and b (east deformation, see boundaries in Figure 7b), or polygons c and d (north deformation, see boundaries in Figure 7c).
Examination of Figure 7a reveals that the trend in vertical deformation for the 5-year strategy ranges between −0.02 and −25.38 mm/year, with the maximum deformation centered over the middle of the GERD reservoir. Negative trends in vertical deformation indicate land subsidence. The subsidence rates decrease away from the center of the GERD reservoir. The maximum subsidence rates also decrease as the filling period increases (e.g., 10 years: −12.72 mm/year; 15 years: −8.49 mm/year). The average subsidence rates over the entire GERD reservoir for the 5-, 10-, and 15-year filling strategies are −17.79 ± 0.02, −8.90 ± 0.09, and −5.94 ± 0.05 mm/year (Figure 8a). Subsidence rates decrease as the reservoir filling period increases. The hydrostatic pressure generated by a 5-year reservoir with larger monthly volume (1.17 km3), area (28.15 km2), and water thickness (0.68 m) cause a higher displacement rate compared to that of the 10-year (monthly volume, area, water thickness: 0.58 km3, 14.10 km2, 0.34 m) and 15-year (monthly volume, area, water thickness: 0.39 km3, 9.38 km2, 0.23 m) reservoirs.
Trends in the eastward movement (polygon a; Figure 7b) and westward movement (polygon b; Figure 7b) trends are estimated at +3.35 and −3.24 mm/year, respectively. These trend values are symmetrical given the GERD reservoir’s relative symmetry in the east–west direction. Trends in the eastward and westward movements change with the filling period, ranging between +1.68 and −1.62 mm/year for the 10-year filling strategy and between +1.12 and −1.08 mm/year for the 15-year filling strategy. Trends in the averaged eastward and westward movements for the 5-year filling strategy are +0.98 ± 0.01 and −0.98 ± 0.01 mm/year, respectively (Figure 8b). These average trends also change with the filling time (10 years: eastward: +0.48 ± 0.00 mm/year and westward: −0.48 ± 0.00 mm/year; 15 years: eastward: +0.33 ± 0.00 mm/year and westward: −0.33 ± 0.00 mm/year; Figure 8b).
Unlike the eastward and westward deformation components, trends in the northward and southward movements show different patterns due to the GERD reservoir asymmetry in the north–south direction. We estimate that the trends in southward and northward movements for the 5-year strategy are, respectively, +3.92 mm/year (polygon c; Figure 7c) and −10.25 mm/year (polygon d; Figure 7c). Similar to vertical and east deformation components, these values are changing with the filling time (10 years: southward: +1.96 mm/year and northward: −5.13 mm/year; 15 years: southward: +1.31 mm/year and northward: −3.43 mm/year). Trends in the averaged southward and northward movements for the 5-year filling strategy are +1.28 ± 0.02 and −3.75 ± 0.04 mm/year, respectively (Figure 8c). These average trends also change with filling time (10 years: southward: +0.64 ± 0.01 mm/year, northward: −1.87 ± 0.02 mm/year; 15 years: southward: +0.43 ± 0.00 mm/year, northward: −1.25 ± 0.01 mm/year; Figure 8c).
5. Discussion
The large-scale land deformation induced by the GERD construction is predicted to be centered over the reservoir’s center, and it decreases toward the reservoir boundaries. The rates and extents of these land deformations decreased with increasing the filling period given the longer time it would take to fill the GERD reservoir (Figure 7). Due to truncation effects, GRACE-FO mission could only restore 3% and 15% of the original GERD’s water thickness and deformation signals, respectively.
The developed approach is innovative and provocative because it (i) improves our understanding of rates and locations of large-scale land deformation caused by the GERD construction; (ii) uses the readily available remote sensing data (e.g., DEM) to investigate and forecast large-scale land deformation caused by a reservoir impoundment; (iii) uses a modelling/simulation approach as an alternative technique to quantify reservoir-induced land deformation in area with limited field observations (e.g., GPS); and (iv) provides a comprehensive understanding of limitations of using the GRACE-FO mission to detect GERD-induced land deformation.
Despite our approach’s effectiveness, the predicted deformation accuracy can still be improved by considering an optimal reservoir filling period and allocated impoundment volume. In this paper, we analyzed only three filling strategies (5, 10, and 15 years), but Ethiopia could decide to fill the GERD reservoir in 7 or 12 years, depending on the agreements reached between Ethiopia, Sudan, and Egypt. Although these filling periods are in line with our considered periods (5–15 years), adopting a definite period (e.g., 7 or 12 years) might increase prediction accuracy and provide more constructive information to project managers, the public, and the scientific community.
In addition, the current analysis assumes monthly constant water volumes to fill the GERD reservoir. Given the changing hydrologic conditions in the NRB, applying time-varying volumes in the filling approach might reflect a more realistic representation of temporal loadings and improve the accuracy of deformation estimates. However, we anticipate only a slight change to the results presented here, because the final mass (water thickness: 41 m; area: 1689 km2; volume: 70 km3) should be the same in any scenario. Finally, our future development will consider the use of GPS and radar interferometry techniques to enhance land deformation estimates and their spatiotemporal variability (i.e., improving spatial details from 10 to 1 km).
6. Conclusions
This study provided an innovative approach for predicting large-scale land deformation induced by the impoundment of 70 km3 of water within the GERD reservoir. We reported three land deformation scenarios with respect to the minimum, average, and maximum filling periods of the GERD reservoir. We found that once the impoundment is complete, the surface area of the GERD reservoir will reach 1689 km2, with an average water thickness of 41 m. Investigating a scenario when GRACE-FO observed the deformation revealed that GRACE-FO would detect only 3% and 15% of the EWH and deformation, due to the SHC truncation errors. Annual land deformations intensify as the filling period decreases.
Trends in vertical deformation are estimated at −17.79 ± 0.02, −8.90 ± 0.09, and −5.94 ± 0.05 mm/year for the 5-, 10-, and 15-year filling strategies, respectively. Trends in the western (eastern) deformations are estimated at +0.98 ± 0.01 (−0.98 ± 0.01), +0.48 ± 0.00 (−0.48 ± 0.00), and +0.33 ± 0.00 (−0.33 ± 0.00) mm/year, during the 5-, 10-, and 15-year filling strategies, respectively. The north part of the reservoir moves southward at an annual rate of +1.28 ± 0.01, +0.64 ± 0.01, and +0.43 ± 0.00 mm/year, while the south part moves northward at an annual rate of −3.75 ± 0.04, −1.87 ± 0.02, and −1.25 ± 0.01 mm/year, during the three examined scenarios.
Our results highlight the need for collaborative responses from Ethiopia, Sudan, and Egypt to address and mitigate GERD-induced land deformation. This study provides clear insights into the impacts of the GERD reservoir impoundment on land surface deformation. Importantly, the elaborated methods are valid not only for the GERD project, but can also be applied to other dam construction plans with relatively similar characteristics to the GERD, such as reservoir size and capacity.
Author Contributions
Y.C. performed the simulations, analyzed the results, and drafted the article. M.A. developed the idea, designed the methodology, analyzed and interpreted the results, wrote and revised the manuscript, and supervised the entire project. N.T. made significant contributions to the design, writing, and review of the manuscript. D.M. helped with the manuscript writing, organization, and review. All authors have read and agreed to the published version of the manuscript.
Funding
M.A. was supported by the Division of Research and Innovation at Texas A&M University—Corpus Christi (Research Enhancement Grant, Research Equipment and Infrastructure Grant, and Texas Comprehensive Research Funds). N.T. was supported by the NASA Earth Science Division in support of the National Climate Assessment.
Institutional Review Board Statement
Not applicable.
Informed Consent Statement
Not applicable.
Data Availability Statement
This study was performed based on public-access data. No new data were created in this study. Data sharing is not applicable to this article.
Acknowledgments
The authors would like to thank the Editor and Reviewers of the Remote Sensing journal for their constructive comments and suggestions.
Conflicts of Interest
The authors declare no conflict of interest.
References
- Swain, A. Challenges for water sharing in the Nile basin: Changing geo-politics and changing climate. Hydrol. Sci. J. 2011, 56, 687–702. [Google Scholar] [CrossRef]
- Kondrashov, D.; Feliks, Y.; Ghil, M. Oscillatory modes of extended Nile River records (A.D. 622-1922). Geophys. Res. Lett. 2005, 32, 1–4. [Google Scholar] [CrossRef]
- Hasan, E.; Tarhule, A.; Hong, Y.; Moore, B.; Hasan, E.; Tarhule, A.; Hong, Y.; Moore, B. Assessment of Physical Water Scarcity in Africa Using GRACE and TRMM Satellite Data. Remote Sens. 2019, 11, 904. [Google Scholar] [CrossRef]
- Hasan, E.; Tarhule, A. GRACE: Gravity Recovery and Climate Experiment long-term trend investigation over the Nile River Basin: Spatial variability drivers. J. Hydrol. 2020, 586, 124870. [Google Scholar] [CrossRef]
- Ahmed, M.; Sultan, M.; Wahr, J.; Yan, E. The use of GRACE data to monitor natural and anthropogenic induced variations in water availability across Africa. Earth Sci. Rev. 2014, 136, 289–300. [Google Scholar] [CrossRef]
- Ahmed, M.; Wiese, D.N. Short-term trends in Africa’s freshwater resources: Rates and drivers. Sci. Total Environ. 2019, 695, 133843. [Google Scholar] [CrossRef]
- Ahmed, M. Sustainable management scenarios for northern Africa’ s fossil aquifer systems. J. Hydrol. 2020, 589, 125196. [Google Scholar] [CrossRef]
- Ahmed, M.; Sultan, M.; Wahr, J.; Yan, E.; Milewski, A.; Sauck, W.; Becker, R.; Welton, B. Integration of GRACE (Gravity Recovery and Climate Experiment) data with traditional data sets for a better understanding of the time-dependent water partitioning in African watersheds. Geology 2011, 39, 479–482. [Google Scholar] [CrossRef]
- Gebreluel, G. The Washington Quarterly Ethiopia’s Grand Renaissance Dam: Ending Africa’s Oldest Geopolitical Rivalry? Geopolitics 2014, 21, 969–989. [Google Scholar]
- Sultan, M.; Ahmed, M.; Yan, E.; Milewski, A.; Mohamed, L.; Farag, A. Management of Egypt’s Surface and Groundwater Resources: Present and Future. In Proceedings of the American Geophysical Union (AGU), San Francisco, CA, USA, 15–19 December 2014. [Google Scholar]
- Ahmed, M.; Abdelmohsen, K. Quantifying Modern Recharge and Depletion Rates of the Nubian Aquifer in Egypt. Surv. Geophys. 2018, 39, 729–751. [Google Scholar] [CrossRef]
- Attalla, R.A. Grand Ethiopian Renaissance Dam (GERD); Worcester Polytechnic Institute: Worcester, MA, USA, 2015. [Google Scholar]
- Elsayed, S.M. Role of the Grand Ethiopian Renaissance Dam on Morphological Changes, Environmental and Hydro-Political Situation in the Nile Valley; Politecnico di Milano: Milan, Italy, 2013. [Google Scholar]
- CNN The Grand Ethiopian Renaissance Dam and the Nile. Available online: https://www.cnn.com/2018/10/19/middleeast/gallery/grand-ethiopian-renaissance-dam-river-nile/index.html (accessed on 15 February 2021).
- Tangdamrongsub, N.; Han, S.C.; Jasinski, M.F.; Šprlák, M. Quantifying water storage change and land subsidence induced by reservoir impoundment using GRACE, Landsat, and GPS data. Remote Sens. Environ. 2019, 233, 111385. [Google Scholar] [CrossRef]
- Taşçi, L. Dam deformation measurements with GPS. Geod. Cartogr. 2008, 34, 116–121. [Google Scholar] [CrossRef]
- Fu, Y.; Freymueller, J.T.; Jensen, T. Seasonal hydrological loading in southern Alaska observed by GPS and GRACE. Geophys. Res. Lett. 2012, 39, 39. [Google Scholar] [CrossRef]
- Khan, S.D.; Huang, Z.; Karacay, A. Study of ground subsidence in northwest Harris county using GPS, LiDAR, and InSAR techniques. Nat. Hazards 2014, 73, 1143–1173. [Google Scholar] [CrossRef]
- Van Dam, T.; Wahr, J.; Milly, P.C.D.; Shmakin, A.B.; Blewitt, G.; Lavallée, D.; Larson, K.M. Crustal displacements due to continental water loading. Geophys. Res. Lett. 2001, 28, 651–654. [Google Scholar] [CrossRef]
- Razi, P.; Sumantyo, J.T.S.; Perissin, D.; Kuze, H.; Chua, M.Y.; Panggabean, G.F. 3D land mapping and land deformation monitoring using persistent scatterer interferometry (PSI) ALOS PALSAR: Validated by Geodetic GPS and UAV. IEEE Access 2018, 6, 12395–12404. [Google Scholar] [CrossRef]
- de Linage, C.; Hinderer, J.; Rogister, Y. A search for the ratio between gravity variation and vertical displacement due to a surface load. Geophys. J. Int. 2007, 171, 986–994. [Google Scholar] [CrossRef]
- Rosado, B.; Fernández-Ros, A.; Berrocoso, M.; Prates, G.; Gárate, J.; de Gil, A.; Geyer, A. Volcano-tectonic dynamics of Deception Island (Antarctica): 27 years of GPS observations (1991–2018). J. Volcanol. Geotherm. Res. 2019, 381, 57–82. [Google Scholar] [CrossRef]
- Li, S.; Shen, W.; Pan, Y.; Zhang, T. Surface seasonal mass changes and vertical crustal deformation in North China from GPS and GRACE measurements. Geod. Geodyn. 2020, 11, 46–55. [Google Scholar] [CrossRef]
- Gloaguen, R.; Kaner, A.; Wobbe, F.; Shahzad, F.; Mahmood, A. Remote sensing analysis of crustal deformation using river networks. In Proceedings of the International Geoscience and Remote Sensing Symposium (IGARSS), Boston, MA, USA, 8–11 July 2008; Volume 4. [Google Scholar]
- Tomás, R.; Cano, M.; García-Barba, J.; Vicente, F.; Herrera, G.; Lopez-Sanchez, J.M.; Mallorquí, J.J. Monitoring an earthfill dam using differential SAR interferometry: La Pedrera dam, Alicante, Spain. Eng. Geol. 2013, 157, 21–32. [Google Scholar] [CrossRef]
- Di Pasquale, A.; Nico, G.; Pitullo, A.; Prezioso, G. Monitoring strategies of earth dams by ground-based radar interferometry: How to extract useful information for seismic risk assessment. Sensors 2018, 18, 244. [Google Scholar] [CrossRef] [PubMed]
- Milillo, P.; Porcu, M.C.; Lundgren, P.; Soccodato, F.; Salzer, J.; Fielding, E.; Burgmann, R.; Milillo, G.; Perissin, D.; Biondi, F. The ongoing destabilization of the mosul dam as observed by synthetic aperture radar interferometry. In Proceedings of the International Geoscience and Remote Sensing Symposium (IGARSS), Fort Worth, TX, USA, 23–28 July 2017; pp. 6279–6282. [Google Scholar]
- Galloway, D.L.; Hudnut, K.W.; Ingebritsen, S.E.; Phillips, S.P.; Peltzer, G.; Rogez, F.; Rosen, P.A. Detection of aquifer system compaction and land subsidence using interferometric synthetic aperture radar, Antelope Valley, Mojave Desert, California. Water Resour. Res. 1998, 34, 2573–2585. [Google Scholar] [CrossRef]
- Qu, F.; Lu, Z.; Zhang, Q.; Bawden, G.W.; Kim, J.W.; Zhao, C.; Qu, W. Mapping ground deformation over Houston-Galveston, Texas using multi-temporal InSAR. Remote Sens. Environ. 2015, 169, 290–306. [Google Scholar] [CrossRef]
- Gebremichael, E.; Sultan, M.; Becker, R.; El Bastawesy, M.; Cherif, O.; Emil, M. Assessing Land Deformation and Sea Encroachment in the Nile Delta: A Radar Interferometric and Inundation Modeling Approach. J. Geophys. Res. Solid Earth 2018, 123, 3208–3224. [Google Scholar] [CrossRef]
- Gebremichael, E.; Molthan, A.L.; Bell, J.R.; Schultz, L.A.; Hain, C. Flood Hazard and Risk Assessment of Extreme Weather Events Using Synthetic Aperture Radar and Auxiliary Data: A Case Study. Remote Sens. 2020, 12, 3588. [Google Scholar] [CrossRef]
- Rodell, M.; Famiglietti, J.S.; Wiese, D.N.; Reager, J.T.; Beaudoing, H.K.; Landerer, F.W.; Lo, M.H. Emerging trends in global freshwater availability. Nature 2018, 557, 651–659. [Google Scholar] [CrossRef]
- Fallatah, O.A.; Ahmed, M.; Cardace, D.; Boving, T.; Akanda, A.S. Assessment of Modern Recharge to Arid Region Aquifers Using an Integrated Geophysical, Geochemical, and Remote Sensing Approach. J. Hydrol. 2018, 569, 600–611. [Google Scholar] [CrossRef]
- Niyazi, B.A.; Ahmed, M.; Masoud, M.Z.; Rashed, M.A.; Basahi, J.M. Sustainable and resilient management scenarios for groundwater resources of the Red Sea coastal aquifers. Sci. Total Environ. 2019, 690, 1310–1320. [Google Scholar] [CrossRef]
- Mohamed, A.; Sultan, M.; Ahmed, M.; Yan, E.; Ahmed, E. Aquifer recharge, depletion, and connectivity: Inferences from GRACE, land surface models, and geochemical and geophysical data. Bull. Geol. Soc. Am. 2017, 129, 534–546. [Google Scholar] [CrossRef]
- Tapley, B.; Watkins, M.M.; Flechtner, F.; Reigber, C.; Bettadpur, S.; Rodell, M.; Famiglietti, J.; Landerer, F.; Chambers, D.; Reager, J.; et al. Contributions of GRACE to understanding climate change. Nat. Clim. Chang. 2019, 9, 358–369. [Google Scholar] [CrossRef]
- Tapley, B.D.; Bettadpur, S.; Ries, J.C.; Thompson, P.F.; Watkins, M.M. GRACE measurements of mass variability in the Earth system. Science 2004, 305, 503–505. [Google Scholar] [CrossRef]
- Wahr, J.; Molenaar, M.; Bryan, F. Time variability of the Earth’s gravity field: Hydrological and oceanic effects and their possible detection using GRACE. J. Geophys. Res. Solid Earth 1998, 103, 30205–30229. [Google Scholar] [CrossRef]
- Liu, R.; Li, J.; Fok, H.S.; Shum, C.K.; Li, Z. Earth surface deformation in the north china plain detected by joint analysis of GRACE and GPS Data. Sensors 2014, 14, 19861–19876. [Google Scholar] [CrossRef] [PubMed]
- Fu, Y.; Freymueller, J.T. Seasonal and long-term vertical deformation in the Nepal Himalaya constrained by GPS and GRACE measurements. J. Geophys. Res. Solid Earth 2012, 117, 1–14. [Google Scholar] [CrossRef]
- van Dam, T.; Wahr, J.; Lavallée, D. A comparison of annual vertical crustal displacements from GPS and Gravity Recovery and Climate Experiment (GRACE) over Europe. J. Geophys. Res. Solid Earth 2007, 112, 1–11. [Google Scholar] [CrossRef]
- Tangdamrongsub, N.; Šprlák, M. The assessment of hydrologic-and flood-induced land deformation in data-sparse regions using GRACE/GRACE-FO data assimilation. Remote Sens. 2021, 13, 235. [Google Scholar] [CrossRef]
- Dow, D.B.; Beyth, M.; Hailu, T. Palaeozoic glacial rocks recently discovered in northern Ethiopia. Geol. Mag. 1971, 108, 53–60. [Google Scholar] [CrossRef]
- Abtew, W.; Dessu, S.B. Grand ethiopian renaissance dam site importance. In Springer Geography; Springer: Berlin/Heidelberg, Germany, 2019; pp. 63–77. [Google Scholar]
- Mohamed, M.M.; Elmahdy, S.I. Remote sensing of the Grand Ethiopian Renaissance Dam: A hazard and environmental impacts assessment. Geomat. Nat. Hazards Risk 2017, 8, 1225–1240. [Google Scholar] [CrossRef]
- Tadesse, S.; Milesi, J.P.; Deschamps, Y. Geology and mineral potential of Ethiopia: A note on geology and mineral map of Ethiopia. J. Afr. Earth Sci. 2003, 36, 273–313. [Google Scholar] [CrossRef]
- Zhang, Y.; Erkyihum, S.T.; Block, P. Filling the GERD: Evaluating hydroclimatic variability and impoundment strategies for Blue Nile riparian countries. Water Int. 2016, 41, 593–610. [Google Scholar] [CrossRef]
- Mulat, A.G.; Moges, S.A. Assessment of the Impact of the Grand Ethiopian Renaissance Dam on the Performance of the High Aswan Dam. J. Water Resour. Prot. 2014, 6, 583–598. [Google Scholar] [CrossRef]
- Wheeler, K.G.; Basheer, M.; Mekonnen, Z.T.; Eltoum, S.O.; Mersha, A.; Abdo, G.M.; Zagona, E.A.; Hall, J.W.; Dadson, S.J. Cooperative filling approaches for the Grand Ethiopian Renaissance Dam. Water Int. 2016, 41, 611–634. [Google Scholar] [CrossRef]
- Wieczorek, M.A.; Meschede, M. SHTools: Tools for Working with Spherical Harmonics. Geochem. Geophys. Geosyst. 2018, 19, 2574–2592. [Google Scholar] [CrossRef]
- Kusche, J.; Schrama, E.J.O. Surface mass redistribution inversion from global GPS deformation and Gravity Recovery and Climate Experiment (GRACE) gravity data. J. Geophys. Res. B Solid Earth 2005, 110, 1–13. [Google Scholar] [CrossRef]
- Wang, H.; Xiang, L.; Jia, L.; Jiang, L.; Wang, Z.; Hu, B.; Gao, P. Load Love numbers and Green’s functions for elastic Earth models PREM, iasp91, ak135, and modified models with refined crustal structure from Crust 2.0. Comput. Geosci. 2012, 49, 190–199. [Google Scholar] [CrossRef]
- Argus, D.F.; Fu, Y.; Landerer, F.W. Seasonal variation in total water storage in California inferred from GPS observations of vertical land motion. Geophys. Res. Lett. 2014, 41, 1971–1980. [Google Scholar] [CrossRef]


Publisher’s Note: MDPI stays neutral with regard to jurisdictional claims in published maps and institutional affiliations. |
© 2021 by the authors. Licensee MDPI, Basel, Switzerland. This article is an open access article distributed under the terms and conditions of the Creative Commons Attribution (CC BY) license (http://creativecommons.org/licenses/by/4.0/).