Article

Evaluation and Hydrological Utility of the GPM IMERG Precipitation Products over the Xinfengjiang River Reservoir Basin, China

School of Geography and Planning, Sun Yat-sen University, Guangzhou 510275, China
*
Author to whom correspondence should be addressed.
Remote Sens. 2021, 13(5), 866; https://doi.org/10.3390/rs13050866
Submission received: 21 December 2020 / Revised: 18 February 2021 / Accepted: 22 February 2021 / Published: 25 February 2021
(This article belongs to the Section Remote Sensing in Geology, Geomorphology and Hydrology)

Abstract

:
As a supplement to gauge observation data, many satellite observations have been used for hydrology and water resource research. This study aims to analyze the quality of the Integrated Multisatellite Retrieval for Global Precipitation Measurement (GPM IMERG) products and their hydrological utility in the Xinfengjiang River reservoir basin (XRRB), a mountainous region in southern China. The grid-based soil and water assessment tool (SWAT) model was used to construct a hydrological model of the XRRB based on two scenarios. The results showed that on a daily scale, the IMERG final run (FR) product was more accurate than the others, with Pearson’s correlation coefficients (CORR) of 0.61 and 0.71 on the grid accumulation scale and the average scale, respectively, and a relative bias (BIAS) of 0.01. In Scenario I (the SWAT model calibrated by rain gauge data), the IMERG-based simulation showed acceptable hydrologic prediction ability on the daily scale and satisfactory hydrological performance on the monthly scale. In Scenario II (the SWAT model calibrated by the FR), the hydrological performances of the FR on the daily and monthly scales were slightly better than those in Scenario I (the CORR was 0.64 and 0.85, the BIAS was 0.01 and −0.02, and the NSE was 0.43 and 0.84). These results showed the potential of the FR for hydrological modeling in tropical mountain watersheds in areas where information is scarce. This study is useful for hydrological, meteorological, and disaster studies in developing countries or remote areas with sparse or low-quality networks of ground-based observation stations.

Graphical Abstract

1. Introduction

Precipitation plays a critical role in the water cycle and hydrometeorology research [1]. Traditionally, precipitation data are solely acquired from ground-based observations. However, ground-based measurement networks (gauge stations) have the problems of sparse stations in individual areas, uneven spatial distributions, and underrepresentation of regional precipitation, which considerably limit their applicability [2].
Over the past dozen years, with the advances of satellite technology [3], rainfall observation methods using remote sensing, including weather radar and space weather satellite detection, have developed, among which [4], are the representative products comprising the TRMM (Tropical Rainfall Measuring Mission) and the CMORPH (climate prediction center (CPC) morphing technique), etc. These open and free access products enable us to obtain global and large-scale grid precipitation data [5]. The TRMM Multisatellite Precipitation Analysis products (TMPA) have received the most applications due to their high accuracy. Based on the success of TMPA, the Global Precipitation Measurement (GPM) mission further prompted the advance of precipitation retrieval in terms of forecasting accuracy and space coverage, benefiting from the fact that it deployed the world’s first dual-frequency precipitation radar. These improvements will enhance the ability to monitor or predict disasters, such as typhoons and other extreme rainfall, floods, drought, and mudslide events. In this study, we will primarily concentrate on the application of the Level-3 product generated by the Day-1 Integrated Multisatellite Retrievals for the GPM (IMERG) algorithm [6].
In recent years, many comprehensive evaluations have been performed on the accuracy of multisatellite products in various regions [7,8,9,10,11,12] and studies have focused on the effects of hydrological applications [13,14,15,16]. Some comparative studies have reported that the latest GPM-Era high-resolution satellite precipitation products are superior to other satellite products [17]; however, their performance under various regions and climatic conditions tends to oscillate and needs further research. The reliability and accuracy of satellite data are affected by climatic and geographic conditions as well as seasons [18]. Despite their variability, a general tendency is that the accuracy of IMERG products improves as the time scale increases [19,20,21]. The IMERG products more closely resemble the site rainfall data at daily, monthly, and annual scales [12], and the post-real-time IMERG final run (FR) product is relatively more accurate than the near-real-time early run (ER) and late run (LR) products and can play an important role in supplementing or replacing surface precipitation measurements [10,21]. On the subdaily scale, the performances of the three IMERG products are similar, with the ER and LR products generally considered to be more reliable for early flood warning systems because of their shorter lag time advantages. Although these products have a greater potential for flood forecasting than other products, their accuracies must be continually evaluated [19,20,21].
In terms of hydrological applications of satellite-based precipitation products, satellite-based precipitation products have been increasingly applied to the study of water processes [22]. Li et al. evaluated the role of TRMM products in hydrological modeling in the Taihu Lake basin using the NSE and BIAS. They found that TRMM precipitation data performed well on monthly and annual scales and were well-fit to ground-based frequency rainfall distributions [23]. Evaluations of the accuracy and hydrological applications of IMERG and TRMM products in the Yellow River Basin by Yuan et al. showed that IMERG products consistently yielded better results than 3B42 V7 products on the daily scale (NSE: 0.810 versus 0.729) and 3-hourly time intervals (NSE: 0.266 to 0.792 versus −0.070 to 0.702). Both of them are reliable precipitation sources for daily and sub-semidiurnal hydrological simulations in the Yellow River source region (YRSR) [14]. Jiang et al. evaluated the performance of IMERG product-driven hydrological forecasts in different regions of China and found that the IMERG FR and ER products provided comparable performances to measurement-based precipitation while the TRMM 3B42 product performed relatively poorly in hydrological simulations as indicated by positive skill score (SS) values and larger Kling–Gupta Efficiency (KGE) values. In addition, the three products generally performed better in wet areas than in dry areas [1]. The general results indicate that GPM satellite precipitation products developed based on TRMM satellites are more accurate, have more potential for hydrological applications [14], and have value in hydrological applications for some countries and regions, especially in areas where information is scarce.
Since it is difficult to set up dense rain gauge networks in mountainous basins due to the complicated topography, it is necessary to evaluate the hydrological application effect of satellite-based precipitation products as supplementary data sources. The Xinfengjiang River basin is an important mountainous river in the humid climate region of South China and an important source of drinking water for the residents of Shenzhen, Dongguan, Huizhou, and other cities in the lower reaches of the East River as well as Hong Kong, and it provides 6 billion cubic meters of clean water to the East River every year. Nevertheless, hydrological evaluations of IMERG series products in the Xinfengjiang River reservoir basin (XRRB) have not yet been reported until the present moment. Moreover, previous results are generally unacceptable due to the higher error limitations of early satellite products [24,25,26,27]. Thus, the hydrological utility of the new generation of IMERG products must be explored in the mountainous areas of southern China.
In this paper, the accuracy of IMERG products on daily and monthly time scales is evaluated in the XRRB. Then, their hydrological utility in streamflow simulations is assessed by using the soil and water assessment tool (SWAT) model. The article is organized as follows: the second part provides an overview of the study area and data sets; the third part provides an introduction to the methodology; the fourth part evaluates the accuracy of the satellite products in the XRRB, constructs the hydrological model of the basin, and assesses the utility of the hydrological applications of the IMERG series products; the fifth part provides a discussion; and the sixth part presents the conclusions of this study.

2. Study Area and Data Sets

2.1. Study Area

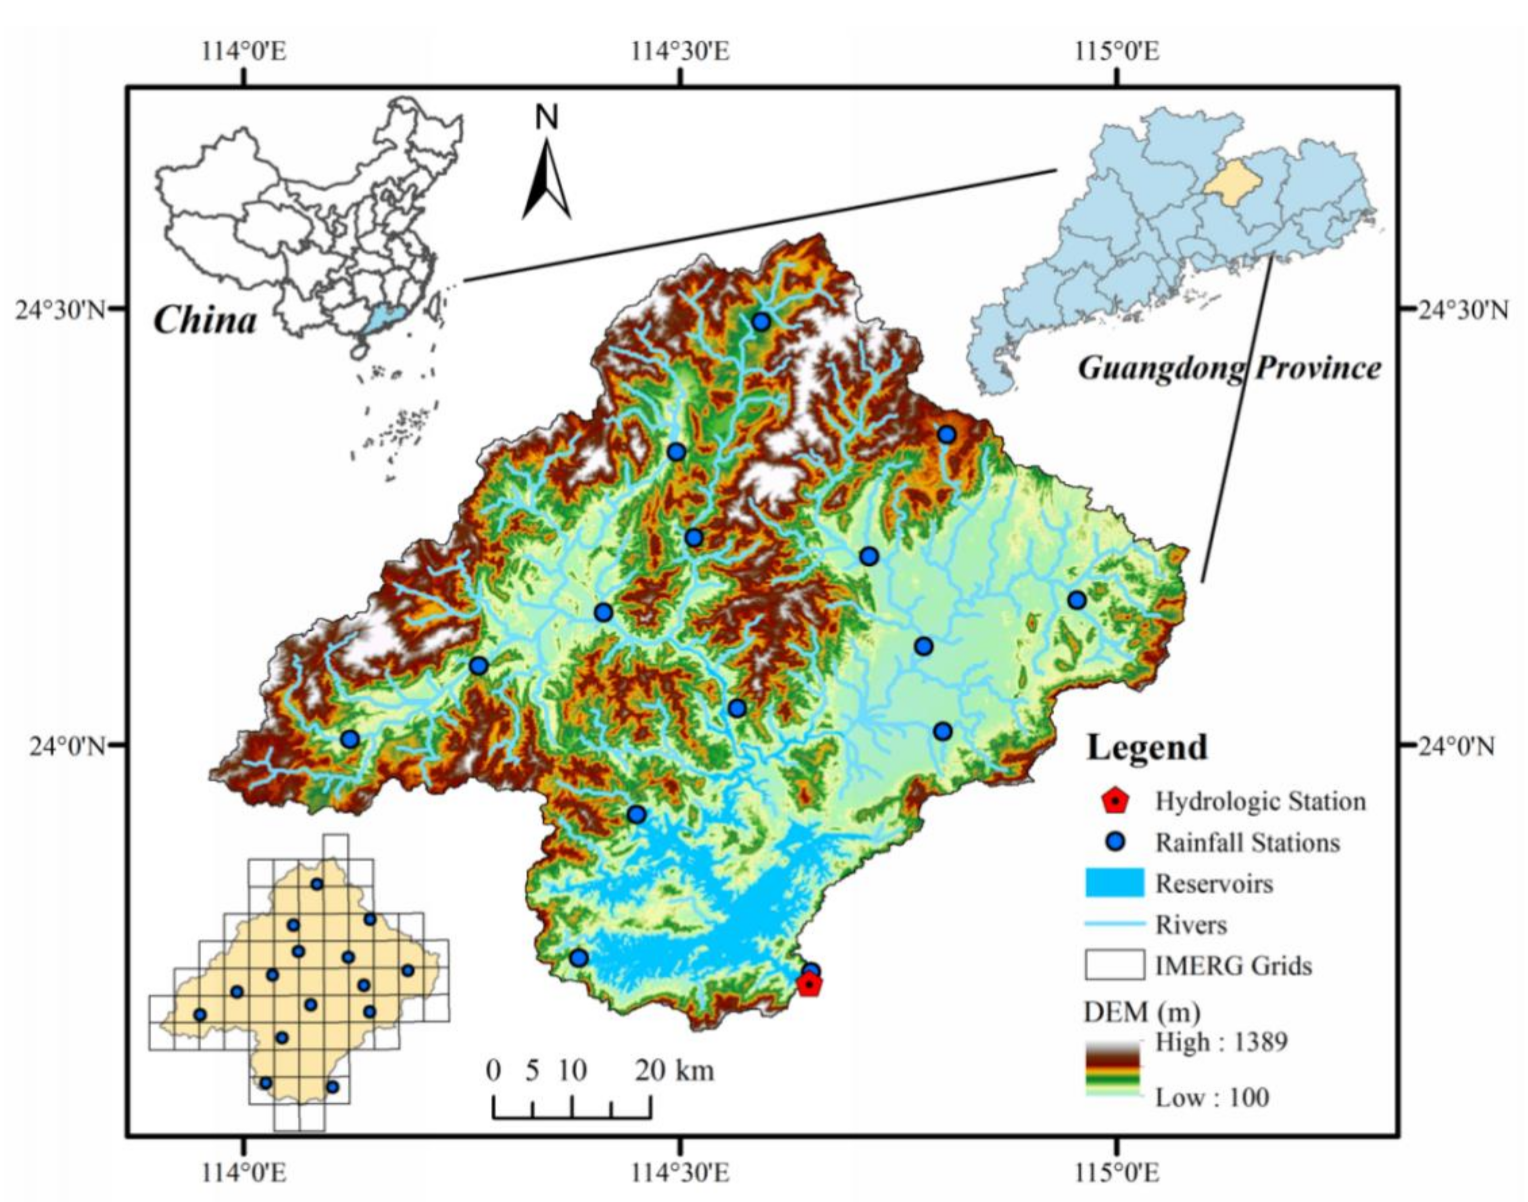
The Xinfengjiang River is located in the southern mountainous area of China, which is a subtropical monsoon climate zone with a mild climate, abundant sunshine and abundant rainfall (Figure 1). The XRRB catchment is selected as the research area in this study, and it has a watershed area of 5734 km2 above the Xinfengjiang Hydraulic Power Station. The dam site is located in Heyuan city, Guangdong Province, 9.2 km away from the mouth of the Xinfengjiang River.
With the Jiulian Mountains to the northwest and the Dengta Basin to the southeast, the terrain of the XRRB drops from northwest to southeast. There are four major rivers in the basin, including the Lianping River, Daxi River and Funatang River [28]. The annual mean precipitation over the XRRB is 1774 mm and is mainly affected by the subtropical monsoon climate. Approximately 80% of the annual precipitation occurs from April to September and mainly includes frontal rain and typhoon rain. Heavy rainfall with a high intensity and a long flood season are observed. The incoming water during the flood season accounts for approximately 80% of the annual incoming water. The average flow of the XRRB is 190 m3/s, and the average water inflow is 6 billion m3. The total storage capacity is 13.896 billion m3 [29].

2.2. Data Set Description

2.2.1. Rain Gauge Data

The rain gauge data were obtained from the Xinfengjiang Reservoir Administration, which integrated the daily rainfall data from 2000 to 2019. The observed daily rainfall data from 15 surface rainfall observation stations that are evenly distributed over the XRRB (Figure 1) were already quality-controlled. The monthly rainfall data are calculated from the daily rainfall data, and both of them are used to evaluate the accuracy of the IMERG series products and runoff simulation over the XRRB.

2.2.2. GPM IMERG Products

The GPM IMERG series products used in this study enjoy high spatial (0.1° latitude/longitude) and temporal (daily) resolutions [6]. Meanwhile, the monthly IMERG data are obtained by accumulating the daily data. The IMERG product line covers the full 60° S–60° N globe and includes the ER, LR and FR products. The ER and LR products are near-real-time products with lag times of 4 h and 12 h, respectively. The algorithm of the post-real-time product FR integrates the satellite data and the ground-based rain gauge monthly observations, while the satellite data comprise the passive microwave and infrared data from GPM and other satellite constellations. The IMERG V05 products used in this study were released in November 2017 [6] and the Level-3 products were downloaded from the Precipitation Measurement Mission (PMM) website (https://pmm.nasa.gov/GPM; accessed on 5 September 2018). It is worth noting that, to make a quantitative assessment of the GPM data, the pixels that contain at least one ground station are first extracted, and then the in situ match-ups are acquired by averaging the ground station data within each extracted pixel.

2.2.3. Data for Hydrologic Model Construction and Implementation

The sources of the streamflow data and remote sensing images for conducting the hydrologic model in the XRRB are listed as follows:
(1)
Daily streamflow data (inflow runoff data) from 2000 to 2019 were obtained from the Xinfengjiang Reservoir Administration, and the location of the hydrological station is shown in Figure 1.
(2)
Other meteorological data forcing required in the hydrological simulation, including daily maximum and minimum temperatures, solar radiation, wind speed, and relative humidity, over the period of 2000 to 2019 is obtained from the China Meteorological Administration (http://data.cma.cn; accessed on 10 May 2020). These data are used to calculate evapotranspiration and related processes.
(3)
The soil types in the XRRB are derived from the soil map in the Harmonized World Soil Database (HWSD) (2009), with a resolution of 1 km (http://www.fao.org; accessed on 10 May 2020).
(4)
The land use/cover is collected from the Resource and Environment Science and Data Center (http://www.resdc.cn; accessed on 10 May 2020) and reclassified into four classes for the SWAT model, including forest, grassland, cultivated land, and water body.

3. Methodology

3.1. Technical Framework

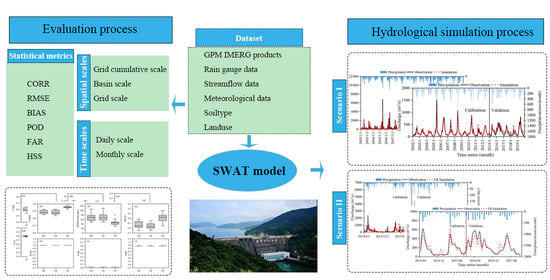
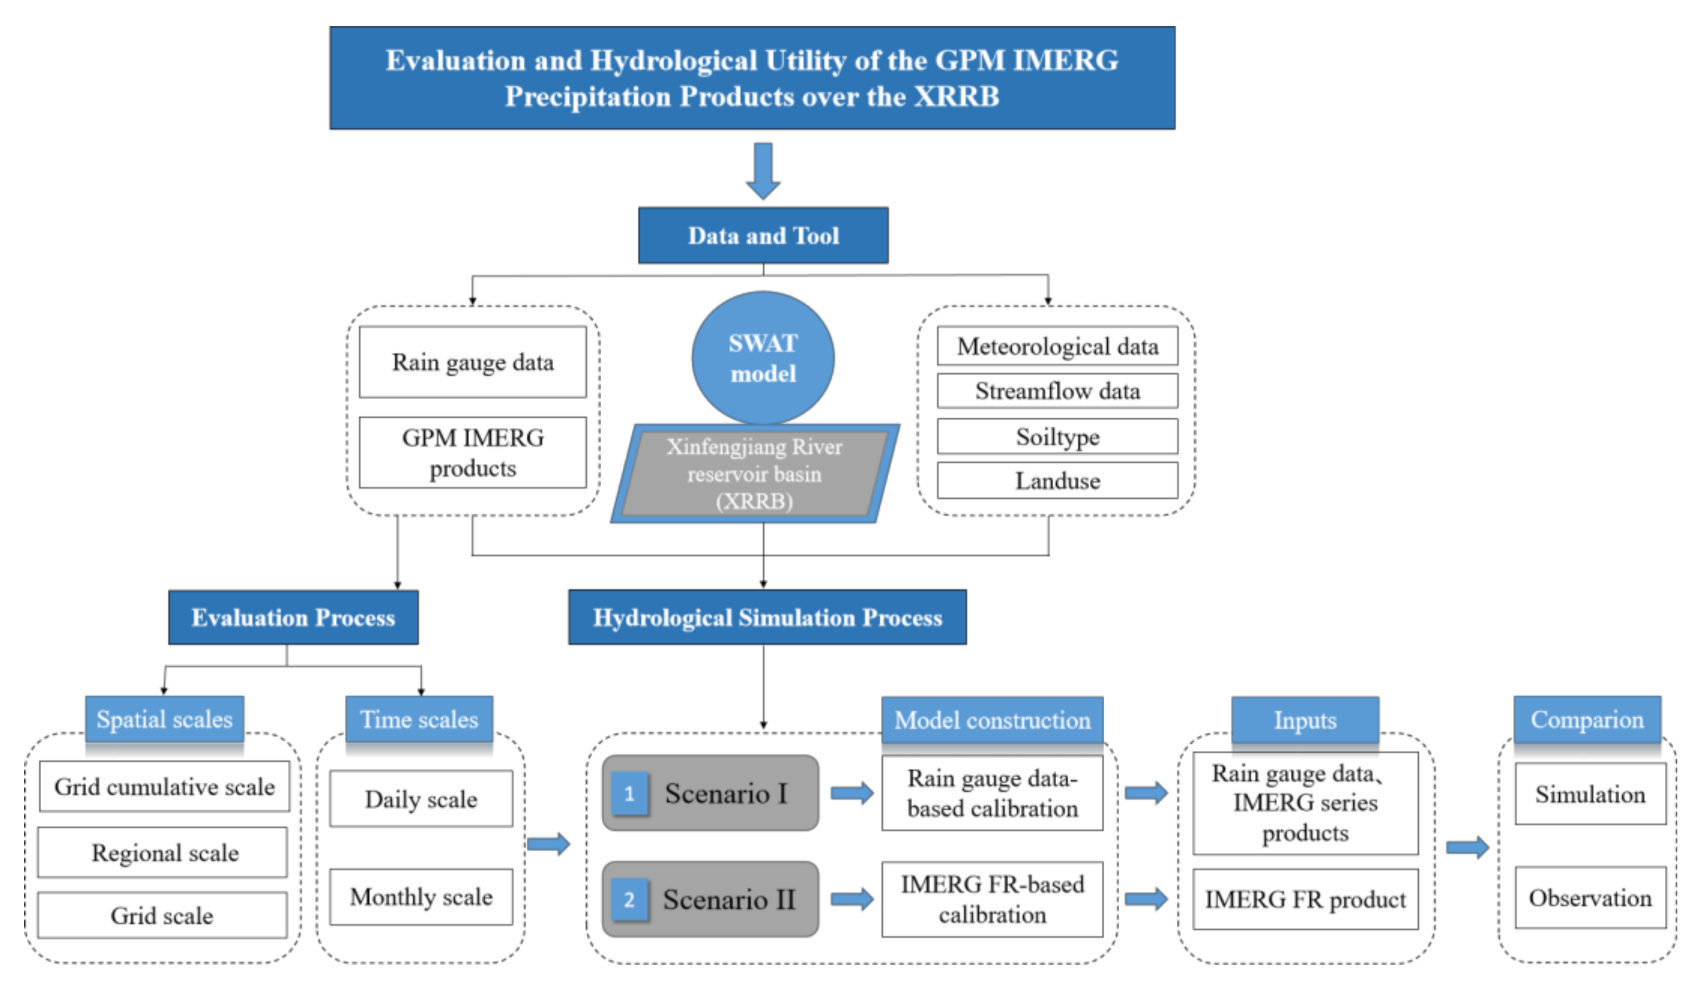
This study is divided into two parts. The aim of the first part (precipitation product evaluation) is to evaluate the accuracy of the IMERG series products on daily and monthly scales in the XRRB. Moreover, the IMERG series products over the XRRB are also statistically analyzed in terms of three spatial scales: grid cumulative scale, basin scale, and grid scale. For the grid cumulative scale, the evaluation is performed by accumulating data for all times and all grids into the same sequence. For the basin scale, the average precipitation of each time point in the research region is incorporated, and the evaluation at the basin scale considers the mean precipitation in the basin. In regard to the grid scale, the spatial distribution characteristics of rainfall events for each product in each grid and indexes are explored. From this, accuracy validation can be conducted using the total data along with evaluations of a single grid, so that a comprehensive comparison between each precipitation product and observed values is achieved [19,20,21]. In the second part (runoff simulation evaluation), the SWAT model is used to construct a hydrological model of the XRRB based on two scenarios. In Scenario I (the SWAT model calibrated by rain gauge data), the ER, LR, and FR products are subsequently used to run the model with the same parameter values in the calibration period. In Scenario II (the SWAT model calibrated by the FR), the FR product is also utilized for validation to explore the potential application of satellite data to areas with little information. Both scenarios are modeled on the daily and monthly scales. The four precipitation products are used to drive the hydrological model. The main idea and procedure of this research are illustrated in Figure 2.

3.2. Statistical Evaluation Indices

With reference to the quantitative product quality evaluation indexes of meteorological satellites in the meteorological industry standards of the People’s Republic of China, the statistical indexes used in this paper include the linear correlation coefficient (CORR), root mean squared error (RMSE), and relative bias (BIAS) (Table 1). The CORR is used to reflect the linear relationship between the satellite precipitation products and the station observations. The BIAS measures the systematic deviation of the satellite-based precipitation data. The RMSE measures the average magnitude of the error. The accuracy of the IMERG series products is evaluated using the above conventional statistical metrics. Meanwhile, it is also important to quantify the consistency between the satellite-based precipitation products and the observed rainfall when rainfall is present. Three categorical statistical indices, namely, probability of detection (POD), false alarm ratio (FAR), and Heidke skill score (HSS), were also employed to indicate the products’ ability to capture rainfall events [30]. POD represents the proportion of observed rainfall events that are accurately predicted. FAR represents the proportion of observed rainfall events that do not occur. HSS characterizes the accuracy of the prediction resulting from random events.
In addition, to evaluate the performances of hydrological models, Nash–Sutcliffe proposed a new efficiency factor, the Nash–Sutcliffe efficiency (NSE), as a statistical criterion for hydrological utility assessments [31], and is widely used in hydrology and water quality modeling to evaluate simulation effects [32] (Table 1). The NSE coefficient ranges between −1.0 and 1.0, and values closer to 1.0 correspond to better consistency between the model simulation value and measured value and higher model quality and reliability. NSE coefficients between 0.0 and 1.0 generally indicate acceptable levels of performance. More specifically, NSE values lie within the interval of 0.5 to 0.65 for satisfactory simulation results, 0.65 and 0.75 for good simulation results, and 0.75 to 1 for excellent results [33]. Moreover, the uncertainty is quantified by a measure referred to as the p-factor (the percentage of measured data bracketed by the 95% prediction uncertainty (95PPU)) and R-factor (the ratio of average thickness of the 95PPU band to the standard deviation of the corresponding measured variable) [34]. For streamflow simulation, when the p-factor values are greater than 0.6 and the R-factor less than 1, the uncertainty of the hydrological model is acceptable [35].

3.3. SWAT Model

In the 1990s, the soil and water assessment tool (SWAT) model was proposed by the Agricultural Research Service (ARS) of the United States Department of Agriculture (USDA) [36]. As a semidistributed hydrological model for medium-to-large watersheds and long time scales, the SWAT model is a widely utilized to model changes in hydrological processes, erosion, vegetation, and water resource management [33]. Compared with data-driven models and lumped hydrological models, distributed hydrological models can incorporate the physical characteristics of watersheds and the heterogeneous performance of precipitation in space and time, providing more accurate hydrological process predictions.
The model is constructed based on hydrologic response units (HRUs). The watershed is split into multiple subwatersheds based on DEM data as well as the actual water network data, and these data are further subdivided into HRUs; subsequently, portions of a territory are characterized by unique land-use/management/soil attributes [37]. Finally, the hydrological cycle can be expressed by the following equation:
S W t = S W O + i = 1 t ( P d a y Q s u r f E a W s e e p Q g w )
where SWt denotes the final soil water content; t denotes time; SWO, Pday, Qsurf, and Ea represent the initial soil water content, precipitation, surface runoff, and evapotranspiration, respectively; Wseep stands for the amount of water entering the vadose zone from the soil profile on day i (mm); and Qgw is the amount of return flow on day i (mm) [38]. In this paper, the runoff curve number method was chosen to estimate surface runoff, and the Penman–Monteith method was chosen to calculate evapotranspiration. The storage algorithm is used for the mid-soil flow evolution, and the Muskingen algorithm [39] is used for the mid-river flow evolution.
The broad range of value parameters and their complex interaction complicate the model parameterization and calibration process. The autocalibration tool was used for the calibration of the SWAT model, via the standalone program SWAT-CUP using the Sequential Uncertainty Fitting version 2 (SUFI-2) algorithm [37]. It enables sensitivity analysis, calibration, validation, and uncertainty analysis of SWAT models. The SUFI-2 algorithm can obtain the best simulation results and uncertainty confidence intervals with the least number of simulations [40].

4. Results

4.1. Comparison of IMERG Series Products with Rain Gauge Data

In this study, the IMERG series products over the XRRB from 1 April 2014 to 31 December 2017 were statistically analyzed in terms of three spatial scales: grid cumulative scale, basin scale, and grid scale. The accuracy of the IMERG series products at daily and monthly scales is evaluated in the XRRB. As shown in Table 2, at the daily scale, the FR has better CORR (0.61/0.71) than the ER (0.59/0.69) and LR (0.59/0.69) on both the grid accumulation scale and the basin scale, and these CORR results are statistically significant at the p < 0.001 level. However, the RMSE value does not show a significant advantage, while the BIAS (0.01) is significantly better than that of the ER (−0.14) and LR (−0.16). On the monthly scale, the FR product also has a higher CORR (0.94/0.99) than the ER (0.88/0.93) and LR (0.88/0.92) products on both the grid accumulation scale and the basin scale. The RMSEs of the FR (48.03/18.99 mm) are also lower than those of the ER (71.50/54.88 mm) and LR (73.13/58.34 mm) products. For the systematic error, the ER and LR products generally tend to underestimate the precipitation, with BIASs of −0.14 and −0.16, respectively, while the FR tends to overestimate the precipitation, with relatively low BIAS of 0.01. Moreover, the statistical significance of the difference among the products was also tested using the t-test at the 95% significance level, and the results are shown in Table 3. The test results reveal that there are significant differences among the ER, LR, and FR products, with all their p-values less than 0.05.
For the detection effect at the grid accumulation scale (Table 2), the POD values of all three IMERG products are above 0.8 on the daily and monthly scales, the FAR values are below 0.37, and the HSS values are above 0.56. FR shows better POD (0.81, 1.00) and HSS values (0.57, 0.98) than ER and LR at the grid accumulation scale. The results of three indexes (POD, FAR, and HSS) demonstrate its good ability in detecting precipitation. The detection performance at the average scale of the watershed is also satisfactory. The POD values of all three IMERG products are above 0.83, FAR values are below 0.22 and HSS values are above 0.67 at both daily and monthly scales. FR yields better POD (0.84, 1.00) and HSS values (0.67, 1.00) than ER and LR at the basin scale. The reason lies in the improvement of the performance of dual-frequency precipitation radar (DPR) and the GPM Microwave Imager (GMI); thus, the spatial structure and physical features of different precipitation particles in the clouds can be monitored from various angles, and, therefore, the capability to discover different-level precipitation has been significantly improved [41]. In our previous study, we proved that the GPM IMERG products have an advantage in capturing rainfall events and estimating instantaneous precipitation, especially for light rain events [19].
Combining the RMSE, Bias, CORR, and significance test results, we can conclude that the FR product is more accurate than the ER and LR products. These results are not unexpected because the FR products have been corrected using the Global Precipitation Analysis Products of the Global Precipitation Climatology Centre (GPCC) (on the monthly scale). Therefore, their grid cells around the GPCC stations will be effectively reduced. In general, the three IMERG products have reasonably good performances in detecting precipitation, with a slight advantage for the FR. The IMERG series products exhibit significantly better accuracy results on the monthly scale than on the daily scale.
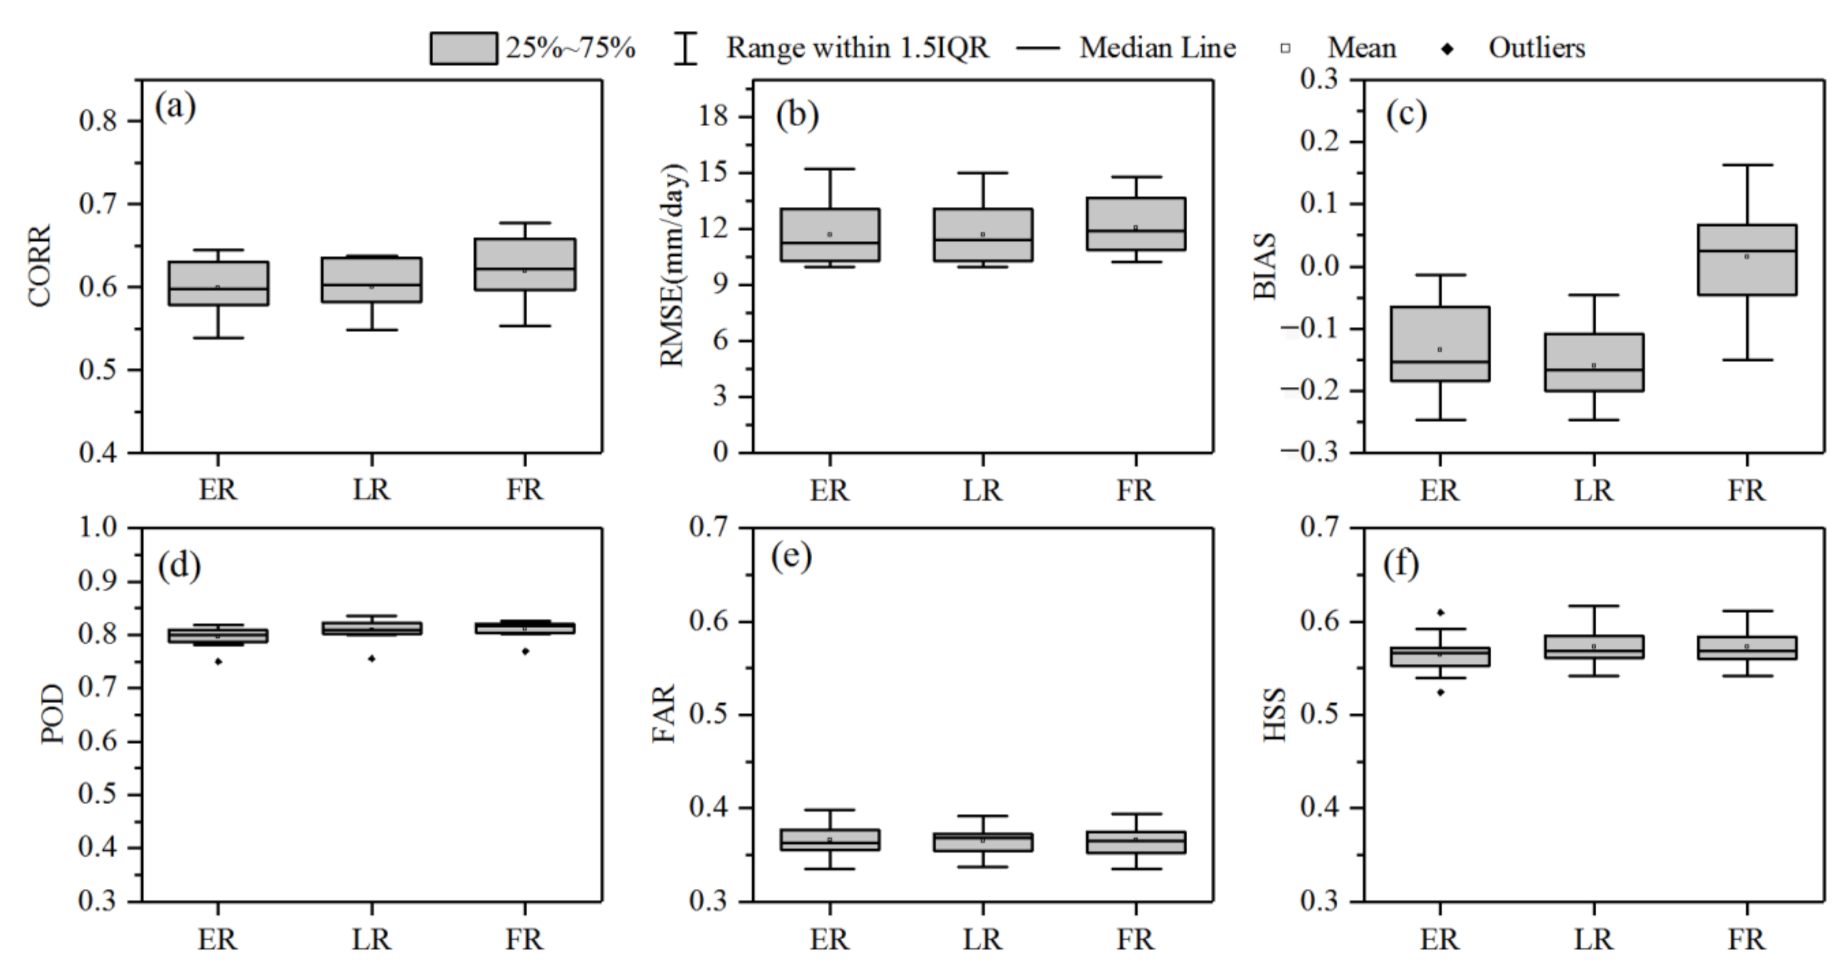
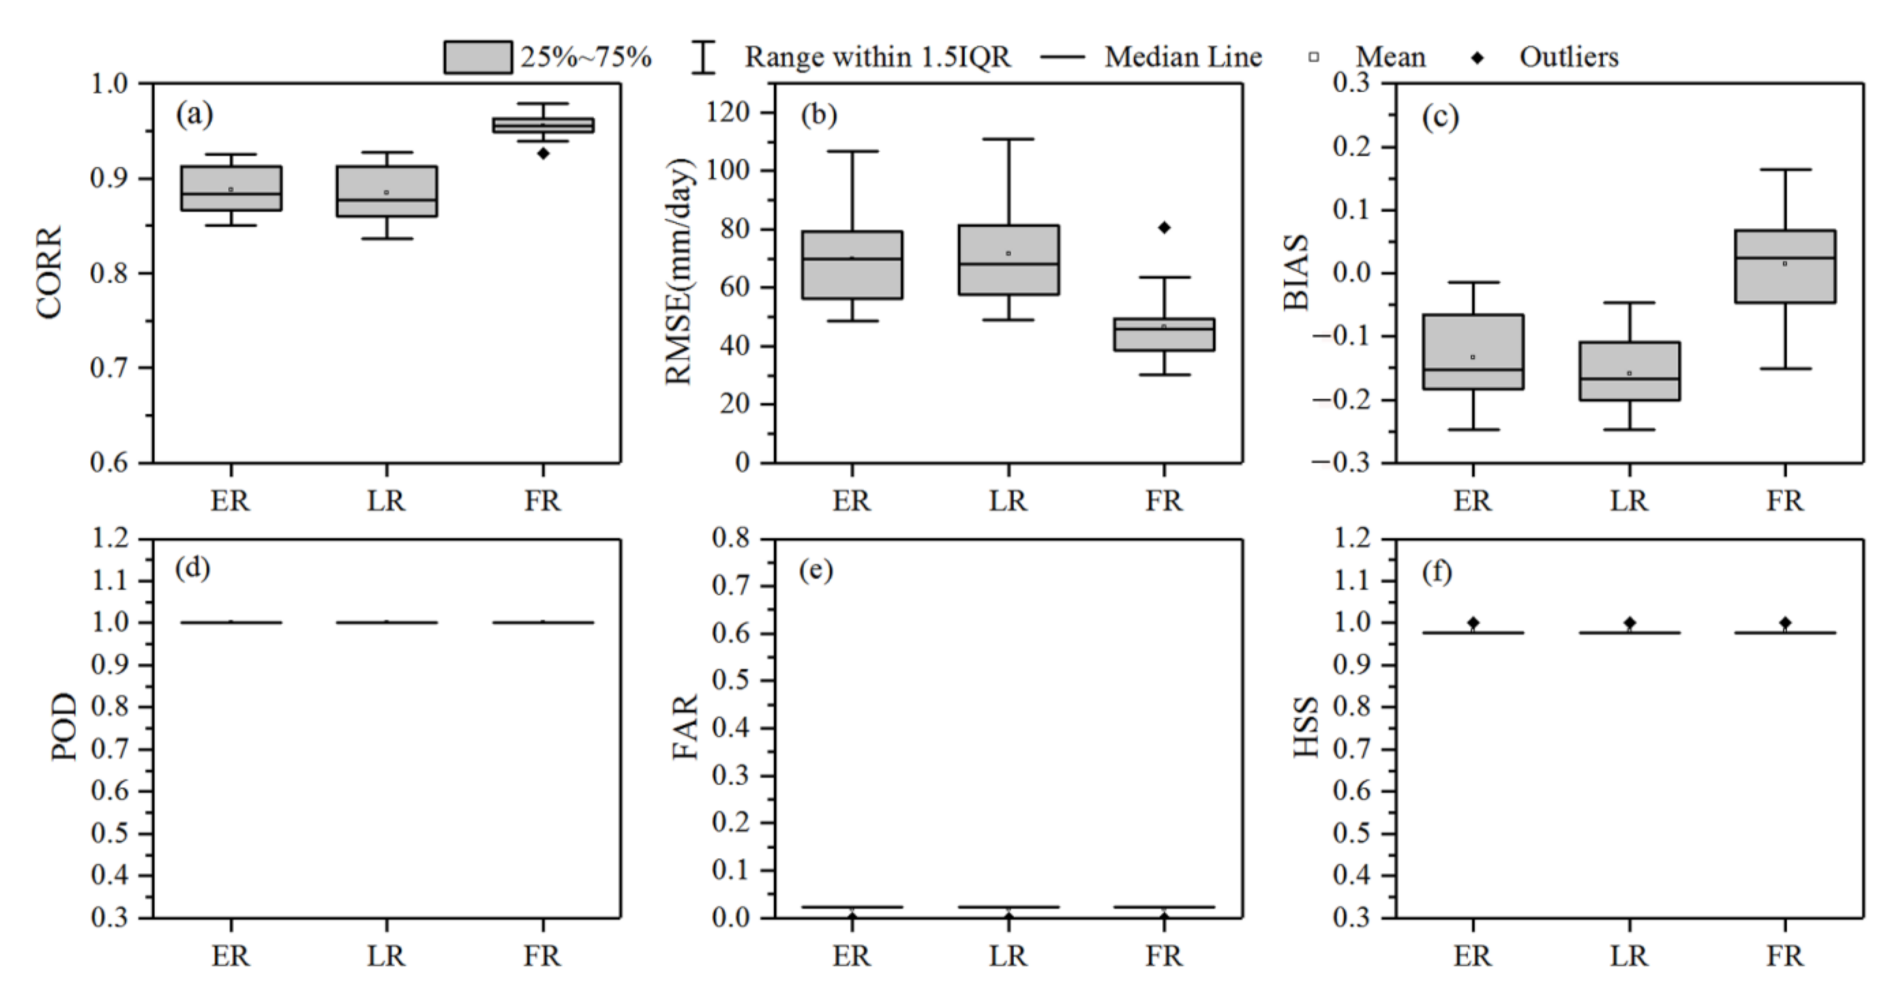
Analyses of the accuracy of the IMERG series of products on the grid scale and all the metrics are included in Figure 3 and Figure 4. The box plots of the accuracy metrics on the daily scale (Figure 3a–c) show that the CORR and BIAS of the FR product (median: CORR of 0.62, BIAS of 0.02) are superior to the ER (median: CORR of 0.60, BIAS of 0.15) and LR (median: CORR of 0.60, BIAS of 0.17). The RMSE metrics results have values that are close to each other. All three IMERG products perform satisfactorily in terms of detection capability and the three metrics all have similar values (Figure 3d–f). The three IMERG products all contain a few outliers with PODs (Figure 3d). From the box plots of the accuracy indicators of each product at the monthly scale in Figure 4, the CORR, RMSE, and BIAS results (Figure 4a–c) show that the FR values (median: CORR of 0.96, RMSE of 45.74, BIAS of 0.02) are more accurate than the ER (CORR:0.88, RMSE:67.99, BIAS:0.15) and LR (CORR:0.88, RMSE:69.856, BIAS:0.17) values. Note that the CORRs and RMSEs of FR, as shown in the box plots of (Figure 4a,b), are distributed in a narrower range than those of ER and LR, indicating the lower uncertainty of the near-real-time products. All three IMERG products perform satisfactorily in terms of detection capability (Figure 4d–f). Overall, the conventional indicators show the advantage of the post-real-time FR. The IMERG products show similar performances in terms of the detection effects. All the metrics improved as the temporal resolution changed from daily to monthly at the grid accumulation scale and basin and grid scales.

4.2. Hydrological Utility Evaluation of the IMERG Series Products in the Xinfengjiang River Reservoir Basin

This paper aims to explore the hydrological application value of the FR product using the SWAT model in the XRRB through two different parameter calibration scenarios. In Scenario I, rain gauge data are first used as input for driving the model and optimizing the parameter values in the validation period. Then, the ER, LR, and FR products are subsequently used to run the model with the same parameter values in the calibration period. In Scenario II, the FR is used for driving the SWAT model and optimizing the parameter values in the validation period, and then the FR product is also utilized for validation to explore the potential application of satellite data to areas with little or no information. Both scenarios are modeled on the daily and monthly scales.

4.2.1. Simulation Driven by Rain Gauge Data (Scenario I)

Rain Gauge Calibration and Validation

In Scenario I, gauge observations (2000–2012) are first used as input for driving the model and optimizing the parameter values. Next, in the validation period (2013–2019), the gauge observations are used to evaluate the effectiveness of the hydrological model constructed based on the SWAT model for the XRRB. Two years of warm-up period (2000–2001, 2013–2014) are reserved in the calibration and validation process. Finally, the ER, LR, and FR products are used to drive the model with the same parameter values, and the effectiveness of the IMERG series in the hydrological application of the XRRB is evaluated. An article providing a detailed description of the model construction process is currently in press.
The model is constructed with a spatial resolution of 90 m and a total watershed area of 5734 km2. The subbasin division threshold is set to 160 km2, and the watershed is divided into a total of 23 subbasins; the thresholds for land use types, soil types, and slope types are set to 8%, 8%, and 10%, respectively, and the watershed is divided into 409 hydrological response units (HRUs). In this study, the skewed normal method is used for the simulation of rainfall, the Penman–Monteith method is selected for the simulation of potential evapotranspiration, the SCS runoff curve method is utilized for the simulation of runoff, and Muskingum is applied in the calculation of river evolution. Twelve parameters that are more sensitive to the runoff simulation of the XRRB are selected for parameter rate determination, and the results of parameter preferences are shown in Table A1.
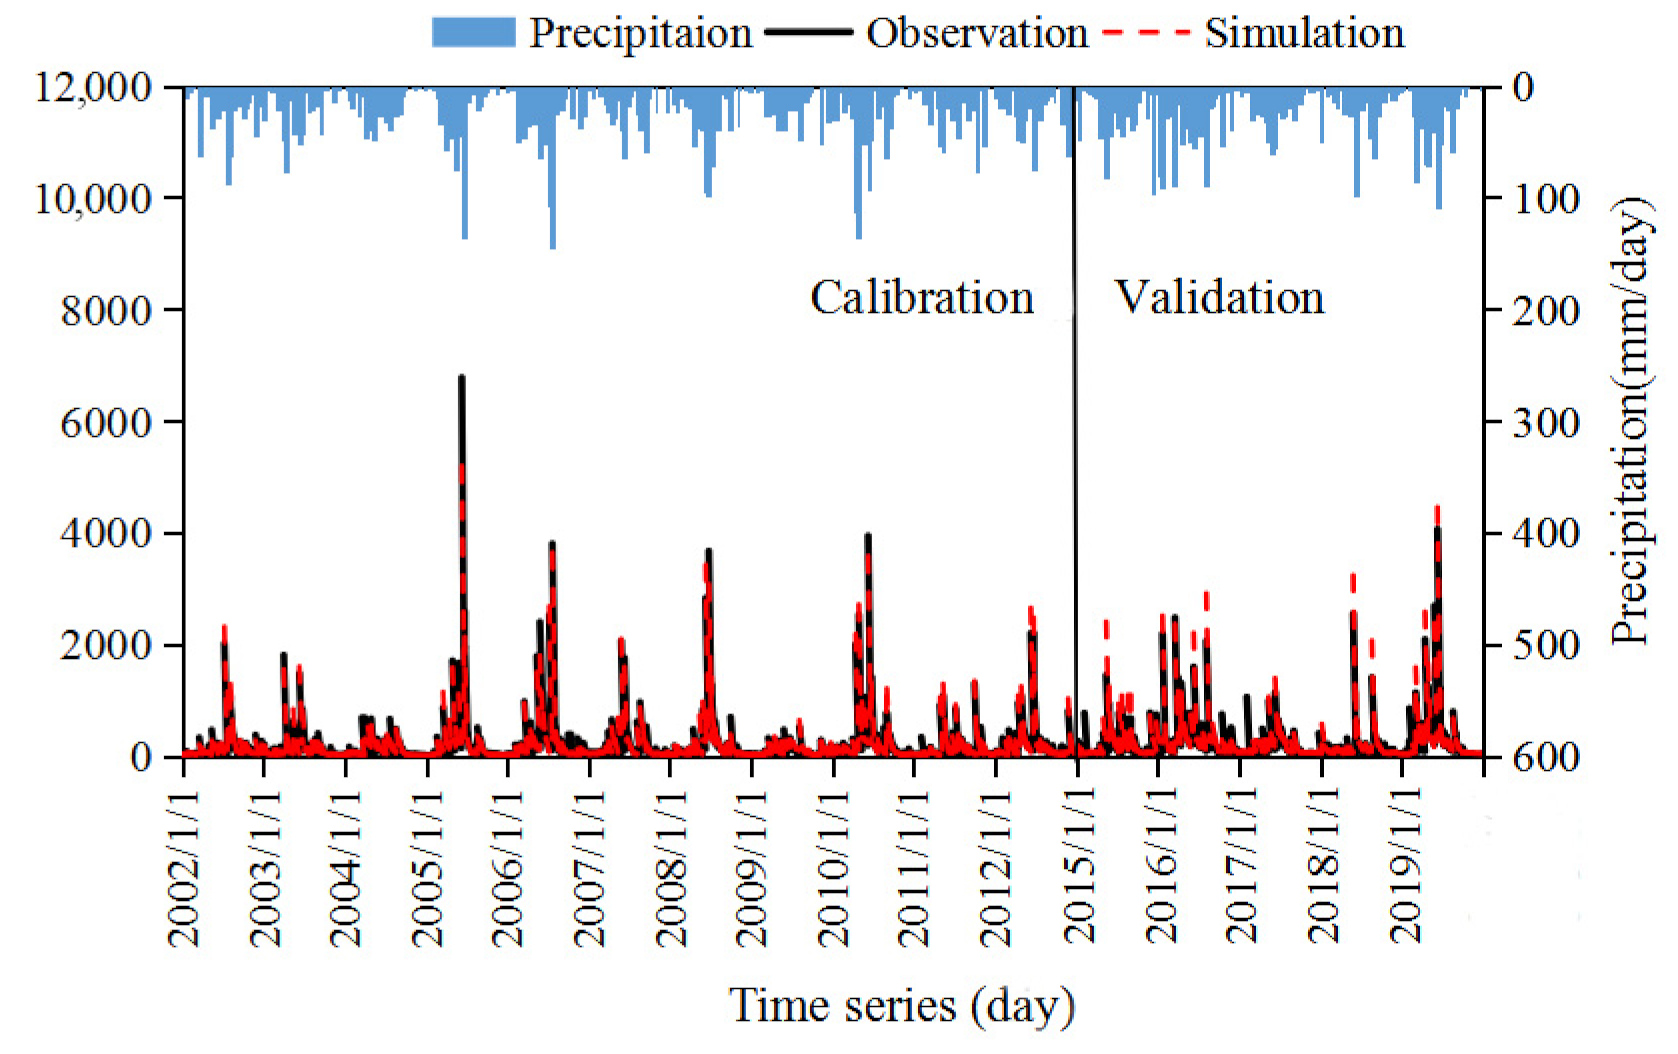
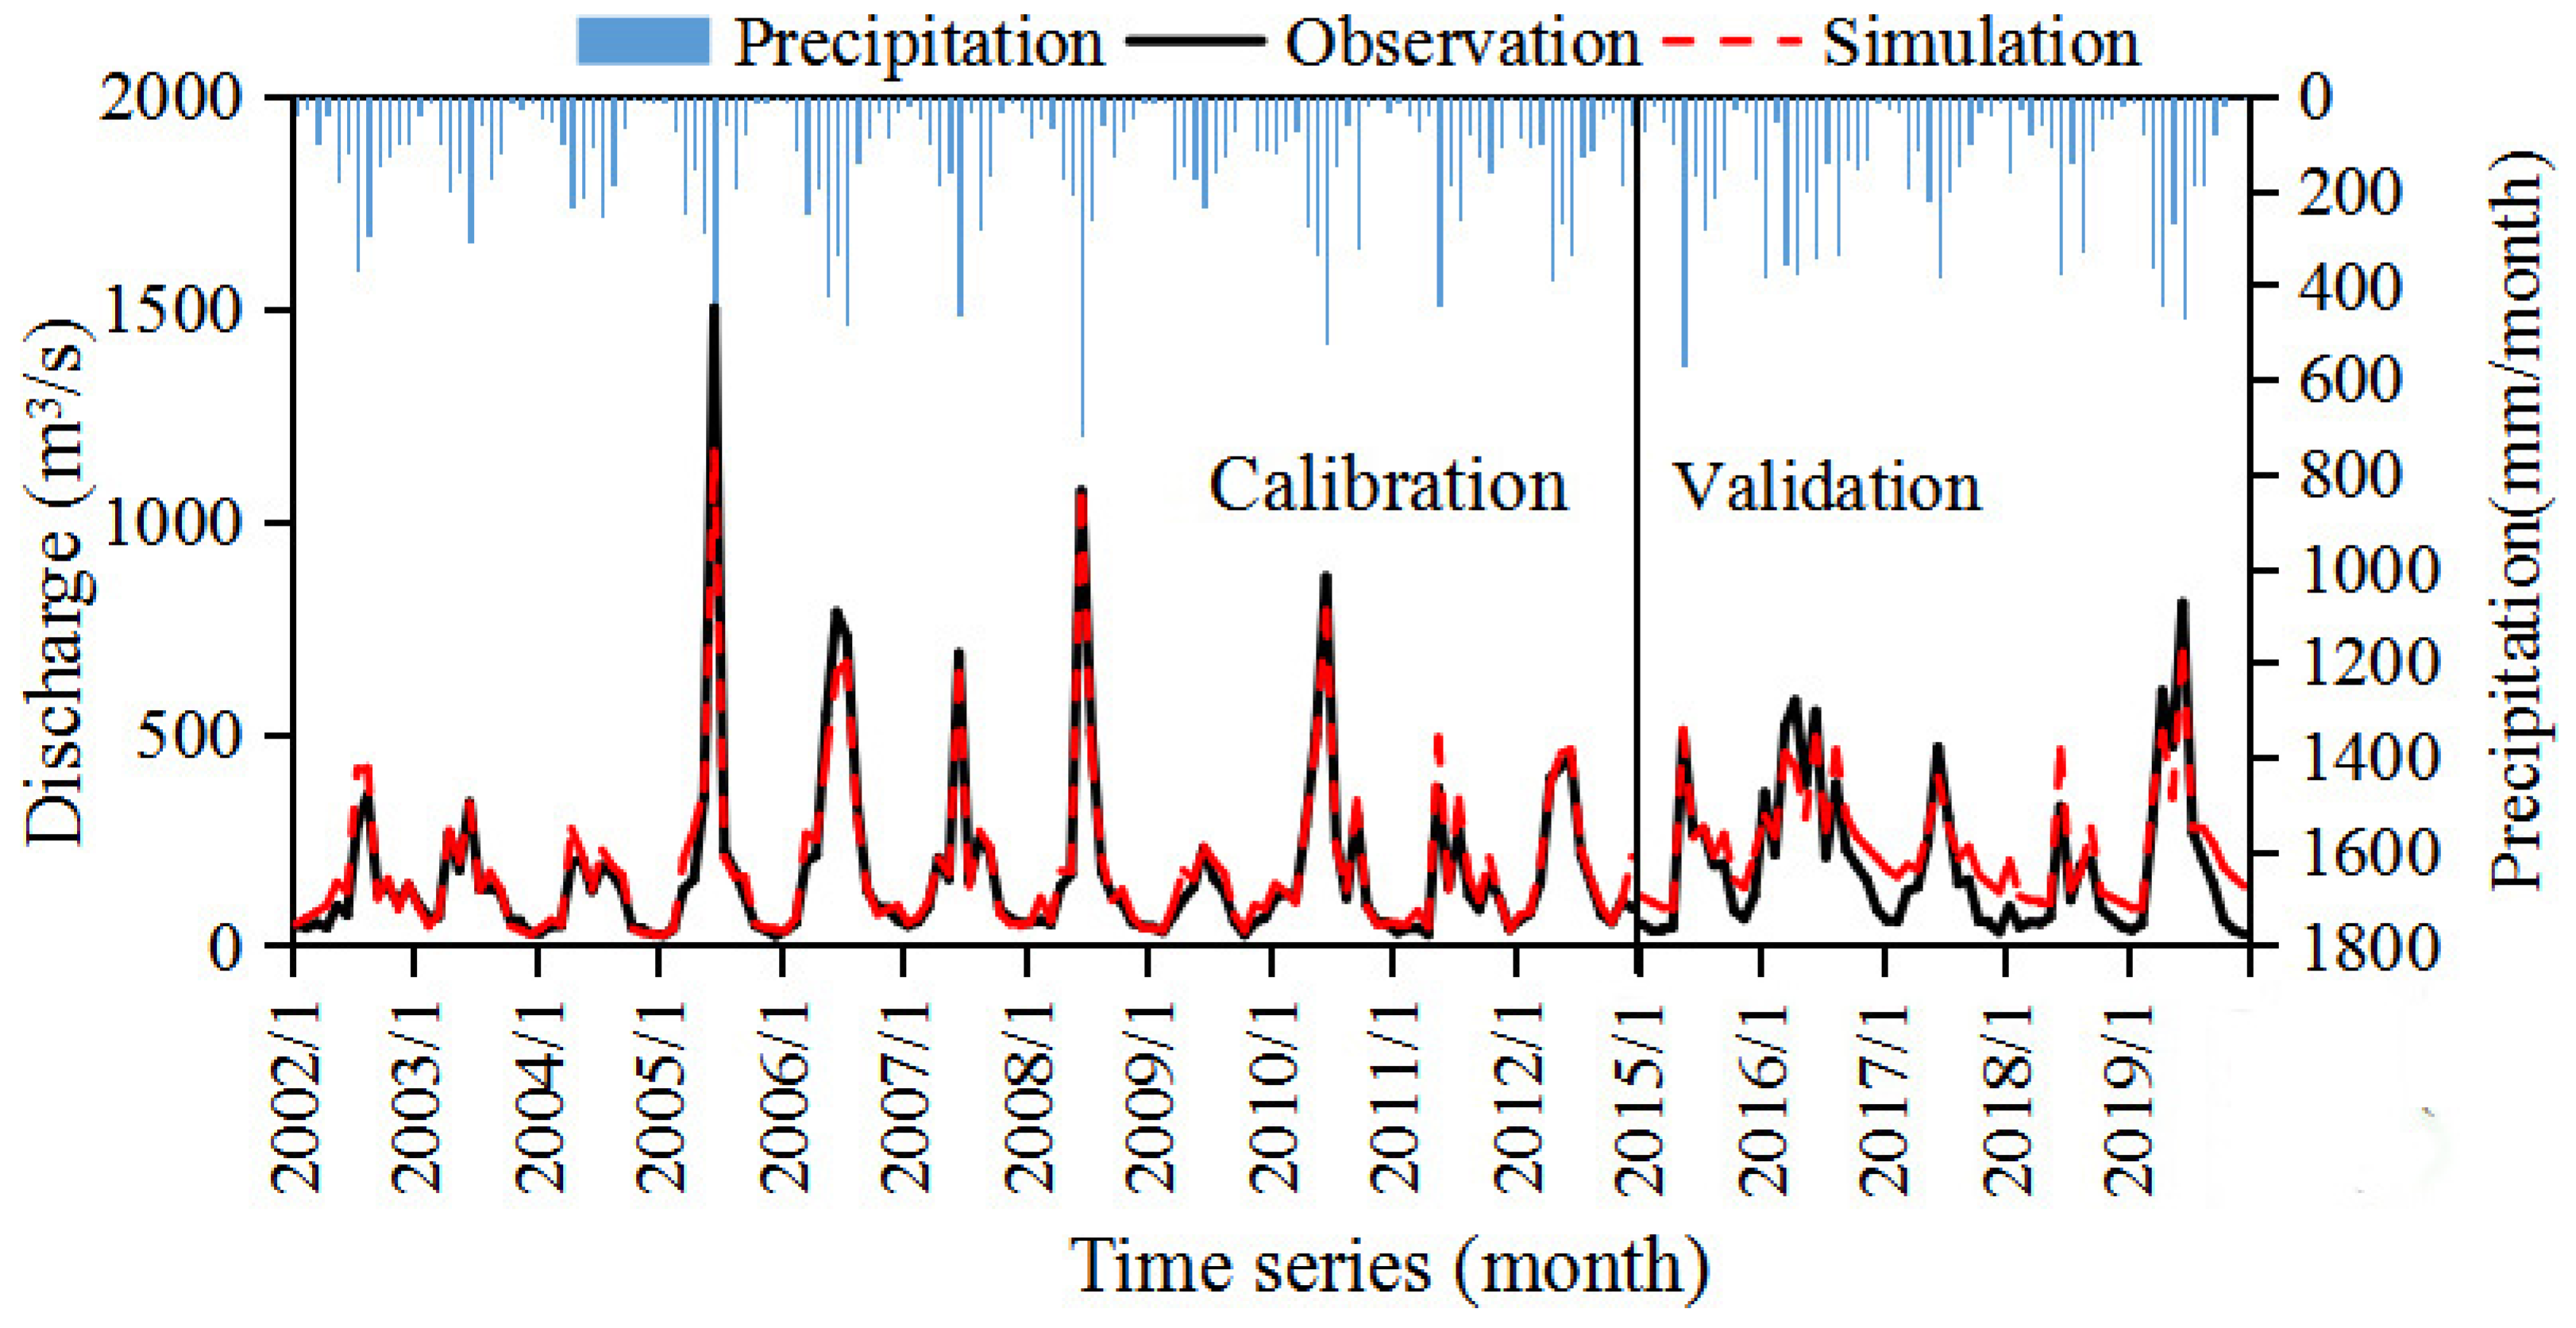
Figure 5 and Figure 6 show the comparisons of the observed streamflow with rain gauge observations on daily and monthly scales during the calibration period and validation period, respectively. Table 4 shows the evaluation results of the modeling effect for the calibration period and the validation period. In general, good agreement is observed between the simulated streamflow and the observed streamflow (inflow streamflow data) at the daily scale during both the calibration and validation periods, with daily CORRs of 0.91 and 0.85, NSEs of 0.91 and 0.83, and BIASs of 0.04 and 0.13 for the calibration and validation periods, respectively. Good agreement is also observed between the simulated streamflow and observed streamflow at the monthly scale, with CORR and NSE values of the rate period and validation period both reaching above 0.90 and above 0.80, respectively, and a BIAS within 20%. As seen in Table 4, both p-factors are greater than 0.6 and R-factors are less than 1 during both the calibration and validation periods. The p-factor is greater than 0.6 and the R-factor is less than 1, indicating that most of the observed data are captured by the 95PPU, and the SWAT model is capable of simulating large flows and extreme events in the XRRB.
In general, the SWAT model constructed in Scenario I meets the requirements of hydrological simulation. All the results show that the SWAT model based on the site data is suitable for the XRRB.

Simulation Driven by Multiple Precipitation Datasets with the Optimal Parameter Set from Scenario I

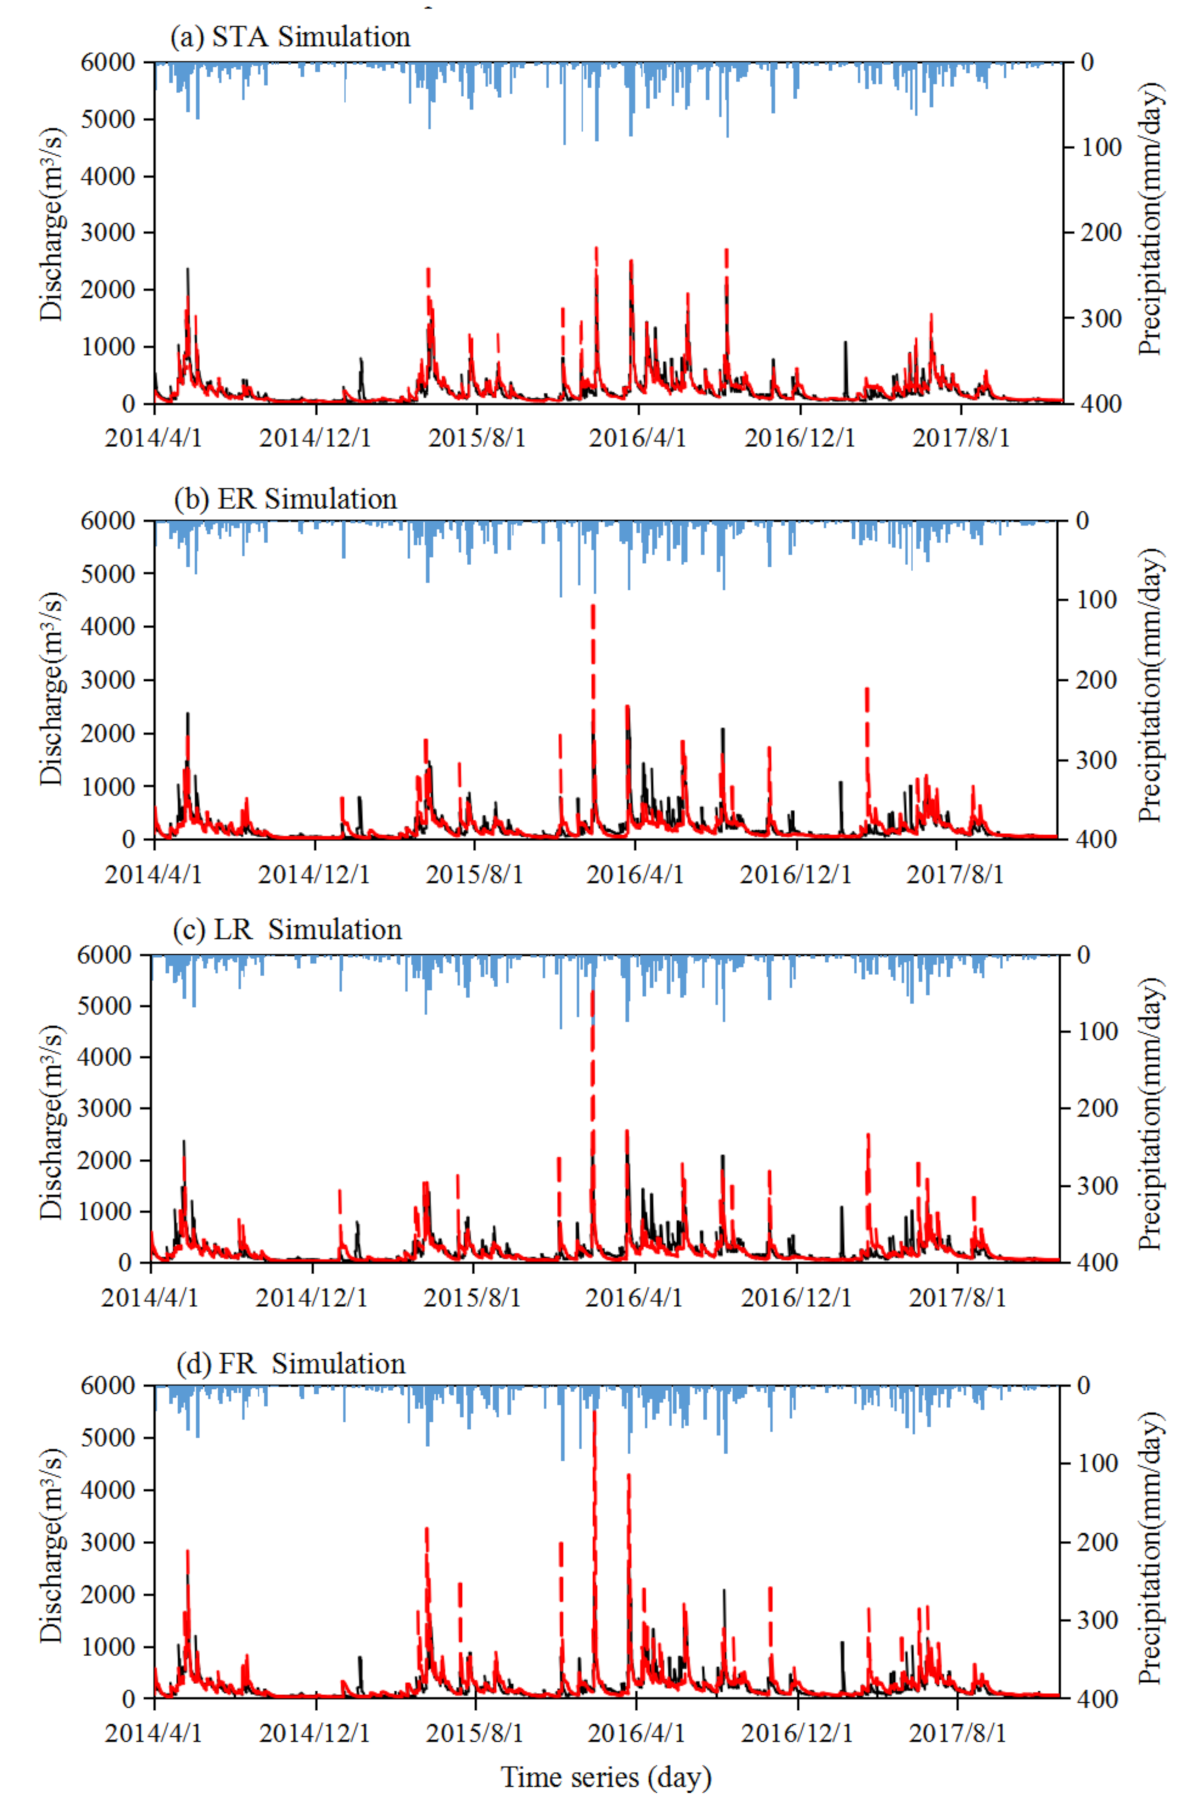
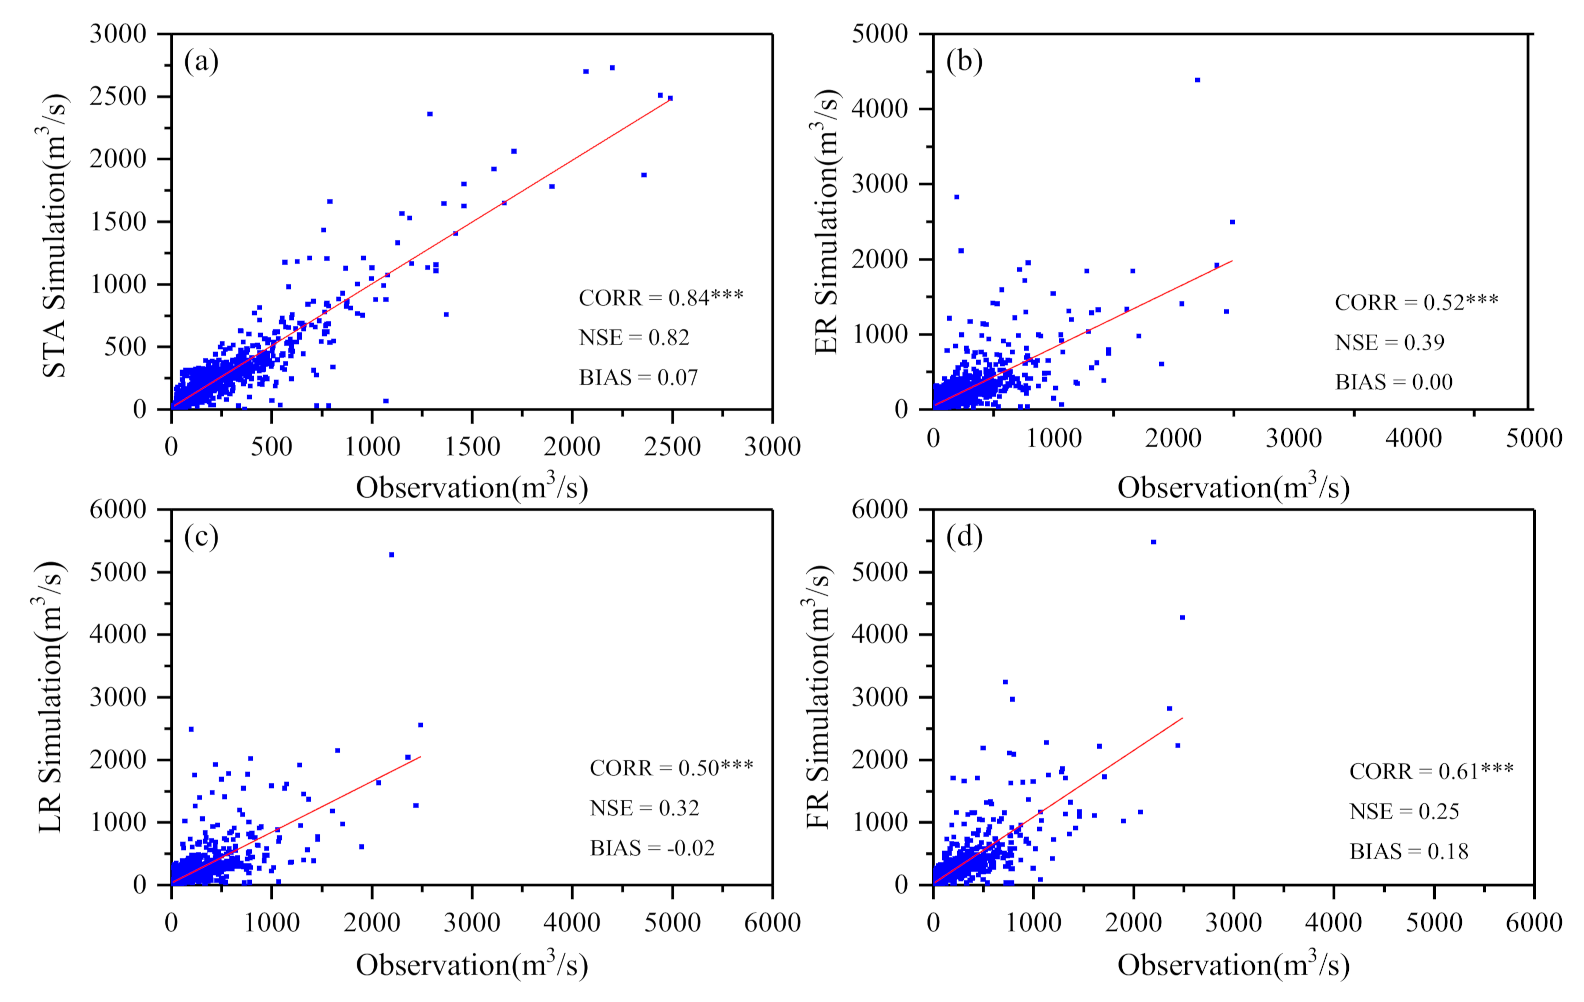
The gauge-benchmarked model based on Scenario I is then forced by rain gauge data (STA) and three IMERG products for daily and monthly streamflow simulations for the period from 1 April 2014 to 31 December 2017. Figure 6 depicts the daily hydrographs that are simulated using the STA, ER, LR, and FR products for the validation period based on the optimal parameter in Scenario I. The results show that the simulation of runoff from rainfall gauge data is in good agreement with the observations in the XRRB from Figure 7. The simulated streamflow forced by the three IMERG products has good performance capturing the spatial and temporal trends of heavy rainfall that lead to runoff generation, although there are significant overestimations in individual periods. Additionally, Figure 8 shows the evaluation statistics of the hydrological simulation results when the four precipitation pieces of data are used as inputs to drive the model. In the validation period, the CORR values of the simulated streamflow driven by the three IMERG products ranged from 0.50 to 0.61 during the validation period, the NSE values of the three products were considerably low and ranged from 0.25 to 0.39, and the BIAS values were all within ±20%. The FR-based streamflow presents a better CORR value than the ER and LR but worse BIAS and RMSE values, with a significant runoff overestimation of 18% and relatively low NSE (0.25). This phenomenon may occur for the following reason. The GPCC precipitation dataset, which is used for bias correction of the FR, is monthly-scale precipitation data, and may not sufficiently capture the spatiotemporal variation in daily-scale precipitation in the XRRB from 2014–2017. The potential large errors associated with the precipitation input will propagate in the streamflow simulations. Therefore, FR has not shown an obvious advantage in hydrological applications at daily scale. In terms of the index results, the simulation results of the directly input IMERG products are acceptable at the daily scale but are not satisfactory.
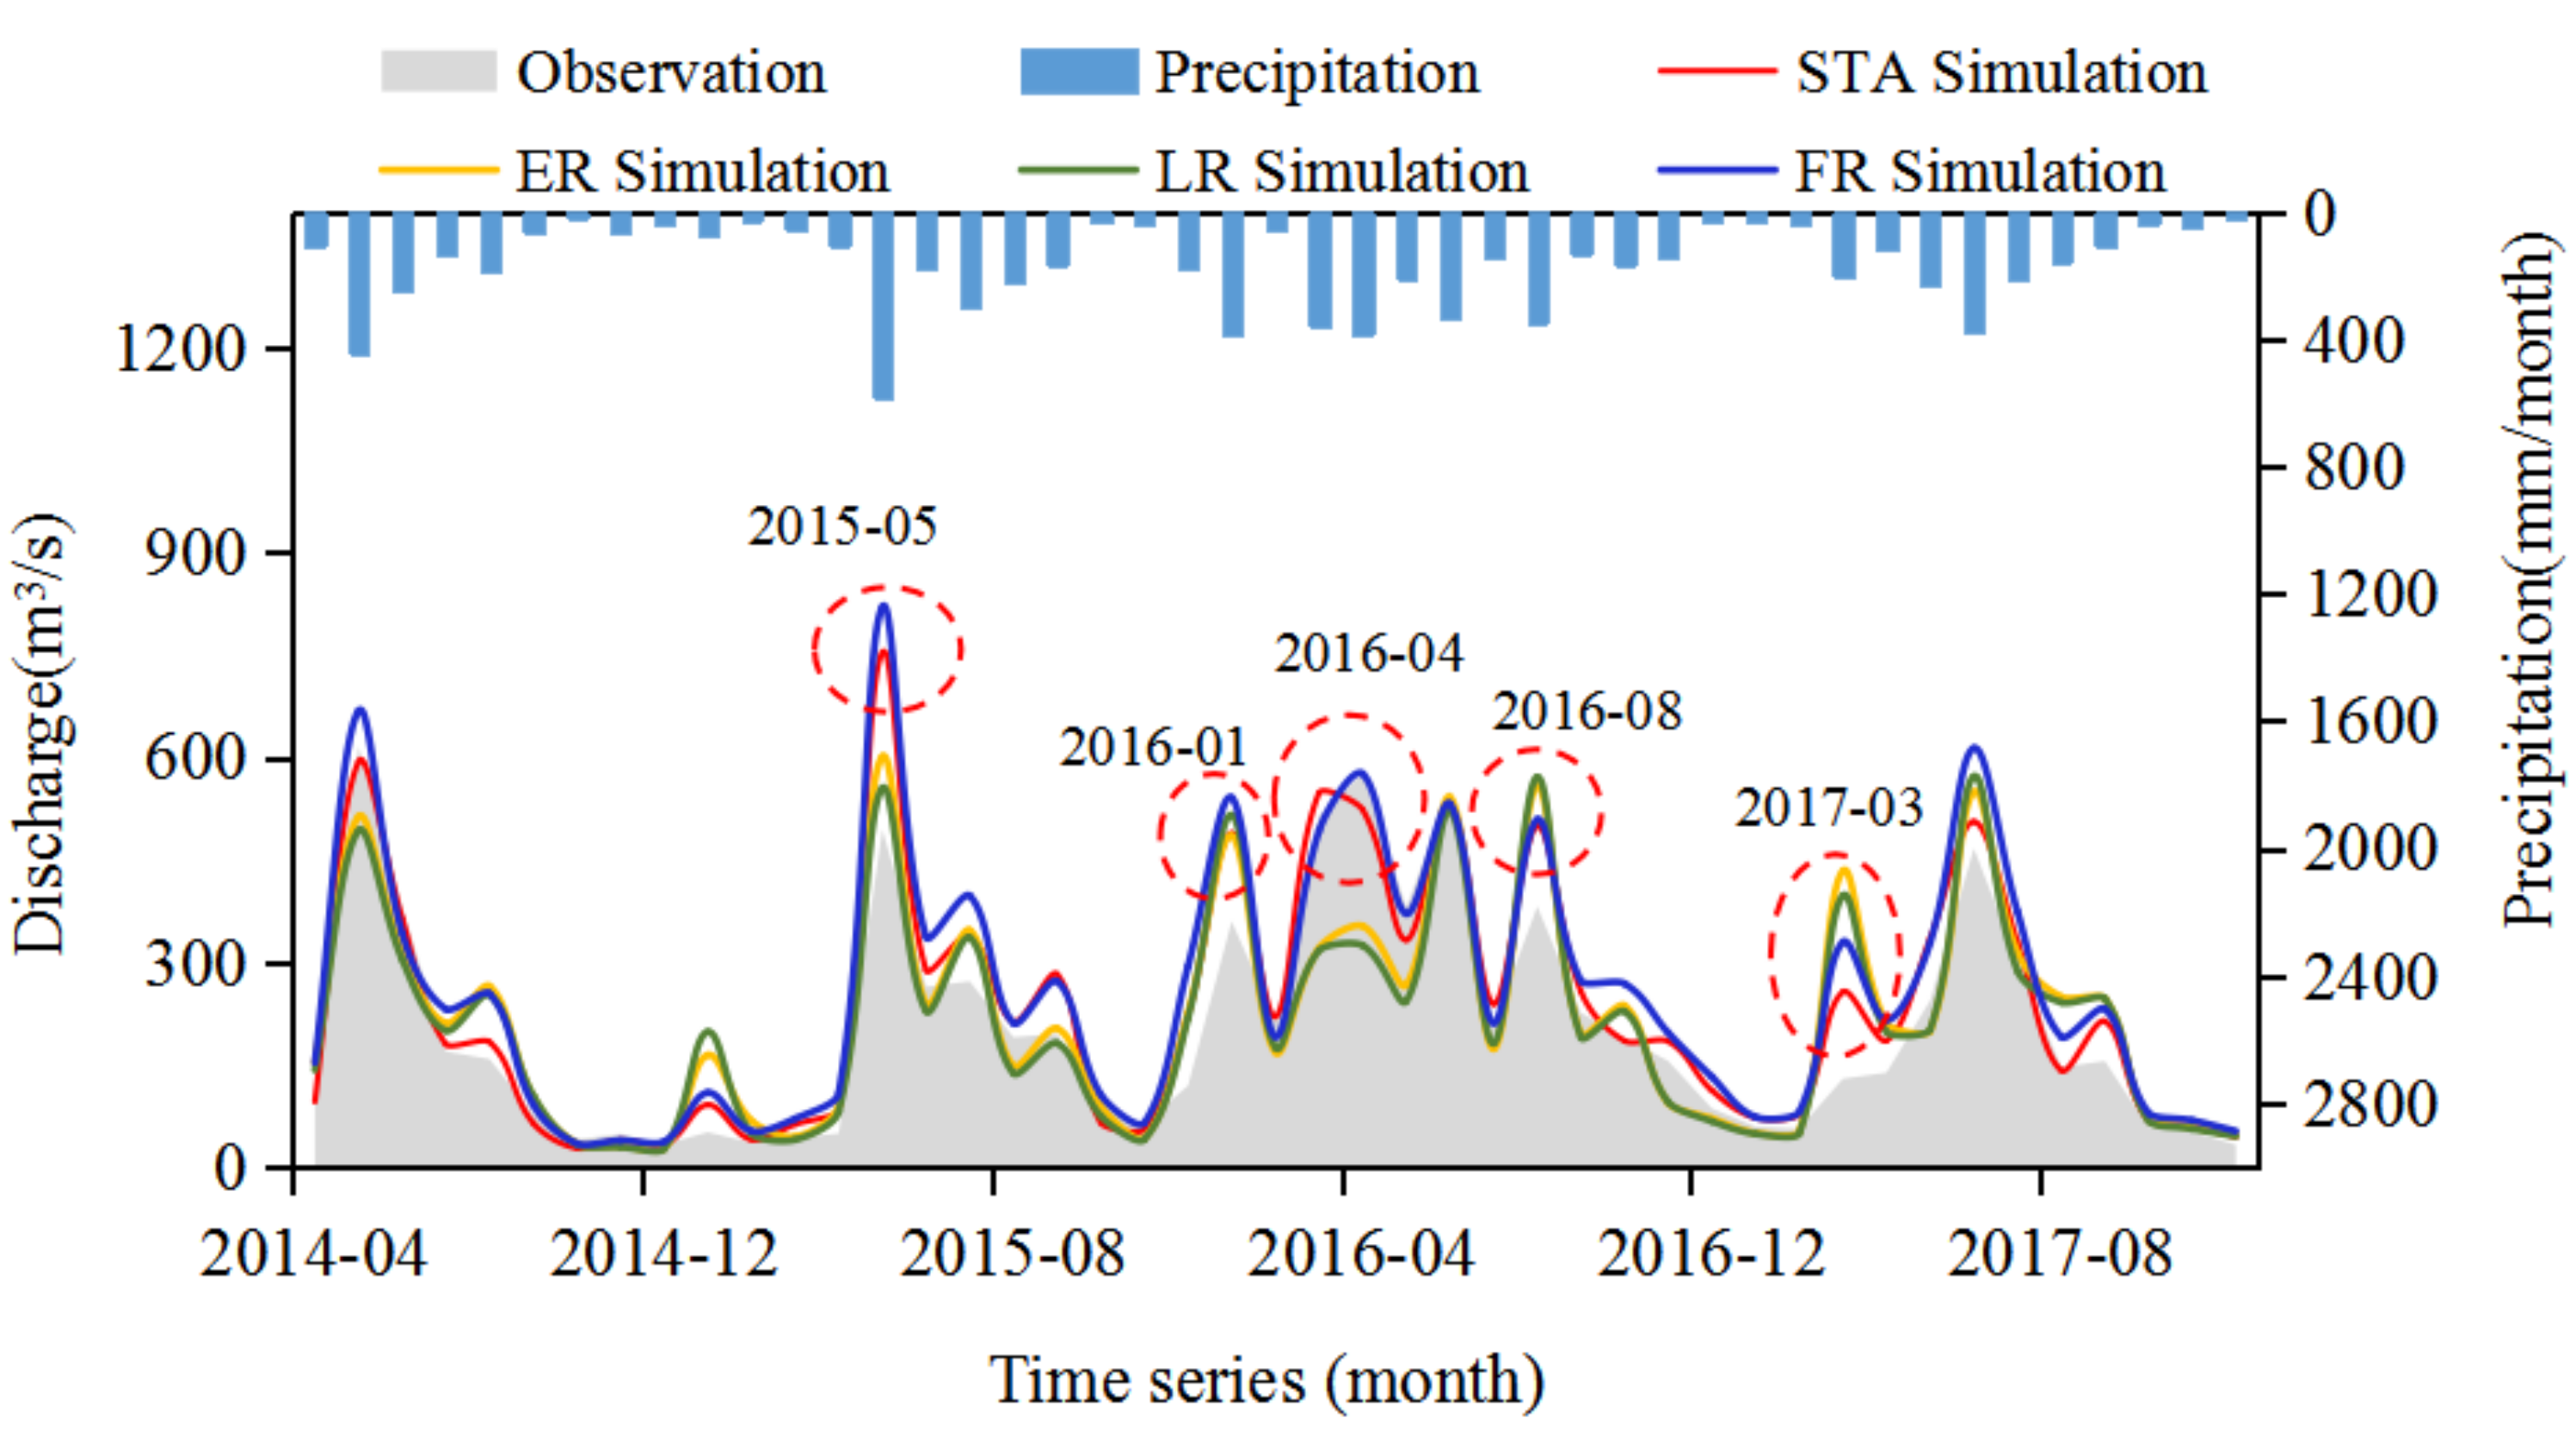
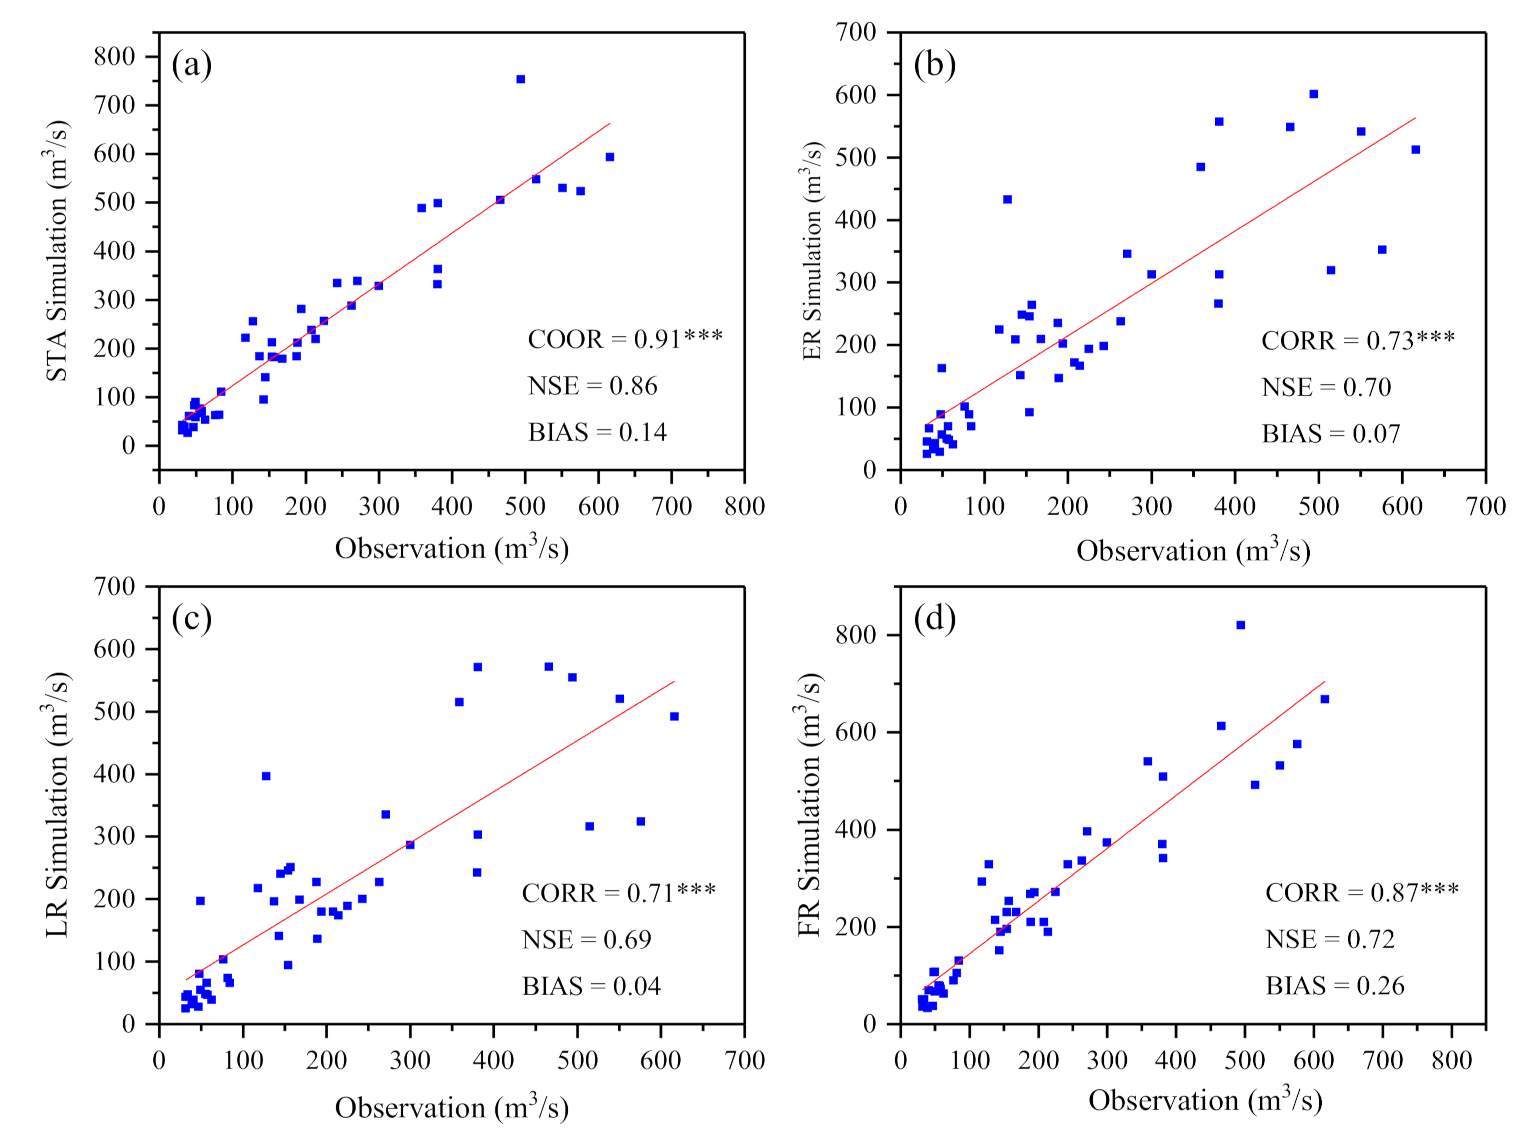
With regard to the results at the monthly temporal scale, the monthly observed and simulated streamflows driven by the four precipitation inputs (STA, ER, LR, and FR products) for the validation period are shown in Figure 9 and Figure 10. The simulated runoff curves for the STA, ER, LR, and FR products are generally consistent with the observed streamflow curves, especially for FR, which has a CORR of 0.87, a value that is much higher than that of ER (0.73) and LR (0.71). The NSE values of all three IMERG products are in the range of 0.69–0.72. The BIAS of FR (0.26) is significantly overestimated, much higher than ER (0.07) and LR (0.04). Similar to the significance test results reported in 4.1, the simulation results based on ER, LR and FR also exhibit significant differences under the t-test at the 95% confidence level. Overall, the IMERG series products have better simulations at the monthly scale than at the daily scale. Compared with the two near-real-time products (ER and LR), the simulations driven by the FR show better performance in hydrological applications. As seen from Figure 8, the markers (May- 2015, March-2017 and January-2016) show that the FR simulation is closer to the STA simulation than ER and LR simulations, which indicates the advantage of the post-real-time FR product. However, it is also necessary to note that all four products (STA, ER, LR, and FR) showed higher simulated flows than observations (the locations marked in May-2015, January-2016, October-2016 and March-2017), which may be related to measurement error in discharge.

4.2.2. Simulation Driven by the IMERG FR Product (Scenario II)

To explore the hydrological utility of the IMERG products in ungauged basins, the FR product is used as rainfall input, with a calibration period of 2014–2015 and a validation period of 2016–2017, to construct a hydrological model and observe the applicability of the model in the XRRB. Precipitation is usually the main source of uncertainty in hydrology, and different sets of precipitation data lead to different ranges of best estimates of the SWAT model calibration parameters [42]. The optimal model parameter settings are shown in Table A2. Scenario II represents an option for sparsely gauged applications, which can make use of the FR product.
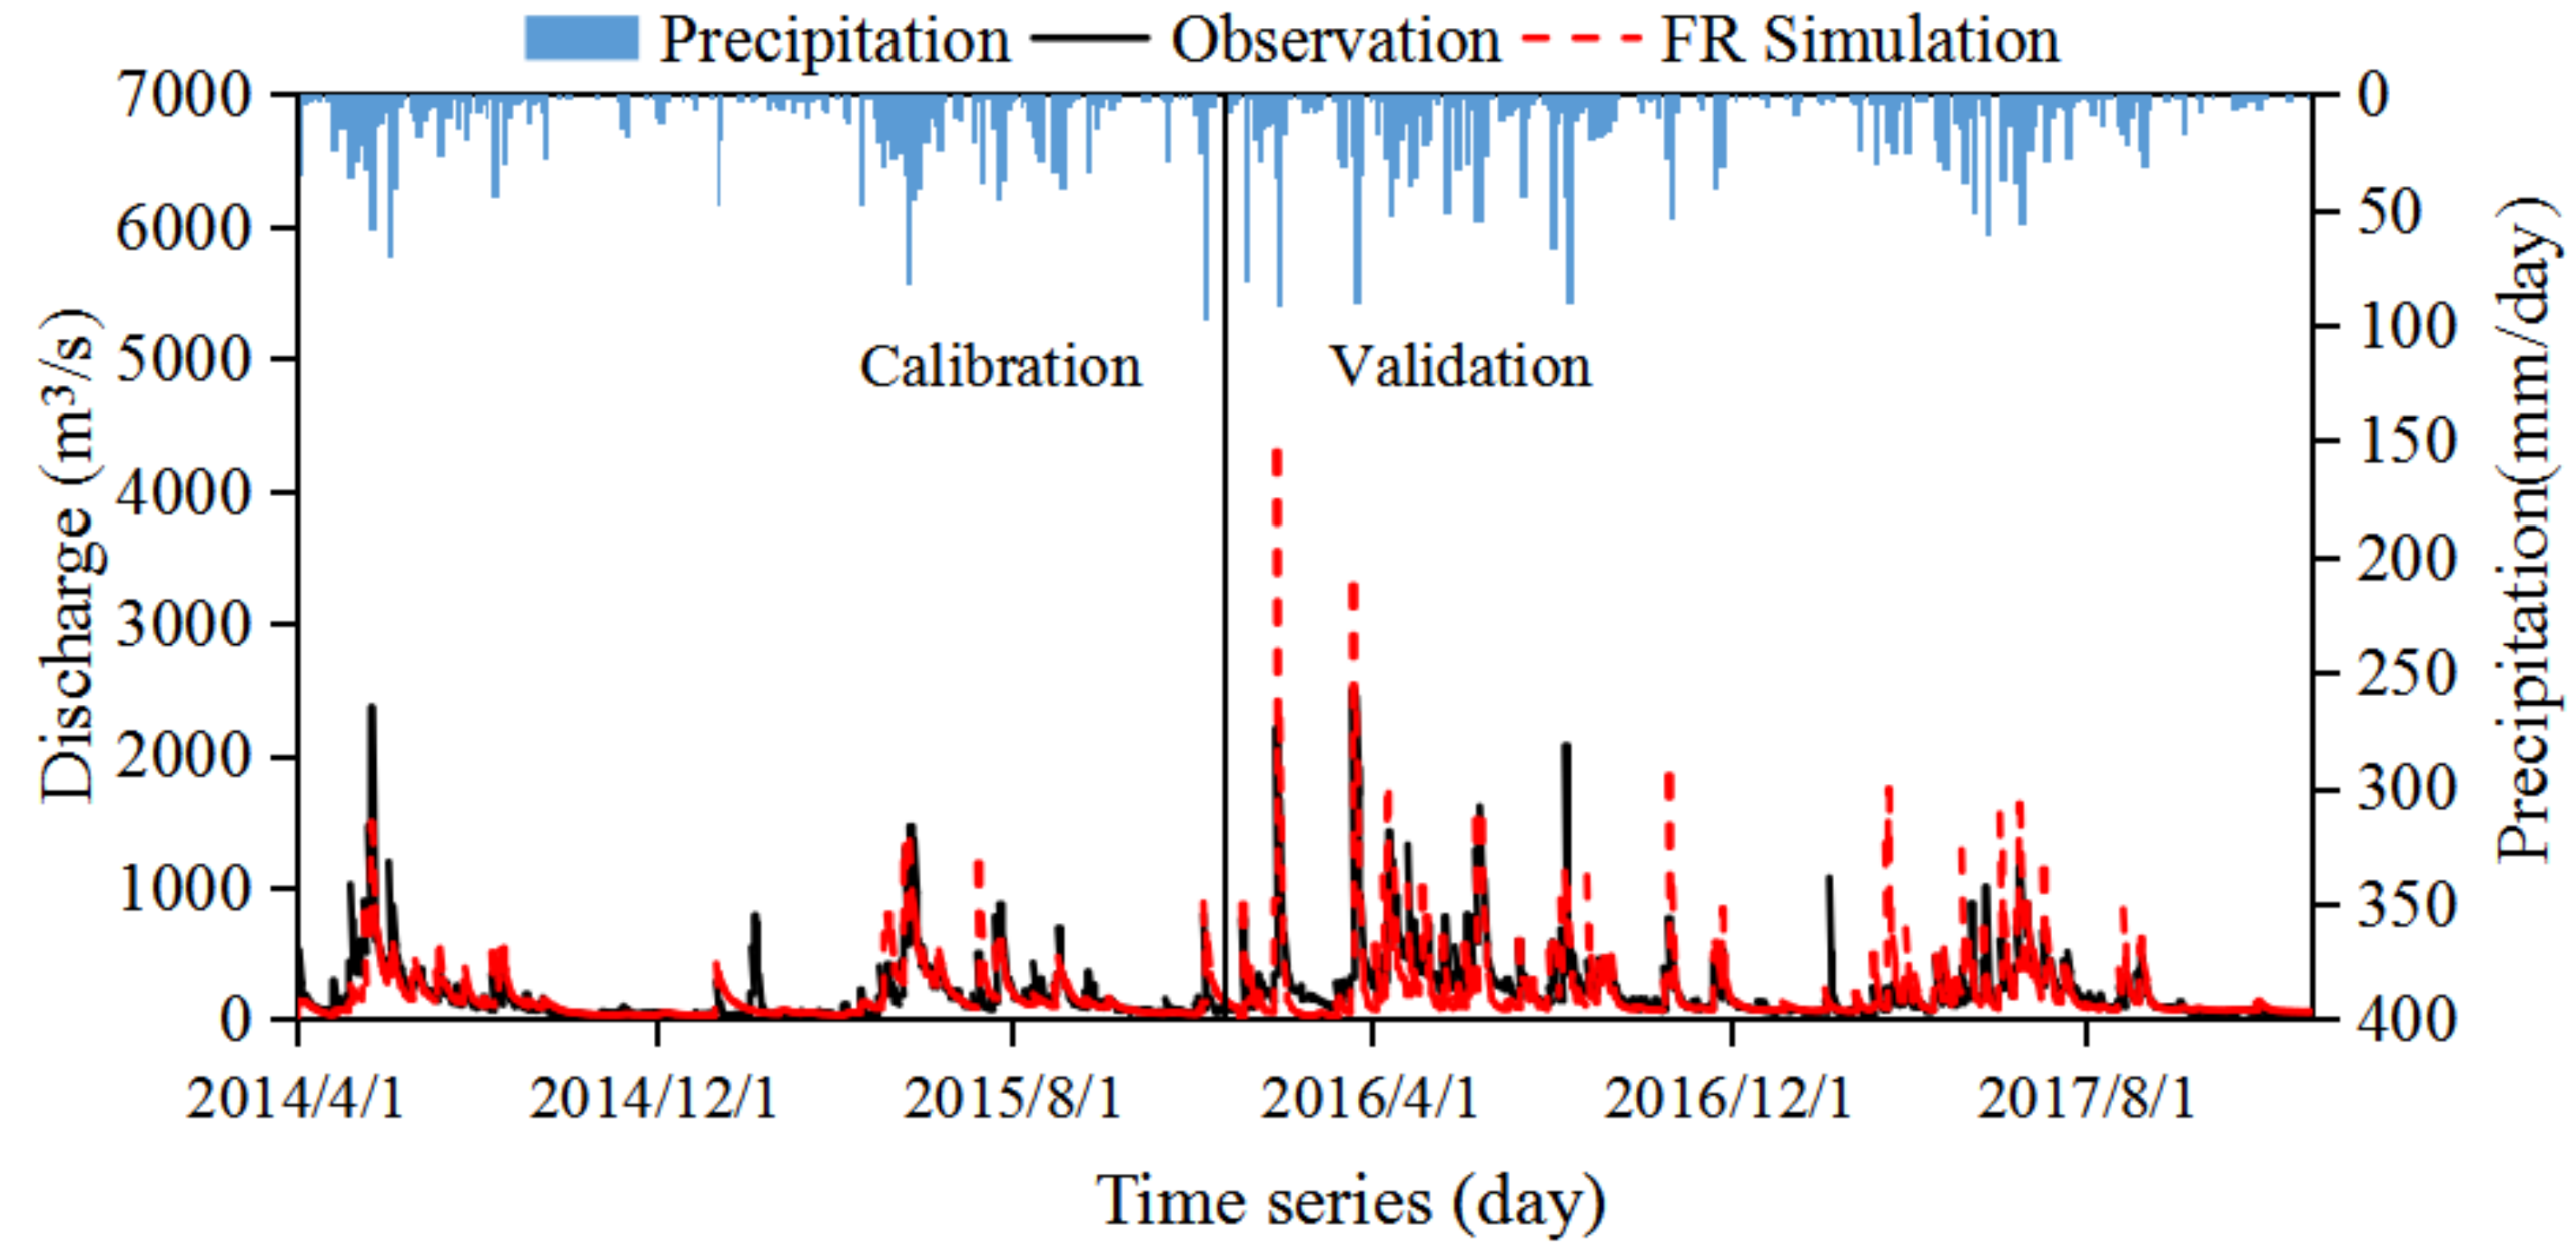
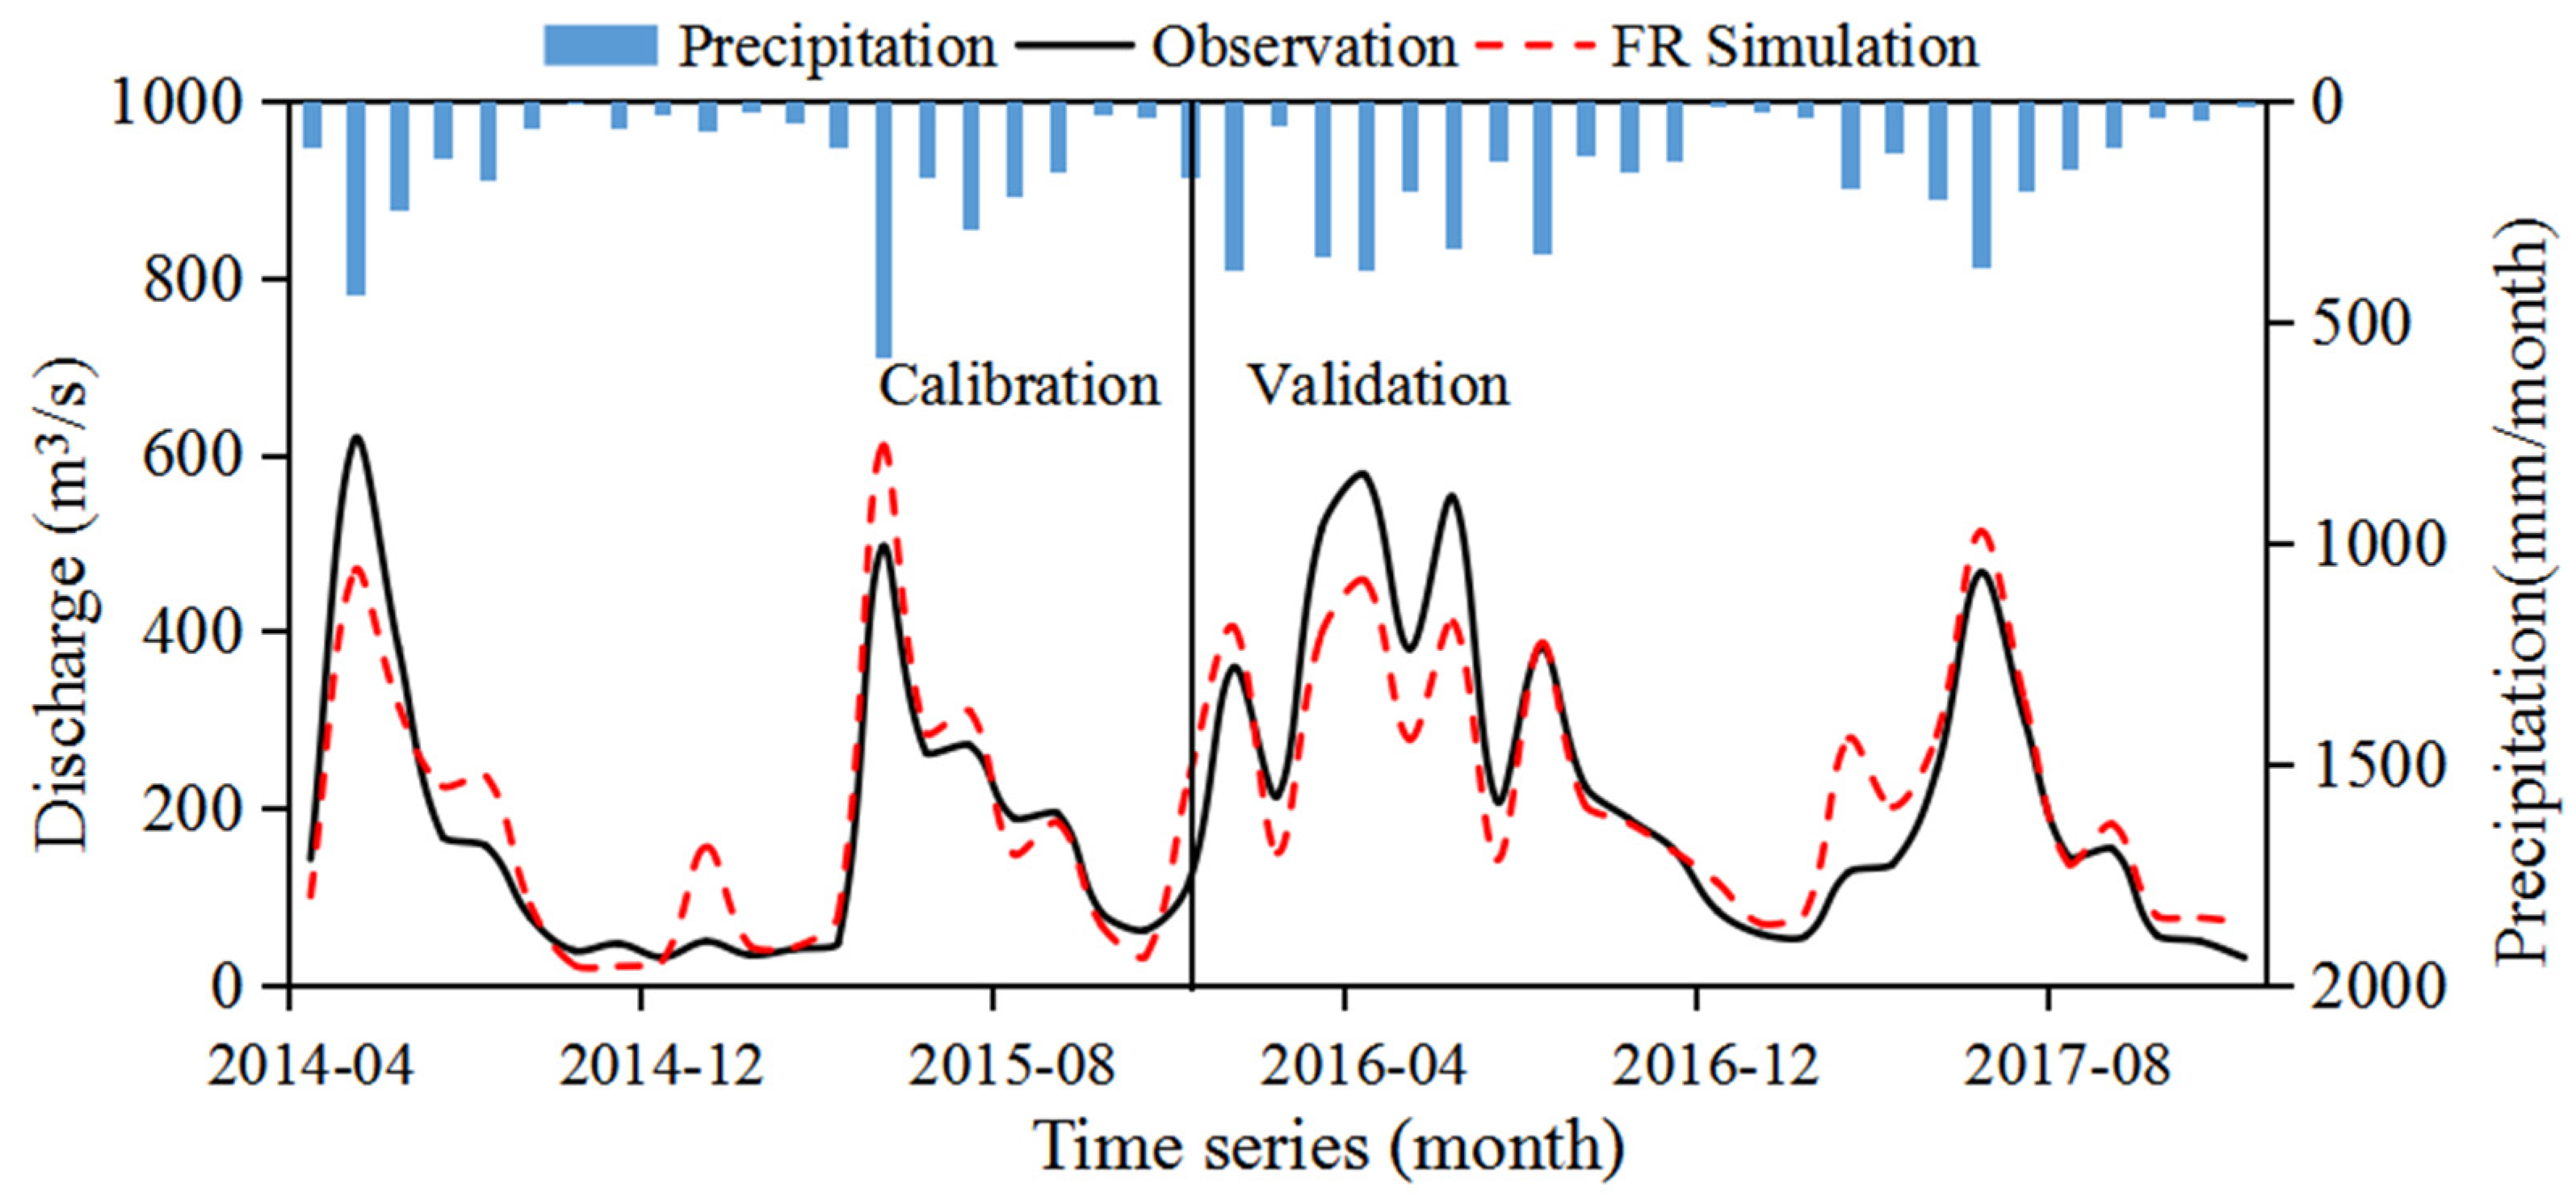
The streamflow simulation results of the FR product for Scenario II are shown in Figure 11 and Figure 12, and the statistical measurements are summarized in Table 4. What can be seen in Table 4 is that the hydrological simulation of the FR product in Scenario II has improved and shows a slightly better accuracy than that of Scenario I. At the daily scale, the CORR of the validation period is 0.64, BIAS is 0.01, and NSE is 0.43. The simulation results are acceptable but not satisfactory, although they are significantly better than those of the validation period in Scenario I (CORR = 0.61, BIAS = 0.18 and NSE = 0.25). The simulation results at the monthly scale show that simulations driving by the FR product during the validation period are significantly better than those in Scenario I, with a CORR of 0.85, an NSE of 0.84, and a BIAS of −0.02. As seen from Table 5, both p-factors are greater than 0.6 and R-factors are less than 1 during both the calibration and validation periods. The results indicate that the SWAT model constructed in Scenario II is robust and meets the requirements of hydrological simulation. All the results show that the SWAT model based on the FR product is suitable for the XRRB.
Overall, Scenario II shows that the hydrological and water resource study of the XRRB can, to a certain extent, use the IMERG FR product as direct input to hydrological and water resource studies instead of ground-based observations. FR can be a reasonable supplement for hydrological applications in areas where rain gauge data are scarce. In Scenario II, the model recalibration even improves the simulations in the calibration period. However, the hydrologic model parameters should be recalibrated carefully using satellite precipitation products, as this may lead to parameter values that do not correspond to reality.

5. Discussion

As shown in the box plots at the daily scale, several outliers associated with PODs (Figure 3d) are found in the three products. By reviewing the original data, we find that the outliers in the POD results come from the same station. Meanwhile, the RMSE and Bias results associated with this station are not notably different from those associated with other stations. Hence, we modestly conclude that some small precipitation events are not fully captured in this grid by the GPM. Despite this, the POD results still indicate that the IMERG products deliver better performance compared with other satellite-based precipitation products [5]. The retrieval algorithms of GPM sensors have received considerable improvement, while the Core Observation platform is equipped with the world’s first dual-frequency precipitation radar (DPR; Ku band at 13.6 GHz and Ka band at 35.5 GHz) [43]. In addition, as illustrated in Figure 4, outliers can also be found in the RMSE results of FR. By checking the original data, we discover that the outliers in the RMSE results also come from the same station, and they may be mainly caused by the fact that more heavy events happened at this station, leading to larger error magnitudes and RMSEs, because RMSE tends to amplify larger errors. Actually, the values of these outliers are also within the acceptable error range, hence they can still offer valuable spatial rainfall information in the next step of runoff simulation.
A large number of studies have evaluated the performance of IMERG products in China [44,45,46]. Scholars generally agree that satellite-based precipitation products have different accuracies in different climates and altitudes [44], while the IMERG series products show a better performance over humid regions than over high elevation zones in China [1]. Among the three IMERG products, FR always has a better accuracy than ER and LR. It is a widely held view that the FRs have better hydrological utility than ER and LR products [14,45]. Similar to these studies [14,45], FR is superior to ER and LR in terms of the CORR index (Table 2) in the XRRB. However, runoff simulation results driven by the FR product show higher deviations compared with those of ER and LR and most high flows are often overestimated in runoff simulations (Figure 7d, Figure 9). The reason may be that the FR after bias correction using the GPCC precipitation dataset fails to fully capture the spatial and temporal changes in precipitation in the XRRB. In a runoff simulation, the potential large errors caused by precipitation input are propagated. In Scenario II, the model after direct parameter rate-setting of FR improved the overestimation at high flows (Figure 11 and Figure 12) and reduced the BIAS values of the FR in daily and monthly scale runoff simulations during the validation period (2016–2017) (BIAS = 0.01 and −0.02). Therefore, the accuracy of runoff simulation in Scenario II is effectively improved through recalibration of the model parameters using FR.
Moreover, according to the results of the BIAS metric (Table 2), the ER and LR products underestimate precipitation (BIAS −0.14 and −0.16, respectively) while the FR product has a very low bias (0.01). However, when the ER and LR are used as forcing for the model, the simulation results are even better than those of the FR product for the NSE and BIAS metrics. One possible explanation is that the relationship between the quality of the precipitation dataset and the hydrological performance is not straightforward as described by previous studies due to the potential interactions between the model and the specific satellite-based rainfall products [1,46,47]. Thus, they should be used with caution in simulations over the XRRB.
Satellite-based precipitation products are obtained through the indirect method of rainfall detection, and the errors of satellite-based precipitation products are also influenced by a variety of factors, such as precipitation variability, spatiotemporal sampling, instrumentation capabilities, and the retrieval algorithms used [48,49]. Therefore, there are still many limitations to these satellite-based precipitation products, including sensitivity to precipitation types, underestimation of terrestrial rainfall, a tendency to miss snowfall, an inability to capture short precipitation events, and systematic bias in mountainous areas [50], which result in the relatively low accuracy of satellite-based precipitation products in some situations. Deviation correction studies of IMERG satellite products in the XRRB should be carried out in the future.
In addition, we would like to characterize the influence of the input parameters on the hydrological simulation errors, which had also been reported in [51,52,53]. However, as the true values of the non-precipitation parameters are missing, it is hard to analyze the contributions of their errors to the final simulation errors. In this case, the errors associated with the precipitation parameters will be mainly considered. Table 6 displays the simulation error changes when the input precipitation parameters are shifted from ground-based observed values to satellite-based precipitation products. It can be seen that the average annual precipitation is 1938.9 mm, while the ER, LR, and FR are 1721.5 mm, 1681.3 mm, and 1975.1 mm, respectively. The relative change rate of ER, LR, and FR with respect to precipitation at the site (STA) is −0.11, −0.13, and 0.02. While the relative change rate of simulation by the different precipitation inputs (ER, LR, and FR) with respect to simulation by the STA is −0.06, −0.08, and 0.11. The relative contribution to the simulation error by the precipitation parameters is obvious, and 9% of the precipitation error will cause 8% simulation errors. It is necessary to quantify the relative contribution to the simulation error by the non-precipitation and precipitation parameters in the future study.

6. Conclusions

This study conducted a comprehensive evaluation of the accuracy of the IMERG series products on multiple time scales (daily and monthly scales) and three spatial scales (grid cumulative scale, basin scale, and grid scale) in the mountainous XRRB of China. Subsequently, the hydrological utility of these products is assessed in streamflow simulations using the SWAT model, and an assessment of the impact of the FR product as forcing data in hydrological applications in the XRRB is derived. The main conclusions are described as follows.
(1)
At the daily scale, the FR outperforms the ER and LR products and has better CORR values (0.61/0.71) than the ER (0.59/0.69) and LR (0.59/0.69) at both the grid accumulation scale and the basin scale. At the monthly scale, the FR also has a higher CORR value (0.94/0.99) than the ER (0.88/0.93) and LR (0.88/0.92) products at both the grid accumulation scale and the basin scale. The RMSEs of the FR (48.03/18.99 mm) are also lower than those of the ER (71.50/54.88 mm) and LR (73.13/58.34 mm) products. For the systematic error, the ER and LR products generally tend to underestimate the precipitation, with BIASs of −0.14 and −0.16, respectively, while the FR tends to overestimate the precipitation, with a relatively low BIAS of 0.01. In terms of detection indicators, at the grid accumulation scale, the POD of IMERG series products is above 0.8 at the daily and monthly scales, the FAR is below 0.37, and the HSS is above 0.56. The results at the average scale of the basin show that the detection effect of each product is also satisfactory.
(2)
For the hydrological evaluation, two experiments based on different parameter calibration scenarios are conducted over the XRRB. In Scenario I, the IMERG-based simulation shows acceptable hydrological prediction skill in terms of the NSE (0.25–0.39) and CORR (0.50–0.61) at the daily scale and performs fairly well at the monthly scale (an NSE of 0.69–0.72 and a CORR of 0.71–0.87), especially for the FR product.
(3)
For the hydrological evaluation in Scenario II, the hydrological simulation performance improved. The hydrological prediction skill of the FR product in the validation period is acceptable (CORR = 0.64, BIAS = 0.01, and NSE = 0.43), and it is significantly better at the monthly scale than the simulation results in Scenario I (CORR = 0.85, BIAS = −0.02, and NSE = 0.84).
In summary, the IMERG products have certain hydrological application potential in tropical watersheds in data-deficient areas and may be able to replace ground station observations for hydrological modeling. This research is useful for hydrological, meteorological and disaster studies in developing countries or remote areas with sparse or low-quality networks of ground-based observation stations. Notably, the IMERG products show overestimations in the non-flood season. To reduce the uncertainty of hydrological simulations based on satellite data, deviation correction studies of the IMERG satellite products in the XRRB should be carried out in the future.
Author Contributions

X.L. conceived of the original design of this paper. Y.C. improved the structure of the paper. X.D., Y.Z., and L.C. provided comments on this paper. All authors have read and agreed to the published version of the manuscript.

Funding

This research was funded by the National Key Research and Development Program of China (No. 2017YFC1502702) and the Natural Science Foundation of China (No. 51961125206).

Institutional Review Board Statement

Not applicable.

Informed Consent Statement

Not applicable.

Data Availability Statement

Not applicable.

Acknowledgments

The authors would like to thank the developer of the IMERG products for providing the data free to the public.

Conflicts of Interest

The authors declare no conflict of interest.

Appendix A

Table A1. List of parameters used for model calibration in the XRRB (Scenario I).
Parameter NameDescriptionMethodDaily-Best ValueMonthly-Best Value
OV_NManning’s “n” value for overland flowReplace6.99522.242466
ESCOSoil evaporation compensation factorReplace0.287640.144083
SOL_AWC(1)Available water capacity of the soil layerRelative0.3166–0.179
CN2SCS runoff curve numberRelative0.2791320.121667
GWQMNTreshold depth of water in the shallow aquifer required for return flow to occur (mm)Replace3552.51363.644897
GW_REVAPGroundwater “revap” coefficientReplace0.197150.137424
GW_DELAYGroundwater delay (days)Replace388.6434159.862595
ALPHA_BFBaseflow alpha factor (days)Replace0.5611590.586
ALPHA_BNKBaseflow alpha factor for bank storageReplace0.5048930.633746
SOL_K(1)Saturated hydraulic conductivityRelative0.3236120.553253
REVAPMNThreshold depth of water in the shallow aquifer for “revap” to occur (mm)Replace1.19143.035614
CH-K2Effective hydraulic conductivity in main channel alluviumReplace21.66718324.792658

Appendix B

Table A2. List of parameters used for model calibration in the XRRB (Scenario II).
Parameter NameDescriptionMethodDaily-Best ValueMonthly-Best Value
OV_NManning’s “n” value for overland flowReplace15.86614.638
ESCOSoil evaporation compensation factorReplace0.104–0.301
SOL_AWC(1)Available water capacity of the soil layerRelative–0.4640.211
CN2SCS runoff curve numberRelative0.1710.407
GWQMNTreshold depth of water in the shallow aquifer required for return flow to occur (mm)Replace4954.1673077.062
GW_REVAPGroundwater “revap” coefficientReplace0.1230.095
GW_DELAYGroundwater delay (days)Replace167.082291.394
ALPHA_BFBaseflow alpha factor (days)Replace0.4460.605
ALPHA_BNKBaseflow alpha factor for bank storageReplace0.9770.467
SOL_K(1)Saturated hydraulic conductivityRelative–0.0300.763
REVAPMNThreshold depth of water in the shallow aquifer for “revap” to occur (mm)Replace295.667498.000
CH-K2Effective hydraulic conductivity in main channel alluviumReplace66.37326.624

References

  1. Jiang, L.; Bauer-Gottwein, P. How do GPM IMERG precipitation estimates perform as hydrological model forcing? Evaluation for 300 catchments across Mainland China. J. Hydrol. 2019, 572, 486–500. [Google Scholar] [CrossRef]
  2. Ramsauer, T.; Weiß, T.; Marzahn, P. Comparison of the GPM IMERG Final Precipitation Product to RADOLAN Weather Radar Data over the Topographically and Climatically Diverse Germany. Remote Sens. 2018, 10, 2029. [Google Scholar] [CrossRef] [Green Version]
  3. Jiang, S.; Ren, L.; Hong, Y.; Yong, B.; Yang, X.; Yuan, F.; Ma, M. Comprehensive evaluation of multi-satellite precipitation products with a dense rain gauge network and optimally merging their simulated hydrological flows using the Bayesian model averaging method. J. Hydrol. 2012, 452–453, 213–225. [Google Scholar] [CrossRef]
  4. Zulkafli, Z.; Buytaert, W.; Onof, C.; Manz, B.; Tarnavsky, E.; Lavado, W.; Guyot, J. A Comparative Performance Analysis of TRMM 3B42 (TMPA) Versions 6 and 7 for Hydrological Applications over Andean–Amazon River Basins. J. Hydrometeorol. 2014, 15, 581–592. [Google Scholar] [CrossRef]
  5. Tang, G.; Ma, Y.; Long, D.; Zhong, L.; Hong, Y. Evaluation of GPM Day-1 IMERG and TMPA Version-7 legacy products over Mainland China at multiple spatiotemporal scales. J. Hydrol. 2016, 533, 152–167. [Google Scholar] [CrossRef]
  6. Huffman, G.J. NASA Global Precipitation Measurement (GPM) Integrated Multi-Satellite Retrievals for GPM (IMERG) Technical Documentation. NASA. 2017. Available online: https://pmm.nasa.gov/index.php?q=data-access/downloads/gpm (accessed on 10 May 2020).
  7. Duan, Z.; Liu, J.; Tuo, Y.; Chiogna, G.; Disse, M. Evaluation of eight high spatial resolution gridded precipitation products in Adige Basin (Italy) at multiple temporal and spatial scales. Sci. Total Environ. 2016, 573, 1536–1553. [Google Scholar] [CrossRef] [Green Version]
  8. Kumar, D.; Gautam, A.K.; Palmate, S.S.; Pandey, A.; Suryavanshi, S.; Rathore, N.; Sharma, N. Evaluation of TRMM multi-satellite precipitation analysis (TMPA) against terrestrial measurement over a humid sub-tropical basin, India. Theor. Appl. Climatol. 2017, 129, 783–799. [Google Scholar] [CrossRef]
  9. Lee, J.; Lee, E.; Seol, K. Validation of Integrated MultisatellitE Retrievals for GPM (IMERG) by using gauge-based analysis products of daily precipitation over East Asia. Theor. Appl. Climatol. 2019, 137, 2497–2512. [Google Scholar] [CrossRef]
  10. Sharifi, E.; Steinacker, R.; Saghafian, B. Multi time-scale evaluation of high-resolution satellite-based precipitation products over northeast of Austria. Atmos. Res. 2018, 206, 46–63. [Google Scholar] [CrossRef]
  11. Zhao, H.; Yang, B.; Yang, S.; Huang, Y.; Dong, G.; Bai, J.; Wang, Z. Systematical estimation of GPM-based global satellite mapping of precipitation products over China. Atmos. Res. 2018, 201, 206–217. [Google Scholar] [CrossRef]
  12. Tan, M.L.; Santo, H. Comparison of GPM IMERG, TMPA 3B42 and PERSIANN-CDR satellite precipitation products over Malaysia. Atmos. Res. 2018, 202, 63–76. [Google Scholar] [CrossRef]
  13. Wang, Z.; Zhong, R.; Lai, C.; Chen, J. Evaluation of the GPM IMERG satellite-based precipitation products and the hydrological utility. Atmos. Res. 2017, 196, 151–163. [Google Scholar] [CrossRef]
  14. Yuan, F.; Wang, B.; Shi, C.; Cui, W.; Zhao, C.; Liu, Y.; Ren, L.; Zhang, L.; Zhu, Y.; Chen, T.; et al. Evaluation of hydrological utility of IMERG Final run V05 and TMPA 3B42V7 satellite precipitation products in the Yellow River source region, China. J. Hydrol. 2018, 567, 696–711. [Google Scholar] [CrossRef]
  15. Zhao, H.; Yang, S.; Wang, Z.; Zhou, X.; Luo, Y.; Wu, L. Evaluating the suitability of TRMM satellite rainfall data for hydrological simulation using a distributed hydrological model in the Weihe River catchment in China. J. Geogr. Sci. 2015, 25, 177–195. [Google Scholar] [CrossRef]
  16. Meng, J.; Li, L.; Hao, Z.; Wang, J.; Shao, Q. Suitability of TRMM satellite rainfall in driving a distributed hydrological model in the source region of Yellow River. J. Hydrol. 2014, 509, 320–332. [Google Scholar] [CrossRef]
  17. Anjum, M.N.; Ding, Y.; Shangguan, D.; Ahmad, I.; Ijaz, M.W.; Farid, H.U.; Yagoub, Y.E.; Zaman, M.; Adnan, M. Performance evaluation of latest integrated multi-satellite retrievals for Global Precipitation Measurement (IMERG) over the northern highlands of Pakistan. Atmos. Res. 2018, 205, 134–146. [Google Scholar] [CrossRef]
  18. Ma, Q.; Li, Y.; Feng, H.; Yu, Q.; Zou, Y.; Liu, F.; Pulatov, B. Performance evaluation and correction of precipitation data using the 20-year IMERG and TMPA precipitation products in diverse subregions of China. Atmos. Res. 2021, 249, 105304. [Google Scholar] [CrossRef]
  19. Li, X.; Chen, Y.; Wang, H.; Zhang, Y. Assessment of GPM IMERG and radar quantitative precipitation estimation (QPE) products using dense rain gauge observations in the Guangdong-Hong Kong-Macao Greater Bay Area, China. Atmos. Res. 2020, 236, 104834. [Google Scholar] [CrossRef]
  20. Tang, G.; Zeng, Z.; Ma, M.; Liu, R.; Wen, Y.; Hong, Y. Can Near-Real-Time Satellite Precipitation Products Capture Rainstorms and Guide Flood Warning for the 2016 Summer in South China? IEEE Geosci. Remote Sens. Lett. 2017, 14, 1208–1212. [Google Scholar] [CrossRef]
  21. Mahmoud, M.T.; Al-Zahrani, M.A.; Sharif, H.O. Assessment of global precipitation measurement satellite products over Saudi Arabia. J. Hydrol. 2018, 559, 1–12. [Google Scholar] [CrossRef]
  22. Levizzani, V.; Cattani, E. Satellite Remote Sensing of Precipitation and the Terrestrial Water Cycle in a Changing Climate. Remote Sens. 2019, 11, 2301. [Google Scholar] [CrossRef] [Green Version]
  23. Li, D.; Christakos, G.; Ding, X.; Wu, J. Adequacy of TRMM satellite rainfall data in driving the SWAT modeling of Tiaoxi catchment (Taihu lake basin, China). J. Hydrol. 2018, 556, 1139–1152. [Google Scholar] [CrossRef]
  24. Hazra, A.; Maggioni, V.; Houser, P.; Antil, H.; Noonan, M. A Monte Carlo-based multi-objective optimization approach to merge different precipitation estimates for land surface modeling. J. Hydrol. 2019, 570, 454–462. [Google Scholar] [CrossRef]
  25. Kneis, D.; Chatterjee, C.; Singh, R. Evaluation of TRMM rainfall estimates over a large Indian river basin (Mahanadi). Hydrol. Earth Syst. Sci. 2014, 18, 2493–2502. [Google Scholar] [CrossRef] [Green Version]
  26. Tong, K.; Su, F.; Yang, D.; Zhang, L.; Hao, Z. Tibetan Plateau precipitation as depicted by gauge observations, reanalyses and satellite retrievals. Int. J. Climatol. 2014, 34, 265–285. [Google Scholar] [CrossRef]
  27. Nanda, T.; Sahoo, B.; Beria, H.; Chatterjee, C. A wavelet-based non-linear autoregressive with exogenous inputs (WNARX) dynamic neural network model for real-time flood forecasting using satellite-based rainfall products. J. Hydrol. 2016, 539, 57–73. [Google Scholar] [CrossRef]
  28. Yang, L. Survey Error Analysis for Inflow in Xinfengjiang Reservoir. Heilongjiang Sci. Technol. Water Conserv. 2012, 40, 14–16. [Google Scholar]
  29. Feng, Y. Study on the Stage Storage Target of Xinfengjiang Reservoir in Flood Season. Yunnan Water Power 2019, 35, 44–47. [Google Scholar]
  30. Wang, W.; Lu, H.; Zhao, T.; Jiang, L.; Shi, J. Evaluation and Comparison of Daily Rainfall from Latest GPM and TRMM Products Over the Mekong River Basin. IEEE J. Stars 2017, 10, 2540–2549. [Google Scholar] [CrossRef]
  31. Nash, J.E.; Sutcliffe, J.V. River flow forecasting through conceptual models part I—A discussion of principles. J. Hydrol. 1970, 3, 282–290. [Google Scholar] [CrossRef]
  32. Yen, H.; Wang, R.; Feng, Q.; Young, C.; Chen, S.; Tseng, W.; Wolfe, J.E.; White, M.J.; Arnold, J.G. Input uncertainty on watershed modeling: Evaluation of precipitation and air temperature data by latent variables using SWAT. Ecol. Eng. 2018, 122, 16–26. [Google Scholar] [CrossRef]
  33. Moriasi, D.N.; Arnold, J.G.; Van Liew, M.W.; Bingner, R.L.; Harmel, R.D.; Veith, T.L. Model evaluation guidelines for systematic quantification of accuracy in watershed simulations. Trans. ASABE 2007, 50, 885–900. [Google Scholar] [CrossRef]
  34. Wu, H.; Chen, B. Evaluating uncertainty estimates in distributed hydrological modeling for the Wenjing River watershed in China by GLUE, SUFI-2, and ParaSol methods. Ecol. Eng. 2015, 76, 110–121. [Google Scholar] [CrossRef]
  35. Abbaspour, K.C.; Rouholahnejad, E.; Vaghefi, S.; Srinivasan, R.; Yang, H.; Kløve, B. A continental-scale hydrology and water quality model for Europe: Calibration and uncertainty of a high-resolution large-scale SWAT model. J. Hydrol. 2015, 524, 733–752. [Google Scholar] [CrossRef] [Green Version]
  36. Srinivasan, R.; Ramanarayanan, T.S.; Arnold, J.G.; Bednarz, S.T. Large area hydrologic modeling and assessment part II: Model application. J. Am. Water Resour. Assoc. 1998, 34, 91–101. [Google Scholar] [CrossRef]
  37. Busico, G.; Colombani, N.; Fronzi, D.; Pellegrini, M.; Tazioli, A.; Mastrocicco, M. Evaluating SWAT model performance, considering different soils data input, to quantify actual and future runoff susceptibility in a highly urbanized basin. J. Environ. Manag. 2020, 266, 110625. [Google Scholar] [CrossRef] [PubMed]
  38. Da Silva, R.M.; Dantas, J.C.; Beltrão, J.D.A.; Santos, C.A.G. Hydrological simulation in a tropical humid basin in the Cerrado biome using the SWAT model. Hydrol. Res. 2018, 49, 908–923. [Google Scholar] [CrossRef]
  39. Cunge, J.A. On The Subject of A Flood Propagation Computation Method (Musklngum Method). J. Hydraul. Res. 1969, 7, 205–230. [Google Scholar] [CrossRef]
  40. Khoi, D.N.; Thom, V.T. Parameter uncertainty analysis for simulating streamflow in a river catchment of Vietnam. Glob. Ecol. Conserv. 2015, 4, 538–548. [Google Scholar] [CrossRef] [Green Version]
  41. Jiang, S.; Ren, L.; Xu, C.; Yong, B.; Yuan, F.; Liu, Y.; Yang, X.; Zeng, X. Statistical and hydrological evaluation of the latest Integrated Multi-satellitE Retrievals for GPM (IMERG) over a midlatitude humid basin in South China. Atmos. Res. 2018, 214, 418–429. [Google Scholar] [CrossRef]
  42. Tuo, Y.; Duan, Z.; Disse, M.; Chiogna, G. Evaluation of precipitation input for SWAT modeling in Alpine catchment: A case study in the Adige river basin (Italy). Sci. Total Environ. 2016, 573, 66–82. [Google Scholar] [CrossRef] [Green Version]
  43. Li, N.; Tang, G.; Zhao, P.; Hong, Y.; Gou, Y.; Yang, K. Statistical assessment and hydrological utility of the latest multi-satellite precipitation analysis IMERG in Ganjiang River basin. Atmos. Res. 2017, 183, 212–223. [Google Scholar] [CrossRef]
  44. Luo, X.; Fan, X.; Li, Y.; Ji, X. Bias correction of a gauge-based gridded product to improve extreme precipitation analysis in the Yarlung Tsangpo–Brahmaputra River basin. Nat. Hazard. Earth Syst. 2020, 20, 2243–2254. [Google Scholar] [CrossRef]
  45. Su, J.; Lü, H.; Zhu, Y.; Cui, Y.; Wang, X. Evaluating the hydrological utility of latest IMERG products over the Upper Huaihe River Basin, China. Atmos. Res. 2019, 225, 17–29. [Google Scholar] [CrossRef]
  46. Chen, X.; Zhong, R.; Wang, Z. Evaluation on the accuracy and hydrological performance of the latest-generation GPM IMERG product over South China. J. Hydraul. Eng. 2017, 48, 1147–1156. [Google Scholar]
  47. Camici, S.; Ciabatta, L.; Massari, C.; Brocca, L. How reliable are satellite precipitation estimates for driving hydrological models: A verification study over the Mediterranean area. J. Hydrol. 2018, 563, 950–961. [Google Scholar] [CrossRef]
  48. Lu, X.; Tang, G.; Wang, X.; Liu, Y.; Jia, L.; Xie, G.; Li, S.; Zhang, Y. Correcting GPM IMERG precipitation data over the Tianshan Mountains in China. J. Hydrol. 2019, 575, 1239–1252. [Google Scholar] [CrossRef]
  49. Wu, L.Z.P. Validation of Daily Precipitation from Two High-Resolution Satellite Precipitation Datasets over the Tibetan Plateau and the Regions to Its East. J. Meteorol. Res. 2012, 26, 735–745. [Google Scholar] [CrossRef]
  50. De Vera, A.; Terra, R. Combining CMORPH and Rain Gauges Observations over the Rio Negro Basin. J. Hydrometeorol. 2012, 13, 1799–1809. [Google Scholar] [CrossRef]
  51. Lu, Z.; Zou, S.; Xiao, H.; Zheng, C.; Yin, Z.; Wang, W. Comprehensive hydrologic calibration of SWAT and water balance analysis in mountainous watersheds in northwest China. J. Phys. Chem. Earth 2015, 79, 76–85. [Google Scholar] [CrossRef]
  52. Cao, Y.; Zhang, J.; Yang, M. Application of SWAT Model with CMADS Data to Estimate Hydrological Elements and Parameter Uncertainty Based on SUFI-2 Algorithm in the Lijiang River Basin, China. Water 2018, 10, 742. [Google Scholar] [CrossRef] [Green Version]
  53. Ma, Q.; Xiong, L.; Liu, D.; Xu, C.-Y.; Guo, S. Evaluating the Temporal Dynamics of Uncertainty Contribution from Satellite Precipitation Input in Rainfall-Runoff Modeling Using the Variance Decomposition Method. Remote Sens. 2018, 10, 1876. [Google Scholar] [CrossRef] [Green Version]
Figure 1. Elevation map of the Xinfengjiang River reservoir basin.
Remotesensing 13 00866 g001
Figure 2. The main flowchart of this research.
Remotesensing 13 00866 g002
Figure 3. Box plots of statistical accuracy indices ((a) CORR, (b) RMSE, (c) BIAS, (d) POD, (e) FAR, and (f) HSS) on a daily scale of the three IMERG products versus rain gauge data at the grid scale.
Remotesensing 13 00866 g003
Figure 4. Box plots of statistical accuracy indices ((a) CORR, (b) RMSE, (c) BIAS, (d) POD, (e) FAR, and (f) HSS) on a monthly scale of the three IMERG products versus rain gauge data at the grid scale.
Remotesensing 13 00866 g004
Figure 5. Comparison of observed and simulated hydrographs using daily rain gauge data during the calibration period and validation period in the XRRB (Scenario I).
Remotesensing 13 00866 g005
Figure 6. Comparison of observed and simulated hydrographs using monthly rain gauge data during the calibration period and validation period in the XRRB (Scenario I).
Remotesensing 13 00866 g006
Figure 7. Daily streamflow simulations based on the optimal parameter in Scenario I driven by. (a) STA, (b) ER, (c) LR, and (d) FR during the validation period (2014–2017).
Remotesensing 13 00866 g007
Figure 8. Scatter plots of daily simulated streamflow driven by (a) STA, (b) ER, (c) LR, and (d) FR against the corresponding observed streamflow (***: p < 0.001).
Remotesensing 13 00866 g008
Figure 9. Monthly streamflow simulations during the validation period based on the optimal parameter in Scenario I driven by the four precipitation datasets (STA, ER, LR, and FR).
Remotesensing 13 00866 g009
Figure 10. Scatter plots of monthly simulated streamflow driven by (a) STA, (b) ER, (c) LR, and (d) FR against the corresponding observed streamflow (***: p < 0.001).
Remotesensing 13 00866 g010
Figure 11. Model simulations during the calibration and validation periods at the daily scale (Scenario II).
Remotesensing 13 00866 g011
Figure 12. Model simulations during the calibration and validation periods at the monthly scale (Scenario II).
Remotesensing 13 00866 g012
Table 1. List of statistical metrics used in the statistical and hydrologic evaluations.
Evaluation IndexesEquationPerfect Value
Correlation coefficient (CORR) B I A S = i = 1 n y i x i i = 1 n x i 1
Relative bias (BIAS) B I A S = i = 1 n y i x i i = 1 n x i 0
Root-mean-square error (RMSE) R M S E = i = 1 n y i x i 2 n 0
Probability of detection (POD) P O D = N 11 N 11 + N 01 1
False alarm rate (FAR) F A R = N 10 N 11 + N 10 0
Heidke skill score (HSS) H S S = 2 N 11 N 00 N 10 N 01 N 11 + N 01 N 01 + N 00 + N 11 + N 10 N 10 + N 00 1
Nash–Sutcliffe efficiency (NSE) N S E t = 1 i = 1 n y i x i 2 i = 1 n y i y ¯ 2 1
(Notation: n represents the number of variables; y i represents the satellite-based precipitation data or simulated streamflow; x i represents the rain gauge data or streamflow; y represents the mean value of satellite-based precipitation data or simulated streamflow; X represents the mean value of the rain gauge data or streamflow; N 11 represents precipitation detected by both gauges and satellite-based products; N 01 represents precipitation detected by gauges but not detected by the satellite-based precipitation product; and N 10 is the opposite of N 01 ).
Table 2. Summary of the evaluation metrics for the three IMERG products at daily and monthly resolutions over the Xinfengjiang River reservoir basin.
Spatial ScaleTemporal ScalesProductsCORRRMSE (mm)BIASPODFARHSS
Grid accumulation scaleDailyER0.59 ***11.78−0.140.800.370.56
LR0.59 ***11.77−0.160.810.370.57
FR0.61 ***12.16+0.010.810.370.57
MonthlyER0.88 ***71.50−0.141.000.020.98
LR0.88 ***73.13−0.161.000.020.98
FR0.94 ***48.03+0.011.000.020.98
Basin scaleDailyER0.69 ***9.04−0.140.830.220.67
LR0.69 ***9.10−0.160.830.220.67
FR0.71 ***9.56+0.010.840.220.67
MonthlyER0.93 ***54.88−0.141.000.001.00
LR0.92 ***58.34−0.161.000.001.00
FR0.99 ***18.99+0.011.000.001.00
***: p < 0.001
Table 3. Summary of the statistical significance of differences of the products (STA, ER, LR, and FR products) at daily and monthly resolutions over the Xinfengjiang River reservoir basin.
(H, p-Value)ERLRFR
Grid accumulation scaleDaily scaleER (S, <0.05)(S, <0.05)
LR (S, <0.05)
FR
Monthly scaleER (S, <0.05)(S, <0.05)
LR (S, <0.05)
FR
Basin scaleDaily scaleER (S, <0.05)(S, <0.05)
LR (S, <0.05)
FR
Monthly scaleER (S, <0.05)(S, <0.05)
LR (S, <0.05)
FR
S: Significant Difference.
Table 4. Indices for the performances of the SWAT model in both the calibration and validation periods (Scenario I).
IndexesDailyMonthly
Calibration PeriodValidation PeriodCalibration PeriodValidation Period
R20.91 ***0.85 ***0.96 ***0.90 ***
NSE0.910.830.950.80
BIAS+0.04+0.13+0.06+0.20
p-factor0.740.780.830.82
R-factor0.390.560.480.67
***: p < 0.001.
Table 5. Indices for the performance of the SWAT model in calibration and validation periods (Scenario II).
IndexesDailyMonthly
Calibration PeriodValidation PeriodCalibration PeriodValidation Period
R20.65 ***0.64 ***0.85 ***0.85 ***
NSE0.650.430.840.84
BIAS−0.03+0.01+0.06−0.02
p-factor0.740.690.760.75
R-factor0.690.700.570.36
***: p < 0.001.
Table 6. Average annual precipitation and discharge simulated for the year of 2014–2017.
STAERLRFRAverage
(ER, LR, and FR)
Precipitation (mm)1938.91721.51681.31975.11792.6
Relative change rate −0.11−0.130.020.09 *
Discharge (m3/s)221.6208.6203.1245.9219.2
Relative change rate −0.06−0.080.110.08 *
*: Absolute relative change rate.
Publisher’s Note: MDPI stays neutral with regard to jurisdictional claims in published maps and institutional affiliations.