Abstract
Seagrass meadows play critical roles in supporting a high level of biodiversity but are continuously threatened by human activities, such as sea reclamation. In this study, we reported on a large seagrass (Zostera marina L.) meadow in Caofeidian shoal harbor in the Bohai Sea of northern China. We evaluated the environmental impact of sea reclamation activities using Landsat imagery (1974–2019) by mapping seagrass meadow distribution changes. ISODATA was adopted for the unsupervised classification and mapping of seagrass beds. The error matrix developed using the in situ data obtained from acoustic surveys for Landsat 8OLI image classification was 87.20% accurate. The maps showed rapidly increasing changes in seagrass meadows as the amount of reclaimed land increased. Some seagrass meadows experienced large-scale changes, and sea reclamation has been suggested as the main factor responsible for habitat loss, which results from physical damage, excessive sedimentation, and increased turbidity caused by reclamation. In addition, habitat degradation may have resulted from three storm surges induced by typhoons in 1992–1998. Fortunately, land reclamation, forming an artificial “longshore bar”, buffers seagrass meadows from wave actions, providing relatively sheltered conditions, which has allowed a large habitat increase since 2012. These were the largest eelgrass meadows (3,217.32 ha), with a peripheral area of ~100 km2, in the Bohai Sea of northern China in 2019. However, the existing largest eelgrass beds in China are threatened by trawling, clam harvesting (especially clam sucking), channel dredging, and culture pond construction. Our work will help coastal managers monitor the environmental impacts of reclamation activities on seagrass meadows on a large spatio-temporal scale and will also provide information for seagrass restoration using artificial “longshore bars”.
1. Introduction
Seagrasses form productive plant communities, providing habitats, foods, and nurseries for a variety of marine organisms [1,2,3,4,5,6,7]. However, with multiple stressors threatening these aquatic plants, seagrass meadows have been declining worldwide since 1990 at a rate of 7% per annum [8]. Many studies have been conducted to effectively understand changes in seagrass habitats’ spatial distributions and temporal fluctuations [9,10,11]. There are 72 species of seagrass in six families and 14 genera worldwide [12]. However, five species within three genera are found in temperate northern China according to the national seagrass resource survey (2015–2020), but only the seagrass Zostera marina L. (eelgrass) is found at our study site. Seagrass monitoring and protection programs exist in North America, Europe, and Australia, and many countries have established seagrass monitoring networks (e.g., Seagrass Watch and Seagrass Net). However, limited investigations have been performed in northern China. Although there are preliminary investigations in Shandong Province, northern China, most research has been carried out in the past decade [13,14]. At present, seagrass research mainly focuses on its distribution in China, and the national seagrass resource survey (2015–2020) will be finished in 2021. Seagrass distributions in China have only been conducted using Sonar scanning [15], scuba diving, and direct sampling at limited depths and areas during low tides. Consequently, there is little information on the historical seagrass distribution in China. Even though underwater applications of satellite remote sensing are subject to several limitations, including cloud cover, wavelength-specific water column attenuation, and spatial and spectral resolutions of the sensors [16], satellite remote sensing is an effective tool for monitoring and managing seagrass beds, and it is now used to complement conventional surveying methods because of the large coverage area, rapidity, and repeatability of observations [17]. Compared with in situ sampling surveys, mapping seagrass using remote sensing provides a more spatially comprehensive representation of seagrass distributions [10,18,19]. Remote-sensing techniques have been used successfully to analyze the spatial extents of seagrass areas [18,19,20,21,22,23].
Seagrass ecosystems are disappearing at an alarming rate worldwide [24] because of natural disturbances and anthropogenic activities [8,25,26]. A large number of seagrass ecosystems have contracted sharply or disappeared in China according to the national seagrass resource survey (2015–2020), and this is mainly attributed to human disturbances caused by fishing, aquaculture, and land reclamation [27]. In general, land reclamation results in the complete, irrecoverable removal of seagrass meadows from natural habitats [28]. Owing to urban construction, as well as port and industrial construction, China’s total reclamation area increased from 8241 km2 to 13,380 km2 during 1990–2008, with an annual increase of 285 km2. Therefore, with the rapid development of harbors and ports, assessing the impact of reclamation activities on seagrass meadow distributions has become more and more important. However, data on the impacts of land reclamation on seagrasses in China are limited. Land reclamation was conducted in Caofeidian coastal waters from 2002 to 2012, covering an area of >200 km2 [29]. According to local fishermen, there was abundant Z. marina distributed in the reclamation area before 2003. In addition, coastal ecosystems are influenced by the extreme climatological events, such as typhoons [11,30], and our study area was severely affected by storm surges induced by typhoons [31].
Seagrass monitoring has been conducted using conventional survey methods with GPS that provides limited information on spatial patterns and temporal dynamics in the habitats. These methods do not provide historical distribution information. However, satellite remote sensing provides more frequent data on seagrass distributions over wide ranges of temporal and geographical scales [11,18,19,20,21,22,23]. Understanding changes in eelgrass distributions during the last 46 years and analyzing its natural and man-made causes are essential for the conservation, management, and restoration of Z. marina beds. This study aimed to monitor seagrass distribution changes in the study area using historical satellite images from 1974 to 2019 and to elucidate the causes of these changes. We mapped changes in the eelgrass distribution over the last 46 years and analyzed their natural and man-made causes using remote sensing, sonar, and in situ survey methods. Our work provides new seagrass distribution data from temperate northern China and fundamental information for implementing appropriate seagrass restoration and conservation strategies.
2. Materials and Methods
2.1. Study Sites
The Bohai Sea is a semi-enclosed sea on the northern coast of China. It is often divided into Liaodong Bay, Bohai Bay, Laizhou Bay, and the Central Area. The Bohai Sea is connected to the Yellow Sea by the Bohai Strait [32]. As a semi-enclosed sea, there is a low water exchange rate in the Bohai Sea, and it takes more than 20 years to renew 90% of the water in the Bohai Sea, leading to a weak self-purification capacity and a low environmental carrying capacity [32]. In recent years, with rapid industrial and agricultural development, port construction, and increased urbanization, the impacts of human activities on the marine ecological environment have increased. The Bohai Sea is seriously polluted, and the functions of the marine ecosystem are degraded and damaged [32]. The Caofeidian shoal used to be in the Luanhe River Delta [33,34], but owing to erosion by tides and waves, a barrier island lagoon system eventually formed (Figure 1). The system consists of the Caofeidian islands, including Caofeidian, Yaotuo, Getuo, Longdao, and other sand islands and sandbars, with a zonal distribution [35]. The width of the tidal flat in this system is approximately 15–25 km, and the lagoon experiences irregular semidiurnal mixed tides [36]. The average water depth of lagoon is approximately 0–5 m, with a maximum water depth of 22 m [37]. At low tide, a large area of the tidal flat is exposed, while at high tide, only the barrier islands are visible. However, the barrier islands are severely affected by erosion resulting from storm surges, waves, and currents [38], resulting in morphological changes to the Caofeidian islands [39], with some islands even disappearing. Moreover, since 2003, large-scale land reclamation from the waters of Caofeidian has caused extreme damage to the barrier island lagoon system. Reclamation directly destroys the habitats of intertidal organisms and has large impacts on intertidal communities. The salinity ranged from 31.4 to 34.6 psu at the study site in the Bohai Sea. The sediments at the study site were mainly (93.28 ± 4.52%) composed of sand (0.063–2.0 mm) [40].
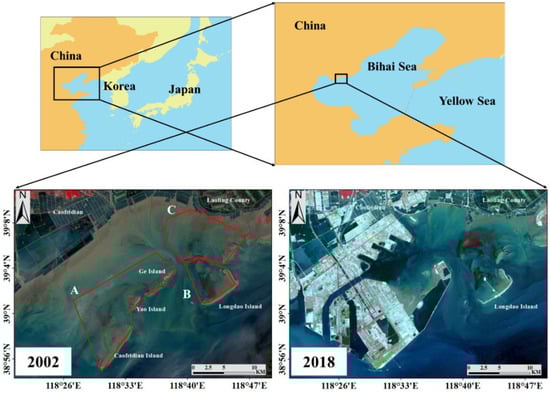
Figure 1.
The study area in the northern coast of the China (2002 and 2018). On the basis of changes in the spatial distributions of the seagrass beds, the study area was divided into three areas (A–C) for research (2002).
2.2. Sonar Survey of the Seagrass Distribution in 2018
A sonar survey method, using the BioSonics MX echosounder (Biosonics Inc., Seattle, WA, USA) from August 5 to 13, 2018, was used to acquire sonar data, and it was applied to areas B and C. The echosounder, with a 204.8 kHz transducer, was set to operate at pulse rate of 0.4 ms and 5 pings s−1. The ship route is parallel, with a spacing of ~500 m, and the ship speed was set to at 3–4 knots (Figure 2). To acquire information regarding the seagrass status (presence/absence, coverage, canopy height, and water depth), sonar data were analyzed using BioSonics Visual Habitat software (BioSonics Inc.). After mask creation, the interpolation analysis using Topo to Raster was applied using ArcMap 10.2.2 software (ESRI Inc., Redlands, CA, USA). The mask was selected as a type of boundary without a field. The parameters of plant coverage, canopy height, and water depth were selected as fields, respectively, and the type was selected as PointElevation. Vegetation with a canopy height > 0.2 m was considered seagrass.
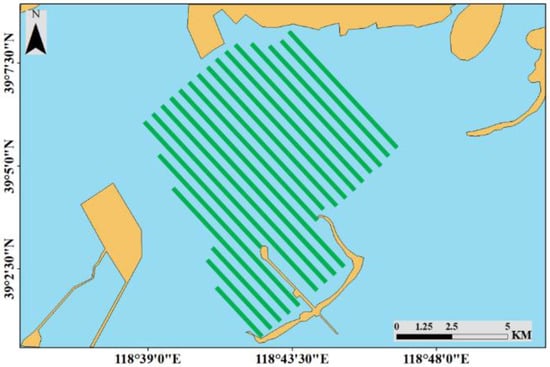
Figure 2.
The ship route, with a spacing of ~500 m, for the acoustic survey of the seagrass distribution.
2.3. Seagrass Distribution Changes Inferred from Satellite Remote-Sensing Data
2.3.1. Satellite Image Analysis
In total, 29 satellite images from Landsat Multi-spectral Scanner (MSS)/Thematic Mapper (TM)/Enhanced Thematic Mapper (ETM+)/Operational Land Imager (OLI) were used to examine the long-term changes in the seagrass beds from 1974 to 2019 in the study area (Table S1). The satellite images that were taken during the period (May–September) in which seagrasses with high biomasses were selected for analysis. In addition, satellite images, taken during low tide (<1 m, Table S1), were selected and analyzed to determine the minimum distortion of the seagrass spectrum by the water column [41,42]. The seagrass beds in the study area were easily visible, because the canopy was exposed above the water level during low tide (Figure 3).
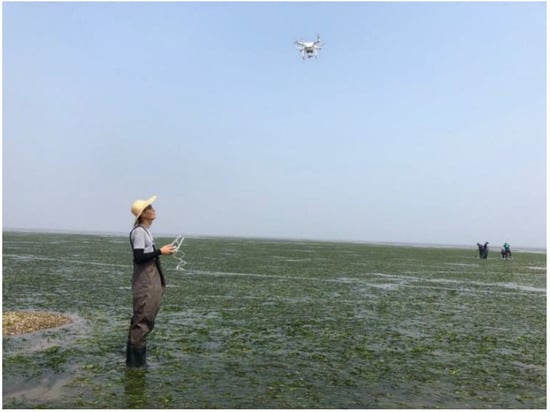
Figure 3.
Field photo of a seagrass bed at the study site in the Bohai Sea (Photo by Xiaomei Zhang; tide height of 0.73 m on 8 June 2019, acquired at Shaleitien Tao Station using wxtide47 software).
The two visible bands (green and red) and the near-infrared band were used to analyze the Landsat images. In addition, wedge-shaped gaps in some Landsat 7ETM+ images were filled [43]. Geometric and radiometric corrections were applied using ENVI 5.2 image processing software (EXELIS Inc., McLean, VA, USA). The FLAASH module was used to make atmospheric corrections [44]. Three masks were created to eliminate the unvegetated areas and to focus on the three specific areas of interest, A, B, and C (Figure 1). The unsupervised classification using ISODATA within ArcMap 10.2.2 software was applied to analyze for seagrass. In addition, because sea reclamations were easily visible in satellite images, to understand the temporal and spatial distributions of the reclamation from 2002 to 2014 in the study area, visual observations were used.
2.3.2. Accuracy Assessment
Field data are usually used to assess classification accuracy, but there was no synchronous related ground truth data for the past 46 years. Consequently, we used the two visible bands (green and red) and the near-infrared band (described in detail in the satellite image analysis section) to determine the seagrass beds in satellite images lacking in situ field data. A Landsat 8OLI (29 June 2018) image was taken within 7 weeks of the in situ data obtained by the acoustic survey, and the acoustic data were used to assess the accuracy of the classifications of the Landsat 8OLI image using those bands. We used raw points acquired from acoustic data as verification points [45]. Points with canopy heights ≥ 0.2 m were defined as in the vegetated class; otherwise, they were defined as in the unvegetated class. The accuracy of the classification was assessed based on an error matrix (overall accuracy) [45], and it was calculated using the ratio of the number of points named to the same class (unvegetated or vegetated) in both the remotely derived classification and the acoustic data, divided by the total number of compared verification points. Depending upon the application, classification accuracy levels of ≤60, 70, and ≥80% may be unacceptable, marginally acceptable, and acceptable, respectively [20].
2.4. Field Survey of Eelgrass Population
To investigate the biological parameters of eelgrass at the six sites (Figure 4), three sediment cores were randomly collected at each site to investigate the density (shoots m−2) and height (cm) of vegetative shoots, as well as the above- and below-ground biomasses [g m−2 dry weight (DW)] of total shoots on 21 August 2019. Samples from the study site were filtered through a 5-mm sieve carefully in situ, and the shoots were kept. The number of shoots was determined in the laboratory, and shoot height and both above- and below-ground biomasses (DW) were measured.
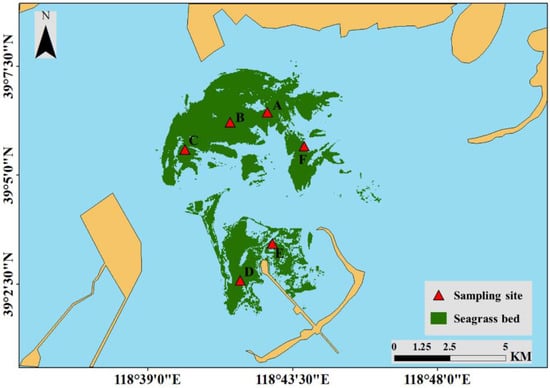
Figure 4.
Field survey sites of eelgrass biological parameters in the study area. The red triangles (A–F) represent seagrass sampling sites.
Water temperature (°C), salinity (ppt), dissolved oxygen content (DO, mg L−1), depth (m), pH level, and chlorophyll content (μg L−1) were measured using a multi-parameter water quality sonde (YSI 6600, USA) at the six sites during the seagrass sampling period (Figure 4).
2.5. Statistical Analyses
Results are presented as means ± SDs. Canopy height, and plant coverage of Z. marina over depths were modelled using generalized additive models (GAMs), which are an extension of generalized linear models that do not require the assumption of a particular response variable distribution along the environmental gradient [46]. The GAMs were built in R 4.0.2 [47] using the package “mgcv”. For remote-sensing data, Pearson’s correlation coefficient between seagrass area and sea reclamation area was determined. Pearson’s correlation analyses were considered significant at a probability level of p < 0.05.
3. Results
3.1. Sonar Survey of Seagrass Distribution in 2018
As illustrated in Figure 5A, we determined the seagrass distribution using canopy height data. The seagrass bed area was 2,916.81 ha in August 2018, and the peripheral area was ~100 km2. Similarly, we obtained plant percentage cover (Figure 5B) and water depth (Figure 5C) data. As illustrated in Figure 5B, the plant percentage cover map was very similar to the seagrass distribution map (Figure 5A). Most of the seagrasses were distributed at a depth of <3 m. There was a divide between seagrass beds (Figure 5A,B), and the general distribution pattern was caused by deeper water (>6 m) in the divide.
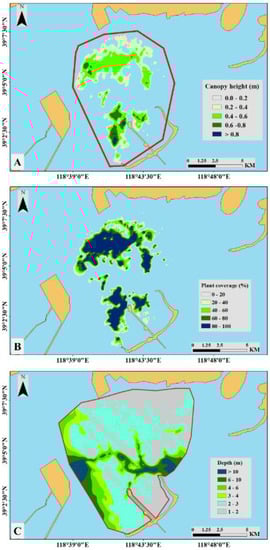
Figure 5.
Eelgrass distribution map of plant canopy height (A), coverage (B), and water depth (C) generated from the interpolation analysis of the study area in August 2018. The area marked by the red polygon in A is the peripheral area of the seagrass beds. The red polygon in C marks the area used for the interpolation analysis.
The variations in canopy height and Z. marina coverage over depths were analyzed. In response to water depth, canopy height and plant coverage exhibited the same trends, which are shown in Figure 6. The canopy height (p < 0.001) and plant coverage (p < 0.001) significantly increased with depth in shallow zones (<2.5 m) but decreased in deeper zones (>2.5 m) (Figure 6).
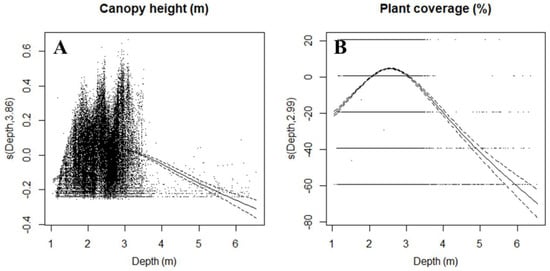
Figure 6.
Response curves (thick, solid lines) of Zostera marina L. canopy height (A) and coverage (B) to water depth. Fitted model plots for depth corresponding to the reduced GAM for canopy height (m) and plant coverage (%). The solid lines show the GAM regressions fitted to each relationship, with dotted lines indicating the confidence interval of the mean trend line.
3.2. Seagrass Distribution Changes Inferred from Satellite Remote-Sensing Data
The accuracy of the classification, at 87.20%, was acceptable (Table 1) [20]. Two major seagrass beds were classified on the Landsat 8OLI image (Figure 7), which was consistent with the sonar results (Figure 5A). Thus, it was possible to classify seagrass beds with a high accuracy using Landsat 8OLI image-based classifications.

Table 1.
The classification-accuracy assessment performed using verification points from acoustic data.
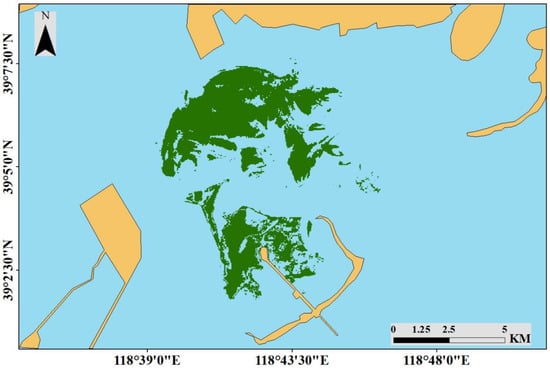
Figure 7.
Seagrass distribution acquired from unsupervised classification (ISODATA) using Landsat 8OLI (29 June 2018) images.
The unsupervised classification (ISODATA) method applied to the Landsat 8OLI images produced a reliable accuracy level for this study area, and it was also used to analyze Landsat MSS/TM/ETM+ images from 1974 to 2019. There was a divide between seagrass beds, and the general distribution pattern (A, B, and C) was maintained consistently over the past 46 years (Figure 1). The area of seagrass beds ranged from 937.71 to 4,527.54 ha and averaged 2,487.65 ± 945.81 ha from 1974 to 2019 (Figure 8 and Figure 9). The beds were largest in 1986 and smallest in 2009. There were, in general, declines in the seagrass bed areas from 1986 to 2009, and a large increase occurred in 2013. In A, there were large declines in the seagrass bed area in 1992–1998 and 2000–2011, and eventually, seagrass disappeared in 2011. Seagrass began to colonize B from 1979, and the seagrass bed area averaged 861.13 ± 356.29 ha from 1979 to 2019. Seagrass began to colonize C from 1984, and the seagrass bed area averaged 158.86 ± 149.42 ha from 1984 to 2012, and there was a large increase in 2013.
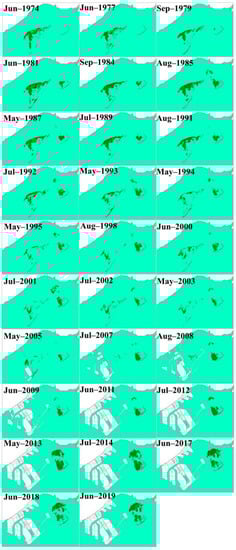
Figure 8.
Changes in the spatial distribution of seagrass beds in the study area from 1974 to 2019. In the satellite images, the seagrass beds and unvegetated seawater are represented by green- and cyan-colored pixels, respectively.
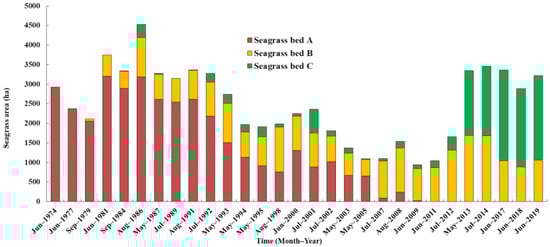
Figure 9.
Changes in the areas (ha) of seagrass beds (A–C) in the study area from 1974 to 2019 as estimated by a satellite-image-based analysis.
The total area of reclamation reached 205.21 km2 from 2002 to 2014 (Figure 10 and Figure 11). In the years following 2003, when the infrastructure construction began, the reclamation area in the study region substantially increased. The reclamation area increased significantly in 2008–2011, but it decreased in the following years. As the reclamation area increased, the intertidal zone area in the study region decreased annually, and seagrass beds also underwent a considerable reduction (Figure 8 and Figure 9). Pearson’s correlation coefficient between the seagrass area of A and sea reclamation area was determined and revealed a significant negative correlation (p < 0.05, R = −0.8588).
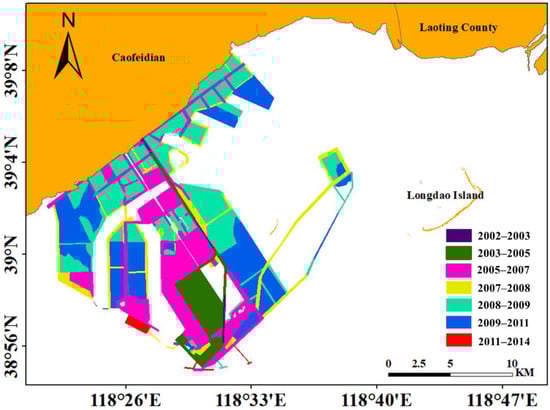
Figure 10.
Spatial-temporal distribution of land reclamation in the study area from 2002 to 2014.
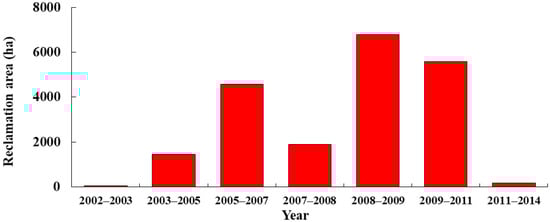
Figure 11.
Reclamation area (ha) in the study region from 1974 to 2019 as estimated by satellite-image-based analysis.
3.3. Field Survey of Eelgrass Population
Salinity (31.11–32.08 psu) and pH (8.40–−8.58) varied slightly within sites. The dissolved oxygen levels of sites C (5.43 ± 0.19 mg L−1) and D (5.09 ± 0.22 mg L−1) were higher than those of other sites (2.93 ± 0.61 mg L−1–3.90 ± 0.14 mg L−1). This may occur because the former sites have strong water exchange capacities, being in a channel having a depth of more than 10 m. The chlorophyll content changes within sites were mostly slight (2.00 ± 0.36 μg·L−1 m−2–6.49 ± 0.27 μg·L−1 m−2).
Total biomass, plant height, and total shoot density varied slightly within the sites on 21 August 2019 (Table 2).
Table 2.
Total biomass, belowground biomass, plant height, and shoot density values of eelgrasses at six sites in the study area on 21 August 2019.
4. Discussion
Remote sensing is a useful tool for long-term monitoring of large seagrass beds [10,11,48,49] that is able to estimate past changes [9]. In this study, we analyzed 46 years of seagrass distribution changes beginning in 1974 using 29 satellite images and the accuracy of classification was 87.20%, which is acceptable [20].
The seagrass distribution in this study area underwent large changes over the past 46 years. Seagrass distribution changes are usually affected by many factors, and coastal development, degraded water quality, and climate change are the main reasons for the loss of global seagrass beds [8]. In particular, extreme climatic events, such as typhoons and tsunamis, are involved in the large-scale die-off of seagrass beds [30,50,51]. Typhoons greatly influence sediment erosion and burial dynamics, which are the main reasons for seagrass loss [52]. In our study area, there were three storm surges induced by typhoons (September 1992, August 1994, and August 1997) in 1992–1998, accounting for 50% of the storm-surge-related disasters since 1960 [31]. The typhoon-related storm surge that occurred in September 1992 was the largest in the study area since 1949 [31], and it killed 208 people. Consequently, the seagrass bed loss in A from 1992 to 1998 may be related to the three storm surges induced by typhoons, which led to physical disturbances, such as shoot and rhizome uprooting, and damage from sediment erosion or burial. Seagrass beds are able to recover in large disturbed areas [53], and in particular, eelgrass grows quickly through both sexual and asexual reproduction [54]. However, seagrass beds in our study area did not recover and continually decreased. It is possible that the shoots, rhizomes, and seeds in the sediment were completely uprooted and removed by typhoon-related storm surges [11]. In addition, the islands of Caofeidian, providing shelter from oceanic waves and forming the ideal lagoon habitats for Z. marina, suffered severe erosion induced by typhoon-related storm surges, waves, and currents [55], and some islands disintegrated, which may have resulted in the severe erosion of seagrass habitats by waves and currents [39]. Lewis [56] reported that seagrasses have substantially retreated in the Tampa Bay (FL, USA) because of the disappearance of longshore bars, which may be particularly vulnerable to storm events. The reduction or disappearance of sand bars in our study area is related to storm surges [57]. According to records, the storm surge wiped out Dawang Island, which was ~10 km from Longdao Island, in 1949 [58].
Reclamation in seagrass habitats might unexpectedly place previously unaffected coastal ecosystems at risk [59]. In the present study, reclamation was the chief reason for seagrass loss in area A, because 205.21 km2 of the seagrass bed was directly and irreversibly buried by reclaimed land (Figure 10 and Figure 11). However, there has been a large increase in seagrass beds in area C since 2012, when the main land reclamation was completed. Lu et al. [36] reported that the mean velocity of ebbing tides in C decreased by 2 to 10% after reclamation, resulting in a slight deposition, of 0.01–0.10 m, after one year. The reduced wave energies in C may provide a favorable environment for eelgrass expansion through sexual and asexual reproduction. Therefore, the land reclamation, forming an artificial “longshore bar”, buffers seagrass beds from wave actions, providing relatively sheltered conditions. Lewis [56] reported that longshore bars maximize the potential for seagrass regrowth. In addition, eelgrasses, as larger species, show greater resilience to reclamation-induced stressors than other smaller species [60]. This allowed the large increase in the seagrass area of C to occur since 2012. During 2003–2011, the seagrass area in C remained at a low level of 109.49 ± 64.08 ha, likely resulting from excessive sedimentation and increased turbidity caused by reclamation.
Seagrass meadows are declining at an unprecedented rate, and there is a general lack of environmental protection for seagrasses in China. As Australia and the USA did decades ago [61,62,63], seagrass needs to be included in the Chinese conservation agenda. In recent years, questionnaires indicate that the existing largest eelgrass beds in China are being threatened by trawling, clam harvesting (especially clams sucking), dredging channels, and the construction of culture ponds (Figure 12). Unfortunately, there were no seagrasses at site C (Figure 4) in June 2020 as a result of clam sucking, which removes sediments from a depth of >30 cm, resulting in great damage to seagrass beds. In addition, in recent years, sand excavation for building construction in the study area has also negatively affected seagrass habitats.
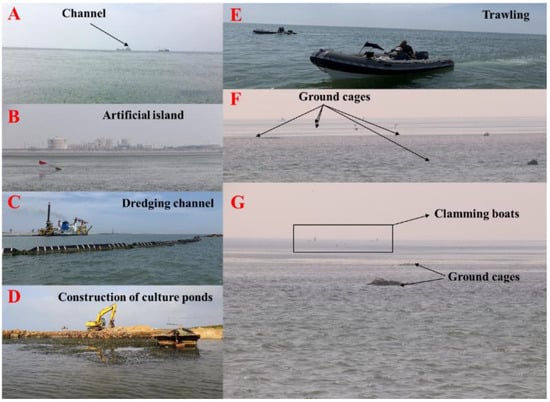
Figure 12.
Existing seagrass beds are subjected to threats resulting from artificial factors, especially anthropogenic causes, such as (A) boating in channels near seagrass beds, (B) construction of artificial islands and industrial activities on the islands, (C) dredging of channels, (D) construction of culture ponds, (E) trawling, (F) fish collection using ground cages, and (G) harvesting clams using specific boats.
In view of the main threats to the largest eelgrass beds in China, we raise the following suggestions for seagrass protection and management: (1) it should be forbidden to use clam sucking boats for clam harvesting in seagrass beds; (2) it is prohibited to illegally fish within the banned fishing periods, but illegal fishing is especially popular in seagrass beds; (3) it is necessary to increase the fishermen’s and policymakers’ understanding of the ecological significances of seagrass beds; (4) environmental impact assessments of construction projects should include the effects on seagrass; (5) seagrass reserves need to be established to protect the largest eelgrass beds in China.
5. Conclusions
We described the long-term changes (>40 years) of a seagrass meadow using historical satellite images. We made accuracy assessments of the satellite image classifications using acoustic data and found that the classification accuracy, at 87.20%, was acceptable. The spatial and temporal changes were mainly driven by sea reclamation since 2002, and the large changes during 1992–1998 may have been affected by the storm surges induced by typhoons. However, the existing largest eelgrass beds are being threatened by human activities, and the negative impacts of those factors needs further investigation.
Supplementary Materials
The following are available online at https://www.mdpi.com/2072-4292/13/5/856/s1, Table S1: Remote-sensor data of eelgrass habitats in the study area.
Author Contributions
S.X. (Shaochun Xu): investigation, data curation, writing the original draft, software, visualization; S.X. (Shuai Xu): investigation; Y.Z. (Yi Zhou): funding acquisition, writing, review and editing. S.Y., X.Z., R.G., Y.Z. (Yu Zhang), Y.Q., M.L., Y.Z. (Yunling Zhang): investigation. All authors have read and agreed to the published version of the manuscript.
Funding
This research was funded by the National Key R & D Program of China (2019YFD0901300), the National Science & Technology Basic Work Program (2015FY110600), the Key Research Project of Frontier Sciences of CAS (QYZDB-SSW-DQC041-1), and the Taishan Scholars Program (Distinguished Taishan Scholars).
Institutional Review Board Statement
Not applicable for studies not involving humans.
Informed Consent Statement
Not applicable for studies not involving humans or animals.
Data Availability Statement
The data that support the findings of this study are available from the author upon reasonable request.
Acknowledgments
We would like to thank Zhenhai Zhang, Y.Z. (Yunling Zhang), Chun Li, Min Ye, Zhiwei Zhang, and Chen Cui for their help in the field survey.
Conflicts of Interest
The authors declare that they have no known competing financial interests or personal relationships that could have appeared to influence the work reported in this paper.
References
- Costanza, R.; d’Arge, R.; de Groot, R.; Farber, S.; Grasso, M.; Hannon, B.; Limburg, K.; Naeem, S.; O’Neill, R.V.; Paruelo, J.; et al. The value of the world’s ecosystem services and natural capital. Nature 1997, 387, 253–260. [Google Scholar] [CrossRef]
- Jackson, E.L.; Rowden, A.A.; Attrill, M.J.; Bossey, S.J.; Jones, M.B. The importance of seagrass beds as a habitat for fishery species. Oceanogr. Mar. Biol. 2001, 39, 269–303. [Google Scholar]
- Duffy, J.E. Biodiversity and the functioning of seagrass ecosystems. Mar. Ecol. Prog. Ser. 2006, 311, 233–250. [Google Scholar] [CrossRef]
- Verweij, M.C.; Ivan, N.; Ingmar, H.; Ruseler, S.M.; Mason, P.R.D. Seagrass nurseries contribute to coral reef populations. Limnol. Oceanogr. 2008, 53, 1540–1547. [Google Scholar] [CrossRef]
- Barbier, E.B.; Hacker, S.D.; Kennedy, C.; Koch, E.W.; Stier, A.C.; Silliman, B.R. The value of estuarine and coastal ecosystem services. Ecol. Monogr. 2011, 81, 169–193. [Google Scholar] [CrossRef]
- Tol, S.J.; Coles, R.G.; Congdon, B.C. Dugong dugon feeding in tropical Australian seagrass meadows: Implications for conservation planning. PeerJ 2016, 4, e2194. [Google Scholar] [CrossRef]
- Taylor, M.D.; Fry, B.; Becker, A.; Moltschaniwskyj, N. Recruitment and connectivity influence the role of seagrass as a penaeid nursery habitat in a wave dominated estuary. Sci. Tot. Environ. 2017, 584–585, 622–630. [Google Scholar] [CrossRef] [PubMed]
- Waycott, M.; Duarte, C.M.; Carruthers, T.J.; Orth, R.J.; Dennison, W.C.; Olyarnik, S.; Calladine, A.; Fourqurean, J.W.; Heck, K.L.; Hughes, A.R. Accelerating loss of seagrasses across the globe threatens coastal ecosystems. Proc. Natl. Acad. Sci. USA 2009, 106, 12377–12381. [Google Scholar] [CrossRef]
- Mumby, P.J.; Green, E.P.; Edwards, A.J.; Clark, C.D. The cost-effectiveness of remote sensing for tropical coastal resources assessment and management. J. Environ. Manag. 1999, 55, 157–166. [Google Scholar] [CrossRef]
- Lyons, M.B.; Roelfsema, C.M.; Phinn, S.R. Towards understanding temporal and spatial dynamics of seagrass landscapes using time-series remote sensing. Estuar. Coast. Shelf Sci. 2013, 120, 42–53. [Google Scholar] [CrossRef]
- Kim, K.; Choi, J.-K.; Ryu, J.-H.; Jeong, H.J.; Lee, K.; Gil Park, M.; Kim, K.Y. Observation of typhoon-induced seagrass die-off using remote sensing. Estuar. Coast. Shelf Sci. 2015, 154, 111–121. [Google Scholar] [CrossRef]
- Short, F.T.; Short, C.A.; Novak, A. Seagrasses. In The Wetland Book: II: Distribution, Description and Conservation; Finlayson, C.M., Milton, G.R., Prentice, R.C., Davidson, N.C., Eds.; Springer Science: Dordrecht, The Netherlands, 2016. [Google Scholar]
- Guo, D.; Zhang, P.D.; Zhang, X.M.; Li, W.T.; Zhang, X.J.; Yuan, Y.D. Preliminary investigation and study on seagrass species of inshore areas in Shandong Province. Trans. Oceanol. Limnol. 2010, 2, 17–21, (In Chinese with English Abstract). [Google Scholar]
- Liu, B.J. Foundational Studies on Resource Investigation and Ecological Restoration of Eelgrass in Typical Bays in Shandong. Master’s Thesis, The University of Chinese Academy of Sciences, Beijing, China, 2012. [Google Scholar]
- Xu, S.C.; Xu, S.; Zhou, Y.; Yue, S.D.; Qiao, Y.L.; Liu, M.J.; Gu, R.T.; Song, X.Y.; Zhang, Y.; Zhang, X.M. Sonar and in situ surveys of eelgrass distribution, reproductive effort, and sexual recruitment contribution in a eutrophic bay with intensive human activities: Implication for seagrass conservation. Mar. Pollut. Bull. 2020, 161, 111706. [Google Scholar] [CrossRef] [PubMed]
- Call, K.A.; Hardy, J.T.; Wallin, D.O. Coral reef habitat discrimination using multivariate spectral analysis and satellite remote sensing. Int. J. Remote Sens. 2003, 24, 2627–2639. [Google Scholar] [CrossRef]
- Hossain, M.S.; Bujang, J.S.; Zakaria, M.H.; Hashim, M. The application of remote sensing to seagrass ecosystems: An overview and future research prospects. International Journal of Remote Sensing. Int. J. Remote Sens. 2014, 36, 61–113. [Google Scholar] [CrossRef]
- Barrell, J.; Grant, J. High-resolution, low-altitude aerial photography in physical geography: A case study characterizing eelgrass (Zostera marina L.) and blue mussel (Mytilus edulis L.) landscape mosaic structure. Prog. Phys. Geog. 2015, 39, 440–459. [Google Scholar] [CrossRef]
- Barrell, J.; Grant, J.; Hanson, A.; Mahoney, M. Evaluating the complementarity of acoustic and satellite remote sensing for seagrass landscape mapping. Int. J. Remote Sens. 2015, 36, 4069–4094. [Google Scholar] [CrossRef]
- Ferguson, R.L.; Korfmacher, K. Remote sensing and GIS analysis of seagrass meadows in North Carolina, USA. Aquat. Bot. 1997, 58, 241–258. [Google Scholar] [CrossRef]
- Howari, F.M.; Jordan, B.R.; Bouhouche, N.; Wyllie-Echeverria, S. Field and remote-sensing assessment of mangrove forests and seagrass beds in the northwestern part of the United Arab Emirates. J. Coast. Res. 2009, 251, 48–56. [Google Scholar] [CrossRef]
- Barillé, L.; Robin, M.; Harin, N.; Bargain, A.; Launeau, P. Increase in seagrass distribution at Bourgneuf Bay (France) detected by spatial remote sensing. Aquat. Bot. 2010, 92, 185–194. [Google Scholar] [CrossRef]
- Knudby, A.; Nordlund, L. Remote sensing of seagrasses in a patchy multi-species environment. Int. J. Remote Sens. 2011, 32, 2227–2244. [Google Scholar] [CrossRef]
- Short, F.T.; Polidoro, B.; Livingstone, S.R.; Carpenter, K.E.; Bandeira, S.; Bujang, J.S.; Calumpong, H.P.; Carruthers, T.J.B.; Coles, R.G.; Dennison, W.C.; et al. Extinction risk assessment of the world’s seagrass species. Biol. Conserv. 2011, 144, 1961–1971. [Google Scholar] [CrossRef]
- Green, E.P.; Short, F.T. World Atlas of Seagrasses; University of California Press: Berkeley, CA, USA, 2003. [Google Scholar]
- Ferwerda, J.G.; Leeuw, J.; Atzberger, C.; Vekerdy, Z. Satellite-based monitoring of tropical seagrass vegetation: Current techniques and future developments. Hydrobiologia 2007, 591, 59–71. [Google Scholar] [CrossRef]
- Zheng, F.Y.; Qiu, G.L.; Fan, H.Q.; Zhang, W. Diversity, distribution and conservation of Chinese seagrass species. Biodivers. Sci. 2013, 21, 517–526, (In Chinese with English Abstract). [Google Scholar]
- Meinesz, A.; Lefevre, J.R.; Astier, J.M. Impact of coastal development on the infralittoral zone along the southeastern Mediterranean shore of continental France. Mar. Pollut. Bull. 1991, 23, 343–347. [Google Scholar] [CrossRef]
- Wu, Y.; Yang, W.B.; Wang, L.; Zhang, Z.; Li, J.L. Primary study on the spatial-temporal changes and the effect of sea reclamation in Caofeidian based on remote sensing. Trans. Oceanol. Limnol. 2013, 1, 153–158, (In Chinese with English Abstract). [Google Scholar]
- Orth, R.J.; Carruthers, T.J.; Dennison, W.C.; Duarte, C.M.; Fourqurean, J.W.; Heck, K.L.; Hughes, A.R.; Kendrick, G.A.; Kenworthy, W.J.; Olyarnik, S. A global crisis for seagrass ecosystems. Bioscience 2006, 56, 987–996. [Google Scholar] [CrossRef]
- Zheng, L.P.; Guo, L.X.; Zhang, W.Y.; Hou, S.X. Analysis on the causes of storm surge in coastal area of Tangshan. Ann. Meet. China Meteorol. Soc. 2006, 1487–1489. (In Chinese) [Google Scholar]
- Li, B.L.; Zhao, Y.H.; Yang, K.; Zhao, B. Current environmental status and the protection of the Bohai Sea. Ocean Dev. Manag. 2016, 33, 59–62. [Google Scholar]
- Gao, S.M.; Li, Y.F.; An, F.T.; Li, F.X. The formation of sand bars on the Luanhe River Delta and the change of the coast line. Acta Oceanol. Sin. 1981, 2, 102–113, (In Chinese with English Abstract). [Google Scholar]
- Wang, Y.; Fu, G.H.; Zhang, Y.Z. River-sea interactive sedimentation and plain morphological evolution. Quat. Sci. 2007, 27, 674–689, (In Chinese with English Abstract). [Google Scholar]
- Zhang, R.S.; Li, K.P. Evolution of tidal inlet-drainage basin system on Luanhe River Delta. Ocean Eng. 1996, 14, 45–52, (In Chinese with English Abstract). [Google Scholar]
- Lu, Y.J.; Zuo, L.Q.; Ji, R.Y.; Zhang, J.S. Effect of development of Caofeidian harbor area in Bohai bay on hydrodynamic sediment environment. Adv. Water Sci. 2007, 18, 793–800, (In Chinese with English Abstract). [Google Scholar]
- Yin, Y.H. Thoughts on large area reclamation of Caofeidian shoal in Tangshan, Hebei Province. Mar. Geol. Lett. 2007, 23, 1–10. (In Chinese) [Google Scholar]
- Gu, J.Q.; Zhang, B.H. Evolution, development and utilization of sedimentary Sand Island in Eastern Hebei Province. Geogr. Territ. Res. 1997, 13, 36–40. (In Chinese) [Google Scholar]
- Tian, H.L.; Liu, X.H.; Shi, Y.J.; Li, Q.C.; Wang, Y.X. Study on the morphologic change of Caofeidian islands. Mar. Sci. Bull. 2015, 34, 695–702, (In Chinese with English Abstract). [Google Scholar]
- Xu, S.C.; Wang, P.M.; Zhou, Y.; Wang, F.; Zhang, X.M.; Gu, R.T.; Xu, S.; Yue, S.D.; Zhang, Y.; Suonan, Z.X. Sheaths of Zostera marina L. as ecological indicators of shoot length and the elemental stoichiometry of aboveground tissues. Mar. Pollut. Bull. 2020, 160, 111545. [Google Scholar] [CrossRef]
- Zimmerman, R.C.; Dekker, A.G. Aquatic optics: Basic concepts for understanding how light affects seagrasses and makes them measurable from space. In Seagrasses: Biology, Ecology, and Conservation; Larkum, A.W.D., Orth, R.J., Duarte, C.M., Eds.; Springer: Dordrecht, The Netherlands, 2006. [Google Scholar]
- Wicaksono, P.; Hafizt, M. Mapping seagrass from space: Addressing the complexity of seagrass LAI mapping. Eur. J. Remote Sens. 2013, 46, 18–39. [Google Scholar] [CrossRef]
- Scaramuzza, P.; Micijevic, E.; Chander, G. SLC Gap-Filled Products Phase One Methodology. 2004. Available online: http://landsat.usgs.gov/documents/SLC_Gap_Fill_Methodology.pdf (accessed on 1 January 2020).
- Research Systems Inc. ENVI FLAASH User’s Guide; ENVI FLAASH Version 4.1; Research Systems Inc.: Norwalk, CT, USA, 2004; pp. 1–80. [Google Scholar]
- Foody, G.M. Status of land cover classification accuracy assessment. Remote Sens. Environ. 2002, 80, 185–201. [Google Scholar] [CrossRef]
- Lepš, J.; Šmilauer, P. Multivariate Analysis of Ecological Data Using CANOCO; Cambridge University Press: Cambridge, UK, 2003. [Google Scholar]
- R Core Team. R: A Language and Environment for Statistical Computing; R Foundation for Statistical Computing: Vienna, Austria, 2016. [Google Scholar]
- Cuttriss, A.K.; Prince, J.B.; Castley, J.G. Seagrass communities in southern Moreton Bay, Australia: Coverage and fragmentation trends between 1987 and 2005. Aquat. Bot. 2013, 108, 41–47. [Google Scholar] [CrossRef]
- Mohammad, S.H.; Mazlan, H.; Japar, S.B.; Muta, H.Z.; Aidy, M.M. Assessment of the impact of coastal reclamation activities on seagrass meadows in Sungai Pulai estuary, Malaysia, using Landsat data (1994–2017). Int. J. Remote Sens. 2018, 40, 3571–3605. [Google Scholar]
- Seddon, S.; Connolly, R.M.; Edyvane, K.S. Large-scale seagrass dieback in northern Spencer Gulf, South Australia. Aquat. Bot. 2000, 66, 297–310. [Google Scholar] [CrossRef]
- Skinner, M.A.; Courtenay, S.C.; McKindsey, C.W. Reductions in distribution, photosynthesis, and productivity of eelgrass Zostera marina associated with oyster Crassostrea virginica aquaculture. Mar. Ecol. Prog. Ser. 2013, 486, 105–119. [Google Scholar] [CrossRef]
- Cabaço, S.; Santos, R.; Duarte, C.M. The impact of sediment burial and erosion on seagrasses: A review. Estuar. Coast. Shelf Sci. 2008, 79, 354–366. [Google Scholar] [CrossRef]
- Greve, T.M.; Krause-Jensen, D.; Rasmussen, M.B.; Christensen, P.B. Means of rapid eelgrass (Zostera marina L.) recolonisation in former dieback areas. Aquat. Bot. 2005, 82, 143–156. [Google Scholar] [CrossRef]
- Rasheed, M.A.; McKenna, S.A.; Carter, A.B.; Coles, C.R. Contrasting recovery of shallow and deep water seagrass communities following climate associated losses in tropical north Queensland, Australia. Mar. Pollut. Bull. 2014, 83, 491–499. [Google Scholar] [CrossRef] [PubMed]
- Gao, W.M.; Yang, J.X. Analysis on evolution of offshore bars in the north area of the Bohai Sea Bay using remote sensing. Geogr. Geo Inf. Sci. 2006, 22, 41–44, (In Chinese with English Abstract). [Google Scholar]
- Lewis, R.R. The potential importance of the longshore bar system to the persistence and restoration of Tampa Bay seagrass meadows. In Proceedings of the Conference on Seagrass Management: It’s Not Just Nutrients, St. Petersburg, FL, USA, 22–24 August 2000. [Google Scholar]
- Hebei Coastal Zone Resources Editorial Committee. Coastal Resources of Hebei Province; Hebei Province Science and Technology Press: Shijiazhuang, China, 1988; pp. 94–95. (In Chinese) [Google Scholar]
- Gong, R.; Mu, Z.Y. Harm and control of storm surge in Hebei Coastal Area. Geogr. Territ. Res. 1994, 10, 21–24. (In Chinese) [Google Scholar]
- Ghazali, N.; Hisham, M. Coastal Erosion and Reclamation in Malaysia. Aquat. Ecosyst. Health Manag. 2006, 9, 237–247. [Google Scholar] [CrossRef]
- Erftemeijer, P.L.A.; Lewis, R.R.R. Environmental impacts of dredging on seagrasses: A review. Mar. Pollut. Bull. 2006, 52, 1553–1572. [Google Scholar] [CrossRef]
- Schemske, D.W.; Husband, B.C.; Ruckelshaus, M.H.; Goodwillie, C.; Parker, I.M.; Bishop, J.G. Evaluating approaches to the conservation of rare and endangered plants. Ecology 1994, 75, 584–606. [Google Scholar] [CrossRef]
- Fonseca, M.S.; Kenworthy, W.J.; Thayer, G.W. Guidelines for the conservation and restoration of seagrasses in the United States and adjacent Waters. In Decision Analysis Series No. 12. U.S. Department of Commerce—NOAA, Maryland; NsCO Program Ed.; NOAA/National Centers for Coastal Ocean Science: Silver Spring, MD, USA, 1998. [Google Scholar]
- Lee-Long, W.J.; Coles, R.G.; McKenzie, L.J. Issues for seagrass conservation management in Queensland. Pac. Conserv. Biol. 2000, 5, 321–328. [Google Scholar] [CrossRef]
Publisher’s Note: MDPI stays neutral with regard to jurisdictional claims in published maps and institutional affiliations. |
© 2021 by the authors. Licensee MDPI, Basel, Switzerland. This article is an open access article distributed under the terms and conditions of the Creative Commons Attribution (CC BY) license (http://creativecommons.org/licenses/by/4.0/).