Article

A Lidar-Based 3-D Photosynthetically Active Radiation Model Reveals the Spatiotemporal Variations of Forest Sunlit and Shaded Leaves

1
International Institute for Earth System Science, Nanjing University, Nanjing 210023, China
2
Jiangsu Provincial Key Laboratory of Geographic Information Science, Nanjing 210023, China
3
Geospatial Laboratory for Environmental Dynamics, University of Idaho, Moscow, ID 83843, USA
*
Author to whom correspondence should be addressed.
Remote Sens. 2021, 13(5), 1002; https://doi.org/10.3390/rs13051002
Submission received: 8 January 2021 / Revised: 27 February 2021 / Accepted: 4 March 2021 / Published: 6 March 2021
(This article belongs to the Special Issue 3D Point Clouds in Forest Remote Sensing)

Abstract

:
Accurately identifying sunlit and shaded leaves using process-based ecological models can improve the simulation accuracy of forest photosynthetic rates and potential carbon sequestration capacity. However, it is still challenging to characterize their three dimensional (3-D) spatiotemporal distributions due to the complex structure. In this study, we developed a light detection and ranging (lidar)-based approach to map the spatiotemporal distribution patterns of photosynthetically active radiation (PAR) and sunlit and shaded leaves within forest canopies. By using both terrestrial laser scanning (TLS) and unmanned aerial vehicle-based lidar system (UAV-LS), we analyzed the influences of different scanning geometries and associated point densities on the separation of sunlit and shaded leaves. Moreover, we further investigated the effects of woody materials and penumbra sizes on identifying sunlit and shaded leaves by separating the foliage and woody materials and estimating the penumbras of sunlit leaves. Our results showed that: (1) The proposed lidar-based PAR model could well capture the variations of field-based pyranometer measurements using fused point data by combining UAV-LS and TLS data (mean R-square = 0.88, mean root mean square error (RMSE) = 155.5 μmol·m−2·s−1, p < 0.01). The separate UAV-LS and TLS-based fractions of sunlit leaves were averagely overestimated by 34.3% and 21.6% when compared to the fused point data due to their different coverages and comprehensiveness. (2) The woody materials showed different effects on sunlit leaf fraction estimations for forest overstory and understory due to the variations of solar zenith angle and tree spatial distribution patterns. The most noticeable differences (i.e., −36.4%) between the sunlit leaf fraction before and after removing woody materials were observed around noon, with a small solar zenith angle and low-density forest stand. (3) The penumbra effects were seen to increase the sunlit leaf fraction in the lower canopy by introducing direct solar radiation, and it should be considered when using 3-D structural information from lidar to identify sunlit and shaded leaves.

1. Introduction

Sunlit leaves, defined as the leaves illuminated by direct solar radiation, receive both direct and diffuse solar radiation simultaneously, while shaded leaves only receive the diffuse solar radiation [1]. The different amounts of solar radiation received by the sunlit and shaded leaves dictate their net photosynthetic rates and further determine the potential capacities of carbon sequestration by forest ecosystems at the leaf, canopy, and regional levels [2,3]. The penumbra regions of foliage elements, whose solar radiation intensities transitionally decrease from fully sunlit to shaded areas, will affect the sizes of the sunlit and shaded leaf areas due to the non-paralleled solar beams emitting from the finite size of the sun disc [4,5]. Although some work has attempted to account for the irradiance distribution in penumbra regions of a forest canopy [6], it remains challenging to map the penumbra regions throughout a forest canopy from a three dimensional (3-D) perspective.
Spatially locating the sunlit and shaded leaves can effectively improve the simulation accuracy of the photosynthesis ability of the forest ecosystem by treating the sunlit and shaded leaves with different light response models [7]. The 3-D spatial arrangement of leaves significantly affects the interactions between foliage elements and incident solar radiations, and further dictates critical physiological processes such as photosynthesis and respiration [8]. Further, information on sunlit and shaded leaves is essential to correctly interpret remote sensing metrics of forest functions such as photochemical reflectance index [9] and solar-induced fluorescence (SIF) [10] at a sub-daily [11] and individual leaf scales [12]. Some studies have only estimated the proportions of sunlit and shaded leaves based on Beer’s law for a given direction of incoming solar radiation [1,13,14,15]. Huang et al. [16] used the observed canopy reflectance to leaf reflectance to determine the fraction of sunlit leaves. However, this approach only allows the provision of fractions of sunlit and shaded leaves from a two-dimensional (2-D) perspective, thereby failing to resolve substantial variability in illumination conditions throughout the vertical profile of forest canopies. A contradiction of this method exists between the estimated fraction of sunlit leaves on cloudy days and the sunlit leaf definition that only receives direct solar radiation. However, it remains challenging to model the 3-D structural arrangement of sunlit and shaded leaves throughout forest canopies due to their structural complexity.
Methods for estimating photosynthetically active radiation (PAR) throughout the vertical profile of a tree canopy include direct measurements and radiative transfer models. Direct measuring approaches rely on PAR sensor arrays above and below the canopy [17,18]. The indirect measurement methods usually require the remotely observed spectral reflectance-based vegetation indices and structural parameters such as leaf angle distribution, leaf area index, and forest inventory parameters of individual trees in a 3-D forest scene for forest PAR estimation purposes [19,20,21,22,23]. Some models characterize the spatiotemporal variations of PAR based on digital hemispherical photos or synthetic hemispherical images [24,25,26]. The limitation with indirect measurement techniques is the lack of a 3-D forest canopy structure. Radiative transfer models have shown promise for modeling PAR throughout tree canopies, though they require detailed 3-D canopy structural information that has traditionally been time-consuming to collect [27]. With the advancement of lidar technology, it is now possible to efficiently capture forest 3-D structural information at a high spatial resolution [28]. Aerial laser scanning (ALS) and terrestrial laser scanning (TLS) are the two most commonly used platforms to acquire lidar point cloud data. The emergence of the unmanned aerial vehicle (UAV) makes it newly possible to collect lidar data in more flexible ways using the UAV-based laser scanning (UAV-LS) systems. Laser penetration index (LPI), which is the ratio of ground point number over total point number in a study area, is a parameter usually used for modeling radiation on the forest floor based on ALS data [28,29,30].
Moreover, some studies modeled the solar radiation throughout forest canopies based on ALS-based metrics such as leaf area density, leaf area index (LAI), and canopy closure [25,31,32]. However, both LPI and lidar metrics-based approaches showed systematic deviations in estimating solar radiation transmittance in heterogeneous forest stands [33,34]. In contrast, lidar driven ray-tracing approaches use 3-D forest structural information as inputs and have shown great potential in capturing the spatial variations of solar radiation throughout forest canopies [35,36,37,38]. However, relatively little is known about how woody materials affect the radiative transfer-based mapping of sunlit and shaded leaves. Forest canopies consist of photosynthetic (i.e., green leaves) and non-photosynthetic (i.e., stem and branches) components [39]. Non-photosynthetic canopy components account for different proportions for young- and old-growth forests, and woody elements play an important role in the radiative transfer model [40]. Thus, accurately estimating the proportions of non-photosynthetic canopy components is critical in better understanding the spatiotemporal distributions of sunlit and shaded leaves in a forest stand.
Further, the differences in scanning geometry between UAV-LS (i.e., top-down) and TLS (i.e., bottom-up) systems bias the comprehensive representation of 3-D structural information [41]. TLS provides detailed structural information of lower forest canopy using the “bottom-up” scanning method. In contrast, ALS or UAV-LS usually captures the upper canopy components using the “top-down” scanning method. In addition, due to the circadian rhythm of plants and external environmental factors (i.e., wind), the locations of trees, branches, and leaves are not fixed, even over a short period. Quantitative forest structure modeling with lidar has been confirmed to be problematic in consideration of trees swaying in the wind and leaf circadian movements [42,43]. Therefore, l idar-based approaches to map solar radiation within forest canopies face potential challenges of leaf movements. There is still a limited understanding regarding the effects of different scanning geometries, point densities, the fraction of woody material, and penumbra effects on the estimation accuracy of forest PAR and associated identification of sunlit and shaded leaves in 3-D space. To address some of these uncertainties, the objectives of this work were to:
(1)
Develop and validate a lidar-based approach for estimating forest incident direct and diffuse solar radiation from a 3-D perspective;
(2)
Identify the sunlit and shaded leaves and map their spatiotemporal distribution patterns;
(3)
Investigate the effects of lidar scanning geometry, point density, penumbra effects, and woody materials on the separation of sunlit and shaded leaves.

2. Materials and Methods
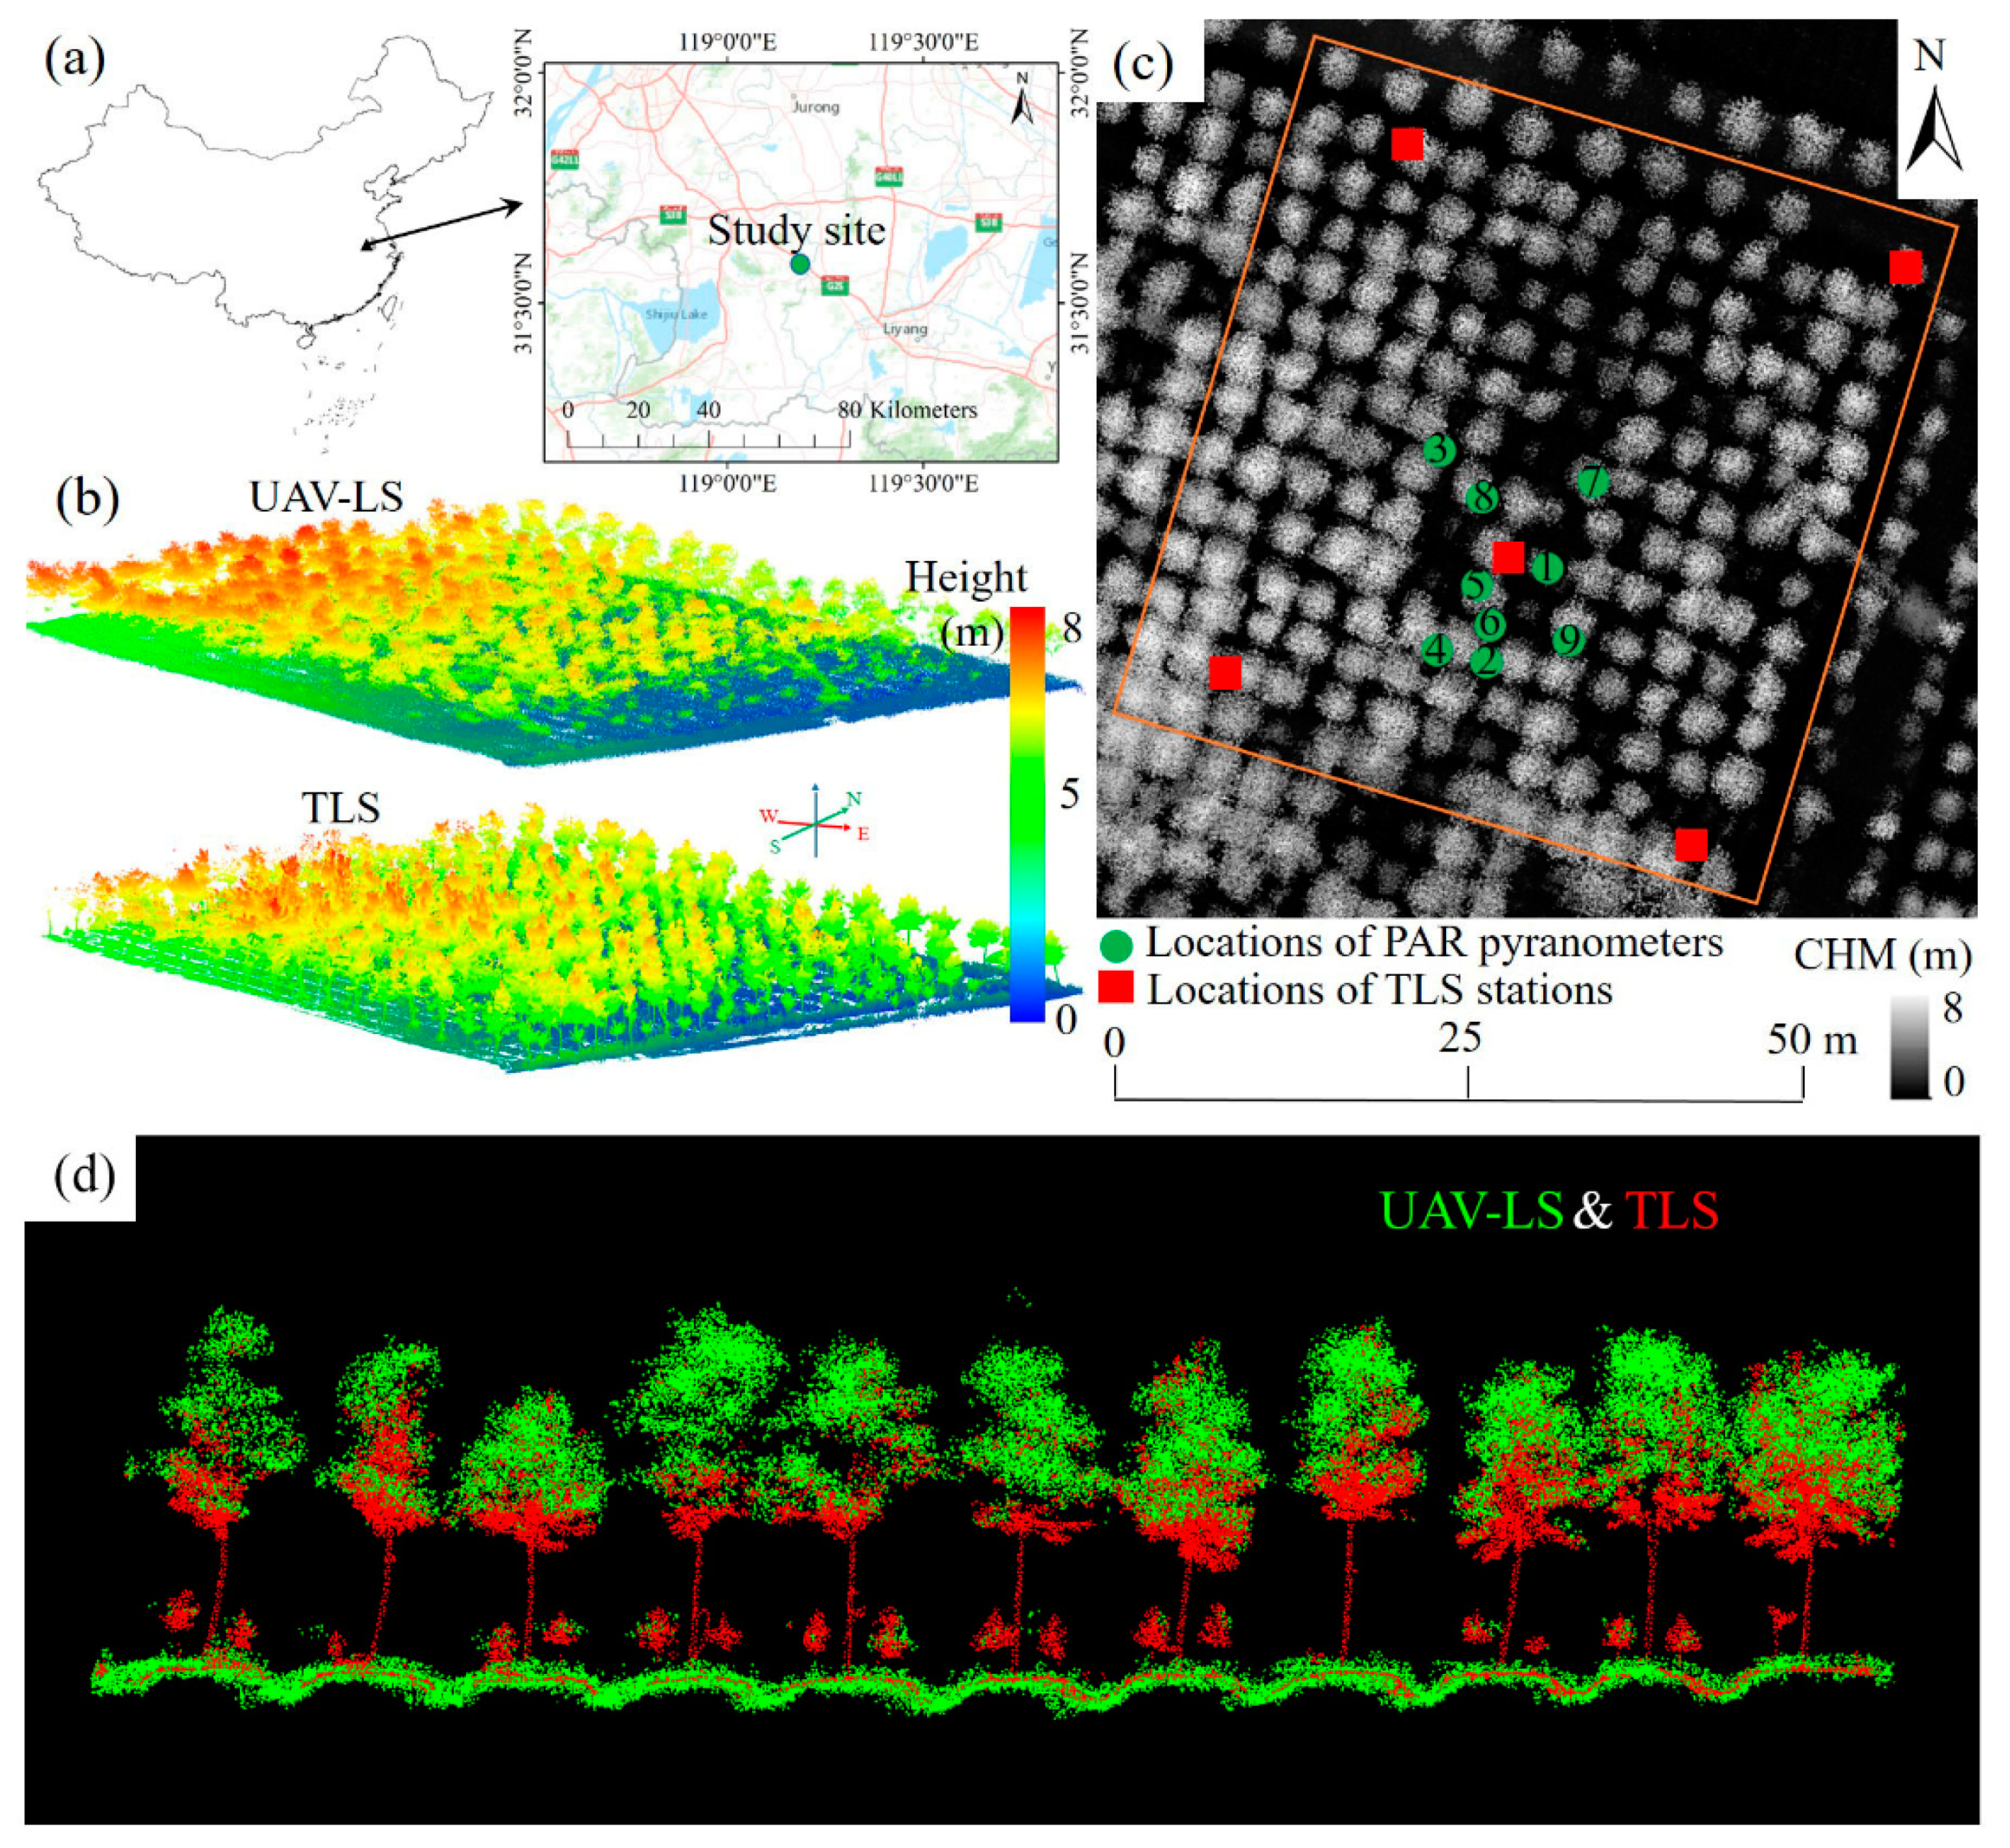
2.1. Study Site

We conducted the field campaign at the Baima experimental forest in Nanjing, China (31°35′18.44″N, 119°11′19.46″E). We selected a 50 m × 50 m experiment area planted with 160 even-aged broadleaf wheel wingnut (Cyclocarya paliurus) with the crown base height of 1.85 m (Figure 1a). The average tree height and tree diameter of this forest plot were 7 m and 2.5 m, with standard deviations of 1.5 m and 1.2 m, respectively. The effective leaf area index and the average spacing between tree stems were 1.5 m 2 m 2 and 3 m, respectively. Moreover, there were about 246 wheel wingnut seedlings planted under the forest canopy with a height of about 1.5 m and even-spacing.

2.2. Datasets

2.2.1. Lidar Data Acquisition and Pre-Processing

  • UAV-LS point cloud data
On 26 July 2017, we collected the UAV-based point cloud data using the method of cross-direction (i.e., north-south and east-west) flights using the DJI M600 pro (DJI Technology Co. Ltd., Shenzhen, China) drone to increase the point density. The UAV-LS system was built using the Velodyne VLP-16 (Velodyne Lidar Inc., San Jose, CA, USA) sensor and a high-definition OXTS × Nav500 (Oxford Technical Solutions, Ltd., Oxford, UK) Inertial Measurement Unit. The laser beam divergence was 3.0 mrad, with a laser wavelength of 905 nm. The field of view of the along- and cross-flight directions was −15.0°~15.0° and −90.0°~90.0° at the flight height of 50~60 m. The average density of laser points in the study area was 500 points/m2. The neighboring point distance (NPD) of the UAV-LS point cloud was 6.5 cm.
  • TLS point cloud data
On 27 July 2017, TLS data were collected with the Leica Scan Station 2 (Leica Geosystem AG, St. Gallen, Switzerland) system at five different scan locations, including one central and four-corner scan locations (Figure 1b). The distances between the central scanning station and four surrounding scan locations were 26 m, 30 m, 18 m, and 21 m, respectively (Figure 1c). The TLS system worked in a hemispherical scanning mode (horizontal: 0°~360°; vertical: −45°~90°) with a spatial resolution of 1 cm at 10 m. In addition, to ensure the comprehensiveness of the sampled TLS data, we also set up five targets between scan locations to register the point cloud data generated from each scanning position. The fine-registration TLS data was achieved using the automatic registration function provided by the Cyclone software 9.0 (Leica Geosystem AG, St. Gallen, Switzerland) with the average NPD and fitting residual standard deviation of 0.5 cm and 0.62 cm, respectively.
  • Registration of UAV-LS and TLS data
To obtain a complete 3-D representation of the canopy with minimal occlusion effects, we combined the bottom-up and top-down point clouds from TLS and UAV-LS, respectively (we refer to this point cloud as ‘fused point cloud’ hereafter). For this, we geo-referenced the TLS point cloud to the World Geodetic System 1984 (WGS 84/UTM zone 50N) of the UAV-LS point cloud. To accomplish this, we matched the two bounding box centers of point data using the Iterative Closest Point algorithm provided by the CloudCompare software package (version 2.6.2) (GPL software, available from http://cloudcompare.org in September 2020). Furthermore, we thinned the TLS point cloud data into the same NPD as the one from the UAV-LS point cloud. The fine-registration procedure resulted in a fused point dataset with a mean square error (MSE) of 0.182 m, computed from randomly sampled 50,000 pairs of points from the UAV-LS and TLS data (Figure 1d). Due to the different scanning geometries of TLS and UAV-LS, we compared and analyzed the occlusion effects of foliage elements due to the shading effects within a forest canopy by following the method described by Schneider et al. [41]. Because of the different NPDs of the original UAV-LS (i.e., 6.5 cm) and TLS (i.e., 0.5 cm) data, we have resampled the TLS data down to 6.5 cm to produce comprehensive fused point data with a consistent NPD. The fused point data were considered as a comprehensive representation of forest canopies.

2.2.2. Field-Based Pyranometer Measurements

  • BF-5 sunshine sensor data
We collected the above-canopy total incident PAR and diffuse PAR (DifPARabove) (unit: μmol·m−2·s−1) by horizontally placing a BF-5 sunshine sensor (Delta-T Devices Ltd., Cambridge, UK) on a roof 20 m above the ground and near to the study site on a clear day. By subtracting the diffuse PAR from the total PAR measurement, we obtained the direct PAR (DirPARabove) above a forest canopy.
  • Photo quantum sensor data
Concurrent below-canopy PAR samples were collected over two measurement periods, which were from 12:00 to 18:00 on July 27 and from 06:00 to 12:00 on 28 July 2017, using nine PAR pyranometers (SY-HGY, ShiYa Ltd., Shijiazhuang, China). All quantum sensors were located at different open space locations under forest canopies to avoid stem shadows with heights ranging from 0 to 2 m, due to the limited cable length (≤10 m), to a data logger (Figure 1). The PAR sensor regularly sampled the photosynthetic photon flux density (PPFD) (unit: μmol·m−2·s−1) with a time interval of 30 s to ensure concurrence with the BF-5 sensor. By visually identifying each quantum sensor in the TLS point cloud data, we were able to locate the nine quantum sensors in 3-D space accurately. We then calibrated their readings using a standard reference quantum sensor (LI-190R, LI-COR, Inc., Lincoln, Nebraska) for model development and validation purposes by following the procedures outlined in previous work by Zeng et al. [44].
  • TRAC data
We also collected the PPFD along a line transect perpendicular to the solar incident direction under a forest canopy using the tracing radiation and architecture of canopy (TRAC) optical instrument [45]. By doing so, we could characterize the penumbra effects and further retrieve its forest canopy clumping index (Ω).

2.2.3. Validation Data

  • Manually classified forest points
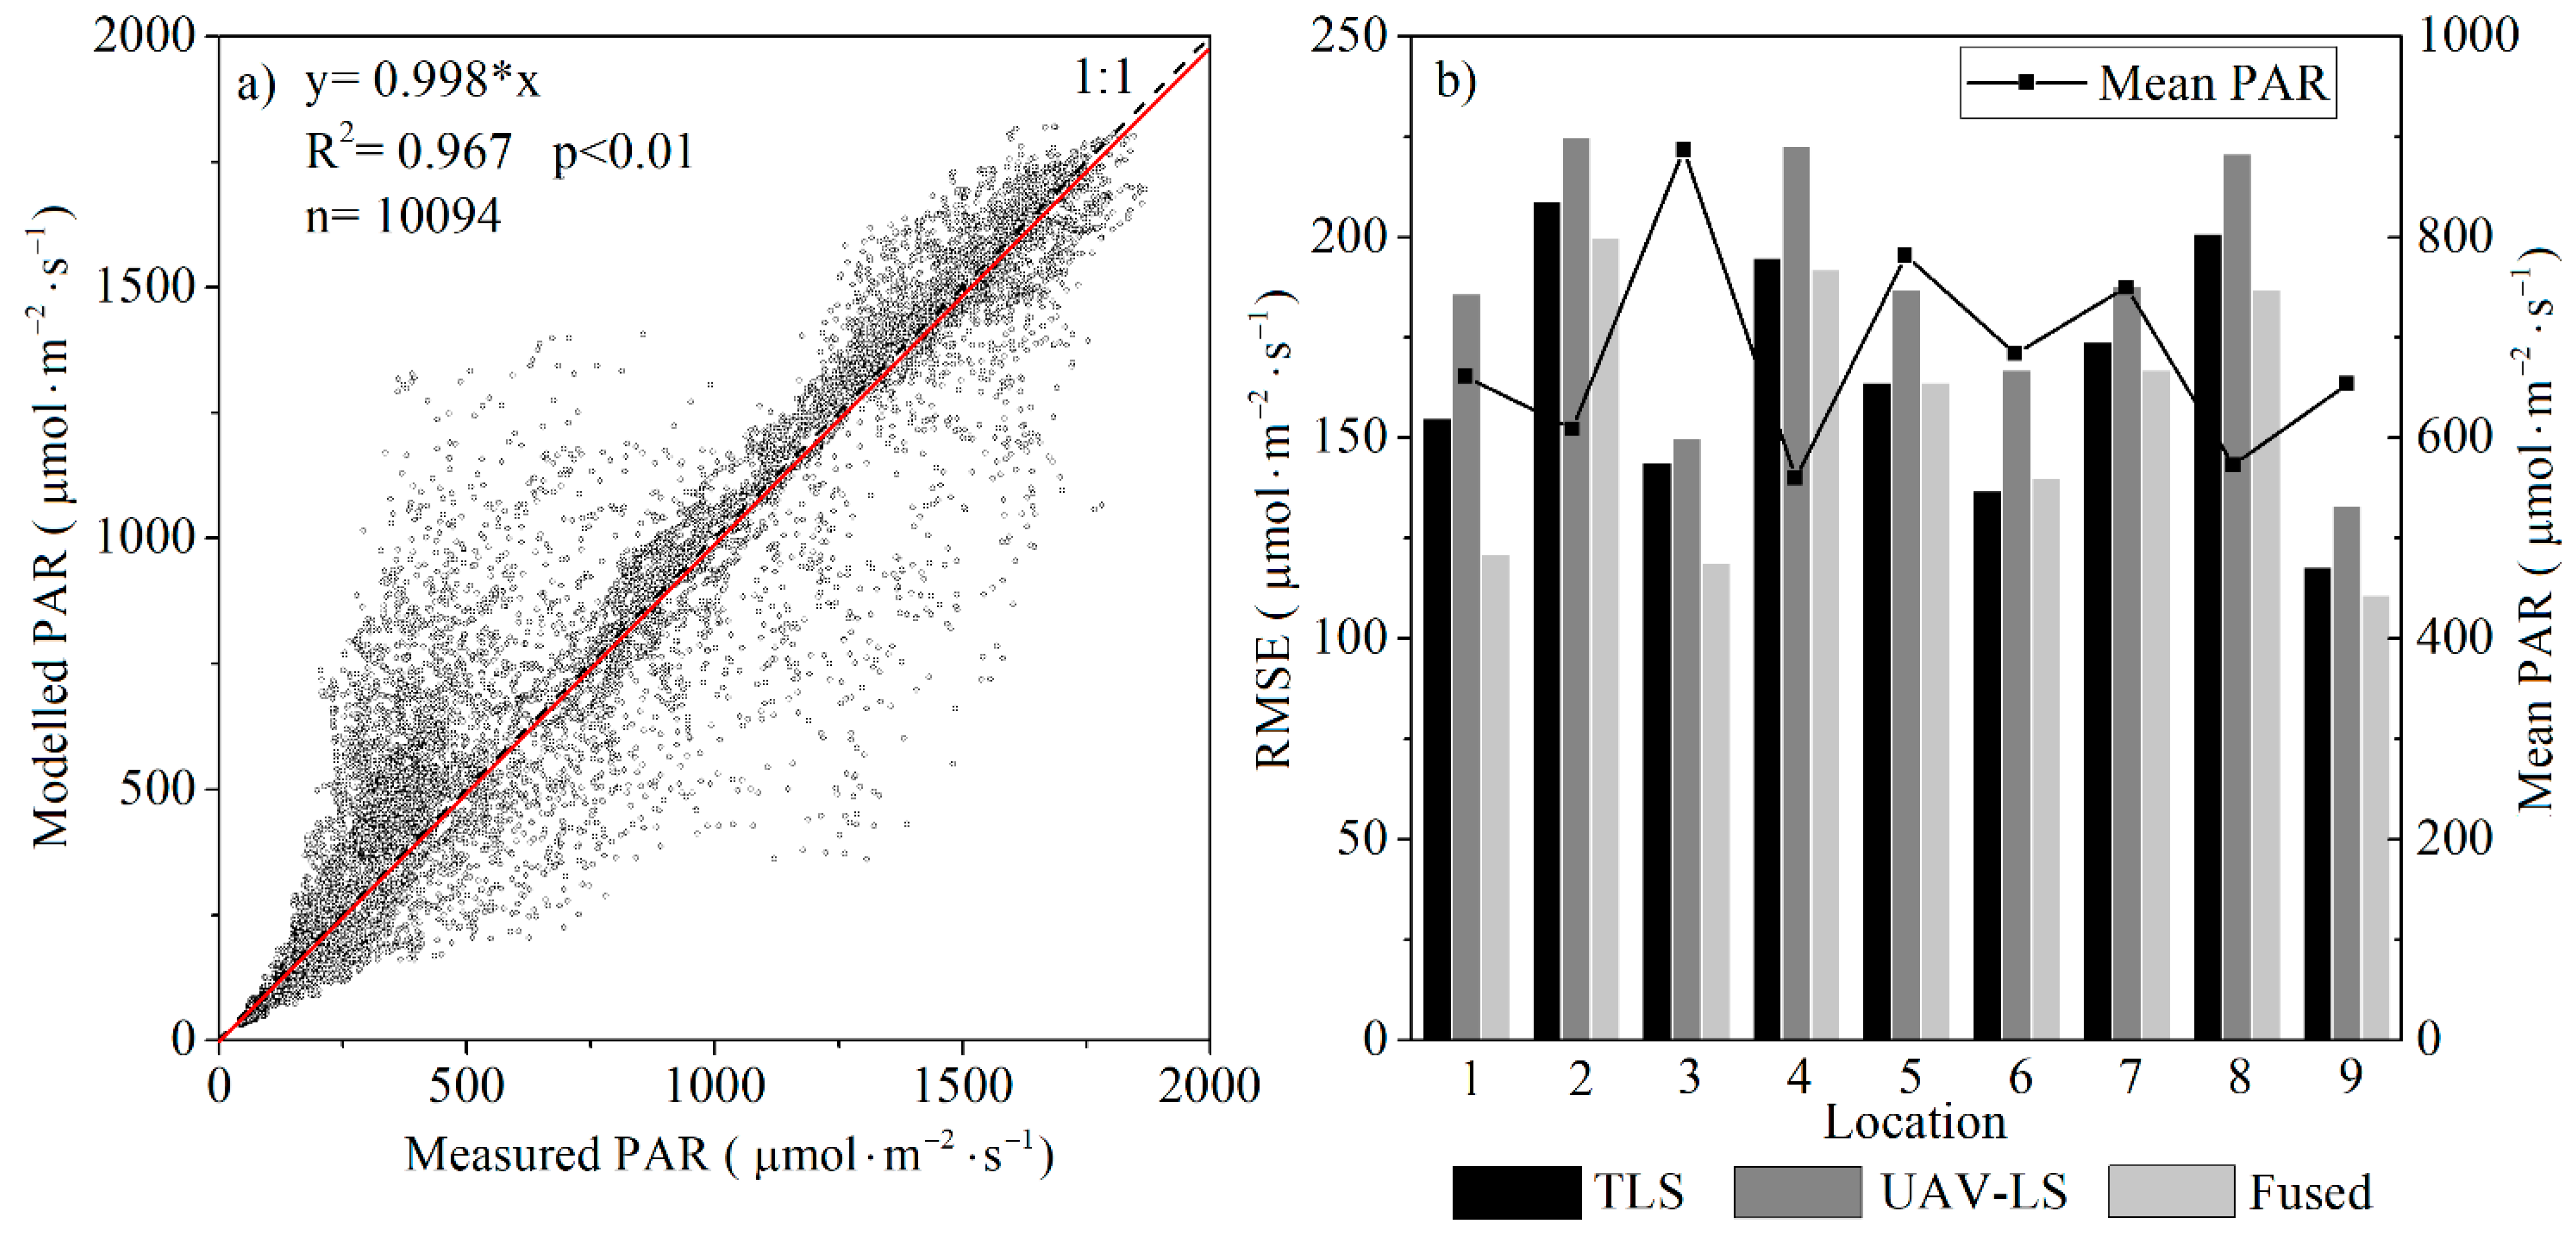
Based on the visual identification, we grouped forest point data into three different categories: (1) photosynthetic components (i.e., leaves, shrubs, and graminoids.); (2) non-photosynthetic canopy components (i.e., stems and branches); and (3) bare earth. The visually classified point cloud data served as reference data to validate computer-based classification results for fused point data.
  • PAR validation
We modeled the 3-D spatiotemporal distributions of forest PAR values and fractions of sunlit and shaded leaves based on the UAV-LS, TLS, and fused point data and validated them with the field-based PAR measurements at nine different locations. For each position, we took 25 measurements between 6:00 to 18:00 with a time interval of 0.5 h, resulting in 225 samples for further statistical analysis. Moreover, the TLS- and UAV-LS-based sunlit leaf fractions were compared with the ones obtained using the fused point data within and under forest canopies at heights from 0 to 7 m with a height interval of 1 m.

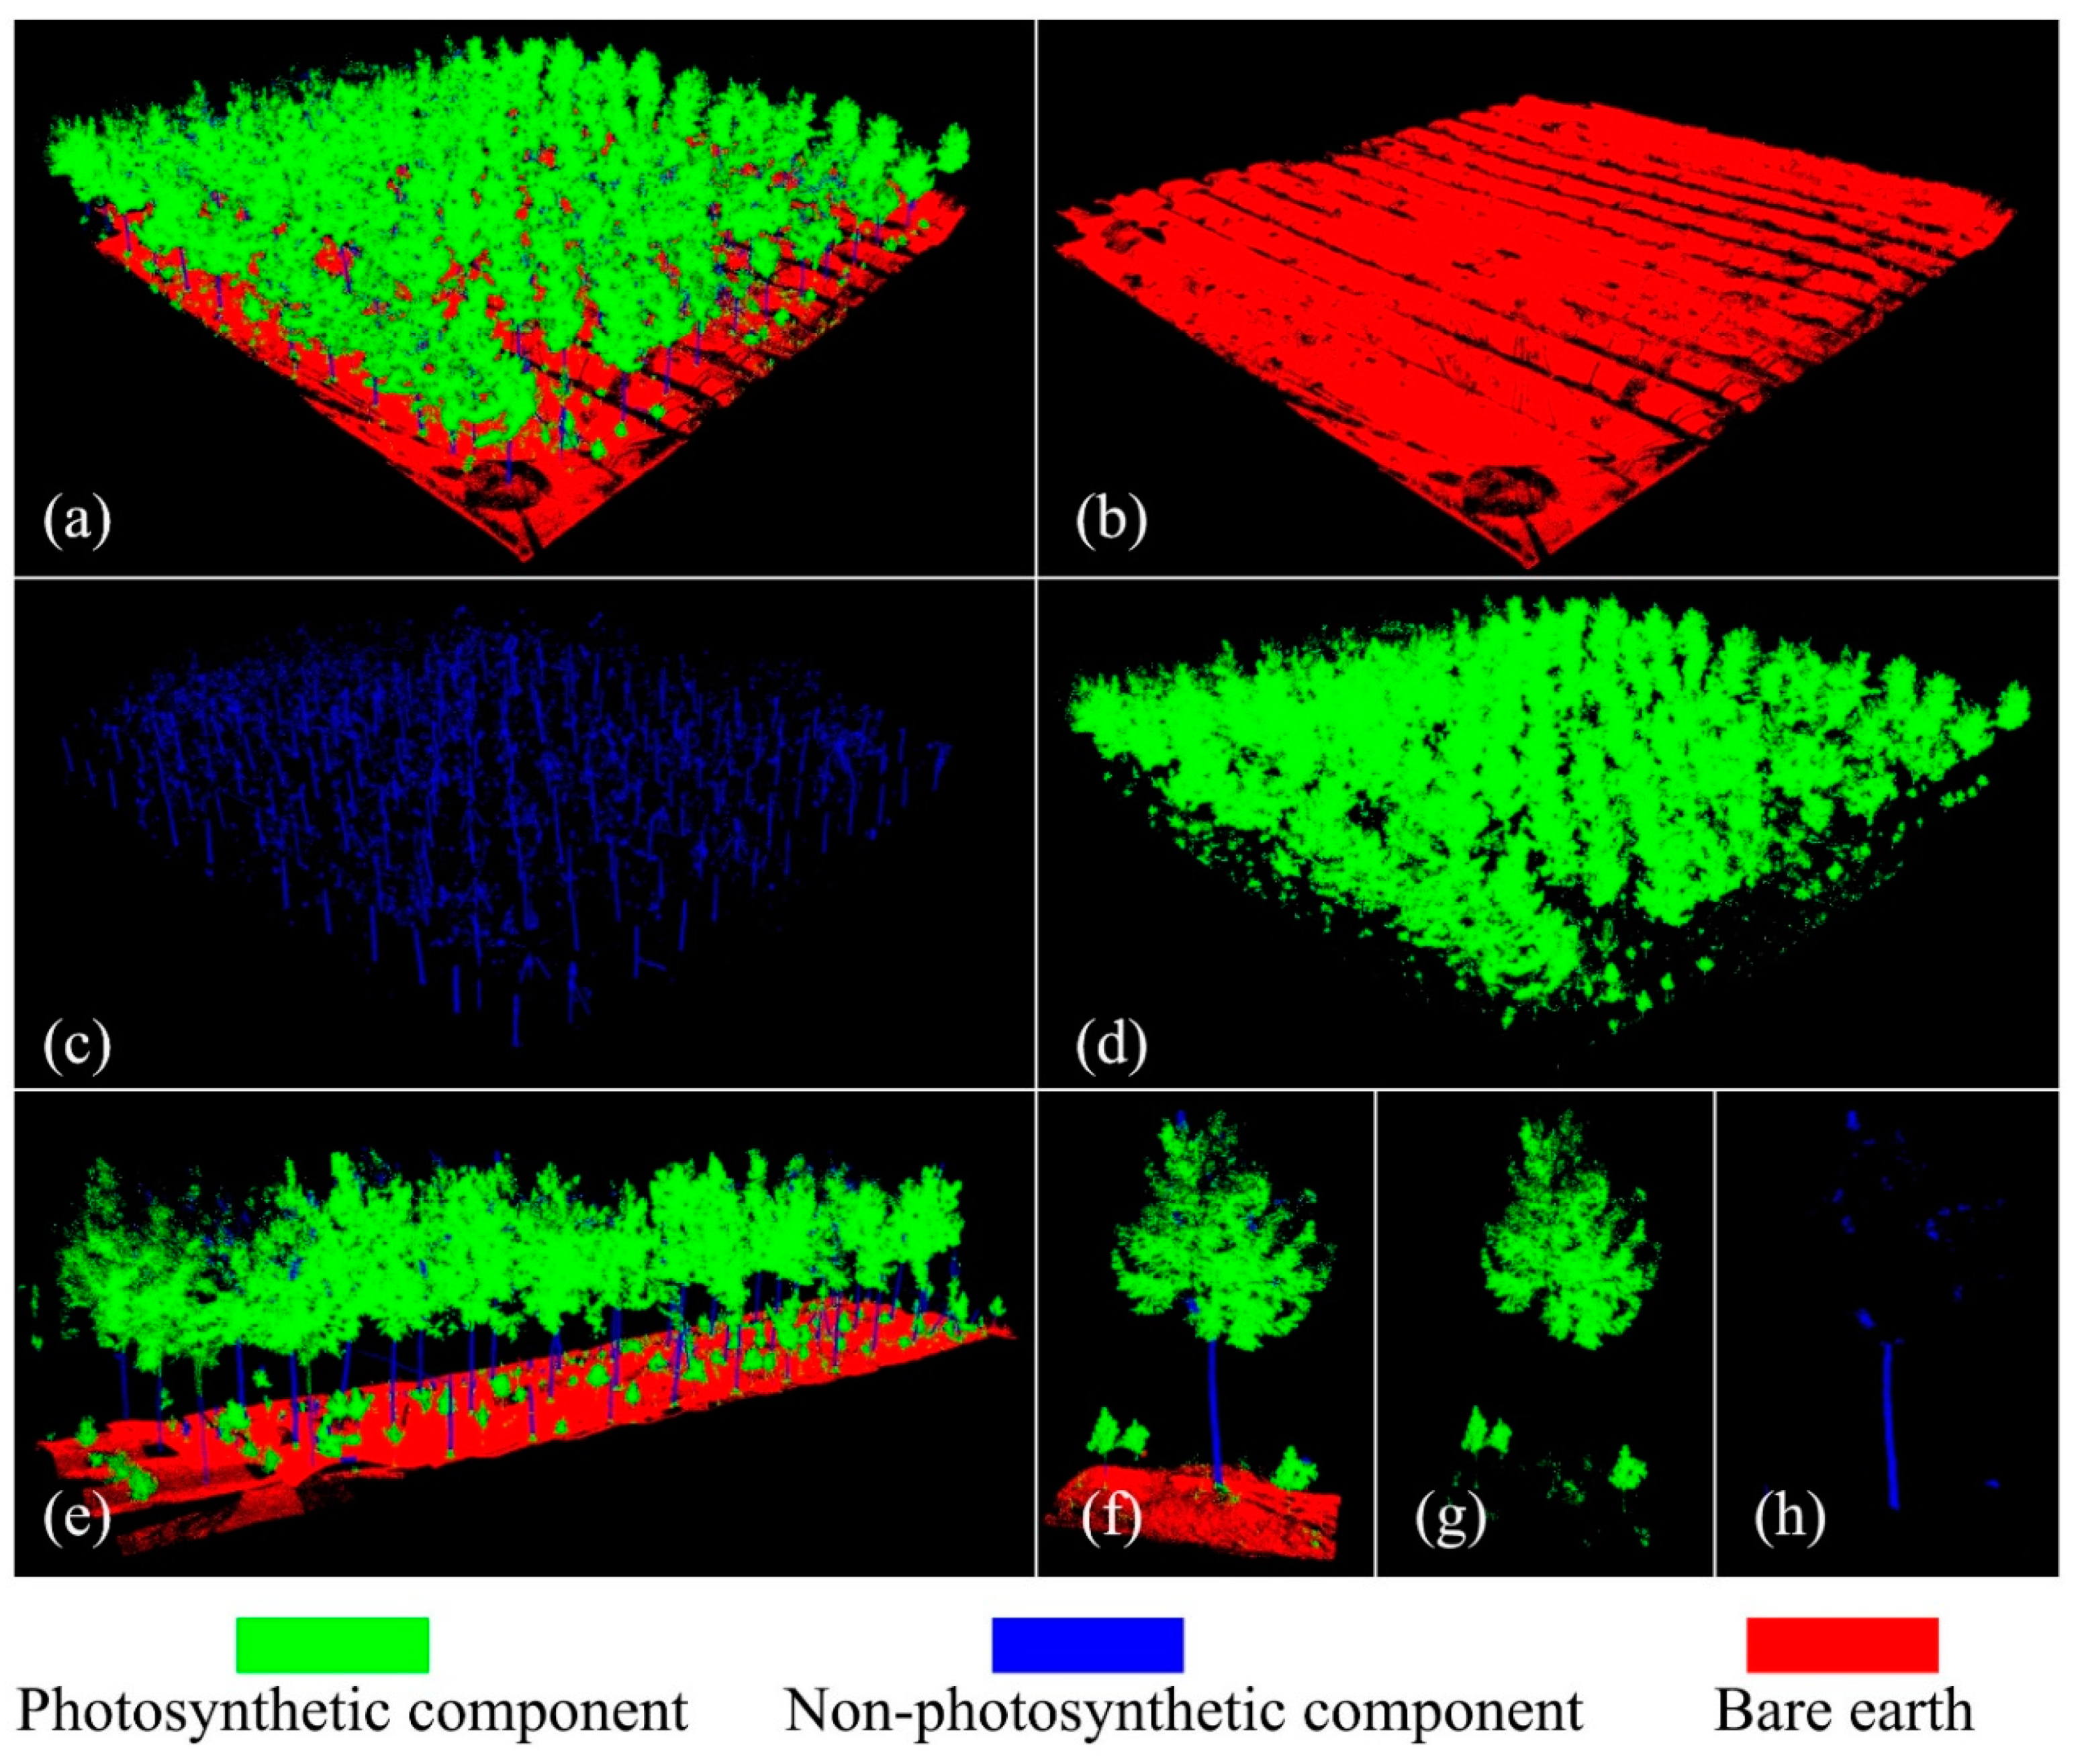
2.3. Separation of Photosynthetic and Non-Photosynthetic Forest Components

To remove the effects of woody materials on the identification of sunlit and shaded leaves, we separated photosynthetic and non-photosynthetic forest components based on lidar point cloud data following the approach outlined in work by Ma et al. [46]. By following this algorithm, we first manually selected 30 training samples for leaves, woody materials (i.e., branches and stems), and bare ground category points. Then, the saliency features for these three categories were constructed based on the eigenvalues ( λ 0 , λ 1 , λ 2 ) of local point sets to parameterize a Gaussian mixed model (GMM) using the expectation-maximization algorithm. Photosynthetic, non-photosynthetic canopy and ground components exhibited random features ( λ 0 λ 1 λ 2 ) , linear features ( λ 0 λ 1 λ 2 ) , and surface features ( λ 0 λ 1 λ 2 ) , respectively. Thus, this approach allows the classification of each point in the lidar point clouds as the leaf, woody materials, or ground, according to the conditional probability computed by three GMMs. We applied six post-processing filters to improve the final classification result and validated it using the data described in Section 2.2.3. Finally, we investigated the effects of non-photosynthetic forest components on the identification of sunlit and shaded leaves based on the classified photosynthetic canopy component points.

2.4. Lidar-Based Forest Sunlit and Shaded Leaves (LFSSL) Identification Algorithm

There are two stages of the newly proposed lidar-based forest sunlit and shaded leaves (LFSSL): 3-D PAR mapping and sunlit and shaded leaves identification. In the following sections, we describe each of these two stages in more detail:

2.4.1. Lidar-Based Forest 3-D PAR

We mapped the 3-D spatiotemporal distributions of forest PAR using our previously developed method [44] from 12:00 to 18:00 on 27 July and from 06:00 to 12:00 on 28 July 2017. The total solar radiation received by foliage elements at a specific location within and under a forest canopy contains three different components, including direct PAR (DirPARunder), diffuse PAR (DifPARunder), and scattering PAR (ScaPAR). The parallel solar beams with a specific incident direction were approximated using a geometric cylinder to model the flux of direct incident PAR, with the sun and ground as the start and end points when transmitting through a forest canopy.
  • Direct PAR component
We computed the direct solar radiation component reaching a specific point in 3-D space (DirPARunder) as (Equation (1)):
D i r P A R u n d e r = D i r P A R a b o v e T
where DirPARabove and T are the total direct PAR above a forest canopy and its transmittance by reaching a specific point. The transmittance (T) of direct PAR was calculated as (Equation (2)):
T = a b + exp ( T P L e c + d )
where a, b, c, and d are statistical regression coefficients. TPLe is the effective total path length; it characterizes the traveled path length of solar beams while penetrating through a forest canopy after excluding all gap regions along with a solar beam cylinder. Moreover, the TPLe considers not only the volume point density variations but also non-randomly distributed point clusters within the cylinder; more information can be found in Zeng et al. [44]. We determined the unknown parameters of Equation (2) by fitting the calibration Equation (1) based on the field-based total incident radiation, and we received direct PAR values above and under a forest canopy using the BF-5 and quantum sensors, respectively.
  • Diffuse PAR component
By assuming that the sky diffuse radiation exhibits an anisotropic distribution pattern, we estimated the incident diffuse PAR component at a specific location within or under a forest canopy (DifPARunder) by dividing the sky hemisphere into nine different annulus rings with a zenith angular interval of 10° as (Equation (3)):
D i f P A R u n d e r = D i f P A R a b o v e k = 1 9 C k P g a p ( k )
where C k and P g a p ( k ) are the diffuse PAR contribution factor and gap fraction of the k-th zenith annulus ring. In terms of the DifPARunder, we applied the sky diffuse radiation distribution model [47] to characterize the anisotropic variations with zenith angles of the sky diffuse PAR above a forest canopy during the daily sun course under a clear sky. Due to the variable sizes of the trapezoid voxels within each annulus ring, we applied a sinusoidal weighting function for each annuls ring to indicate its contribution of the gap fraction of k-th annulus ring to a whole forest canopy. The total gap fraction P g a p ( k ) was computed as the ratio of the number of empty trapezoid voxels over the total number of voxels within a sky hemisphere.
  • Scatter PAR component
In the scattering PAR component of the model, the ScaPAR was computed as a function of the leaf scattering coefficient and canopy structure parameters (Equation (4)) [48,49]:
S c a P A R = α Ω D i r P A R a b o v e ( 1.1 0.1 P A I e ) exp ( cos θ s )
where α is the broadleaf scattering coefficient in the PAR band and is set as 0.15, according to work by Chen et al. [48], PAIe is the plant area index of a forest stand and computed from the TLS data using the method proposed by Zheng et al. [50], and Ω is the forest canopy clumping index indicating the dispersion extent of foliage element away from the random distribution and related with the tree structure and species. We computed the value of Ω based on the PPFD measurement using the TRAC instrument [51], and θ s is the solar zenith angle. Finally, the total PAR was computed as (Equation (5)):
t o t a l P A R u n d e r = D i r P A R u n d e r + D i f P A R u n d e r + S c a P A R
By doing this, we mapped the 3-D spatiotemporal distributions for each leaf at any specific location throughout a forest canopy.

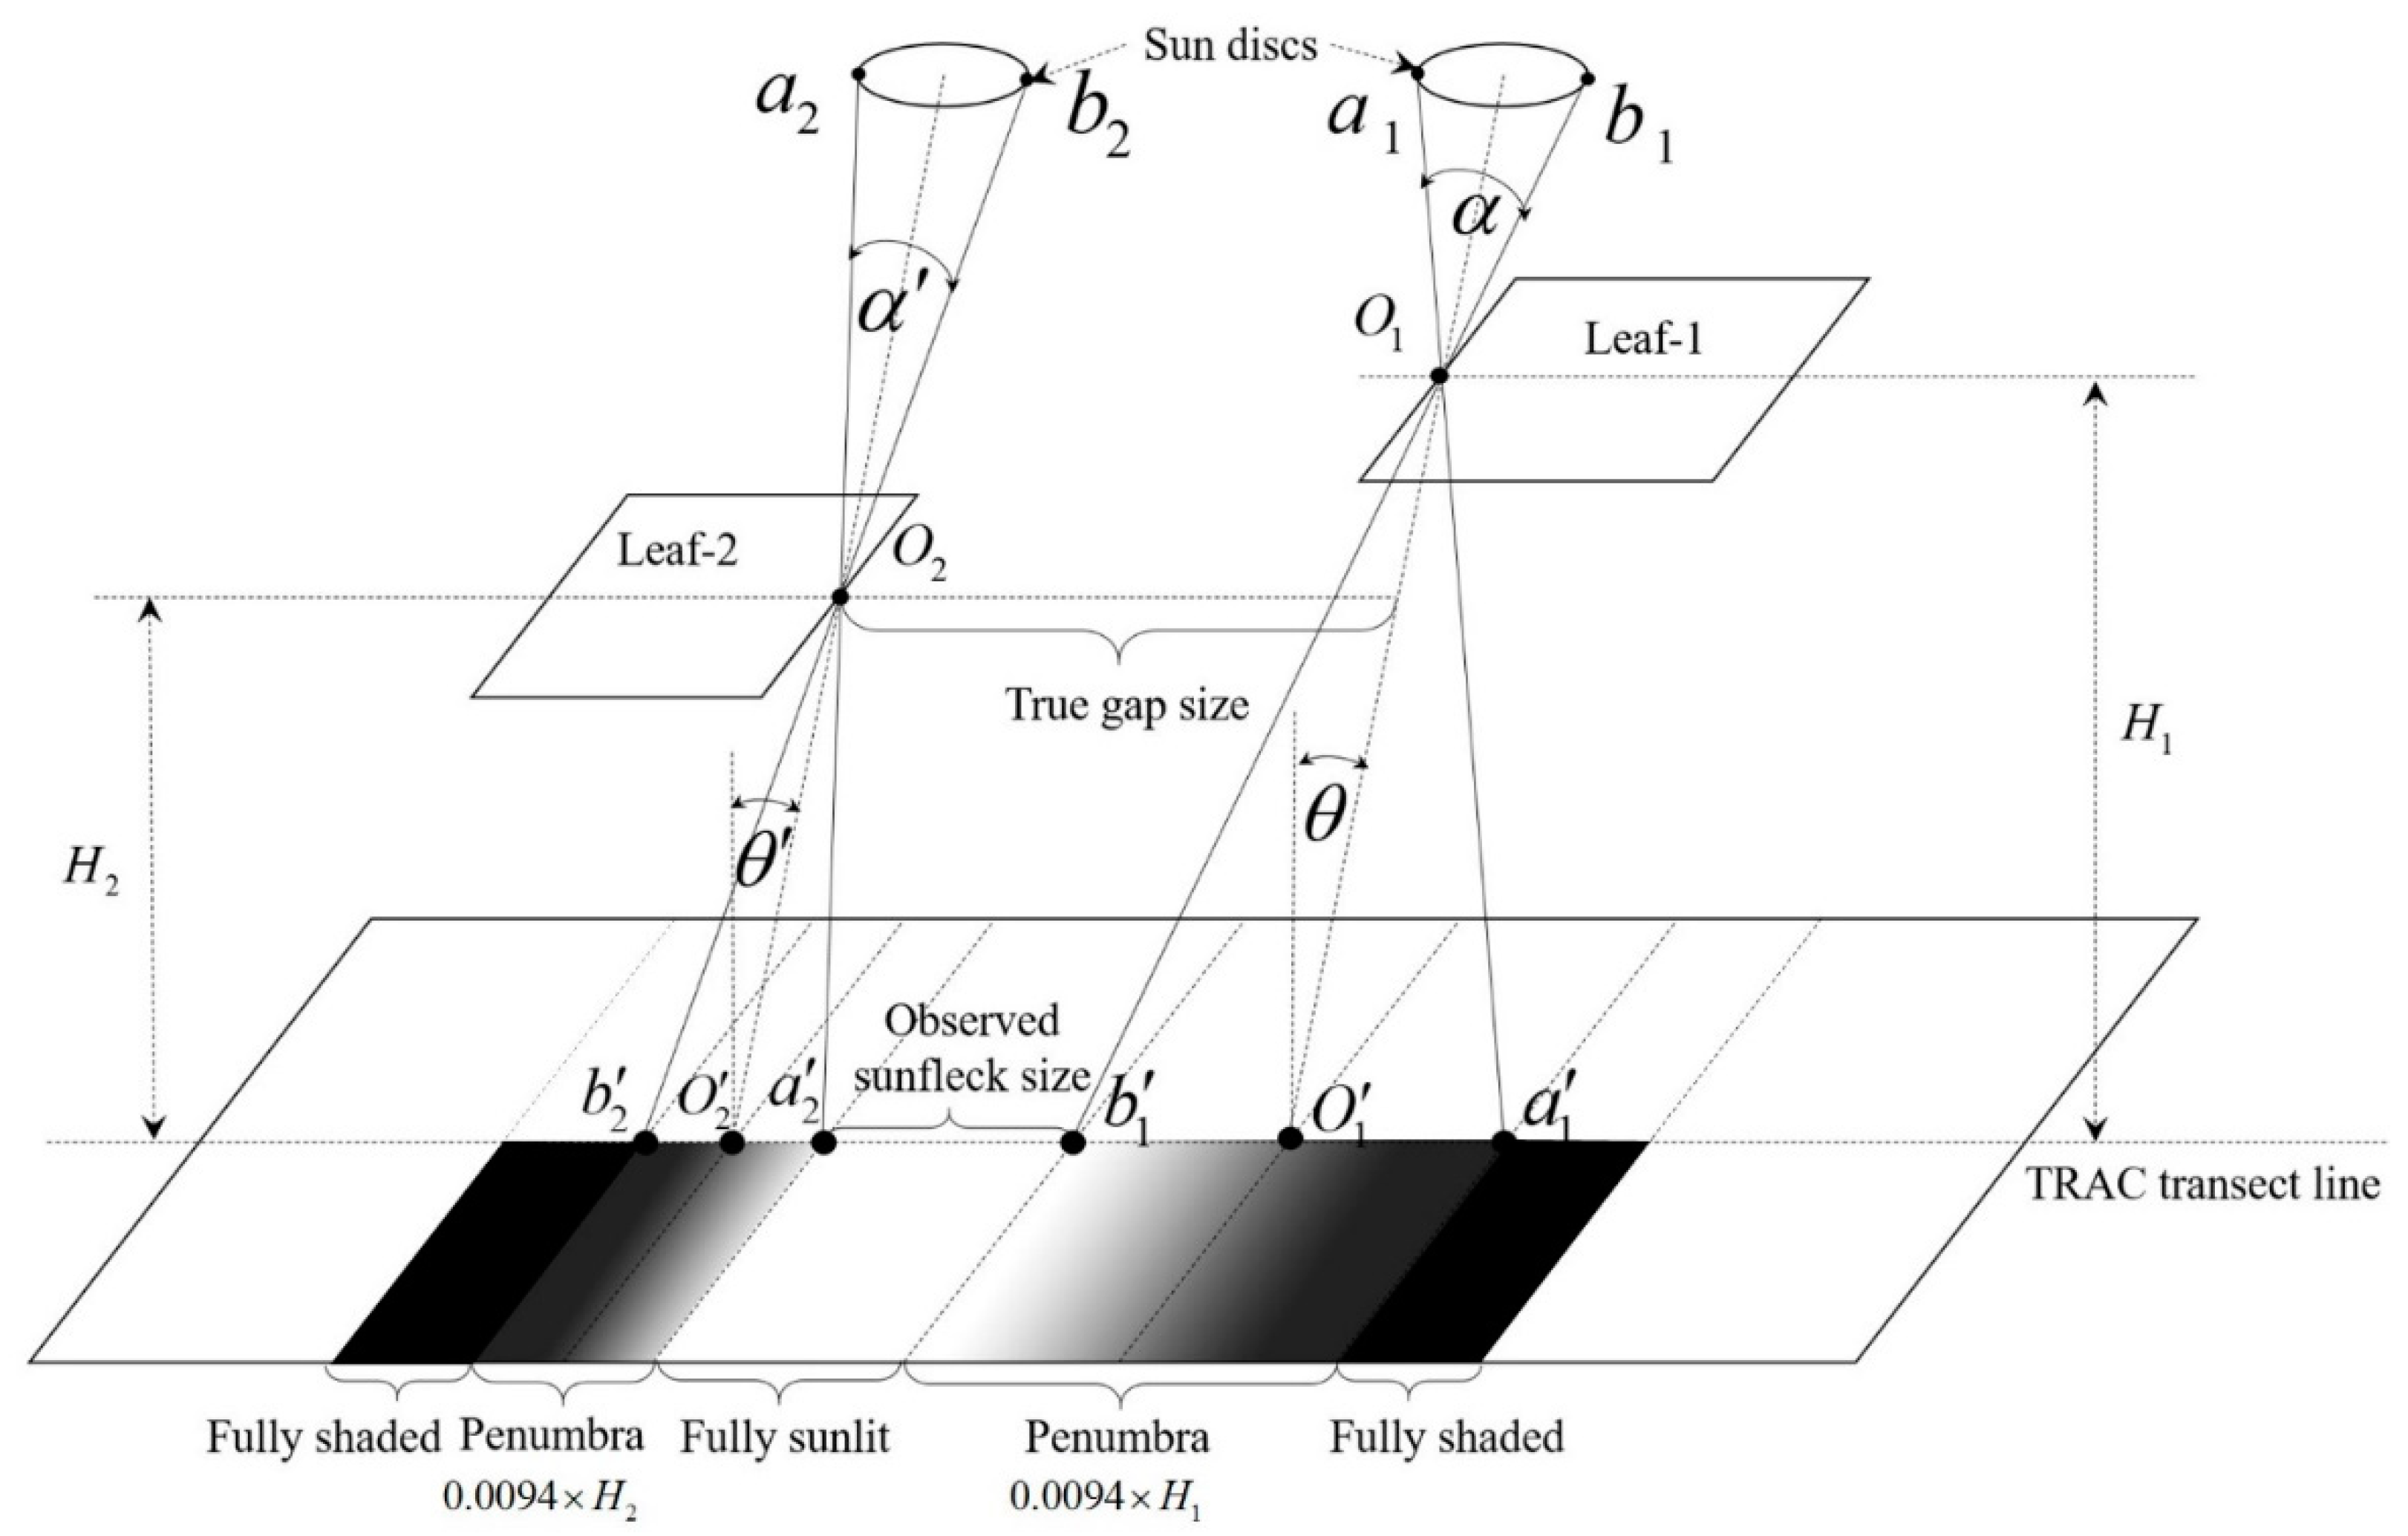
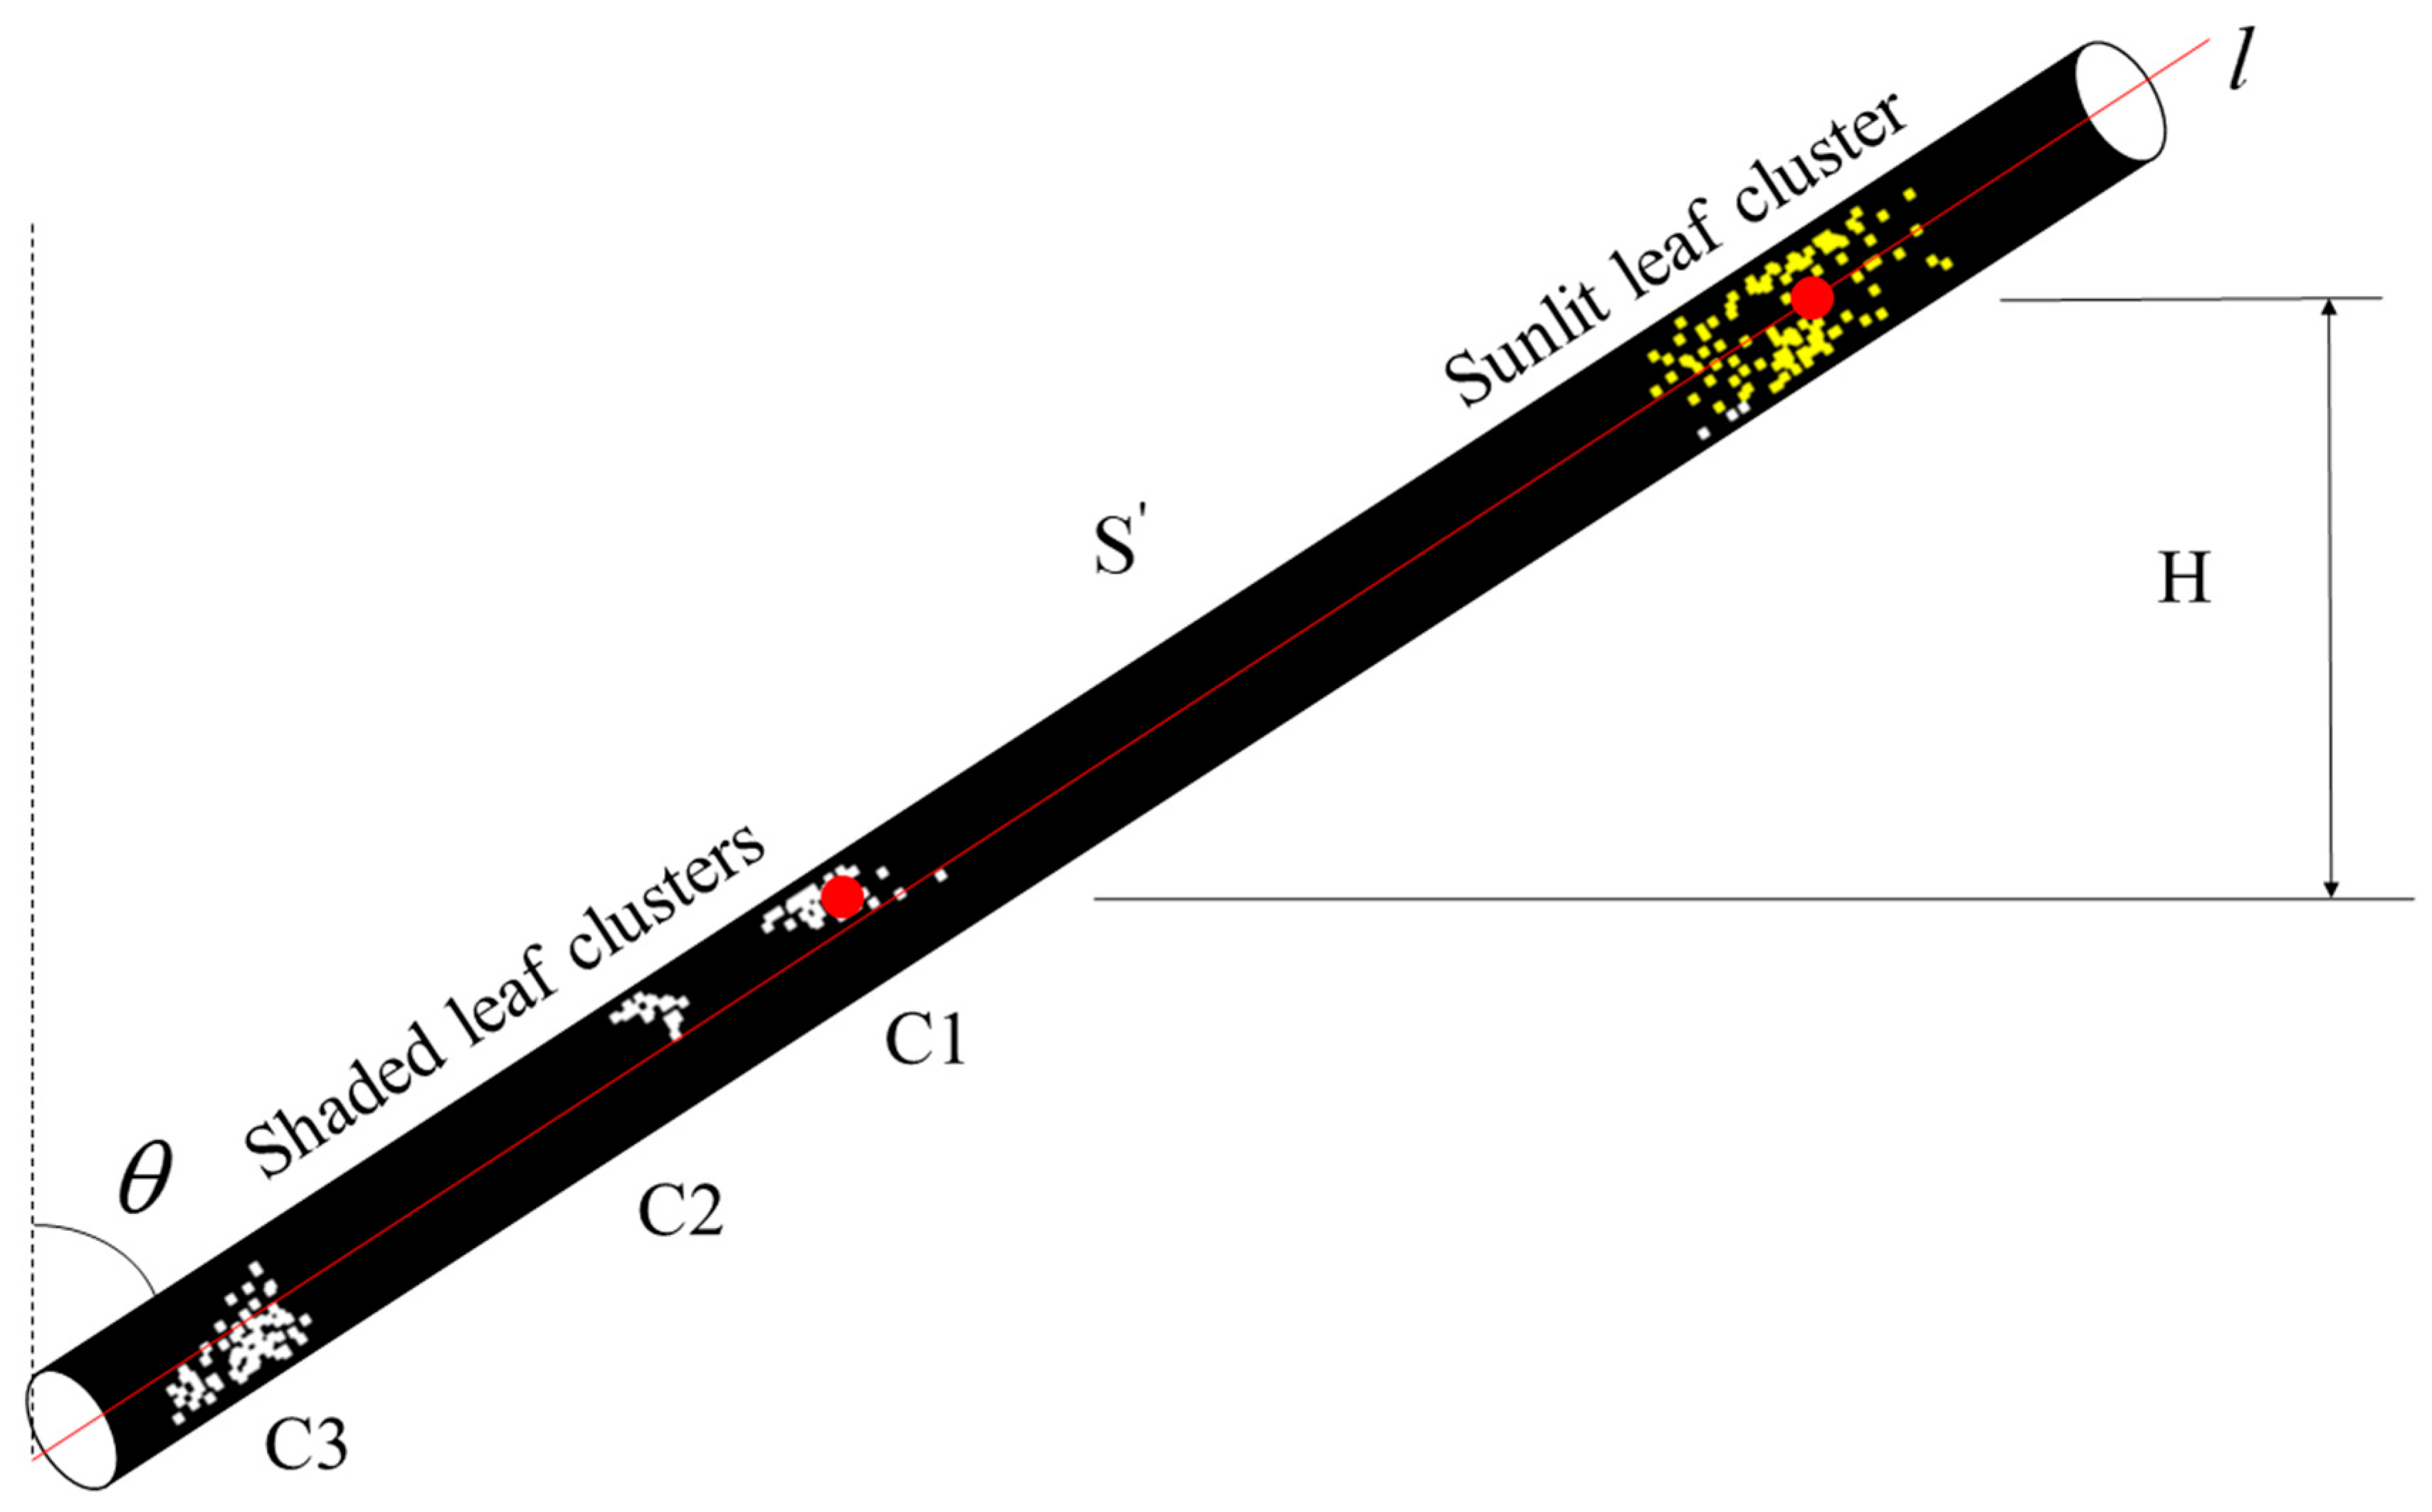
2.4.2. Forest Penumbra Effects Characterization

It is usually challenging to identify the sunlit and shaded leaves by visual interpretation using 2-D images due to the penumbra effects and the complexity of the canopy structure. The penumbra effects of leaves resulting from the non-ignorable size of the sun disc will affect the estimated intensity of PPFD reaching a specific point within or under a forest canopy. Penumbra regions are defined as the transitional regions from fully sunlit to fully shaded areas, which is closely related to the leaf height. The heights of leaves will alter the size of penumbra regions on the ground surface, and the increasing height shrinks the observed sunfleck size along a line transect, measured using the TRAC optical instrument in the field (Figure 2).
As shown in Figure 2, for leaf-1 and leaf-2 of a forest canopy at the heights of H1 and H2 (units: meter), ranging from the ground surface and the sun disc, the points O 1 and O 2 are two random points at the edge of two leaves, and their projected points on the ground surface are O 1 and O 2 for the solar beams coming out from the center of the sun discs, respectively. Due to the non-ignorable size of the sun disc, the sun illuminated forest canopies and ground surface are in the shape of a solar cone with the same sector angle ( α = α = 32 ) [52]. Based on the light transmission geometry, the projected points of points a 1 and b 1 , a 2 and b 2 from the sun disc on the ground surface are a 1 and b 1 , a 2 and b 2 , respectively. Along the line transect sampled on the ground surface using the TRAC instrument, the true gap size between the two leaves is the distance O 1 O 2 . However, the observed sunfleck size is a 2 b 1 , which is smaller than its true gap size. Starting from the fully shaded points a 1 and b 2 , there are penumbra regions, which are exponential increasing PPFD areas and reach the maximum values at the points a 2 and b 1 [51,52]. Penumbra effects introduce direct PAR to regions a 1 O 1 and b 2 O 2 , although some penumbra leaves near points a 1 and b 2 are closer in total PAR dosage to shaded than sunlit, these leaves are classified as sunlit according to the definitions of sunlit and shaded leaves.
For points O 1 and O 2 , their penumbra areas a 1 b 1 and a 2 b 2 under the solar zenith angle θ can be calculated as (Equations (6) and (7)):
a 1 b 1 = 2 tan ( α / 2 ) H 1 sec   θ = 0.0094 H 1 sec   θ
a 2 b 2 = 2 tan ( α / 2 ) H 2 sec θ = 0.0094 H 2 sec θ
The leaf points that fall into the observed sunfleck areas and penumbra regions are considered as the sunlit components, otherwise, they will be classified as shaded areas.
To quantify the influences of penumbra effects on fraction estimation of the sunlit and shaded leaves, we developed a lidar-based penumbra effects characterization algorithm. The sunlit leaves from the top canopy would generate visible penumbra on the leaves in the lower canopy components that might convert the shaded leaves into sunlit leaves due to the illumination of direct PAR. For a single light beam transmission cylinder with the central axis (l) and zenith angle (θ) (Figure 3), we built a 3-D cylindrical buffer (S′) region as it penetrates through a forest canopy. We clustered all points into different groups based on their spatial distances using the K-means algorithm [53]. This point grouping process would iteratively assign every point into different groups (C1, C2, … Cn) with each group center point (K1, K2, …Kn) [44]. The height difference (H) between two point clusters was a crucial parameter to quantitatively characterize the penumbra effects of sunlit leaf clusters on the leaf clusters in the lower part of the light transmission cylinder. The more substantial the height differences were, the more obvious penumbra effects could be observed.
In this study, we only considered the penumbra effects as obvious ones whose size was larger than half of the NPD. In other words, along a light transmission path, the first shaded leaf point cluster whose height difference to the center of the sunlit leaf point cluster was larger than a certain threshold was considered as a “qualified penumbra leaf points” cluster, and the threshold was called initial height difference ( H i ). Moreover, we defined a parameter hereafter referred to as “conversion ratio” to represent the proportions of original shaded leaf point clusters converted into sunlit leaf point clusters after considering the penumbra effects. The “conversion ratio” was defined as the ratio of the number of incident solar directions containing “qualified penumbra leaf points” over the total number of solar incident directions during a daily sun course. Within a light beam cylinder, we assumed that the penumbra effects only affected the first qualified shaded point cluster (C1) and had little impact on the remaining shaded point clusters (C2, C3…) due to the block of the first shaded point cluster.

2.4.3. Identification of Sunlit and Shaded Leaves

In this study, we determined the fractions of sunlit and shaded leaves using the validated modeled PAR values based on the definitions of sunlit and shaded leaves. Based on the classified photosynthetic canopy component points and modeled forest PAR in 3-D space, we further identified the sunlit and shaded leaves after correcting the penumbra effects at a specific time during the day. All leaf points were classified as sunlit leaves as long as they were receiving direct solar radiation beams. Otherwise, they would be labeled as shaded leaf points that only received diffuse PAR. Sunlit leaf fraction was computed as the ratio of the number of sunlit leaf points to the total number of leaf points. By dividing a forest canopy into different horizontal layers, we obtained both vertical and horizontal distributions of PAR accordingly, with a height interval of 1 m ranging from 0 m to 7 m. Moreover, we also explored the relationship between the sunlit leaf fraction and effective total path length of light transmission while penetrating through a forest canopy. The fused point cloud-based sunlit leaf fraction was used as a reference to compare with the UAV-LS and TLS-based results, which allowed examination of the effects of point density and laser scanning geometry on estimation accuracy of sunlit leaf fraction.

2.5. Sensitivity Analysis

By comparing the modeled PAR values obtained from TLS, UAV-LS, and fused point data with the field-based pyranometer measurements, we analyzed the effects of lidar scanning geometry on the estimation accuracy of PAR estimates. Additionally, to explore the impact of TLS-based point density on the PAR estimation accuracy, we thinned the raw TLS data with different NPDs of 5 mm, 25 mm, 45 mm, 65 mm, 85 mm, and 100 mm, respectively. In the meantime, we also changed the NPDs of UAV data from 65 mm to 85 mm and 100 mm for comparison purposes.
Moreover, reasonable movements of leaves and branches in the canopy point cloud were made to simulate the canopy movement in the light of existing research results [43], and the effects of leaf movements on the PAR estimation accuracy were investigated. Vaaja et al. [43] proved that there was almost no estimation error of the stem position below 28% of the tree height in wind under 9 m/s, yet the stem movement was more than 0.2 m at the height of 15 m. Correspondingly, in our study area, we thought that branches and leaves below 2.24 m in height were not displaced, while branches and leaves from 2.24 m to 8 m in height would move. It was assumed that the movement distance was linearly related to the leaves’ height, and the movement of branches and leaves at 8 m could reach 0.12 m.
To simplify the model, we considered that branches and leaves were only displaced in the horizontal plane. The canopy point cloud was displaced to the north, the south, the east, and the west to study the influence of leaf movements on the estimation of solar radiation within the forest. New positions ( X , Y , Z )   of a point ( X 0 , Y 0 , Z 0 )   after displacement were as (Equation (8)):
( X ,   Y ,   Z ) =   { ( X 0 ,   Y 0 + 0.12 ( Z 0 2.24 ) / ( 8 2.24 ) ,   Z 0 ) T o   t h e   N o r t h ( X 0 ,   Y 0 0.12 ( Z 0 2.24 ) / ( 8 2.24 ) ,   Z 0 ) T o   t h e   S o u t h ( X 0 + 0.12 ( Z 0 2.24 ) / ( 8 2.24 ) ,   Y 0 ,   Z 0 ) T o   t h e   E a s t ( X 0 0.12 ( Z 0 2.24 ) / ( 8 2.24 ) ,   Y 0 ,   Z 0 ) T o   t h e   W e s t
The estimation accuracy of the modeled and observed PAR was evaluated using the root mean square error (RMSE), slope, mean absolute error (MAE), and the coefficient of determination (R2). All statistical analysis was conducted using the open-source software package R 3.6.3 (R Core Team, 2019).

3. Results

3.1. UAV and TLS Fused Points

We obtained the fused point data by registering the UAV-LS and thinned TLS data to represent the comprehensive forest 3-D structure information. Both UAV-LS and TLS-based point cloud data showed apparent occlusion effects because surfaces were physically blocked (Figure 1d). With the height increasing from ground surface to canopy top, the occlusions decreased from 70% to 2% for UAV-LS data and increased from 0% to 38% for TLS-based data (Figure 4). It was shown that UAV-LS only captured a few lower canopy components, while apparent occlusion effects existed in the upper canopy component of the TLS data.

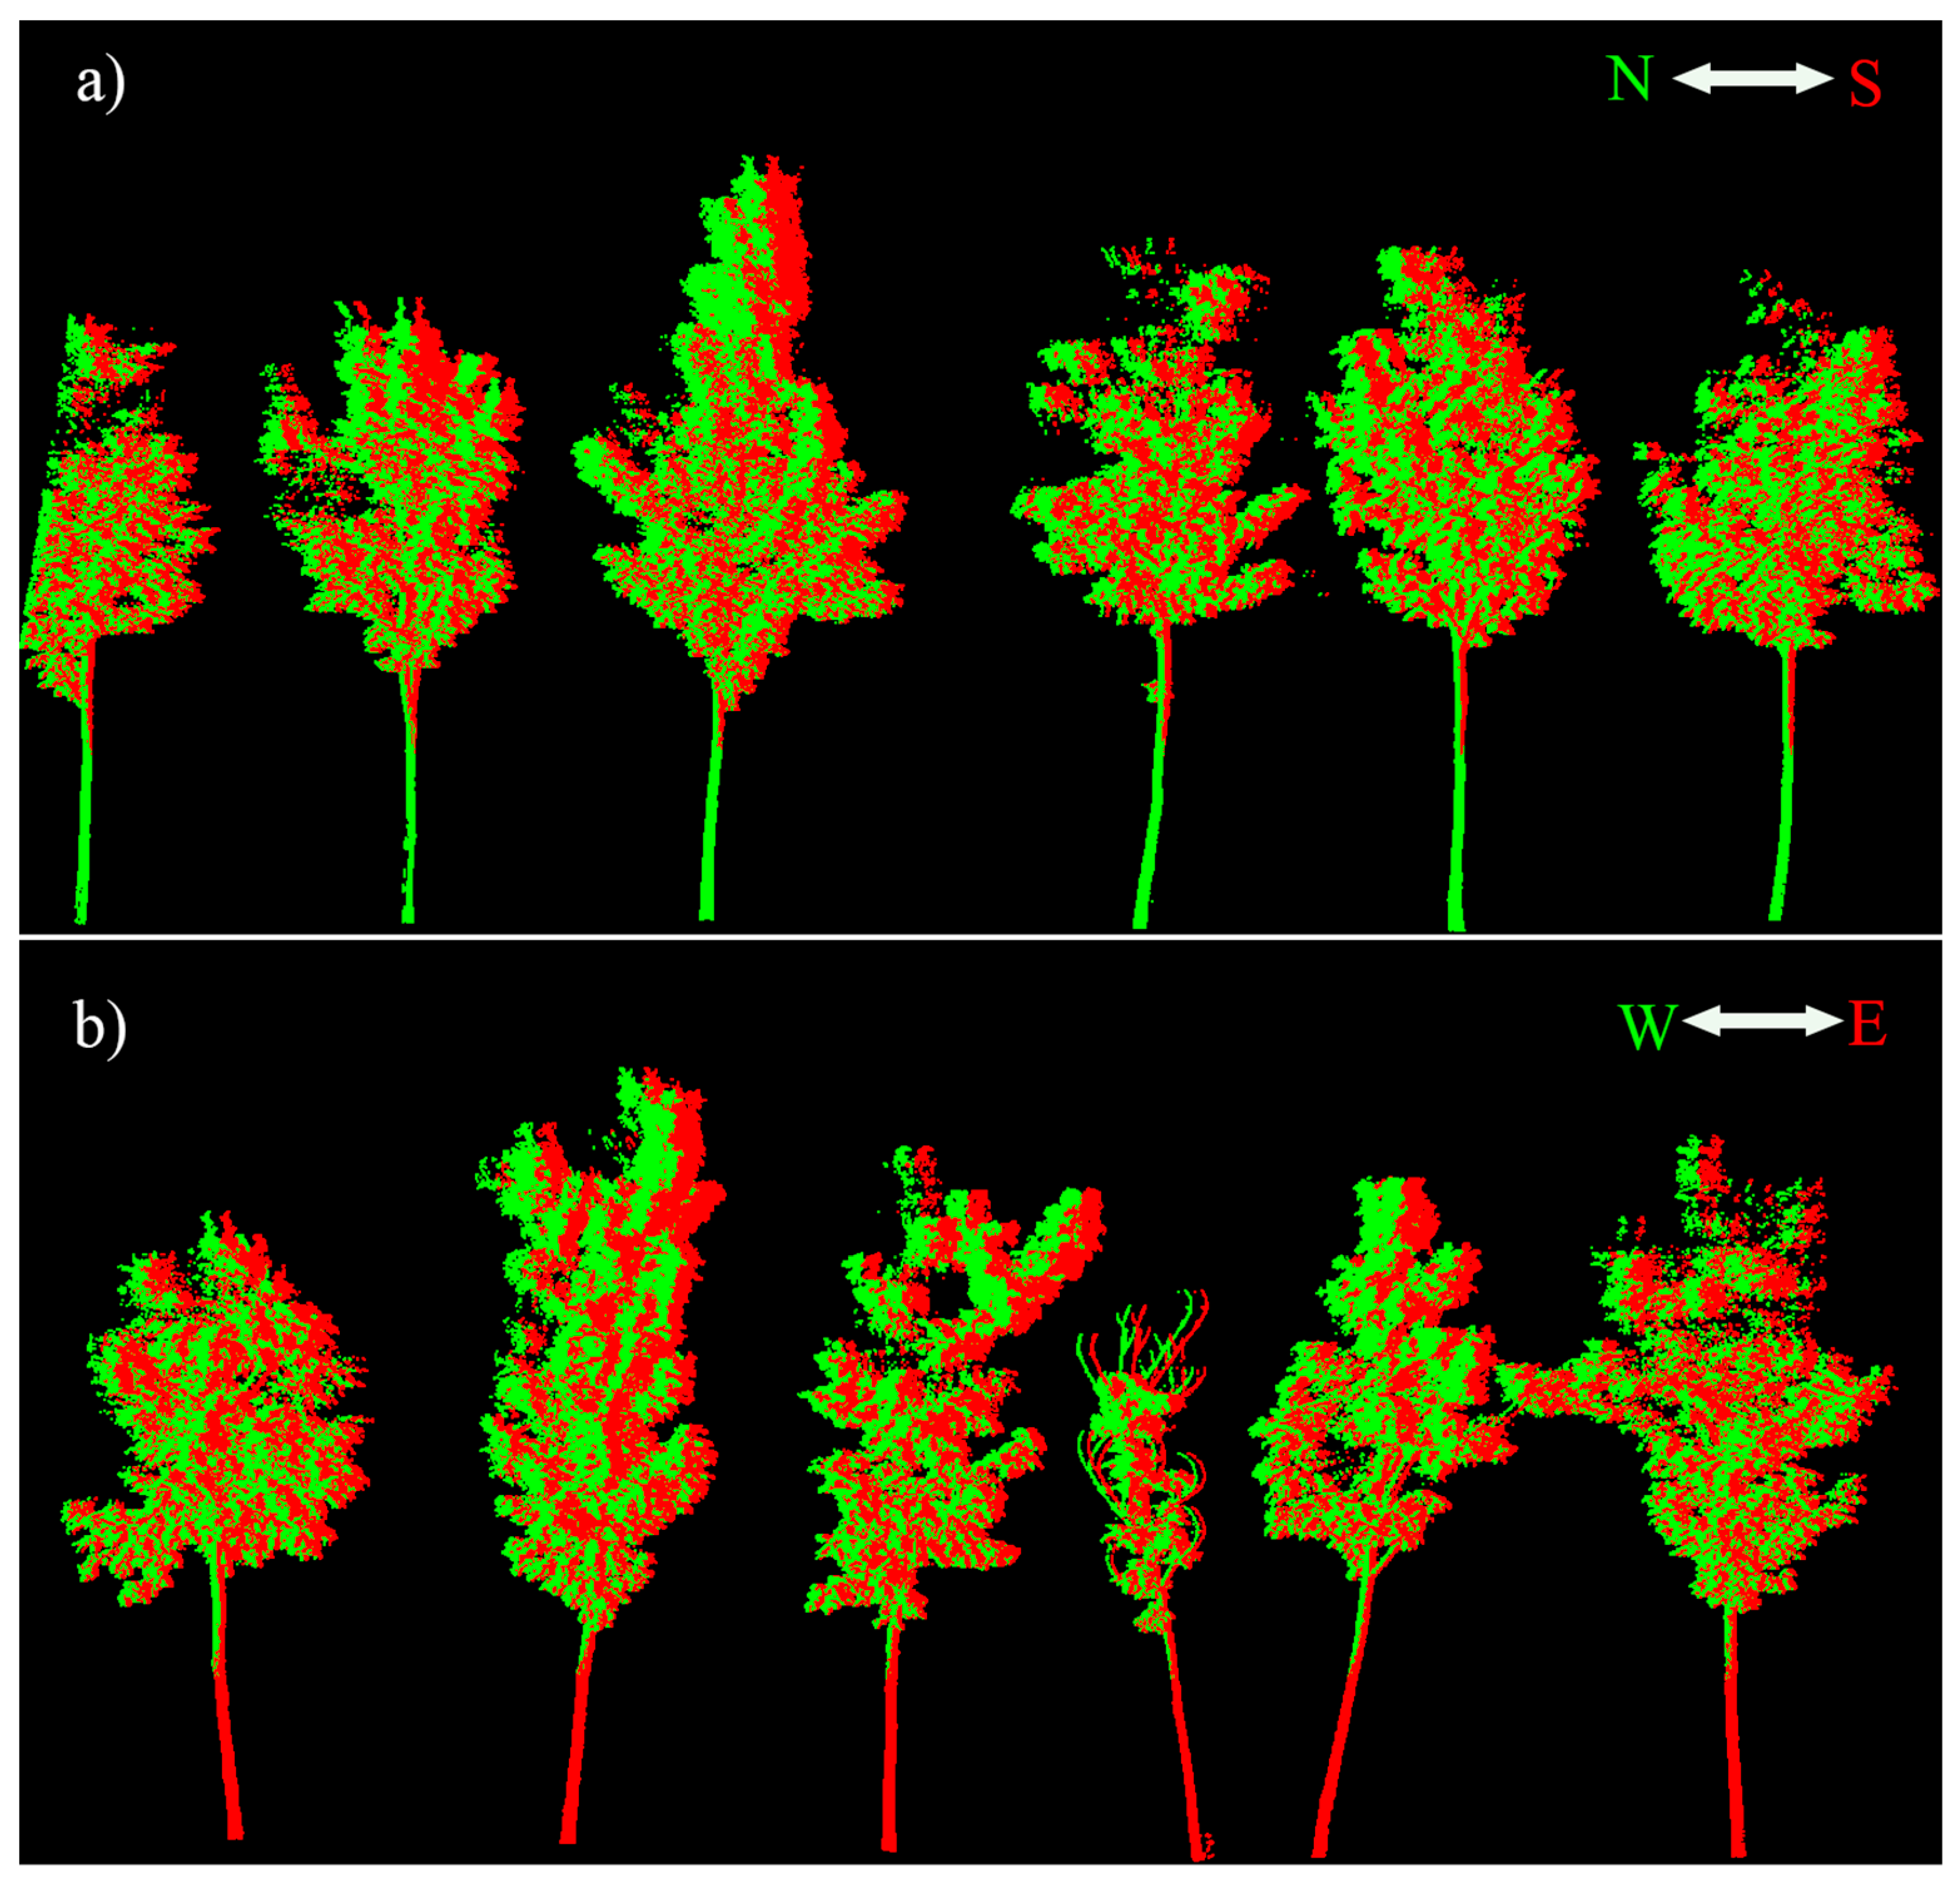
3.2. Forest Point Classification

We classified the fused forest point cloud data into canopy photosynthetic (i.e., green leaves), non-photosynthetic (i.e., stems and branches), and bare earth (Figure 5), based on the local geometric feature using the pointwise classification approach [46]. By comparing with the manually selected ground truth data for the above three different categories, we obtained the producer’s accuracies as 93.56%, 98.92%, and 78.41% for the bare earth, photosynthetic, and non-photosynthetic canopy components, respectively (Table 1). Non-photosynthetic canopy components accounted for 8.5% of total canopy components.

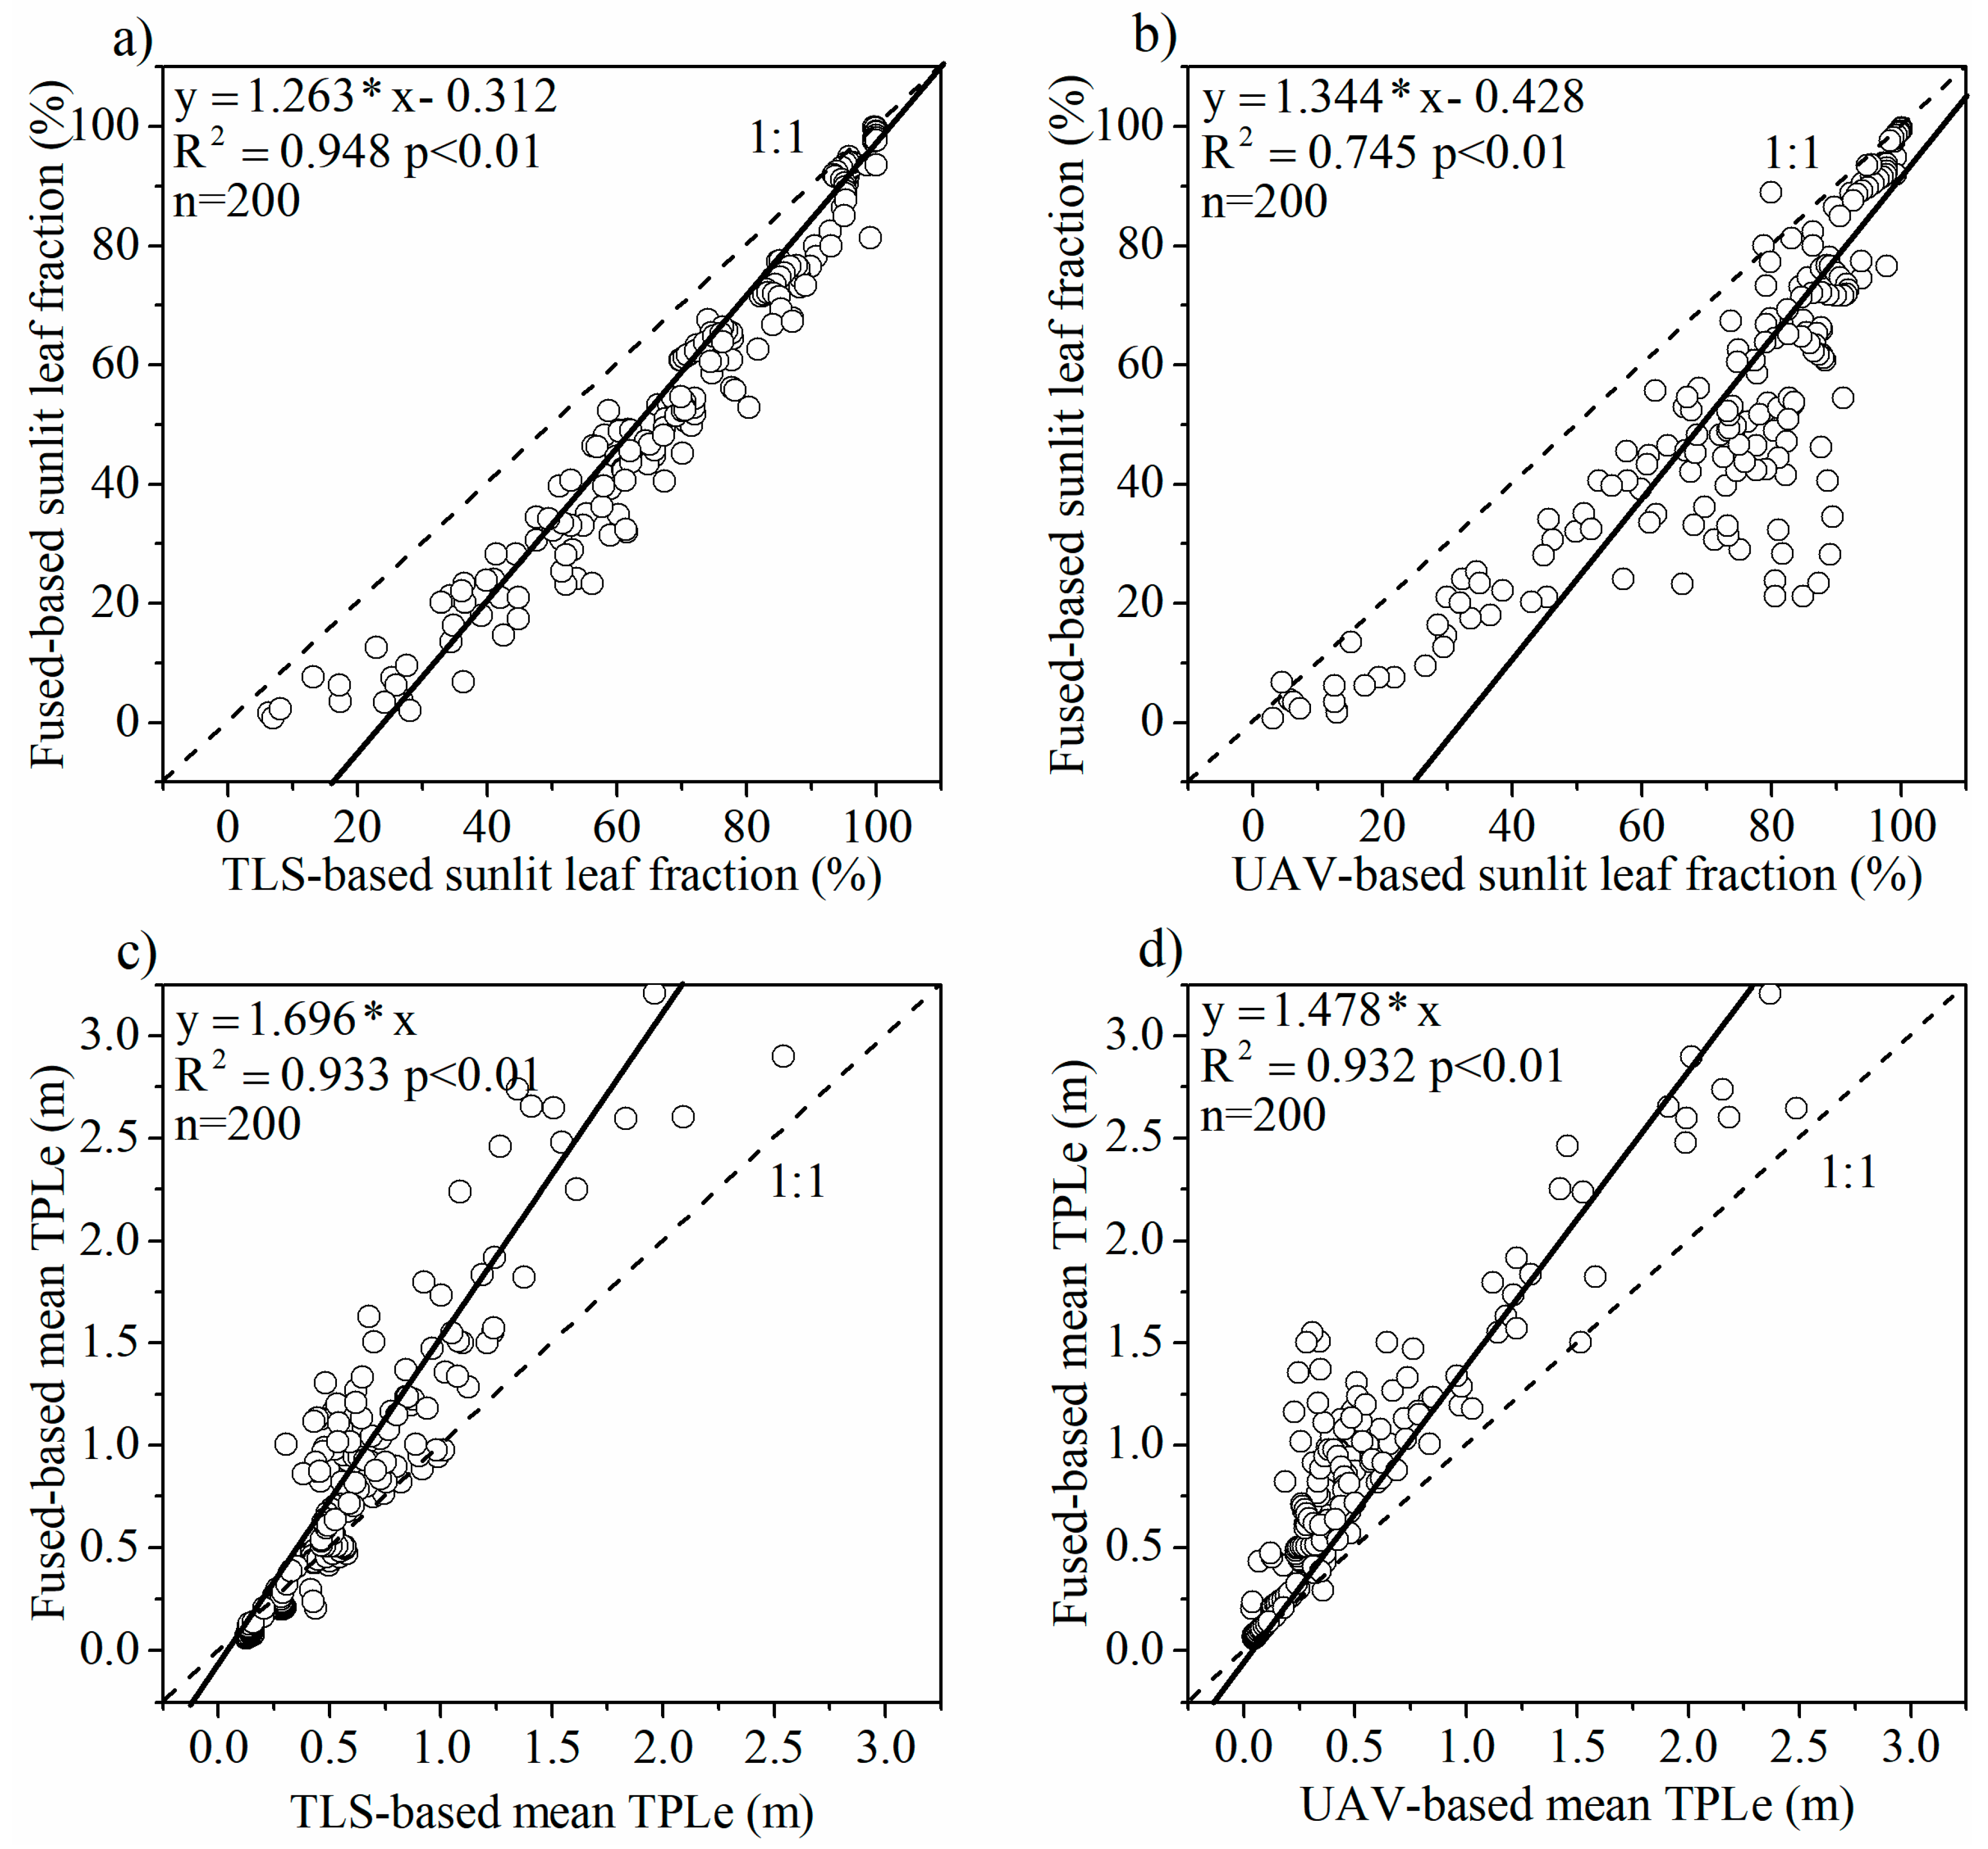
3.3. Sunlit and Shaded Leaves Identification

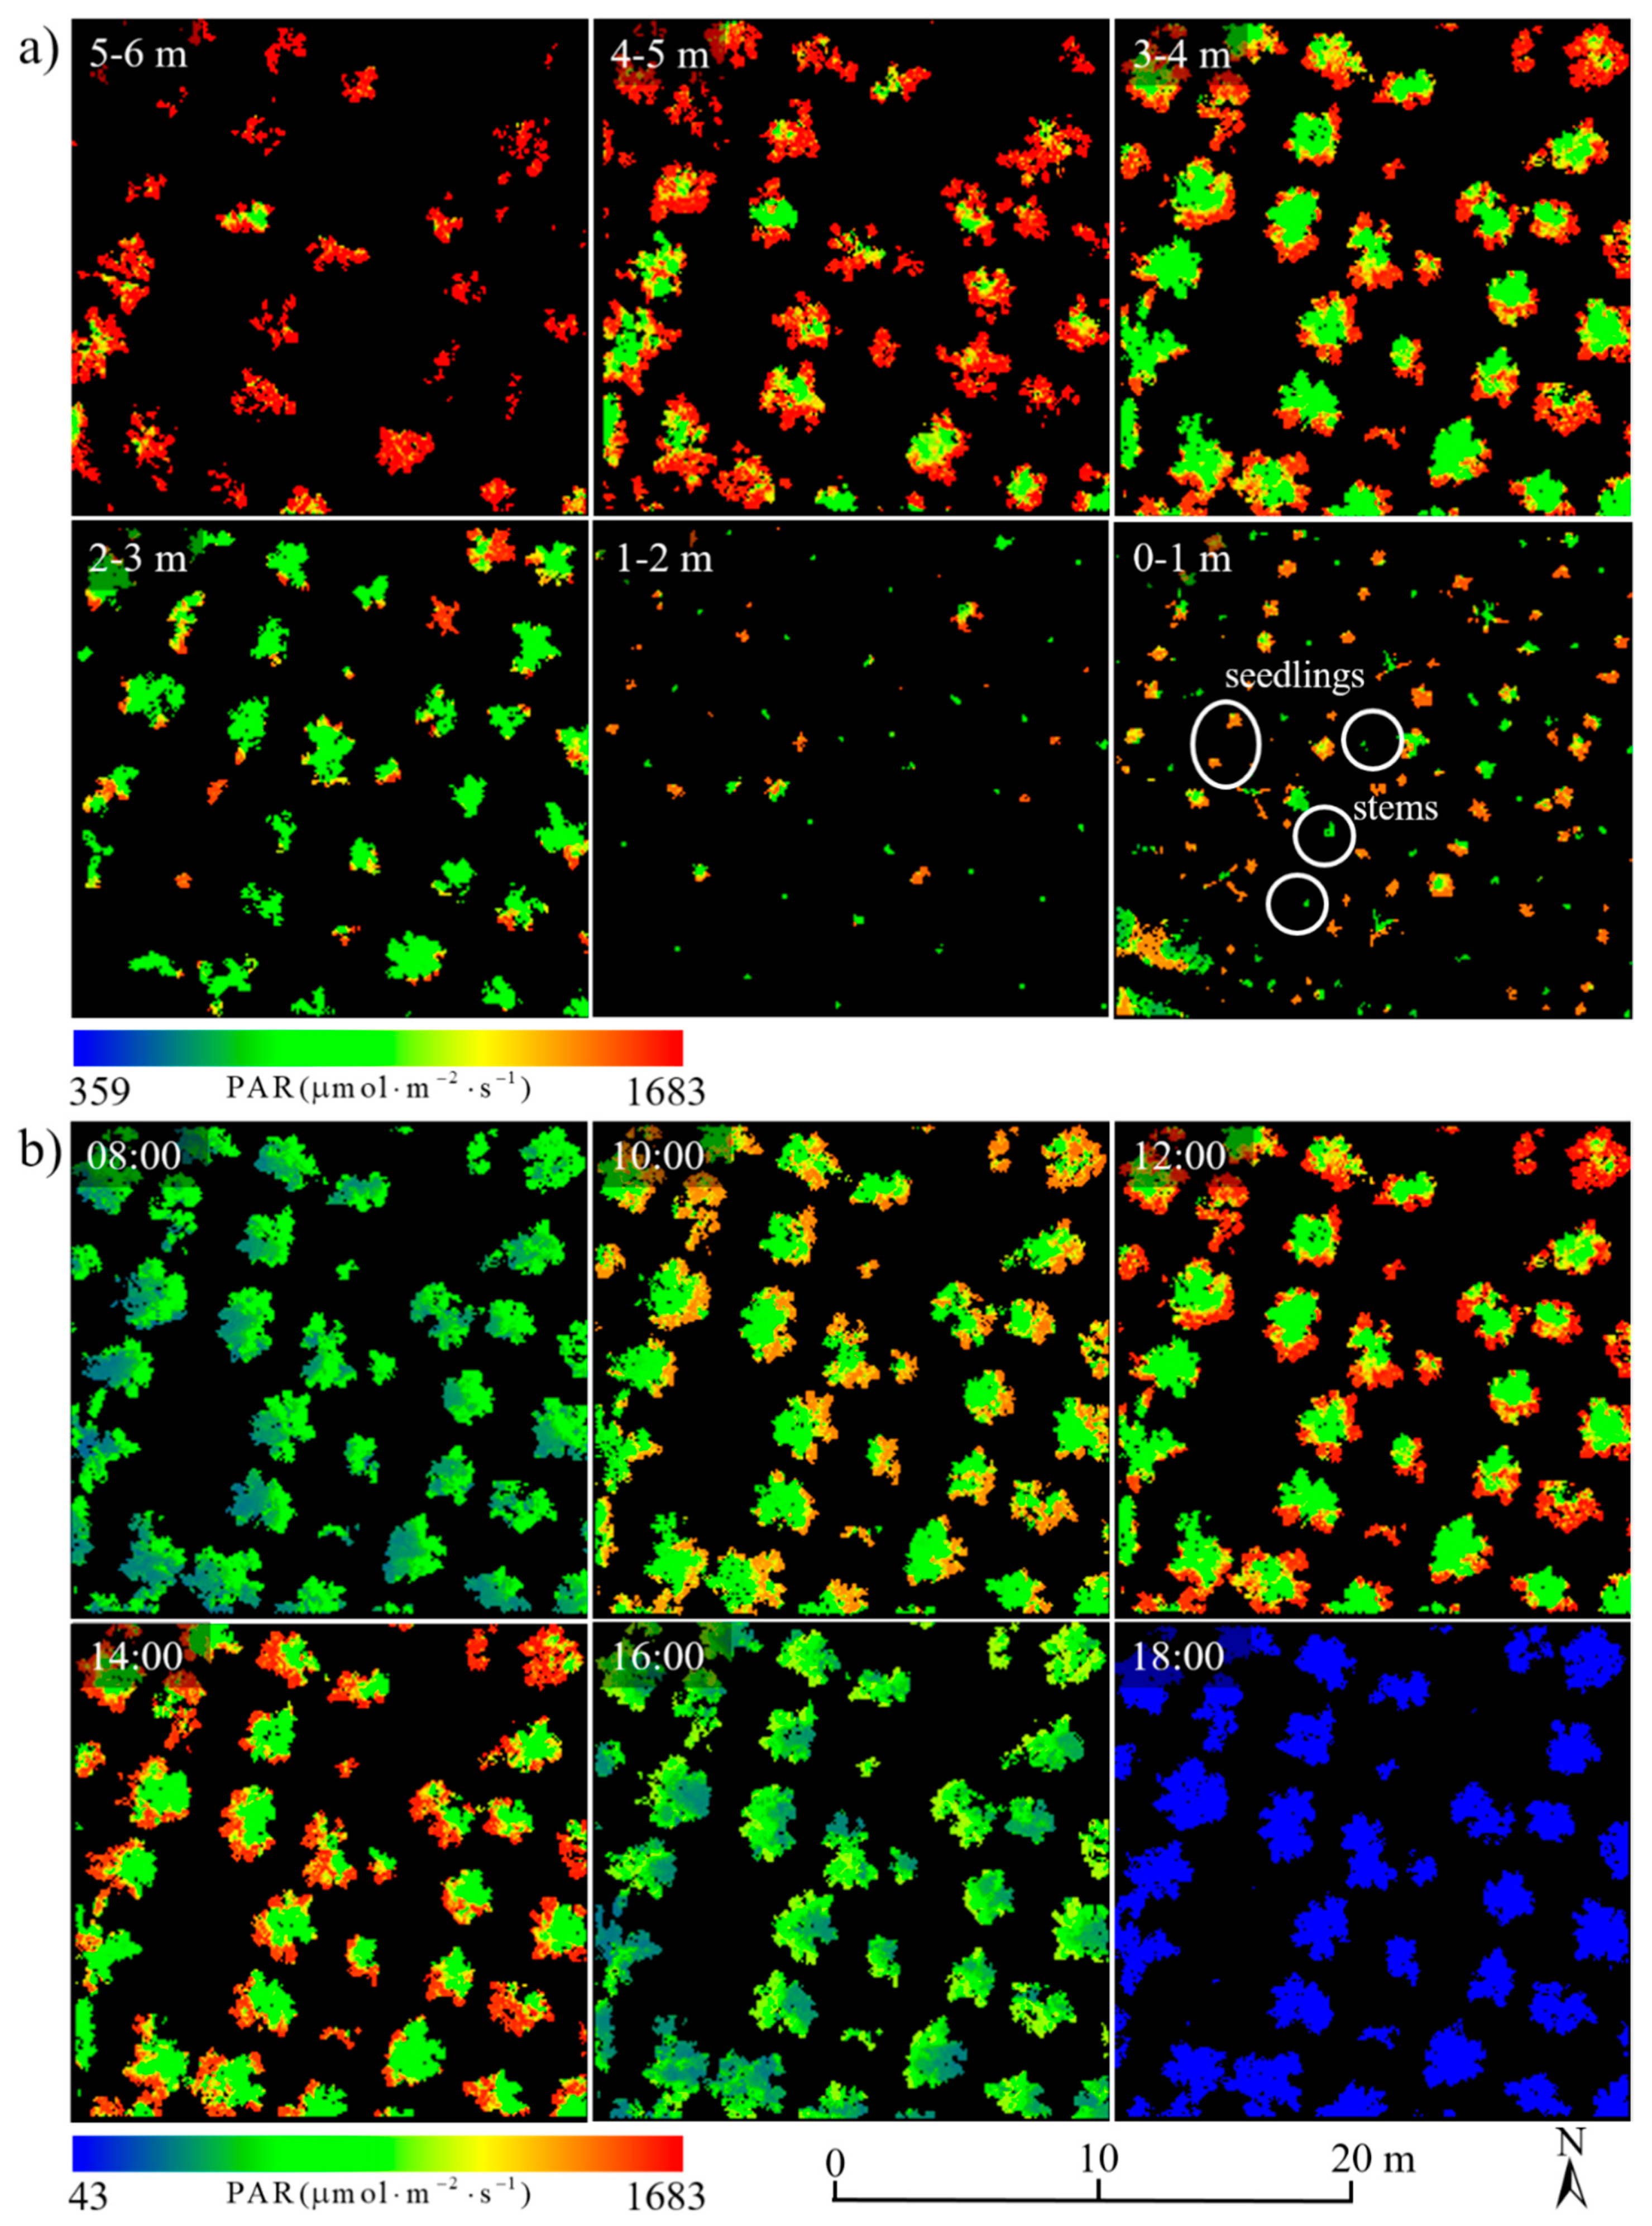
3.3.1. Spatiotemporal Distributions of PAR

After applying the PAR estimation algorithm, as described in Section 2.4.1, we obtained the spatiotemporal distributions of total forest PAR (i.e., direct, diffuse, and scatter PAR) at any point locations of the forest canopies in 3-D space. The forest PAR in different horizontal layers showed distinct heterogeneous distribution patterns, with the height ranging from 0 to 6 m with an interval of 1 m at noon on 28 July 2017 (Figure 6a).
Overall, the forest top canopy received abundant incident PAR, and the proportions of low PAR pixels at horizontal layers tended to increase as the height decreased down to the ground surface. The closer to the tree stems, the lower PAR pixels could be observed due to the little penetration possibilities of PAR through forest canopies, especially for the 2–3 m horizontal layer right above the crown base height (Figure 6a). However, the spatial distribution of forest PAR in the horizontal layers in the ranges of 0–1 m and 1–2 m above the ground surface was different from other horizontal layers due to the existence of seedling trees. Most of the seedlings existed in the first horizontal layers (i.e., 0–1 m), and only a few top crowns of seedlings appeared in the second horizontal layer (i.e., 1–2 m); they both intercepted a lot of incident PAR. In contrast, the tree stems of taller trees were shown as “dots” in the first two horizontal layers and received a weaker intensity of incident PAR due to the crown shading effect (Figure 6a). It was clearly shown that tree trunks received much lower PAR than other surrounding seedling crowns at noon. Moreover, there were apparent temporal variations of the 3-D PAR of forest canopies, with the height ranging from 3 to 4 m at the local time of 8:00, 10:00, 12:00, 14:00, 16:00, and 18:00, respectively (Figure 6b). The temporal variations of forest PAR was first shown to increase in the morning from 8:00 to noon and then decrease. All leaves from the crown boundary area in the 3–4 m horizontal layer received the highest PAR at noon, and the lowest PAR interception was observed at 18:00 when the sun elevation angle reached the lowest point.

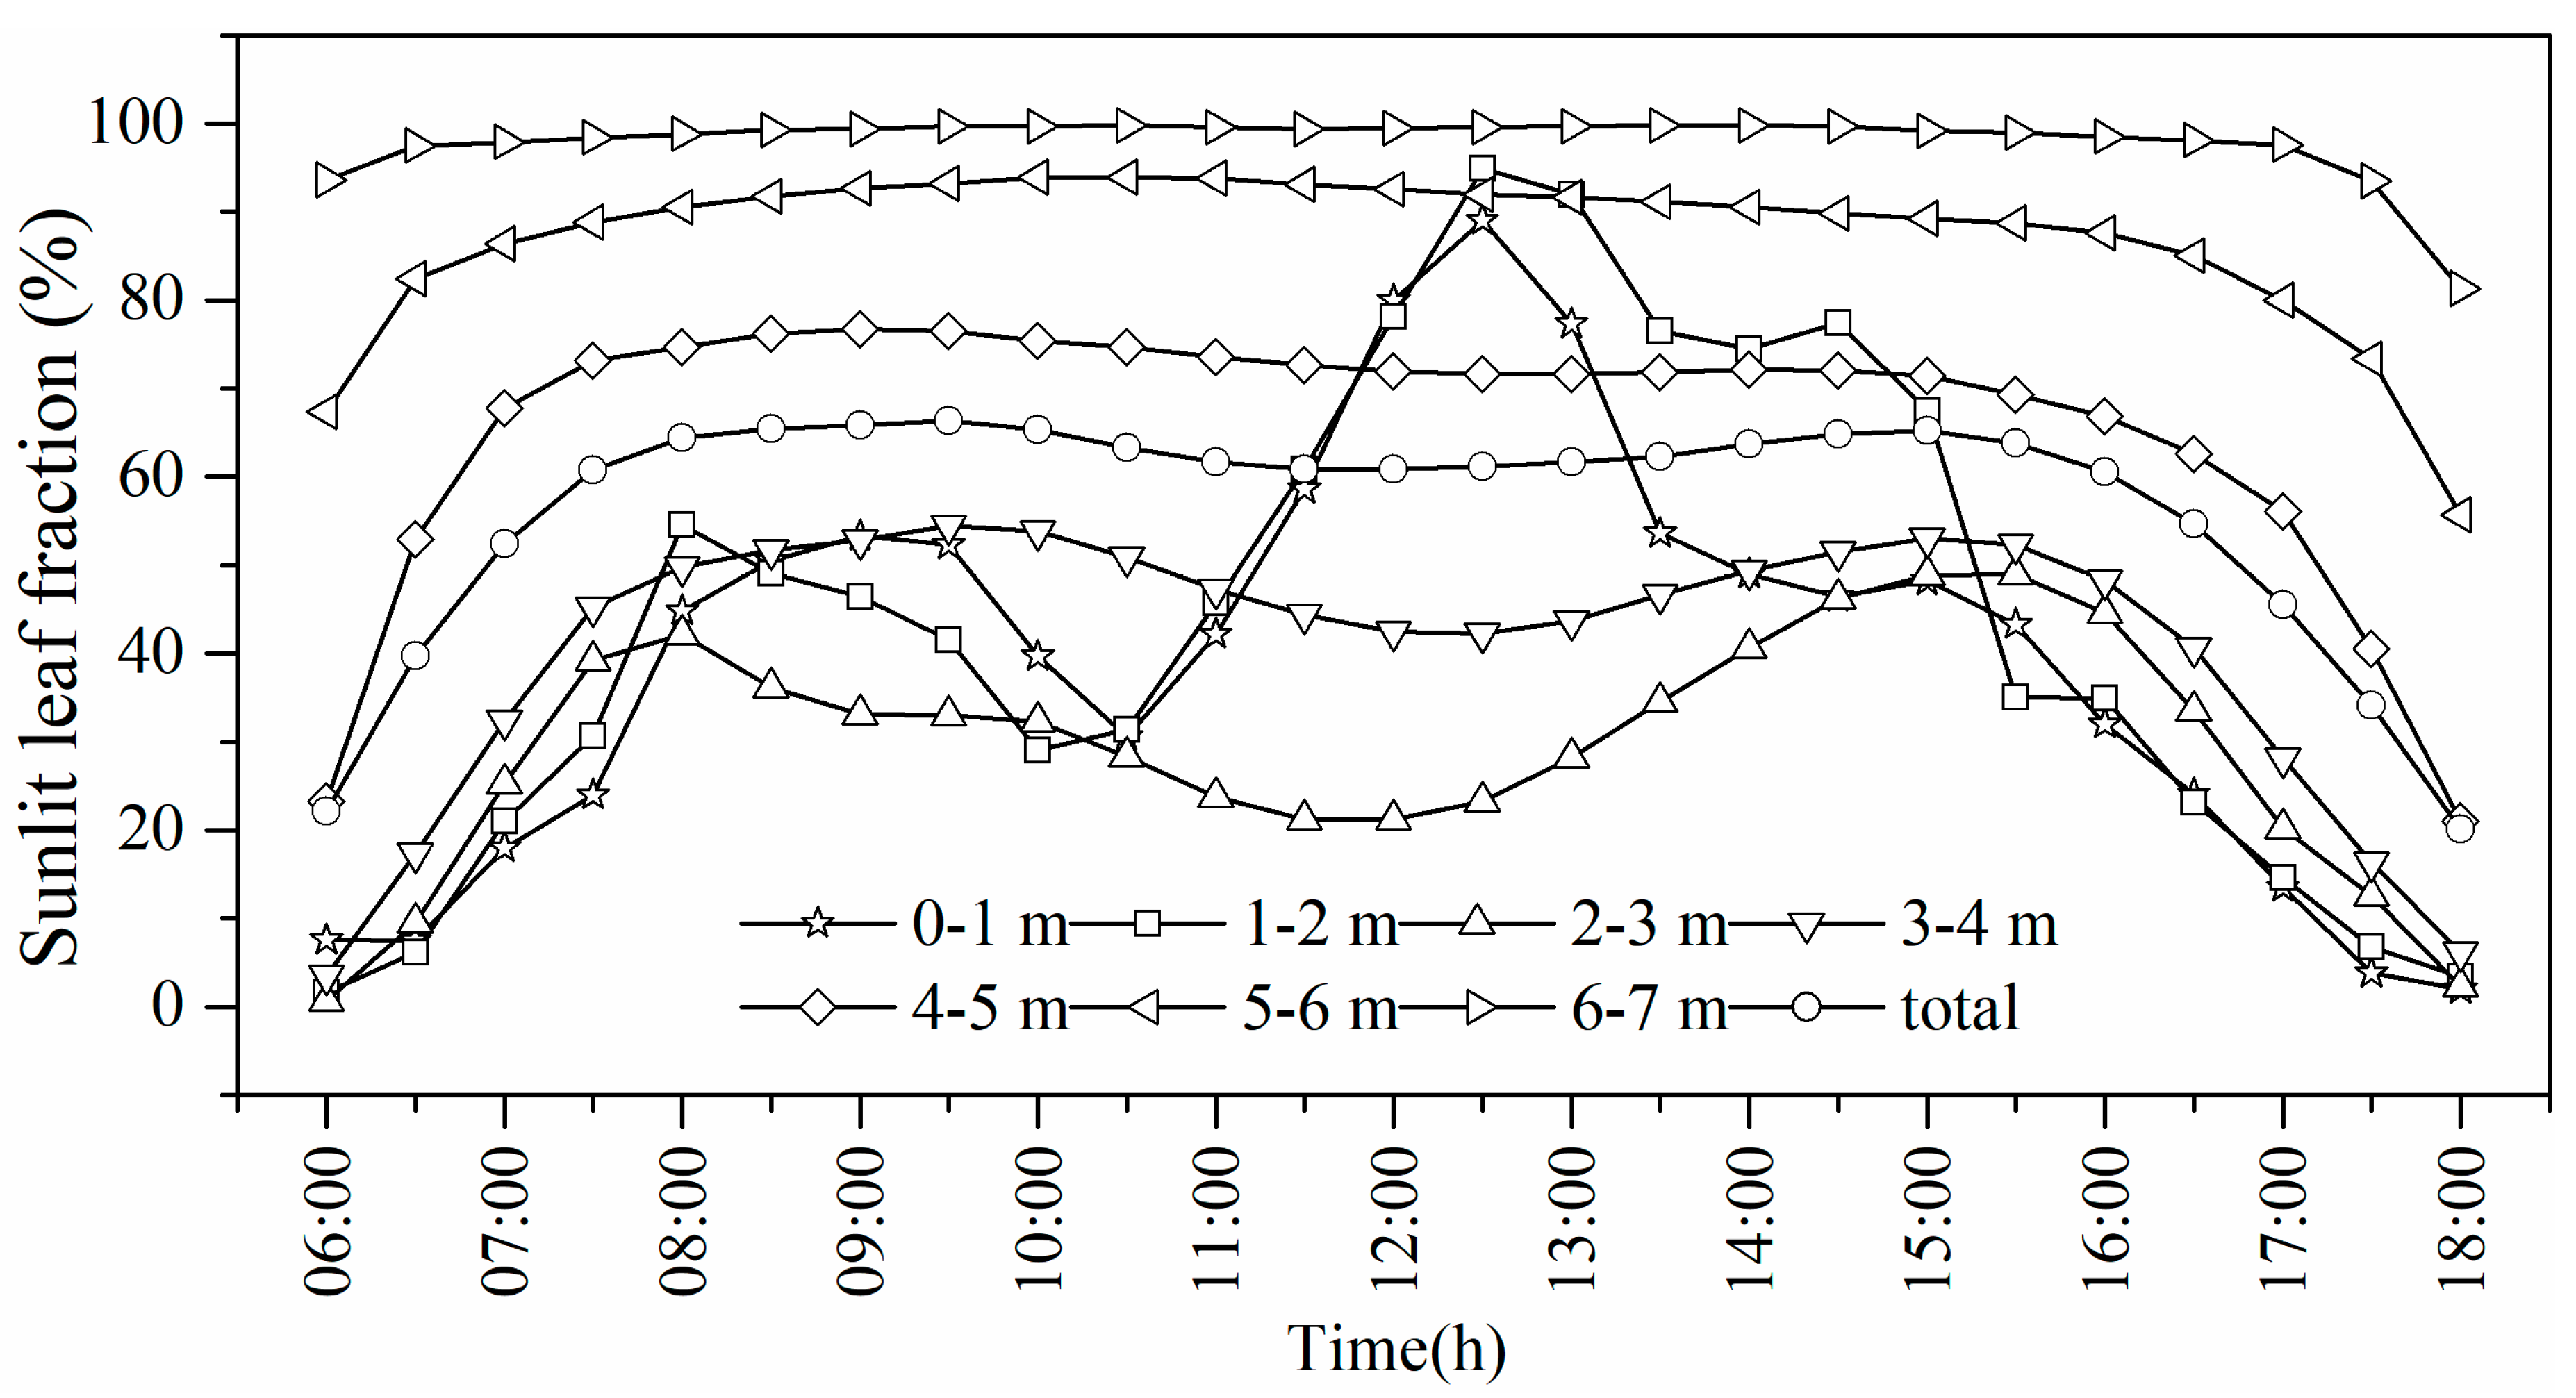
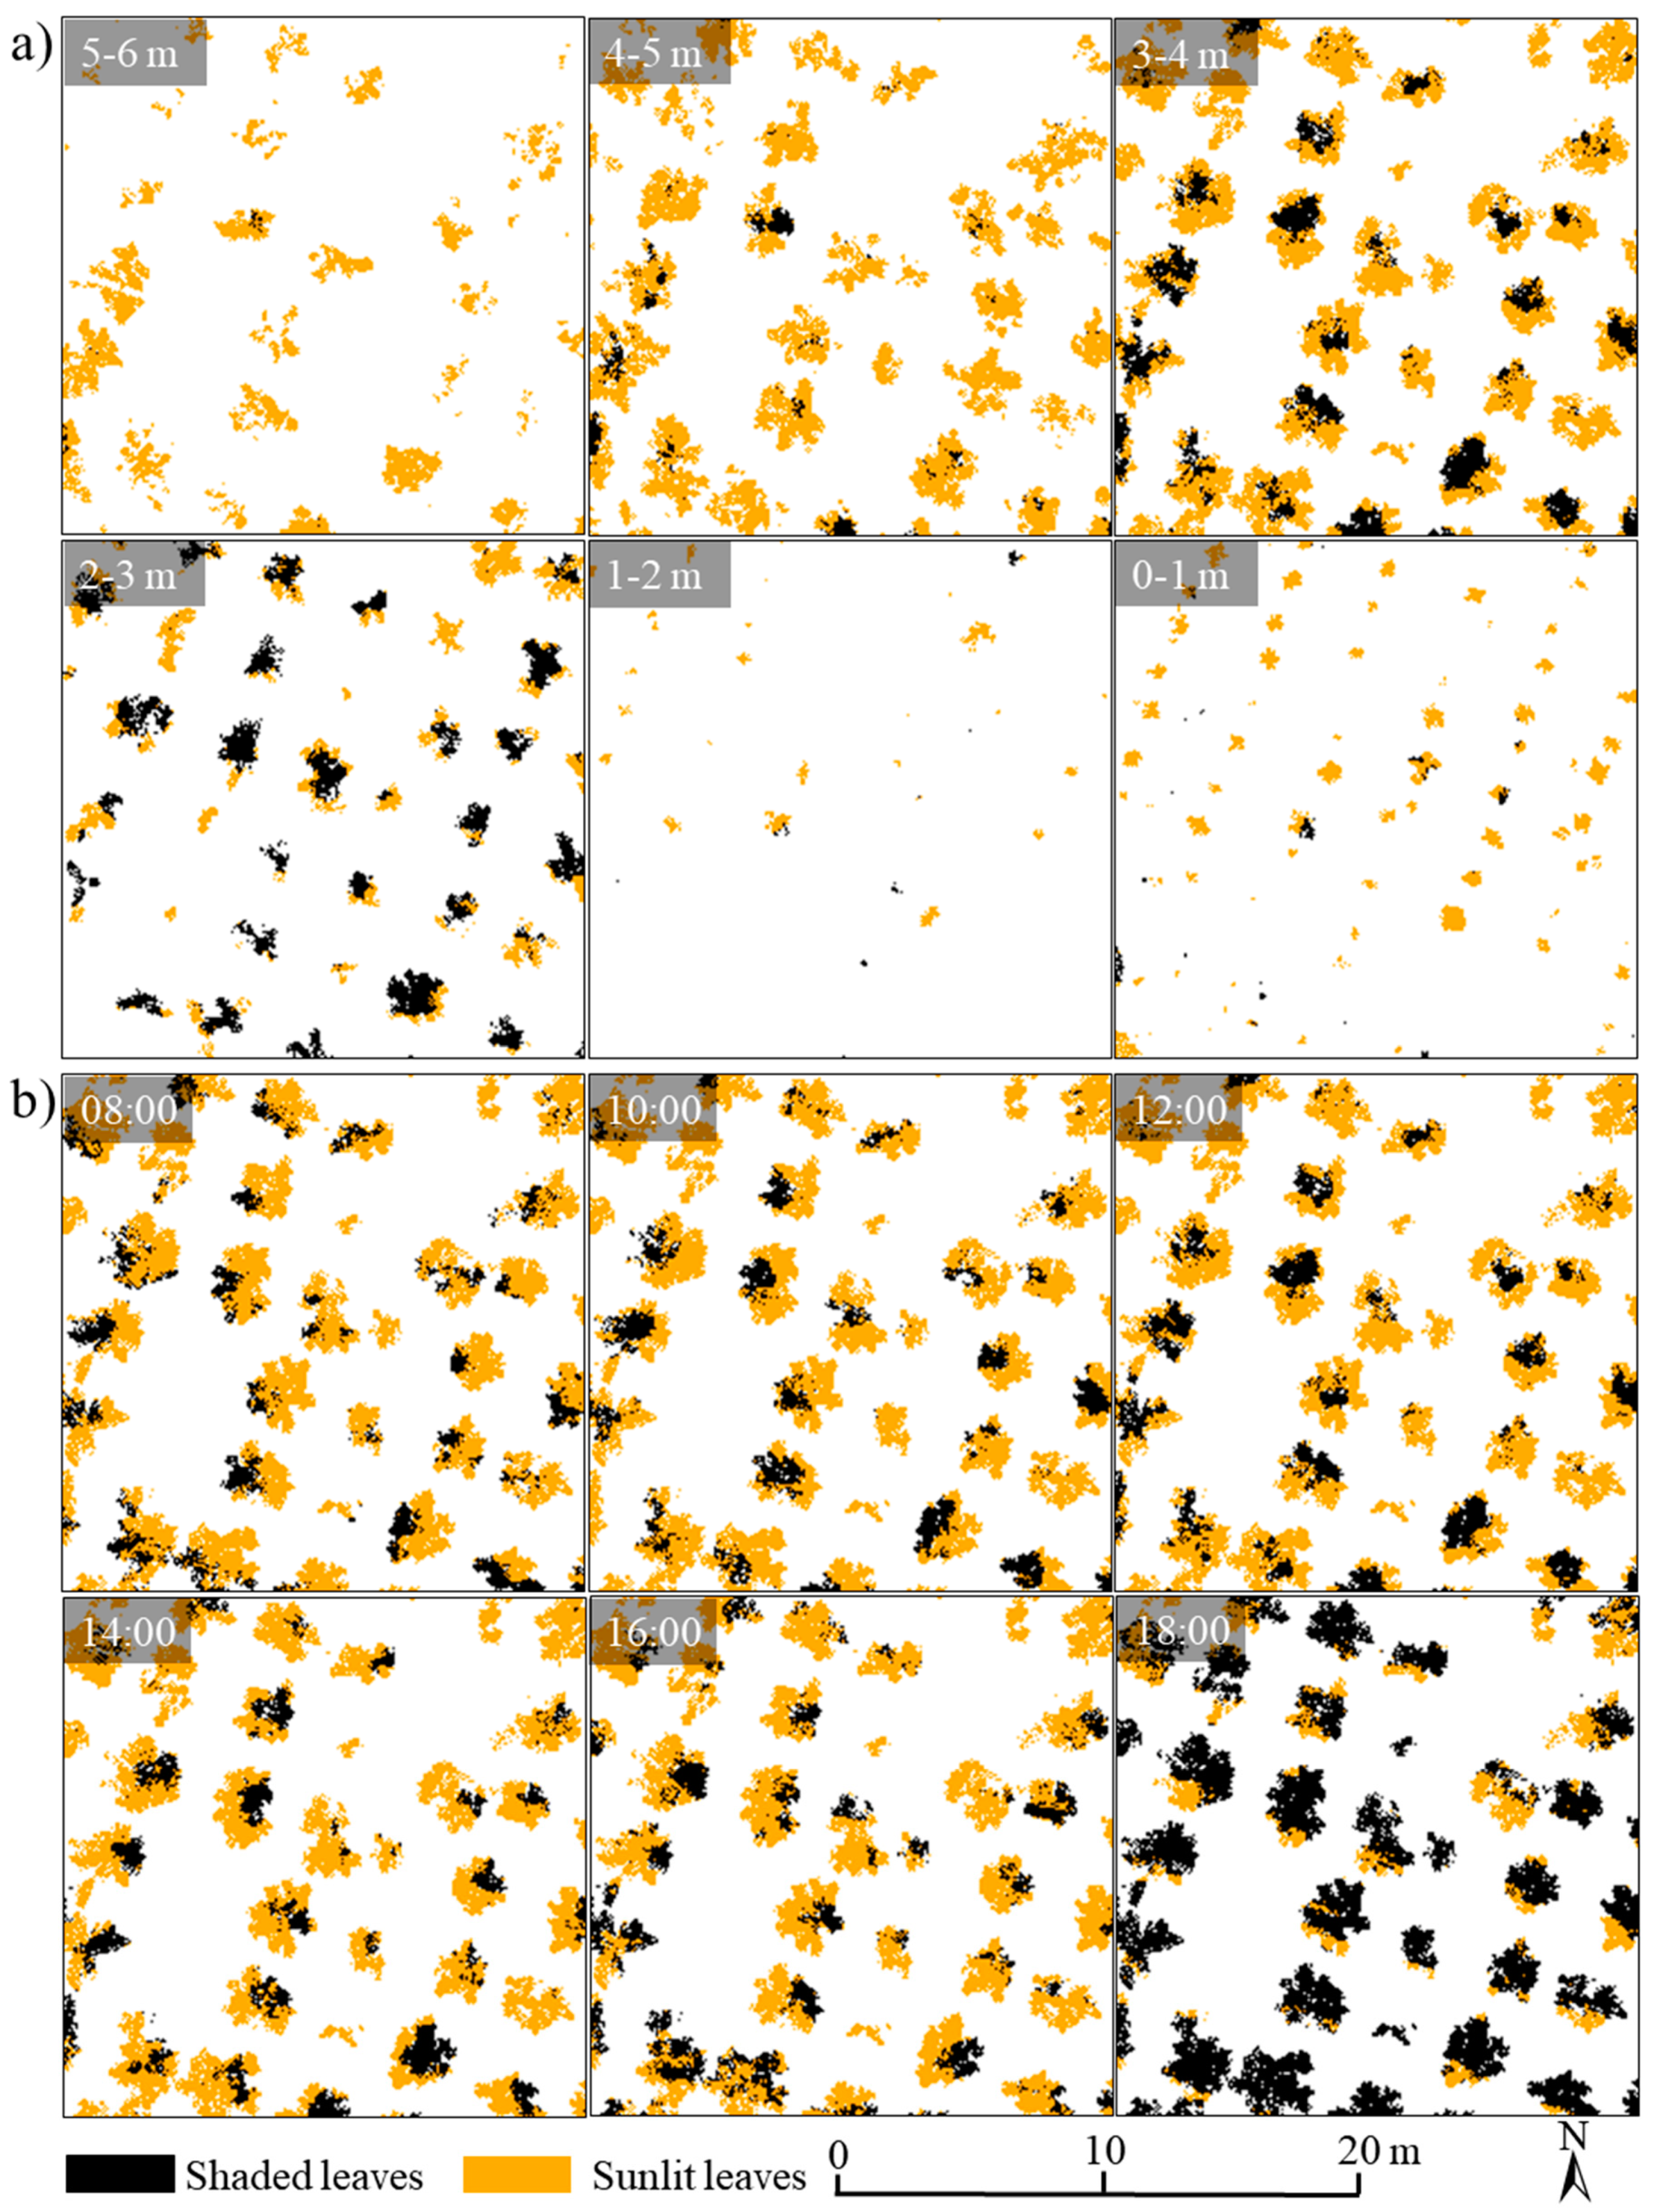
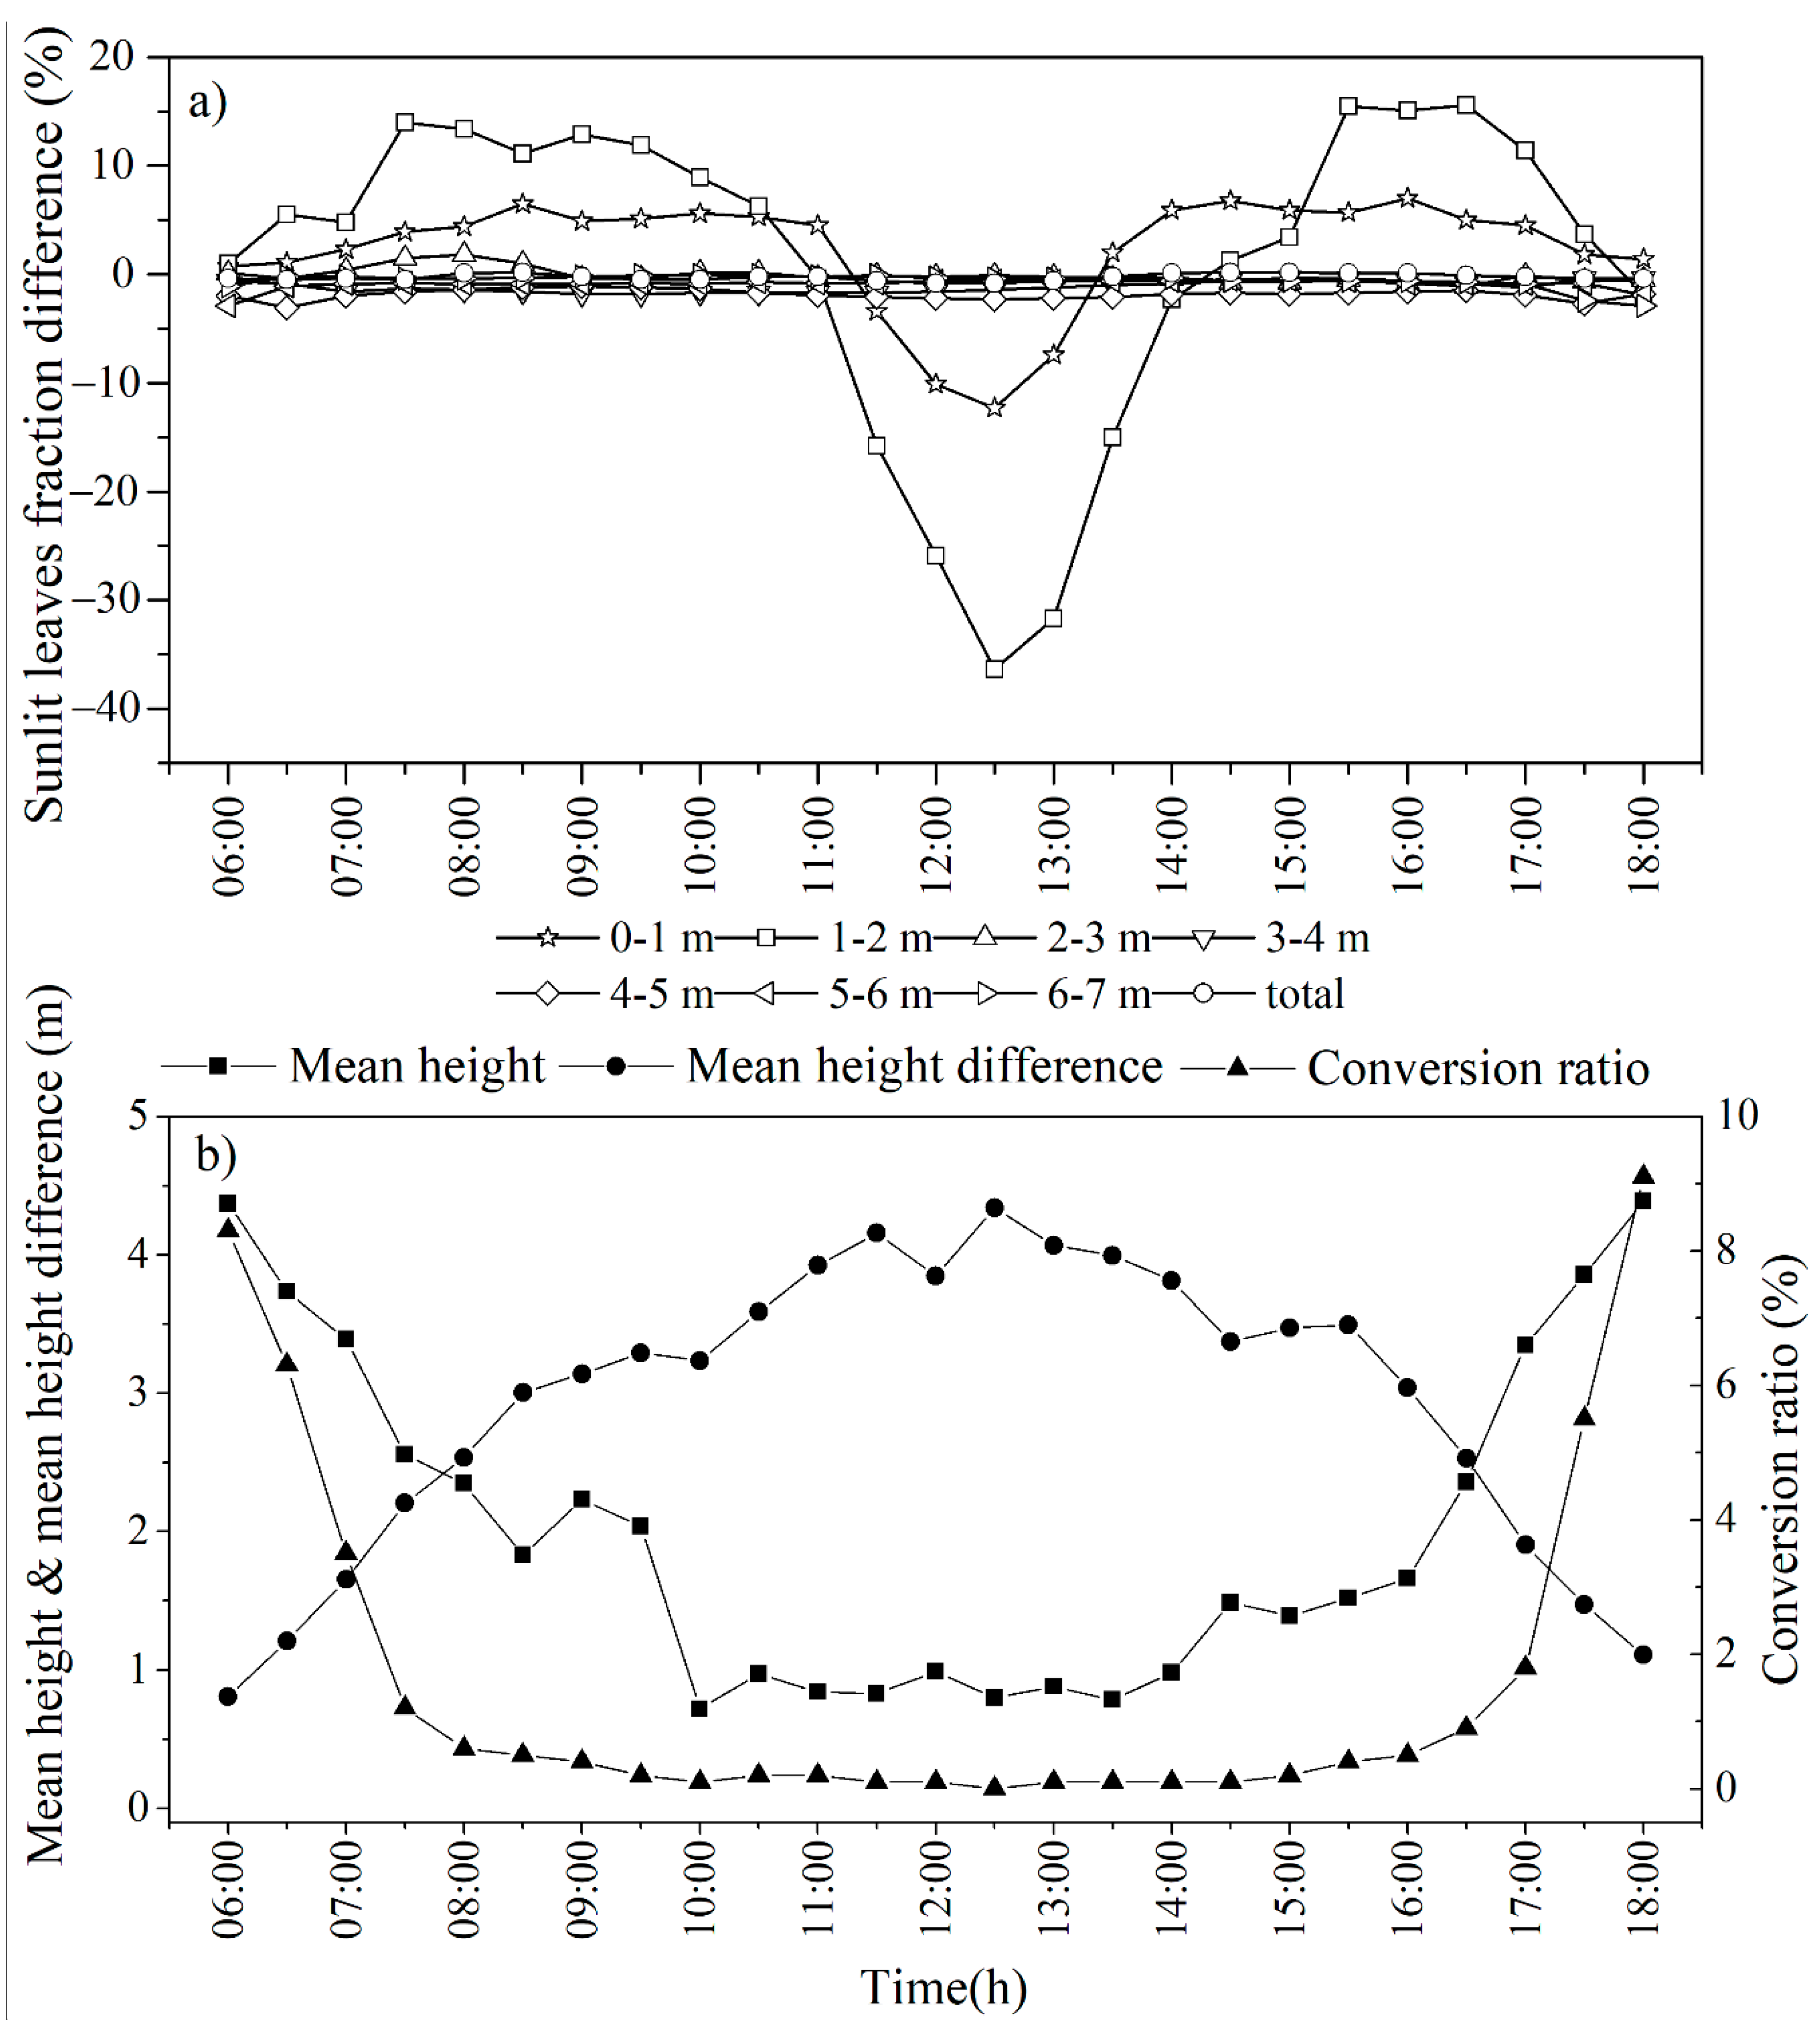
3.3.2. Spatiotemporal Distributions of Sunlit and Shaded Leaves

We obtained the temporal variations of sunlit leaf fractions from 6:00 to 18:00 local time in seven different horizontal layers whose heights ranged from 0 m to 7 m with an interval of 1 m. The general patterns of sunlit leaf fractions held the lowest proportions at sunrise and sunset and remained relatively stable during the daytime (Figure 7). However, the first two horizontal layers (i.e., 0–1 m and 1–2 m) exhibited apparent peak values (i.e., around 85.5% and 93.6%) of sunlit leaf fraction at 12:30 local time and then had a gradually decreased variation pattern. This variation pattern might be attributed to the fact that there was little shadow on seedling crowns in a forest stand with low canopy cover under a high sun elevation angle. Once the horizontal layer’s heights exceeded 2 m, the sunlit leaf fractions of each horizontal layer increased from 21.1%, 43.5%, 70.3%, and 89.4% to 97.1% as the height increased from 2 m to 7 m with the interval of 1 m. At the whole forest canopy level, the sunlit leaf fraction started with 9.5% at 06:00 and gradually increased up to 68.7% and stayed relatively stable through to 15:00, then decreased down to 20.6% at 18:00.
In terms of the 3-D spatial distribution, we mapped the distribution patterns of six horizontal layers with the height ranging from 0 m to 6 m with an interval of 1 m at noon in July 2017 (Figure 8a). The proportions of sunlit leaves in the first horizontal layer (i.e., 0–1 m) were high due to the existence of seedling trees, and the second layer (i.e., 1–2 m) had fewer sunlit leaves distributed in the top of seedling crowns. Moreover, the high crown base height and exclusion of non-photosynthetic canopy components resulted in few leaf points in this layer. As for the third layer (i.e., 2–3 m), the amount of shaded leaves increased because it contained the lower canopy component with little penetrated solar radiation. The shaded leaves were usually distributed in the interior crown, while sunlit leaves spread in the exterior crown. As the heights increased, the proportions of sunlit leaves continued to grow till the fully illuminated canopy top surface. The spatial distribution patterns indicated the heterogeneous PAR regime within and under forest canopies.
In addition, we also mapped the temporal variation of sunlit and shaded leaves distribution patterns for the fourth horizontal canopy layer (i.e., 3–4 m) at the local time from 08:00 to 18:00 with an interval of two hours (Figure 8b). It could be seen that the sunlit leaves were mainly distributed in the incident directions of solar radiation. In contrast, the shaded leaves were primarily distributed in the opposite part.

3.4. Sensitivity Analysis on Sunlit and Shaded Leaves Identification

3.4.1. The Laser Scanning Geometry

The scatter plot between observed and predicted sub-canopy PAR underlay the positively correlated relationship between the modeled and observed PAR, although the predicted values were slightly lower than the observations (Figure 9a). To test the effects of laser scanning geometry on estimation accuracy of forest PAR, we evaluated the TLS-, UAV-LS, and fused point cloud-based forest PAR values with the field-based pyranometer measurements based on the fit statistics of four models. Overall, the fused point cloud-based forest PAR provided the best (R2 > 0.80, RMSE ≤ 200 μ m o l m 2 s 1 , MAE ≤ 121 μ m o l m 2 s 1 , and bias = −79~28 μ m o l m 2 s 1 ) estimation results among the three different datasets at nine different measurement locations (Figure 9b). In the meantime, the TLS-based PAR estimations were not as good as the one obtained from fused point data, but they were better than the ones computed from only the UAV-LS-based results. The R2 values of TLS-based PAR ranged from 0.80~0.95 (RMSEs = 118~209 μ m o l m 2 s 1 ), while the UAV-LS based ones changed from 0.75 to 0.95 (RMSEs = 133~225 μ m o l m 2 s 1 ). Moreover, the MAEs of TLS-based PAR (i.e., 75~127 μ m o l m 2 s 1 ) were smaller than the ones computed based on the UAV-LS data (i.e., 84~139 μ m o l m 2 s 1 ). Estimated PAR, based on the TLS, UAV-LS, and fused point cloud, all correlated positively with the field-based PAR observation.
To test the influence of laser scanning geometry on the estimation accuracy of sunlit leaf fraction, we evaluated the TLS- and UAV-LS point cloud-based sunlit leaf fraction with the fused point cloud-based sunlit leaf fraction. The TLS-based sunlit leaf fractions showed more significant (R2 = 0.948, n = 200, slope = 1.263, p < 0.01) (Figure 10a) correlations with the results obtained from the fused point data compared with the UAV-LS based statistical relationship (R2 = 0.745, n = 200, slope = 1.344, p < 0.01) (Figure 10b). We compared the TLS and UAV-LS-based mean effective total path lengths with the ones obtained from the fused point data using the method described in Section 2.2.3 (Figure 10c,d). From the results, it is clear that the UAV-LS and TLS-based TPLe tended to underestimate the one computed from fused point data. The most obvious differences between the UAV-LS and fused point data were at the crown base height horizontal layer (i.e., 2–3 m) due to the most severe occlusion and lots of missing points. Compared with the fused point data, UAV-LS and TLS-based fractions of sunlit leaves were overestimated by 34.3% and 21.6%, on average.

3.4.2. The Point Density

As shown in Table 2, the TLS-based sunlit leaf fractions with the NPD of 5 mm were closest to the ones computed from the TLS data with an NPD of 25 mm. With the NPDs increasing, the sunlit leaf fractions in both horizontal layer and whole forest canopy levels continued to increase, except for the first (i.e., 0–1 m) and second (i.e., 1–2 m) horizontal layers. Furthermore, we analyzed the RMSEs of TLS- and UAV-LS based PAR computed with various NPDs. The RMSEs for TLS-based PAR computed with point density changed from 5 mm to 100 mm and were from 125 μ m o l m 2 s 1 to 167 μ m o l m 2 s 1 . As the average UAV-LS point density increased from 65 mm to 100 mm, RMSEs increased from 156 μ m o l m 2 s 1 to 205 μ m o l m 2 s 1 . The point density variation also affected the identification of sunlit and shaded leaves. Sunlit leaf fractions were overestimated by 23.5% as the TLS point density changed from 5 mm to 100 mm (Table 2), and by 7.7% as the UAV-LS point density increased from 65 mm to 100 mm.

3.4.3. Woody Materials

Through comparing the sunlit leaf fractions computed using the “whole forest” and “leaf-only” data, it was found that the sunlit leaf fraction differences ranged from −36.4% to 15.6% (i.e., 1–2 m) and from −12.3% to 6.8% (i.e., 0–1 m) during the day, and the maximum differences were observed around noon (Figure 11a). However, as for the overstory, relatively small sunlit leaf fraction differences could be observed through a whole day.

3.4.4. Penumbra Areas

Penumbra effects converted partially shaded points into sunlit ones by introducing direct PAR. The height difference between two objects along a light transmission path plays a vital role in the penumbra size estimation. Based on the procedures described in Section 2.4.2, we computed the mean height of the shaded leaf points that were converted into sunlit leaves after considering the penumbra effects during a daily sun course (hereafter refer as “converted leaf points”). As shown in Figure 11b, the mean heights of converted leaf points were 4.37 m and 4.38 m at local time 06:00 and 18:00, respectively. The mean height gradually decreased as the sun elevation angles increased and reached the minimum value of 0.72 m at 10:00 and stayed under 1 m from 10:00 to 14:00, then increased up to the peak value of 4.38 m.
Moreover, we investigated the vertical distributions of “converted leaf points” and upper sunlit leaf point clusters by computing the mean height differences between the “qualified penumbra leaf points” and the center point of sunlit leaf point clusters during a daily sun course (Figure 11b). The mean height differences started with 0.81 m at 06:00 and gradually increased up to 4.34 m at 12:30 with the decrease of solar zenith angle. At 18:00, it then decreased down to 1.11 m. In terms of the conversion ratio, they held the high-level values of 8.3% and 9.1% at local time 06:00 and 18:00, respectively. The minimum value was 0.1% at 12:30 and stayed below 1% from 08:00 to 16:30 during the day (Figure 11b).

3.4.5. Leaf Movements

As shown in Figure 12, the lower stems hardly swayed, but the upper canopy moved more from the original position. In particular, an obvious position offset could be seen in the top part of the trees. The maximum distance between the northward/eastward offset extreme and the southward/westward offset extreme could reach 0.24 m. To test the effects of leaf movements on estimation accuracy of forest PAR, we compared the north-, south-, east-, and west-displaced point cloud-based forest PAR values with the field-based pyranometer measurements. Displaced point cloud-based forest PAR estimation accuracies were a little bit worse (RMSEs = 160~166 μ m o l m 2 s 1 , R2 = 0.81~0.83, MAEs = 115~121 μ m o l m 2 s 1 , bias = −27~−20 μ m o l m 2 s 1 ) than the non-displaced point cloud-based forest PAR.
To test the effects of leaf movements on sunlit leaf fractions, we compared differences between sunlit leaf fractions calculated based on displaced point clouds and the reference one calculated based on the non-displaced point cloud. As shown in Table 3, leaf movements would result in a slight reduction of sunlit leaf fractions during a daily sun course. However, for north- and south-, and east- and west-displaced point cloud, effects of leaf movements in the opposite direction on sunlit leaf fractions were different at some time. Differences between the effects of the north- and south-displaced point cloud on the decrease of sunlit leaf fractions were very small at 6:00, 8:00, 10:00, 14:00, 16:00, and 18:00 (<0.3%), but that difference was relatively high at 12:00 (0.7%). Differences between effects of the east- and west-displaced point cloud on the decrease or increase of sunlit leaf fractions were very small at 6:00, 8:00, 12:00, 16:00, and 18:00 (<0.5%), but that difference was relatively high at 10:00 and 14:00 (1.1%).

4. Discussion

Through the sensitivity analysis on the sunlit and shaded leaf identification, we found that both the penumbra area and the decrease in point density increased the sunlit leaf fraction, while the sunlit leaf fraction was reduced in different degrees due to leaf movements and point cloud fusion. Furthermore, the effect of woody materials on the identification of sunlit leaves changed with the canopy height. To better understand how these factors caused variations of sunlit leaves distribution, in the following sections, we discuss the effects of laser scanning geometry, data point density, woody materials, penumbra areas, and leaf movements on identifying sunlit and shaded leaves:

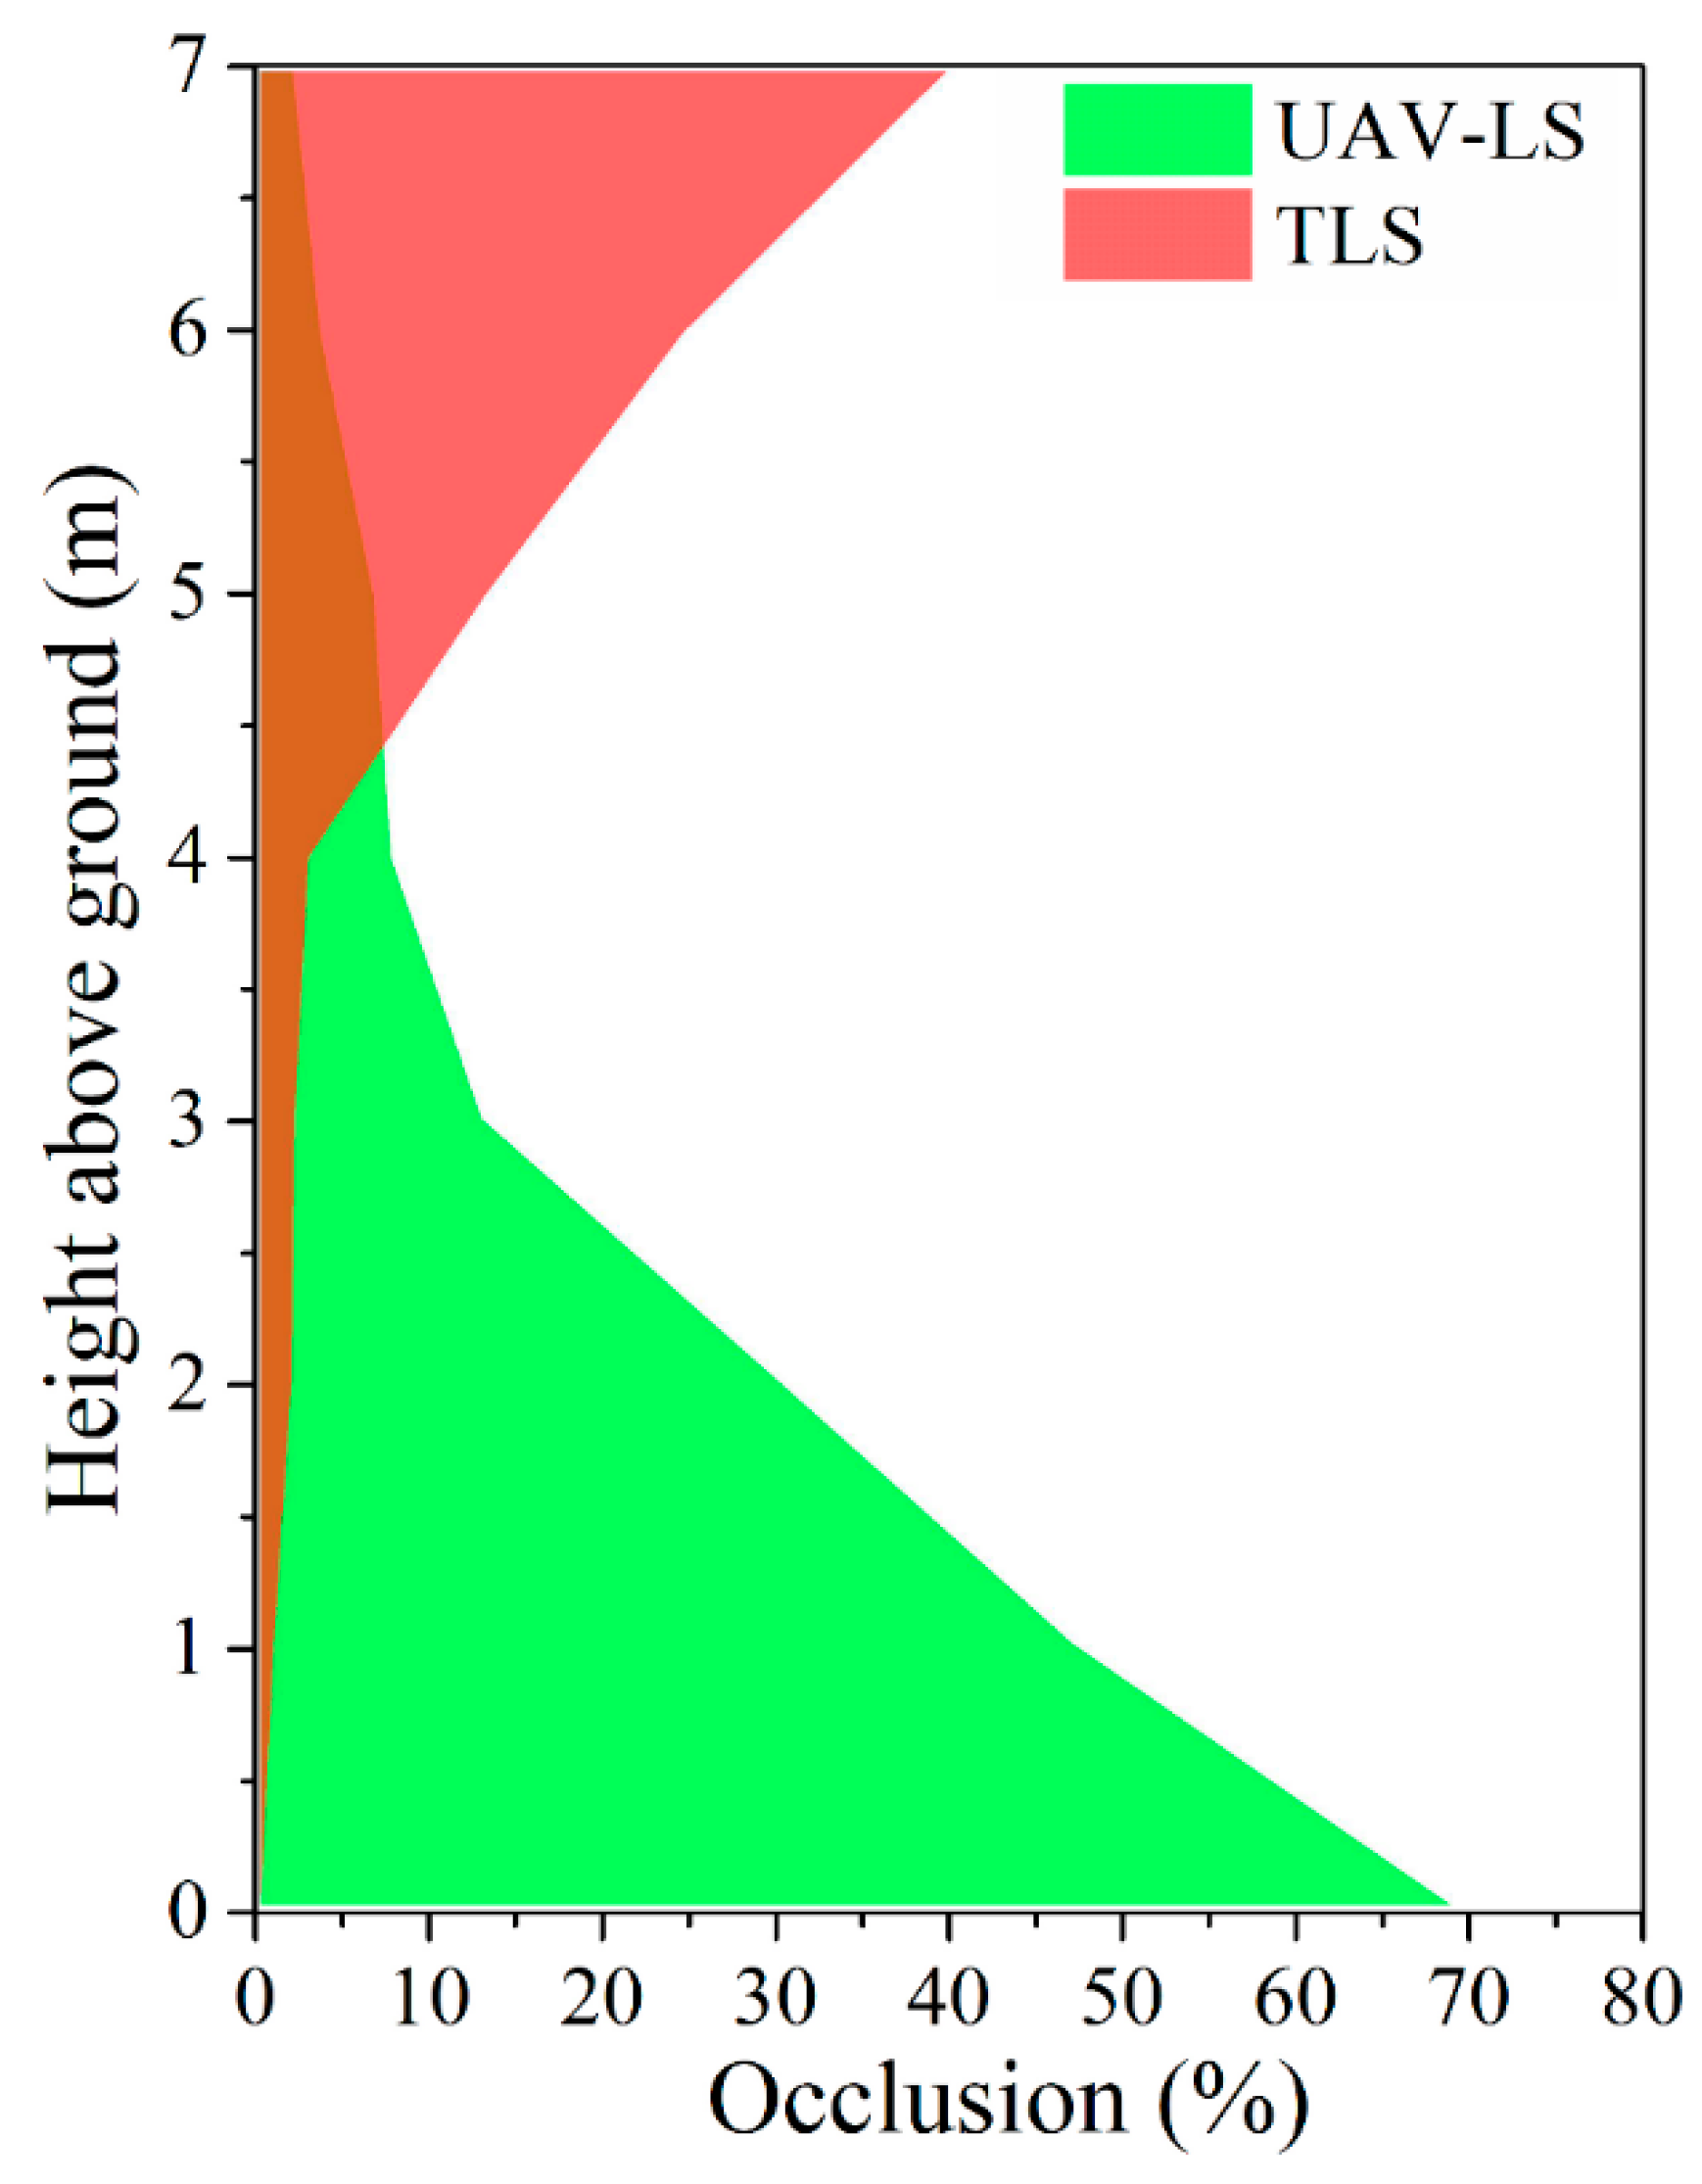
4.1. Effects of Laser Scanning Geometry

The laser scanning geometry greatly affected the estimation accuracy of the sunlit leaf fraction due to the different spatial coverages of forest canopies resulting from occlusions among foliage elements. The missing points resulted in occlusion that would change the spatial distribution pattern of a forest canopy and alter the length of the effective light transmission path under a given incident direction (Figure 10c,d), which resulted in the overestimation of forest PAR in 3-D space. The fused point data can effectively improve the comprehensiveness of forest canopies, which agrees with the previous works [54,55]. The relative comprehensive representation of a forest canopy using fused point data was conducive to catching actual effective total path lengths, and produced the low bias in the predicted PAR value (Figure 9a). As a result, more shaded leaves could be identified due to increased effective total path lengths of light transmission (Figure 10a,b).
Measurements from the top of the canopy could cover a few meters of the upper canopy. However, there were quite a lot of occlusions in the mid- and understory (Figure 4). Consequently, we found that the UAV-LS point cloud-based forest PAR provided the worst estimation results (Figure 9b) and contributed to the overestimation of sunlit leaf fractions. These findings were consistent with research showing that a large quantity of TLS acquisitions was not detected owing to occlusions in the ALS acquisition [55,56]. The two systems observe the forest in completely different ways due to the different geometries of observation and acquisition [57]. The TLS measurements scan forests with more observation angles than ALS acquisitions, allowing the system to record vertical features such as tree trunks and twigs in great detail. On the other hand, ALS systems have difficulty detecting these vertical features with similar details due to their top-down viewing geometry, lower pulse density, fewer viewing angles, and smaller scanning angle ranges [55]. Nevertheless, increasing pulse density or using full-waveform ALS data have been shown to improve the ability of ALS data to measure lower branches and leaves within the crown structure [58].

4.2. Effects of Point Density

The point density determined the level of details about forest 3-D structure, which plays a vital role in both estimating forest PAR and identifying sunlit and shaded leaves. As the point cloud density decreased, less structural detail was captured [59], adversely affecting the accuracy of the sunlit leaf fraction. The K-Means++ algorithm was applied to group the vegetation points and calculate the TPLe in previous work by Zeng et al. [44], and the clustering algorithm’s performance was closely related to the data point density. For example, the TPLe, calculated based on different NPD point clouds, showed a downward trend with the decrease of TLS point density, and the sunlit leaf fractions were overestimated as point density decreased (Table 2). The effect of point density on the TPLe was weak in the upper canopy but significant in the lower canopy. This showed that the number of points in the light path limited the impact of point density on the performance of the clustering algorithm when the TPLe was short. As the light went deep into the canopy, more vegetation points and vegetation clusters appeared in the light path, which greatly affected the separation of multiple vegetation element clusters. The explanation for this phenomenon is that the reasonable determination of the initial cluster center in the clustering algorithm had a great influence on the clustering effect [53]. The number and aggregation of points in the light path reduced with the decrease of point density, which would reduce the rationality of the initial cluster center setting and lead to the decrease of the TPLe. The change of point density puts forward higher requirements for the clustering algorithm to extract the TPLe exactly. The point cloud extraction method using the Density-Based Spatial Clustering of Applications with Noise (DBSCAN) algorithm could solve this problem because targets that show low-density distribution can be accurately detected using density-based clustering algorithms like DBSCAN [60,61].
Furthermore, the decrease of NPD would make local point sets lose the ability to represent certain spatial features. For example, the thinning tree trunk surface points might be misclassified as leaf points due to the changing of spatial distribution pattern variation [62]. This misclassification would further affect the fraction estimation of sunlit leaves in the understory layer because the woody elements are concentrated in the lower part of young forests [40]. Therefore, the appropriate point clustering algorithm and accurate estimates of the leaf and trunk profiles of the specific study area are important because they enable us to discuss the effects of data point density on the identification of sunlit and shaded leaves.

4.3. Effects of Woody Materials

The contribution of woody materials to the estimation error of the sunlit leaf fraction changed with the canopy height. The woody materials significantly affected estimated fractions of sunlit leaves in the understory layer, while sunlit leaf fractions of the overstory layers would not change with the removal of woody materials (Figure 11a). This might be due to the fact that woody materials such as branches and stems in young forests are usually concentrated in the lower part of the canopy [40]. The most apparent differences were observed around noon, which might be explained by the fact that tree canopies intercepted most of the PAR per projected area of the canopy near solar noon, and woody material points just below canopies were identified as shaded leaves [63]. The 3-D structure of trunks and branches had a limited impact on the identification of sunlit leaves in canopies because the study was carried out in a young forest where the woody elements were relatively proportionally low in tree crowns (Figure 5f,g). In other studies on the influence of woody elements on radiative transfer approaches, non-photosynthetic canopy components accounted for 5% to 40% of the total forests biomass, especially in old-growth forests. This shows that radiative transfer approaches should take woody elements into account when retrieving sunlit and shaded leaves in a heterogeneous stand [40].

4.4. Effects of Penumbra Areas

The penumbra area within forest canopies increased the proportions of sunlit leaves by introducing direct solar radiation, especially in a tall live standing forest stand. The mean height difference is a critical factor that is used to explain the potential influence of vegetation height on penumbra effects [64]. Our method is based on the empirical analysis of penumbra regions created by sunlight projecting through leaf edge and variable height differences to the lower canopy layer. To study the effect of mean height differences, we calculated the proportions (conversion ratio) of original shaded leaf point clusters converted into sunlit leaf point clusters after considering penumbra effects. By comparing mean height differences and conversion ratios during the daily sun course (Figure 11b), we found that the mean height difference was small, but the conversion ratio was large at sunrise and sunset. As the solar zenith angle decreased, the mean height difference increased and the conversion ratio decreased. This finding can be explained by the possibility that the upper and middle canopy layers were more affected by the penumbra effect at sunrise and sunset, while the penumbra created more apparent effects on seedling crowns at noon. It indicated that the evaluation of the mean height difference for a given forest would enable estimates of the vertical distribution of the penumbra effect on forest canopies. The sunlit and shaded leaf identification model incorporating the penumbra effect may be especially important for interpreting the underlying physiological response patterns of understory plants. Furthermore, the variation patterns of the mean height difference with solar zenith angle indicated that penumbra effects exhibited temporal variations on the identification of sunlit leaves within a day. The effects of penumbra variation with solar elevation angle on the identification of sunlit and shaded leaves deserve further study.

4.5. Effects of Leaf Movements

Others have shown that branches and leaves move in a complex way, which makes it hard to determine general patterns [65]. The goal here is to generate reasonable displaced point clouds to test the effect of leaf movements on the canopy radiative transfer model and the identification of sunlit leaves. Sunlit leaf fractions decreased slightly due to leaf movements (Table 3), and the reason for this may be that tiny gaps were closed due to movements of leaves and branches. A similar conclusion was reached that canopy movements decreased the calculated canopy openness [66]. It is noteworthy that the effects of the north- and south-displaced leaves on the increase of sunlit leaf fractions were relatively different at 12:00, because the solar azimuth angle at 12:00 was 169°25′36″, and the sunlight incident direction and leaf movement direction can be regarded as on one line, which suggested that the influence of leaf movements on solar radiation in forests was probably related to the canopy displacement direction.
The point cloud displacement had little effect on sunlit leaf fractions because the maximum displacement of points was 0.12 m, which was smaller than the light path radius of 0.15 m, indicating that most displaced points still stayed in the original light path, thus the canopy radiation distribution calculated based on the displaced-point cloud showed a small difference. In addition, other researchers have found that most movements of branches and leaves occurred at sunrise and sunset [67,68], but our experiment was based on single-temporal lidar data, which made it difficult to describe the real leaf movements at all times. This is the deficiency of the current research, and multi-temporal lidar data is needed to detect canopy movements in the future. The automatic forest dynamic monitoring TLS platform would have been more suitable for this study but was not available. A TLS measurement station built within a field station recently at a boreal forest illustrates the possibility of observing the influence of leaf movements on the lighting variation of boreal trees in different seasons [69].

5. Conclusions

In this study, we developed a lidar-based LFSSL algorithm approach to map the spatiotemporal distributions of forest PAR from a 3-D perspective and further identified the fractions of sunlit and shaded leaves in a broadleaf forest stand. In addition, we analyzed various factors affecting sunlit and shaded leaf identification, including laser scanning geometry, point density, woody materials, penumbra effects, and leaf movements. Based on our findings, we conclude that: (1) The LFSSL algorithm, combined with the field-based pyranometer measurements, is beneficial for mapping the spatiotemporal variations of direct-, diffuse- and scatter-PAR of a forest canopy based on 3-D comprehensive lidar data; (2) It is necessary to combine UAV-LS and TLS lidar data to comprehensively represent the forest stand for identifying sunlit and shaded leaves after removing the non-photosynthetic canopy components; (3) The penumbra effect is a non-ignorable factor in determining sunlit leaves, especially in a forest stand with a prominent multi-layer structure including tall trees, shrubs, and graminoids; (4) Leaf movements are crucial to better identify sunlit and shaded leaves in forests. This work provides a solid foundation to better model the interactions between vegetation and light, which can ultimately improve our ability to model and understand biophysical processes.

Author Contributions

Conceptualization, S.T. and G.Z.; data curation, Q.Z.; formal analysis, S.T.; funding acquisition, G.Z. and Q.Z.; methodology, S.T. and G.Z.; software, S.T.; writing—original draft, S.T.; writing—review and editing, G.Z. and J.U.E. All authors have read and agreed to the published version of the manuscript.

Funding

Funding and resources for this research project came from the Key Research and Development Programs for Global Change and Adaptation (Grant NO. 2019YFA0606601), the National Science Foundation of China (NSFC) (NSFC award #41771374 and #42071392), and the Scientific Research Satellite Engineering of Civil Space Infrastructure Project (Forestry products and its practical techniques research on Terrestrial Ecosystem Carbon Inventory Satellite).

Conflicts of Interest

The authors declare no conflict of interest.

References

  1. Wilson, J.W. Stand structure and light penetration. III. Sunlit foliage area. J. Appl. Ecol. 1967, 159–165. [Google Scholar] [CrossRef]
  2. Ellsworth, D.; Reich, P. Canopy structure and vertical patterns of photosynthesis and related leaf traits in a deciduous forest. Oecologia 1993, 96, 169–178. [Google Scholar] [CrossRef]
  3. Gu, L.; Baldocchi, D.; Verma, S.B.; Black, T.; Vesala, T.; Falge, E.M.; Dowty, P.R. Advantages of diffuse radiation for terrestrial ecosystem productivity. J. Geophys. Res.-Atmos. 2002, 107, ACL 2-1–ACL 2-23. [Google Scholar] [CrossRef] [Green Version]
  4. Stenberg, P. Penumbra in within-Shoot and between-Shoot Shading in Conifers and Its Significance for Photosynthesis. Ecol. Model. 1995, 77, 215–231. [Google Scholar] [CrossRef]
  5. Dengel, S.; Grace, J.; MacArthur, A. Transmissivity of solar radiation within a Picea sitchensis stand under various sky conditions. Biogeosci. Discuss. 2015, 12, 3825. [Google Scholar] [CrossRef] [Green Version]
  6. Denholm, J. The influence of penumbra on canopy photosynthesis I. Theoretical considerations. Agric. Meteorol. 1981, 25, 145–166. [Google Scholar] [CrossRef]
  7. Zheng, T.; Chen, J.M. Photochemical reflectance ratio for tracking light use efficiency for sunlit leaves in two forest types. ISPRS J. Photogramm. 2017, 123, 47–61. [Google Scholar] [CrossRef]
  8. Chen, J.M.; Wang, Z.; Zhang, F.; Mo, G. Chlorophyll Fluorescence Is a Better Proxy for Sunlit Leaf Than Total Canopy Photosynthesis//Agu Fall Meeting. In Proceedings of the AGU Fall Meeting Abstracts, San Francisco, CA, USA, 11–15 December 2015. [Google Scholar]
  9. Hilker, T.; Coops, N.C.; Schwalm, C.R.; Jassal, R.P.S.; Black, T.A.; Krishnan, P. Effects of mutual shading of tree crowns on prediction of photosynthetic light-use efficiency in a coastal Douglas-fir forest. Tree Physiol. 2008. [Google Scholar] [CrossRef]
  10. Maguire, A.J.; Eitel, J.U.H.; Griffin, K.L.; Magney, T.S.; Long, R.A.; Vierling, L.A.; Schmiege, S.C.; Jennewein, J.S.; Weygint, W.A.; Boelman, N.T. On the Functional Relationship Between Fluorescence and Photochemical Yields in Complex Evergreen Needleleaf Canopies. Geophys. Res. Lett. 2020, 47. [Google Scholar] [CrossRef]
  11. Wieneke, S.; Burkart, A.; Cendrero-Mateo, M.P.; Julitta, T.; Rossini, M.; Schickling, A.; Schmidt, M.; Rascher, U. Linking photosynthesis and sun-induced fluorescence at sub-daily to seasonal scales. Remote Sens. Environ. 2018, 219, 247–258. [Google Scholar] [CrossRef]
  12. Van der Tol, C.; Berry, J.A.; Campbell, P.K.E.; Rascher, U. Models of fluorescence and photosynthesis for interpreting measurements of solar-induced chlorophyll fluorescence. J. Geophys. Res. Biogeosci. 2014, 119, 2312–2327. [Google Scholar] [CrossRef] [PubMed] [Green Version]
  13. Canham, C.D.; Coates, K.D.; Bartemucci, P.; Quaglia, S. Measurement and modeling of spatially explicit variation in light transmission through interior cedar-hemlock forests of British Columbia. Can. J. For. Res. 1999, 29, 1775–1783. [Google Scholar] [CrossRef]
  14. Kotchenova, S.Y.; Song, X.; Shabanov, N.V.; Potter, C.S.; Knyazikhin, Y.; Myneni, R.B. Lidar remote sensing for modeling gross primary production of deciduous forests. Remote Sens. Environ. 2004, 92, 158–172. [Google Scholar] [CrossRef]
  15. Norman, J.M. Simulations of microclimates. In Biometeorology in Integrated Pest Management; Hatfield, J.L., Thomason, I.J., Eds.; Academic Press: Cambridge, MA, USA, 1982. [Google Scholar] [CrossRef]
  16. Huang, Q.; Qiu, F.; Fan, W.; Liu, Y.; Zhang, Q. Evaluation of Different Methods for Estimating the Fraction of Sunlit Leaves and Its Contribution for Photochemical Reflectance Index Utilization in a Coniferous Forest. Remote Sens. 2019, 11, 1643. [Google Scholar] [CrossRef] [Green Version]
  17. Wang, Y.P.; Jarvis, P.G. Description and Validation of an Array Model–Maestro. Agric. For. Meteorol. 1990, 51, 257–280. [Google Scholar] [CrossRef]
  18. Begue, A.; Hanan, N.P.; Prince, S.D. Radiative-Transfer in Shrub Savanna Sites in Niger—Preliminary-Results from Hapex-Sahel.2. Photosynthetically Active Radiation Interception of the Woody Layer. Agric. For. Meteorol. 1994, 69, 247–266. [Google Scholar] [CrossRef]
  19. Guillen-Climent, M.L.; Zarco-Tejada, P.J.; Berni, J.A.J.; North, P.R.J.; Villalobos, F.J. Mapping radiation interception in row-structured orchards using 3D simulation and high-resolution airborne imagery acquired from a UAV. Precis. Agric. 2012, 13, 473–500. [Google Scholar] [CrossRef] [Green Version]
  20. Asrar, G.M.; Fuchs, M.; Kanemasu, E.T.; Hatfield, J.L. Estimating Absorbed Photosynthetic Radiation and Leaf Area Index from Spectral Reflectance in Wheat1. Agron. J. 1984, 76, 121A. [Google Scholar] [CrossRef]
  21. Gallo, K.P.; Daughtry, C.S.T.; Bauer, M.E. Spectral estimation of absorbed photosynthetically active radiation in corn canopies. Remote Sens. Environ. 1985, 17, 221–232. [Google Scholar] [CrossRef]
  22. Daughtry, C.S.T.; Gallo, K.P.; Goward, S.N.; Prince, S.D.; Kustas, W.P. Spectral Estimates of Absorbed Radiation and Phytomass Production in Corn and Soybean Canopies. Remote Sens. Environ. 1992, 39, 141–152. [Google Scholar] [CrossRef]
  23. Hanan, N.P.; Prince, S.D.; Begue, A. Estimation of absorbed photosynthetically active radiation and vegetation net production efficiency using satellite data. Agric. For. Meteorol. 1995, 76, 259–276. [Google Scholar] [CrossRef]
  24. Isabelle, P.-E.; Nadeau, D.F.; Asselin, M.-H.; Harvey, R.; Musselman, K.N.; Rousseau, A.N.; Anctil, F. Solar radiation transmittance of a boreal balsam fir canopy: Spatiotemporal variability and impacts on growing season hydrology. Agric. For. Meteorol. 2018, 263, 1–14. [Google Scholar] [CrossRef]
  25. Moeser, D.; Roubinek, J.; Schleppi, P.; Morsdorf, F.; Jonas, T. Canopy closure, LAI and radiation transfer from airborne LiDAR synthetic images. Agric. For. Meteorol. 2014, 197, 158–168. [Google Scholar] [CrossRef]
  26. Musselman, K.N.; Molotch, N.P.; Margulis, S.A.; Kirchner, P.B.; Bales, R.C. Influence of canopy structure and direct beam solar irradiance on snowmelt rates in a mixed conifer forest. Agric. For. Meteorol. 2012, 161, 46–56. [Google Scholar] [CrossRef]
  27. Fan, W.; Li, J.; Liu, Q. GOST2: The improvement of the canopy reflectance model GOST in separating the sunlit and shaded leaves. IEEE J. Sel. Top. Appl. Earth Observ. Remote Sens. 2015, 8, 1423–1431. [Google Scholar] [CrossRef]
  28. Olpenda, A.S.; Sterenczak, K.; Bedkowski, K. Modeling Solar Radiation in the Forest Using Remote Sensing Data: A Review of Approaches and Opportunities. Remote Sens. 2018, 10, 694. [Google Scholar] [CrossRef] [Green Version]
  29. Tymen, B.; Vincent, G.; Courtois, E.A.; Heurtebize, J.; Dauzat, J.; Marechaux, I.; Chave, J. Quantifying micro-environmental variation in tropical rainforest understory at landscape scale by combining airborne LiDAR scanning and a sensor network. Ann. For. Sci. 2017, 74. [Google Scholar] [CrossRef]
  30. Bode, C.A.; Limm, M.P.; Power, M.E.; Finlay, J.C. Subcanopy Solar Radiation model: Predicting solar radiation across a heavily vegetated landscape using LiDAR and GIS solar radiation models. Remote Sens. Environ. 2014, 154, 387–397. [Google Scholar] [CrossRef]
  31. Alexander, C.; Moeslund, J.E.; Bocher, P.K.; Arge, L.; Svenning, J.C. Airborne laser scanner (LiDAR) proxies for understory light conditions. Remote Sens. Environ. 2013, 134, 152–161. [Google Scholar] [CrossRef]
  32. Oshio, H.; Asawa, T. Estimating the Solar Transmittance of Urban Trees Using Airborne LiDAR and Radiative Transfer Simulation. IEEE T Geosci. Remote 2016, 54, 5483–5492. [Google Scholar] [CrossRef]
  33. Musselman, K.N.; Margulis, S.A.; Molotch, N.P. Estimation of solar direct beam transmittance of conifer canopies from airborne LiDAR. Remote Sens. Environ. 2013, 136, 402–415. [Google Scholar] [CrossRef]
  34. Nyman, P.; Metzen, D.; Hawthorne, S.N.D.; Duff, T.J.; Inbar, A.; Lane, P.N.J.; Sheridan, G.J. Evaluating models of shortwave radiation below Eucalyptus canopies in SE Australia. Agric. For. Meteorol. 2017, 246, 51–63. [Google Scholar] [CrossRef]
  35. Van der Zande, D.; Stuckens, J.; Verstraeten, W.W.; Mereu, S.; Muys, B.; Coppin, P. 3D modeling of light interception in heterogeneous forest canopies using ground-based LiDAR data. Int. J. Appl. Earth Obs. 2011, 13, 792–800. [Google Scholar] [CrossRef]
  36. Bittner, S.; Gayler, S.; Biernath, C.; Winkler, J.B.; Seifert, S.; Pretzsch, H.; Priesack, E. Evaluation of a ray-tracing canopy light model based on terrestrial laser scans. Can. J. Remote Sens. 2012, 38, 619–628. [Google Scholar] [CrossRef] [Green Version]
  37. Cifuentes, R.; Van der Zande, D.; Salas, C.; Tits, L.; Farifteh, J.; Coppin, P. Modeling 3D Canopy Structure and Transmitted PAR Using Terrestrial LiDAR. Can. J. Remote Sens. 2017, 43, 124–139. [Google Scholar] [CrossRef]
  38. Peng, S.Z.; Zhao, C.Y.; Xu, Z.L. Modeling spatiotemporal patterns of understory light intensity using airborne laser scanner (LiDAR). ISPRS-J. Photogramm. Remote Sens. 2014, 97, 195–203. [Google Scholar] [CrossRef]
  39. Zheng, G.; Ma, L.; He, W.; Eitel, J.U.; Moskal, L.M.; Zhang, Z. Assessing the contribution of woody materials to forest angular gap fraction and effective leaf area index using terrestrial laser scanning data. IEEE Trans. Geosci. Remote 2015, 54, 1475–1487. [Google Scholar] [CrossRef]
  40. Verrelst, J.; Schaepman, M.E.; Malenovsky, Z.; Clevers, J.G.P.W. Effects of woody elements on simulated canopy reflectance: Implications for forest chlorophyll content retrieval. Remote Sens. Environ. 2010, 114, 647–656. [Google Scholar] [CrossRef] [Green Version]
  41. Schneider, F.D.; Kukenbrink, D.; Schaepman, M.E.; Schimel, D.S.; Morsdorf, F. Quantifying 3D structure and occlusion in dense tropical and temperate forests using close-range LiDAR. Agric. For. Meteorol. 2019, 268, 249–257. [Google Scholar] [CrossRef]
  42. Calders, K.; Adams, J.; Armston, J.; Bartholomeus, H.; Bauwens, S.; Bentley, L.P.; Chave, J.; Danson, F.M.; Demol, M.; Disney, M.; et al. Terrestrial laser scanning in forest ecology: Expanding the horizon. Remote Sens. Environ. 2020, 251, 112102. [Google Scholar] [CrossRef]
  43. Vaaja, M.T.; Virtanen, J.P.; Kurkela, M.; Lehtola, V.; Hyyppa, J.; Hyyppa, H. The Effect of Wind on Tree Stem Parameter Estimation Using Terrestrial Laser Scanning. ISPRS Ann. Photogramm. Remote 2016, 3, 117–122. [Google Scholar] [CrossRef] [Green Version]
  44. Zeng, K.; Zheng, G.; Ma, L.; Ju, W.; Pang, Y. Modelling Three-Dimensional Spatiotemporal Distributions of Forest Photosynthetically Active Radiation Using UAV-Based Lidar Data. Remote Sens. 2019, 11, 2806. [Google Scholar] [CrossRef] [Green Version]
  45. Chen, J.M.; Cihlar, J. Plant canpy gap-size analysis theory for improving optical measurement of leaf-area index. Appl. Opt. 1995, 34, 6211–6222. [Google Scholar] [CrossRef] [PubMed] [Green Version]
  46. Ma, L.X.; Zheng, G.; Eitel, J.U.H.; Moskal, L.M.; He, W.; Huang, H.B. Improved Salient Feature-Based Approach for Automatically Separating Photosynthetic and Nonphotosynthetic Components Within Terrestrial Lidar Point Cloud Data of Forest Canopies. IEEE Trans. Geosci. Remote Sens. 2016, 54, 679–696. [Google Scholar] [CrossRef]
  47. Grant, R.H.; Heisler, G.M.; Gao, W. Photosynthetically-active radiation: Sky radiance distributions under clear and overcast conditions. Agric. For. Meteorol. 1996, 82, 267–292. [Google Scholar] [CrossRef]
  48. Chen, J.M.; Liu, J.; Cihlar, J.; Goulden, M.L. Daily canopy photosynthesis model through temporal and spatial scaling for remote sensing applications. Ecol. Model. 1999, 124, 99–119. [Google Scholar] [CrossRef] [Green Version]
  49. Liu, J.; Chen, J.M.; Cihlar, J. Mapping evapotranspiration based on remote sensing: An application to Canada’s landmass. Water Resour. Res. 2003, 39. [Google Scholar] [CrossRef]
  50. Zheng, G.; Moskal, L.M.; Kim, S.H. Retrieval of Effective Leaf Area Index in Heterogeneous Forests With Terrestrial Laser Scanning. IEEE Trans. Geosci. Remote Sens. 2013, 51, 777–786. [Google Scholar] [CrossRef]
  51. Chen, J.M.; Cihlar, J. Quantifying the effect of canopy architecture on optical measurement of leaf area index using 2 gap size analysis mehtods. IEEE Trans. Geosci. Remote Sens. 1995, 33, 777–787. [Google Scholar] [CrossRef]
  52. Miller, E.E.; Norman, J.M. Sunfleck theory for plant canopies: 2. penumbra effect—Intensity distributions along sunfleck segments. Agron. J. 1971, 63, 739–743. [Google Scholar] [CrossRef]
  53. Celebi, M.E.; Kingravi, H.A.; Vela, P.A. A comparative study of efficient initialization methods for the k-means clustering algorithm. Expert. Syst. Appl. 2013, 40, 200–210. [Google Scholar] [CrossRef] [Green Version]
  54. Morsdorf, F.; Kukenbrink, D.; Schneider, F.D.; Abegg, M.; Schaepman, M.E. Close-range laser scanning in forests: Towards physically based semantics across scales. Interface Focus 2018, 8. [Google Scholar] [CrossRef] [Green Version]
  55. Kükenbrink, D.; Schneider, F.D.; Leiterer, R.; Schaepman, M.E.; Morsdorf, F. Quantification of hidden canopy volume of airborne laser scanning data using a voxel traversal algorithm. Remote Sens. Environ. 2017, 194, 424–436. [Google Scholar] [CrossRef]
  56. Crespo-Peremarch, P.; Fournier, R.; Nguyen, V.-T.; Lier, O.; Ruiz, L. A comparative assessment of the vertical distribution of forest components using full-waveform airborne, discrete airborne and discrete terrestrial laser scanning data. For. Ecol. Manag. 2020, 473, 118268. [Google Scholar] [CrossRef]
  57. Hilker, T.; Coops, N.C.; Newnham, G.J.; van Leeuwen, M.; Wulder, M.A.; Stewart, J.; Culvenor, D.S. Comparison of Terrestrial and Airborne LiDAR in Describing Stand Structure of a Thinned Lodgepole Pine Forest. J. For. 2012, 110, 97–104. [Google Scholar] [CrossRef]
  58. Campbell, M.; Dennison, P.; Hudak, A.T.; Parham, L.; Butler, B. Quantifying understory vegetation density using small-footprint airborne lidar. Remote Sens. Environ. 2018, 215, 330–342. [Google Scholar] [CrossRef]
  59. Luo, S.; Chen, J.; Wang, C.; Xiaohuan, X.; Zeng, H.; Peng, D.; Li, D. Effects of LiDAR point density, sampling size and height threshold on estimation accuracy of crop biophysical parameters. Opt. Express 2016, 24, 11578. [Google Scholar] [CrossRef] [PubMed]
  60. Guo, Z.; Liu, H.; Pang, L.; Fang, L.; Dou, W. DBSCAN-based point cloud extraction for Tomographic synthetic aperture radar (TomoSAR) three-dimensional (3D) building reconstruction. Int. J. Remote Sens. 2021, 42, 2327–2349. [Google Scholar] [CrossRef]
  61. Kazemi, U.; Boostani, R. FEM-DBSCAN: An Efficient Density-Based Clustering Approach. Iran. J. Sci. Technol.-Trans. Electr. Eng. 2021. [Google Scholar] [CrossRef]
  62. Michalowska, M.; Rapinski, J. A Review of Tree Species Classification Based on Airborne LiDAR Data and Applied Classifiers. Remote Sens. 2021, 13, 353. [Google Scholar] [CrossRef]
  63. Zhang, J.; Whiting, M.D.; Zhang, Q. Diurnal pattern in canopy light interception for tree fruit orchard trained to an upright fruiting offshoots (UFO) architecture. Biosyst. Eng. 2015, 129, 1–10. [Google Scholar] [CrossRef]
  64. Smith, W.; Knapp, A.; Reiners, W. Penumbral Effects on Sunlight Penetration in Plant Communities. Ecology 1989, 70. [Google Scholar] [CrossRef]
  65. Bakay, L.; Moravcik, L. Quantification of Circadian Movement of Small-Leaved Lime (Tilia cordata Mill.) Saplings With Short Interval Terrestrial Laser Scanning. Front. Plant Sci. 2020, 11, 984. [Google Scholar] [CrossRef] [PubMed]
  66. Seidel, D.; Fleck, S.; Leuschner, C. Analyzing forest canopies with ground-based laser-scanning: A comparison with hemispherical photography. Agric. For. Meteorol. 2011, 154–155, 1–8. [Google Scholar] [CrossRef]
  67. Zlinszky, A.; Molnár, B.; Barfod, A. Not All Trees Sleep the Same—High Temporal Resolution Terrestrial Laser Scanning Shows Differences in Nocturnal Plant Movement. Front. Plant Sci. 2017, 8, 1814. [Google Scholar] [CrossRef] [Green Version]
  68. Jackson, T.; Shenkin, A.; Moore, J.; Bunce, A.; van Emmerik, T.; Kane, B.; Burcham, D.; James, K.; Selker, J.; Calders, K.; et al. An architectural understanding of natural sway frequencies in trees. J. R. Soc. Interface 2019, 16. [Google Scholar] [CrossRef] [Green Version]
  69. Campos, M.; Litkey, P.; Wang, Y.; Chen, Y.; Hyyti, H.; Hyyppä, J.; Puttonen, E. A Long-Term Terrestrial Laser Scanning Measurement Station to Continuously Monitor Structural and Phenological Dynamics of Boreal Forest Canopy. Front. Plant Sci. 2021, 11. [Google Scholar] [CrossRef]
Figure 1. The study site location (inset a) and corresponding unmanned aerial vehicle based laser scanning (UAV-LS) and terrestrial laser (TLS) point cloud data (inset b). The inset (c) shows the field setup locations of the TLS system and nine photosynthetically active radiation (PAR) pyranometers. The vertical profile and coverage of the fused point cloud resulted from TLS (red) and UAV-LS (green) point clouds (inset d).
Remotesensing 13 01002 g001
Figure 2. Schematic diagram showing the penumbra effects of leaves at different heights on the PAR estimation and sunlit leaf identification.
Remotesensing 13 01002 g002
Figure 3. Schematic diagram of sunlit and shaded leaf identification based on the point cloud data within a light transmission path.
Remotesensing 13 01002 g003
Figure 4. Vertical distribution of canopy occlusion based on the UAV-LS and TLS-based point cloud data. Occlusion is determined by comparing UAV-LS and TLS-based point cloud data against the fused point cloud.
Remotesensing 13 01002 g004
Figure 5. The classified fused point data for the study forest plot (inset a) including the bare earth (inset b), non-photosynthetic component (inset c), and photosynthetic components (inset d). Additionally, subplot (inset e) and individual tree (insets fh) point cloud data of the study forest plot are shown in perspective and side-lateral views separately to better illustrate the classification results.
Remotesensing 13 01002 g005
Figure 6. The vertical spatial distributions of PAR within a forest canopy at noon (inset a) and temporal variations of PAR with the height ranging from 3 m to 4 m (inset b) based on the fused point data.
Remotesensing 13 01002 g006
Figure 7. The temporal variations of sunlit leaf fractions at different horizontal layers during a daily sun course in a forest stand.
Remotesensing 13 01002 g007
Figure 8. The vertical distribution of sunlit and shaded leaves within a forest canopy at noon (inset a) and temporal distribution variations of sunlit and shaded leaves with the height ranging from 3 m to 4 m (inset b) based on the fused point. data.
Remotesensing 13 01002 g008
Figure 9. Observed vs. predicted sub-canopy PAR based on fused point cloud at all pyranometer locations (inset a). Comparisons between PAR RMSEs using the LFSSL algorithm between the predicted and observed PAR based on TLS, UAV-LS, and fused point cloud (inset b). The mean sub-canopy PAR is plotted on the secondary y-axis.
Remotesensing 13 01002 g009
Figure 10. Comparisons between the TLS and UAV-based sunlit leaf fraction (insets a,b) and mean effective total path length (TPLe) (insets c,d) with the ones obtained from the fused point data.
Remotesensing 13 01002 g010
Figure 11. The temporal variations of sunlit leaf fraction differences based on the “whole forest” and “leaf-only” datasets at different horizontal layers (inset a) and mean height, mean height differences, and conversion ratio of penumbra sunlit leaf fractions (inset b) during a daily sun course.
Remotesensing 13 01002 g011
Figure 12. Movement of leaves and branches in canopy point clouds. In the view from the west, red and green represent the northward and southward shifted canopy (inset a), respectively. In the view from the south, red and green represent the eastward and westward shifted canopy (inset b), respectively.
Remotesensing 13 01002 g012
Table 1. Accuracy assessment of pointwise classification result for fused point data.
Class TypeTotal Number of PointsCorrectly Classified Number of PointsUser’s AccuracyProducer’s Accuracy
Bare earth244,549235,79496.42%93.56%
Photosynthetic component1,138,3331,106,00497.16%98.92%
Non-photosynthetic component105,74680,70576.32%78.41%
Overall1,488,6281,422,50395.55%95.69%
Table 2. The differences between sunlit leaf fractions calculated based on TLS data with other neighboring point distances (NPDs) and the reference one calculated based on TLS data with an NPD of 5 mm (differences = other NPDs—5 mm).
Canopy LayerNPD = 25 mmNPD = 45 mmNPD = 65 mmNPD = 85 mmNPD = 100 mm
6–7 m0.40%0.80%1.20%3.10%4.10%
5–6 m1.40%3.90%6.30%7.10%8.50%
4–5 m4.30%11.90%14.80%20.30%13.60%
3–4 m8.90%19.10%22.60%36.50%17.20%
2–3 m12.0%24.70%33.00%44.50%56.60%
1–2 m−4.50%−7.50%−13.40%−13.10%−23.80%
0–1 m−9.40%−10.60%−18.00%−17.00%−34.20%
total4.40%11.70%17.60%19.60%23.50%
Table 3. The differences between sunlit leaf fractions calculated based on displaced point clouds and the reference one calculated based on the non-displaced point cloud (differences = displaced—non-displaced).
TimeTo the NorthTo the SouthTo the EastTo the West
06:00−4.50%−4.40%−4.50%−4.40%
08:00−6.30%−6.20%−6.50%−6.00%
10:00−1.80%−1.90%−2.40%−1.30%
12:002.50%1.80%2.10%2.10%
14:00−0.70%−1.00%−0.30%−1.40%
16:00−7.90%−7.90%−7.70%−8.00%
18:00−4.80%−4.90%−4.80%−4.80%
Daily−3.36%−3.50%−3.44%−3.40%
Publisher’s Note: MDPI stays neutral with regard to jurisdictional claims in published maps and institutional affiliations.

