Abstract
Trees growing on private property have become an essential part of urban green policies. In many places, restrictions are imposed on tree removal on private property. However, monitoring compliance of these regulations appears difficult due to a lack of reference data and public administration capacity. We assessed the impact of the temporary suspension of mandatory permits on tree removal, which was in force in 2017 in Poland, on the change in urban tree cover (UTC) in the case of the municipality of Racibórz. The bi-temporal airborne laser scanning (ALS) point clouds (2011 and 2017) and administrative records on tree removal permits were used for analyzing the changes of UTC in the period of 2011–2017. The results show increased tree removal at a time when the mandatory permit was suspended. Moreover, it appeared that most trees on private properties were removed without obtaining permission when it was obligatory. The method based on LiDAR we proposed allows for monitoring green areas, including private properties.
1. Introduction
Urban forests give residents many benefits known as “ecosystem services” (ES) [1,2,3,4]. They have vital importance for sustainable development and inhabitants’ quality of life and include all types of services: provisioning (e.g., wood and fruits), regulation and maintenance of conditions (e.g., reducing the formation of urban heat islands and habitats), resources for services (e.g., biomass production) and cultural importance (e.g., beauty) [4,5,6,7]. However, in recent decades, urban areas have been significantly affected by tree removal, giving space to urban services such as buildings, roads and others. According to Nowak and Greenfield [8], in the United States, a country with fast population growth in cities, urban tree cover (UTC) fell from 40.4% to 39.4% in 2009–2014, while impervious cover (mainly roads and buildings) increased by 1%. In Melbourne, Australia, UTC declined in 2008–2016 by 0.7% [9], with the most significant losses being observed in public parks and private properties (coverage reduction in these areas was 2.9% and 3.5%, respectively). A similar situation is happening elsewhere in the world [10,11]. The increasing density of buildings, including single-family housing, means that tree space decreases [10,12], reducing the essential ES that trees provide, undermining life quality and contributing to social inequalities.
1.1. Regulations Concerning Tree Removal on Private Property
Effective policies regarding the protection of trees and shrubs in cities are very much needed, but the increasing urban development makes public lands insufficient in this respect. As a result, urban green space management needs to take into account private landowners. The inclusion of the private sector in environmental policies is not new. Such attempts are observed in flood risk management [13] and nature conservation [14]. For trees, private property often constitutes the majority of the city area grown by trees [12,15,16], and private land yards and gardens comprise a substantial part of the urban tree canopy. Trees on residents’ land are essential for supporting biodiversity [17,18] and the structural connectivity of urban forest networks, which is crucial for many species [19,20].
However, incorporating private owners into tree management appears problematic. In general, individuals’ contributions to the public good involve the collective action problem [21]. Individuals are inclined to free-ride, e.g., refrain from contributing to the public good while counting on contributions from others, assuming that they will be available freely anyway, regardless of one’s input [22]. The collective action problem is widely recognized in environmental management, as most environmental goods have the common good’s essential characteristics. If the collective action problem is not resolved, the underprovision of the public good can be expected. Besides the collective action problem, there are several specific difficulties. Firstly, ecosystem disservices are functions of ecosystems that are perceived as unfavorable for human well-being [23]. Speak [24] has noticed significant differences between ES and ecosystem disservices provided by trees on private and public land. It may explain why residents generally do not support the rules treating a tree in a private area as a public good and restricting their freedom of tree removal [25,26]. Secondly, a tree on a neighbor’s property can be a source of conflict due to the shadow cast on the neighbor’s property, problems with falling leaves, or safety issues. Pandit et al. [27] noticed that trees on nearby plots can significantly reduce the estate price. The urban fabric also matters in this respect. According to Saphores and Li [28]), trees are more valuable to people who live in denser areas. They would like new trees in their neighborhood, but they are still unwilling to pay for the maintenance costs of new trees on their properties. Moreover, urban trees are a natural habitat for many species, which might also cause some nuisance [29], influencing the decision to remove a tree.
This situation necessitates the protection of trees on private property. Indeed, regulations are applied, aiming at securing the public good [30,31,32]. In the field of tree protection and management, there are regulatory mechanisms established at the state and the municipality levels concerning tree removal on private property in many countries. The regulations that control or even prohibit it on this type of property are one of the possible solutions. For example, in most cities in Germany or Australia, a private owner has to submit an appropriate, detailed application to the nature protection authority for permission to cut a tree in his/her own garden. The application needs to provide arguments to remove the tree, detailed photos, a sketch of the property with the location of tree species, the tree’s parameters (height and trunk circumference), and the numbers of all trees on the property. The property owner should also deliver information on a planned replacement of trees and if it is not possible, he must pay an appropriate fee for each tree removed. The fees are spent to maintain and plant new trees in public places. Usually, though there are exceptions, the owner receives approval from the office if there are appropriate arguments. There are also large fines for illegal tree removals [33].
Nevertheless, in many cities, tree removal ordinances are not present, or regulations, even if they include tree removal permit obligations, have numerous exceptions [34]. This makes urban tree policies inefficient. Therefore, it is particularly important to monitor spatio-temporal variation in UTC on public land and in private areas to determine the scale of changes taking place and their causes. Tracking the number of removed trees is critical for the management of green areas in urban space. For a proper assessment of the changes, such factors as the current legal status or ecosystem disservices related to trees’ presence (e.g., shading or maintenance problems) need also be considered. Although regulations on tree removal play a significant role, data that assess the effectiveness of these regulations are scarce. In many cases, the scale of UTC changes is hard to estimate, as many cities have little or no information on private green space [35]. Little research has focused on tree removal on private properties [10,15,36], and most of the research focused on studying the residents’ attitudes toward their own trees and the importance of legal regulations in their protection [24,25,26]. Tools for supporting the management available in many cities also focus on public urban forests—for example, the GreenSpaces (previously known as R3 TREES, R3GIS) application used by municipal administrations in 129 places in Europe [37]. Since it is very comprehensive, it allows the management of all information about public greenery and helps schedule maintenance and care activities on all managed objects, but trees on private properties are not included in this database.
In Poland, the municipal administration focuses only on urban greenery growing on the municipality property. As a result, private areas are beyond any tree or shrub monitoring database [38]. No private greenery inventories are made, which means that there is no assessment of the actual impact of the existing policies on tree protection found in these areas. At the same time, monitoring is essential when regulations exist with numerous exceptions regarding tree removal apply, and this is the case in Poland. A specific Polish enactment regulates this issue and the legal procedure of application for cutting down trees has undergone development. Since April 16th, 2004, there have been established regulations on tree removal permits that forced private owners to apply for permission to cut trees on private land. The mandatory permission does not apply to fruit trees and small trees less with trunk circumferences less than 25/35 cm (depending on the species) and twelve other exceptions, mostly for security reasons [39]. Local checks controlling the situation on private land occurred occasionally at that time, and information from neighbors appeared to be the main control of compliance. The number of applications for removal was steadily growing, which could be attributed to increasing awareness of the obligation. However, the number of applications resulted in a considerable burden for the administration. At the same time, the vast majority of applications were granted. According to research conducted in provincial cities in 2011–2014, 96.4% of applicants were granted permission to cut down their trees [39]. Eventually, a change in the Act on Nature Conservation [40] of December 2016 abolished the requirement to obtain a permit to cut down trees on private property. It went into force on 1 January 2017. It caused controversy, as there were cases of large clearings and the media reported that there was tree removal on a dramatic scale. On 1 March, the protection period started due to bird nesting. It suspended the tree removal, and in June 2017, the mandatory permits were restored.
The regulation change that took place in Poland in 2017 constitutes an interesting case from the urban green area management perspective. Assessing the impact of the regulation’s change on the actual number of trees cut is difficult, as there are no effective monitoring mechanisms in place. In Poland, the administrative process is monitored, e.g., monitoring replacement plantings or the number of permits for tree removal issued [39]. The outcome of the procedure, in terms of the number of removed trees, is not monitored directly by the regulation. Moreover, only public urban greenery is subject to inventory, and there is a growing need to have in place smart and integrated GIS systems that can provide tree management.
1.2. Remote Sensing Data in UTC Change Analysis
This paper deals with the monitoring of tree removal on private properties in the municipality of Racibórz (South of Poland) using the LiDAR (light detection and ranging) 3D point clouds approach and an administrative record to estimate the UTC loss caused by the temporary suspension of mandatory permits to tree removal on private property introduced in Poland in 2017. LiDAR is an active remote sensing technology that uses its own energy source, i.e., a laser, to map objects. The laser energy (pulses in the near infra-red range, e.g., 1064 nm) is sent from the transmitter which is the laser diode. The pulses are scattered by rotating elements, e.g., mirrors, and they reach the object at the speed of light, are reflected from it, and some of the photons return to the detector as signal echoes [41]. Since each light pulse is numbered, the system uses the time it travels to determine the path to and from the object. This way one can calculate the distance of the object from the device, taking into account the angle of impulses sent (horizontal and vertical). In the case of airborne laser scanning (ALS) technology, which was used in this research, a laser altimeter is mounted on an aircraft and the precise location of the platform (plane or helicopter) is determined thanks to an INS (inertial measurement system) which consists of a GNSS (global navigation satellite system) and an inertial measurement unit (IMU). The IMU records with high precision the platform inclination angles in three dimensions, and directions and acceleration values. System integration allows one in the case of ALS to achieve measurement accuracy of 20–30 cm horizontally (XY) and <10 cm vertically (Z) depending on the scanning density and the technology used and geodetic transformations (projections). Modern aerial scanners are able to generate several hundred thousand pulses per second and provide a scanning density of 10–40 points/m (one strip, depending on the flight altitude and speed). For trees, the ALS technology allows for very precise registration of objects thanks to the penetration of the laser through vertical structure of vegetation. The individual echoes (beam parts of light) reflect off the crown, trunks, and branches and reach the bushes or the ground. Depending on the phenological period (leaves on or off), the degree of tree crown damage, and the treatments performed, the horizontal structure (range of the crown; areas of trees and shrubs 2D/3D) and the vertical structure (tree height, crown length, crown base, percentiles, penetration, cover, etc.) can be precisely described [42].
ALS point cloud analyses are a promising approach to monitor the protection of trees and shrubs in private properties. However, its potential has not been not sufficiently utilized till today. First of all, that is due to the relatively high costs of regularly repeated ALS campaigns in a short period. Existing research in terms of using remote sensed data in urban forestry is based mostly on aerial orthophotos or satellite (high resolution or very high resolution) imagery and their derivatives, e.g., the normalized difference vegetation index (NDVI) [43,44] or the Landsat-5 Thematic Mapper (TM) [45]. Another usually applied solution is to use LiDAR data of single time points [46]. Both approaches give ambiguous results. Landry and Pu [44] used IKONOS-2 scenes to verify the introduction of tree permit regulations. Sung applied LiDAR data (2012) and Landsat TM images for the same purpose (2013). The results of the studies suggest that the law can at least partly influence the UTC. Nevertheless, the regulation change is not the only possible explanation. Conway and Urbani’s analysis of satellite images (2007) revealed no significant differences between residential areas in which the regulations on tree removal were and were not implemented. Thus, the results obtained in previous studies are not conclusive in the context of the effectiveness of legal rules. Moreover, all of the above research focused on the comparison of tree cover between neighboring municipalities with and without tree removal regulations, which does not enable taking into account the temporal lag. Meanwhile, past planning decisions and behavior of citizens may significantly influence the present UTC [47].
The second difficulty related to applied remote sensing methods is the spatial scale of data. Very often, the availability of UTC data only allows comparison of changes across the city that do not take into account district or parcel-level processes, such as tree removal on private property [43,44,45,46]. More detailed spatial analyses relate to comparisons between types of land cover or administrative units [48]. However, these may be misleading, as the spatial variability in such cases is closely related to the size of the analyzed areas [12]. Therefore, an impact evaluation of policies should be based on both a detailed analysis carried out at the parcel level and data from at least two-time points. Such a study was performed in Christchurch (New Zealand) in terms of redevelopment’s influence on UTC [36]. However, it concerned only selected plots of land, not the entire city, as only the manual method of marking removed trees was used.
Moreover, analyzing the effectiveness of tree management policies on private property should not be limited to comparing UTC changes between private and public property. If UTC is the only variable analyzed in the study, many non-legal factors may affect it, such as population density, social stratification, luxury effect, and ecology of prestige [47]. Therefore, explicit efficiency of the implemented solutions requires analysis of UTC changes and comparison with actual permits for tree removal. Such a comparison would allow not only determining the changes in UTC but also checking the extent to which the legal provisions are respected and whether they really influence changes regarding trees. Effective regulations in this respect should assume a high consistency in the number of trees removed on the basis of administrative data and resulting from the actual change in UTC. Only then can it be concluded that the solutions introduced allow local authorities to have real control over the number of trees cut down. That, in turn, requires the development of an appropriate methodology to convert the surface of canopy cover into individual trees. Such an analysis could provide more reliable information on the effectiveness of existing regulations in tree protection in private areas.
This study responded to that challenge. It had two main goals: (1) to propose a new method of analyzing changes in UTC using various data sources, and to apply it for (2) evaluation of the regulations’ effectiveness concerning tree protection on private properties. We tested a specific approach in which two ALS point cloud data sets (2011 and 2017) and administrative decisions were compared to assess the effectiveness of legal regulations concerning tree removal. The analysis was performed for the Polish municipality of Racibórz. The study used bi-temporal ALS point clouds for assessment of the effectiveness of the tree preservation legislation in force in Poland between 2011 and 2016. The work describes how these data can be supplemented by administrative decision records that authorize the trees’ removal to produce a more precise analysis of a policy output. The results include the analysis of the impact of the regulation change, i.e., the suspension of mandatory tree removal permits for private purposes that was introduced in Poland at the beginning of 2017.
2. Materials and Methods
2.1. The City of Racibórz Case Study
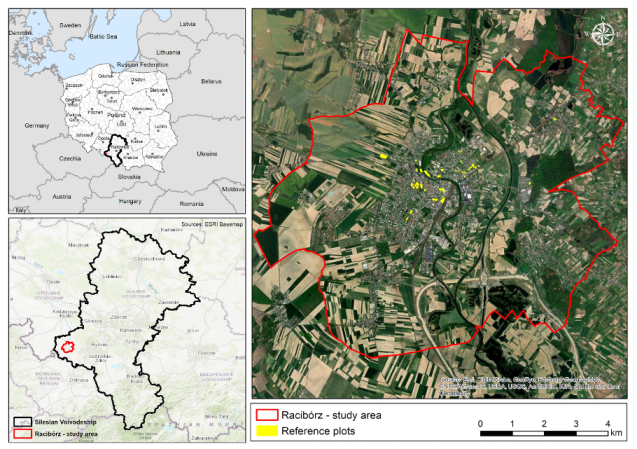
The paper investigated the case study of Racibórz, a medium-sized city with approximately 55,000 inhabitants, located in Silesian Province in southern Poland, near the border with the Czech Republic (Figure 1). The choice was constrained by the availability of ALS data from the beginning of 2017, allowing for the analysis of the regulation change’s impact. The data were available for the city of Racibórz, which did not differ from a typical Polish town of this size regarding the types of green areas and their share in covering the city. It is an administrative center, being the seat of Racibórz County. Its area is about 75 km. Agricultural land accounts for over 68.9% of the total area; forests and forest land 3.7%; built-up land 22.9% [49]. The spatial structure of Racibórz is characteristic of other medium-sized Polish cities. A significant portion is constituted by open areas located mainly on the outskirts of the town on the left side of the Odra River. This is mostly arable land and meadows. Urbanized areas with the highest density is concentrated in the central part of the city, along the river. The vision of the city of “Racibórz 2020” takes the strategy of openness to cooperation, for a vibrant, clean and green city [49].
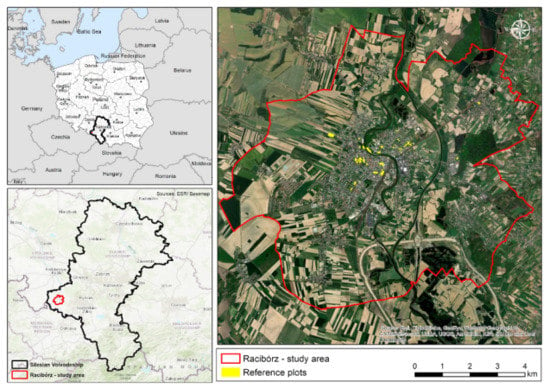
Figure 1.
Localization of study area. Left top: border of Poland; left bottom: Silesian provincial borders; right: orthophotomap of Racibórz city.
2.2. Input Data
Two types of data were taken for the analysis: remote sensing data and information from the administrative record. They are presented below.
2.2.1. Remote Sensing Data
Two types of remotely sensed data were used in the study. The primary data set includes two acquisitions of ALS point clouds collected on 2011 (6 June 2011) and 2017 (5 March 2017). The ALS data set from 2011 was acquired within the framework of the country-wide ISOK project dedicated to the country’s protection against extraordinary threats [50]. The second acquisition in 2017 was performed as part of the CAPAP project [51]. ALS data were obtained by two standards: (a) standard I—applied mainly for forest and rural areas outside cities, where point cloud density was at least 4 points per square meter (ppsqm); (b) standard II—applied in 94 cities in Poland [50], with a density at least 12 ppsqm. The ALS point clouds were previously classified by data providers according to the specifications of the American Society for Photogrammetry and Remote Sensing (ASPRS) for LiDAR Exchange Format (LAS 1.2). The second type of remotely sensed data were digital aerial orthophotomaps available in natural color composites (RGB) through the Google Earth application (Table 1). The orthophotomaps were used as an additional data source to make the UTC layer up-to-date at the beginning of the period of no tree removal permit regulations for private purposes (Figure 2).

Table 1.
Specifications of airborne laser scanning (ALS) and aerial orthophotos used.

Figure 2.
The timeline shows changes in tree removal regulations (above the horizontal line) and remote sensing data (below the horizontal line). The red segment represents the time period when the mandatory tree removal permission was suspended.
It should be emphasized that 5 March 2017 (when the ALS data set was available for Racibórz) was the perfect time to analyze the impact of the change in legislation on tree felling. The period from 1 March to 16 September is considered in Poland as the “bird breeding period,” which introduces additional restrictions related to tree removal due to protection of nesting birds. Thus, for many areas, the appropriate period during which the removal of trees on private properties was beyond control was January–February 2017.
2.2.2. Administrative Data
Local authorities provided two types of spatial information to conduct the study: cadastral data about land ownership and permits for tree removal. The first type of data, obtained from the County Office in Racibórz, contained information on the type of the real estate ownership assigned to registered plots according to 44 different sub-groups. These data covered the studied area, and the accuracy of the border points of the land plot does not exceed 0.3 m. For the purpose of this study, the plots were divided into four categories based on the dominant sub-group registration codes of the registration entities [52]. The first two (accounting for 54% of the city area) are related to private owners located in (a) residential areas and (b) farms (in the outskirts of the city). These two categories were related to the changes in the law that entered into force at the beginning of 2017. The remaining areas are mainly various types of non-private land, which constitute the third distinguished category and 45% of the city’s area. The housing cooperatives (not covered by the regulation change from the beginning of 2017) and the individual plots for which the type of registration group was not specified, were classified in the fourth group—others—and will not be discussed in detail in the results.
The data concerning the locations of trees with administrative permission for tree removal were obtained from the Racibórz City Council for decisions issued between 2011 and 2017 (by the City Council and the County Office). The information contained 1763 records, each including the permit date, address, plot number, number of trees and species name. The plot number was the basis for combining the removal data with the cadastral data. Unfortunately, the system of collecting this data leaves much to be desired, and therefore the correct allocation of individual decisions was not always possible. Therefore, we assessed the policy effects on the city level. We assumed that the proportional shares of particular types of land ownership regarding tree removal, calculated for decisions whose relevant locations were provided, represent the whole city’s situation.
2.3. Creating the Urban Tree Cover Loss Layers
In this section, the consecutive steps of the analysis are presented.
2.3.1. Generating Normalized Digital Surface Models and Canopy Height Models
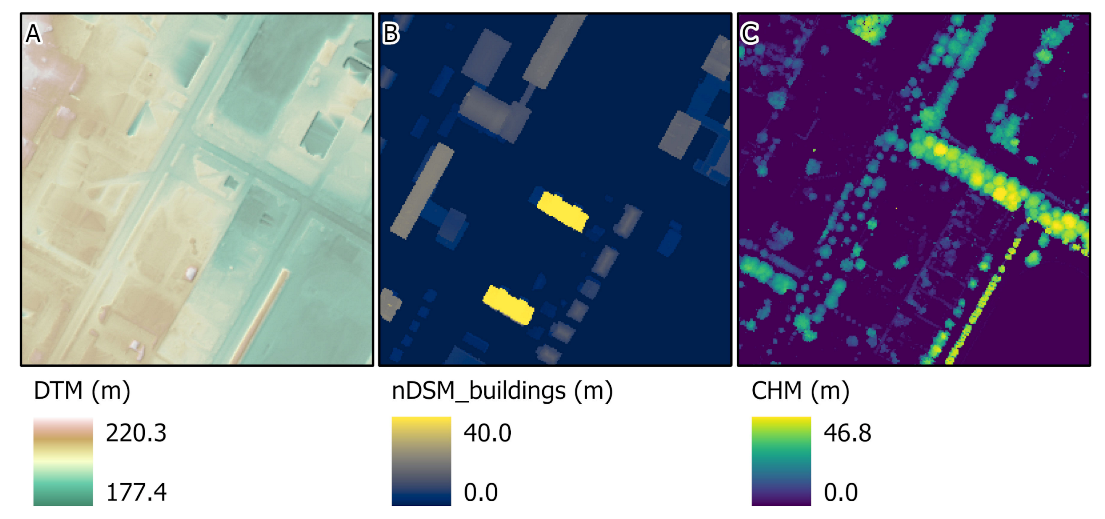
In the first step of analyzing the remote sensing data, a Digital Terrain Model (DTM) and a normalized Digital Surface Model (nDSM) were generated based on the ALS LiDAR point clouds. The models were created with a spatial resolution of 1.0 m using the FUSION software [53]. The nDSMs were generated in two variants—in the first variant (nDSM_build) using points classified (according to ASPRS) into classes (2) ground and (6) buildings, and in the second variant (nDSM) using points classified into classes (2) ground, (3) low vegetation, (4) medium vegetation, (5) high vegetation and (6) buildings. Height models were generated separately for data obtained in 2011 and 2017. In the first step of analyzing the ALS data, Digital Terrain Models (DTM) with 1.0 m spatial resolution were created separately for both ALS datasets using the “GridSurfaceCreate” algorithm from the FUSION software [53]. ALS point clouds were then normalized by subtracting the DTM elevation from the corresponding ALS points. The normalized point clouds were then used for creating normalized Digital Surface Models describing the elevation of buldings (nDSM_buildings). For that purpose, only the points classified (according to ASPRS) as classes (2) ground and (6) buildings were used during genearation of nDSM. In the next step, the Canopy Height Models (011–201s) were generated using points classified as classes (2) ground, (3) low vegetation, (4) medium vegetation and (5) high vegetation. The nDSMs and CHMs were genrated using the “CanopyModel” algorithm from the FUSION software [53]. Height models were generated separately for point clouds acquired in 2011 and 2017 airborne campaigns. Results of generating a DTM, an nDSM_buildings and a CHM for the selected subset of the study area are presented in Figure 3.
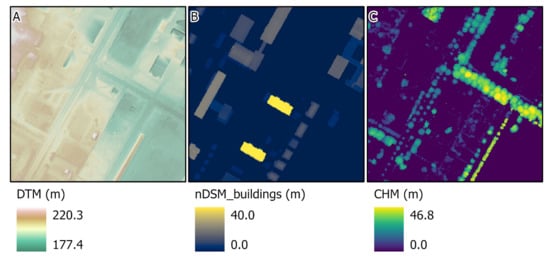
Figure 3.
Results of processing airborne laser scanning point clouds acquired in 2017 for the subset of the study area: Digital Terrain Model (DTM); (A) normalized Digital Surface Model for buildings (nDSM_buildings); (B) Canopy Height Model (CHM) (C).
2.3.2. Initial Classification of Areas Covered by Trees
The nDSMs and CHMs were imported into the eCognition Developer 9.3 software for the preliminary classification of areas covered by high vegetation. It was performed using the object-based classification method with the use of the rule-based approach. The object-based classification method known under the acronym GEOBIA (Geographic Object-Based Image Analysis) is an image analysis method that enables the integration of multi-source data [54]. This method has many advantages over pixel classification, especially in the context of analyzing data with a high spatial resolution [55,56]. A similar approach was used by Guo et al. [36] for creating an initial tree land cover class for further tree crown delineation. In the first step, the buildings were classified using a nDSM_buildings layer. Objects were considered to be buildings with an area of at least 4.0 m and a height of at least 1.0 m. In the next step, based on CHMs generated from classes of points 2–5, vegetation areas were classified, which could constitute potential tree crowns. It was assumed that the crown of a single tree should have an area of at least 3.0 m, and the minimum top height should be at least 3.0 m. The assumption about the minimum size of the tree crown was adopted to eliminate minor errors in the classification of ALS point clouds. These errors mainly consisted of an incorrect classification of power lines into the high vegetation class. The adoption of the minimum height of the tree top at 3.0 m was also aimed at eliminating from the analysis areas covered with shrubs, for which it is difficult to precisely segment individual shrubs based on the nDSM derived from ALS. Finally, the areas classified as potential trees were used in the subsequent analysis for individual tree segmentation. The described analyses were performed separately for ALS from the years 2011 and 2017.
2.3.3. Segmentation of Individual Trees Based on Canopy Height Models
Using the previously created CHMs, single tree segmentation was performed. For this purpose, the algorithm of inverse watershed implemented in eCognition Developer software was used. It is an image segmentation algorithm using the local minima of the indicated raster layer (in this case inverted from a CHM), which are treated as the so-called seeds (treetops) from which segments expand into adjacent pixels with higher values [57]. The expansion of a given segment (tree crown) occurs until it comes into contact with the border of the next segment growing from the adjacent seed (in this case, the top of the tree). This algorithm works well in conditions of managed forest stands where the trees growing next to each other have comparable sizes. In the case of urban green areas, small and big trees often grow next to each other. Thus, it is difficult to properly parameterize the segmentation algorithm to correctly separate all trees [58]. Increasing the minimum area of segments representing tree crowns causes incorrect merging of neighboring crowns of small trees. On the other hand, the use of too small a minimum size for segments results in generating several segments within the crown of a single tree. In order to mitigate the described issues, the segmentation algorithm was parameterized using data collected on 41 reference plots established in June 2019 in Racibórz city. In June 2019, fieldwork was carried out within 41 reference areas of an average area of 0.004 km. The plots were established in places where tree removal had not been carried out in recent years so that the number of trees measured in the field corresponded to the number of trees identified on the CHM from 2017.
The first step of segmentation of tree crowns was performed based on CHMs from 2017 using the same segmentation parameters for all trees. Then, the differences between the number of trees obtained via the segmentation and the actual number of trees determined on 41 reference plots were analyzed. Based on the analysis of errors, in the next step, the segmentation was performed in two stages—using different parameters for trees lower and higher than 16 m. The segmentation parameters were tuned in both groups to minimize the systematic percentage error (percentage bias) calculated based on reference data. Comparison of number of trees detected through segmentation of CHMs with the data from 41 reference plots showed relatively high agreement (R2 = 0.86; mean absolute percentage error = 21.1%; mean percentage error (percentage bias) = 0.3%). The segmentation parameters tuned based on the field data and CHM from 2017 were also used to perform the CHM segmentation from 2011. The results of tree segmentation based on CHMs were saved as two vector layers in ESRI Shapefile format: UTC 2011 and UTC 2017.
2.3.4. Generating UTC Loss Layers
Based on the two vector layers, e.g., UTC 2011 and UTC 2017, the UTC loss vector layer was generated (UTCL 2011–2017). The GIS analysis was performed to compare the UTC 2011 and UTC 2017 layers by calculating the overlapping areas between the layers. The tree loss was identified for tree crowns segmented in 2011 if the tree crown area decreased by 75% or more. In the subsequent analysis, the number of trees identified in the UTCL 2011–2017 layer was compared with the number of trees removed according to administrative decisions within the same period.
The separate UTC loss layer was created for the period from 1 January 2017 to 28 February 2017 when the permit for tree removal in Poland was not required (UTCL 2017). The first step of the analysis was to identify the tree crowns segmented in 2011 for which the crown area decreased by 40% or more between two ALS acquisitions (2011–2017). The threshold of 40% was used in this case to make the analysis more robust and to minimize the potential error of missing the trees removed within the mentioned period. Such detected trees were then subject to visual verification when the operator analyzed each tree on the computer monitor and decided whether this tree could be removed in the period 1 January 2017–28 February 2017. The visual verification was based on the aerial orthophotomap from 1 September 2016 available in the Google Earth application. If the tree crown did not exist on the orthophotomap (2016), it was removed, since it means that it disappeared before the period of interest. To obtain the most accurate estimation of the number of trees removed within the targeted period (1 January 2017–28 February 2017), the information from administrative decisions authorizing tree removal was also analyzed. Based on the information about the number of trees removed with permission within the period 1 September 2016–31 December 2016 for an individual cadastral parcel, the corresponding number of trees were removed from the UTCL 2017 layer within borders of that parcel.
2.4. Comparing Administrative Decisions Regarding the Number of Removed Trees with ALS-Derived UTC Loss Layers
To compare the data from administrative decisions with ALS-derived UTCL layers, the polygons representing removed tree crowns (UTCL layers) were converted to points by finding the centroid of each polygon. In the next step, the obtained points were spatially assigned to the appropriate cadastral parcel. For each parcel, the decision date and the number of trees removed according to administrative decisions were available. The comparison of two data sets consisted of calculating the sum of removed trees according to ALS-derived UTCL layers and the sum of trees from the removal permits for a single registered parcel, taking into account the same period. That allowed for the estimation of the percentage of trees that were removed without permission:
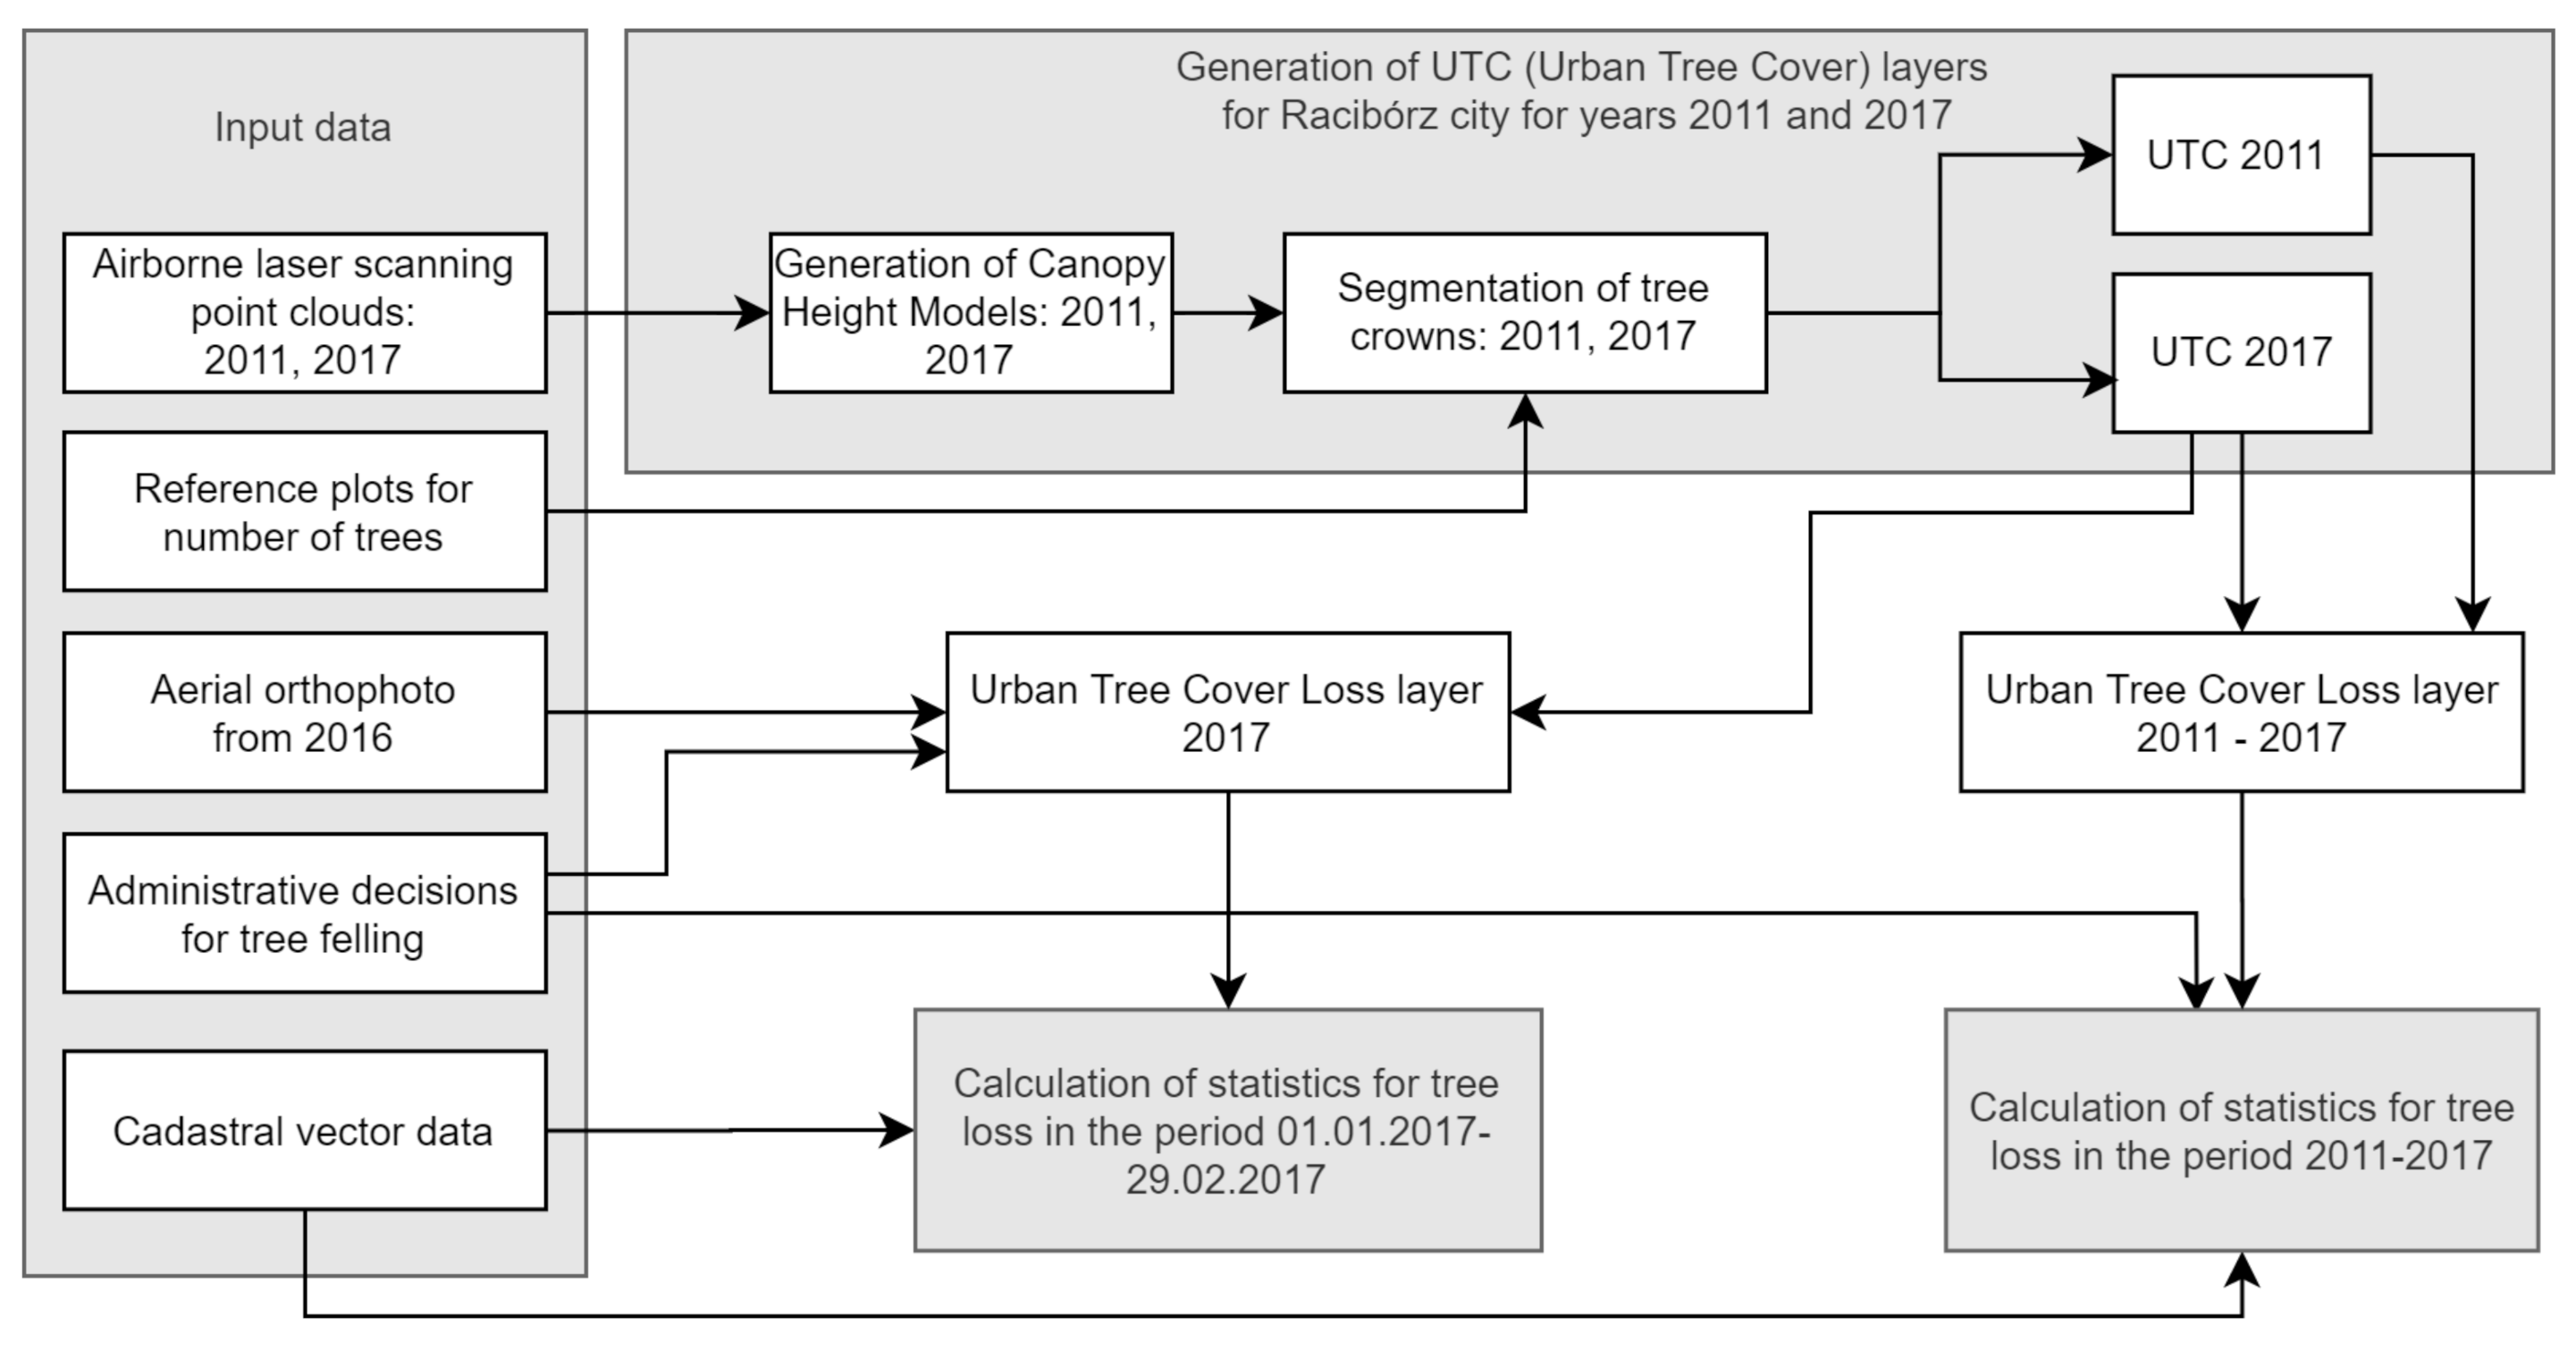
The flowchart summarizing the steps of performed analysis is presented in Figure 4.
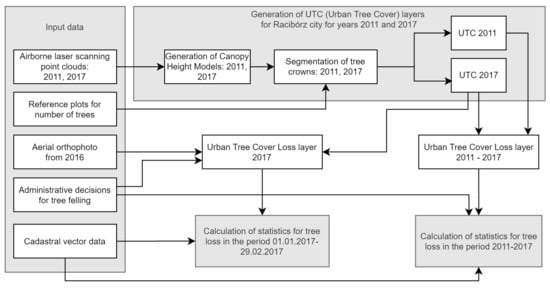
Figure 4.
Flowchart of the analysis performed.
3. Results
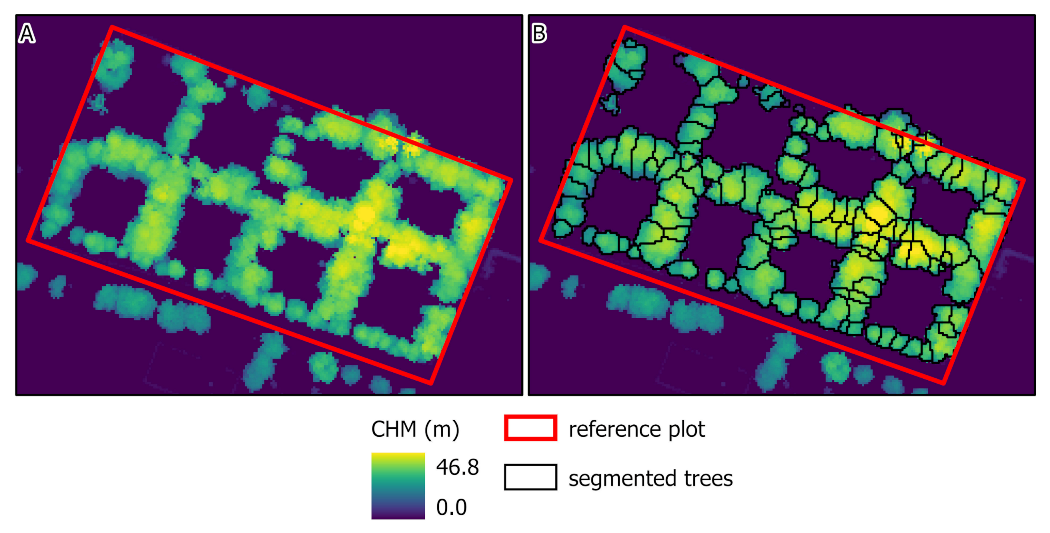
An analysis of UTC changes in Racibórz based on LiDAR data alone shows that in the period of 2011–2017 a total of 113.5 ha of tree crowns disappeared, representing 1.5% of the city area, and 10.8% of the area of all trees growing in 2011. It means the loss of almost 48,000 trees, according to estimates based on the used segmentation method. More than half of them were removed from non-private areas. In the case of private properties 34% disappeared from farms, and 13% from residential areas. Results of tree crown segmentation for the selected reference plot is presented in Figure 5.
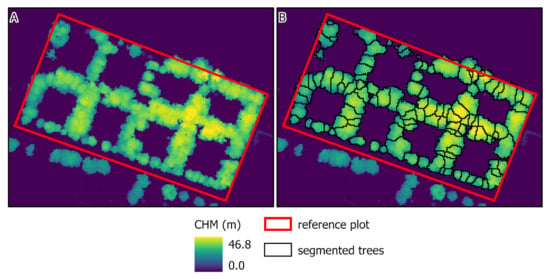
Figure 5.
Results of tree crown segmentation obtained for the selected reference plot: (A) Canopy Height Model (CHM) created from ALS data acquired in 2017; (B) results of tree crown segmentation based on CHM 2017.
3.1. Number of Trees Removed from 2011 to 2016
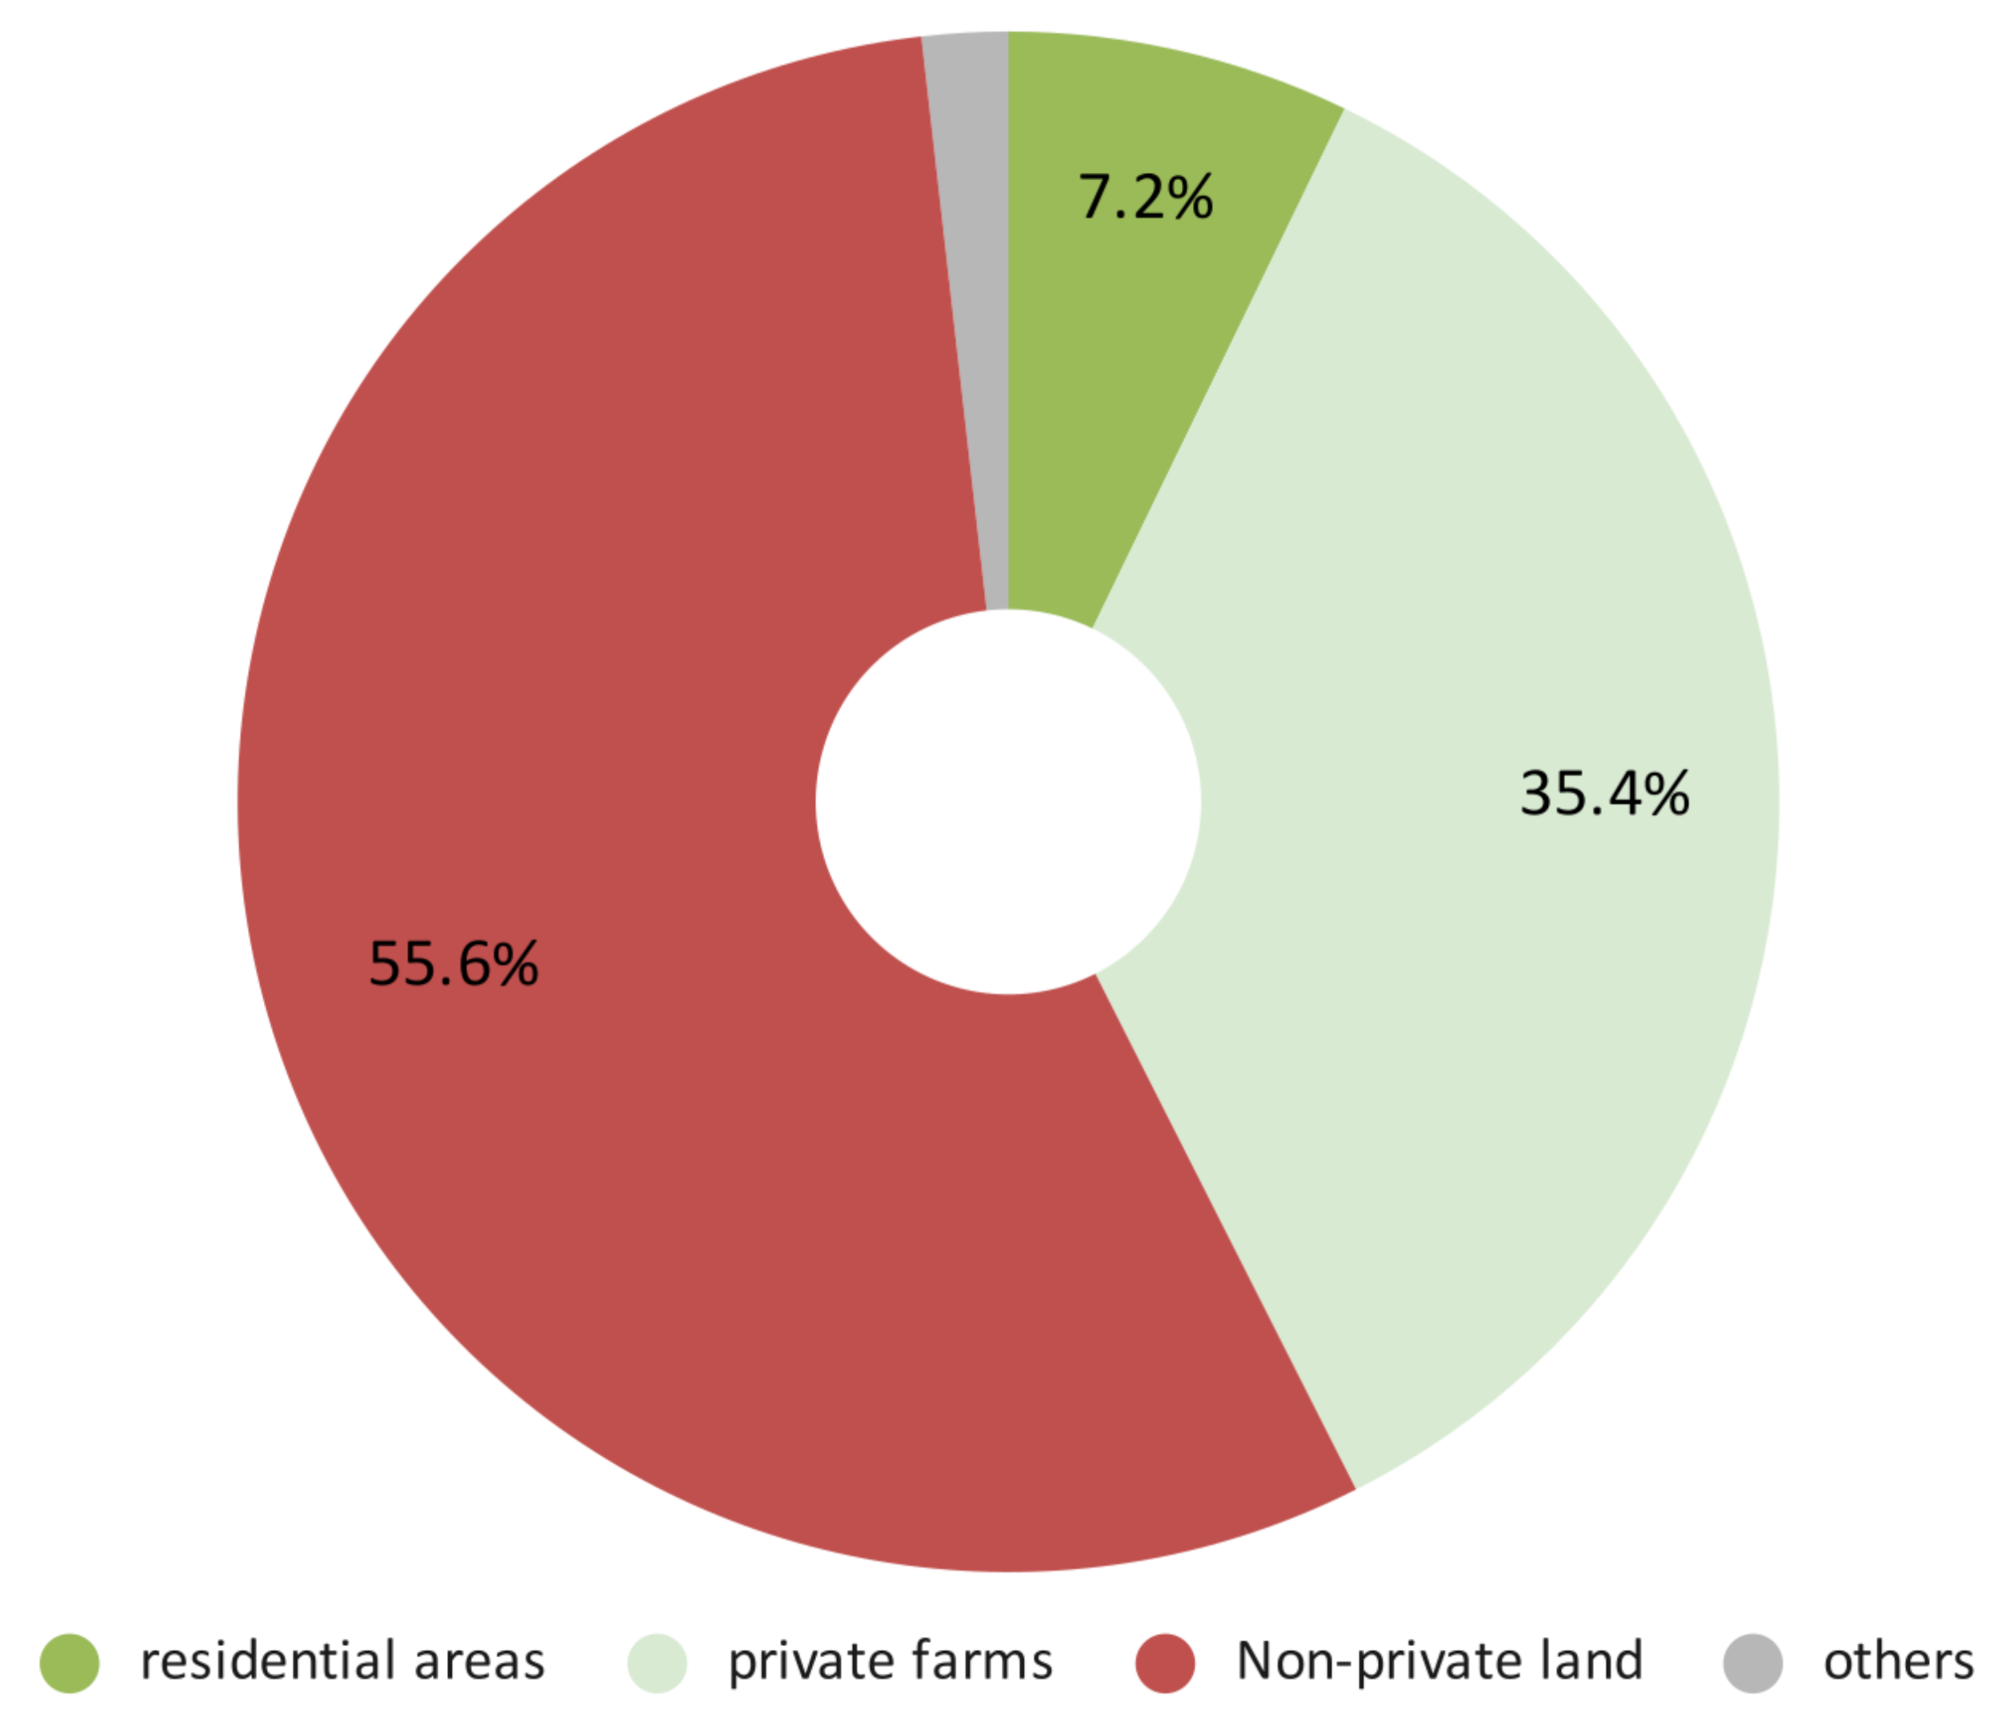
In order to estimate for what proportion of removed trees the permissions were issued we analyze the period of 2011–2016 when the permissions were mandatory. In accordance with the adopted segmentation method, a total of 42,839 trees were cut in 2011–2016 while permits issued at that time concerned 8473 trees. It means that 80% of trees disappeared at that time without obtaining formal consent. According to the administrative records, for the whole city 7.2% of trees for which permits for removing were issued were in private residential areas, 35.4% in farms, and 55.6% in non-private land (Figure 6). Thus it can be estimated that in 2011–2016 a permit was issued for the removal of 593 trees grown in private residential areas and 2966 growing on private farms.
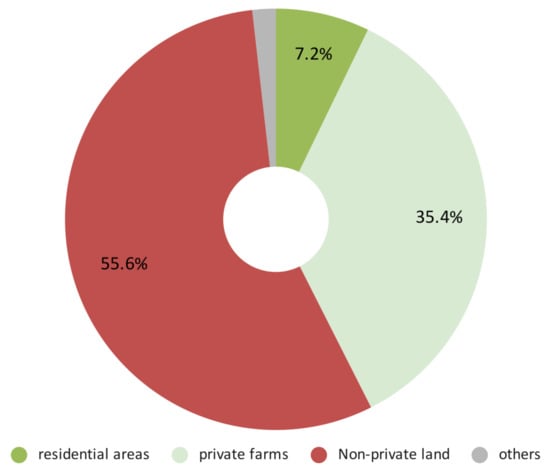
Figure 6.
The shares of land ownership types for the total number of trees removed according to administrative decisions from 2011 to 2016.
In order to estimate for what proportion of removed trees the permissions were issued we analyze the period of 2011–2016 when the permissions were mandatory. In accordance with the adopted segmentation method, a total of 42,839 trees were cut in 2011–2016 while permits issued at that time concerned 8473 trees only. It means that 80% of trees disappeared at that time without obtaining formal consent. According to the administrative records, for the whole city 7.2% of trees for which permits for removing were issued were in private residential areas, 35.4% in farms, and 55.6% in non-private land (Figure 6). Thus it can be estimated that in 2011–2016 a permit was issued for the removal of 593 trees grown in private residential areas and 2966 growing on private farms.
According to the analysis of ALS data, 44% of trees were cut on private properties. The estimated number of trees that disappeared from the two categories of private areas was 4622 and 14,224 trees, respectively. Thus comparing the number of trees removed in the period 2011–2016 according to ALS data and administration decisions, 87.2% of trees that disappeared from private residential land were cut down without obtaining permission. The same situation applies to 79.1% of trees owned by farmers.
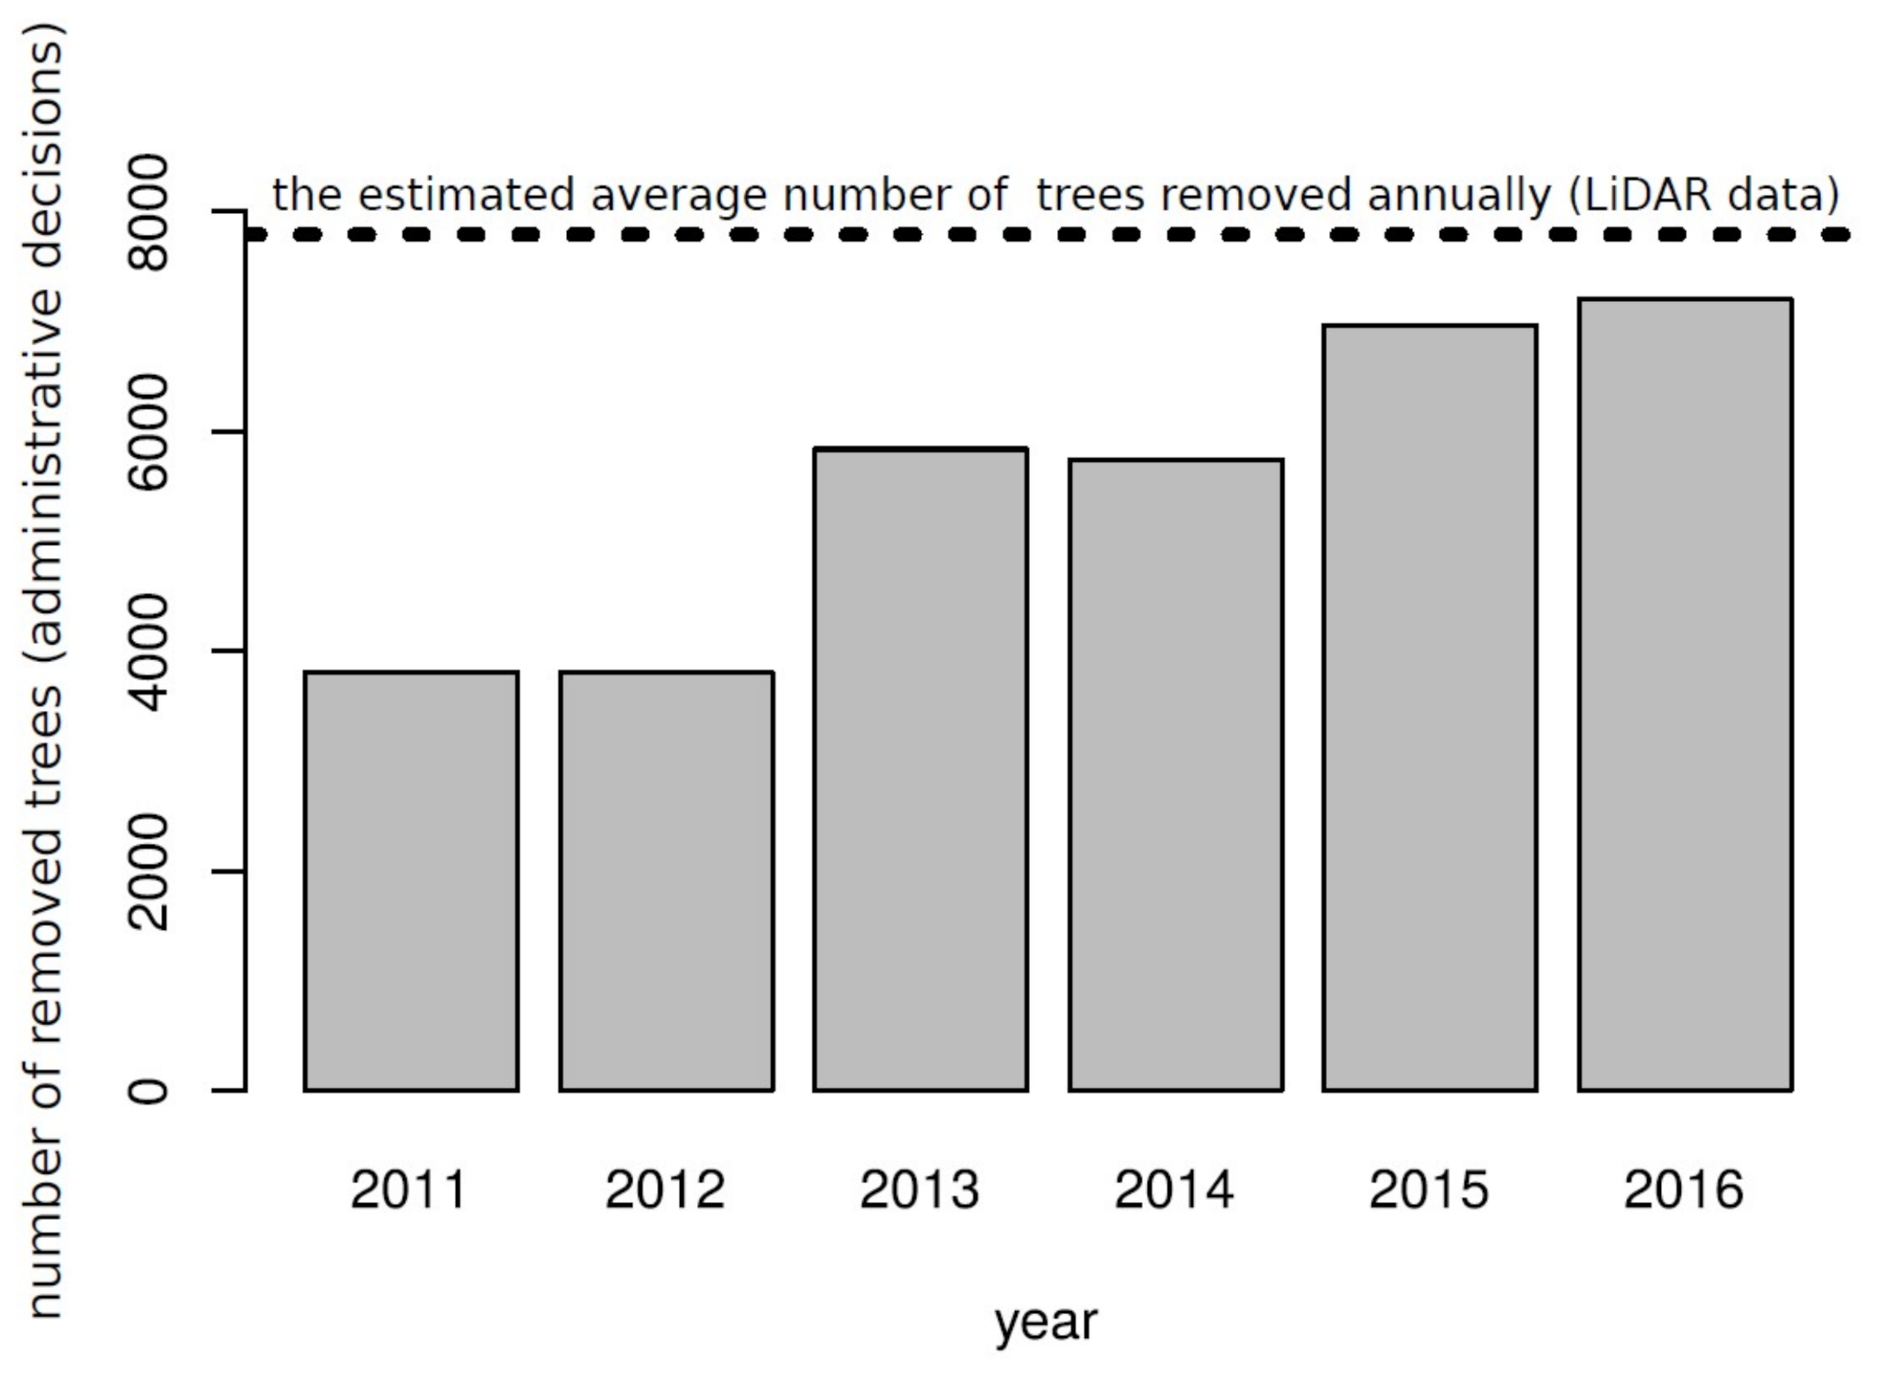
The number of applications for permission to remove trees increased annually. We cannot determine whether this increase was related to residents’ growing awareness regarding applicable legal provisions or the increasing demand for tree removal. Assuming the constant number of trees cut down annually by the inhabitants, the number of tree removal applications in 2016 was lower than the actual number of trees removed by 7.6% (Figure 7).
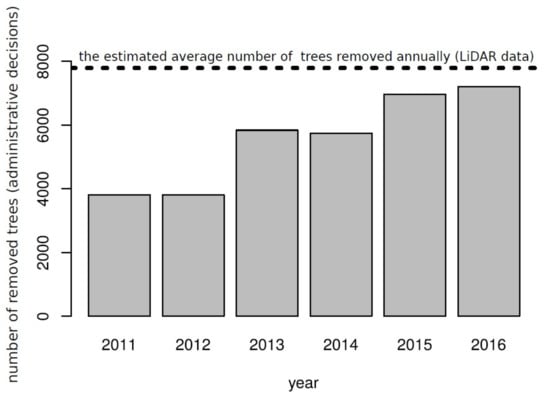
Figure 7.
Comparison of the number of tree removal permits issued annually with the average number of trees removed annually estimated based on ALS data.
3.2. Number of Trees Removed in the Period of January–February 2017
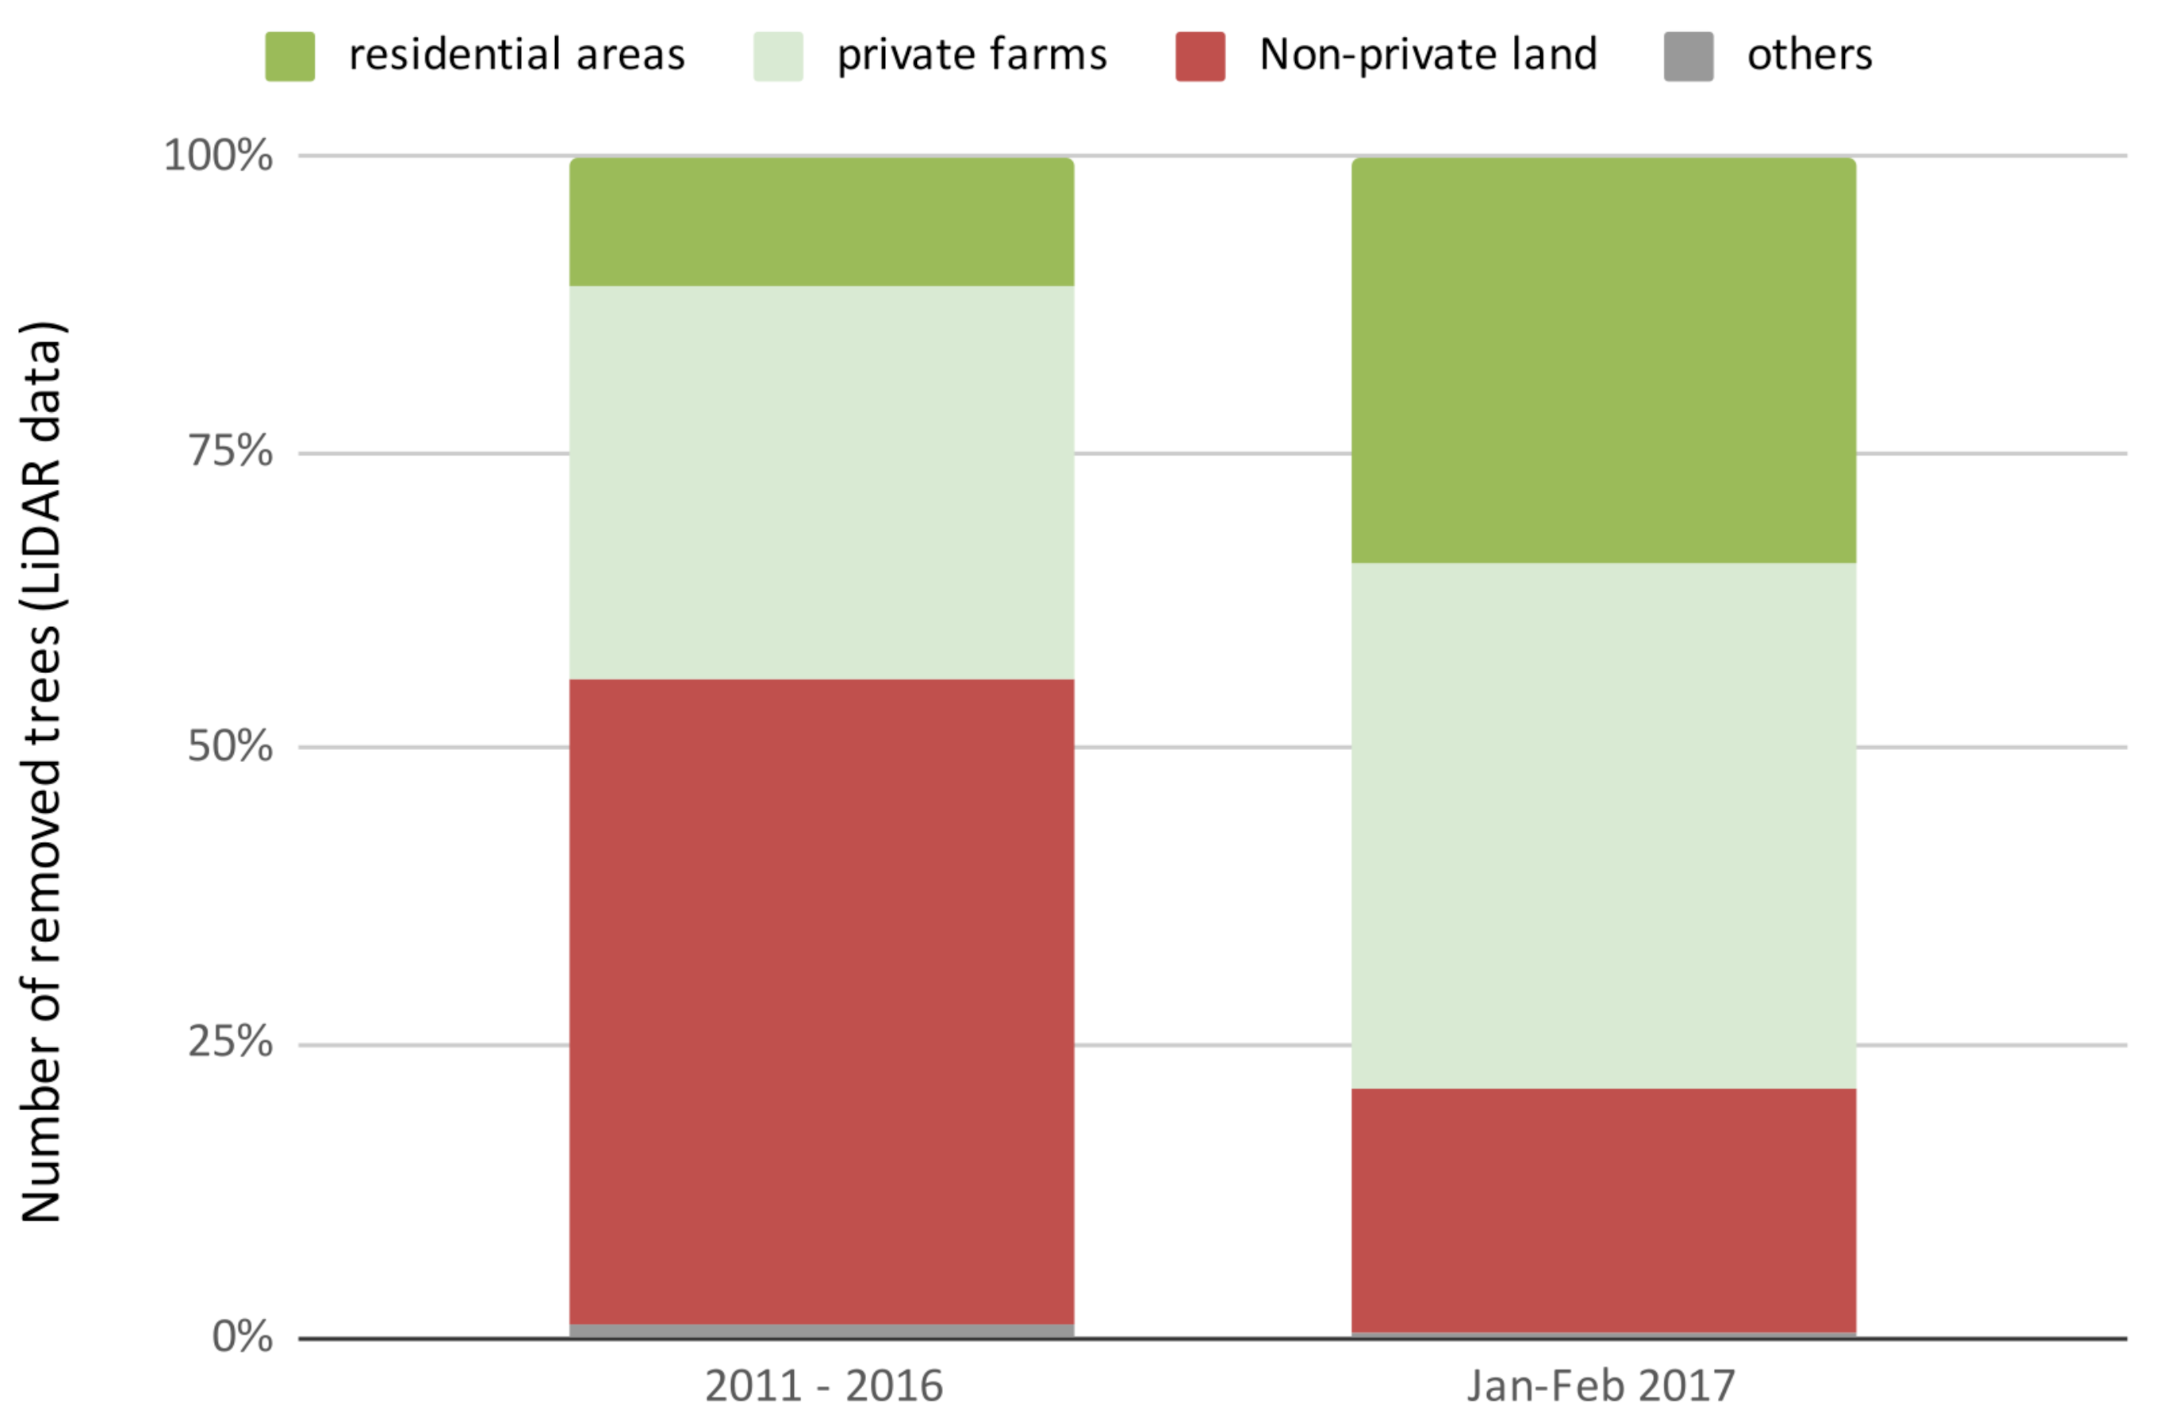
Concerning the removal of trees at the beginning of 2017, when the regulations were changed, it can be estimated that 5075 trees were cut at that time, 78% of which were in both types of private areas: 34% in residential areas and 44% on private farms. It is a substantial increase in the share of trees removed on these land ownership compared to the previous period (Figure 8). In the period of 2011–2016, average 70 trees were removed monthly on private residential areas and 216 on private farms. During the first two months of 2017, when the mandatory permits for tree removal were lifted, the estimated numbers of removed monthly trees in these areas were 874 and 1125, respectively while the rest concerned non-private lands. Noteworthy, a significant contribution to this number was made by large-area tree removal taking place on 14 large parcels located on the outskirts of the city. Almost 2000 trees, which covered 22% to 35.8% of the plot’s area, disappeared from those parcels. In other locations, mostly a few trees were cut down (average two per property).
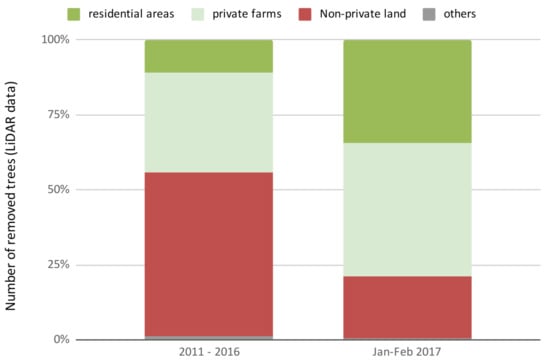
Figure 8.
The shares of types of land ownership in the total tree removal in two time periods: 2011–2016 (tree permit obligation) and the beginning of 2017 (the tree permit obligation on private properties lifted).
4. Discussion
4.1. Influence of Tree Removal Policy on the UTC Change on Private Properties
This research shows that the Racibórz case follows the general trend observed around the world in relation to decreasing UTC in cities [8,9,10,12], the area covered by trees shrank by 10% during the studied period of 2011–2017. It resulted in the loss of 48,000 trees, among which almost 47% disappeared on private properties. Thus, the regulations aiming at the protection of trees in these area, appeared unsatisfactory.
The change of the regulation in 2017 that allowed tree removal without permits increased tree removal. It is in line of the previous observations [44,45,46]. However, it cannot be determined whether this change would be long-lasting or temporary, as Conway and Urbani have already pointed out [43]. In this context, it is essential to analyze not only the UTC change but also the reasons and aggregated dynamics of the removal of trees. The increased removal in the time of releasing the restrictions could stem from a need to get rid of individual trees that were problematic for the owners. After a while, the situation would stabilize. Just as opportunity makes the thief, a change in the law could have only accelerated the decision, which would happen in the long run anyway.
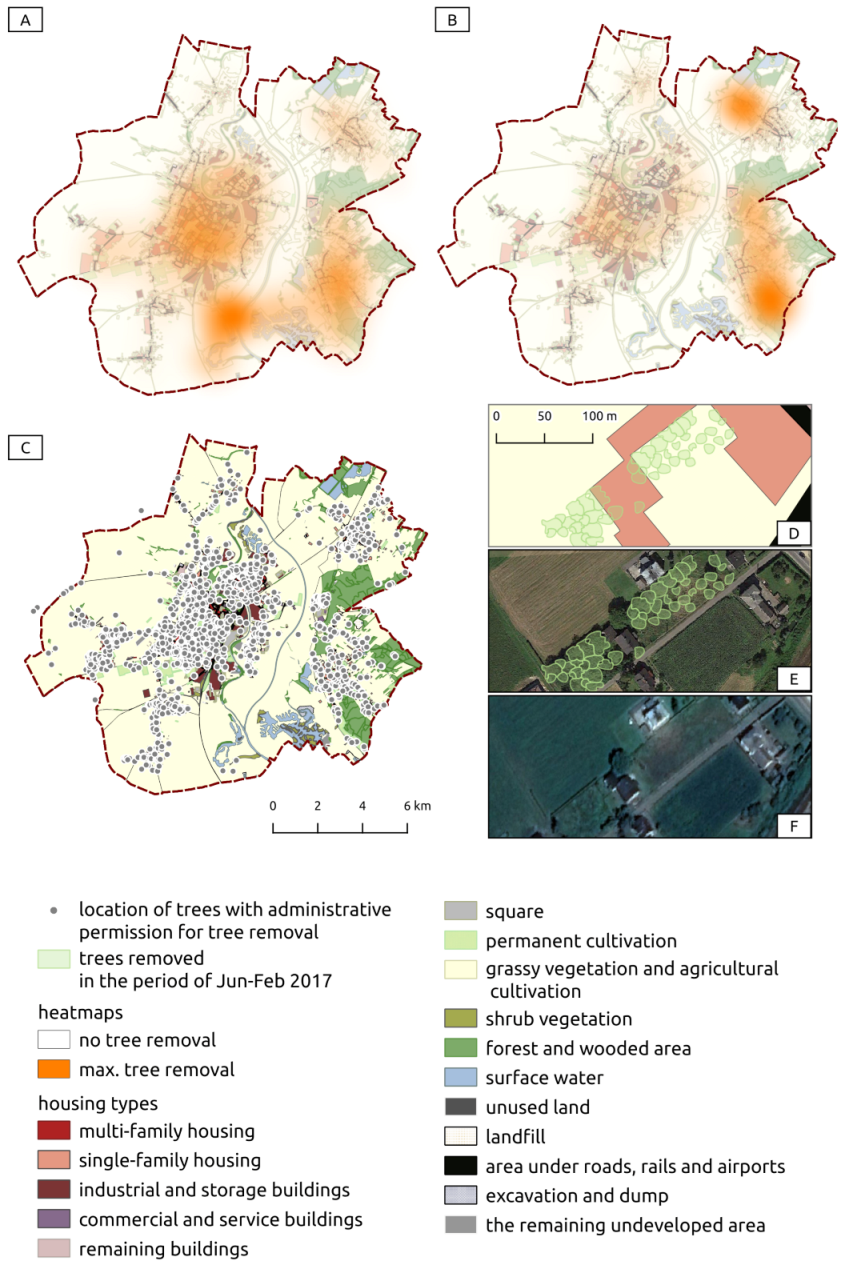
There are many reasons why people choose to fell trees [59]. In the case of Racibórz it appeared that in the period when the permits were lifted, it regarded mainly large-scale tree removal in a few plots. Considering the whole period 2011–2017 (Figure 9A), the most significant UTC loss is related to the regulation of the banks of the Odra River and related floodplains. The decision to remove trees in such areas belonged to the relevant water management bodies and did not require obtaining a felling permit. The large share of tree removal also concerns the city center, while when considering only the trees removed in early 2017 (Figure 9B), it is barely noticeable. Instead, the share of housing estates located on the outskirts of the city becomes clear. Removal in 14 plots (one of them is shown on the Figure 9D) constituted 65% of trees cut at the beginning of 2017. That allows us to suppose that the main reasons inhabitants cut down trees were not security or lack of knowledge but rather redevelopment activities. A similar situation took place in Christchurch, New Zealand [11]. However, it is difficult to interpret to what extent the cutting resulted from private landowners’ needs and to what extent, in the long run, it was aimed at commercial, developmental purposes. In the latter case, it would mean abuse of the introduced legal changes. A more straightforward assessment of this situation would require further observation in subsequent years, as the amendment to the 2016 Act [40] prohibits the sale of a plot in the next five years after trees were removed. In any case, if reconstruction or development activities were the reason for large-scale tree removal, it would be a clear signal to national and local law-making institutions that this issue requires attention. The regulations present in Poland till the end of 2016 were criticized as imposing the unnecessary burden for both landowners and the administration as the same procedure applied for a single tree and a large number of trees removal. However, liquidating the regulation involved additional tree removal. Thus, there is a need for urban tree protection policies sensitive to the types of land in terms of number of trees.
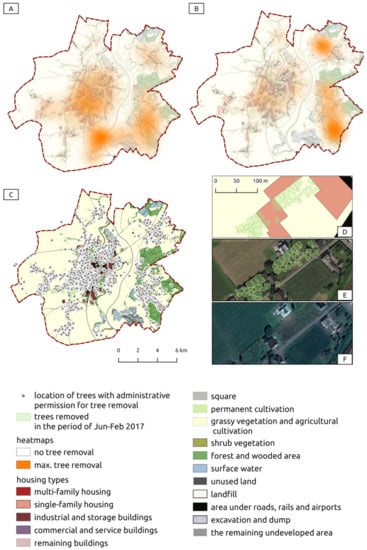
Figure 9.
The intensity of UTC loss visualized in the form of heat maps created for two time periods: 2011–2017 (A) and the beginning of 2017 (B), compared with the location of trees for which a felling permit was issued in 2011–2017 (C); and the zoom-in showing exemplary large-scale tree removal (D) also indicated with Google Earth images from 1 September 2016 (E) and 30 July 2017 (F), not indicated on the Racibórz map to preserve the anonymity of the landowners; Basemap: the land cover based on open source data available on [51].
The study underlines the importance of regulations compliance. As the changes to the law introduced at the beginning of 2017 were short-lived, assessing the effectiveness of previously binding legal regulations is critical. Meanwhile, the results from 2011–2016 indicate that a relatively large number of trees were cut down without permission in 2011–2016. Two explanations can be posed in this context. First, the tree preservation regulations on private properties were ineffective due to a lack of proper monitoring systems. The second explanation is that the majority of trees in private areas did not require permission for their removal (e.g., being fruit trees or small trees in diameter). Thus, the exceptions in existing regulation might have influenced UTC significantly. The letter explanation suggests that tree protection in private areas need to be even more restricted to protect against decreasing UTC. That supports empirically the results of Lavy and Hegelman’s [34] analysis on law in Texas. Both reasons confirm the importance of regular monitoring of tree protection policies’ effects, and remote sensed data has a vital role in this subject.
ALS point clouds allow not only to analyze the intensity of tree removal in selected time periods but also enable checking the effectiveness of restrictions in this regard, if they exist. In conjunction with a reliable spatial database on the granted permits for felling (Figure 9C), they enable one to indicate the locations for which such a decision was not issued and whether the situation was legal. Local authorities can also analyze the affected land cover types and draw conclusions for future protection strategies. It is especially important when regulations assume certain exceptions. In the case study discussed in this paper, thanks to the analysis of bi-temporal ALS point clouds, it was possible to identify specific locations that may raise doubts about whether the tree removal without permission was following the regulations that entered into force in Poland in 2017 (i.e., Figure 9D). It is also important that at this stage, future monitoring can be realized even with the use of satellite images only (Figure 9E,F). Therefore, the knowledge that we gain by using remote sensed data (ASL and aerial orthophotos) appears crucial for assessing environmental policies and the management of urban greenery on private properties.
However, residents’ support for the principles of tree protection involves acceptance of treating their properties as a public good [25,26]. It is not always the case. Residents’ behavior concerning greenery in private areas may be influenced by their neighbors [47]. It is related to the willingness to maintain nearby households’ prestige and expresses belonging to a specific lifestyle group. Exploring these issues requires both detailed spatial data, in terms of issued administrative decisions, and data on residents’ knowledge, awareness, and attitudes. This would allow for the development of a more elaborate analysis informative for effective regulations that could propose not only the penalty system but also the incentives.
4.2. Combing Information of UTC Change with Permits Issued for Tree Removal
We claim that monitoring of tree cover is crucial in green areas management. Nevertheless, ALS data from various time points are so far rarely used to analyze factors affecting the number of trees cut down in private areas. Usually, such analyzes are subject to many limitations, such as data availability at selected time points or their accuracy or spatial extent. The methodology presented in the article allows supplementing incomplete ALS data with administrative information regarding the permits issued to remove trees, thus limiting the interpretation uncertainty of results. The observation presented above would not be possible if the change in UTC based on ALS data and the administrative data were analyzed separately.
A reliable assessment requires the ability to compare administrative data with an analysis of actual changes in UTC. Our work presents a workable methodological approach in this regard. However, tree crown segmentation in the city environment is a challenging task. To avoid big over- or underestimating the real number of trees, we parameterized the segmentation algorithm based on the reference field plots. The comparison of the number of trees derived from segmentation and the actual number of trees showed relatively high agreement and low systematic error. However, it has to be kept in mind that the applied segmentation algorithm was not validated based on “unseen data” [60] because all of the 41 field plots were used for parameterization of the algorithm. The analysis of UTC loss for the beginning of the year 2017 can be treated as more accurate. In that case, the results of automatic segmentation were also checked through manual photo interpretation. We decided to apply this approach since the manual delineation of all trees, as done for example by Guo et al. [36], although it is time-consuming and not error-free. Thus, it is not feasible for large-scale cases. One of the aims of our study was to combine ALS data with administrative decisions in the context of tree removal monitoring rather than providing a ready to use tree segmentation approach for urban areas. In the case of using ALS data for UTC monitoring, it is usually more common to base on the area of tree crowns instead of the number of trees [9]. A tree crown area can be easier derived from ALS point clouds and provide a better proxy to calculate ES [61]. However, for monitoring a tree protection policy, tree segmentation was necessary. It enabled the comparison of permits’ administrative records, where information about tree crown area was not available with the independent data set to assess different law regulations’ effectiveness. Future studies should put an effort in development of robust tree segmentation methods, specifically dedicated for urban areas. Recent advancements in methods of data analysis, such as deep learning approaches dedicated for analysis of 3D point clouds [62], together with possibilities of acquiring very high density point clouds [63], might provide big contribution to research and practical applications of LiDAR technology in context of UTC monitoring.
4.3. Limitations of the Study
Our study has several limitations. The first one is the quality and availability of administrative data mentioned in the chapter concerning input data, especially those relating to removal permits. The accuracy of the estimation depends on the quality efficiency of tree location data collected by offices. Cadastral data having accurate georeferencing of every single property is also important. The database we used was often inconsistent and incomplete. There were missing or erroneous data in the records resulting in the impossibility of correct allocation of individual decision detection. This problem concerned 11% of the analyzed decisions. That is why a detailed analysis indicating land plots that had not obtained consent for tree removal was not possible. Records often lacked the exact locations of tree removal, or the addresses provided do not exist. In many cases, it was impossible to geolocate removed trees and make a more elaborated spatial analysis. The cadastral data were also incomplete, although to a much lesser extent. The lack of information about the type of ownership concerned only 1% of the plots. Thus, the methodology we propose does not allow detailed indications of plots of land where abuses occurred.
The approach we propose would also provide more opportunities if ALS data were collected more frequently, which is still a long way off, at least in Poland. It would help analyze UTC changes in the city’s specific areas in more detail and investigate their causes. Additionally, it would enable us to compare UTC changes in subsequent years with the administrative decisions issued. Without this information, we cannot determine yearly dynamics of the number of trees being cut down between 2011–2016. Nevertheless, the proposed method makes it possible to assess the effectiveness of introduced regulations in general. Of course, frequently collecting ALS data requires additional financial resources, so it is worth considering in the future also comparative analysis of accuracy and costs using alternative methods allowing for detailed monitoring of UTC. Automatic urban tree coverage mapping with LiDAR data can be also performed, e.g., using artificial intelligence models, to ensure efficiency and quality. Timilsina et al. [64] demonstrated that a combination of Convolution Neural Network (CNN) with OBIA based on very high-resolution (VHR) aerial ortophotomap and LiDAR data results in 93.2% overall accuracy (OA) of classification for mapping urban trees within cadastral parcels. Object-Based CNN (OB-CNN) was also used to mapping UTC changes using Google Earth imageries and LiDAR datasets with 96% and 98% OA [65]. Deeper CNN methods such as Region-based CNN (R-CNN) with manually generated training samples were used by Wang et al. [58] with 86% OA in identifying flowering trees. One of the most promising techniques is generating image-derived point clouds from images acquired from aircraft or Remotely Piloted Aircraft Systems (RPAS), commonly known as Unmanned Aerial Vehicles (UAVs) or just as drones (Dandois i Ellis, 2013). One should also not forget about the new possibilities of the Earth Observation (EO) satellites which can provide multispectral images (0.15 to 3 m ground sampling distance; GSD), even daily. The plans of the new constellations show that the acquisition of images will be possible even several dozen times a day (SkySat Planet Labs., MAXAR), which will give decision-makers strong geoinformatics tools to monitor the state of greenery in the city.
5. Conclusions
The study presented a new adapted method of using LiDAR point clouds for UTC change analyses. Its application may be of particular importance when the ALS datasets are insufficient. The obtained results point out a few insights essential for the effective assessment of tree protection regulations on private property.
First of all, it shows that the necessity to obtain consent for tree removal on private property does not guarantee local authorities’ full control in this regard. In the case of Racibórz, it turned out that in 2011–2016 most of the trees were cut down without obtaining permission. No matter the actual reason behind that issue, the uncontrolled loss of almost 19,000 trees in practice shows such regulations’ ineffectiveness.
Secondly, lifting the obligatory permission for tree removal on private property caused even more intense UTC loss in this type of land ownership. This indicates that restrictions concerning the owners of trees growing on private land are not without significance in this respect. Nevertheless, to ensure satisfactory policy outcomes’ results, they must be introduced together with properly planned monitoring of UTC changes in these areas.
Thirdly, the presented results highlight the role of ALS point clouds in this scope. Their wider use by the public administration is essential to create environmental policies not only based on theoretical assumptions but also real data. These, if collected regularly, can provide new insights into the behavior of residents in the field of tree removal. In a situation where there are gaps in geodata, in periods when LiDAR point clouds are not obtained due to high costs, it is necessary to use aerial photo matching techniques or unmanned aircraft systems (generating even denser point clouds but with limited penetration through vegetation). Taking them into account may help construct better legal solutions and incentives to plant and keep urban trees and shrubs in the entire city also on private properties.
Fourthly, the presented results show the very necessity to regularly monitor the functioning of implemented policies based on spatial data. The state’s role should be to facilitate setting appropriate standards in this regard than on creating specific regulations concerning removing trees on private properties on the local level. We agree with the recent claim in a study of the effective implementation of land-use planning regulations in Australia that evaluation guidelines are crucial to achieving the intended results [66]. Otherwise, top-down goals are often not included in local documents, not to mention monitoring their implementation. Similar conclusions appeared in the review of legal regulations regarding urban sustainability plans in selected US cities [35]. It showed that in many cases, UTC growth goals do not take into account the monitoring plan. At the same time, only an adequately designed valuation of existing regulation enables one to create practical solutions in this respect.
Author Contributions
Conceptualization, P.P., P.H., K.Z.-K., A.I., K.M., P.W., P.M.; methodology, P.P., P.H., K.Z.-K., A.I., P.W.; validation, P.H., A.I.; formal analysis, P.P., P.H.; investigation, P.P., P.H., K.Z.-K., A.I.; resources, P.P., P.H., K.Z.-K., P.W., A.I., K.M.; data curation, P.P., P.H., A.I.; P.W.; writing—original draft preparation, P.P., P.H., K.Z.-K., A.I., K.M., P.W., P.M.; writing—review and editing, P.P., P.H., K.Z.-K., A.I., K.M., P.W., P.M.; visualization, K.Z.-K., P.P.; P.H.; supervision, P.M, P.W.; project administration, P.M., K.M; funding acquisition, P.P., K.M., P.W., P.M. All authors have read and agreed to the published version of the manuscript.
Funding
This research was funded by the National Science Centre, Poland, under grant number 2017/25/B/HS6/00954; and the Foundation for Polish Science (FNP) (scholarship START edition 2020).
Acknowledgments
We would like to thank the Central Office of Geodesy and Cartography in Poland (GUGiK) for providing open LiDAR data and aerial orthophotography data and the City Hall in Racibórz for providing the database of permission for felling trees. Research assistance by Marcin Mielewczyk is gratefully acknowledged.
Conflicts of Interest
The authors declare no conflict of interest.
References
- Costanza, R.; d’Arge, R.; de Groot, R.; Farber, S.; Grasso, M.; Hannon, B.; Limburg, K.; Naeem, S.; O’Neill, R.V.; Paruelo, J.; et al. The value of the world’s ecosystem services and natural capital. Nature 1997, 387, 253–260. [Google Scholar] [CrossRef]
- Jennings, V.; Larson, L.; Yun, J. Advancing Sustainability through Urban Green Space: Cultural Ecosystem Services, Equity, and Social Determinants of Health. Int. J. Environ. Res. Public Health 2016, 13, 196. [Google Scholar] [CrossRef]
- Biernacka, M.; Kronenberg, J. Urban green space availability, accessibility and attractiveness, and the delivery of ecosystem services. Cities Env. 2019, 12, 5. [Google Scholar]
- Reid, W.; Mooney, H.; Cropper, A.; Capistrano, D.; Carpenter, S.; Chopra, K.; Millennium Ecosystem Assessment. Ecosystems and Human Well-Being: Synthesis. 2005. Available online: www.islandpress.org/bookstore/details.php?prod_id=1119 (accessed on 16 February 2021).
- Haines-Young, R.; Potschin, M. Common International Classification of Ecosystem Services (CICES, Version 4.1); European Environment Agency: Copenhagen, Denmark, 2012. [Google Scholar]
- Takács, Á.; Kiss, M.; Hof, A.; Tanács, E.; Gulyás, Á.; Kántor, N. Microclimate Modification by Urban Shade Trees—An Integrated Approach to Aid Ecosystem Service Based Decision-making. Procedia Environ. Sci. 2016, 32, 97–109. [Google Scholar] [CrossRef]
- Hasselström, L.; Visch, W.; Gröndahl, F.; Nylund, G.M.; Pavia, H. The impact of seaweed cultivation on ecosystem services—A case study from the west coast of Sweden. Mar. Pollut. Bull. 2018, 133, 53–64. [Google Scholar] [CrossRef] [PubMed]
- Nowak, D.J.; Greenfield, E.J. Declining urban and community tree cover in the United States. Urban For. Urban Green. 2018, 32, 32–55. [Google Scholar] [CrossRef]
- Croeser, T.; Ordóñez, C.; Threlfall, C.; Kendal, D.; van der Ree, R.; Callow, D.; Livesley, S.J. Patterns of tree removal and canopy change on public and private land in the City of Melbourne. Sustain. Cities Soc. 2020, 56, 102096. [Google Scholar] [CrossRef]
- Daniel, C.; Morrison, T.H.; Phinn, S. The governance of private residential land in cities and spatial effects on tree cover. Environ. Sci. Policy 2016, 62, 79–89. [Google Scholar] [CrossRef]
- Guo, T.; Morgenroth, J.; Conway, T.; Xu, C. City-wide canopy cover decline due to residential property redevelopment in Christchurch, New Zealand. Sci. Total Environ. 2019, 681, 202–210. [Google Scholar] [CrossRef]
- Mincey, S.K.; Schmitt-Harsh, M.; Thurau, R. Zoning, land use, and urban tree canopy cover: The importance of scale. Urban For. Urban Green. 2013, 12, 191–199. [Google Scholar] [CrossRef]
- Hartmann, T.; Slavíková, L.; McCarthy, S. (Eds.) Nature-Based Flood Risk Management on Private Land; Springer International Publishing: Cham, Switzerland, 2019. [Google Scholar] [CrossRef]
- Kamal, S.; Grodzińska-Jurczak, M.; Brown, G. Conservation on private land: A review of global strategies with a proposed classification system. J. Environ. Plan. Manag. 2014, 58, 576–597. [Google Scholar] [CrossRef]
- Kaspar, J.; Kendal, D.; Sore, R.; Livesley, S. Random point sampling to detect gain and loss in tree canopy cover in response to urban densification. Urban For. Urban Green. 2017, 24, 26–34. [Google Scholar] [CrossRef]
- Heynen, N.; Perkins, H.A.; Roy, P. The Political Ecology of Uneven Urban Green Space. Urban Affairs Rev. 2006, 42, 3–25. [Google Scholar] [CrossRef]
- Goddard, M.A.; Dougill, A.J.; Benton, T.G. Scaling up from gardens: Biodiversity conservation in urban environments. Trends Ecol. Evol. 2010, 25, 90–98. [Google Scholar] [CrossRef] [PubMed]
- Braaker, S.; Moretti, M.; Boesch, R.; Ghazoul, J.; Obrist, M.K.; Bontadina, F. Assessing habitat connectivity for ground-dwelling animals in an urban environment. Ecol. Appl. 2014, 24, 1583–1595. [Google Scholar] [CrossRef]
- Hale, J.D.; Fairbrass, A.J.; Matthews, T.J.; Sadler, J.P. Habitat Composition and Connectivity Predicts Bat Presence and Activity at Foraging Sites in a Large UK Conurbation. PLoS ONE 2012, 7, e33300. [Google Scholar] [CrossRef]
- Ossola, A.; Locke, D.; Lin, B.; Minor, E. Yards increase forest connectivity in urban landscapes. Landsc. Ecol. 2019, 34, 2935–2948. [Google Scholar] [CrossRef]
- Mincey, S.K.; Vogt, J.M. Watering strategy, collective action, and neighborhood-planted trees: A case study of Indianapolis, Indiana, US. Arboric. Urban For. 2014, 40, 84–95. [Google Scholar]
- Marschall, M.J. Citizen Participation and the Neighborhood Context: A New Look at the Coproduction of Local Public Goods. Political Res. Q. 2004, 57, 231–244. [Google Scholar] [CrossRef]
- Lyytimäki, J.; Sipilä, M. Hopping on one leg—The challenge of ecosystem disservices for urban green management. Urban For. Urban Green. 2009, 8, 309–315. [Google Scholar] [CrossRef]
- Speak, A.; Escobedo, F.J.; Russo, A.; Zerbe, S. An ecosystem service-disservice ratio: Using composite indicators to assess the net benefits of urban trees. Ecol. Indic. 2018, 95, 544–553. [Google Scholar] [CrossRef]
- Kirkpatrick, J.; Davison, A.; Daniels, G. Resident attitudes towards trees influence the planting and removal of different types of trees in eastern Australian cities. Landsc. Urban Plan. 2012, 107, 147–158. [Google Scholar] [CrossRef]
- Conway, T.M.; Bang, E. Willing partners? Residential support for municipal urban forestry policies. Urban For. Urban Green. 2014, 13, 234–243. [Google Scholar] [CrossRef]
- Pandit, R.; Polyakov, M.; Sadler, R. Valuing public and private urban tree canopy cover. Aust. J. Agric. Resour. Econ. 2013, 58, 453–470. [Google Scholar] [CrossRef]
- Saphores, J.D.; Li, W. Estimating the value of urban green areas: A hedonic pricing analysis of the single family housing market in Los Angeles, CA. Landsc. Urban Plan. 2012, 104, 373–387. [Google Scholar] [CrossRef]
- Adams, L.W.; Van Druff, L.W.; Luniak, M. Managing urban habitats and wildlife. In Techniques for Wildlife Investigations and Management, 6th ed.; The Wildlife Society: Bethesda, MD, USA, 2005; pp. 714–739. [Google Scholar]
- Narducci, J.; Quintas-Soriano, C.; Castro, A.; Som-Castellano, R.; Brandt, J.S. Implications of urban growth and farmland loss for ecosystem services in the western United States. Land Use Policy 2019, 86, 1–11. [Google Scholar] [CrossRef]
- Rimal, B.; Sharma, R.; Kunwar, R.; Keshtkar, H.; Stork, N.E.; Rijal, S.; Rahman, S.A.; Baral, H. Effects of land use and land cover change on ecosystem services in the Koshi River Basin, Eastern Nepal. Ecosyst. Serv. 2019, 38, 100963. [Google Scholar] [CrossRef]
- Wang, W.; Wu, T.; Li, Y.; Xie, S.; Han, B.; Zheng, H.; Ouyang, Z. Urbanization Impacts on Natural Habitat and Ecosystem Services in the Guangdong-Hong Kong-Macao “Megacity”. Sustainability 2020, 12, 6675. [Google Scholar] [CrossRef]
- Nasemann, A. Fällen Verboten. Available online: https://www.sueddeutsche.de/geld/baeume-faellen-verboten-1.3585349 (accessed on 30 September 2020).
- Lavy, B.L.; Hagelman, R.R. Protecting the urban forest: Variations in standards and sustainability dimensions of municipal tree preservation ordinances. Urban For. Urban Green. 2019, 44, 126394. [Google Scholar] [CrossRef]
- Benton-Short, L.; Keeley, M.; Rowland, J. Green infrastructure, green space, and sustainable urbanism: Geography’s important role. Urban Geogr. 2017, 40, 330–351. [Google Scholar] [CrossRef]
- Guo, T.; Morgenroth, J.; Conway, T. Redeveloping the urban forest: The effect of redevelopment and property-scale variables on tree removal and retention. Urban For. Urban Green. 2018, 35, 192–201. [Google Scholar] [CrossRef]
- Green Spaces. Available online: https://www.r3-trees.com/ (accessed on 30 September 2020).
- Feltynowski, M.; Kronenberg, J.; Bergier, T.; Kabisch, N.; Łaszkiewicz, E.; Strohbach, M.W. Challenges of urban green space management in the face of using inadequate data. Urban For. Urban Green. 2018, 31, 56–66. [Google Scholar] [CrossRef]
- Krynicki, M.; Witkoś Gnach, K. Monitoring standardów w zarządzaniu zielenią wysoką w największych miastach Polski. Technical Report. 2016. Available online: http://drzewa.org.pl/publikacja/1075-2/ (accessed on 30 September 2020).
- The Act of December 16, 2016 Amending the Act on Nature Protection and the Act on Forests. 2016. Available online: http://isap.sejm.gov.pl/isap.nsf/DocDetails.xsp?id=WDU20160002249 (accessed on 30 September 2020).
- Wagner, W.; Ullrich, A.; Melzer, T.; Briese, C.; Kraus, K. From Single-Pulse to Full-Waveform Airborne Laser Scanners: Potential and Practical Challenges. 2004. Available online: https://www.isprs.org/proceedings/XXXV/congress/comm3/papers/267.pdf (accessed on 16 February 2021).
- Wezyk, P. The integration of the terrestrial and airborne laser scanning technologies in the semi-automated process of retrieving selected trees and forest stand parameters Integração das tecnologias terrestre e aerotransportada de scanner laser no processo semi. Ambiencia 2012, 8, 533–548. [Google Scholar]
- Conway, T.M.; Urbani, L. Variations in municipal urban forestry policies: A case study of Toronto, Canada. Urban For. Urban Green. 2007, 6, 181–192. [Google Scholar] [CrossRef]
- Landry, S.; Pu, R. The impact of land development regulation on residential tree cover: An empirical evaluation using high-resolution IKONOS imagery. Landsc. Urban Plan. 2010, 94, 94–104. [Google Scholar] [CrossRef]
- Sung, C.Y. Mitigating surface urban heat island by a tree protection policy: A case study of The Woodland, Texas, USA. Urban For. Urban Green. 2013, 12, 474–480. [Google Scholar] [CrossRef]
- Sung, C.Y. Evaluating the efficacy of a local tree protection policy using LiDAR remote sensing data. Landsc. Urban Plan. 2012, 104, 19–25. [Google Scholar] [CrossRef]
- Grove, J.M.; Locke, D.H.; O’Neil-Dunne, J.P.M. An Ecology of Prestige in New York City: Examining the Relationships Among Population Density, Socio-economic Status, Group Identity, and Residential Canopy Cover. Environ. Manag. 2014, 54, 402–419. [Google Scholar] [CrossRef] [PubMed]
- Lee, S.J.; Longcore, T.; Rich, C.; Wilson, J.P. Increased home size and hardscape decreases urban forest cover in Los Angeles County’s single-family residential neighborhoods. Urban For. Urban Green. 2017, 24, 222–235. [Google Scholar] [CrossRef]
- Biuletyn Informacji Publicznej. Available online: https://www.bipraciborz.pl (accessed on 30 September 2020).
- IT System of the Country Protection. Available online: https://isok.gov.pl/index.html (accessed on 30 September 2020).
- Head Office of Geodesy and Cartography. Available online: http://www.gugik.gov.pl/ (accessed on 30 September 2020).
- Ordinance of the Minister of Regional Development and Construction of March 29, 2001 on Land and Building Records. Available online: http://isap.sejm.gov.pl/isap.nsf/DocDetails.xsp?id=wdu20010380454 (accessed on 5 January 2021).
- McGaughey, R.J. FUSION/LDV: Software for LIDAR Data Analysis and Visualization; US Department of Agriculture, Forest Service, Pacific Northwest Research Station: Seattle, WA, USA, 2009; p. 123. [Google Scholar]
- Castilla, G.; Hay, G. Image objects and geographic objects. In Object-Based Image Analysis; Springer: Berlin/Heidelberg, Germany, 2008; pp. 91–110. [Google Scholar]
- Shojanoori, R.; Shafri, H.Z. Review on the use of remote sensing for urban forest monitoring. Arboric. Urban For. 2016, 42, 400–417. [Google Scholar]
- Blaschke, T. Object based image analysis for remote sensing. ISPRS J. Photogramm. Remote Sens. 2010, 65, 2–16. [Google Scholar] [CrossRef]
- Vincent, L.; Soille, P. Watersheds in digital spaces: An efficient algorithm based on immersion simulations. IEEE Trans. Pattern Anal. Mach. Intell. 1991, 13, 583–598. [Google Scholar] [CrossRef]
- Wang, K.; Wang, T.; Liu, X. A Review: Individual Tree Species Classification Using Integrated Airborne LiDAR and Optical Imagery with a Focus on the Urban Environment. Forests 2018, 10, 1. [Google Scholar] [CrossRef]
- Conway, T.M. Tending their urban forest: Residents’ motivations for tree planting and removal. Urban For. Urban Green. 2016, 17, 23–32. [Google Scholar] [CrossRef]
- Redyuk, S.; Schelter, S.; Rukat, T.; Markl, V.; Biessmann, F. Learning to Validate the Predictions of Black Box Machine Learning Models on Unseen Data. In Proceedings of the Workshop on Human-In-the-Loop Data Analytics; ACM Press: New York, NY, USA, 2019. [Google Scholar] [CrossRef]
- Nowak, D.J.; Hirabayashi, S.; Bodine, A.; Greenfield, E. Tree and forest effects on air quality and human health in the United States. Environ. Pollut. 2014, 193, 119–129. [Google Scholar] [CrossRef] [PubMed]
- Kuželka, K.; Slavík, M.; Surový, P. Very High Density Point Clouds from UAV Laser Scanning for Automatic Tree Stem Detection and Direct Diameter Measurement. Remote Sens. 2020, 12, 1236. [Google Scholar] [CrossRef]
- Bello, S.A.; Yu, S.; Wang, C.; Adam, J.M.; Li, J. Review: Deep Learning on 3D Point Clouds. Remote Sens. 2020, 12, 1729. [Google Scholar] [CrossRef]
- Timilsina, S.; Sharma, S.K.; Aryal, J. Mapping Urban Trees Within Cadastral Parcels Using An Object-Based Convolutional Neural Network. ISPRS Ann. Photogramm. Remote Sens. Spat. Inf. Sci. 2019, IV-5/W2, 111–117. [Google Scholar] [CrossRef]
- Timilsina, S.; Aryal, J.; Kirkpatrick, J.B. Mapping Urban Tree Cover Changes Using Object-Based Convolution Neural Network (OB-CNN). Remote Sens. 2020, 12, 3017. [Google Scholar] [CrossRef]
- Phelan, K.; Hurley, J.; Bush, J. Land-Use Planning’s Role in Urban Forest Strategies: Recent Local Government Approaches in Australia. Urban Policy Res. 2018, 37, 215–226. [Google Scholar] [CrossRef]
Publisher’s Note: MDPI stays neutral with regard to jurisdictional claims in published maps and institutional affiliations. |
© 2021 by the authors. Licensee MDPI, Basel, Switzerland. This article is an open access article distributed under the terms and conditions of the Creative Commons Attribution (CC BY) license (http://creativecommons.org/licenses/by/4.0/).

