Abstract
Obtaining the water volume of small- and medium-sized lakes in enclosed watersheds with scarce data is a global focus of research. River flow into a lake is an important factor affecting the water volume. However, most river flow measurement methods involve long cycles, low efficiency, and transdisciplinary expertise, making rapid assessments in ungauged basins impossible. This paper proposes a remote sensing flow estimation method based on multi-source remote sensing data, which quickly assesses river flow and provides important input data for lake water volume simulation. The cross-section flow was estimated by extracting the river width. The calculated results were consistent with the measured data, with accuracy greater than 90%. The results compared with daily data measured at hydrological stations, and the Nash coefficient was greater than 0.9. Additionally, the simulation method for lake area, water volume, and water level was constructed using river inflow input data, greatly reducing the parameters required by the conventional lake water volume simulation method. Based on the remote sensing discharge estimation method, we quickly and conveniently obtained changes in river flow into the lake, simulated lake water volume, and provided the basis for water resource management in terminal lake basins with scarce data.
1. Introduction
With the rapid development of the global economy, the water demand of human society has increased dramatically. The intensity of water resource development and the utilization of and interference with the water environment have increased significantly. Larger demand has also greatly impacted regional distribution patterns and the national water system, resulting in the imbalance and dislocation of the human water relationship [1]. Nearly 33% of global land area lies in closed inland basins (excluding the Antarctic). Since the 20th century, global environmental and economic globalization issues have intensified the binding force of water resources on regional sustainable development. Water resources are a key factor restricting the ecological environment and sustainable economic development of terminal lake basins, the key areas of research on global environmental change and sustainable development [2].
A terminal lake is located at the mouth of an inland river [3]. Surface and underground runoff in terminal lake basins are not connected to other water catchment areas or to the ocean and have independent hydrological processes. The lake water in these areas accounts for approximately half of total global lake reserves [3]. The above-mentioned characteristics make terminal lakes among the most dynamic global hydrological systems. Water level fluctuates rapidly and significantly due to the influence of natural climate change and human activities [3,4,5,6] and is an indicator of climate change and environmental variability in the lake area [7]. The alarmingly rapid shrinking of many terminal lakes due to global climate change and regional human activities [8,9,10] is one of the principal environmental problems facing mankind [11,12].
Existing studies attribute terminal lake shrinkage to climate change and human activities, which, especially in the Anthropocene, are the controlling factors of hydrological process change [13]. Because of increased population and expansion of oases in terminal lake basins, water is increasingly diverted; the reduction in the amount of water entering the lake is the primary cause of terminal lake shrinkage [14,15,16]. Abundant research addresses the impact of human activities on the water volume of terminal lakes. For example, since 2000, the water level in the Salton Sea, California, has dropped by 7 m due to decreased inflow [17]. The development of agricultural water in the Aral Sea Basin has reduced the lake area and water volume by 74% and 90%, respectively [18] and exposed 12,700 km2 of lakebed [19]. Sellinger et al. (2007) [20] showed that after the city of Los Angeles diverted the Owens river for agricultural and urban use, Owens Lake in eastern California dried up completely in 1940, eventually leading to excessive airborne dust and increasing the prevalence of asthma, pulmonary infections, and other respiratory diseases in the area [21]. Bai et al. (2012) [22] attributed the reduced area of terminal lakes in Central Asia to a large irrigation quota and dry climate. Therefore, multiple studies show that the ecological service function of lakes and wetlands is seriously weakened by the drying of terminal lakes under the influence of human activities [23]. As an important ecological barrier in arid areas, terminal lakes suffer almost irreversible damage.
Previous studies primarily focus on the study of large terminal lakes. Small- and medium-sized lakes are widely used as local ecological indicators and play an unexpectedly important role in the global cycle. However, due to their small scale, they often lack long-term ecological observation [24,25]. Simulating the water volume and hydrological characteristics of lake areas is of great significance for the management and utilization of water resources [26,27,28]. Multiple terminal lakes are currently located in ungauged basins; thus, predicting hydrological forecasts in ungauged basins is a pressing issue for hydrologists worldwide.
In recent years, remote sensing-driven hydrological models and direct inversion are the primary research directions. The former can partially solve the forecasting problem and is widely used in basins worldwide. Although hydrological modeling has made much progress in recent decades, satisfying the data requirements of the more advanced models remains challenging. In contrast, remote sensing direct inversion is more widely used globally [29,30]. However, existing remote sensing monitoring methods only monitor large rivers; thus, calculating the flow of smaller rivers is difficult. Therefore, new high-resolution data sources to improve existing river flow monitoring methods are required.
Low-altitude unmanned aerial vehicles (UAVs), an emerging specialized remote sensing monitoring system, are not subject to time resolution and can obtain high-resolution remote sensing research data anytime and anywhere. UAVs are a powerful supplement to traditional aerospace photogrammetry [31] and have been widely used in hydrological underlying surface information acquisition and river flow calculation. Therefore, UAV data has higher credibility than satellite remote sensing data, especially in the construction of high-precision river models and more important research value in river flow estimation.
Therefore, considering the difficulty of assessing lake water volume changes in ungauged basins, the use of multi-source remote sensing data to construct a surface river flow estimation model that performs lake water volume simulations must be explored. The primary objectives of the present study were: (1) construction of a river flow estimation method based on multi-source remote sensing to provide important input data for lake water volume simulation and (2) quantitative analysis of the relationship between river flow into a lake and the area and water volume of the terminal lake. The area, water volume, and water level of terminal lakes can be simulated and analyzed by determining inflow into the lake. The results provide a basis for simulating the change of lake water volume and provide a reference for the utilization of lake water resources in the Ebinur Lake Basin with scarce data.
2. Study Area and Materials
2.1. Study Area
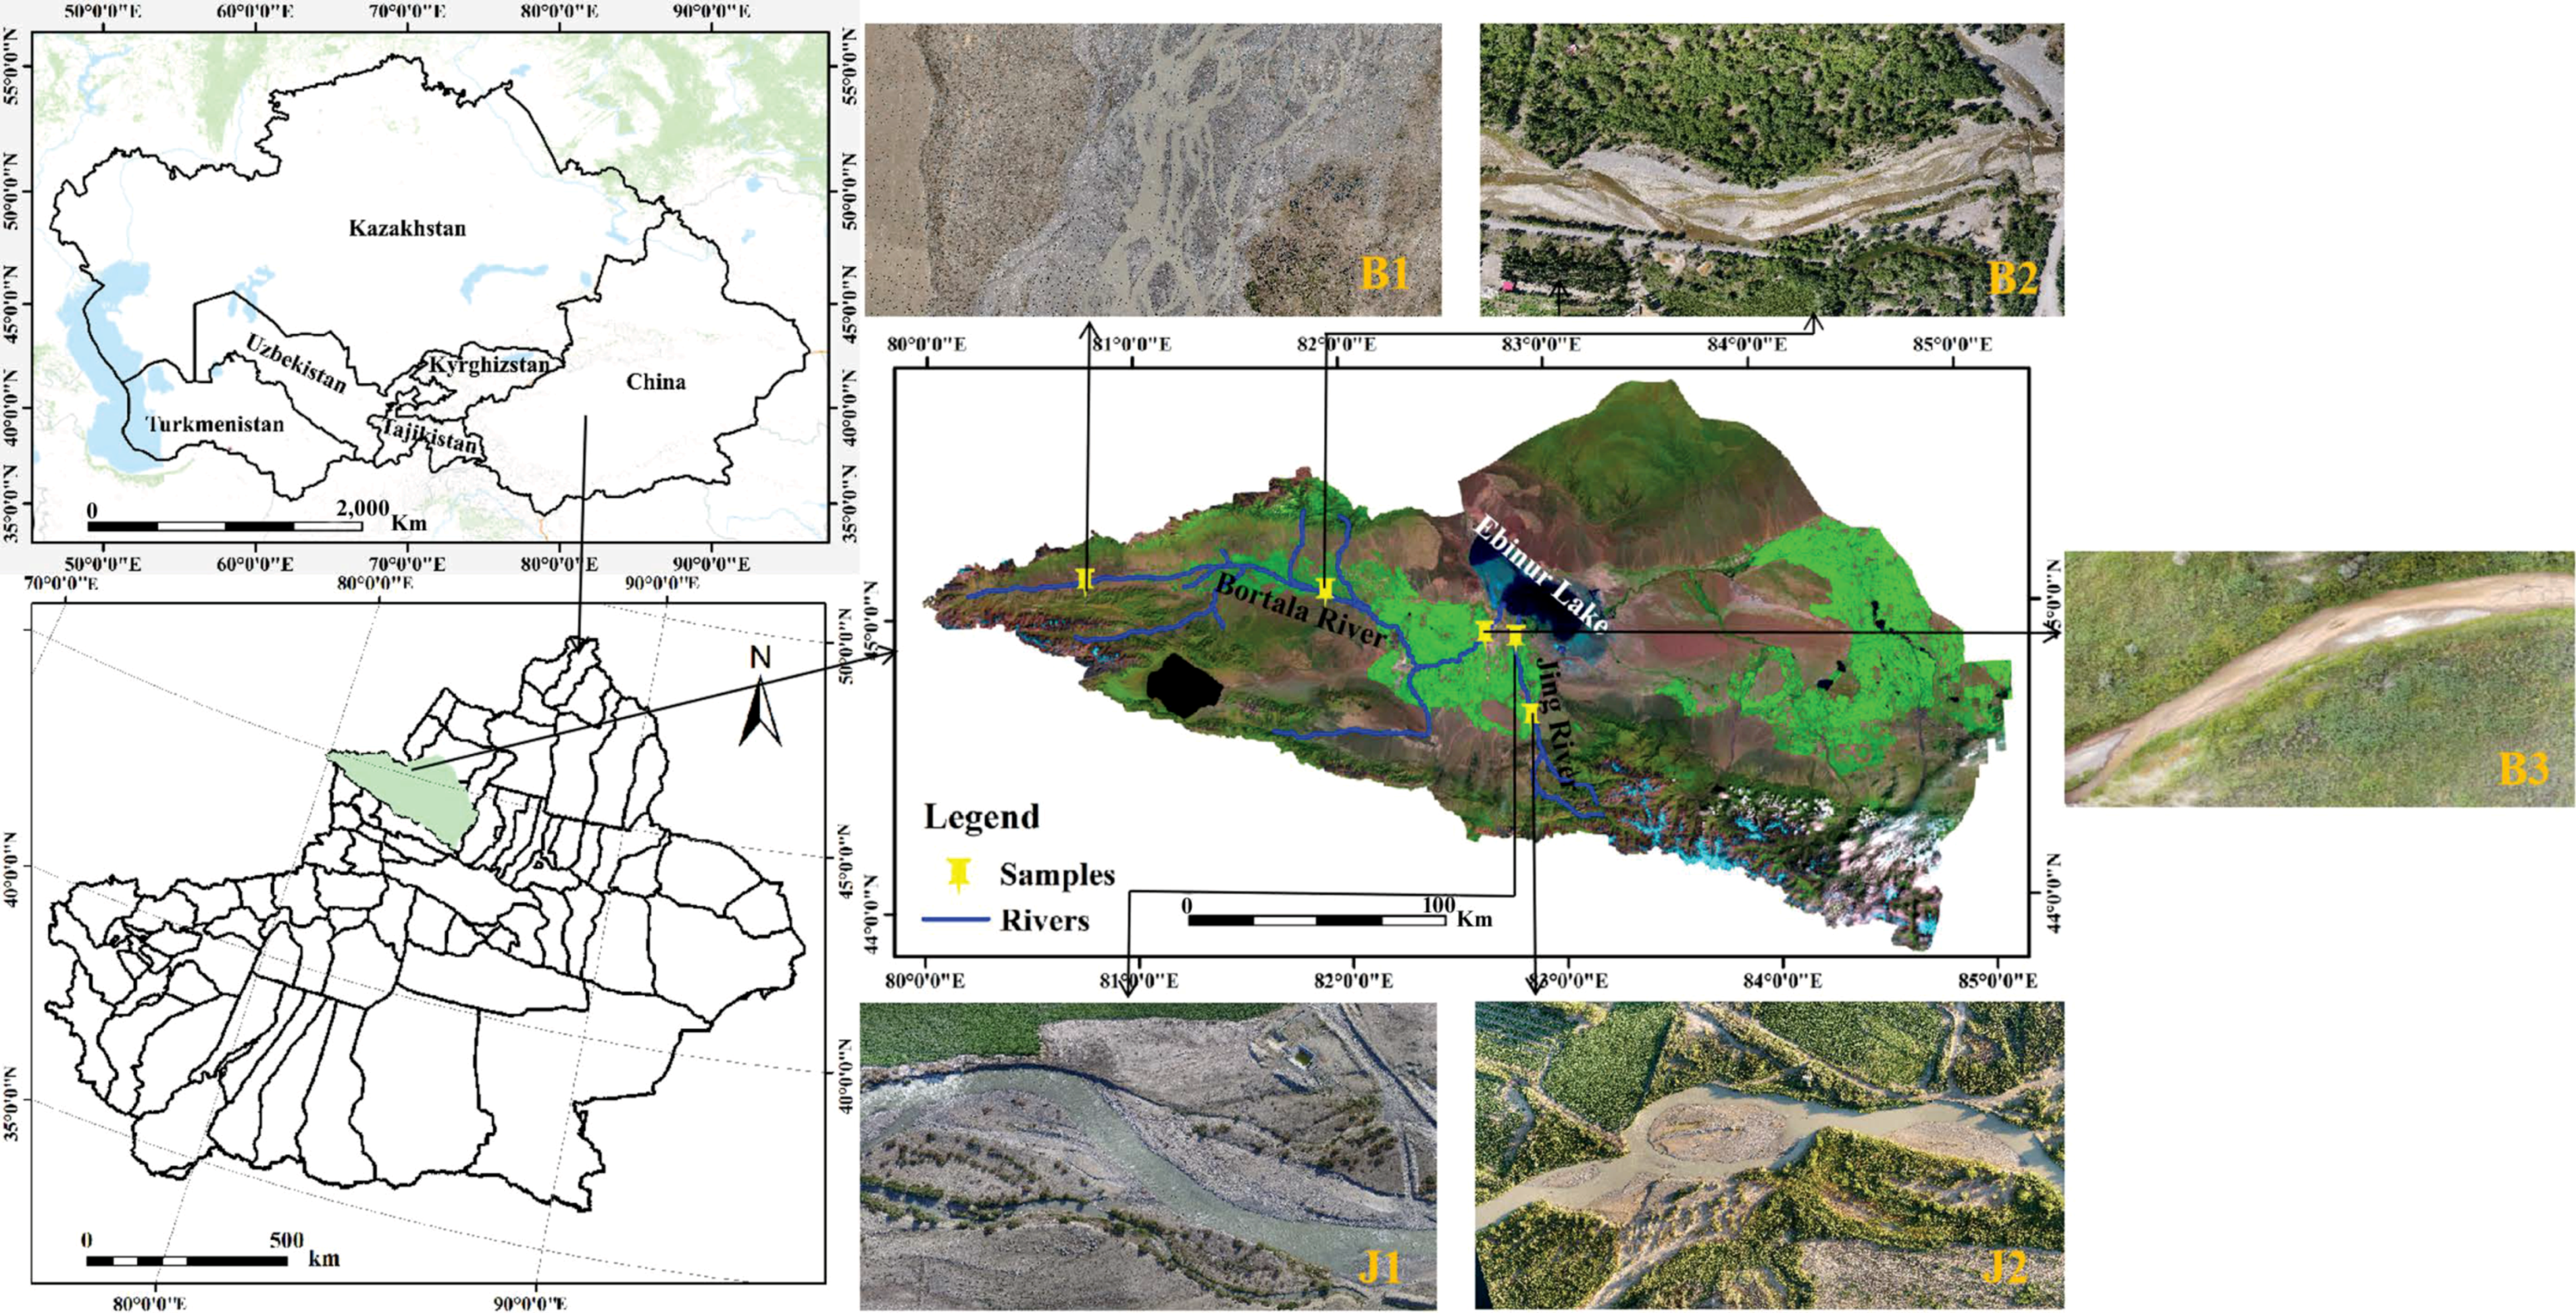
The Ebinur Lake Basin, located at 43°38′~45°52′N and 79°53′~85°02′E in northwest Xinjiang Uygur Autonomous Region, People’s Republic of China (Figure 1) is an arid to semiarid region suffering from frequent drought and water scarcity. The two water stations in the downstream areas of the Bortala River and the Jing River are typical for water-scarce areas. The basin was once fed by 12 branch rivers from the Bortala, Jing, and Kuytun river systems, which primarily formed upstream of the ungauged basin. The Ebinur Lake Basin is now primarily recharged by alpine glacier meltwater and mountain precipitation. Total runoff is 37.46 × 10⁸ m3/yr [32]. Some rivers have gradually lost their hydraulic connections, and only the Bortala and Jing rivers now feed into Ebinur Lake. Climate change is the principal factor affecting the high mountain streams of the Ebinur Lake Basin [33], but human activities associated with the development of the regional economy are increasingly damaging the ecological environment. Analyzing the hydrological changes in river basins with scarce data and ensuring that the water volume of lakes in the basin is maintained are key to maintaining sustainable regional socioeconomic development. This paper selects typical river sections in the Ebinur Lake Basin to study the impact of inflow on lake area and water quantity (Figure 1).
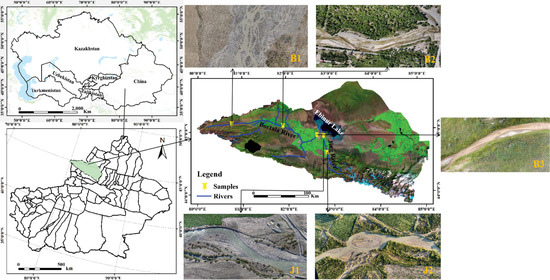
Figure 1.
Location and river-course cross-section photos of the study area.
2.2. UAV and Section Measurement Data for Establishing a Digital River Model
Channel cross-sections, which are usually acquired by the traditional field measurement method, are critical parameters for calculating river flow. Previous studies indicated that UAV-based topographic survey precision can reach centimeter levels [34,35]. From 5 to 12 August 2018, we conducted five missions with the DJI Phantom 4 Professional UAV (Table 1). In this study, Pix4Dcapture software (https://pix4d.com/2016.12, accessed on 12 January 2021, produced by Pix4D, Lausanne, Switzerland) was selected as the preprocessing platform for UAV data. The flight was controlled by the intelligent flight control software Pix4D with a flying height of 70 m. The photo overlap was set to 70% to ensure the subsequent generation of stereoscopic image pairs and to obtain 400 high-resolution UAV photos. Image treatment generally includes data importation, initial processing, point cloud encryption, digital orthophoto map (DOM) generation, and digital surface model (DSM) generation.

Table 1.
Basic Phantom-4-pro drone parameters.
In accordance with the requirements of “Waterway Observation Regulations” (SL257-2000) and “General Hydrographic Survey specifications” (SL58-93) [36], the river cross-section was measured using the “Velocity-Area Method” to provide the necessary measured flow velocity and water depth data. According to Hydrological Survey specifications (SL58-2014), a sounding rod was used to measure water depth data at intervals of 10 and 40 m for rivers with widths of less than 100 and from 100–1000 m, respectively. Flow velocity data were acquired by combining an electric current-meter (Stalker II SVR V1.0 produced by Applied Concepts Inc., Richardson, TX, USA) and a traditional current meter (No. LS25-1). A complete cross-sectional shape was fitted by combining the topographic data obtained by UAV and the water depth data measured in-situ. Measurements were conducted in the Ebinur Lake Basin; we selected five typical river-course cross-sections in the Bortala and Jing rivers to calculate the river discharge (Table 2). Of these, B1, B2, and J1 correspond to the Wenquan Hydrological Station, Bole Hydrological station, and Jinghe Hydrological station, respectively.

Table 2.
Distribution position of river-course cross-sections.
2.3. Satellite Data
The research used Sentinel-2 (https://scihub.copernicus.eu/, accessed on 12 January 2021) and Landsat 8 (https://earthexplorer.usgs.gov/, accessed on 12 January 2021) image data for river width extraction. Because the research time span was relatively large, Landsat 8 image data supplemented the Sentinel-2 data when the period of time covered by Sentinel-2 did not meet our requirements. The Sentinel satellites are part of the Earth Observation Program of the European Union, which is jointly managed by the European Commission and the European Space Agency. The satellites record changes in terrain, vegetation, and temperature, etc. [37]. Additionally, the National Aeronautics and Space Administration and the United States Geological Survey operate the Landsat series of satellites, which have continuously collected spectral information of the Earth’s surface features for 40 years and created a data archive with irreplaceable coverage, length, quality, and details for scientific research. Therefore, Sentinel-2 and Landsat 8 data were selected to extract the water surface from April to October from 2013 to 2019 in combination with normalized difference water index (NDWI) calculations. A total of 49 images of the study area were collected to extract the water surface range of the target river section. Landsat 8 and Sentinel-2 image data were from 2013 to 2015 and 2016 to 2019, respectively.
2.4. Statistical Data
The study collected monthly river discharge data from 2000 to 2012 at the entrance of Bortala River and the Jing River in the Ebinur Lake Basin to analyze the changes in lake inflow. The real-time daily discharge data of the Wenquan, Bole, and Jinghe hydrological stations from 2017 to 2018 were used to verify the surface runoff estimation results.
3. Methods
3.1. Calculating River Flow
Riggs proposed the slope-area method (SAM), a classic hydraulic equation to calculate the runoff by using the slope and river cross-sectional area [38], that is based on physical laws and mathematical derivation and widely used for calculating the discharge of small- and medium-sized rivers [39,40]. We used three-dimensional surface data obtained from UAV-based remote sensing to calculate the river flow [41] with the SAM [42,43]. The equations used for the SAM calculation are as follows:
where v is the average flow, m/s; k is the conversion factor, m1/3/s (=1); n is the empirical roughness coefficient; the hydraulic radius R is the ratio of the river section area A to the wet cycle L; J is the hydraulic gradient of the river channel; and Q is the river flow, m3/s. The R and J values were obtained from UAV-based remote sensing [42,43].
The relationship between river width and flow generally varies among cross-sections, prompting us to consider how the relationship between river width and river flow changes for narrow and wide-shallow rivers in arid areas. We used hydraulic geometry and low-altitude and satellite remote sensing data to estimate river discharge with the following steps:
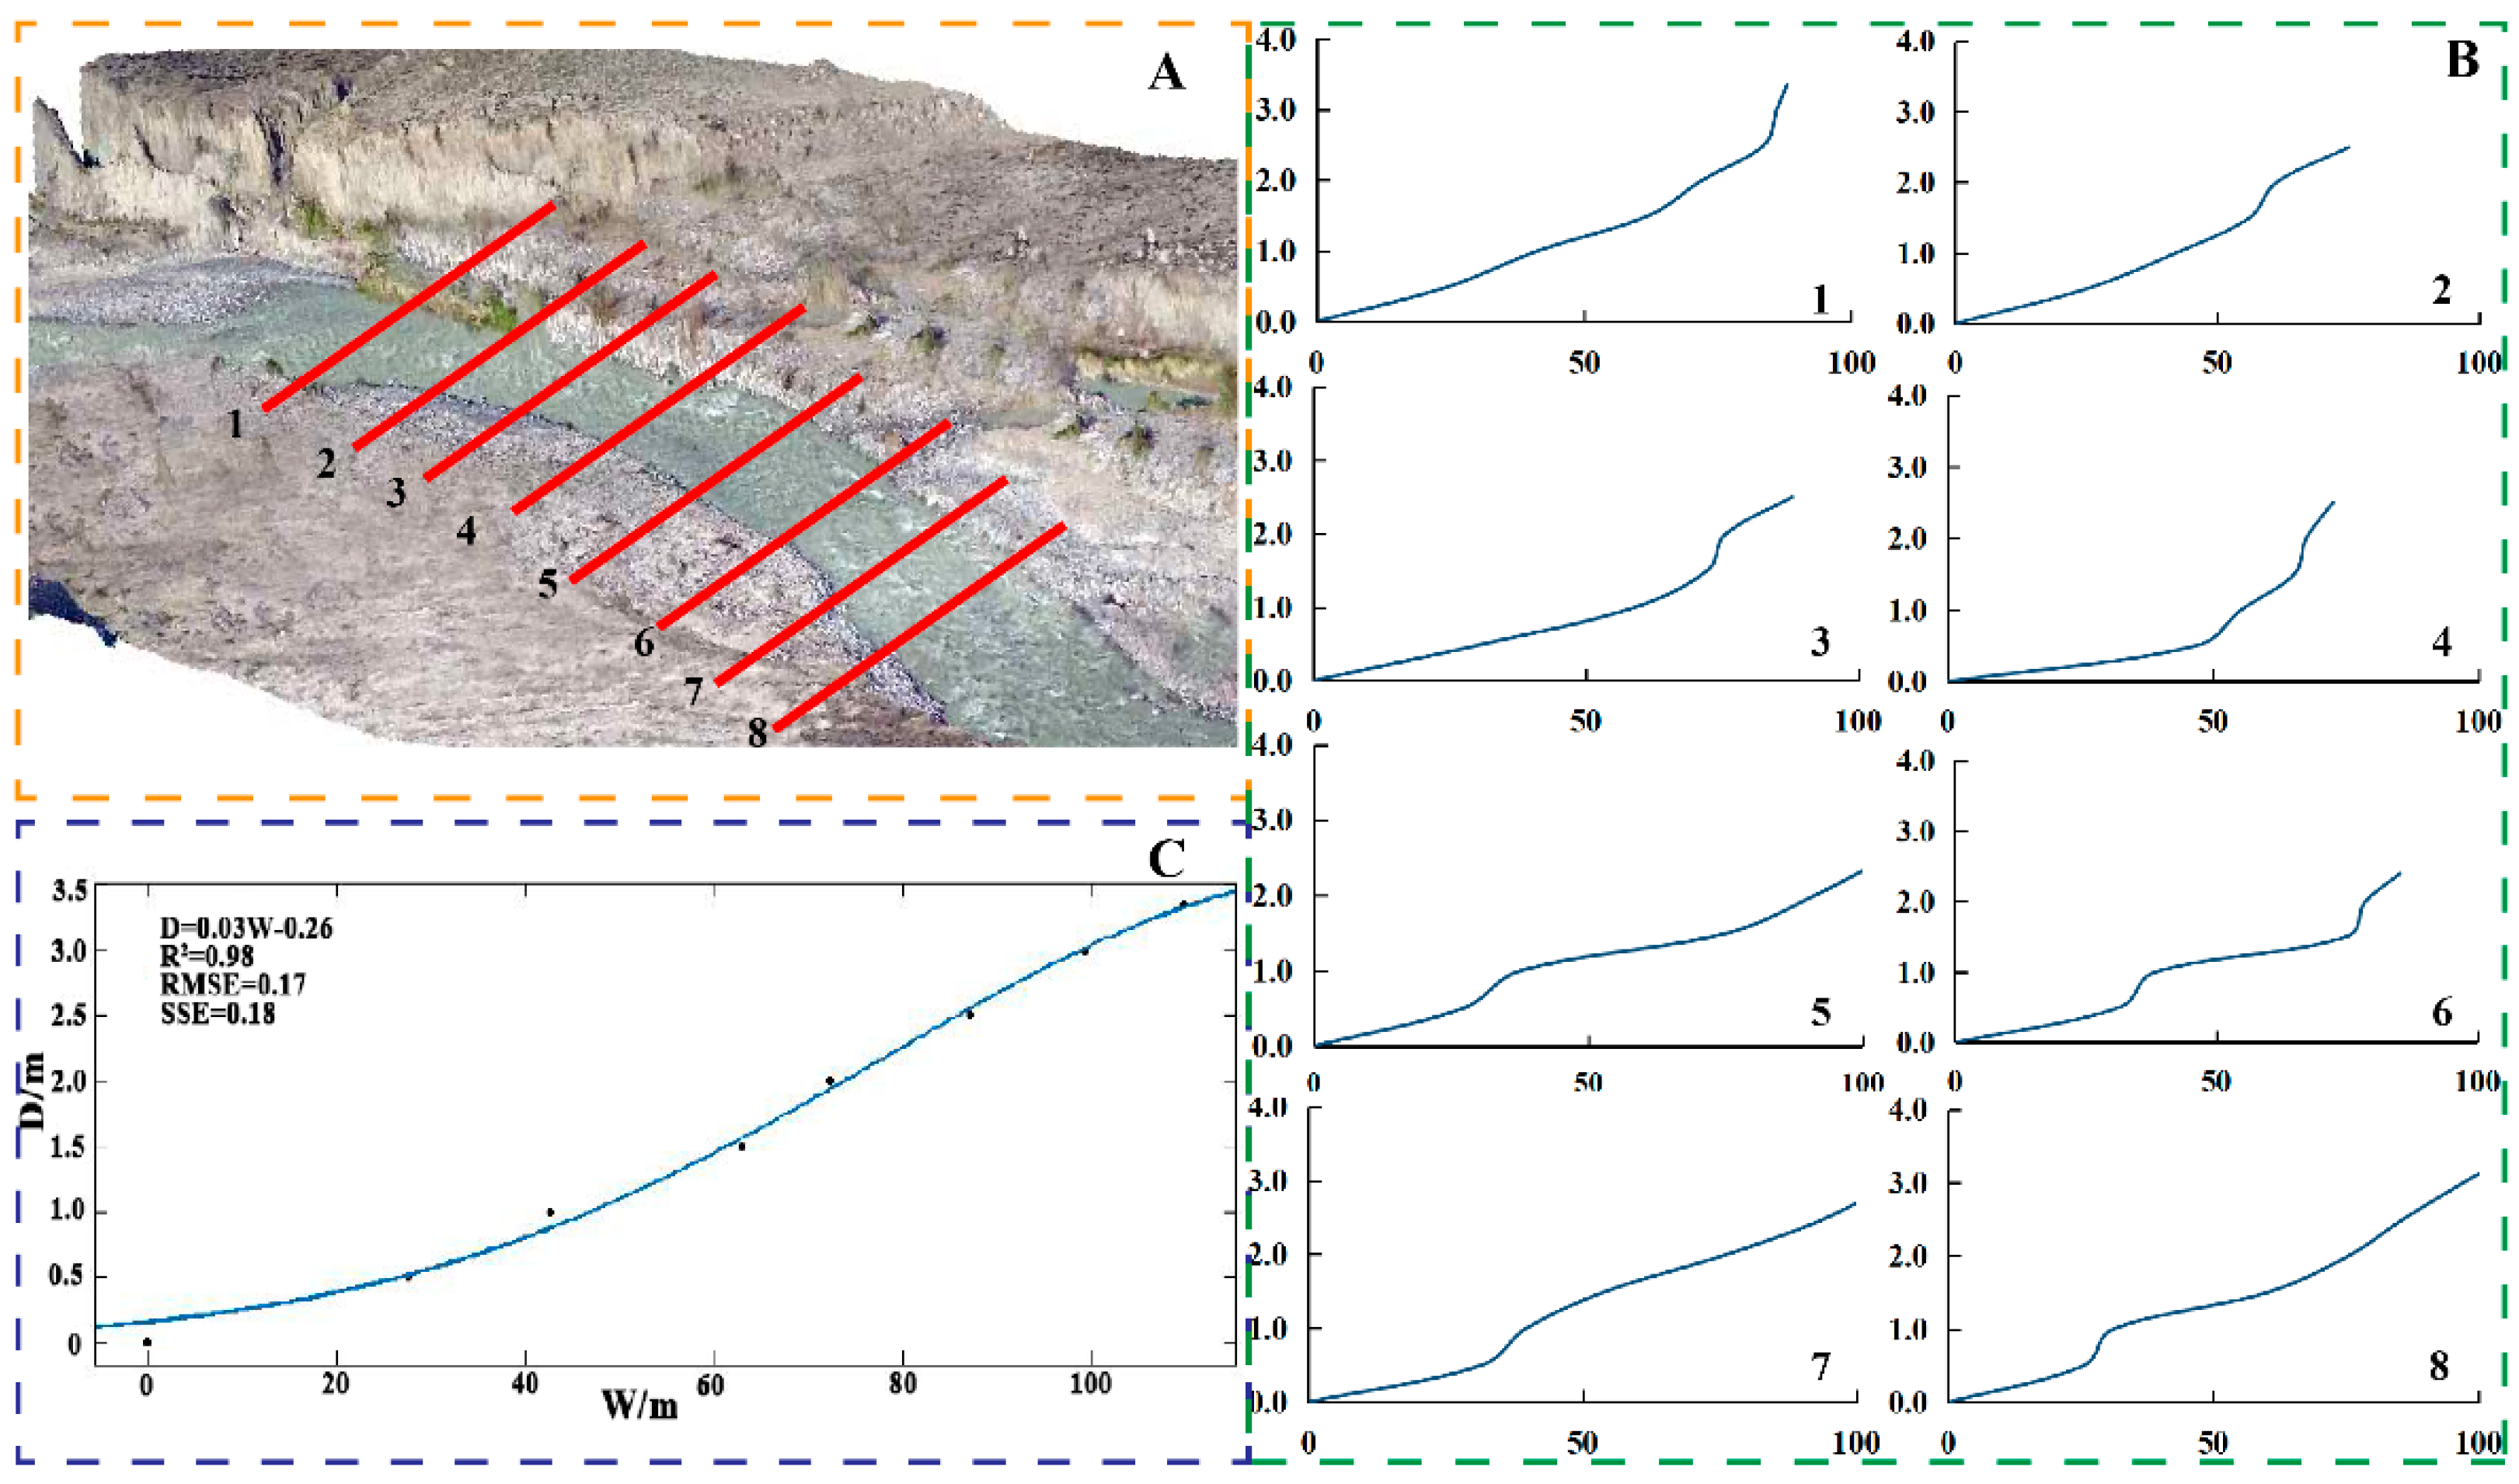
(1) The entire river section was divided into eight sections by using high-resolution UAVs images (Figure 2A), and the shape of each section was established by combining on-site measured water depth and UAV DSM data.
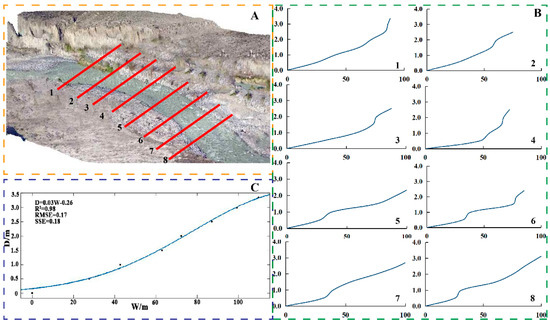
Figure 2.
Flow diagram fitting relationship between average river width and water depth. (A): Divide the river section; (B): Establish the water surface width-depth relationship curve of the divided section; (C): Generalize the water surface width-water depth curve of the river section.
(2) According to the shape of the river sections, the elevation data of the segmented river sections were extracted, and the water surface width data corresponding to each 0.5-m water depth step was obtained. Finally, the water surface width-water depth relationship curve of the segmented river sections was drawn (Figure 2B).
(3) To obtain the water surface width-water depth relationship curve in the segmented sections, the target river was considered as a complete unit. The average water surface widths of the different divided river sections were calculated at the same water depth, and a single water surface width-water depth relationship curve (Figure 2C) was used to represent the cross-sectional shape characteristics of the river to input the water surface width and to calculate the corresponding water depth results.
(4) Based on the theory of hydraulic geometry, the corresponding relationship between water surface width and water depth was established. The research on river discharge estimation was performed by monitoring the change in water surface width.
The method fit the average water surface width of the river section with the corresponding water depth, reducing the deviation of the estimation results caused by the error when extracting a single river section width from remote sensing images.
The fitting relationship between the average river width and the water depth shows that the water depth data can be deduced by obtaining the average river width to estimate the river flow (Figure 2C). According to Huang et al. (2018) [44], the roughness coefficient (n) and hydraulic slope (J) are considered constants to avoid use as dynamic variables. In this study, n was given by the local hydrology bureau, and the J was calculated from UAV DSM data. Finally, for different river sections, river parameters were obtained based on low-altitude UAV image data, which were further converted into equations dependent on satellite source variables as input data to obtain the river flow estimation method.
3.2. Extraction of Water Surface Width
The different resolutions of Sentinel-2 and Landsat 8 image data caused errors in the monitoring results of the linear water surface width. To reduce the river width extraction error, we adopted the relatively mature surface water area monitoring method. The indirect calculation of river width by measuring area is an effective method to improve data accuracy [45,46]. Equation (3) shows that the ratio of water surface area to reach length is the average width of the reach:
where W is the width of the generalized reach, A is the water surface area of the study reach, and L is the length of the study reach. We used the NDWI (Equation (4)) to extract the water surface width:
where Gb and NIR are the surface reflectance of the green and infrared bands, respectively.
3.3. Performance Metrics
The accuracy of the reliability of the river discharge estimation method in the Ebinur Lake Basin was verified using the B1~B2 river sections of Bortala river and the J1 section of Jing river. River flow estimation performance was evaluated using the following metrics: relative accuracy (RA), root-mean-square error (RMSE), and the Nash–Sutcliffe efficiency coefficient (NSE) [47]:
where Qm is the in-situ discharge, Qc is the estimated discharge, denotes the mean value of in-situ discharge, t represents simulation calculations times, and n represents the total number of observations. The relative accuracy is the percentage of the absolute error in the measured value. According to the “Regulations for Hydrological Information Forecasting” (GB/T22482-2008) promulgated by the Water Conservancy Department for river flow forecasting and calculation standards, 20% of the actual measured value is the allowable error range; thus, when the relative accuracy is less than 20%, the result is considered reliable [46]. The RMSE is used to quantify the deviations of the estimates from the observations. The NSE varies from −∞ to 1, and 1 indicates the optimal status where the simulated discharge equals the in-situ measurements.
3.4. Lake Water Volume Simulation
Through spatial analysis, based on the digital elevation model (DEM) of the bottom of the lake, the volume changes of Ebinur Lake under different water levels and areas were simulated. Finally, the area-water volume and water level elevation-water volume models were constructed. The corresponding functions of lake area, lake elevation, and lake volume are as follows:
where: V is the volume of the lake, 108 m3; A is the corresponding area of the lake, km2; H is the average altitude of the lake surface, which is used to represent the water level of the lake and has units of m. The lake water level (H) constantly changes with the water volume and area. The relationship among lake area, lake water level, and lake volume was established by nonlinear curve fitting. Combining the Myquart and Universal Global Optimization methods avoids using the Myquart local optimization method without artificially establishing the initial coefficient value, which is randomly given by 1stOpt; finally, the optimal solution of the fit is found [48]. This method automatically finds the result that minimizes the sum of the squared errors according to the constraint conditions. The calculation method is shown in Equation (10):
where: f(xi) is the calculated value; yi is the measured value.
4. Results
4.1. Estimation of River Inflow Based on the Remote Sensing Flow Method
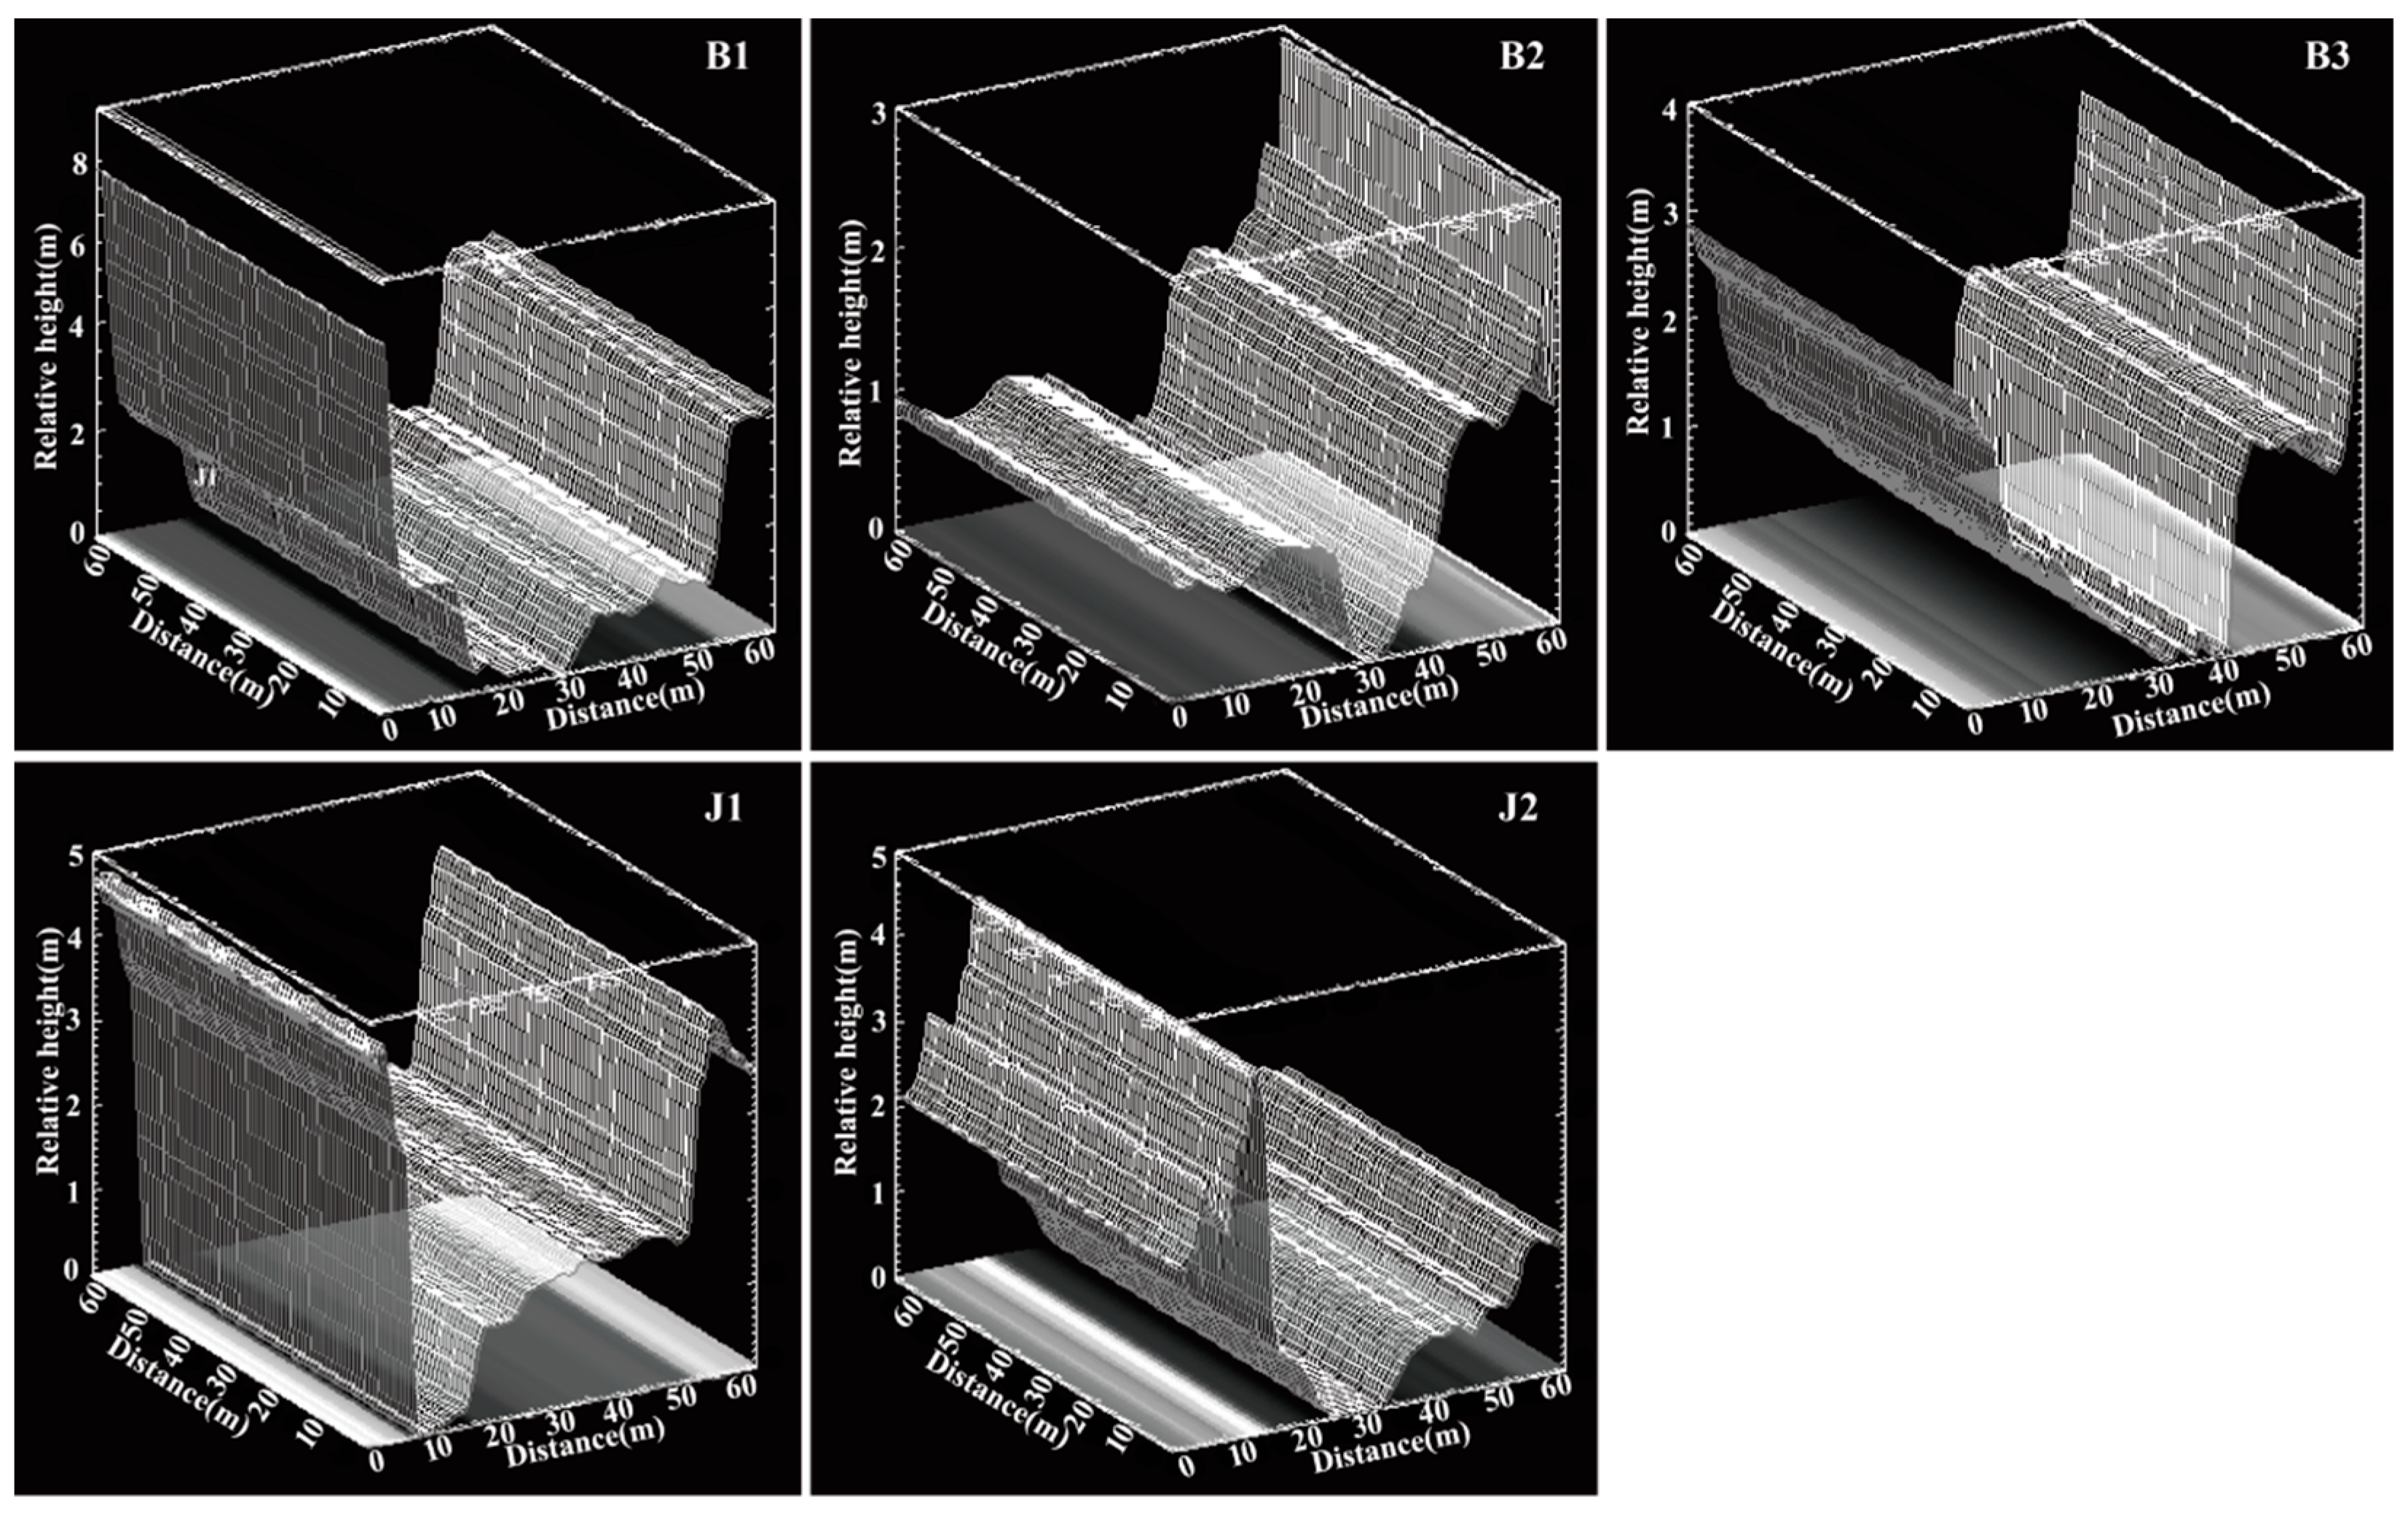
Most rivers in Xinjiang are characterized by low water yield, short flow, and small water environmental capacity. UAV was used in this study to acquire a full cross-section and high-resolution water-based terrain data and combined with measured water depth data to fit the shape of the river section (Figure 3).
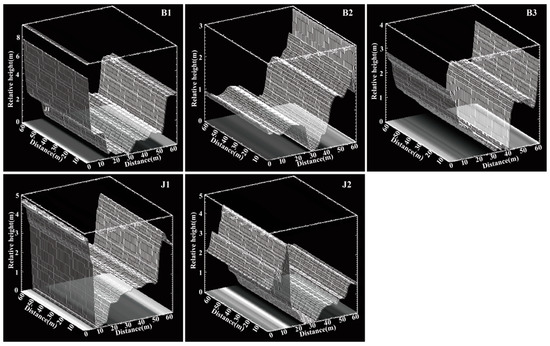
Figure 3.
Digital model of river section. B1~B3 are the cross-sectional morphology of the Bortala River; J1~J2 are the cross-sectional morphology of Jing River.
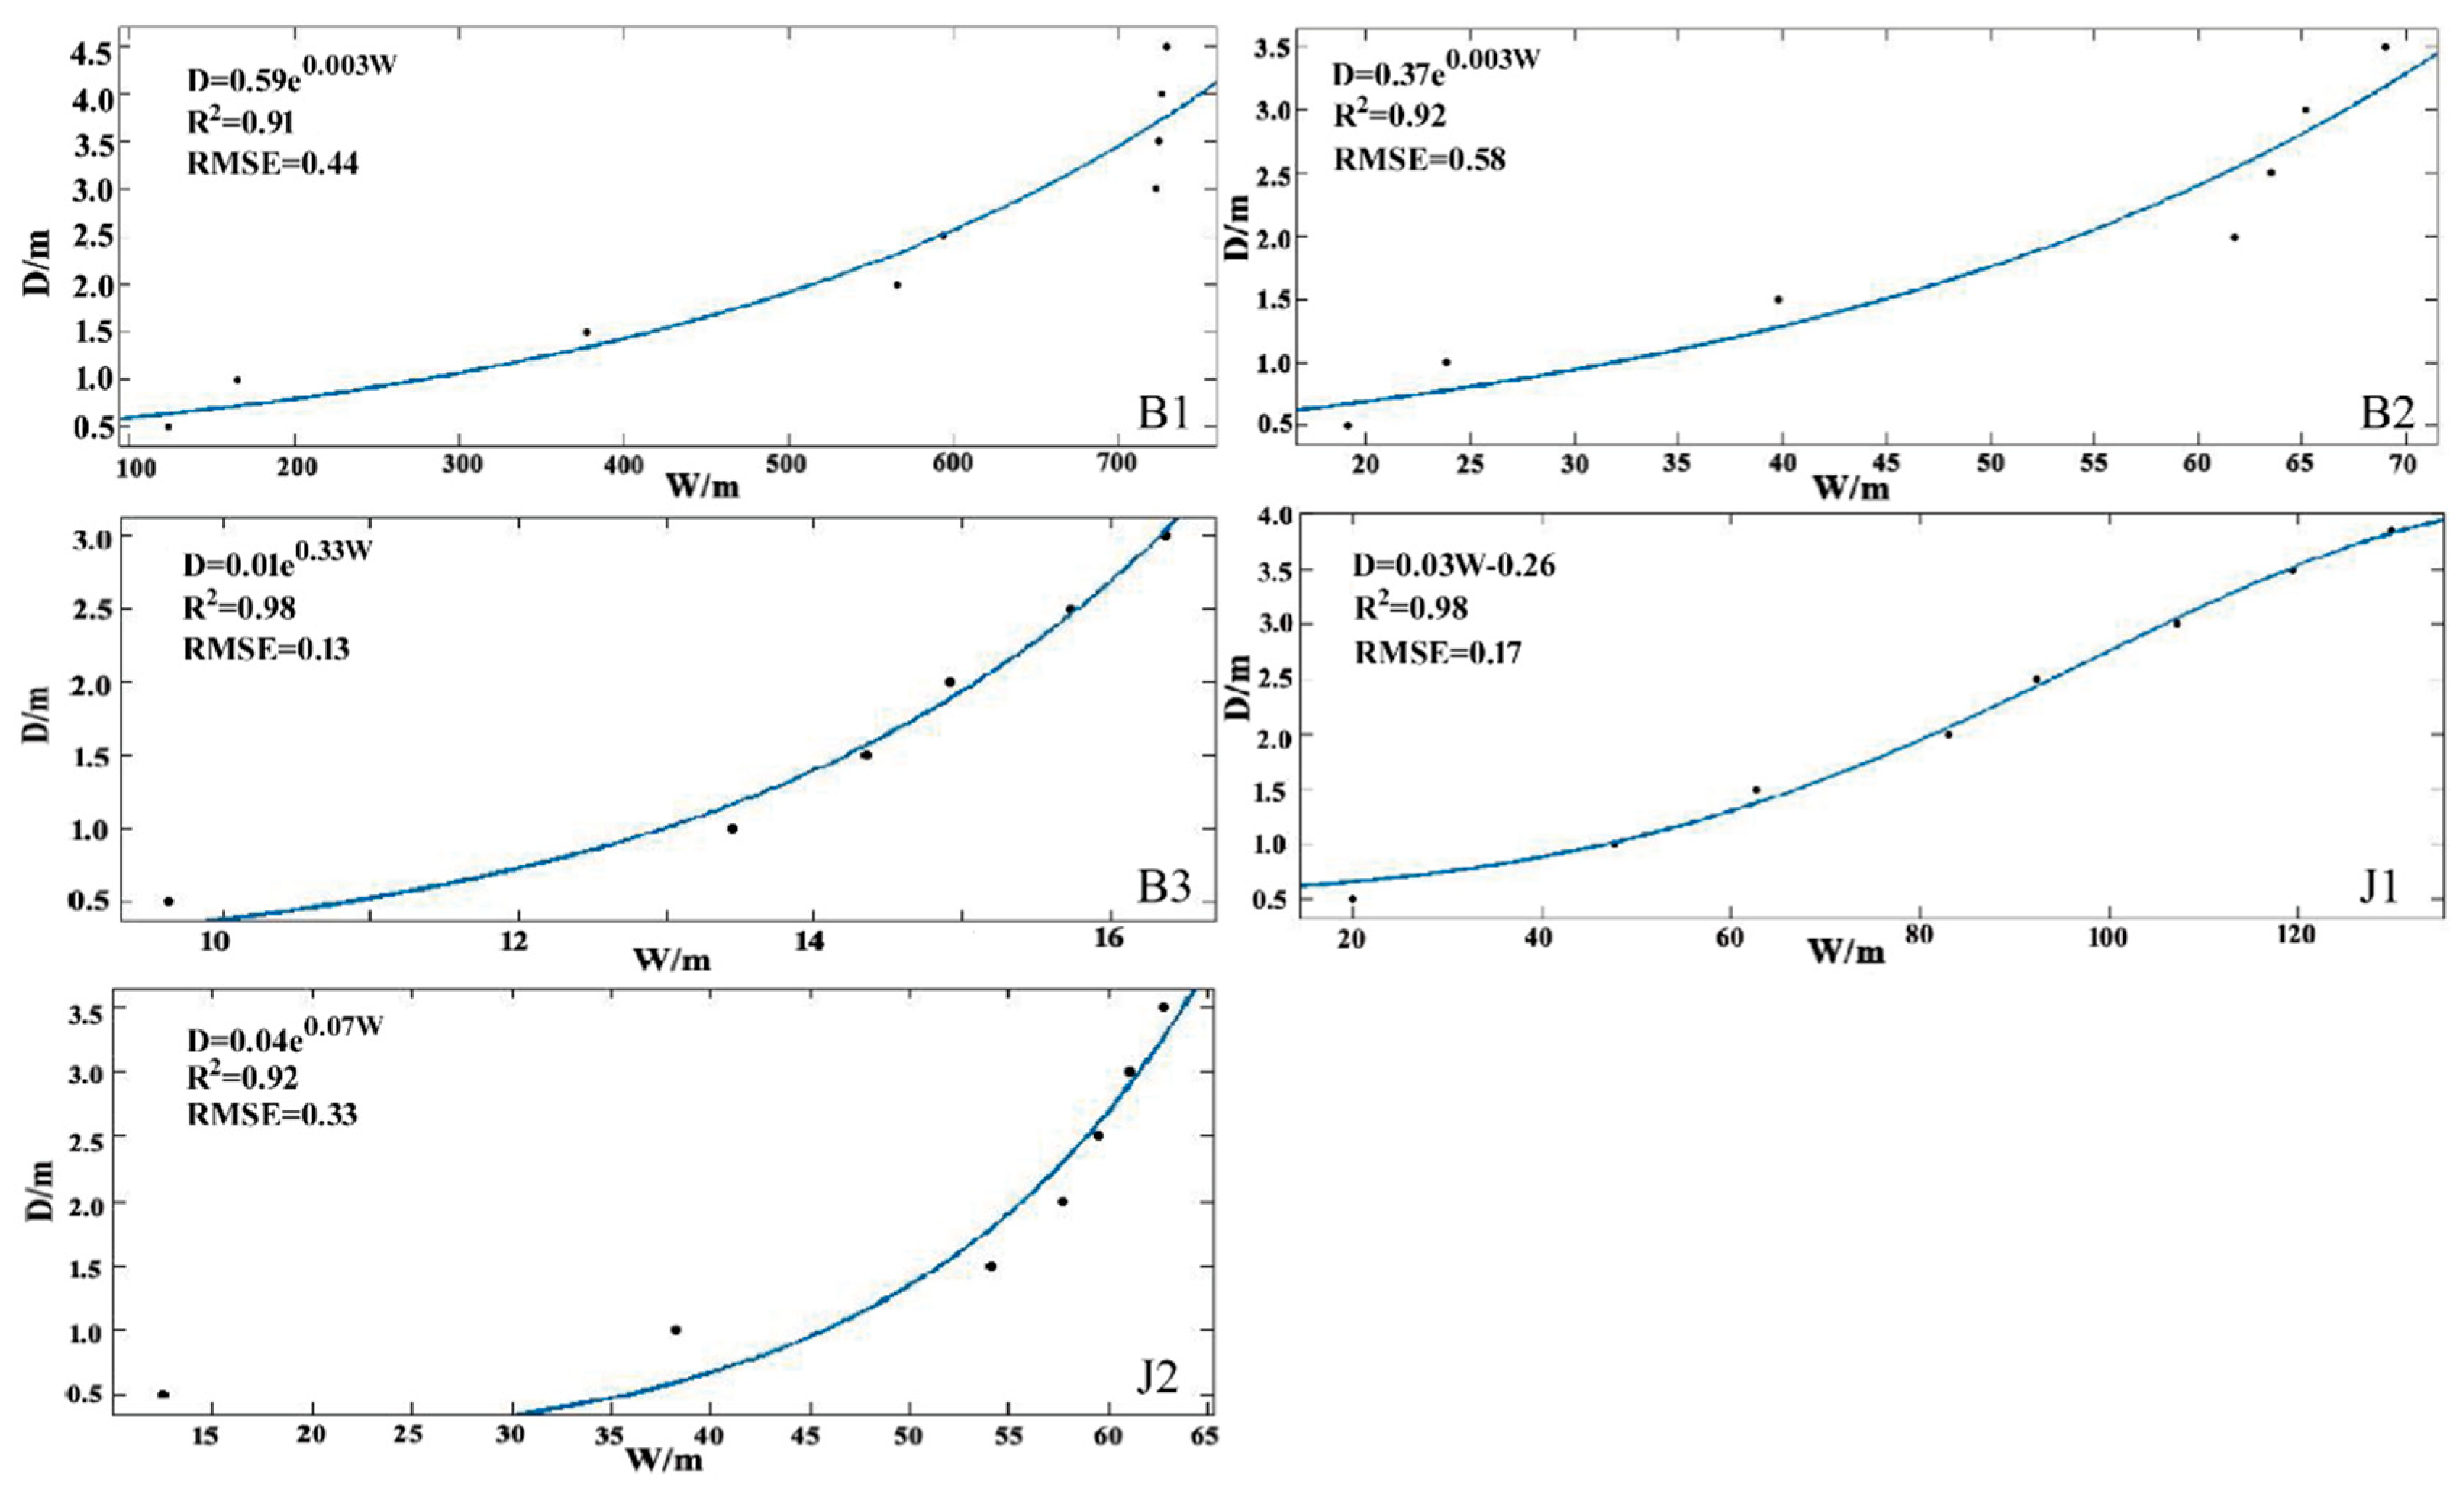
According to the method described in Section 3.1, the mathematical model provided by the MATLAB software 2018a (Developed by MathWorks, Natick, MA, USA) was used for iterative calculation to obtain the best fitting results of the water surface width-depth curve and to calculate the error. The results are shown in Figure 4.
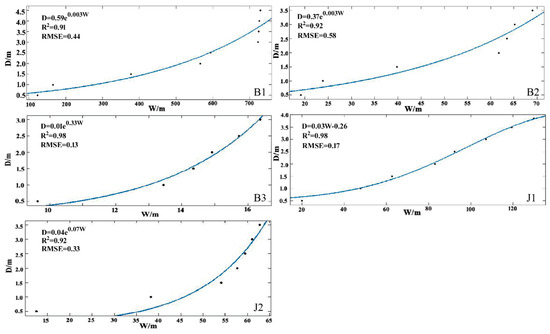
Figure 4.
Fitting relationship between average water surface width and water depth of river sections at different monitoring stations. B1~B3 are the width-depth fitting curves of Bortala River section; J1~J2 are the width-depth fitting curves of Jinghe River section.
The average water surface width-water depth curve of each river section was fitted using remote sensing images from August 2018 to extract the average water surface width, calculate the water depth, and estimate the river flow; the results are shown in Table 3. The estimated results of B1, B2, and J1 are comparable to those of the measured data, with an accuracy of more than 90%.

Table 3.
Flow rate estimation of river cross-sections.
To extend the method on the temporal scale, the average width of the river was extracted from Sentinel-2 images at the B1, B2, and J1 sections, and the estimated results were compared with the data measured at the hydrological stations. The remote sensing flow estimation results were evaluated based on the abovementioned accuracy evaluation method. Because the calculation time of each remote sensing flow monitoring section in the Ebinur Lake Basin occurred before and after the on-site measurement data time, the relative accuracy assessment method was used to compare and to verify the calculated flow and measured velocities. The results are shown in Table 4. The estimation results of the five river sections were within the error range, indicating that the remote sensing estimation methods meet the accuracy requirements.

Table 4.
Relative accuracy evaluation results.
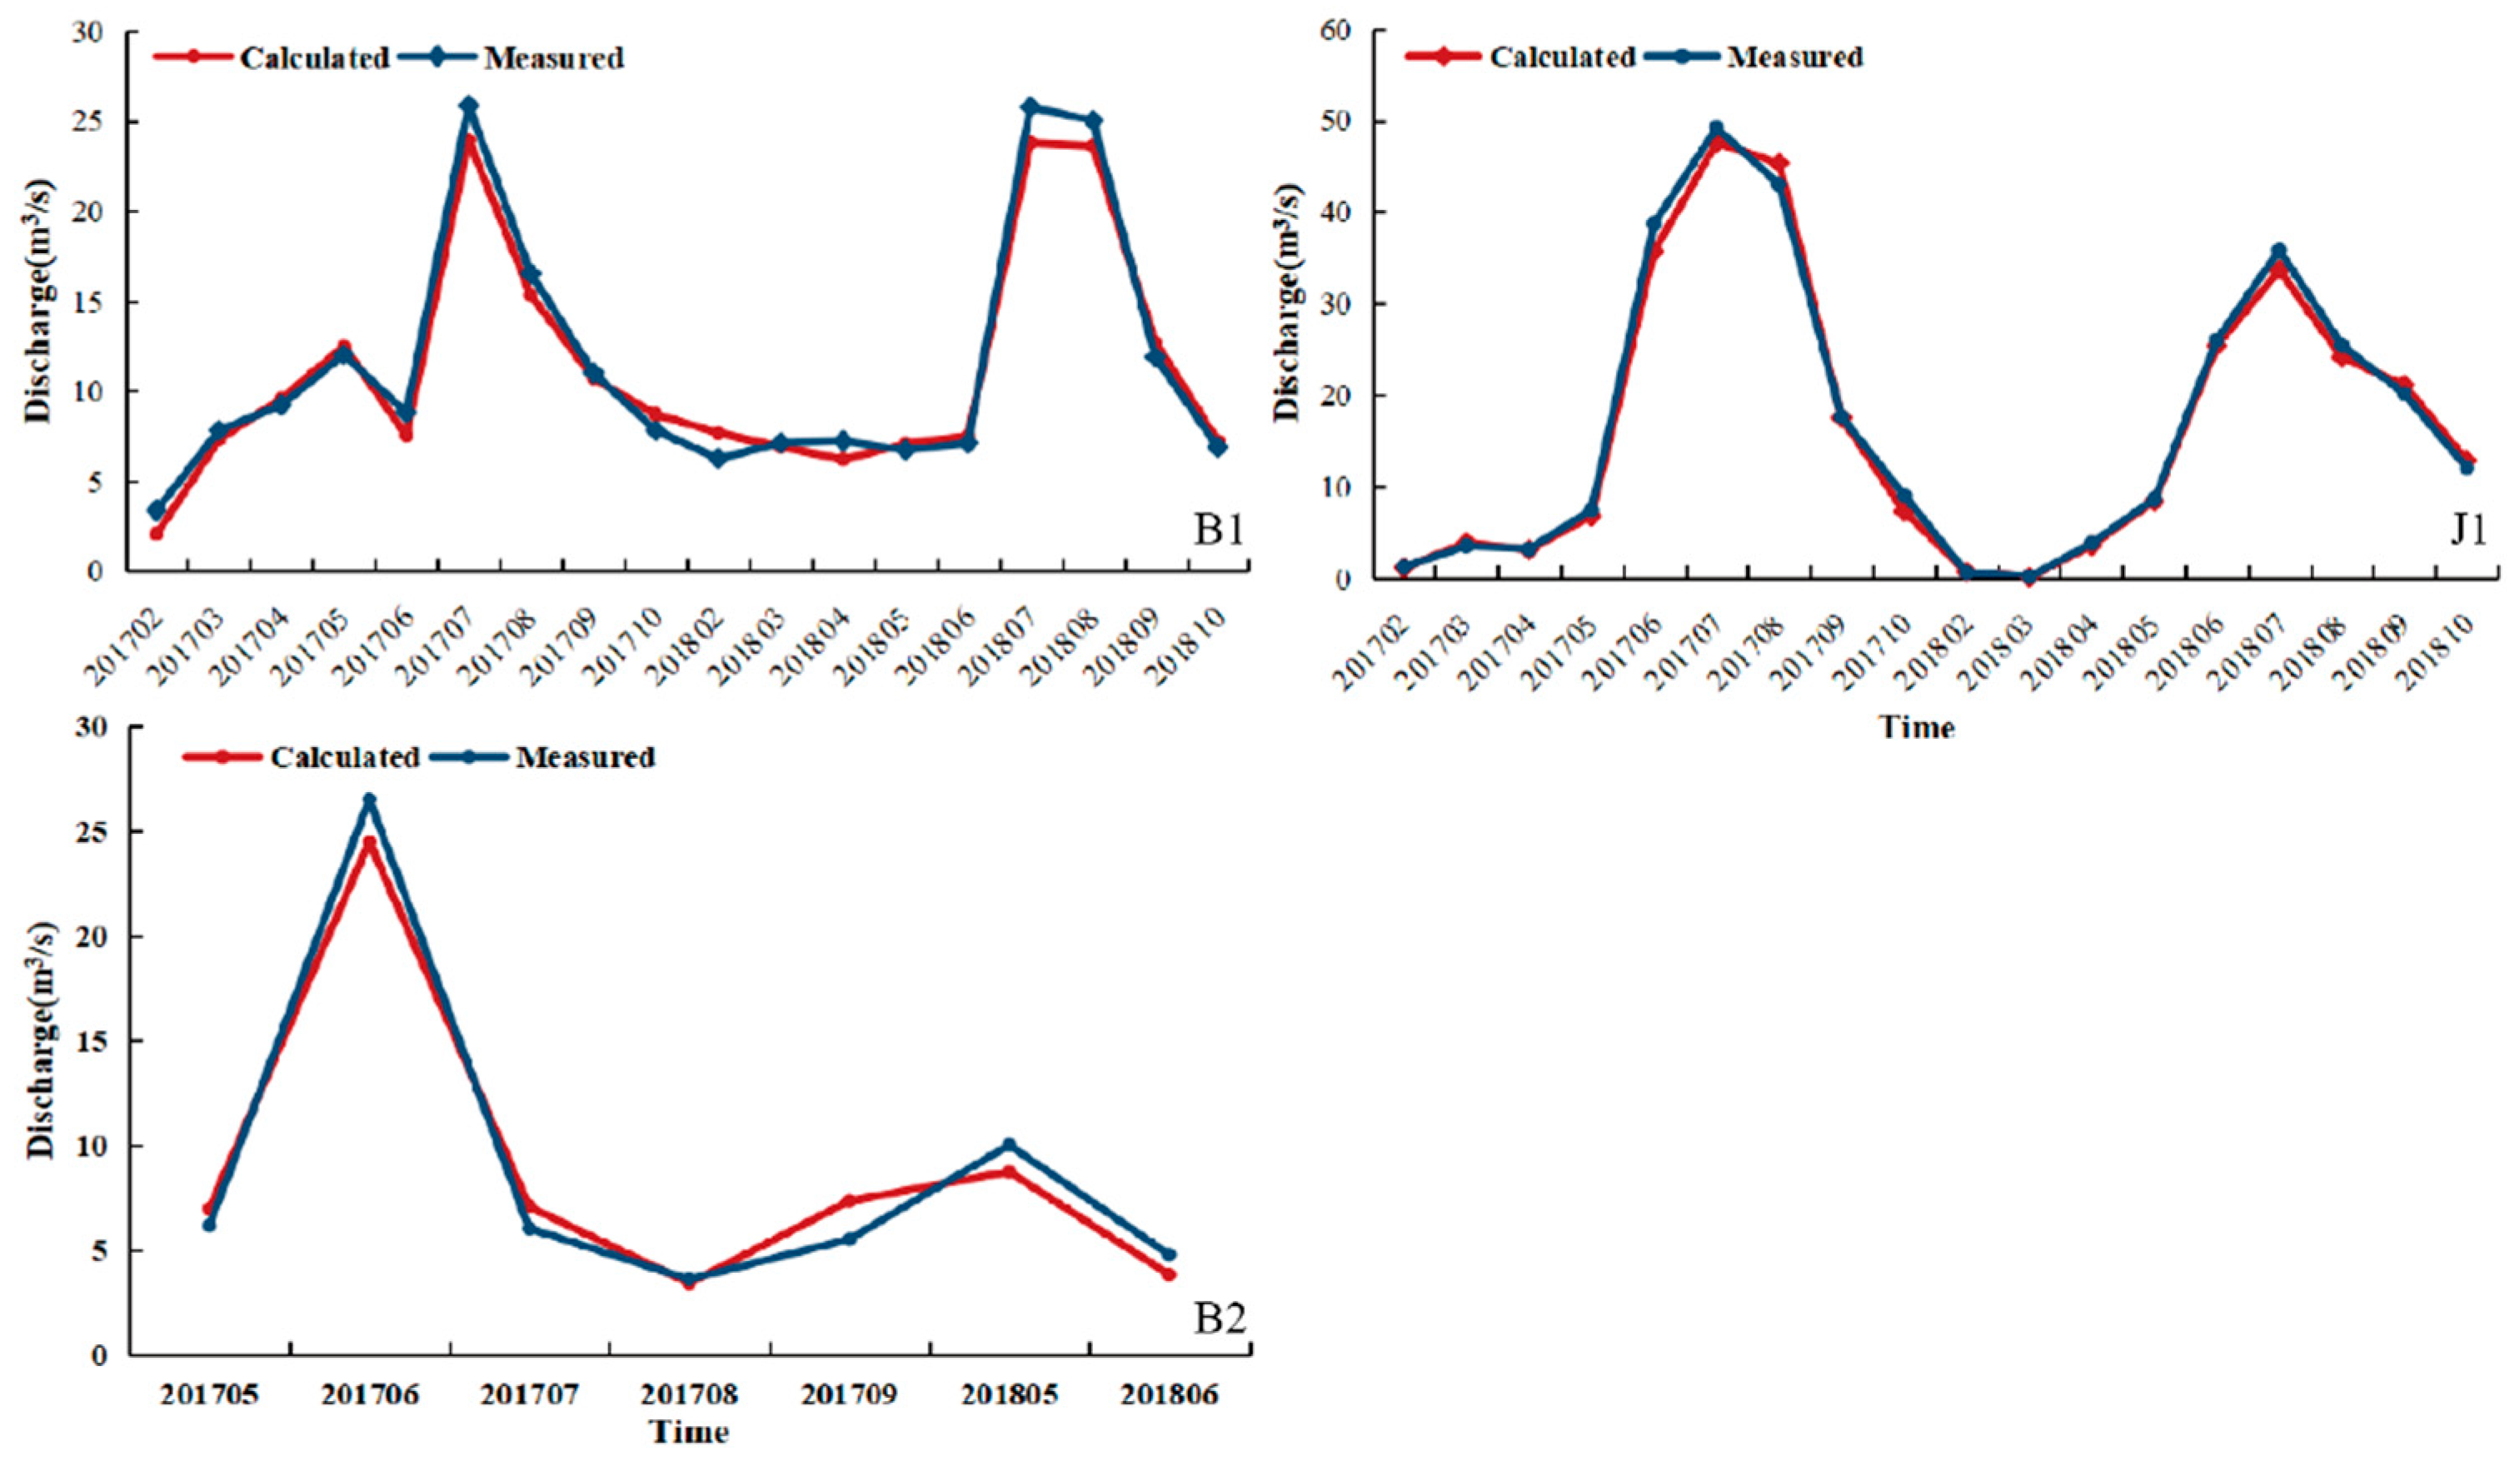
Additionally, the river flow estimation results at the three hydrological stations from 2017 to 2019 were compared with the actual daily flow data to further evaluate the accuracy. Because the B2 section of the Bortala River only collected data from July to October 2018, the verification time was inconsistent with that of B1 and J1. The final results are shown in Figure 5 and Table 5.
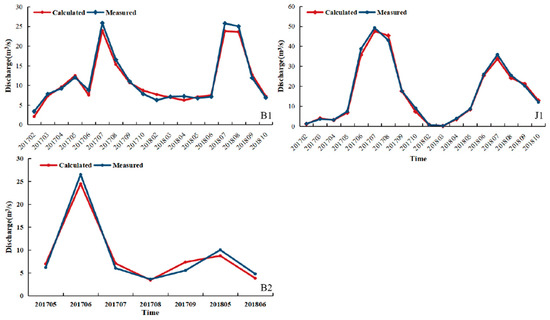
Figure 5.
Verification of discharge estimation results from 2017 to 2019. B1, B2, and J1 correspond to the Wenquan Hydrological Station, Bole Hydrological station, and Jinghe Hydrological station, respectively.

Table 5.
Error analysis of the discharge estimation results of the cross-section at Hydrological station.
Comparing the calculated results of the river flow and the measured data reveals that the Nash coefficients of the remote sensing flow estimation results of the B1, B2, and J1 sections are 0.98, 0.95, and 0.97, respectively and that the RMSE are all less than 1.5 m3/s. In this study, the river flow estimation results of each section were instantaneous; thus, the estimated results were consistent with the measured daily flow data of the hydrological station, resulting in a Nash coefficient of more than 0.9. The results show that the remote sensing river flow estimation method of extracting river width from remote sensing data for wide and shallow rivers in arid areas is relatively ideal.
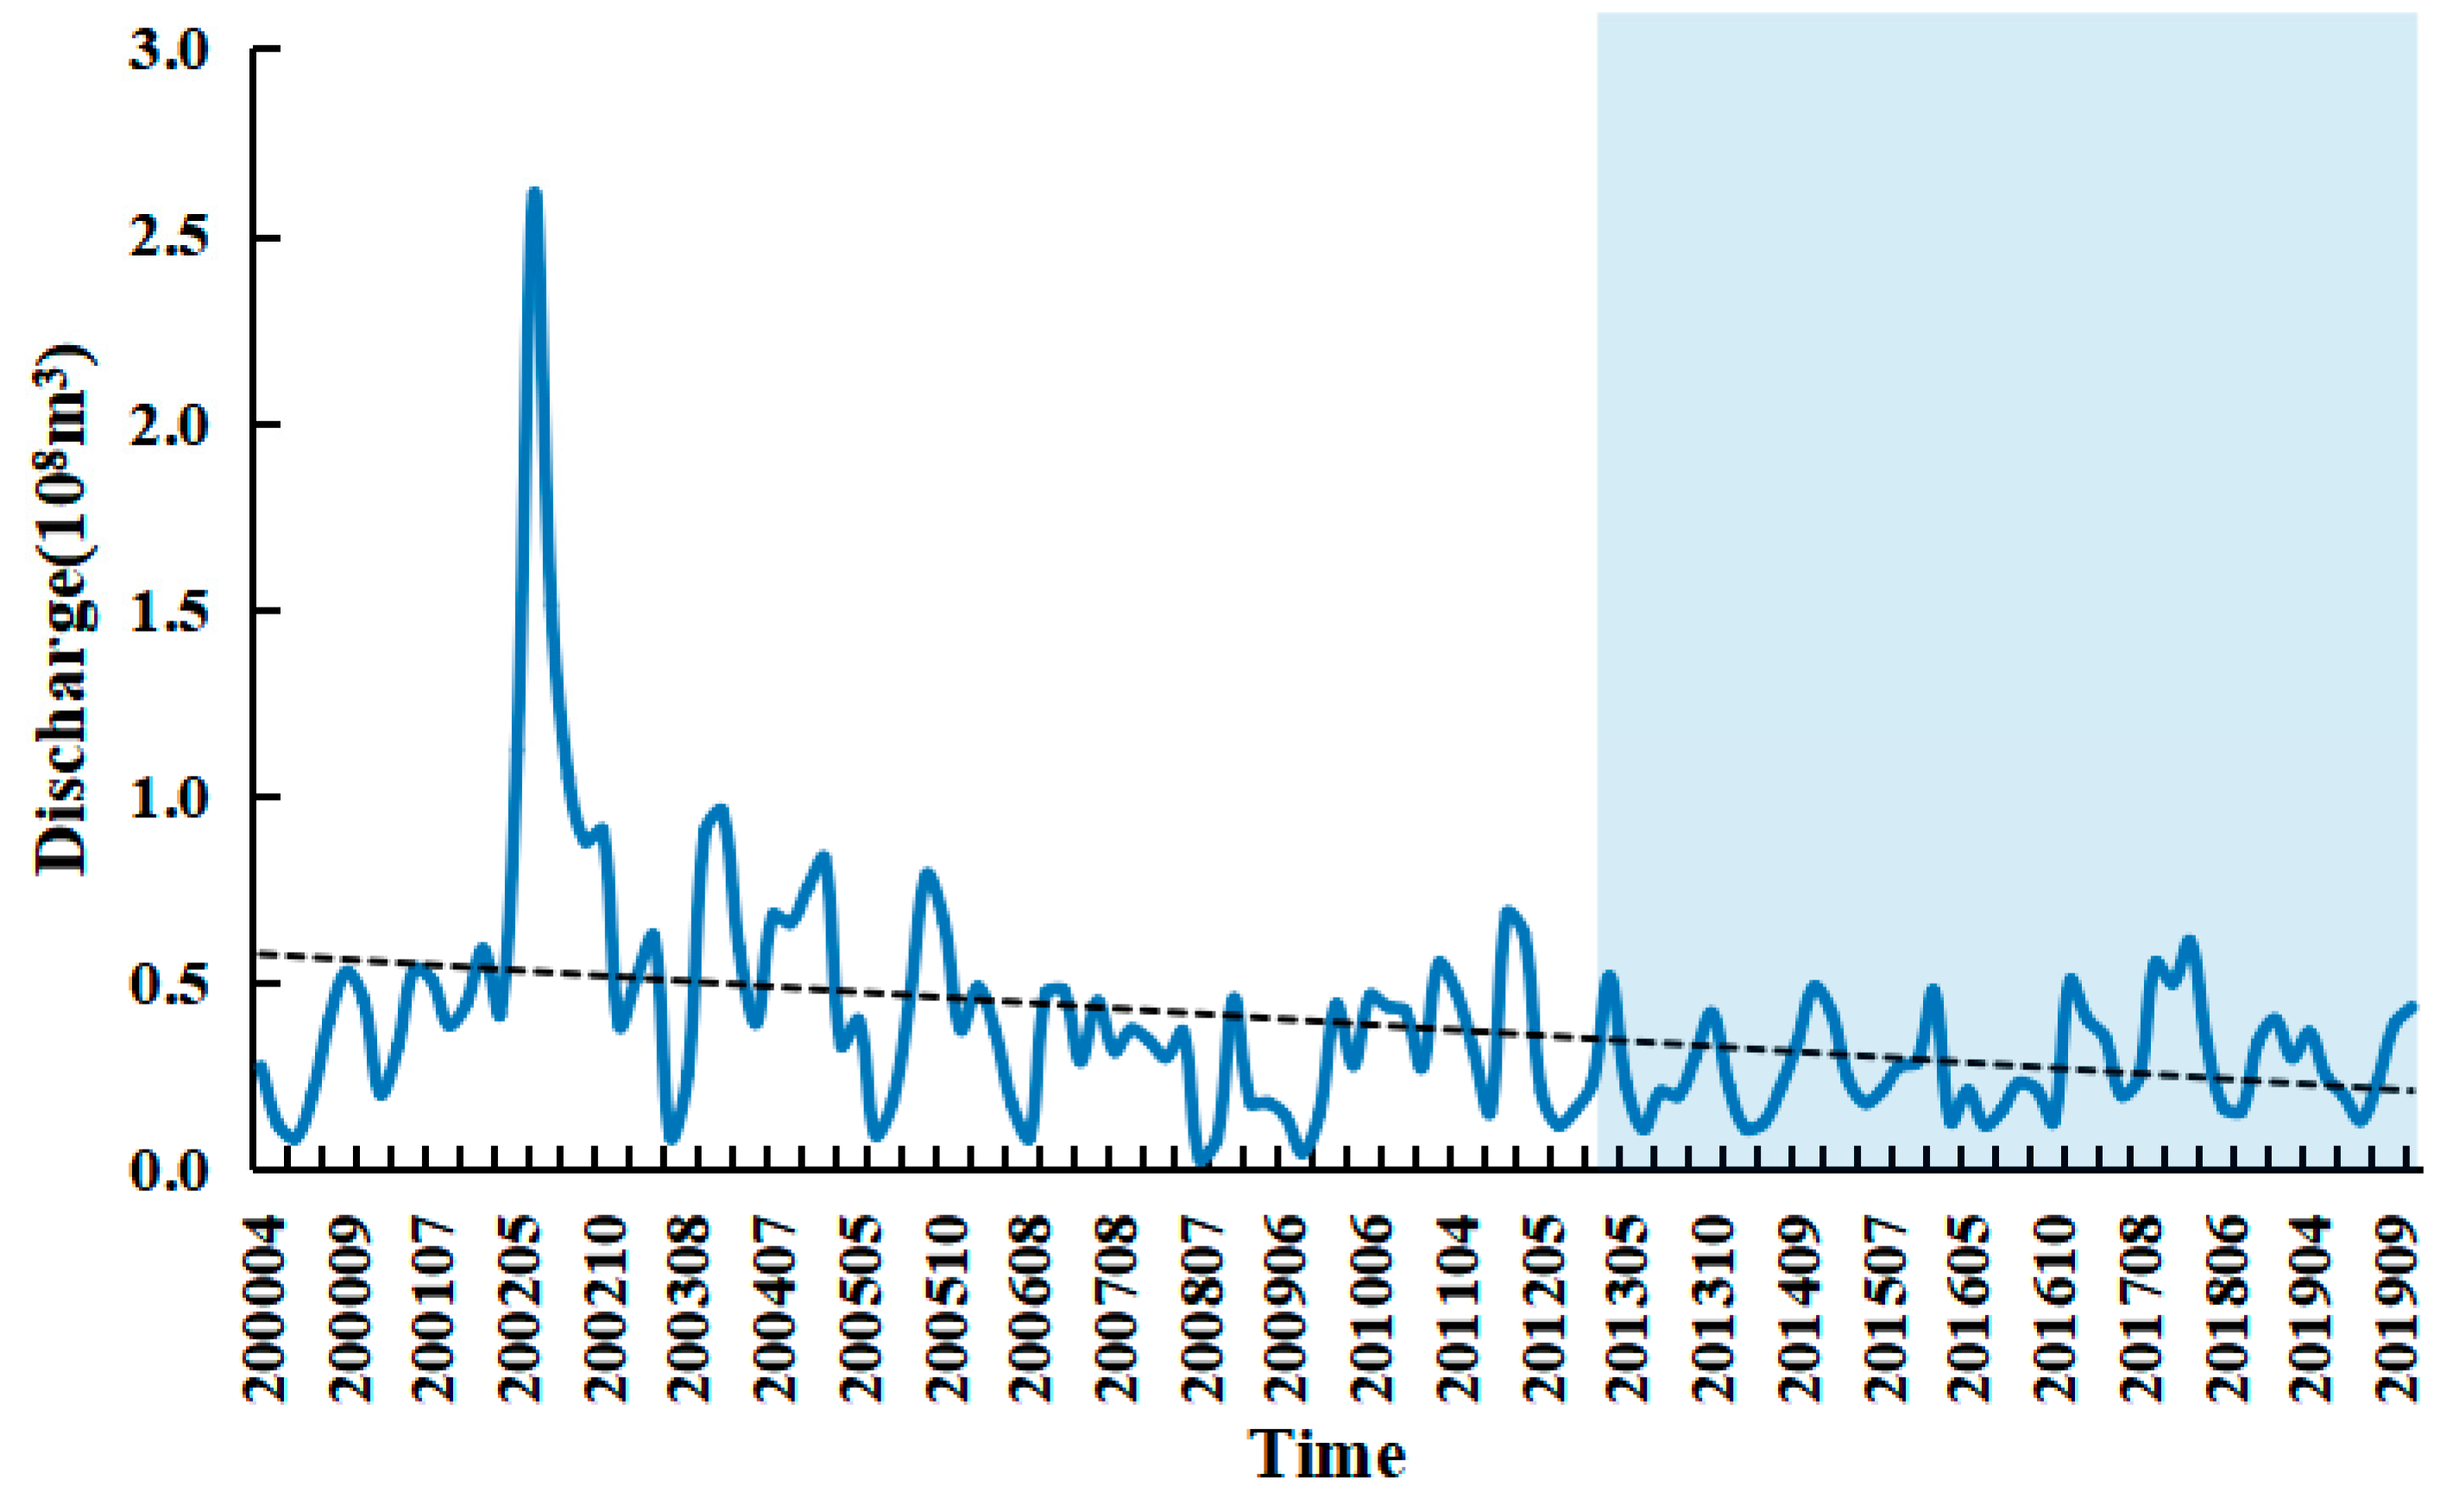
We applied the method described above to Sentinel-2 and Landsat 8 data to simulate the flow of the river into the lake through sections B3 and J2. The inflow monitoring data in this study is monthly average flow data from 2000 to 2012, and subsequent data are missing due to perennial disrepair of the monitoring station equipment. Therefore, this study used the remote sensing river flow estimation method to simulate inflow from 2013 to 2019 (blue area in Figure 6). The daily river flow obtained from remote sensing imagery was taken as the daily average flow of the current month to calculate the monthly scale of river flow into the lake. Finally, the total monthly inflow into Ebinur Lake was obtained by adding the river flows of sections B3 and J2. The results are shown in the blue area in Figure 6.
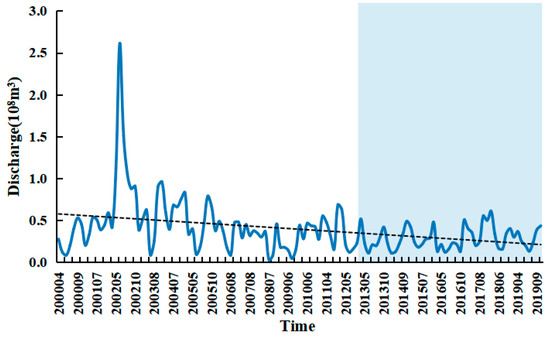
Figure 6.
Variation of average annual inflow from 2000 to 2019.
Since 2000, river flow into Ebinur Lake has shown a significant downward trend (Figure 6). In June 2002, Ebinur Lake inflow reached a maximum value of 2.61 × 10⁸ m3, due to heavy rainfall that year. Since 2002, river flow into the lake has gradually decreased and fluctuated greatly throughout the year. Overall, river flow into Ebinur Lake was relatively large from April to May, after which point the water diversion from human activities in the basin increased, causing river flow to reach low values from July–August. Annual monthly discharge into the lake was less than 0.5 × 10⁸ m3 and less than 0.1 × 10⁸ m3 from July to August from 2003 to 2009. The large amount of water diversion for upstream use significantly affects annual inflow and represents the primary reason for the minimum water surface levels in terminal lakes. The remote sensing river flow estimation method supplements the lake inflow monitoring data and provides important input data for lake water volume simulation.
4.2. Simulation of Lake Water Volume Changes in a Terminal Lake Basin
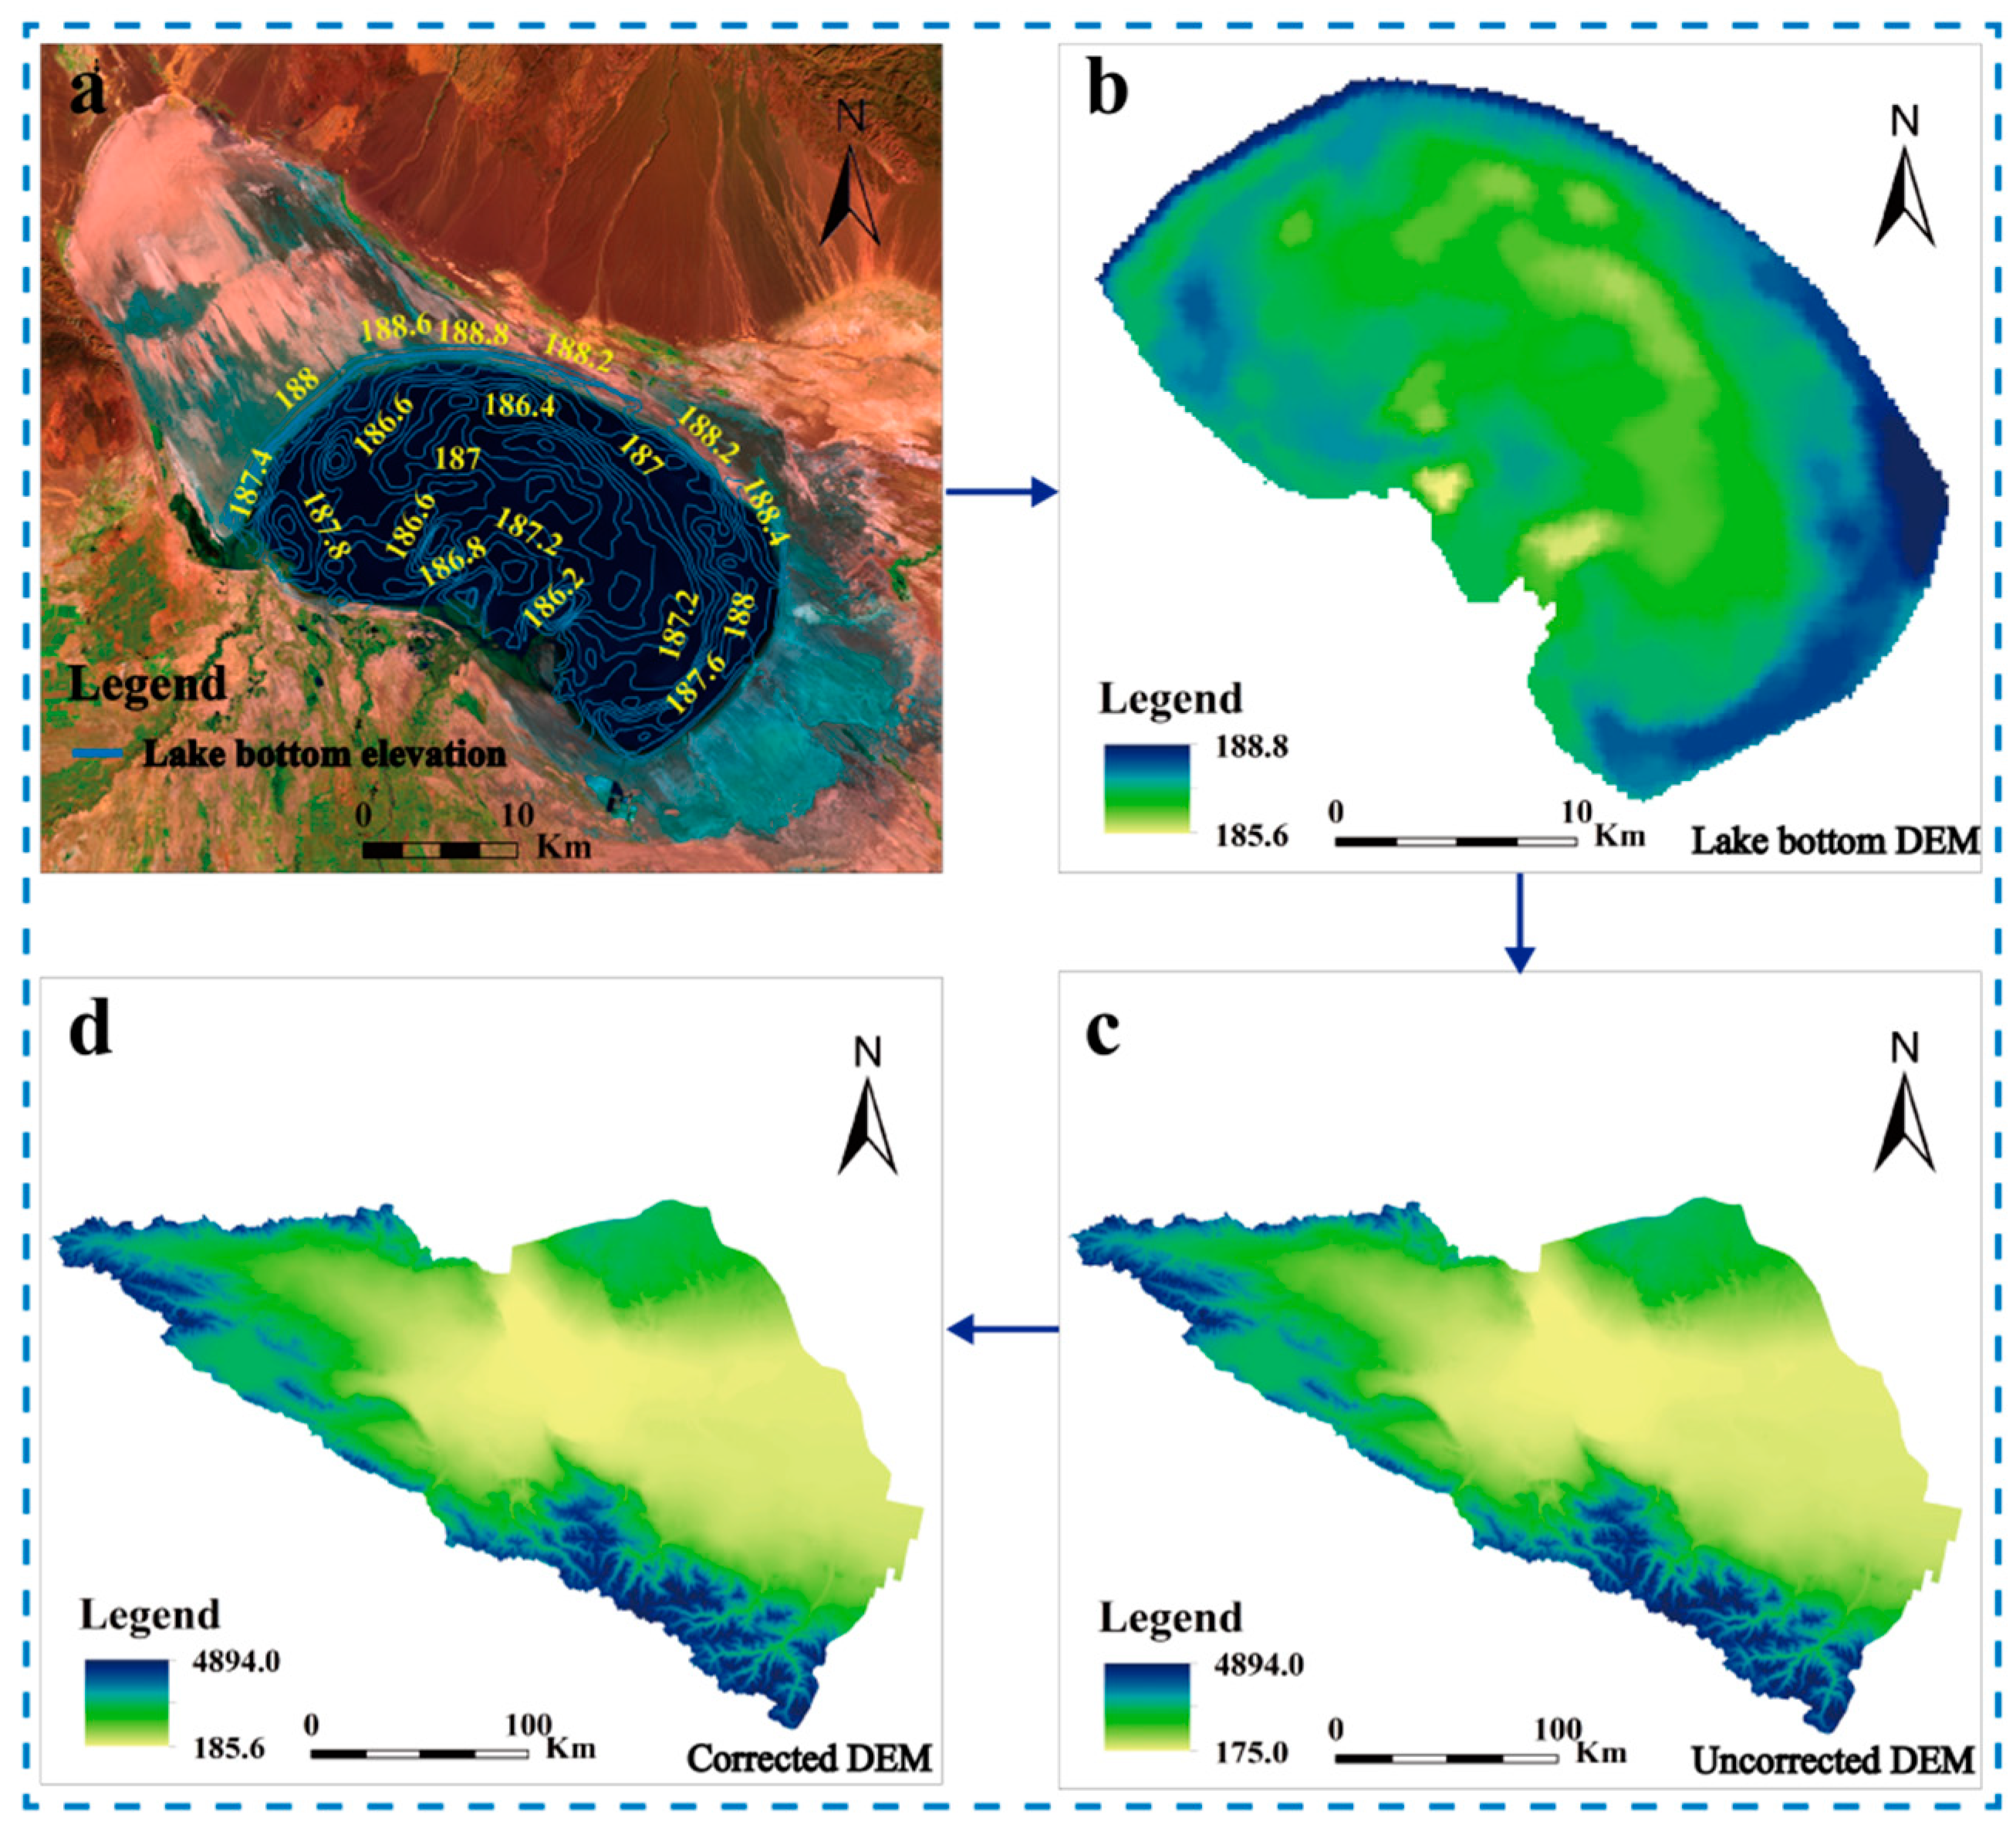
Wu et al. (2010) [49] measured 49 effective lake water depth sampling points in Ebinur lake in August 2003 and obtained the underwater topographic map of Ebinur lake by subtracting the water depth from the water surface elevation. We corrected the lake bottom topographic map in ArcGIS and vectorized the lake bottom terrain. Finally, the lake bottom DEM was generated to obtain the topography of the lake and embedded into the DEM of the Ebinur Lake Basin to obtain the modified DEM. The result is shown in Figure 7.
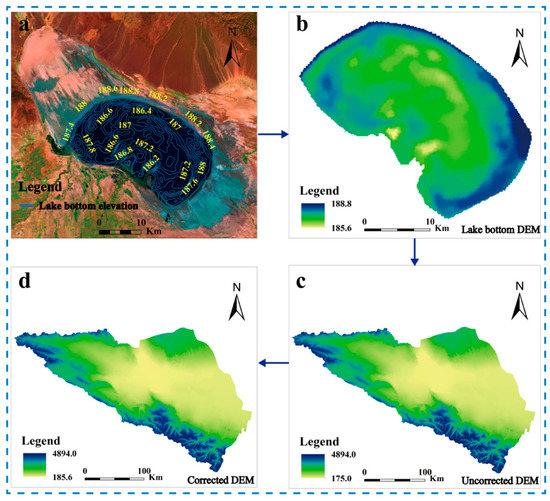
Figure 7.
Topography of the bottom of Ebinur Lake. (a): Vectorization of lake bottom elevation; (b): Generate lake bottom DEM; (c): Original DEM of Ebinur Lake Basin; (d): DEM of Ebinur Lake basin after lake bottom topography correction.
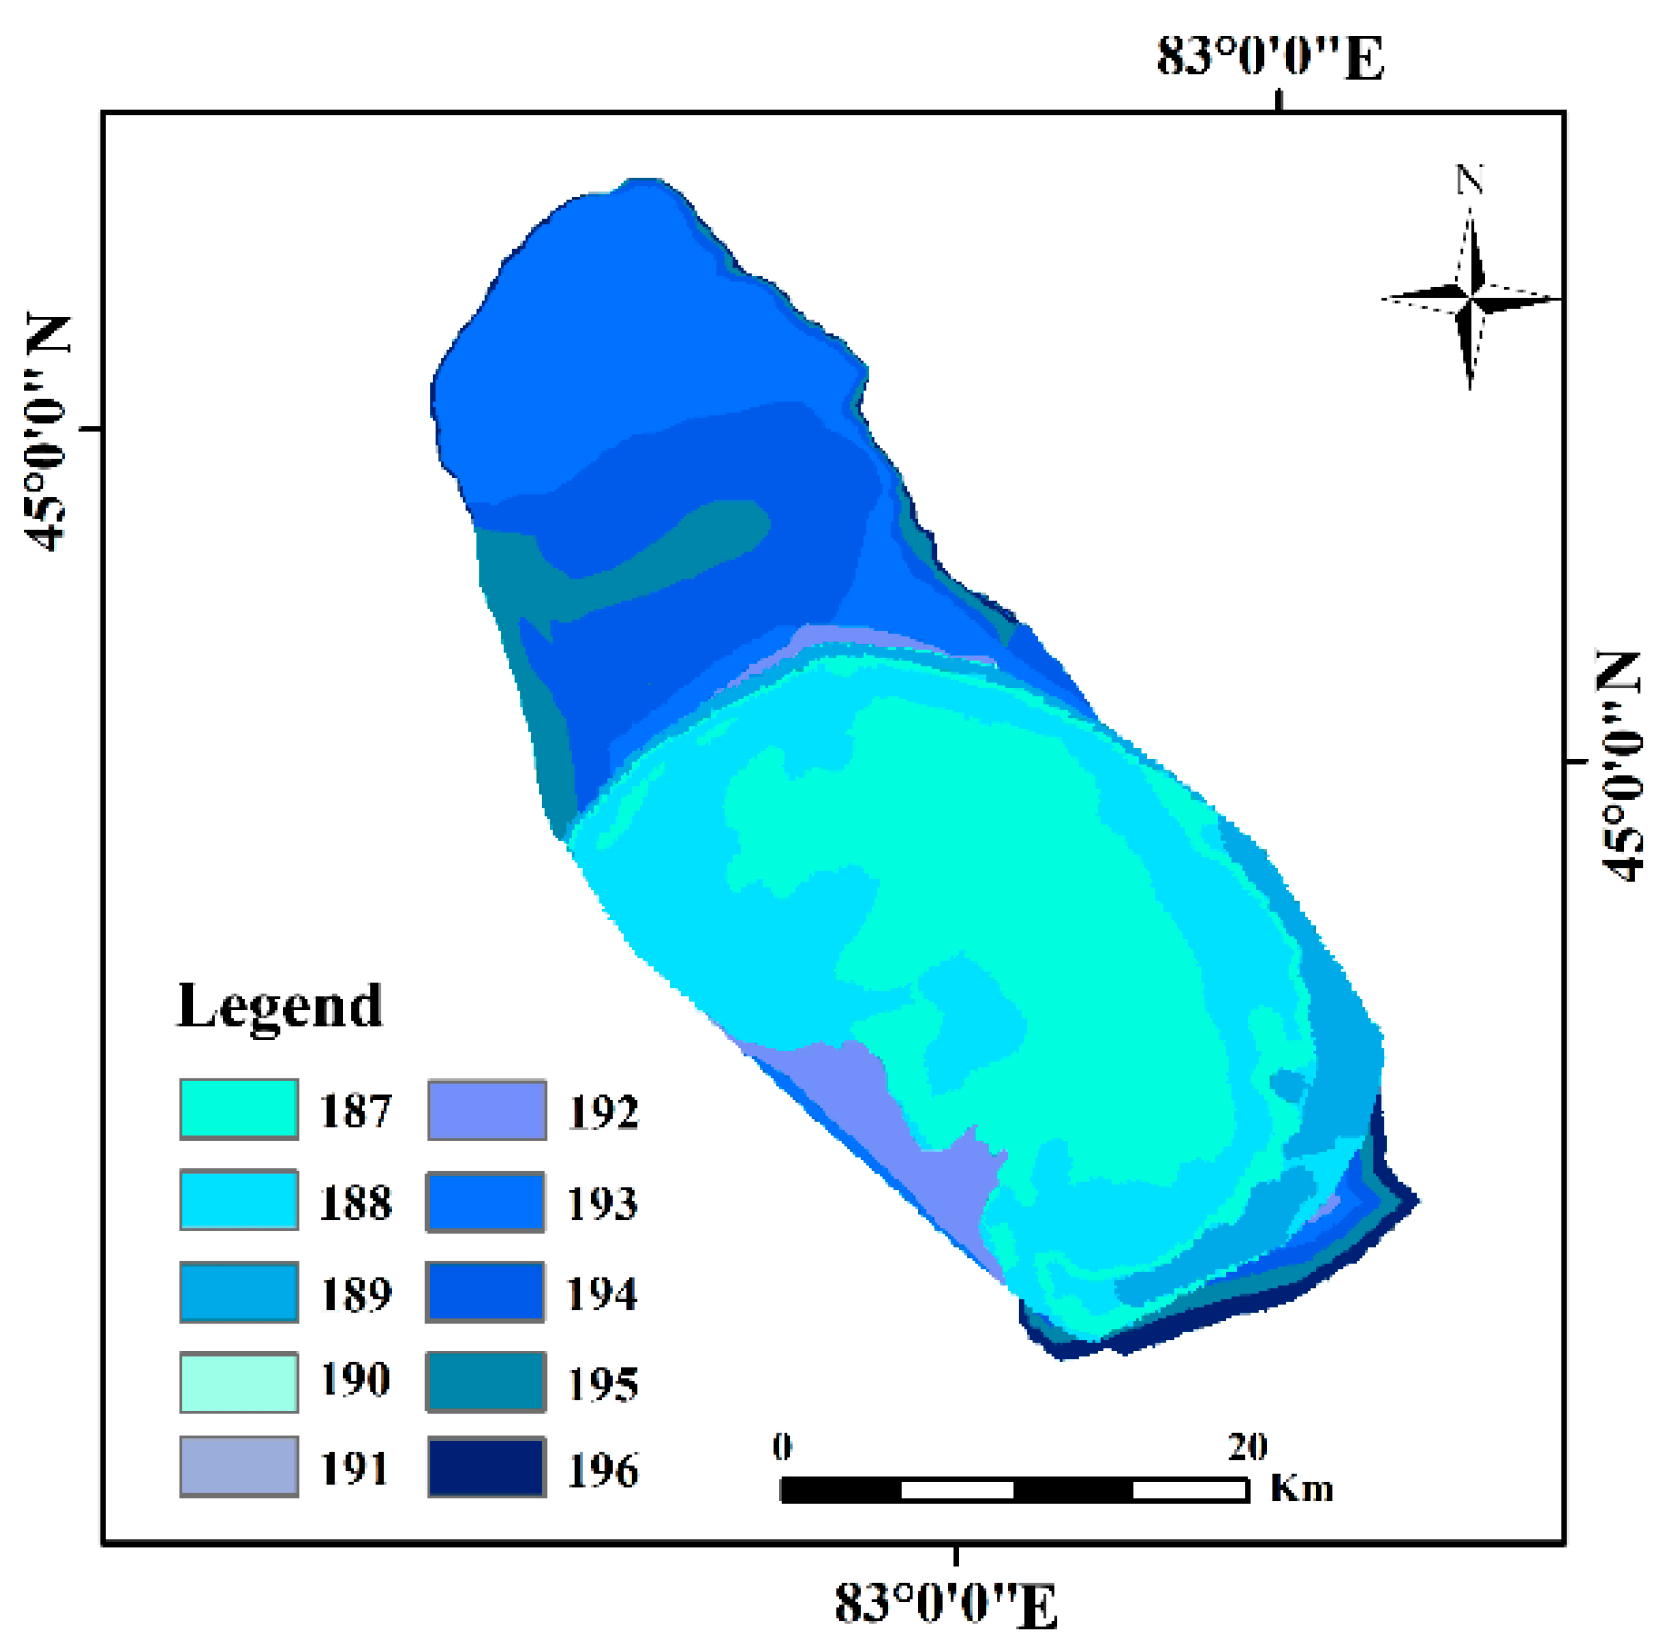
Using the modified DEM at the bottom of Ebinur lake, the lake area corresponding to elevation of 187–196 m was reconstructed with every 1-m rise in the water level (Figure 8).
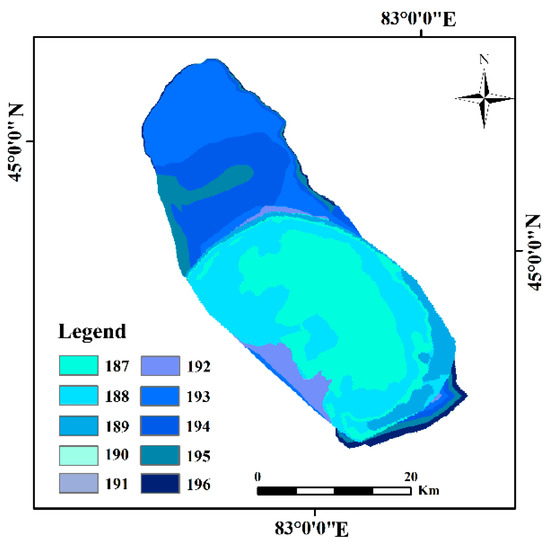
Figure 8.
Area change of Ebinur Lake by water level elevation.
By obtaining the changes in lake water volume at different water surface elevations, the lake water volume-water level and lake water area-water volume models were constructed. The fitting models are shown in Figure 9, and the model results are shown in Table 6.

Figure 9.
Fitting of the lake water level-water volume and lake water area-water volume relationships. (a):The fitting results of lake water volume and water level; (b):The fitting results of lake water area and water volume.

Table 6.
Fitting model of the lake water level-water volume and lake water area-water volume relationships.
Figure 9 shows that the fitting results of the simulation and calculated values of the lake water volume-water level model were satisfactory. The fitting resulted in an R2 greater than 0.98, indicating that the lake water volume can be calculated more accurately by obtaining the lake area to quickly determine water level changes.
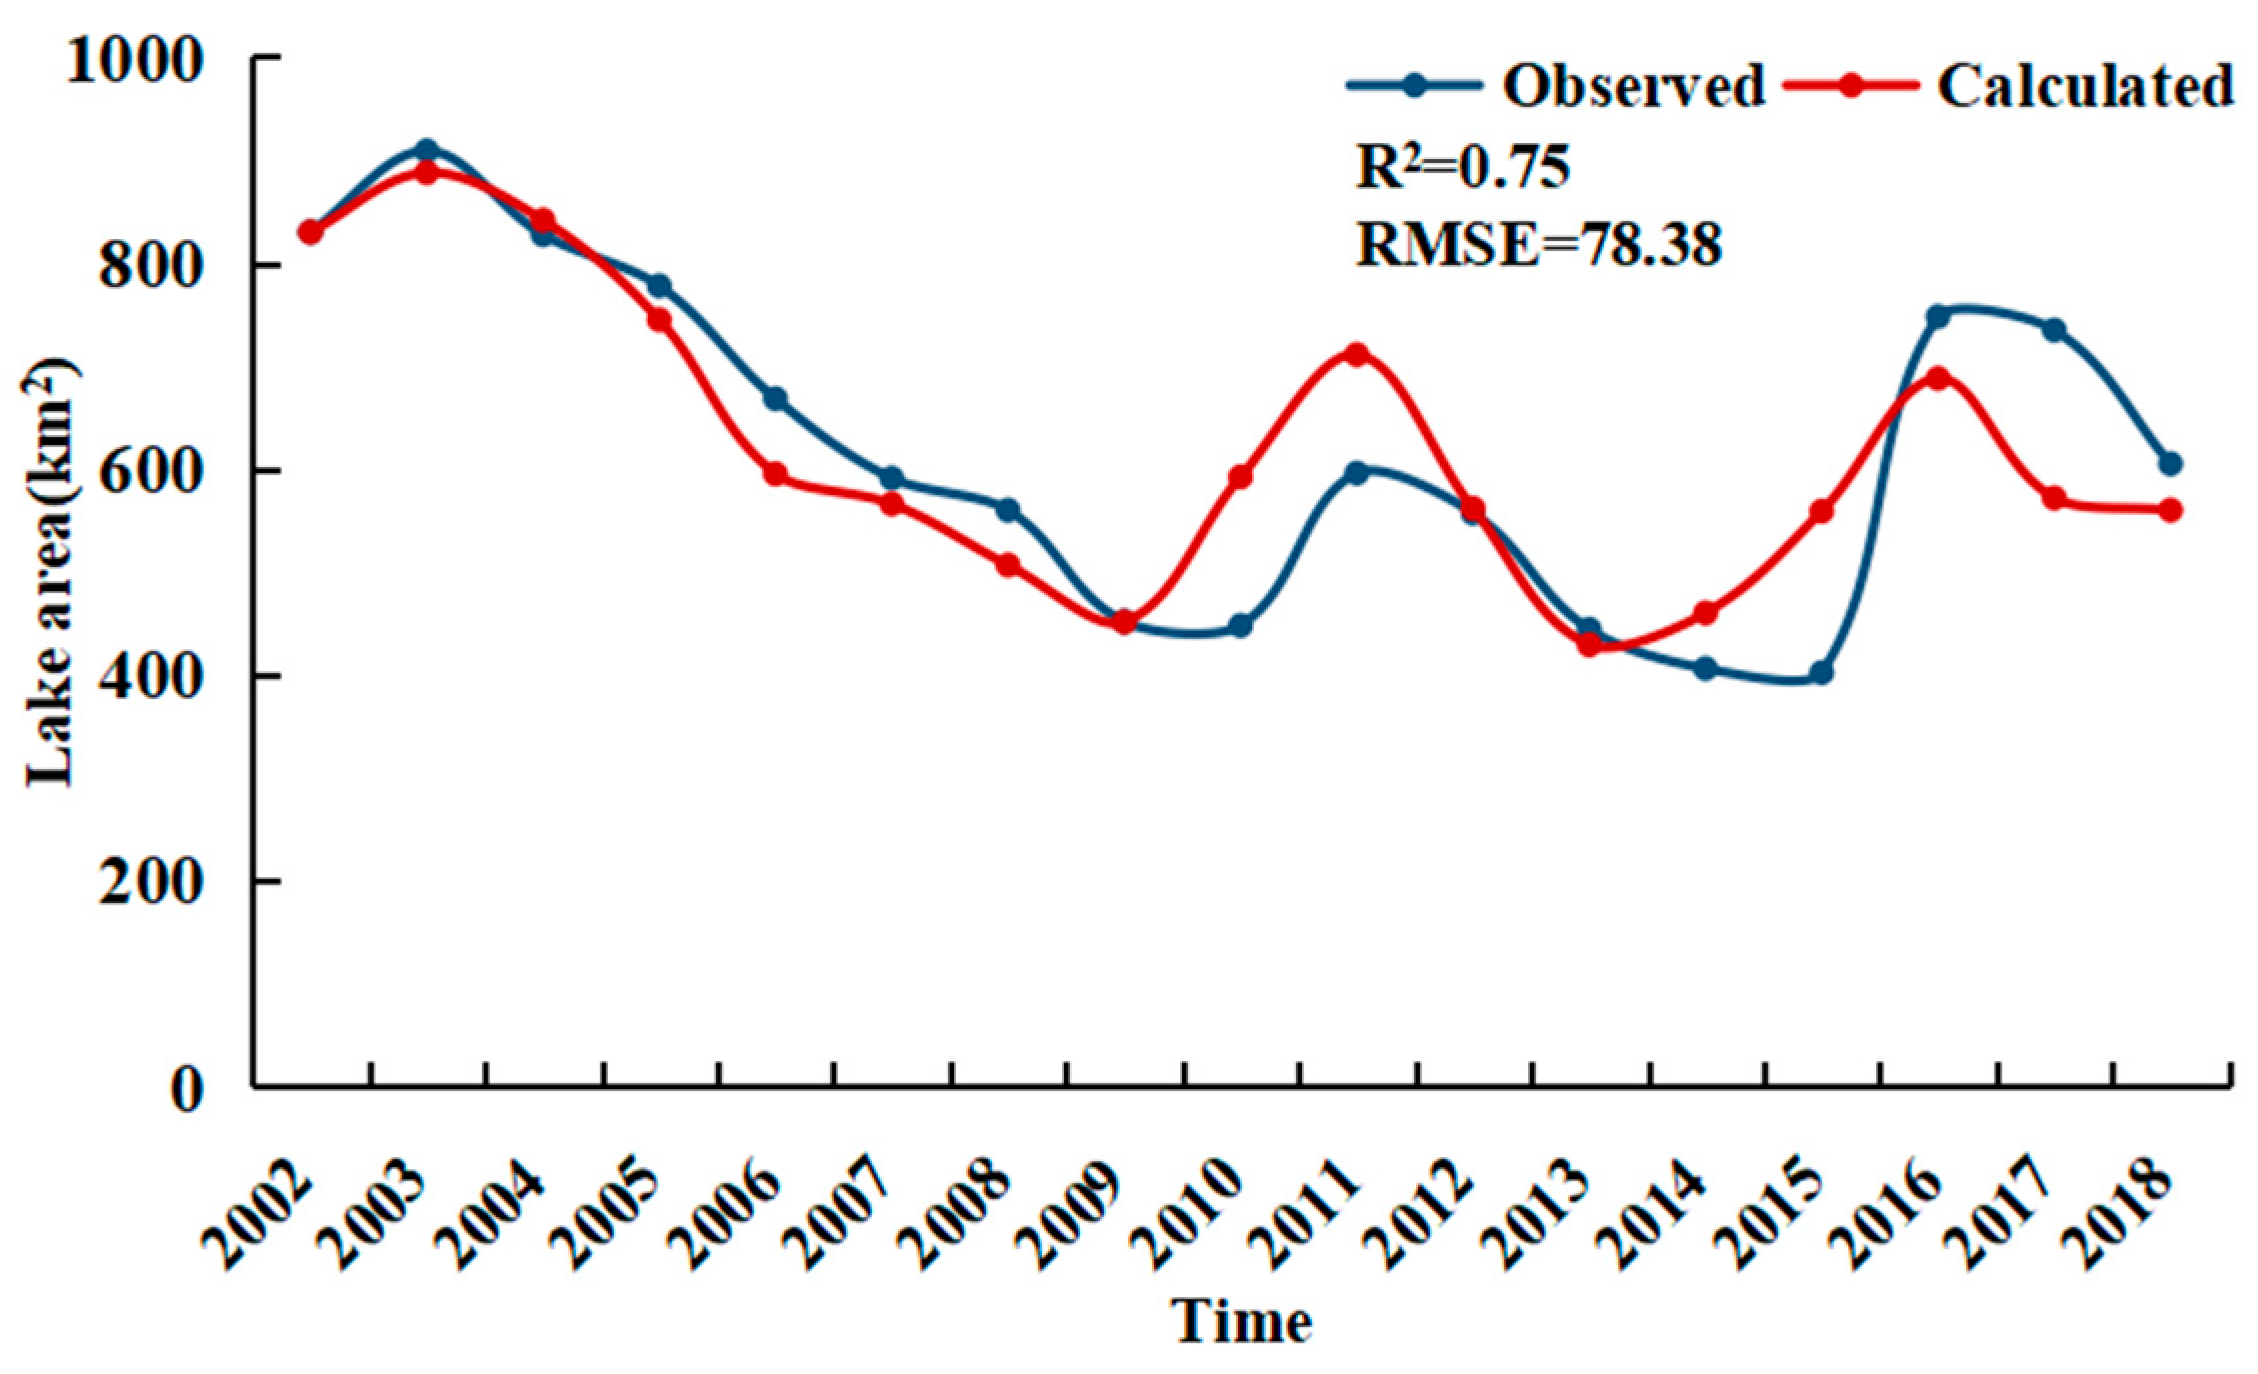
Using the method described in Section 3.4, the relationship between the river inflow and the area of the lake was established, and the changes in lake area and water volume were simulated using only river inflow. The results are shown in Figure 10 and Equation (13).
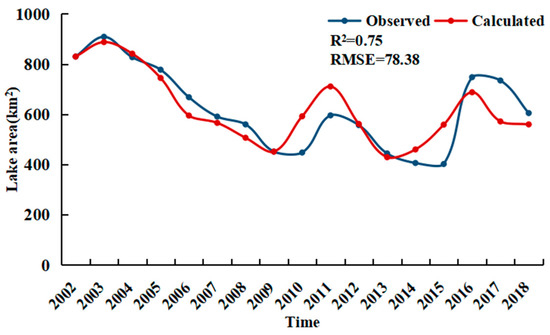
Figure 10.
Prediction of lake area based on inflow.
Consequently, the model R2 of the relationship between river inflow and lake area reached 0.75, and the RMSE was 78.38 km2. Thus, the model fitting result was considered acceptable. Using this model, we can quickly and simply predict the area of the lake by obtaining the river inflow.
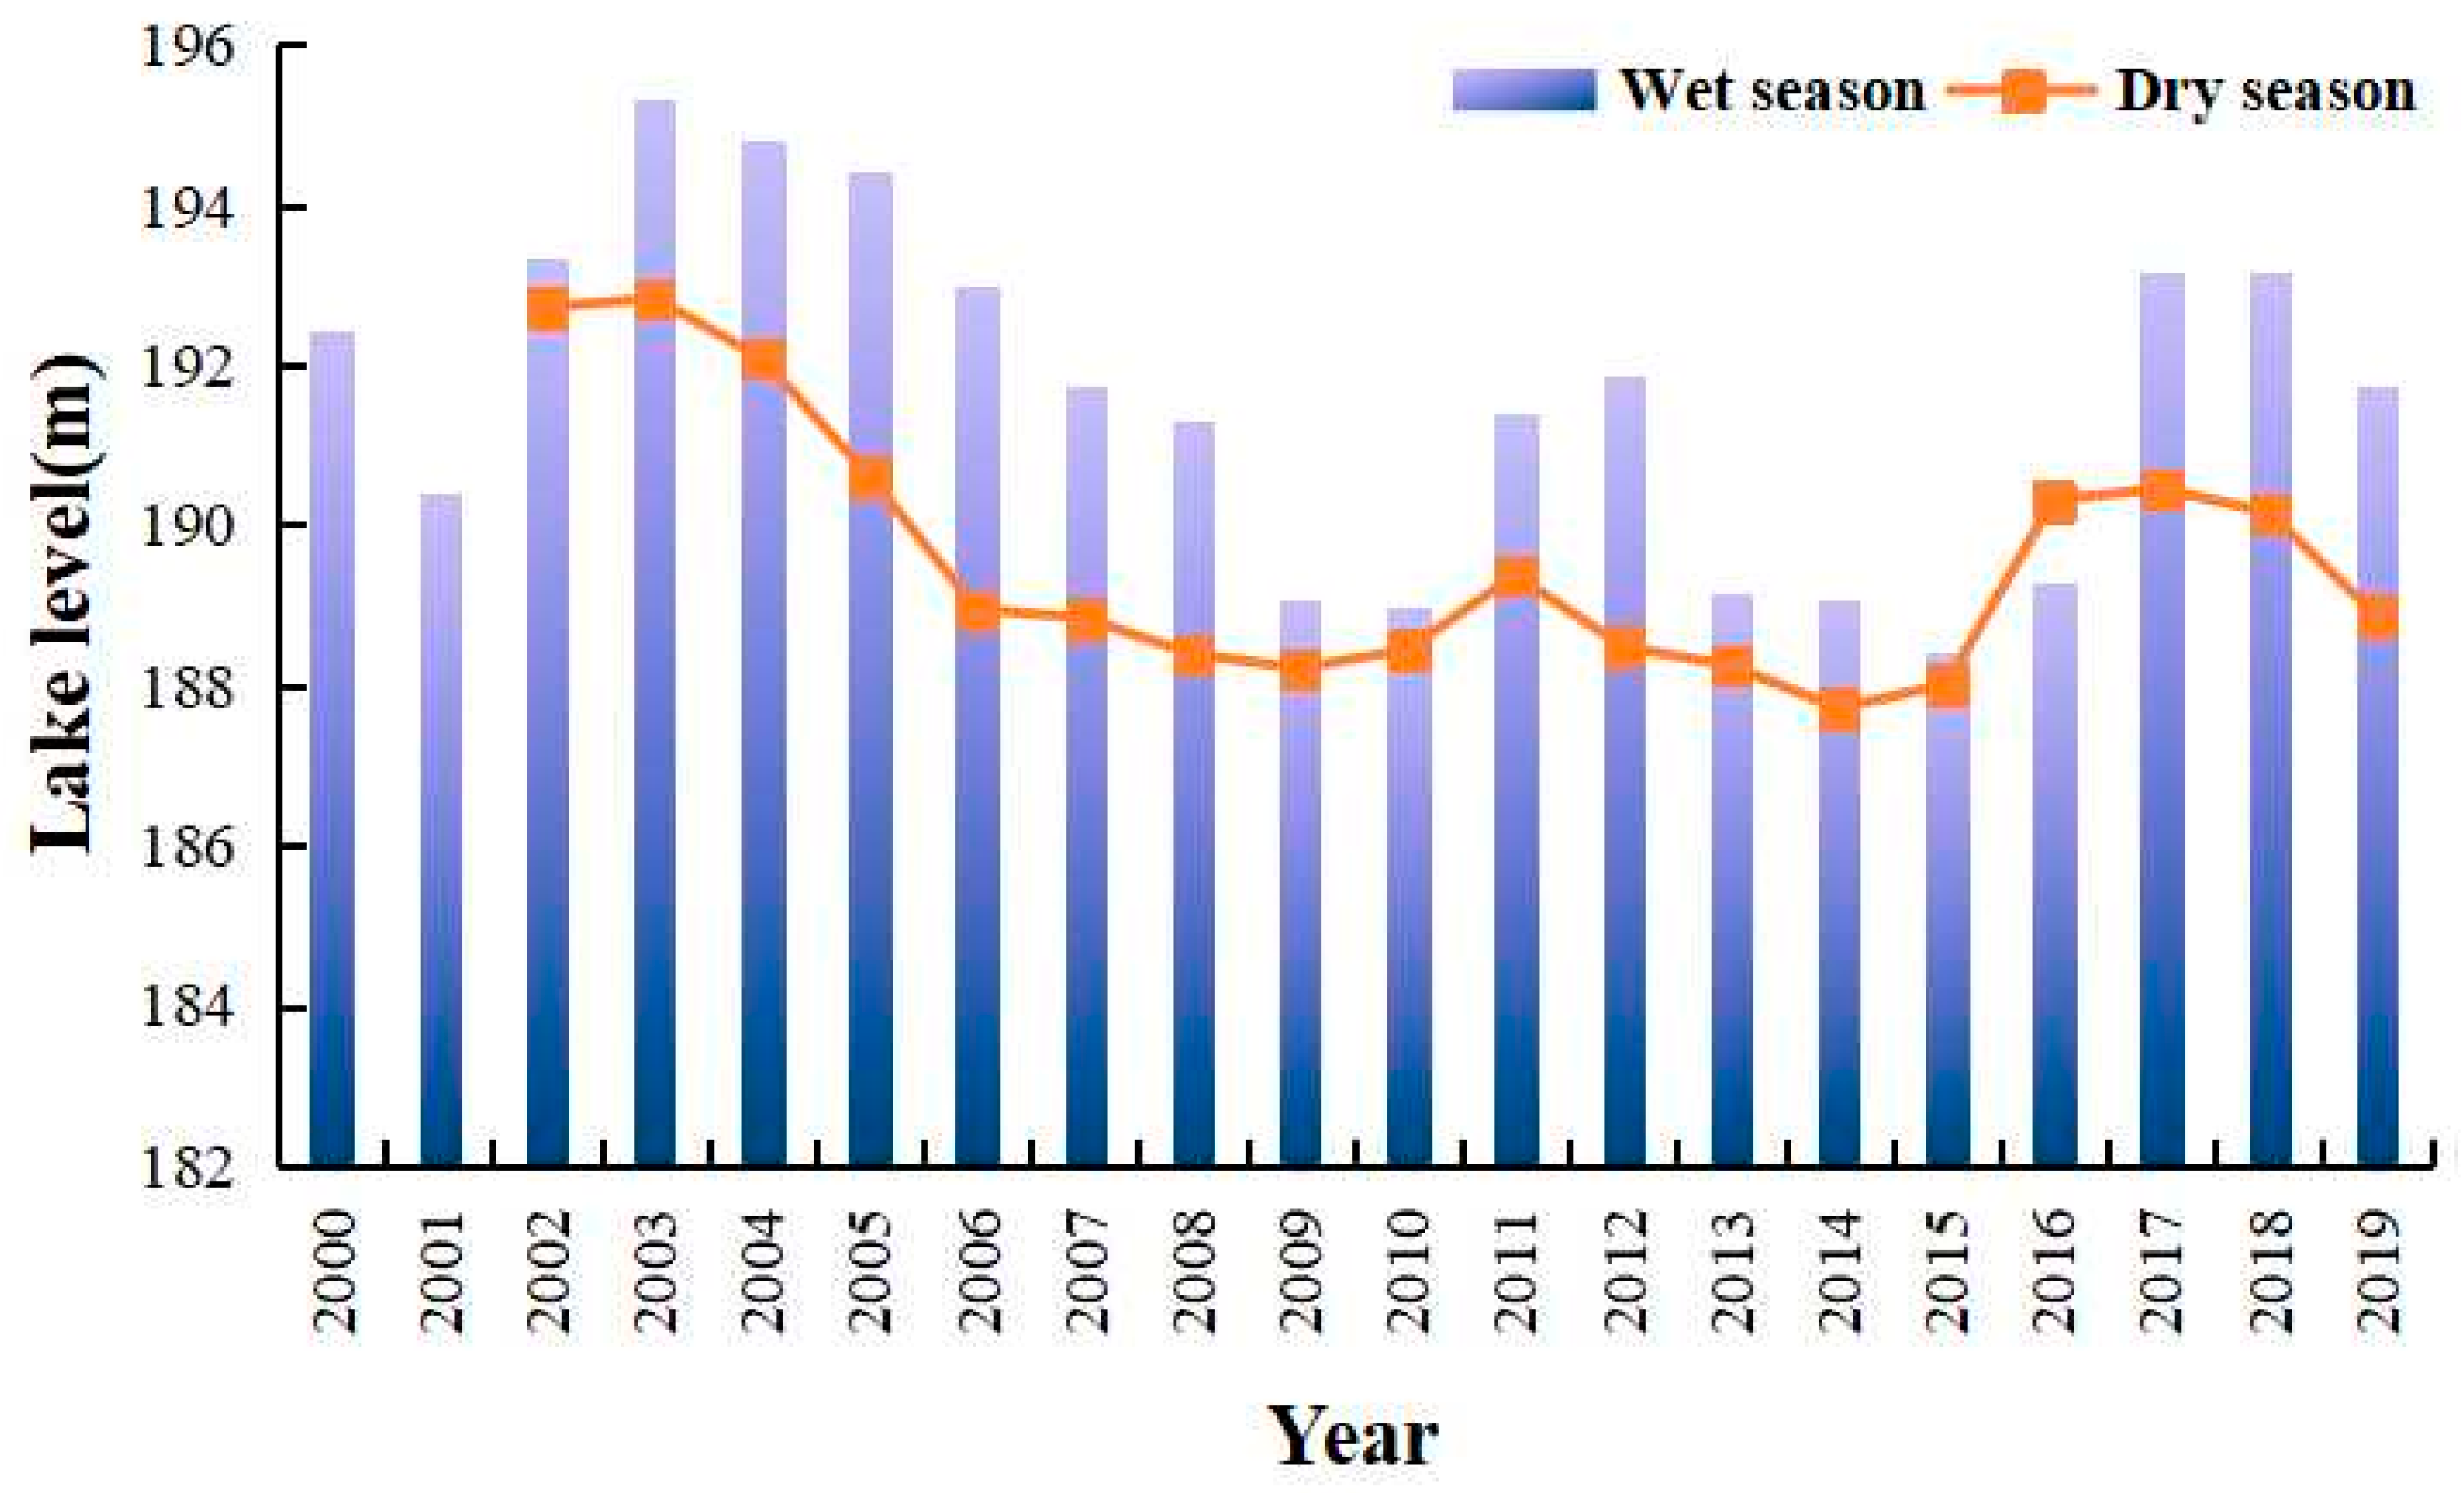
Therefore, the surface area of Ebinur Lake in the wet season (May) and the dry season (October) from 2000 to 2019 was extracted by analyzing Landsat series images. Combined with the model in formula 11~13, the lake water levels (H) in different periods were estimated (Figure 11). The lake area could not be obtained owing to the influence of clouds and fog during the dry season from 2000 to 2001; thus, no water level data were obtained.
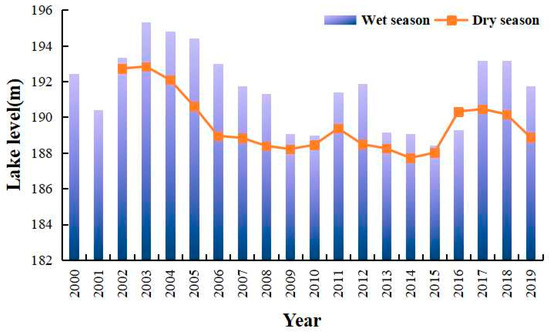
Figure 11.
Lake water level changes from 2000 to 2019.
The lake level showed a significant downward trend from 2000 to 2010 and rose significantly from 2016 to 2019. The water level was typically higher in the wet season than in the dry season. However, in 2016 the water surface area in the dry season (593.86 km2) was larger than that in the wet season (566 km2) owing to the influence of annual rainfall. Consequently, the water level in the dry season was also higher. In the past 20 years, the water level has shown a downward trend.
5. Discussion
5.1. Influence of Precipitation on Lake Water Volume
In arid areas with ungauged basins, precipitation is the primary factor affecting lake water changes. Therefore, we analyzed the correspondence between precipitation and lake area changes by comparing precipitation changes during wet and dry periods. Because directly measuring the precipitation at the lake is difficult, the study used monthly average precipitation from the Bole, Jinghe, and Alashankou meteorological stations close to Ebinur Lake (Figure 12).

Figure 12.
Precipitation and lake area changes from 2000 to 2019 (a): wet season; (b): dry season.
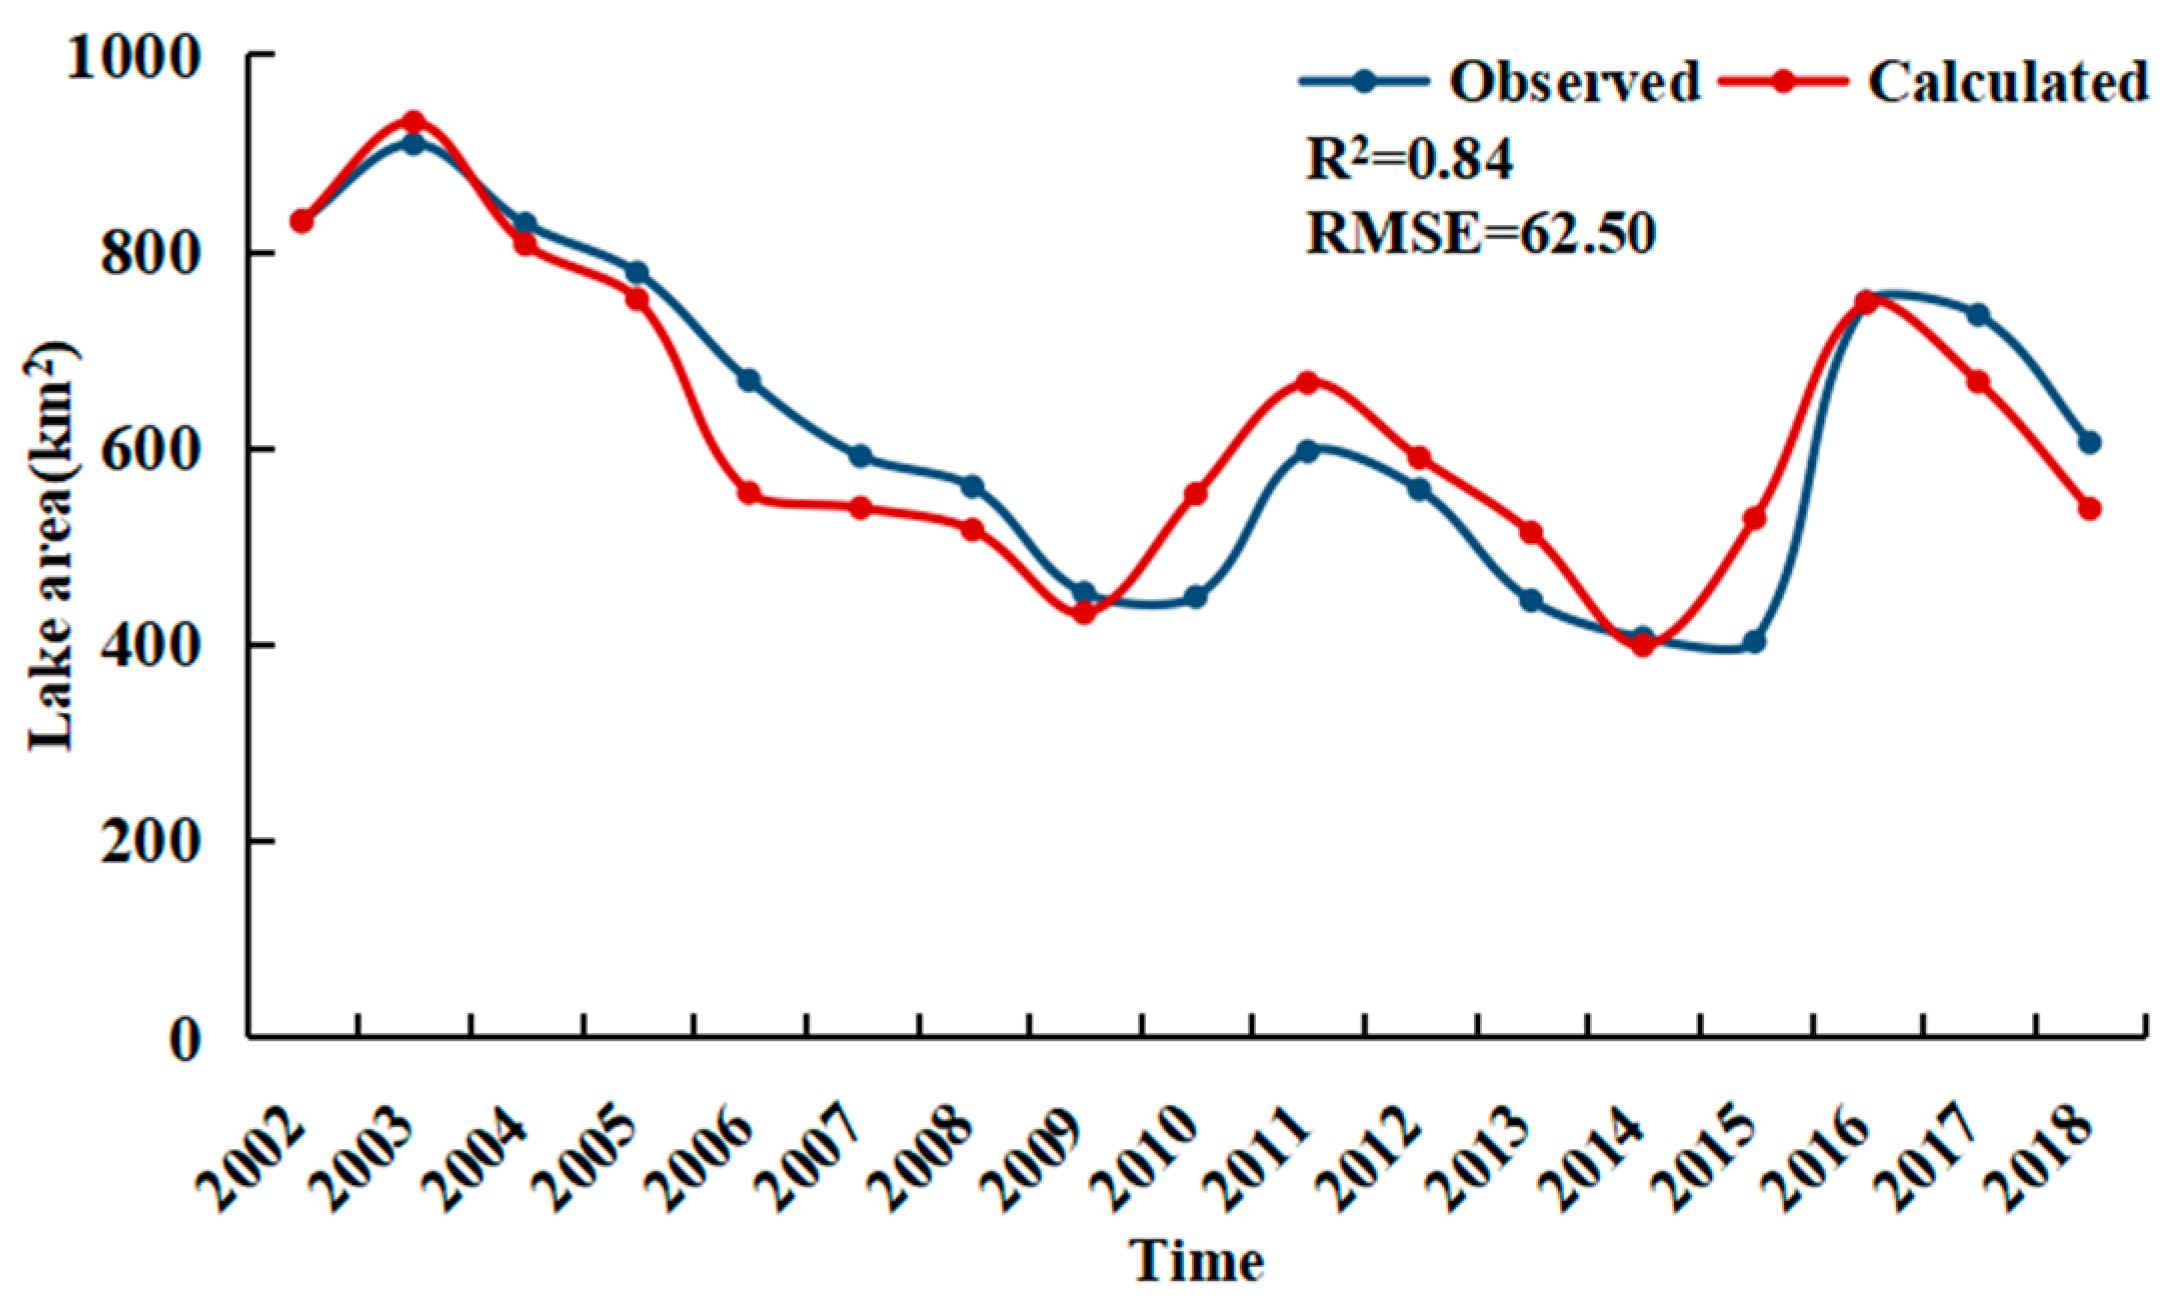
Figure 12 shows good correspondence between precipitation and lake area in the past 20 years, with peak precipitation values of approximately 30~35 mm. In the wet season (Figure 12a), the lake area change and precipitation trends showed good consistency; in the dry season, however, the corresponding relationship was less strong. The gray area in Figure 12b showed that high precipitation does not correspond to a large lake area in the dry season, and the red area shows that low precipitation corresponds to a larger lake area. Thus, in the dry season, precipitation was not the primary factor affecting the change in lake area. Therefore, the lake area was simulated by considering precipitation on the surface and river discharge. The results are shown in Figure 13 and Equation (14).
where A is the lake area, in km2, P is the precipitation on the lake surface, in mm, and Q is the river flow into the lake, in 108 m3. The lake area simulation model R2 that comprehensively considers precipitation and the river flow into the lake can be increased to 0.84, indicating that the lake area can be more accurately predicted by considering precipitation and inflow. Thus, models 11–13 or 11–12,14 can be selected according to the data of the study area to predict lake water volume and water level in the ungauged terminal lake basin of Ebinur Lake. Please note that the empirical models established in this study are only applicable to Ebinur Lake.
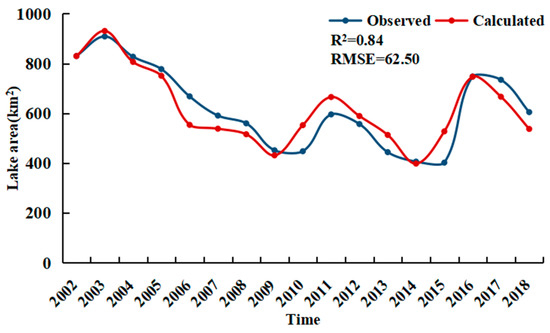
Figure 13.
Simulation of lake area based on rainfall and inflow.
5.2. Comparison and Discussion of Lake Water Volume Simulation Method and Remote Sensing Flow Estimation Method with Existing Methods
5.2.1. Simulation Method of Lake Water Volume
Compared with existing methods of lake water volume change analysis, this research can be divided into the following three categories: (1) Satellite radar altimeter data was used to obtain the lake water level and to analyze changes in the quantity of lake water. The subsatellite point footprints of the major altimetry satellites are approximately 2 km and did not cover all lakes. Research has proven that satellite altimetry is suitable for monitoring dynamic changes in the water levels of large lakes [50]. (2) Lake water volume changes are analyzed based on lake water level change monitoring data and satellite remote sensing imaging of lake area changes [51,52]. This method is restricted by the acquisition of in-situ continuous water level monitoring data, which is difficult to obtain data in ungauged basins. (3) Based on water balance studies, multi-source remote sensing and monitoring data are used to establish the relationship between various hydrological elements and to infer changes in lake water volume [53,54].
The above-mentioned research methods for determining lake water volume are subject to long-term continuous monitoring data and limitations according to lake size and type. The existing related research is primarily concentrated in areas with abundant hydrological data and study typical, large lakes. The use of these methods is difficult in the data-scarce area of the Ebinur Lake Basin. The method used in this study effectively reduces the input data requirements for lake water simulation by using only remote sensing data to obtain the discharge into the lake and allowing a quick and easy evaluation of lake water volume changes. Further, this method provides useful information to guide the utilization of lake water resources in the Ebinur Lake Basin.
5.2.2. Remote Sensing Flow Estimation Method
Abundant theoretical and technological research has recently been conducted on the application of remote sensing data to monitor river discharge [55,56]. These studies can be divided into two categories. The first uses remote sensing to observe discharge indicators in the river, establishes the relationship between the indicators and the discharge, and estimates the discharge by observing changes in said indicators [57]. The key to this statistical method is finding a suitable runoff indicator. The other category uses remote sensing to observe the river water surface width, water level, river slope, and other variables to characterize the hydraulic geometry of the river and utilizes the resulting hydraulic equations to estimate the discharge. This type of method, which combines the basic theories of hydraulics and uses established hydraulic geometry parameters for the river, is more popular and has greater application value [44]. For example, Huang et al. [44] used remote sensing to observe width and water depth in the upper reaches of the Yarlung Zangbo River and used the improved the Manning formula to calculate discharge. Garambois et al. [57] studied the method of Surface Water and Ocean Topography satellite measurement of water surface elevation and proposed a new method of river discharge estimation based on the one-dimensional Saint-Venant equation.
Due to the limited accuracy of satellite remote sensing data—especially the difficulty of underwater topographic measurement—no breakthrough has been made [58], and the acquisition of direct or indirect data related to water depth remains unreliable. All previous research thus selected areas on large rivers to minimize the error caused by data inaccuracy. This study effectively combined UAV and satellite data for small- and medium-sized rivers in ungauged basins, and the results showed good surface runoff simulation.
5.3. Accounting for Changing River Bottom Topography
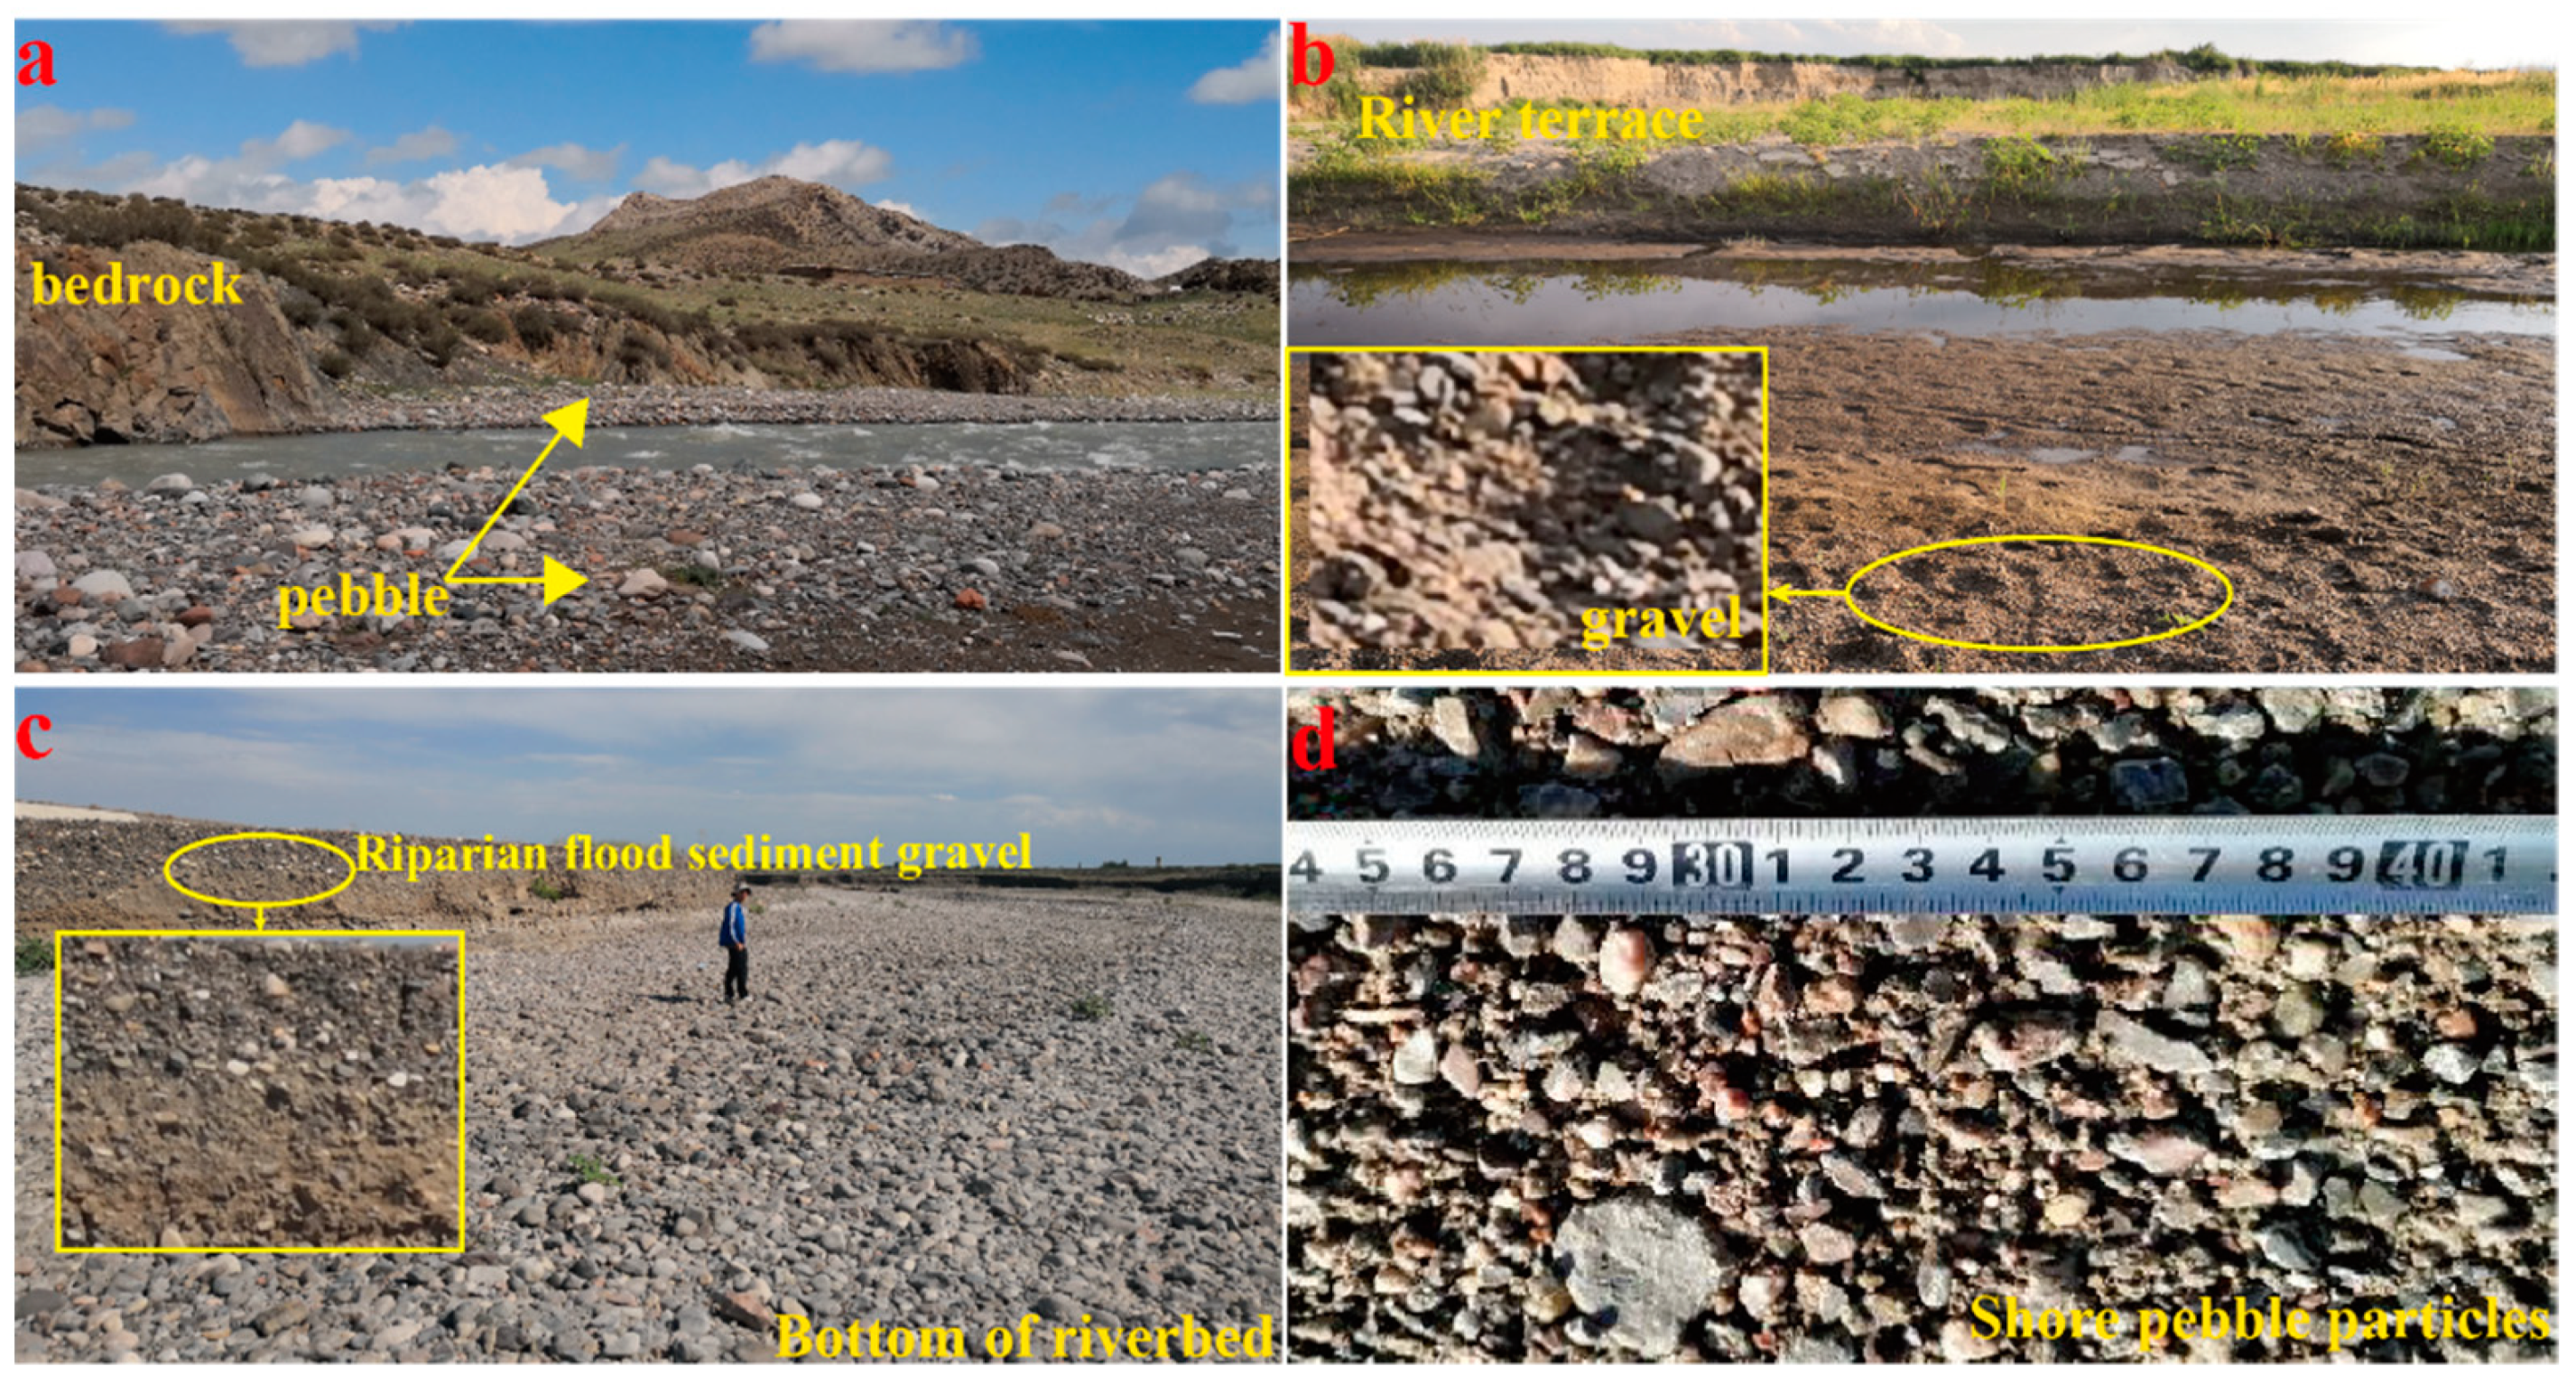
According to the requirements of the National Hydrological Survey specification (SL58-2014), the survey section should be a relatively stable river section. In the Ebinur Lake Basin, the bottom of the river is mostly composed of bedrock, gravel, or pebbles (Figure 14) and the river morphology is relatively stable. However, the occurrence of a flood event that changes the river morphology due to erosion would require the use of UAV to remeasure the reach after the flood. In the absence of a flood event, the Hydrological Survey specification (SL58-2014) requires a comprehensive survey of the cross-section at 5-y intervals for correction and remodeling.
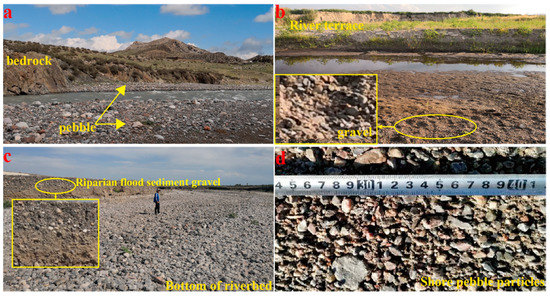
Figure 14.
Photos of representative rivers in the study area. (a) The river bank is composed of bedrock and large pebbles distributed on both sides of the river; (b) a river terrace is present and the floodplain is gravelly; (c) the river is dry during the dry season, and the river bottom is covered by pebbles; (d) pebble particles on the bank.
Many methods currently support the modeling of underwater terrain, which can calculate the flow area and hydraulic radius and be used to estimate runoff [59,60]. In the Ebinur Lake Basin, the river is dry or semidry in the dry season. The UAV accurately recorded the river terrain during this time, avoiding the issue of wading measurements. This paper proposes the following possible solutions for other underwater river sections:
(Figure 15a) The orange dashed line is the measured underwater data, and the blue solid line is the terrain data obtained by UAV. The two are combined to create a complete river section.

Figure 15.
Underwater section acquisition method. (a): Supplement the missing underwater terrain data with measured data; (b): Estimate river flow based on background values; (c): Fit underwater terrain.
During periods of less river flow, only the above-water section is digitized and records a measured Q0 value, which is used as a background value in the subsequent discharge estimation (Figure 15b). This method is a good solution when the water volume exceeds Q0; however, for discharges less than Q0, the section relationship and correct Q0 must be re-established.
Underwater terrain fitting is generally the preferred method in areas of turbulent flow not suitable for measurements, such as high mountains and valleys. Geometry is used to fit the underwater section according to the above-water terrain information. Figure 15c shows underwater terrain fitted by a parabolic equation. The orange solid line is the fitted result of parabolic equation, and the blue solid line is the terrain data obtained by UAV. In addition to parabolic fitting, triangles, trapezoids, rectangles, and arcs are commonly used fitting shapes that are selected according to the location of the river and the actual situation [60].
In conclusion, for flood events, the above-mentioned method can be selected for re-measurement, according to the specific situation at the site after flood scouring. Therefore, the use of low-altitude remote sensing data for river estimation methods can have excellent adaptability in different geographic environments and can be popularized and applied in other areas with insufficient hydrological data.
6. Conclusions
Owing to improvements in hydrological parameters and variable precision requirements, the data obtained by conventional remote sensing methods do not meet the hydrological calculation of the Ebinur Lake ungauged basin in Xinjiang. Thus, the use of effective methods to simulate and monitor surface water resources is required. This study proposes a remote sensing river flow estimation method to calculate river flow based on multi-source remote sensing images, effectively reduces the parameters required for lake water volume simulation, and provides a reference for the simulation of water volume in terminal lakes with scarce data. The results showed that:
(1) The effective combination of high-altitude remote sensing and low-altitude drone technology established a flow estimation method suitable for small- and medium-sized rivers.
(2) The lake water volume and water level prediction simulation was quickly conducted by obtaining the lake surface precipitation and the river inflow discharge, which significantly reduced the input parameters required for conventional lake water volume simulation.
Overall, this study combined low- and high-altitude remote sensing data to provide new prospects for the rapid assessment of river flow. This method effectively promoted the simulation of lake water resources in the Ebinur Lake ungauged basin and provided an important reference for water resource monitoring in the basin.
Author Contributions
Conceptualization, J.W. and S.Y.; Formal analysis, J.W., H.L. (Huiping Liu), and P.W.; investigation, J.W. and P.W.; Methodology, J.W., S.Y., and H.L. (Huiping Liu); Visualization, H.L. (Hezhen Lou); writing—original draft, J.W.; writing—review and editing, H.L. (Hezhen Lou) and T.G. All authors have read and agreed to the published version of the manuscript.
Funding
This research was funded by the National Natural Science Foundation of China (Grant Nos. U1603241).
Data Availability Statement
The data presented in this study are available on request from the corresponding author.
Acknowledgments
We acknowledge all of the editors and reviewers for their valuable advice. The authors are also thankful for the financial support from the National Natural Science Foundation of China (Grant Nos. U1603241).
Conflicts of Interest
The authors declare no conflict of interest.
References
- Zuo, Q.T.; Cui, G.T. Study on theoretical system and framework of interconnected river system network. Water Resour. Power 2012, 30, 1–5. (In Chinese) [Google Scholar]
- Cheng, W.M.; Zhou, C.H.; Liu, H.J.; Zhang, Y. The Oasis expansion and eco-environment change over the last 50years in Manas River Valley, Xinjiang. Sci. China Ser. D Earth Sci. 2005, 11, 1074–1086. [Google Scholar] [CrossRef]
- Williams, W.D. What future for saline lakes? Environ. Sci. Policy Sustain. Dev. 1996, 38, 12–39. [Google Scholar] [CrossRef]
- Ariztegui, D.; Anselmetti, F.S.; Robbiani, J.M.; Bernasconi, S.M.; Brati, E.; Gilli, A.; Lehmann, M.F. Natural and human-induced environmental change in southern Albania for the last 300 years—Constraints from the Lake Butrint sedimentary record. Glob. Planet. Chang. 2010, 71, 183–192. [Google Scholar] [CrossRef]
- Russell, J.M.; McCoy, S.J.; Verschuren, D.; Bessems, I.; Huang, Y. Human impacts, climate change, and aquatic ecosystem response during the past 2000 yr at Lake Wandakara, Uganda. Quat. Res. 2009, 72, 315–324. [Google Scholar] [CrossRef]
- Bartolai, A.M.; He, L.; Hurst, A.E.; Mortsch, L.; Paehlke, R.; Scavia, D. Climate change as a driver of change in the Great Lakes St. Lawrence River basin. J. Great Lakes Res. 2015, 41, 45–58. [Google Scholar] [CrossRef]
- Yan, L.; Zheng, M. The response of lake variations to climate change in the past forty years: A case study of the northeastern Tibetan Plateau and adjacent areas, China. Quat. Int. 2015, 371, 31–48. [Google Scholar] [CrossRef]
- Wang, J.; Song, C.; Reager, J.T.; Yao, F.; Famiglietti, J.S.; Sheng, Y.; MacDonald, G.M.; Brun, F.; Schmied, H.M.; Marston, R.A.; et al. Recent global decline in endorheic basin water storages. Nat. Geosci. 2018, 11, 926–932. [Google Scholar] [CrossRef]
- Rodell, M.; Famiglietti, J.S.; Wiese, D.N.; Reager, J.T.; Beaudoing, H.K.; Landerer, F.W.; Lo, M.H. Emerging trends in global freshwater availability. Nature 2018, 557, 651–659. [Google Scholar] [CrossRef]
- Hammer, U.T. Saline Lake Ecosystems of the World; Springer Science & Business Media: Berlin, Germany, 1986. [Google Scholar]
- Pavelsky, T.M. World′s landlocked basins drying. Nat. Geosci. 2018, 11, 892–893. [Google Scholar] [CrossRef]
- Du, Y.; Xue, H.P.; Wu, S.J.; Ling, F.; Xiao, F.; Wei, X.H. Lake area changes in the middle Yangtze region of China over the 20th century. J. Environ. Manag. 2011, 92, 1248–1255. [Google Scholar] [CrossRef]
- Abbott, B.W.; Bishop, K.; Zarnetske, J.P.; Hannah, D.M.; Frei, R.J.; Minaudo, C.; Chapin, F.S., III; Krause, S.; Conner, L.; Ellison, D.; et al. A water cycle for the Anthropocene. Hydrol. Process. 2019, 33, 3046–3052. [Google Scholar] [CrossRef]
- Chaudhari, S.; Felfelani, F.; Shin, S.; Pokhrel, Y. Climate and anthropogenic contributions to the desiccation of the second largest saline lake in the twentieth century. J. Hydrol. 2018, 560, 342–353. [Google Scholar] [CrossRef]
- Wine, M.L.; Rimmer, A.; Laronne, J.B. Agriculture, diversions, and drought shrinking Galilee Sea. Sci. Total Environ. 2019, 651, 70–83. [Google Scholar] [CrossRef]
- Zhang, G.; Yao, T.; Chen, W.; Zheng, G.; Shum, C.K.; Yang, K.; Piao, S.; Sheng, Y.; Yi, S.; Li, J.; et al. Regional differences of lake evolution across China during 1960s–2015 and its natural and anthropogenic causes. Remote Sens. Environ. 2019, 221, 386–404. [Google Scholar] [CrossRef]
- Case, H.L., III; Boles, J.; Delgado, A.; Nguyen, T.; Osugi, D.; Barnum, D.A.; Decker, D.; Steinberg, S.; Steinberg, S.; Keene, C.; et al. Salton Sea Ecosystem Monitoring and Assessment Plan: U.S. Geological Survey Open-File Report 2013-1133. p. 220. Available online: https://pubs.usgs.gov/of/2013/1133/ (accessed on 13 February 2021).
- Assessment, M.E. Ecosystems and Human Well-Being: Wetlands and Water; World Resources Institute: Washington, DC, USA, 2005. [Google Scholar]
- Indoitu, R.; Kozhoridze, G.; Batyrbaeva, M.; Vitkovskaya, I.; Orlovsky, N.; Blumberg, D.; Orlovsky, L. Dust emission and environmental changes in the dried bottom of the Aral Sea. Aeolian Res. 2015, 17, 101–115. [Google Scholar] [CrossRef]
- Sellinger, C.E.; Stow, C.A.; Lamon, E.C.; Qian, S.S. Recent water level declines in the Lake Michigan−Huron System. Environ. Sci. Technol. 2008, 42, 367–373. [Google Scholar] [CrossRef] [PubMed]
- Ramboll Environ, U.S. Corporation. Great Basin Unified Air Pollution Control District: 2016 Owens Valley Planning Area PM10 State Implementation Plan; Great Basin Unified Air Pollution Control District: Bishop, CA, USA, 2016; p. 1494. [Google Scholar]
- Bai, J.; Chen, X.; Yang, L.; Fang, H. Monitoring variations of inland lakes in the arid region of Central Asia. Front. Earth. Sci. 2012, 6, 147–156. [Google Scholar] [CrossRef]
- Senner, N.R.; Moore, J.N.; Seager, S.T.; Dougill, S.; Kreuz, K.; Senner, S.E. A salt lake under stress: Relationships among birds, water levels, and invertebrates at a Great Basin saline lake. Biol. Conserv. 2018, 220, 320–329. [Google Scholar] [CrossRef]
- Wik, M.; Varner, R.K.; Anthony, K.W.; MacIntyre, S.; Bastviken, D. Climate-sensitive northern lakes and ponds are critical components of methane release. Nat. Geosci. 2016, 9, 99–105. [Google Scholar] [CrossRef]
- Kelly-Quinn, M.; Biggs, J.; von Fumetti, S. Preface: The importance of small waterbodies. Hydrobiologia 2017, 793, 1–2. [Google Scholar] [CrossRef]
- Dessie, M.; Verhoest, N.E.; Pauwels, V.R.; Adgo, E.; Deckers, J.; Poesen, J.; Nyssen, J. Water balance of a lake with floodplain buffering: Lake Tana, Blue Nile Basin, Ethiopia. J. Hydrol. 2015, 522, 174–186. [Google Scholar] [CrossRef]
- Li, X.; Yao, J.; Li, Y.; Zhang, Q.; Xu, C.Y. A modeling study of the influences of Yangtze River and local catchment on the development of floods in Poyang Lake, China. Hydrol. Res. 2016, 47, 102–119. [Google Scholar] [CrossRef]
- Ye, X.; Li, X.; Xu, C.Y.; Zhang, Q. Similarity, difference and correlation of meteorological and hydrological drought indices in a humid climate region–the Poyang Lake catchment in China. Hydrol. Res. 2016, 47, 1211–1223. [Google Scholar] [CrossRef]
- Sun, W.C.; Ishidaira, H.; Bastola, S. Towards improving river discharge estimation in ungauged basins: Calibration of rainfall-runoff models based on satellite observations of river flow width at basin outlet. Hydrol. Earth. Syst. Sci. 2010, 14, 2011. [Google Scholar] [CrossRef]
- Temimi, M.; Leconte, R.; Brissette, F.; Chaouch, N. Flood and soil wetness monitoring over the Mackenzie River Basin using AMSR-E 37 GHz brightness temperature. J. Hydrol. 2007, 333, 317–328. [Google Scholar] [CrossRef]
- Habib, M.K.; Baudoin, Y.; Nagata, F. Robotics for rescue and risky intervention. In Proceedings of the IECON 2011: 37th Annual Conference of the IEEE Industrial Electronics Society, Melbourne, Australia, 7–10 November 2011. [Google Scholar]
- Qiao, M.; Zhou, S.B.; Lu, L. Trends in runoff variations of the Ebinur Lake Basin during the last 48 years. J. Soil Water Conserv. 2010, 24, 236–239. (In Chinese) [Google Scholar] [CrossRef]
- Pan, X.L.; Wang, X.C.; Lei, J.Q. Some consideration on evolution and control of ecological environment of arid regions in western china. Adv. Earth Sci. 2001, 1, 24–27. (In Chinese) [Google Scholar] [CrossRef]
- Zarco-Tejada, P.J.; Diaz-Varela, R.; Angileri, V.; Loudjani, P. Tree height quantification using very high resolution imagery acquired from an unmanned aerial vehicle (UAV) and automatic 3D photo-reconstruction methods. Eur. J. Agron. 2014, 55, 89–99. [Google Scholar] [CrossRef]
- Neugirg, F.; Stark, M.; Kaiser, A.; Vlacilova, M.; Della Seta, M.; Vergari, F.; Schmidt, J.; Becht, M.; Haas, F. Erosion processes in calanchi in the Upper Orcia Valley, Southern Tuscany, Italy based on multitemporal high-resolution terrestrial LiDAR and UAV surveys. Geomorphology 2016, 269, 8–22. [Google Scholar] [CrossRef]
- Xie, R. Water Information Technology; Water Resources and Hydropower Press: Beijing, China, 2009. [Google Scholar]
- Hakim, S.S.; Azimi, A.H. Hydraulics of submerged triangular weirs and weirs of finite-crest length with upstream and downstream ramps. J. Irrig. Drain. Eng. 2017, 143, 06017008. [Google Scholar] [CrossRef]
- Riggs, H. A simplified slope-area method for estimating flood discharges in natural channels. J. Res. US Geol. Surv. 1976, 4, 285–291. [Google Scholar]
- Stewart, A.M.; Callegary, J.B.; Smith, C.F.; Gupta, H.V.; Leenhouts, J.M.; Fritzinger, R.A. Use of the continuous slope-area method to estimate runoff in a network of ephemeral channels, southeast Arizona, USA. J. Hydrol. 2012, 472, 148–158. [Google Scholar] [CrossRef]
- Sikder, M.S.; Hossain, F. Understanding the Geophysical Sources of Uncertainty for Satellite Interferometric (SRTM)-Based Discharge Estimation in River Deltas: The Case for Bangladesh. IEEE J. Sel. Top. Appl. Earth Obs. Remote Sens. 2015, 8, 523–538. [Google Scholar] [CrossRef]
- Zhao, C.S.; Zhang, C.B.; Yang, S.T.; Liu, C.M.; Xiang, H.; Sun, Y.; Yang, Z.Y.; Zhang, Y.; Yu, X.Y.; Shao, N.F.; et al. Calculating e-flow using UAV and ground monitoring. J. Hydrol. 2017, 552, 351–365. [Google Scholar] [CrossRef]
- Yang, S.; Wang, P.; Lou, H.; Wang, J.; Zhao, C.; Gong, T. Estimating River Discharges in Ungauged Catchments Using the Slope–Area Method and Unmanned Aerial Vehicle. Water 2019, 11, 2361. [Google Scholar] [CrossRef]
- Yang, S.; Wang, J.; Wang, P.; Gong, T.; Liu, H. Low Altitude Unmanned Aerial Vehicles (UAVs) and Satellite Remote Sensing Are Used to Calculated River Discharge Attenuation Coefficients of Ungauged Catchments in Arid Desert. Water 2019, 11, 2633. [Google Scholar] [CrossRef]
- Huang, Q.; Long, D.; Du, M.; Zeng, C.; Li, X.; Hou, A.; Hong, Y. An improved approach to monitoring Brahmaputra River water levels using retracked altimetry data. Remote Sens. Environ. 2018, 211, 112–128. [Google Scholar] [CrossRef]
- Smith, L.C.; Isacks, B.L.; Bloom, A.L.; Murray, A.B. Estimation of discharge from three braided rivers using synthetic aperture radar satellite imagery: Potential application to ungaged basins. Water Resour. Res. 1996, 32, 2021–2034. [Google Scholar] [CrossRef]
- Birkinshaw, S.J.; Moore, P.; Kilsby, C.G.; O′donnell, G.M.; Hardy, A.J.; Berry, P.A.M. Daily discharge estimation at ungauged river sites using remote sensing. Hydrol. Process. 2014, 28, 1043–1054. [Google Scholar] [CrossRef]
- Sichangi, A.W.; Wang, L.; Yang, K.; Chen, D.; Wang, Z.; Li, X.; Zhou, J.; Liu, W.; Kuria, D. Estimating continental river basin discharges using multiple remote sensing data sets. Remote Sens. Environ. 2016, 179, 36–53. [Google Scholar] [CrossRef]
- Riahi, K.; Rao, S.; Krey, V.; Cho, C.; Chirkov, V.; Fischer, G.; Kindermann, G.; Nakicenovic, N.; Rafaj, P. RCP 8.5-A scenario of comparatively high greenhouse gas emissions. Clim. Chang. 2011, 109, 33–57. [Google Scholar] [CrossRef]
- Wu, C.Y. Study on Bottom Topography of Ebinur Based on Remote Sensing Technology. Master’s Thesis, Xinjiang Normal University, Urumqi, China, 2010. (In Chinese). [Google Scholar]
- Arsen, A.; Crétaux, J.F.; Berge-Nguyen, M.; Del Rio, R.A. Remote sensing-derived bathymetry of lake Poopó. Remote Sens. 2014, 6, 407–420. [Google Scholar] [CrossRef]
- Chipman, J.W. A multisensor approach to satellite monitoring of trends in lake area, water level, and volume. Remote Sens. 2019, 11, 158. [Google Scholar] [CrossRef]
- Lei, Y.; Yao, T.; Yang, K.; Sheng, Y.; Kleinherenbrink, M.; Yi, S.; Bird, B.W.; Zhang, X.; Zhu, L.; Zhang, G. Lake seasonality across the Tibetan Plateau and their varying relationship with regional mass changes and local hydrology. Geophys. Res. Lett. 2017, 44, 892–900. [Google Scholar] [CrossRef]
- Zhu, W.; Yan, J.; Jia, S. Monitoring recent fluctuations of the southern Pool of Lake Chad using multiple remote sensing data: Implications for water balance analysis. Remote Sens. 2017, 9, 1032. [Google Scholar] [CrossRef]
- Zhang, G.; Chen, W.; Xie, H. Tibetan Plateau′s lake level and volume changes from NASA′s ICESat/ICESat-2 and Landsat Missions. Geophys. Res. Lett. 2019, 46, 13107–13118. [Google Scholar] [CrossRef]
- Kite, G.W.; Pietroniro, A. Remote sensing applications in hydrological modelling. Hydrol. Sci. J. 1996, 41, 563–591. [Google Scholar] [CrossRef]
- Alsdorf, D.E.; Lettenmaier, D.P. Tracking fresh water from space. Science 2003, 301, 1491–1494. [Google Scholar] [CrossRef]
- Garambois, P.A.; Monnier, J. Inference of effective river properties from remotely sensed observations of water surface. Adv. Water Resour. 2015, 79, 103–120. [Google Scholar] [CrossRef]
- Kerr, J.M.; Purkis, S. An algorithm for optically-deriving water depth from multispectral imagery in coral reef landscapes in the absence of ground-truth data. Remote Sens. Environ. 2018, 210, 307–324. [Google Scholar] [CrossRef]
- Li, J.; Guo, X.; Gong, T.; Wang, J.; Wang, T.; Li, H. A method estimating natural runoff in regions with none or less data. J. Hydraul. Eng. 2018, 49, 1420–1428. (In Chinese) [Google Scholar] [CrossRef]
- Liu, C.; Men, B.; Song, J. Ecological hydraulic radius method for estimating ecological water demand in river course. Prog. Nat. Sci. 2007, 1, 42–48. (In Chinese) [Google Scholar] [CrossRef]
Publisher’s Note: MDPI stays neutral with regard to jurisdictional claims in published maps and institutional affiliations. |
© 2021 by the authors. Licensee MDPI, Basel, Switzerland. This article is an open access article distributed under the terms and conditions of the Creative Commons Attribution (CC BY) license (http://creativecommons.org/licenses/by/4.0/).

