Article

Capability of IMERG V6 Early, Late, and Final Precipitation Products for Monitoring Extreme Precipitation Events

1
School of Geography and Information Engineering, China University of Geosciences (Wuhan), Wuhan 430074, China
2
School of Environmental Studies, China University of Geosciences (Wuhan), Wuhan 430074, China
3
Wuhan Regional Climate Center, Wuhan 430074, China
*
Author to whom correspondence should be addressed.
Remote Sens. 2021, 13(4), 689; https://doi.org/10.3390/rs13040689
Submission received: 24 December 2020 / Revised: 9 February 2021 / Accepted: 10 February 2021 / Published: 13 February 2021
(This article belongs to the Section Remote Sensing in Geology, Geomorphology and Hydrology)

Abstract

:
The monitoring of extreme precipitation events is an important task in environmental research, but the ability of the Integrated Multi-satellitE Retrievals for Global Precipitation Measurement (IMERG) precipitation products to monitor extreme precipitation events remains poorly understood. In this study, three precipitation products for IMERG version 6, early-, late-, and final-run products (IMERG-E, IMERG-L, and IMERG-F, respectively), were used to capture extreme precipitation, and their applicability to monitor extreme precipitation events over Hubei province in China was evaluated. We found that the accuracy of the three IMERG precipitation products is inconsistent in areas of complex and less complex topography. Compared with gauge-based precipitation data, the results reveal the following: (1) All products can accurately capture the spatiotemporal variation patterns in precipitation during extreme precipitation events. (2) The ability of IMERG-F was good in areas of complex topography, followed by IMERG-E and IMERG-L. In areas of less complex topography, IMERG-E and IMERG-L produced outcomes that were consistent with those of IMERG-F. (3) The three IMERG precipitation products can capture the actual hourly precipitation tendencies of extreme precipitation events. (4) In areas of complex topography, the rainfall intensity estimation ability of IMERG-F is better than those of IMERG-E and IMERG-L.

1. Introduction

Precipitation is one of the most important meteorological variables used for investigations in the hydrological cycle context [1]. The Fifth Assessment Report of the Intergovernmental Panel on Climate Change (IPCC AR5) stated that extreme precipitation events over most mid-latitude land masses are becoming increasingly intense and frequent as the global mean surface temperature increases [2]. Extreme precipitation events can exert considerable social, economic, and environmental impacts. In this context, monitoring extreme precipitation events is of great significance for flood forecasting and disaster mitigation.
Accurate precipitation measurement is a precondition for monitoring extreme precipitation events. How to obtain appropriate precipitation data sources is key due to the rainfall patterns and the characteristics of rainstorms [3]. In the past, extreme precipitation monitoring mainly depended on the rain gauge network, but this network can only directly observe some discrete point precipitation information; its monitoring capability is affected by the density and spatial distribution of the gauge network [4,5,6]. Weather radars can also provide near-real-time precipitation data with continuous changes in time and space. However, the accuracy of weather radars is easily affected by some factors, such as the terrain environment affecting the transmission of radar electronic signals [7,8]. With the rapid development of remote sensing technology and the continuous improvement in satellite-based precipitation retrieval algorithms, satellite precipitation products, with large coverage area and high spatiotemporal resolution, exhibit considerable application potential in extreme precipitation monitoring. The commonly used satellite precipitation products at present include the Tropical Rainfall Measuring Mission (TRMM) Multi-satellite Precipitation Analysis (TMPA) [9]; the Climate Precipitation Center MORPHing technique (CMORPH) [10]; the Precipitation Estimation from Remotely Sensed Information Using Artificial Neural Networks (PERSIANN) [11]; the Global Satellite Mapping of Precipitation (GSMaP) [12]; and the Integrated Multi-satellitE Retrievals for Global Precipitation Measurement (IMERG) [13]. Past studies have shown that these satellite precipitation products have a good correlation with gauge observations on long-term scales, such as monthly, seasonally, and yearly scales [14,15,16,17,18,19,20,21].
As the successor of TRMM, the Global Precipitation Measurement (GPM) mission, which was launched on 27 February 2014, was designed to obtain global satellite precipitation estimates [22]. The newly released IMERG provides global precipitation products at half-hourly and 0.1° spatiotemporal scales, which offers the opportunity for capturing finer local extreme precipitation variations in space and time. The IMERG precipitation products include three modes of runs, near real-time: early-run (IMERG-E) and late-run (IMERG-L), and post-real-time: final-run (IMERG-F) [23]. Current research has also focused on the application of the IMERG precipitation products on long-term scales [8,24,25,26]. The research on extreme precipitation events on short-term scales is scarce. For example, Zhang et al. [27] merely evaluated the performance of IMERG-F version 5 during an extreme precipitation storm over Southern China and found that IMERG-F V5 could capture the trend in hourly area-averaged precipitation. However, the capability of IMERG-E and IMERG-L to monitor extreme precipitation and the performance of the three precipitation products in the extreme precipitation events remain poorly understood. IMERG version 6 (V6) was released on 13 March, 2019 [17,28]. To the best of our knowledge, few studies have evaluated the performance of IMERG V6 in extreme precipitation events, and a systematic and comprehensive evaluation has not yet been conducted. Therefore, an updated evaluation of the IMERG V6 is required to determine its applicability to monitor extreme precipitation.
The province of Hubei, which is the center of the Central China economic zone, has suffered from serious flood disasters. Estimating extreme precipitation based on high-spatiotemporal-resolution satellite precipitation products is crucial because of the limited number of rain gauge stations in Hubei province. In this study, we evaluated the ability to use the IMERG V6 early, late, and final precipitation products for monitoring extreme precipitation events by applying three statistical (Pearson correlation coefficient, root mean square error, and relative bias) and three categorical (probability of detection, false alarm ratio, and critical success index) metrics (introduced in detail in Section 2.3). The capability of the three IMERG precipitation products to estimate variation patterns in extreme precipitation was assessed using the spatiotemporal level, statistical metrics, and precipitation detection capability (Section 3). Additionally, the influence of topography and extreme rainfall indexes on IMERG precipitation products in extreme precipitation events were discussed (Section 4).

2. Materials and Methods

2.1. Study Areas

Hubei province is located in Central China at 29°05′–33°20′N and 108°21′–116°07′E, with a total area of 18.59 × 10⁴ km2. The average annual precipitation is 800–1600 mm/year, which decreases from southeast to northwest over the entire province. The precipitation exhibits apparent seasonal changes and is mainly concentrated in summer, especially in the main rainy season (mid-June to mid-July). Our analysis focused on precipitation comparisons in four cities in Hubei province: Enshi, Jingzhou, Shiyan, and Wuhan, from which four extreme precipitation events of different time series (Events 1, 2, 3, and 4) were selected. Figure 1 shows a map of these regions, and Table 1 presents an overview of each region’s basic characteristics, timing of the events, and the number of rain gauge stations.

2.2. Datasets

2.2.1. Gauge-Based Precipitation Data

The meteorological department built a high-density rain gauge observation network in Hubei province. The hourly precipitation data from four periods (Table 1) measured at 2224 rain gauge stations over Hubei province were used as the reference data in this study (Figure 1). The historical data of the daily datasets were collected from 736 separate rain gauge stations (260 stations in Enshi, 114 stations in Jingzhou, 260 stations in Shiyan, and 102 stations in Wuhan) operated by Wuhan Regional Climate Center and National Meteorological Information Center of the China Meteorological Administration. Gauge-based precipitation data underwent strict quality control following relevant Chinese industry standards before being published [18]. The quality control of gauge-based precipitation data included format check, missing data check, range check, main change range check, internal consistency check, temporal consistency check, spatial consistency check, quality control analysis, and data quality identification [29]. We performed a quantitative evaluation by comparing IMERG pixels with the corresponding rain gauge observation data. Based on rain gauge observation data, an inverse distance weighting (IDW) method was used for spatial interpolation, and a ground precipitation field (1 h and 0.1° × 0.1°) was generated to evaluate the qualitative accuracy of the three IMERG precipitation products.

2.2.2. Satellite Precipitation Products

IMERG is the Level 3 multi-satellite precipitation algorithm of GPM, which combines all available constellation microwave precipitation estimates, infrared satellite estimates, and monthly gauge precipitation data, with the intention of creating a new generation of global precipitation products [22]. More detailed descriptions of the IMERG precipitation products and the precipitation retrieval algorithm can be found in Tan et al. [30]. IMERG precipitation products include three types of products: early run (IMERG-E, ~4 h after observation time), late run (IMERG-L, ~14 h after observation time), and final run (IMERG-F, ~3.5 months after observation time). IMERG-E and IMERG-L are near-real-time precipitation products, and the IMERG-F represent a post-real-time precipitation product that combines the Global Precipitation Climatology Center (GPCC) gauge data [31].
Nowadays, the IMERG precipitation products have been upgraded from version 5 (V5) to version 6 (V6) by reducing biases based on the new GPCC monthly precipitation records. For example, the displacement vectors in V6 are computed using the Modern Era Retrospective Reanalysis 2 (MERRA-2) and Goddard Earth observing system (GEOS) model forward processing data instead of the previously used infrared data, which helps ensure consistency in the vectors between the IMERG-F and the IMERG-E and IMERG-L [26]. The generation times of IMERG precipitation products and gauge-based precipitation data are all universal time coordinated (UTC). In order to make their temporal resolution the same (IMERG is half-hourly data and gauge-based is hourly data), IMERG precipitation products need to be processed into hourly products before being evaluated. In addition, we also evaluated the daily performance of IMERG precipitation products in extreme precipitation events by comparing the accumulated IMERG and gauge-based daily precipitation data on a daily scale.

2.3. Methods

Three commonly used statistical metrics are adopted to evaluate the performance of IMERG-E, IMERG-L, and IMERG-F in these four different extreme precipitation events (Table 1). Three categorical metrics can be further used to evaluate their capability to estimate different precipitation intensities. Simple descriptions of the six metrics are provided below.

2.3.1. Statistical Metrics

Three statistical metrics used in this work are as follows [32,33]: the Pearson correlation coefficient (CC) describes the agreement between IMERG precipitation estimates and gauge observations (Equation (1)); the root mean square error (RMSE) reflects the average absolute error of IMERG precipitation estimates (Equation (2)), and the relative bias (BIAS) represents the systematic bias of IMERG precipitation estimates (Equation (3)). A positive BIAS indicates an overestimation of IMERG precipitation, whereas a negative value implies an underestimation. The closer the CC value to 1 and the closer the RMSE and BIAS values to 0, the better the IMERG precipitation products performance [34].
CC = i = 1 n ( x i x ¯ ) ( y i y ¯ ) i = 1 n ( x i x ¯ ) 2 i = 1 n ( y i y ¯ ) 2 ,
RMSE = i = 1 n ( x i y i ) 2 n ,
BIAS = i = 1 n ( x i y i ) i = 1 n y i × 100 % ,
where n is the total number of ground stations, xi represents the numerical value of the IMERG precipitation products at station i, yi represents the numerical value of the gauge-based precipitation data at station i, x represents the mean value of the IMERG precipitation products at all stations, and y represents the mean value of the gauge-based precipitation data at all stations.

2.3.2. Categorical Metrics

Three categorical metrics used in this work are as follows [35,36,37]: the probability of detection (POD) denotes the proportion of the actual precipitation intensity levels correctly detected by IMERG precipitation products (Equation (4)); the false alarm ratio (FAR) reflects the ratio of the actual precipitation intensity levels falsely detected by IMERG precipitation products (Equation (5)), and the critical success index (CSI) describes the overall proportion of the actual precipitation intensity levels correctly detected by IMERG precipitation products (Equation (6)). These metrics are widely used to quantify the capacity of satellite precipitation products to detect precipitation events or precipitation intensity levels [14,15,34].
POD = H H + M ,
FAR = F H + F ,
CSI = H H + F + M ,
where H and F represent the number of actual precipitation intensity levels correctly and falsely detected by IMERG precipitation products respectively, and M refers to the number of precipitation intensity levels observed by ground stations rather than by IMERG precipitation products. Several scholars have classified precipitation intensity level intervals using daily precipitation: 0.1–9.9 mm/day as light rain, 10.0–24.9 mm/day as moderate rain, 25.0–49.9 mm/day as heavy rain, and >50.0 mm/day as rainstorm [38]. In this study, four threshold intervals (i.e., 0.1–9.9, 10.0–24.9, 25.0–49.9, and >50.0 mm/day) were used as different precipitation levels. Table 2 shows the definition of the hit (H), false (F), and missed (M) for different precipitation thresholds observed by gauge-based precipitation data and IMERG precipitation products.

3. Results

In this section, results of the performance of IMERG-E, IMERG-L, and IMERG-F against the gauge-based precipitation data are presented. We evaluate the effectiveness of the three IMERG precipitation products to monitor extreme precipitation events over Hubei province at the hourly and daily time scales. Specifically, this section sought to evaluate the ability of the three IMERG precipitation products to (1) estimate the spatial distribution of precipitation on the daily scale and the temporal variation of precipitation on the hourly scale in extreme precipitation events and (2) detect different precipitation intensity levels.

3.1. Spatial and Temporal Assessments

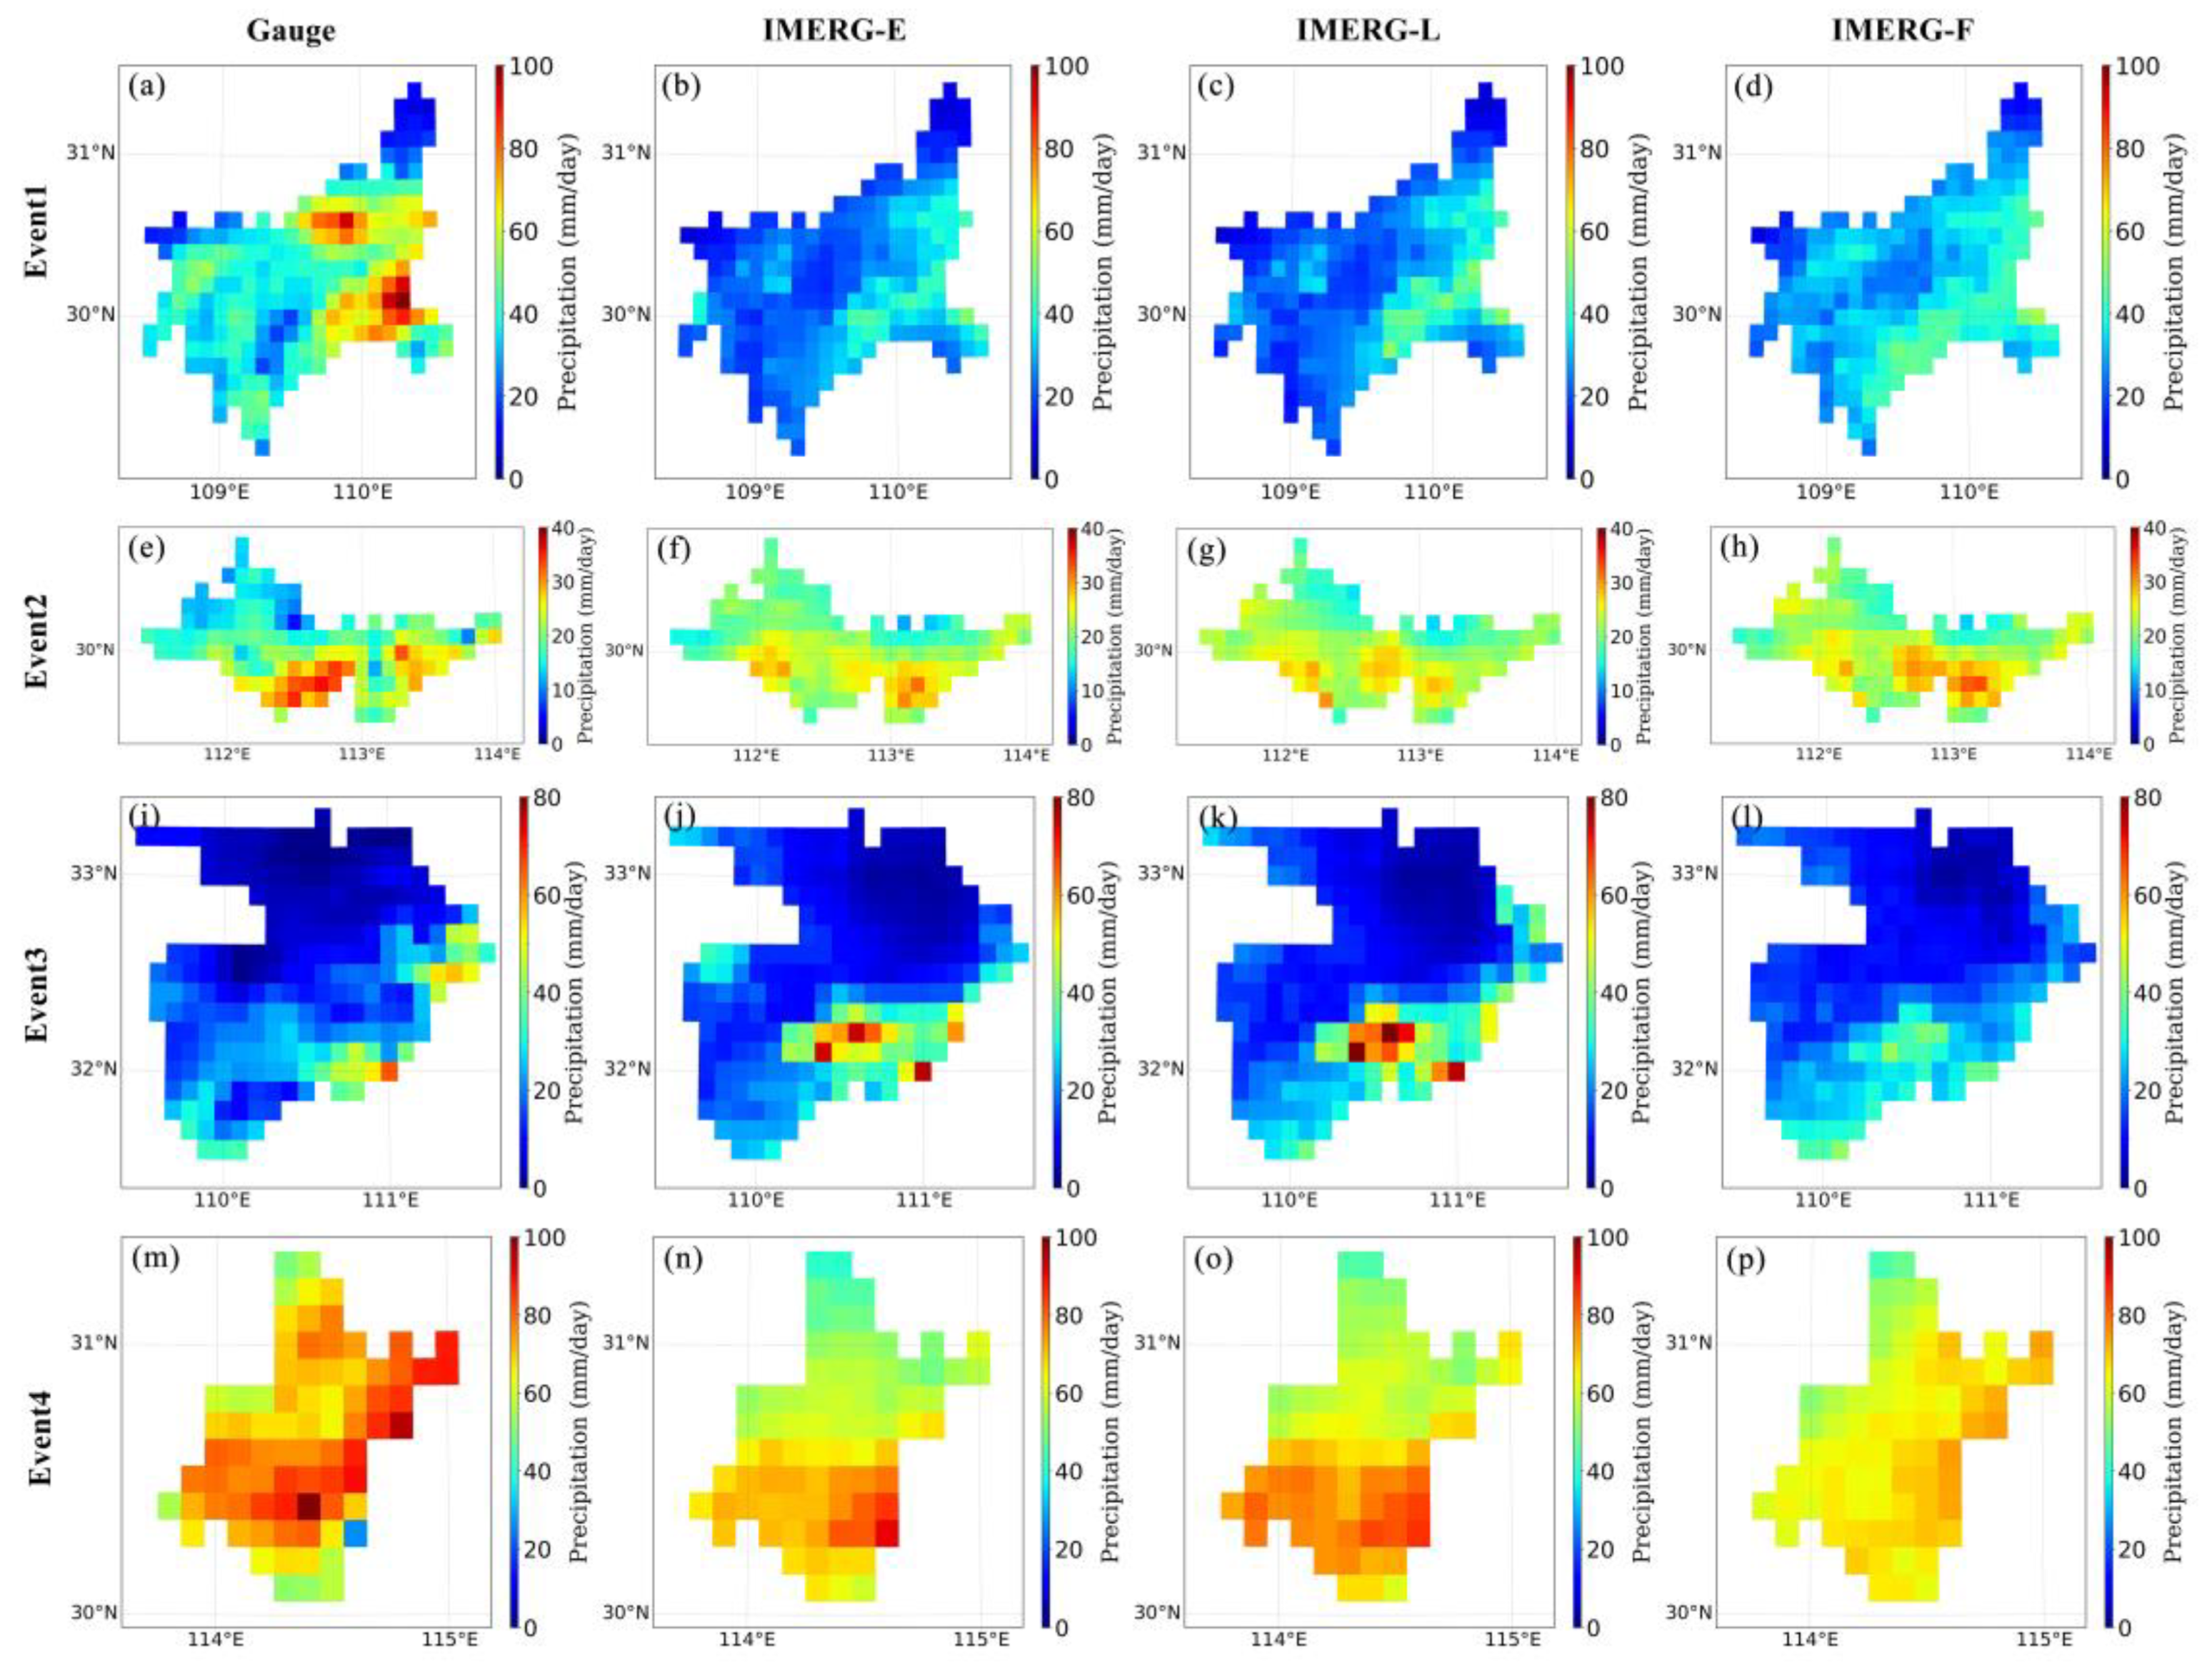
In Event 1, the spatial distribution of mean daily precipitation for gauge-based precipitation data (Figure 2a) showed that precipitation was mainly centered on Southeastern Enshi. These three IMERG precipitation products all captured the precipitation center, but they presented significant underestimation in Enshi, especially IMERG-E and IMERG-L (Figure 2b–d). Similarly, in Event 3, IMERG-F (Figure 2l) was the closest to the gauge-based precipitation data (Figure 2i), while IMERG-E and IMERG-L (Figure 2j,k) significantly overestimated mean daily precipitation in the Southeastern Shiyan. In Events 2 and 4, the performance of these three IMERG precipitation products to estimate mean daily precipitation was consistent, and they all exhibited moderate underestimation in most areas of events 2 and 4 (Figure 2f–h,n–p). Figure 2p shows that IMERG-F performed poorly in event 4. Furthermore, a temporal assessment was conducted based on the average hourly precipitation in the four events separately.
In Event 1, in accordance with the statistics from the Disaster Department, we found that precipitation was mainly concentrated in Southeastern Enshi city (Figure 2a), where Hefeng and Jianshi counties are located (Table 1). On the hourly scale, three IMERG precipitation products showed the same temporal variation patterns as gauge-based precipitation data and consistent occurrence time of precipitation peaks and valleys. We determined a heavy rainfall period (between 23:00 on 18 July and 12:00 on 19 July) in Event 1 (Figure 3a) based on gauge-based precipitation data. IMERG-E and IMERG-L underestimated precipitation compared with the gauge-based precipitation data during this heavy rainfall period. In contrast, IMERG-F was almost consistent with the gauge-based precipitation data. Meanwhile, the performance of IMERG-F is slightly better than that of IMERG-E and IMERG-F during this heavy rainfall period, as shown in Figure 3b,c.
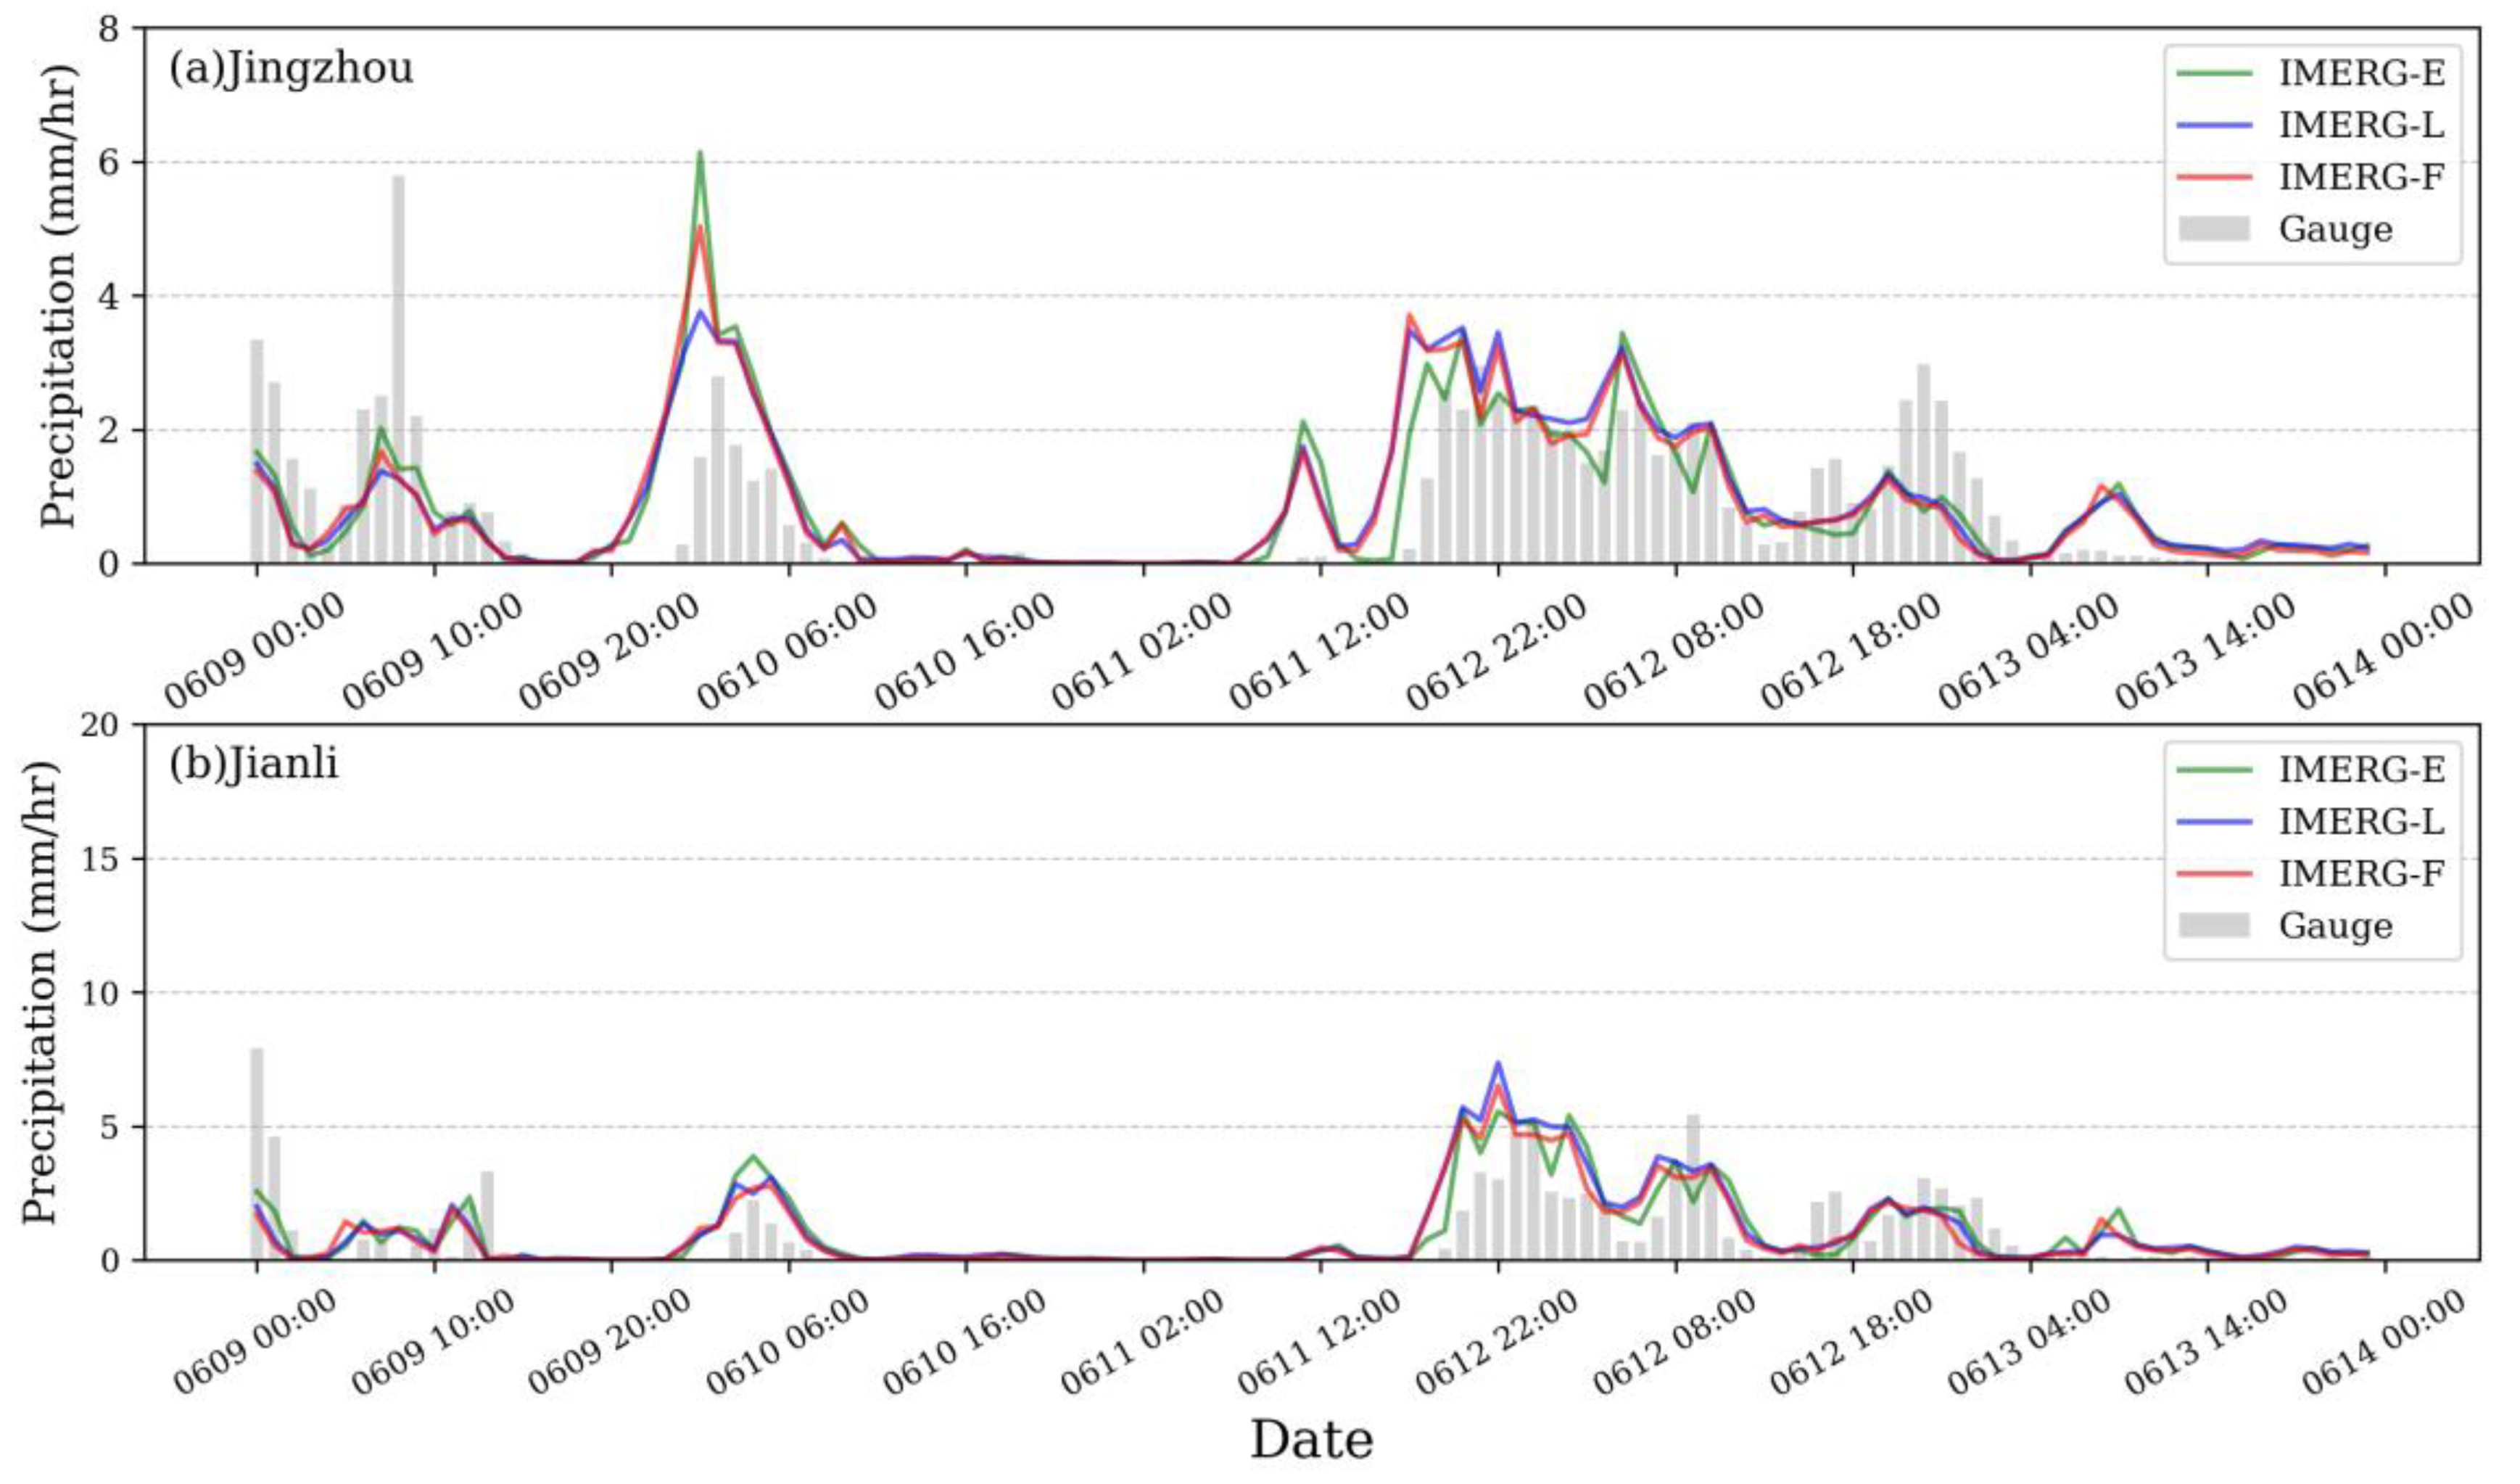
In Event 2, according to the statistics from the Disaster Department, we found that precipitation was mainly concentrated in Jianli county (Table 1), in the south of Jingzhou city (Figure 2e). Three IMERG precipitation products displayed the same variation patterns as the gauge-based precipitation data in both regions and had a consistent occurrence time of precipitation peaks and valleys (Figure 4a,b), which indicated that IMERG-E and IMERG-L produced no significant difference compared with IMERG-F over Jingzhou.
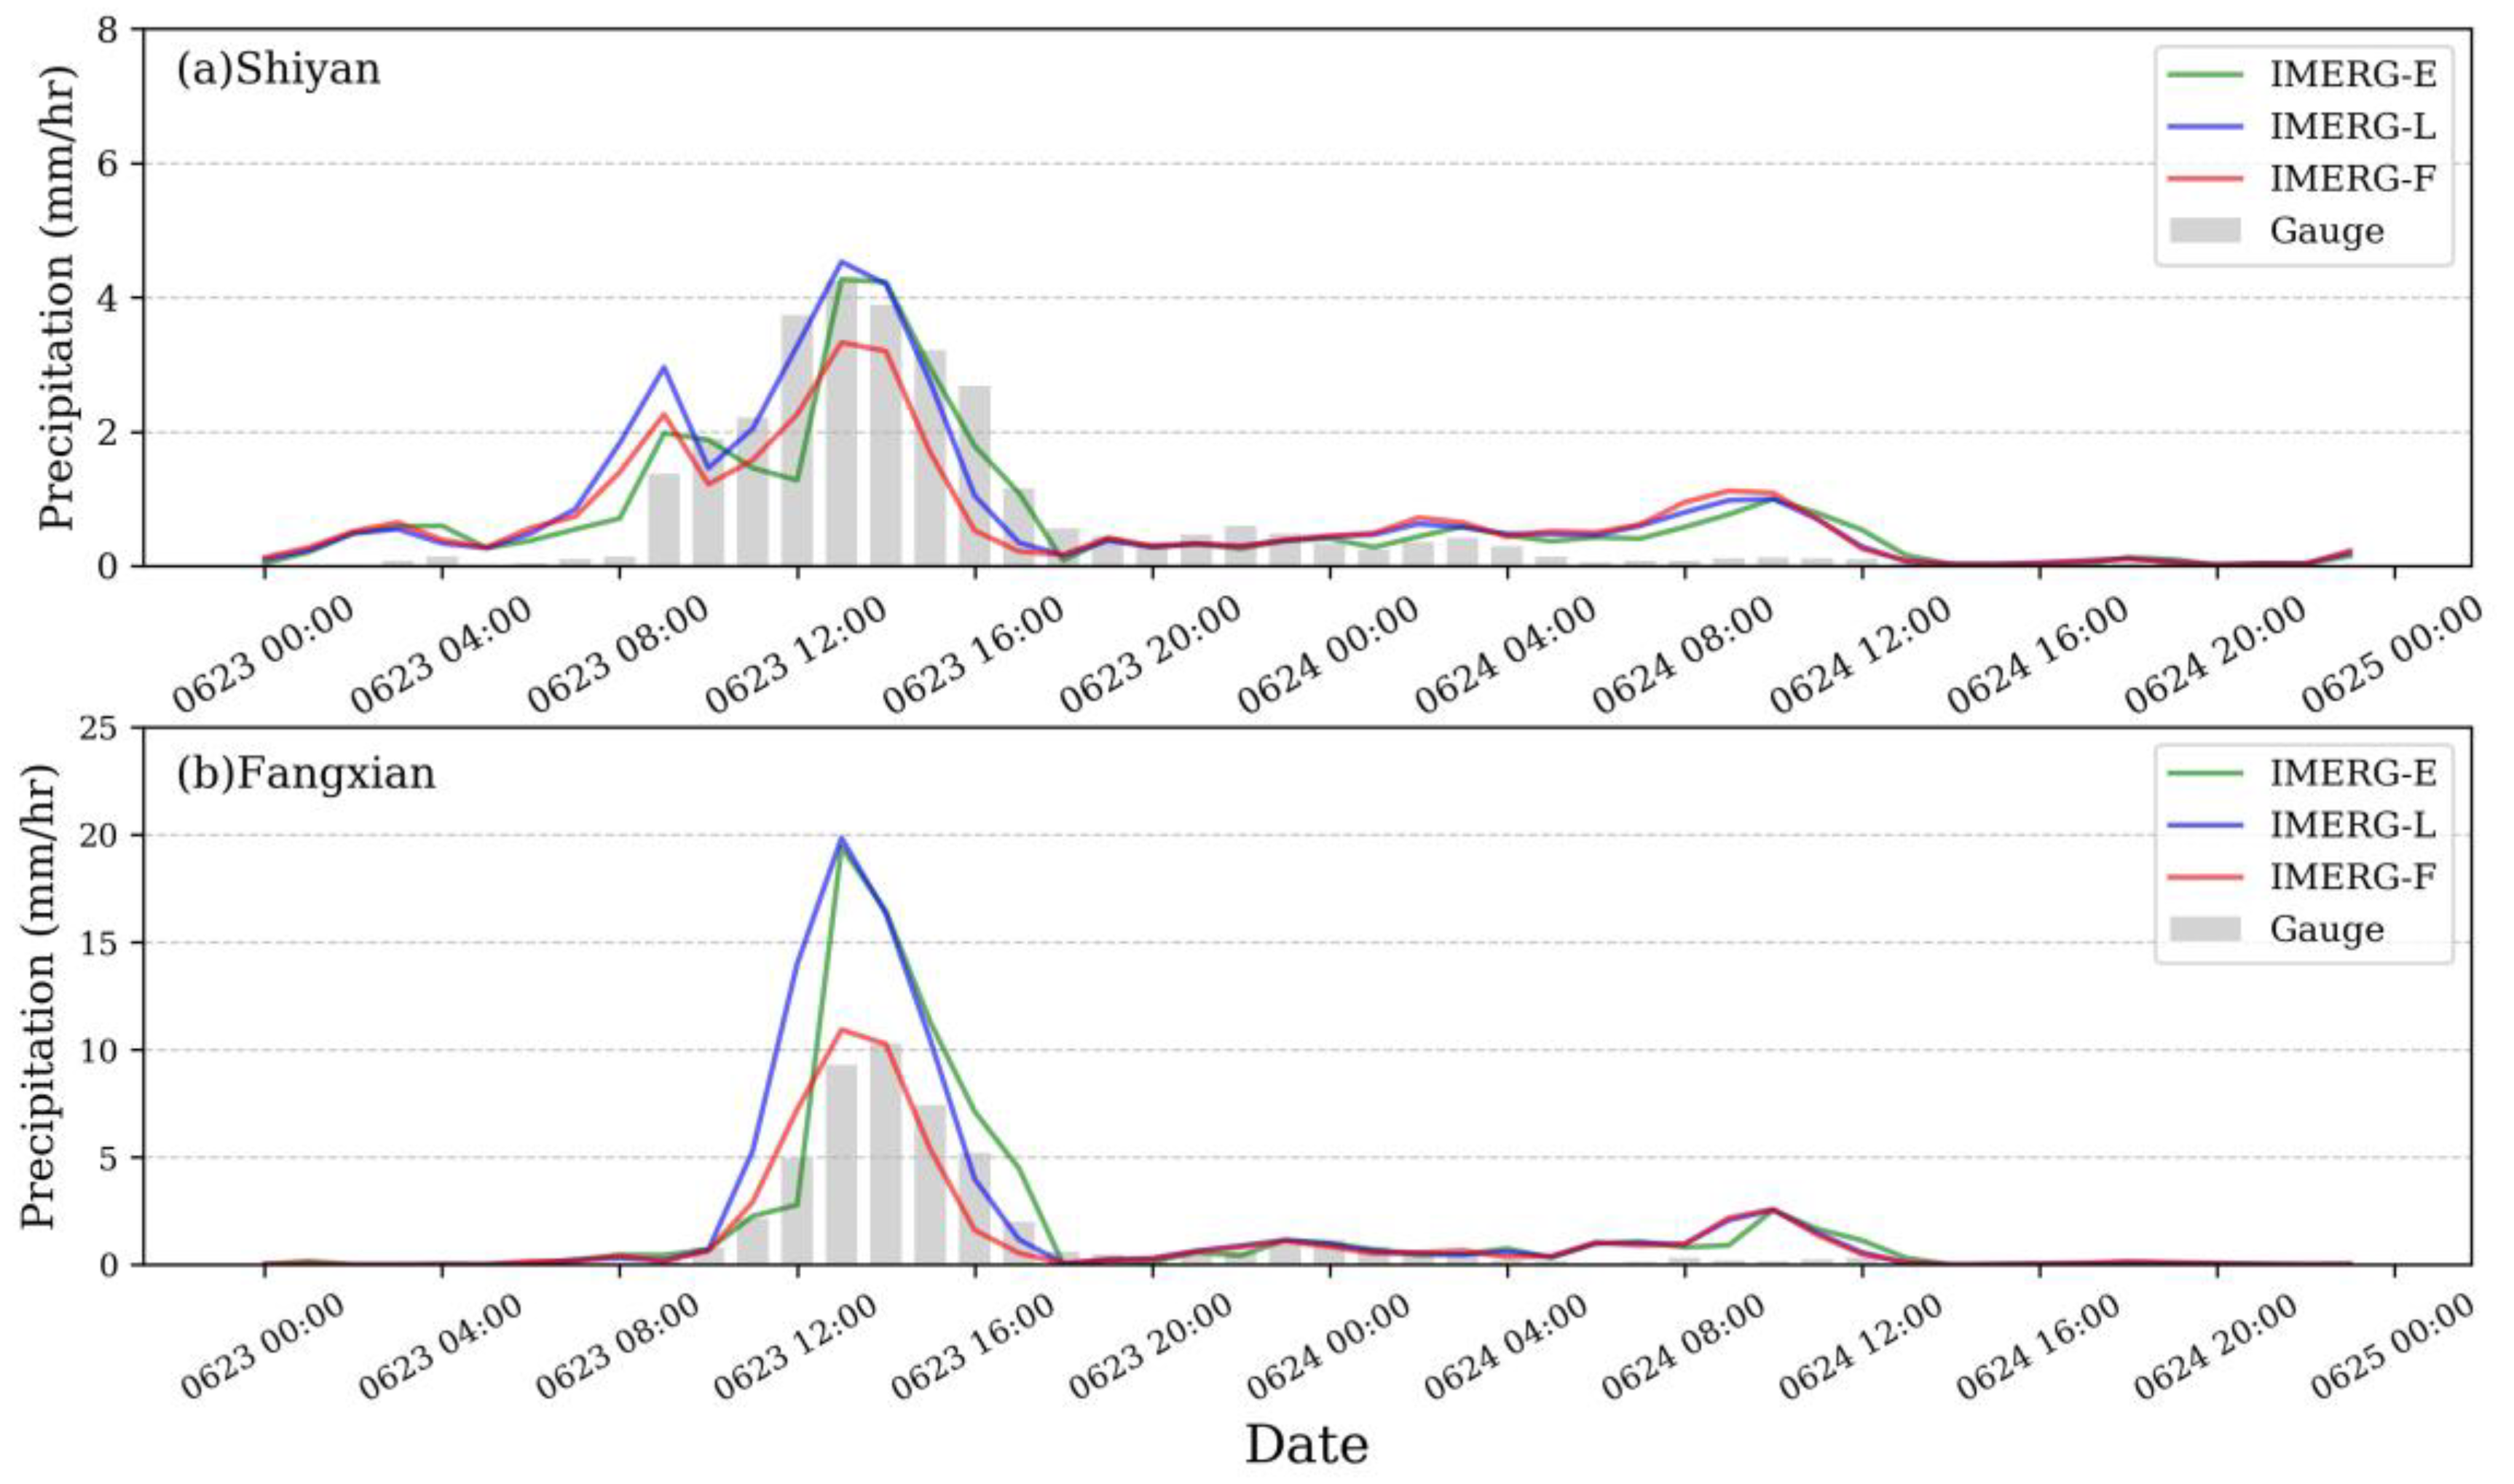
In Event 3, in accordance with the statistics from the Disaster Department, we found that precipitation was mainly concentrated in Southeastern Shiyan city (Figure 2i), where Fangxian county is located (Table 1). Figure 5a shows that three IMERG precipitation products had similar variation patterns as the gauge-based precipitation data in Shiyan, and the occurrence time of precipitation peaks and valleys was in agreement. For a heavy rainfall period between 11:00 a.m. and 4:00 p.m. on 23 June, IMERG-F was almost consistent with the gauge-based precipitation data (Figure 5b). However, IMERG-E and IMERG-L produced obvious overestimation compared with the gauge-based precipitation data, which indicated that IMERG-F accurately estimated hourly precipitation of the precipitation center more than them.
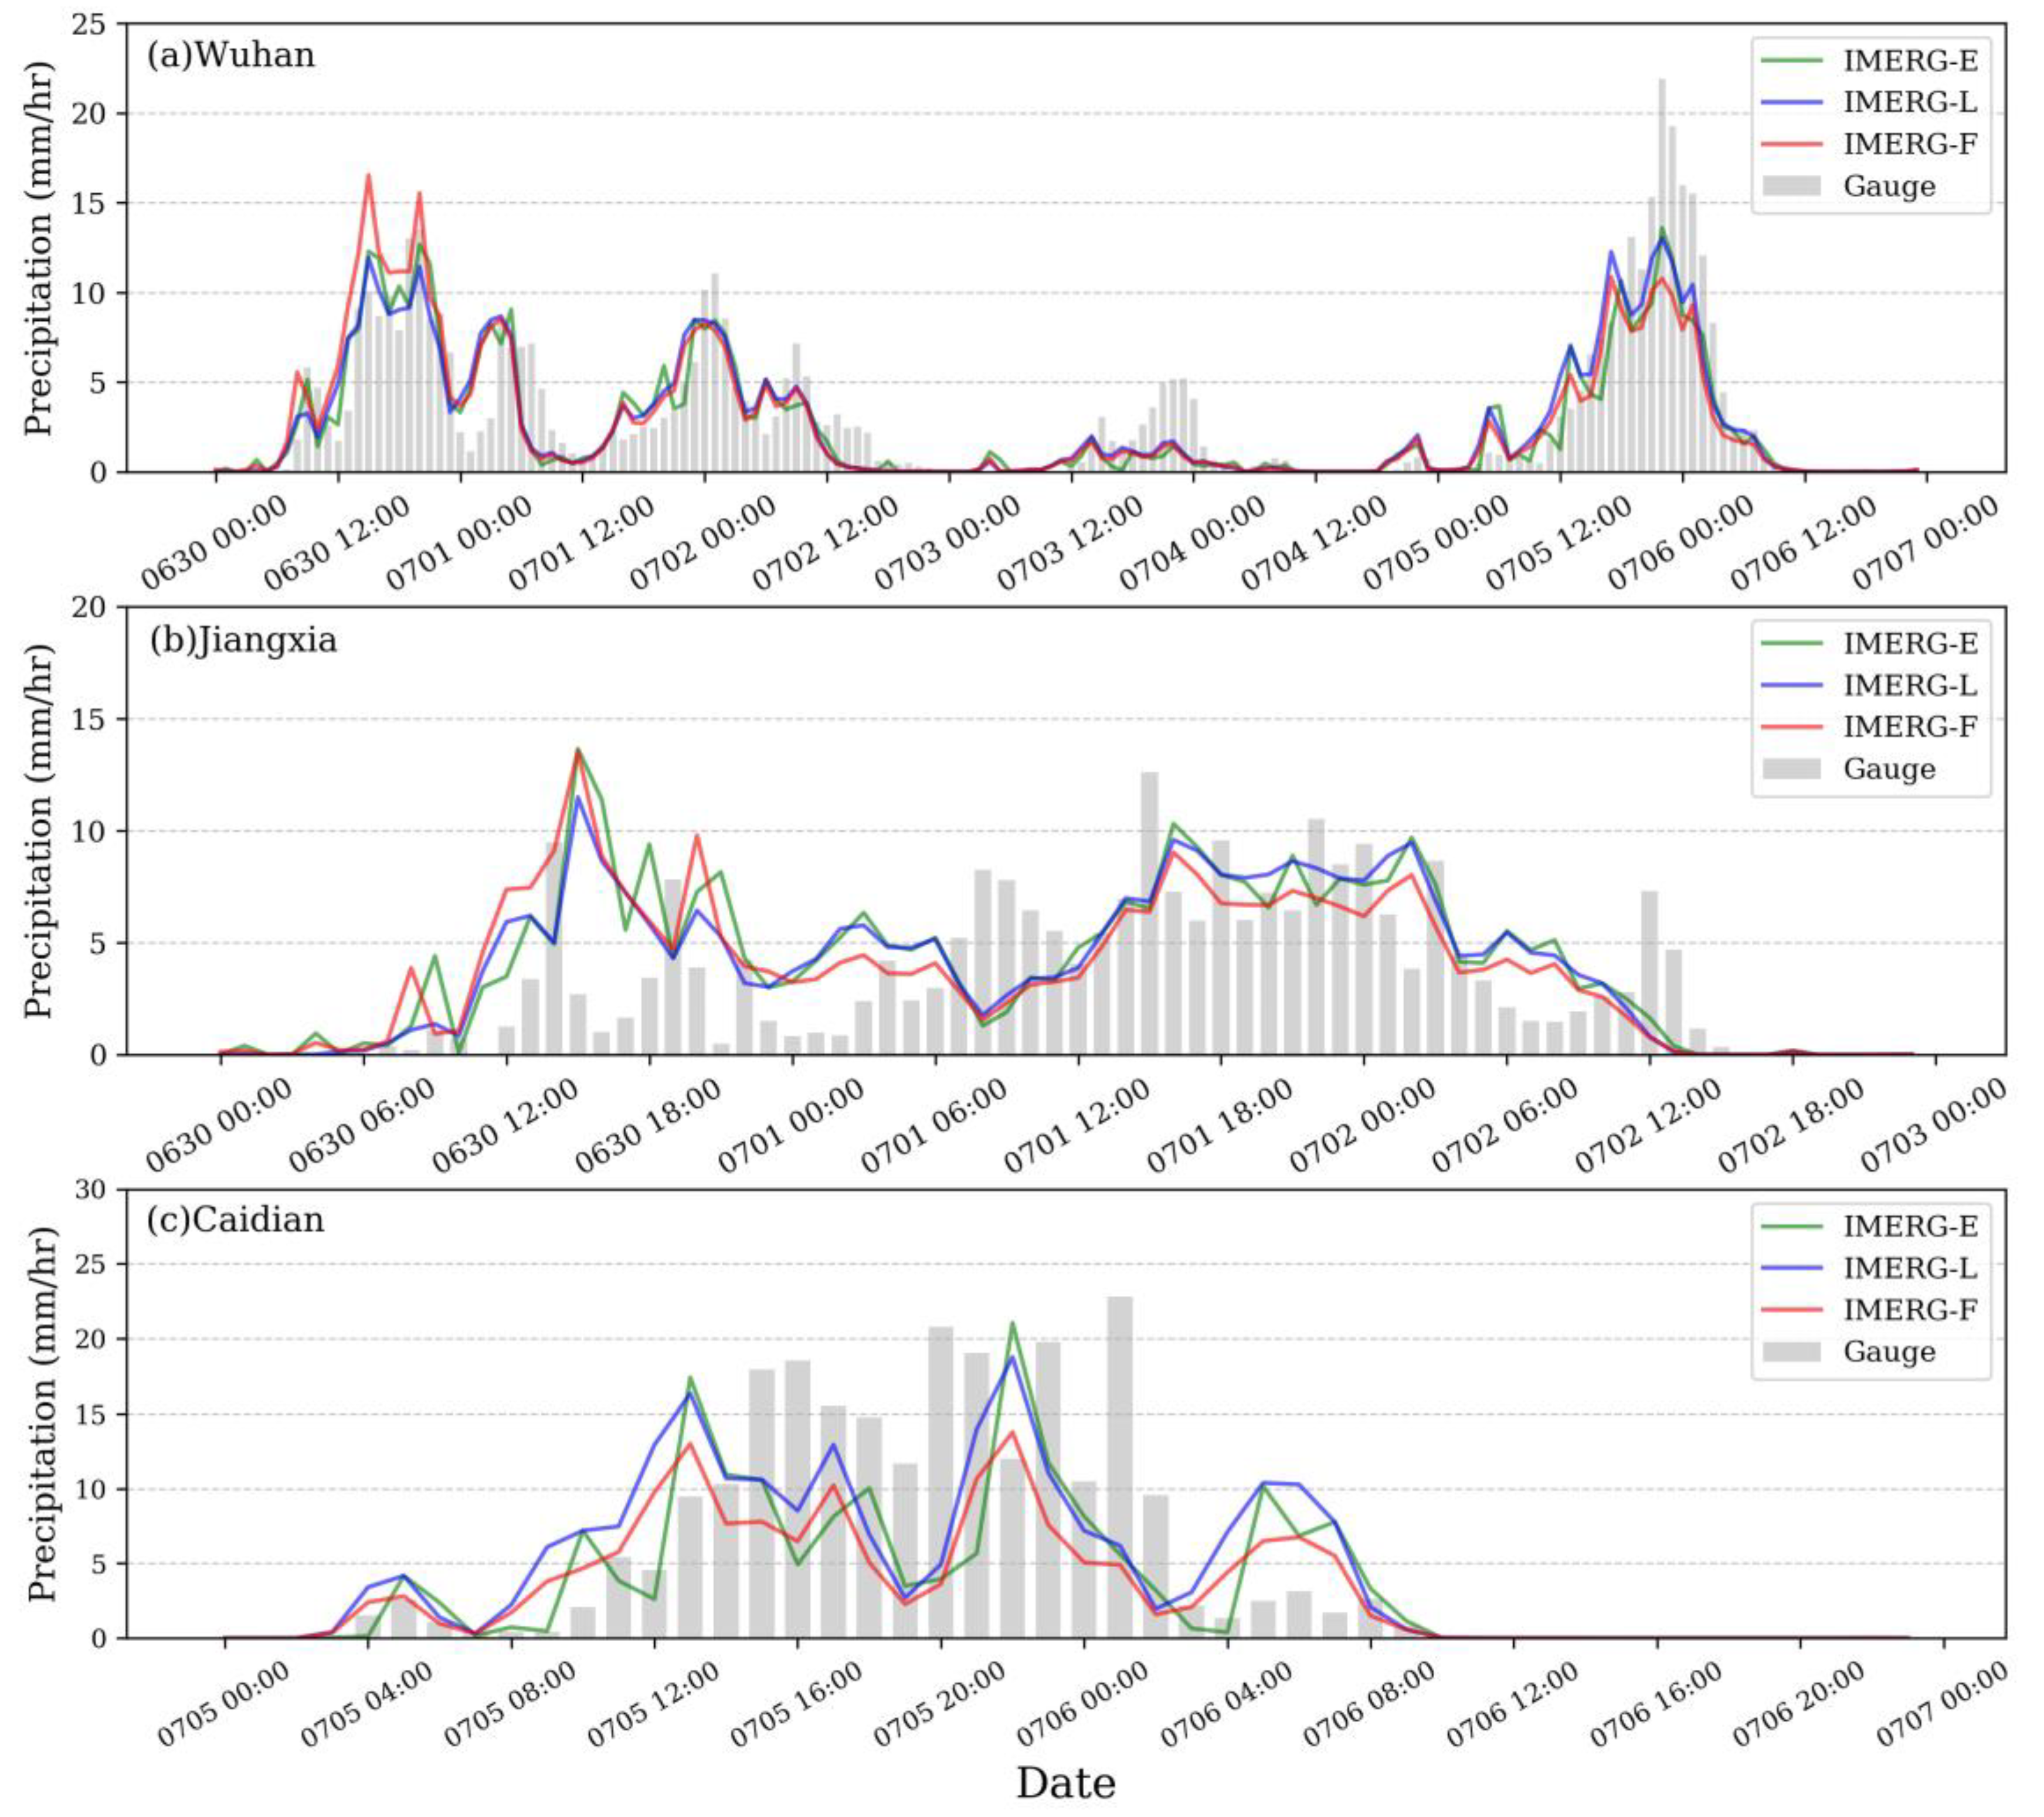
In Event 4, in accordance with the statistics from the Disaster Department, we found that between 30 June and 2 July 2016, heavy rainfall was mainly concentrated in Southern Wuhan city, in Jiangxia county (Table 1). Between 5 and 6 July 2016, heavy rainfall was mainly concentrated in the southwest of Wuhan city, in Caidian county (Table 1). Figure 6a–c shows the average hourly precipitation in Wuhan, Jiangxia, and Caidian in Event 4. As indicated in Figure 6a, three IMERG precipitation products displayed similar variation patterns as the gauge-based precipitation data in Wuhan. They also captured the rainfall variation patterns during two heavy rainfall periods (Figure 6b, c) in Event 4. However, in Caidian (between 15:00 p.m. on 5 July and 2:00 a.m. on 6 July), three IMERG precipitation products were significantly underestimated hourly precipitation compared with gauge-based precipitation data, especially IMERG-F.
By analyzing the spatial distribution of precipitation on the daily scale and the temporal variation of precipitation on the hourly scale in four extreme precipitation events, we found that the accuracy of IMERG-E, IMERG-L, and IMERG-F was basically the same in Jingzhou and Wuhan, while IMERG-F performed better than IMERG-E and IMERG-L in Enshi and Shiyan.

3.2. Statistical Assessments

In this section, we evaluated the three IMERG precipitation products against gridded gauge-based precipitation products on the hourly and daily scales in four different extreme precipitation events. In order to ensure a more accurate comparison, only grid pixels with gauge stations were taken to calculate the statistical metrics.
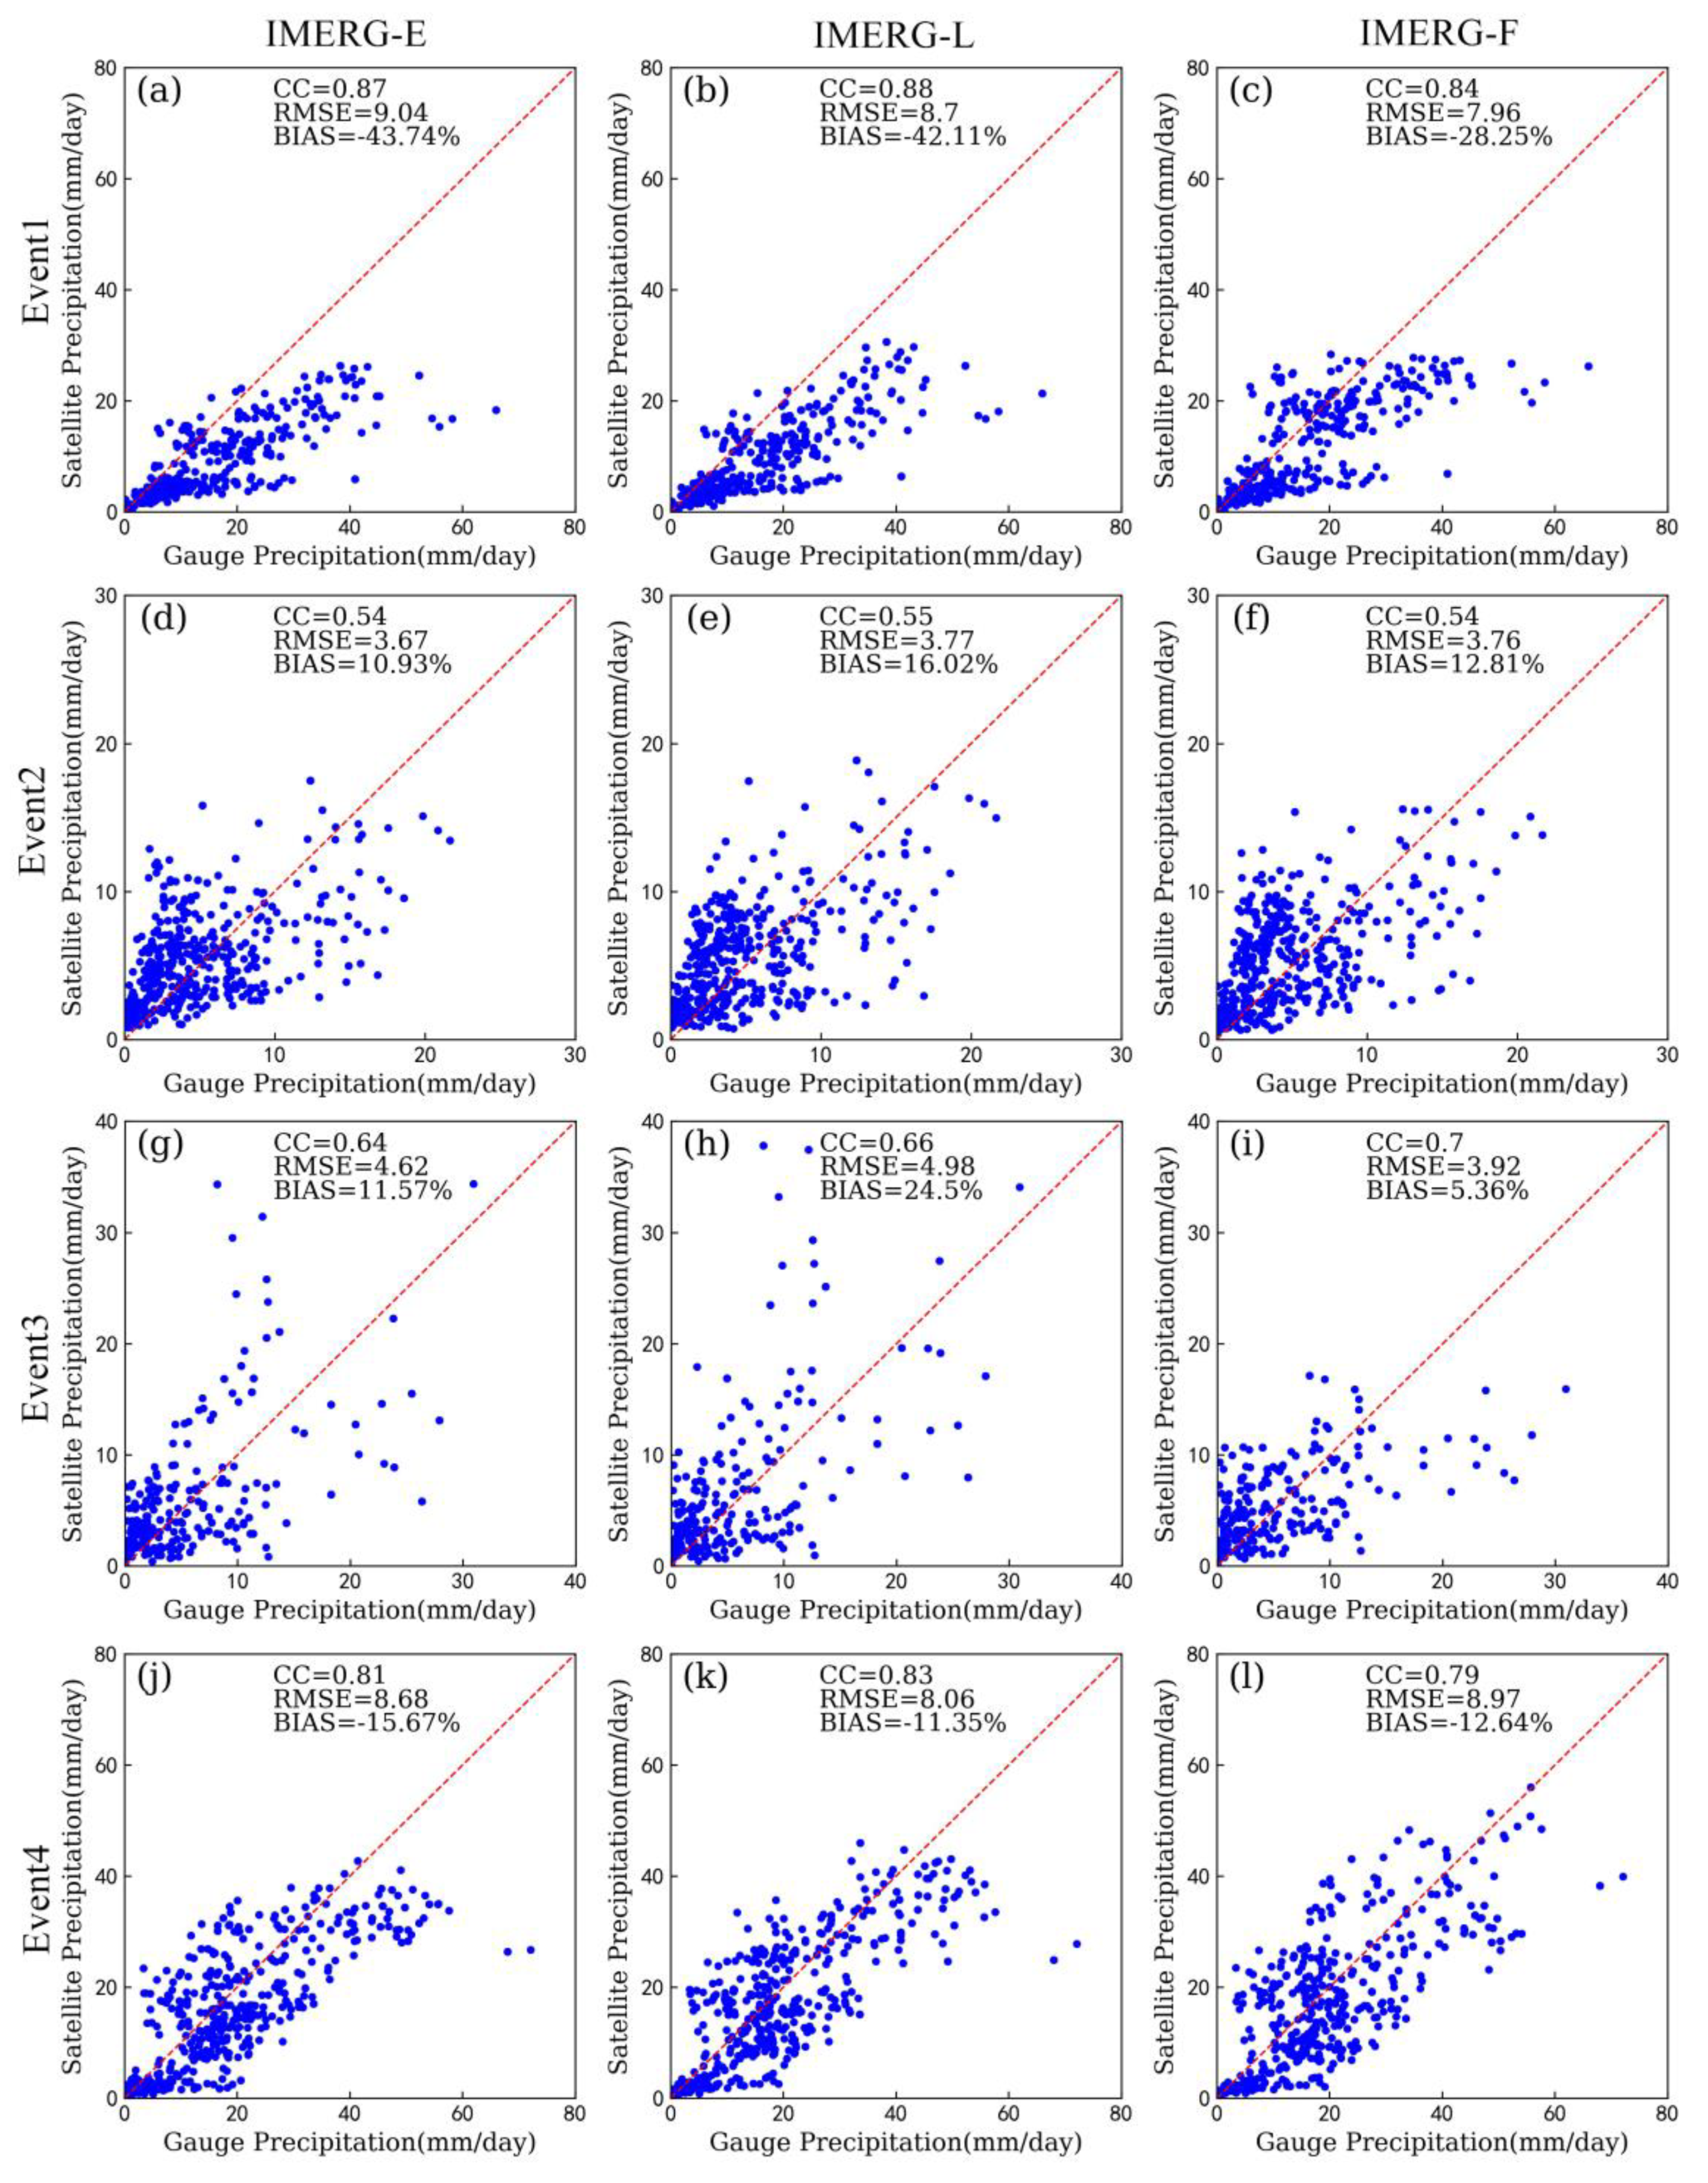
As shown in Figure 7a–c, the CC and RMSE values of three IMERG precipitation products were similar on the daily scale in Event 1. IMERG-E, IMERG-L, and IMERG-F had relatively high CC (0.84, 0.88, and 0.87, respectively). Concerning BIAS, IMERG-E, IMERG-L, and IMERG-F displayed a consistent result, that is, they had negative BIAS values (−43.74%, −42.11%, and −28.25%, respectively), and considerably underestimated precipitation, but IMERG-F had a higher value than the others. Event 3 (Figure 7g–i) had comparable results to those of Event 1. In general, IMERG-F had a relatively higher CC (0.70) than IMERG-E and IMERG-L (0.64 and 0.66, respectively) and relatively lower RMSE and BIAS (15.67 mm and 5.36%, respectively) than those of IMERG-E and IMERG-L (18.48 mm, 19.91 mm; 11.57%, 24.50%, respectively).
Events 2 and 4 produced inconsistent results compared with Events 1 and 3. As indicated in Event 2 (Figure 7d–f), IMERG-E, IMERG-L, and IMERG-F had nearly the same CC (0.54, 0.54, and 0.55, respectively) and RMSE (14.68, 15.02, and 15.07 mm, respectively) and low BIAS (10.93%, 12.81%, and 16.02%, respectively). Likewise, in Event 4 (Figure 7j–l), the CC, RMSE, and BIAS values of three IMERG precipitation products were close. However, IMERG-F exhibited poor performance with the lowest CC (0.79) and highest RMSE (35.86 mm) compared with IMERG-E and IMERG-L. Overall, the performance of the three IMERG precipitation products was similar in Events 2 and 4, even IMERG-F was relatively worse than IMERG-E and IMERG-L. To identify the different results in each region, we evaluated the statistical metrics of hourly precipitation, including every event’s precipitation centers, in the four specific events.
To quantitatively evaluate statistical metrics on the hourly scale in Event 1, CC, RMSE, and BIAS were calculated from the three IMERG precipitation products, as shown in Figure 8 and Table 3. The three IMERG precipitation products considerably underestimated precipitation with the BIAS ranged from −28.25% in IMERG-F to −51.19% in IMERG-E. In comparison, IMERG-F performed better in terms of BIAS compared with IMERG-E and IMERG-L in three regions. As for the CC and RMSE, the three IMERG precipitation products had nearly the same results. The performance of the IMERG precipitation products was less satisfactory on the hourly scale, which was different from that on the daily scale.
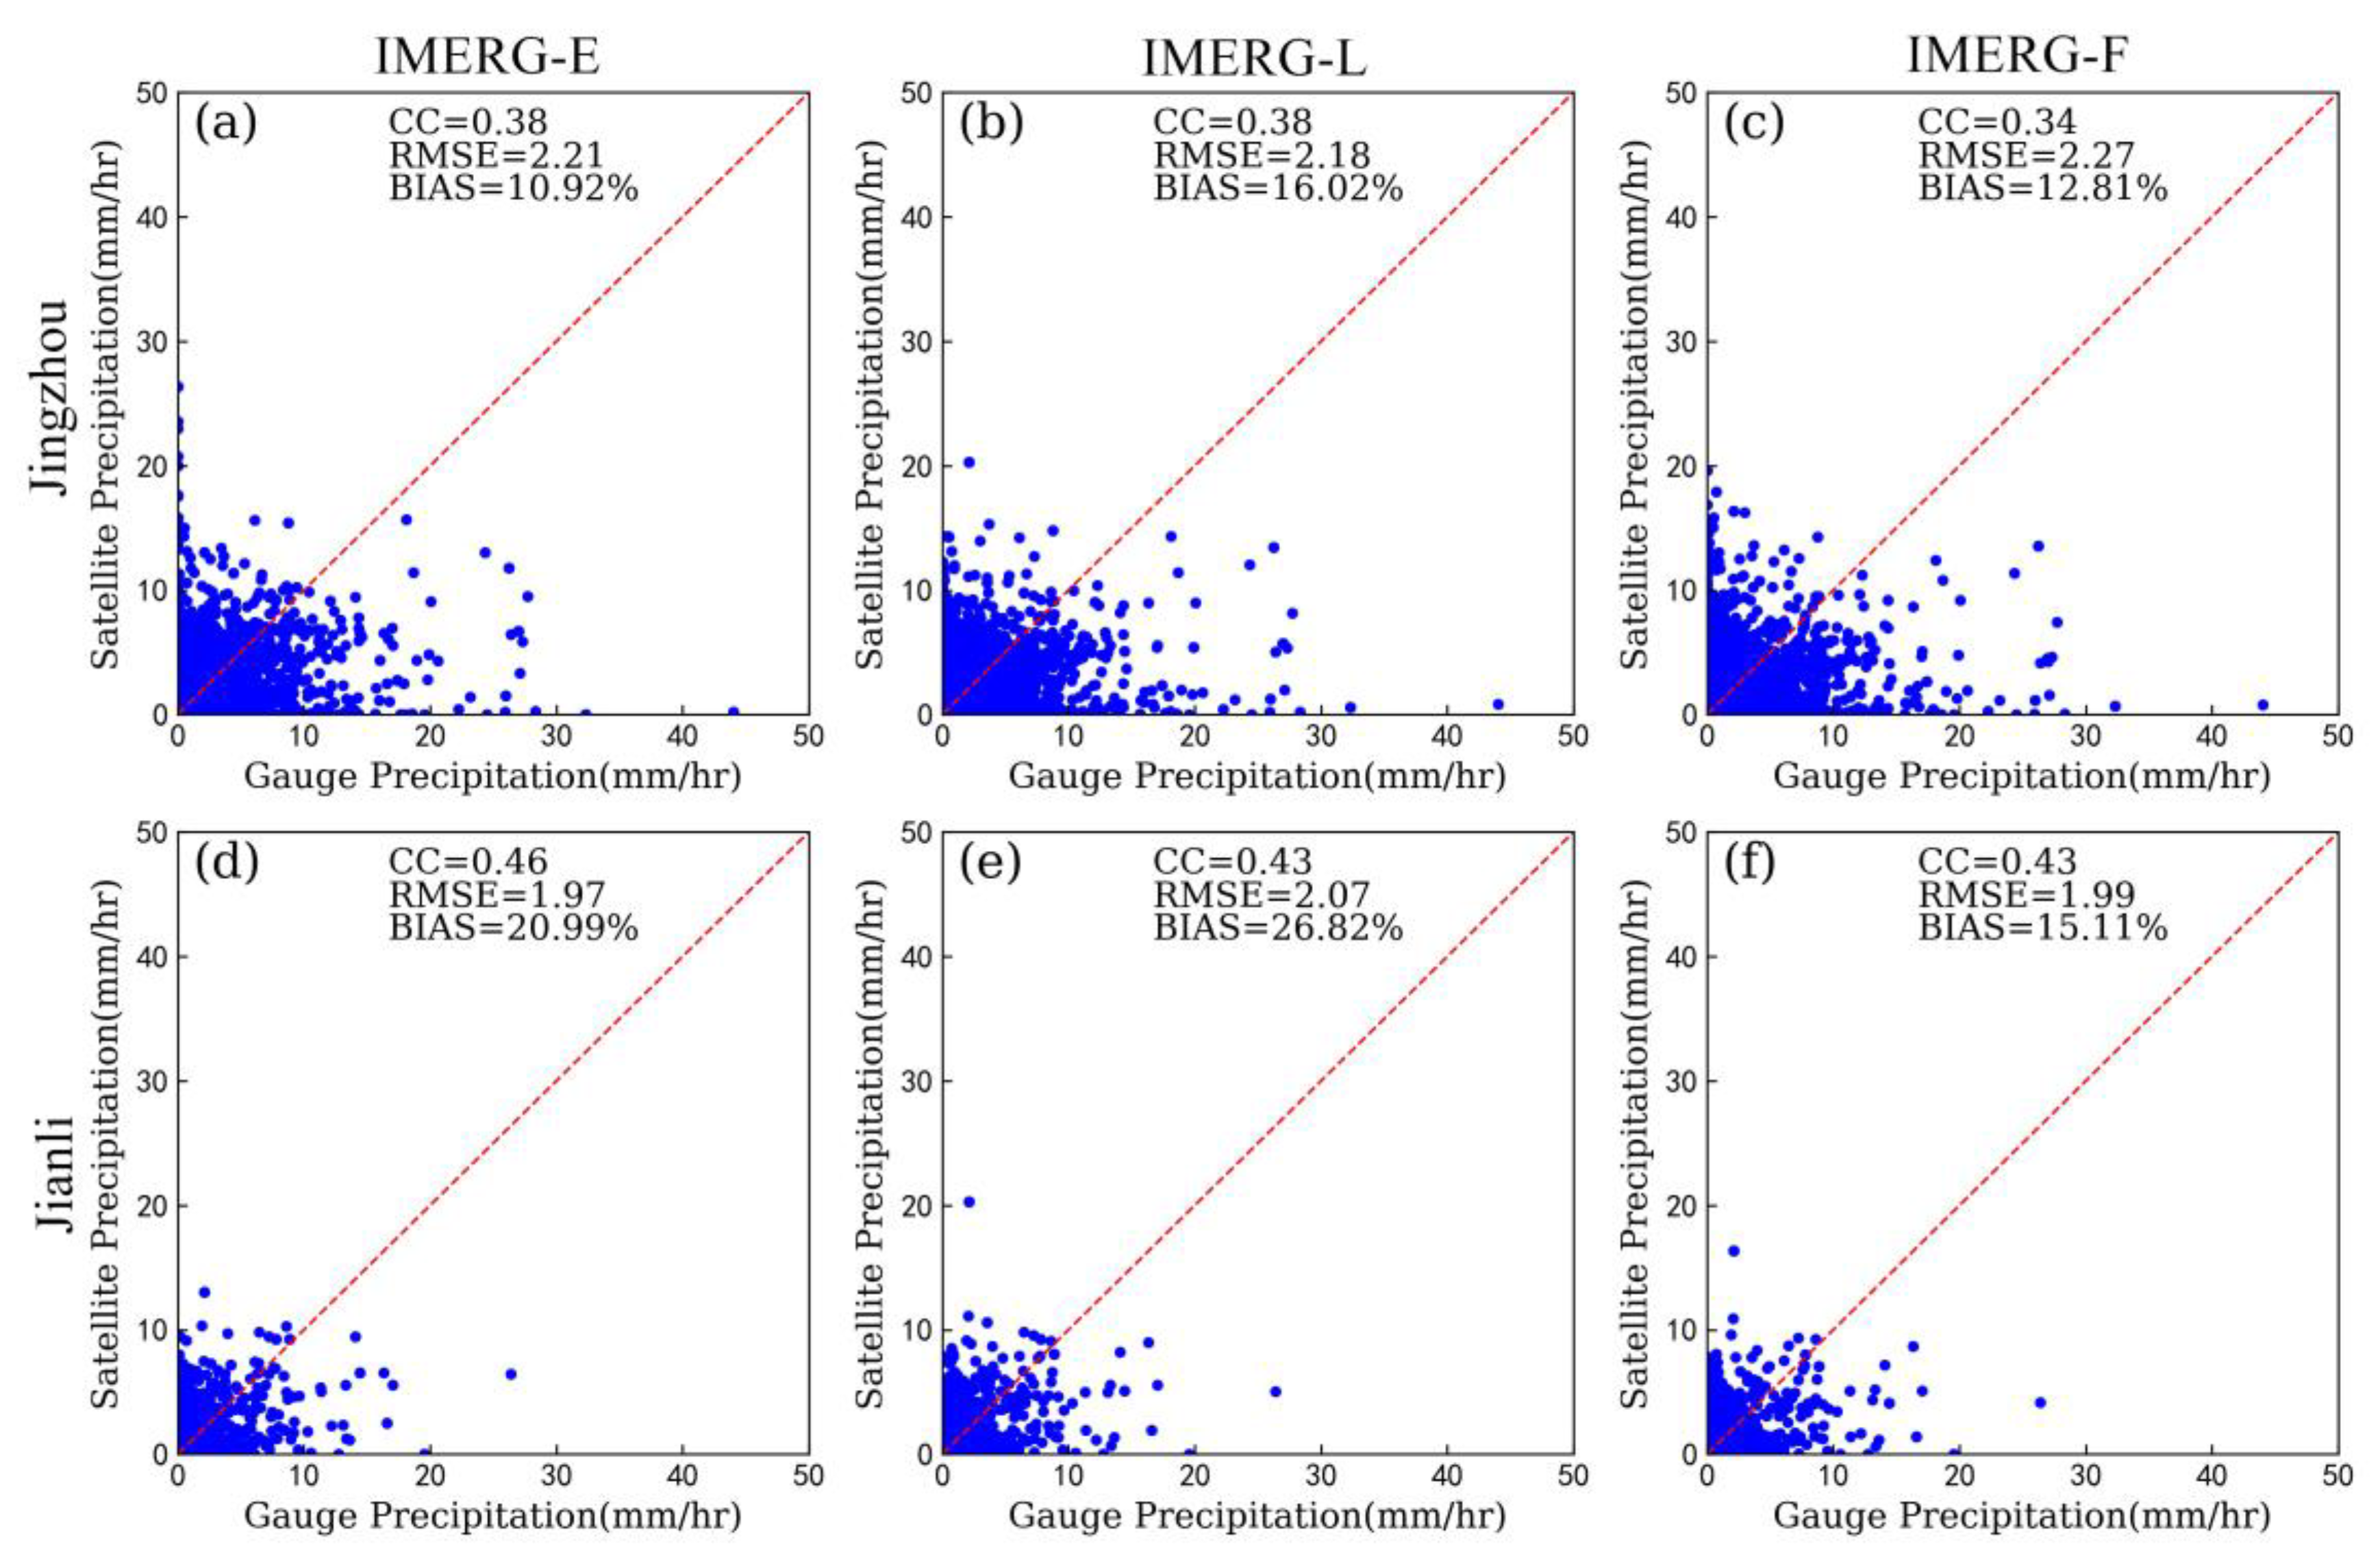
Figure 9 shows the scatterplots of the three IMERG precipitation products against gauge-based precipitation data to provide a statistical metric comparison of average hourly precipitation over Jingzhou and Jianli throughout the corresponding period. Different from the performance in Enshi, the three IMERG precipitation products overestimated the hourly precipitation in Jingzhou and Jianli. As shown in Figure 9 and Table 3, the CC and RMSE of the three IMERG precipitation products were similar. As for the BIAS, IMERG-E had the lowest BIAS (10.92%) in Jingzhou, but IMERG-F had the lowest BIAS (15.11%) in Jianli. Overall, the performance of the three IMERG precipitation products was relatively consistent in Event 2.
Figure 10 shows the scatterplots of the three IMERG precipitation products against gauge-based precipitation data to enable a statistical metric comparison of average hourly precipitation over Shiyan and Fangxian throughout the corresponding period. As shown in Figure 10 and Table 3, IMERG-F had the largest CC, which was 0.49 in Shiyan and 0.64 in Fangxian, although the three IMERG precipitation products had approximately similar CC values. As for the RMSE and BIAS, the RMSE of IMERG-F were lower than IMERG-E and IMERG-L. IMERG-F had a lower BIAS (5.35%) than IMERG-E and IMERG-L (11.57% and 24.5%, respectively) for Shiyan. In addition, the BIAS of IMERG-E and IMERG-L was above 60% in Fangxian, and that of IMERG-F was only 11.3%. The scatter points distribution showed that IMERG-F is better than the two other IMERG precipitation products; the results are similar to those for Enshi. Overall, IMERG-F had better performance than IMERG-E and IMERG-L over Shiyan.
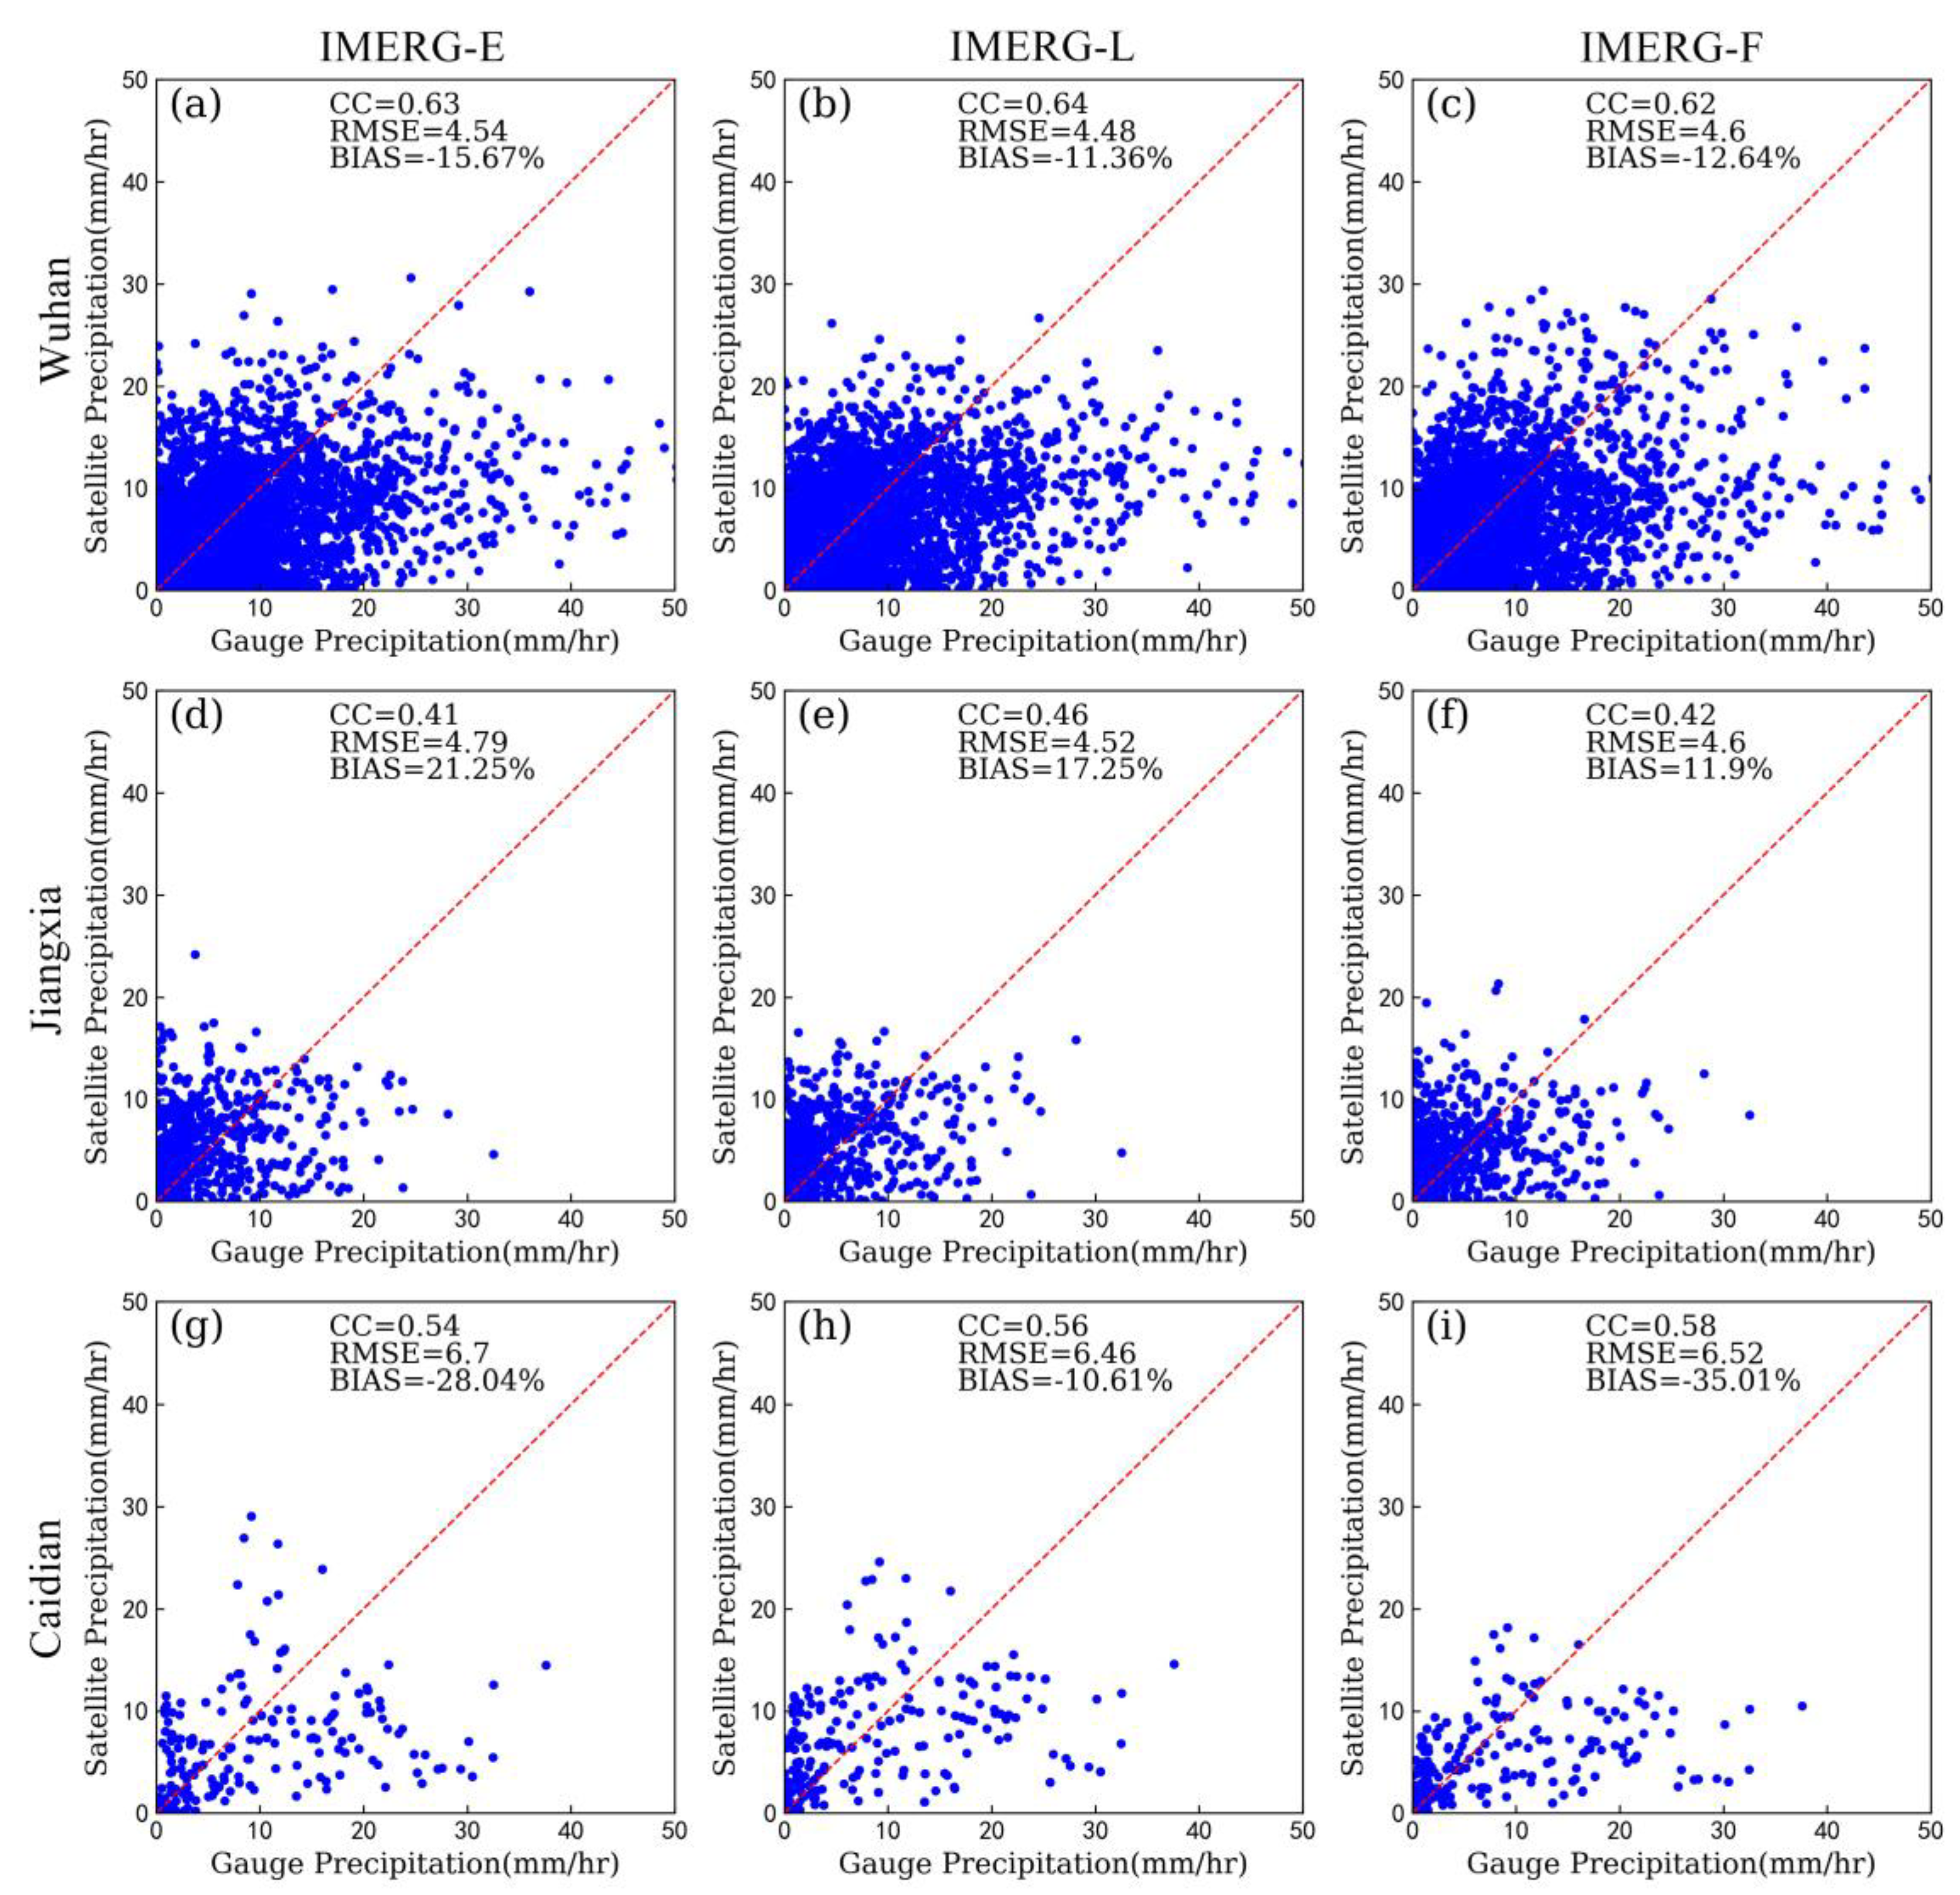
Figure 11 shows the scatterplots of the three IMERG precipitation products against gauge-based precipitation data to enable a statistical metric comparison of average hourly precipitation over Wuhan and two other precipitation centers (Jiangxia and Caidian) throughout the corresponding periods. In general, the scatter points distribution of the three IMERG precipitation products were similar in the three regions. Although the three IMERG precipitation products overestimated precipitation in Jiangxia but underestimated precipitation in Wuhan and Caidian, the accuracy of the three IMERG precipitation products was relatively consistent (Table 3). Overall, as the statistical metrics show, IMERG-F had a relatively higher CC and lower RMSE and BIAS values than those of IMERG-E and IMERG-L in Enshi and Shiyan. However, CC, RMSE, and BIAS values of the three IMERG precipitation products were close in Jingzhou and Wuhan.

3.3. Precipitation Detection Ability

In this section, we evaluated the three IMERG precipitation products against gridded gauge-based precipitation products on the daily scale in four different extreme precipitation events. In order to evaluate the ability of three IMERG precipitation products to detect four precipitation intensity levels, those are, light rain (0.1–9.9 mm/day), moderate rain (10.0–24.9 mm/day), heavy rain (25.0–49.9 mm/day), and rainstorm (>50.0 mm/day), only grid pixels with gauge stations were taken to calculate the categorical metrics.
In Event 1, the POD and CSI values of the three IMERG precipitation products displayed a decreasing trend in the range of light to heavy rain, whereas the FAR values increased as the threshold interval of precipitation intensity increased in the range of light to moderate rain (Table 4). The POD and CSI values of IMERG-E (approximately 0.55 and 0.51, respectively), IMERG-L (approximately 0.51 and 0.47, respectively), and IMERG-F (approximately 0.76 and 0.68, respectively) were observed when the precipitation intensity exceeded the rainstorm level, which indicated a recovery in rainstorm detection compared with heavy rain from IMERG-E (approximately 0.15 and 0.10, respectively), IMERG-L (approximately 0.20 and 0.12, respectively), and IMERG-F (approximately 0.24 and 0.18, respectively). The highest FAR value of IMERG-E (approximately 0.80) and IMERG-L (approximately 0.78) were observed when the precipitation intensity reached the heavy rain level, but when the precipitation intensity reached the moderate rain level, IMERG-F already had a relatively high FAR value of about 0.67.
Table 5 shows the categorical metrics for the three IMERG precipitation products for Event 2. The POD and CSI values for IMERG-F displayed a decreasing trend as the precipitation threshold increased, but the FAR value increased as the threshold interval of precipitation increased in the range of light to heavy rain. The high POD (approximately 0.46) and low FAR (approximately 0.31) of IMERG-L showed that it performed the best at the light rain level. However, IMERG-E had the highest POD value (approximately 0.54) when the precipitation intensity reached moderate rain and the highest FAR value (approximately 0.78) when the heavy rain level was reached. Overall, the three categorical metrics of the IMERG precipitation products for different precipitation intensity levels were relatively close in Event 2.
Table 6 shows the categorical metrics for the three IMERG precipitation products for Event 3. The POD and CSI values for IMERG-E and IMERG-L displayed a decreasing trend in the range of light to heavy rain but increased when the precipitation intensity reached the rainstorm level. All three IMERG precipitation products had the lowest FAR at the light rain level, that was, ~0.23 for IMERG-E, ~0.25 for IMERG-L, and ~0.14 for IMERG-F. We found that the ability of IMERG-F to detect moderate rain and heavy rain levels is better than IMERG-E and IMERG-L.
Table 7 shows the categorical metrics for IMERG-E, IMERG-L, and IMERG-F for Event 4. The POD and CSI values for three IMERG precipitation products displayed a decreasing trend in the range of light to heavy rain, but the FAR values of three IMERG precipitation products displayed an increasing trend in the same range. All three IMERG precipitation products had the lowest POD and CSI values at the heavy rain level, that is, ~0.14 and ~0.07 for IMERG-E, ~0.19 and ~0.1 for IMERG-L, and ~0.12 and ~0.05 for IMERG-F, respectively. They also had the highest FAR values at the heavy rain level: ~0.87, ~0.82, and ~0.91 for IMERG-E, IMERG-L, and IMERG-F, respectively (Table 7). IMERG-F had a low POD when the precipitation intensity level exceeded heavy rain, but its FAR value was higher than those of IMERG-E and IMERG-L, probably because IMERG-F overestimates heavy rain. The performance of the IMERG-F in Wuhan was similar to that of the IMERG-E and IMERG-L, but the results were different for Enshi and Shiyan (Table 4 and Table 6, respectively). In Enshi and Shiyan, the categorical metrics for IMERG-F were better than for IMERG-E and IMERG-L.
We estimated and compared three IMERG precipitation products’ capability to monitor extreme precipitation with gauge-based precipitation data in the four events in terms of spatiotemporal scales, statistical metrics, and precipitation intensity levels detection capability. Figure 4, Figure 6, Figure 7, Figure 9 and Figure 11 and Table 5 and Table 7 indicate that the accuracies of the three IMERG precipitation products were relatively consistent in Event 2 (Jingzhou) and Event 4 (Wuhan). However, the accuracy of IMERG-F was higher than IMERG-E and IMERG-L in Event 1 (Enshi) and Event 3 (Shiyan), as shown in Figure 3, Figure 5, Figure 7, Figure 8 and Figure 10 and Table 4 and Table 6. According to our investigation, Enshi and Shiyan are characterized by complex topography, including mountains, forests, and hills, and the average elevation is about 1000 m, while Jingzhou and Wuhan are characterized by low mountains, ridges, and plains, and the average elevation is about 40 m. We think that the inconsistent results obtained for the four regions might be due to terrain factors (i.e., complex and less complex topography). Enshi and Shiyan are preliminarily classified as areas of complex topography, and Jingzhou and Wuhan are classified as areas of less complex topography. Further comprehensive analysis is therefore necessary.

4. Discussion

Three IMERG precipitation products, IMERG-E, IMERG-L, and IMERG-F, were used to estimate extreme precipitation and exhibited capabilities in monitoring cumulative precipitation, variation patterns in precipitation on spatiotemporal scales, and statistical and categorical metrics in extreme precipitation events. IMERG-F performed better than the IMERG-E and IMERG-L in Enshi and Shiyan, but this finding was not observed in Jingzhou and Wuhan. Li et al. [39] found that IMERG-F performed better than IMERG-E and IMERG-L in an extreme heavy rainfall process over Nanjing city in China. Yang et al. [40] compared the three IMERG precipitation products and found that the IMERG-F may be regarded as a reliable data source. However, Tang et al. [23] found that the IMERG-F was not always superior to IMERG-E and IMERG-L in several evaluations. Yang et al. [40] evaluated the three IMERG precipitation products in extreme precipitation events over Sichuan province in China and found that the level of the precipitation detection capability of the IMERG precipitation products depended on the rainfall type and topography. Thus, the influence of topography on extreme precipitation events must be determined.
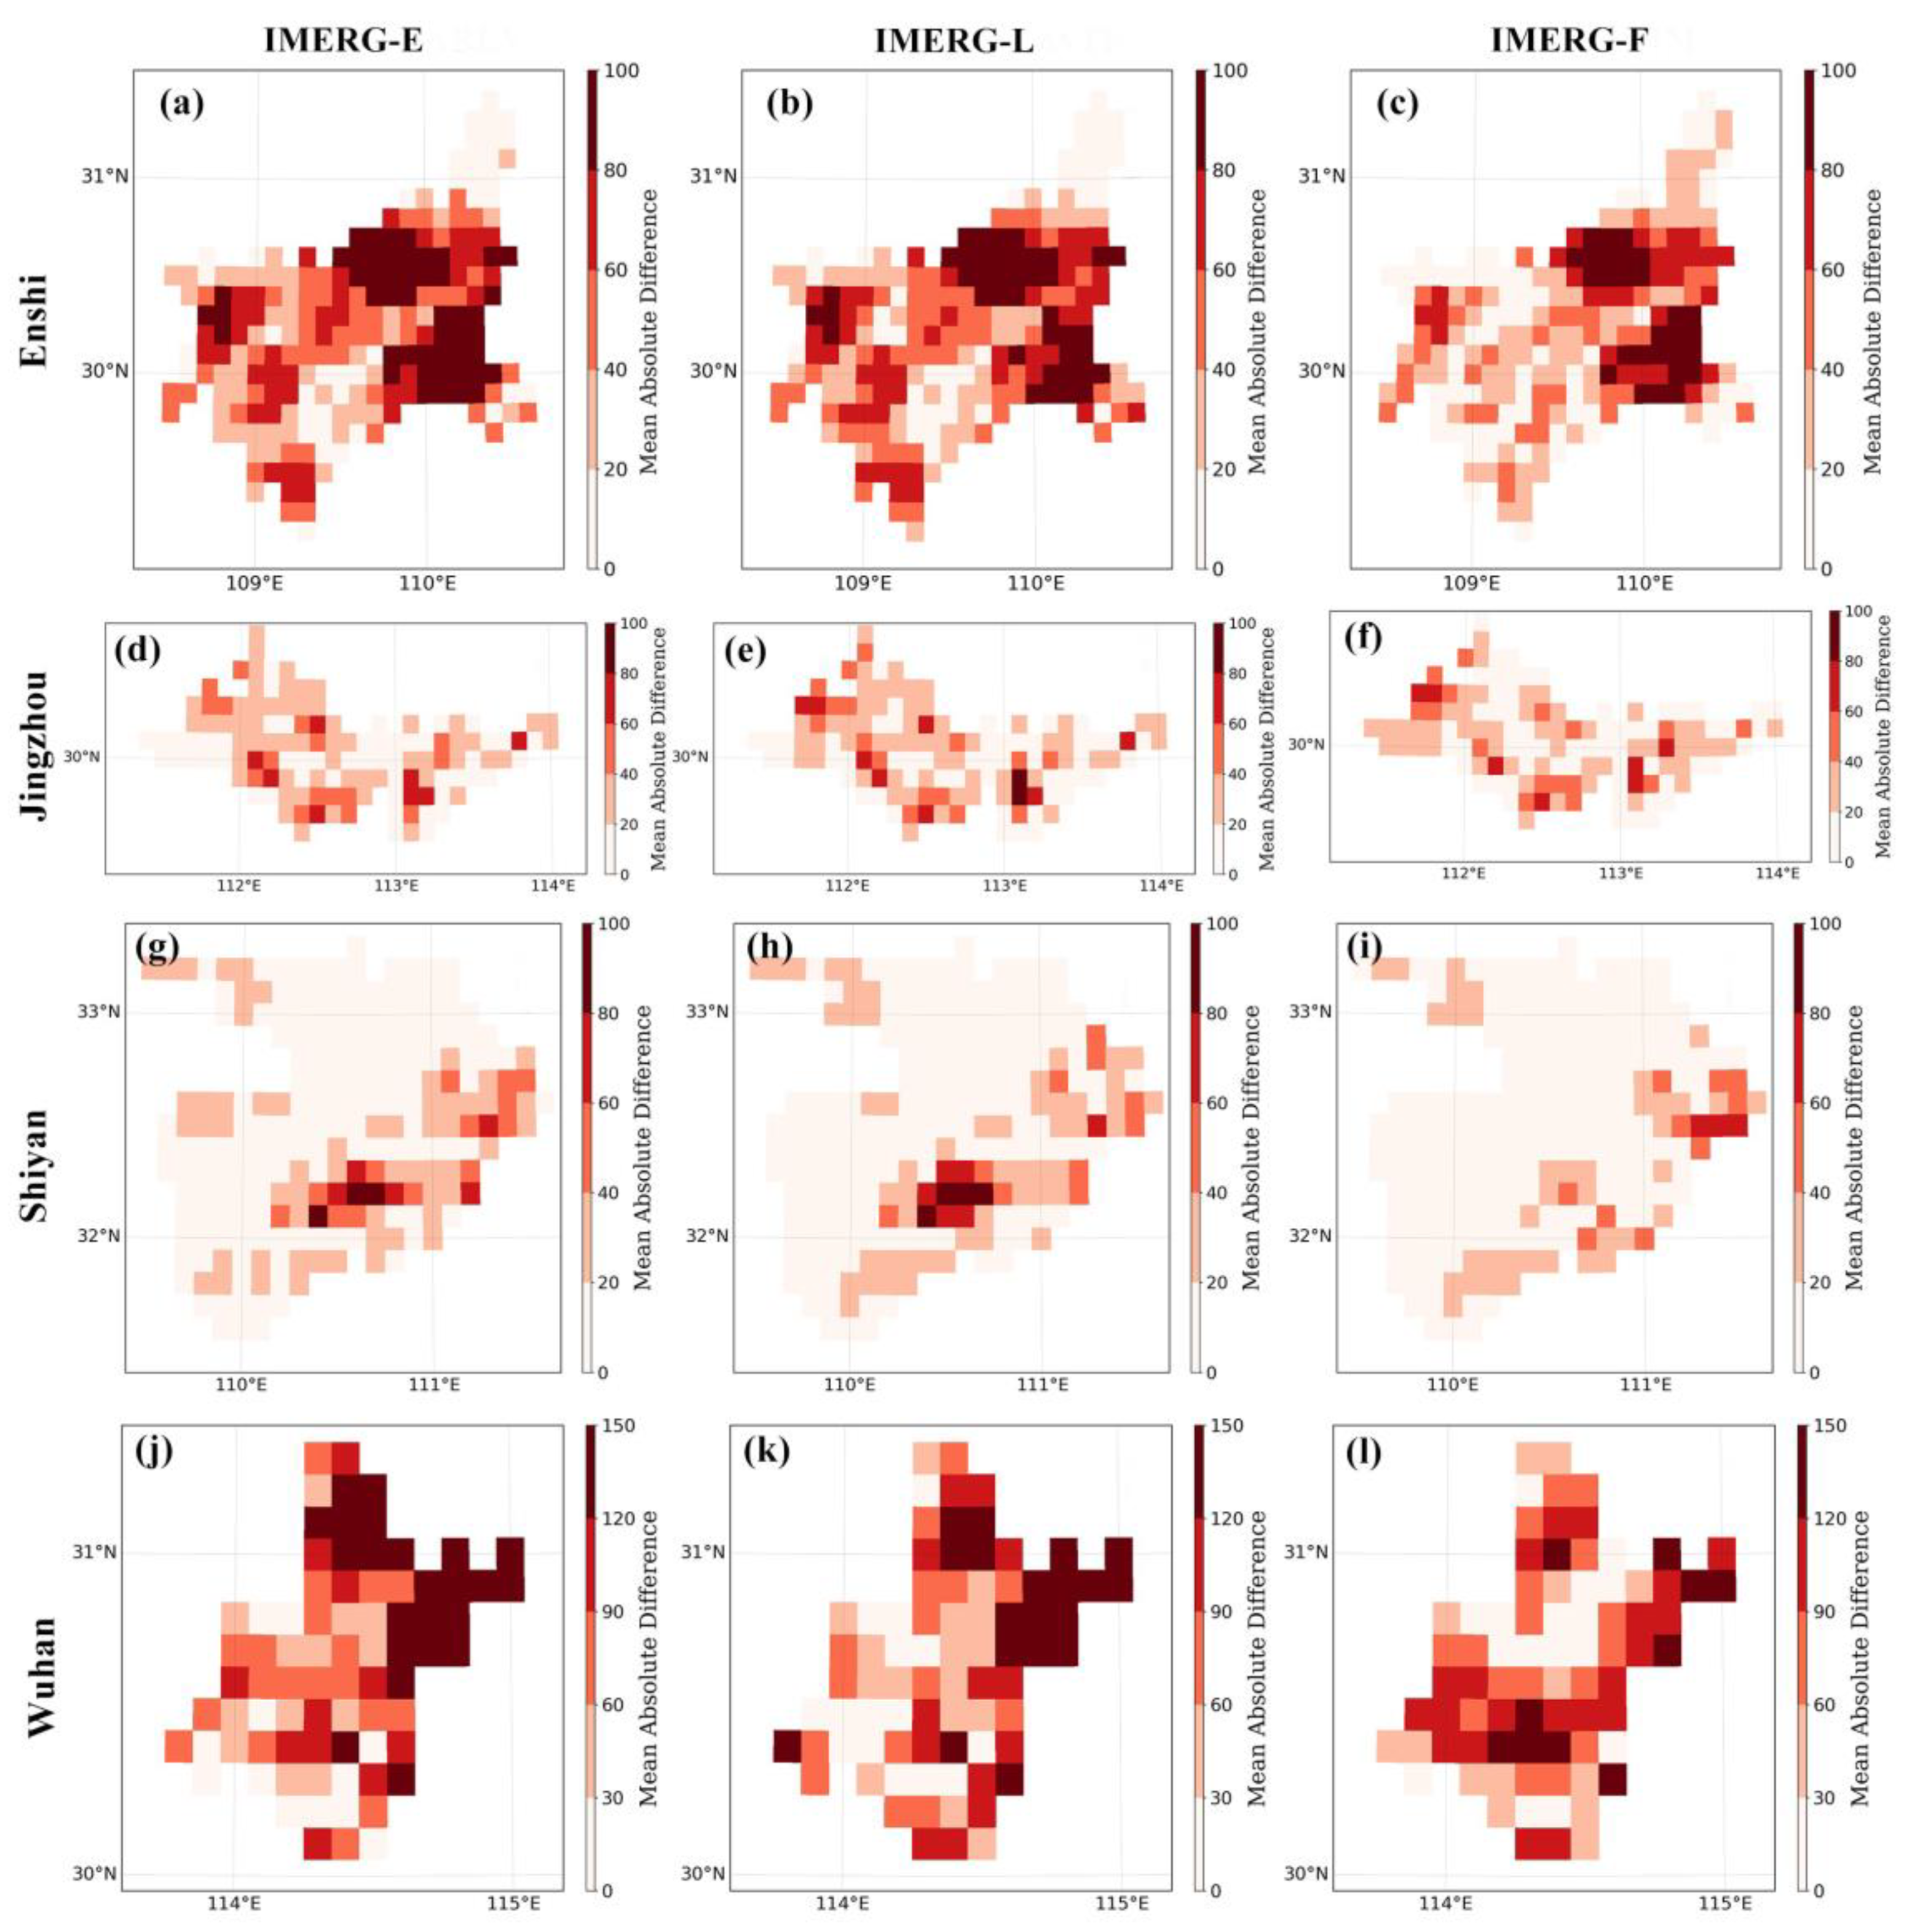
Enshi and Shiyan are characterized by complex topography, such as mountains, forests, and hills, with an average elevation of about 1000 m, while Jingzhou and Wuhan were mostly characterized by low mountains and hills and numerous ridges and plains. The mean absolute difference between the cumulative precipitation of the IMERG precipitation products and gauge-based precipitation data was calculated. As shown in Figure 12, in Events 1 (Enshi) and 3 (Shiyan), the IMERG-F outperformed the IMERG-E and IMERG-L and exhibited lower precipitation differences with the gauge-based precipitation data. IMERG-E and IMERG-L overestimated precipitation over the southeast of Shiyan. However, in Events 2 (Jingzhou) and 4 (Wuhan), the IMERG-F products were close to the others. These results indicated that IMERG-F may present a smooth trend in precipitation differences in areas of complex topography. Therefore, it is crucial to consider different environments, rain types, and topography when estimating the IMERG products’ capability to monitor extreme precipitation.
The Expert Team on Climate Change Detection, Monitoring, and Indices (ETCCDMI) recommends a total of 27 core indexes with a primary focus on extremes derived from daily station data [41]. Yang et al. [40] used extreme indicators to evaluate the three IMERG precipitation products in extreme precipitation events while considering the influence of topography and rain type. In accordance with Camarasa et al. [42], who used eight rainfall indicators (including 1, 6, and 12 h rainfall intensity) to estimate flood risk thresholds, we selected two extreme rainfall indexes: rainfall intensity and accumulated rainfall.
The CC values of three IMERG precipitation products for different accumulation periods, including 1, 2, 3, 6, 12, and 24 h, in areas of complex and less complex topography, are shown in Figure 13. The CC increased with time-intensity in the four different regions, revealing the capacity of the three IMERG precipitation products to estimate short-term extreme precipitation. In areas of complex topography, IMERG-F had higher CC than IMERG-E and IMERG-L at most intensities. However, in areas of less complex topography, the CC of the three IMERG precipitation products was similar. IMERG-E and IMERG-L had slightly higher CC than IMERG-F at 1, 2, and 3 h rainfall intensities. Therefore, IMERG-E and IMERG-L have a similar capability as IMERG-F to estimate extreme precipitation in areas of less complex topography.
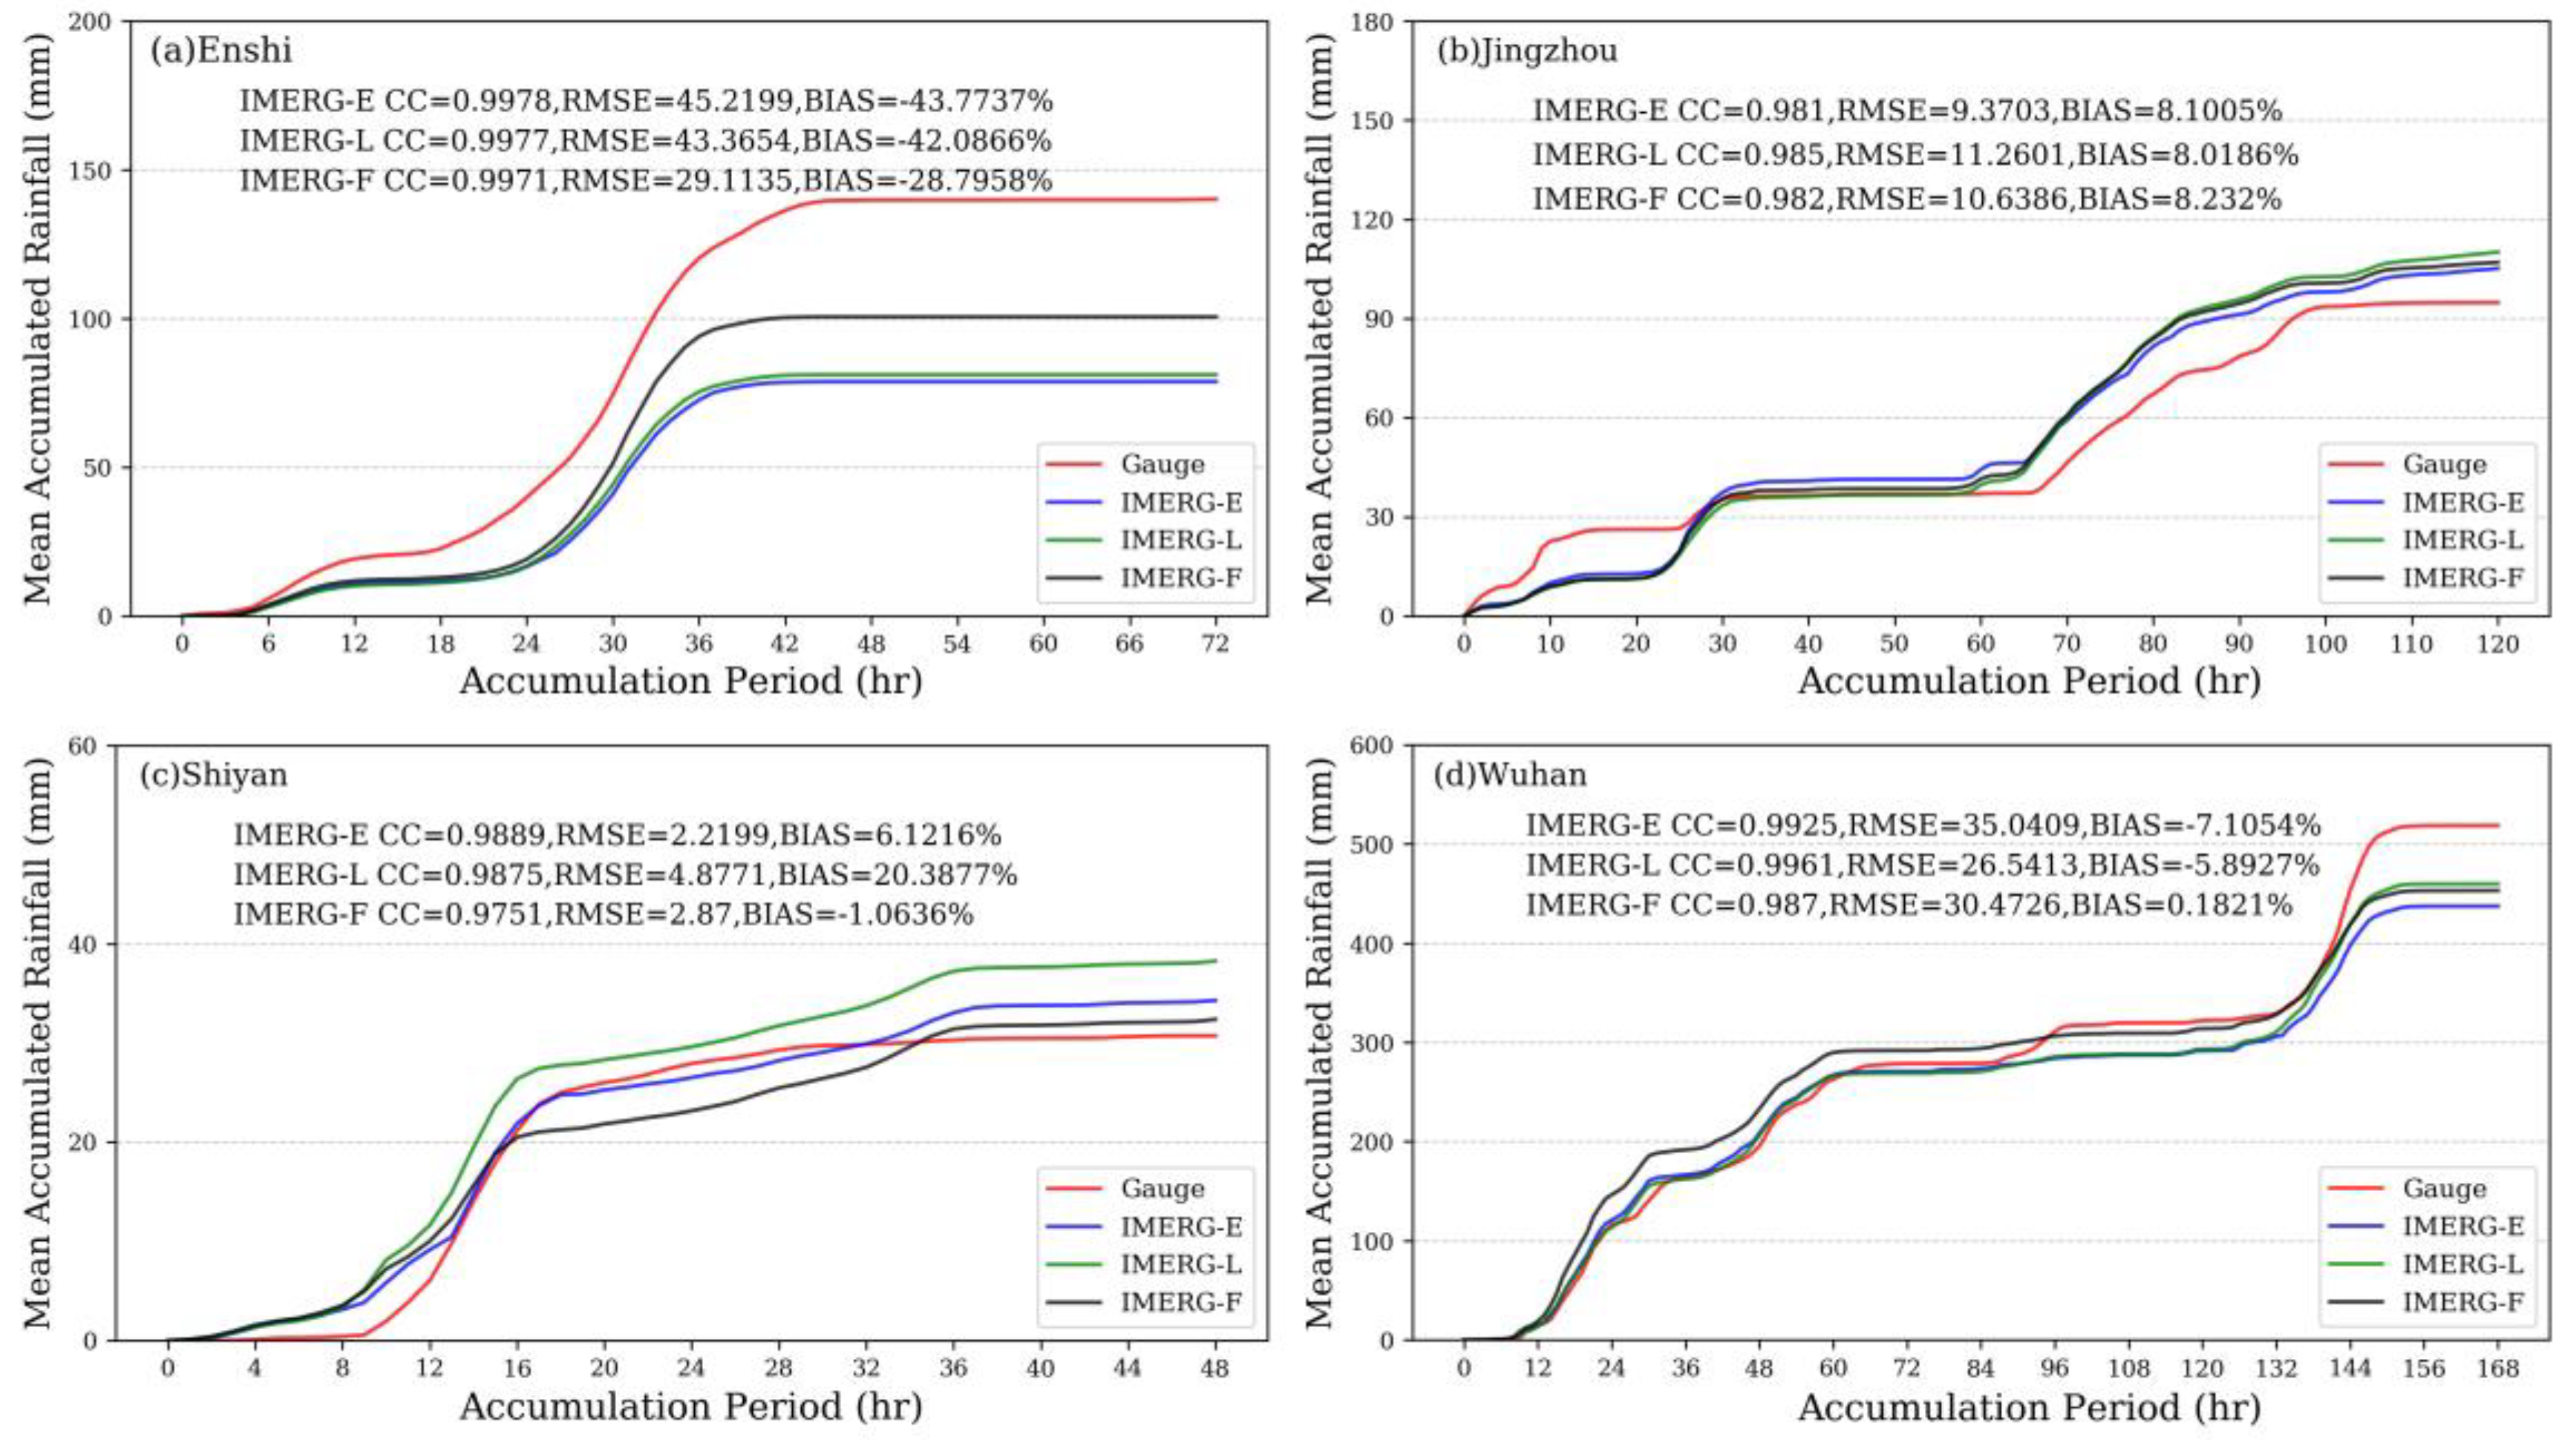
Figure 14 shows the average cumulative precipitation observed by three IMERG precipitation products and gauge-based precipitation data over Enshi, Jingzhou, Shiyan, and Wuhan during the corresponding accumulation periods in time. In Enshi, Shiyan, and Wuhan, the BIASs of IMERG-F (−28.80%, −1.06%, and 0.18%, respectively) were lower than those of IMERG-E (−43.77%, 6.12%, and −7.11%, respectively) and IMERG-L (−42.09%, 20.39%, and 5.89%, respectively) but similar to them in Jingzhou. The three IMERG precipitation products captured the actual hourly precipitation tendency, indicating that IMERG precipitation products could be used for monitoring extreme precipitation events on the hourly scale, although the capability on the hourly scale was less satisfactory than on the daily scale [26].
The three IMERG precipitation products have good applicability to monitor extreme precipitation events. However, we also found that errors were observed between IMERG precipitation products and gauge-based precipitation data. For example, their average CC in the four events were 0.86, 0.54, 0.67, and 0.81, and their average RMSE was 34.27, 14.92, 18.02, and 34.26 mm, respectively. Therefore, future studies need to estimate and optimize the IMERG precipitation products. Further validation needs to be performed in other study areas, including those with complex or less complex topography.

5. Conclusions

GPM IMERG precipitation products are usually used to analyze long-term precipitation distribution in a certain area, but their ability to analyze short-term precipitation events, especially their capability to monitor extreme precipitation, remains poorly understood. In this study, the ability of three IMERG V6 products (IMERG-E, IMERG-L, and IMERG-F) to monitor extreme precipitation events was comprehensively evaluated and compared with the gauge-based precipitation data in four separate regions. Three IMERG precipitation products captured the same spatiotemporal variation patterns of extreme precipitation as gauge-based precipitation data over time, but the performance of the three IMERG precipitation products varied from region to region. The three IMERG precipitation products also captured the actual hourly precipitation tendencies during extreme precipitation events. This assessment of the three IMERG precipitation products provides a valuable reference to and feedback for studies on extreme precipitation events. Considering that the terrain environments of the study regions are different, we found that IMERG-F presented better capability than IMERG-E and IMERG-L in areas of complex topography, but they produced consistent outcomes in areas of less complex topography. This finding may help other scholars when analyzing the error sources of satellite precipitation products. However, it is still not enough to analyze the influences of terrain factors by using only limited extreme precipitation events (four events in this study): other evaluations of extreme precipitation events in areas of complex and less complex topography could be conducted in future studies.

Author Contributions

C.Z.: Conceptualization, Methodology, Software, Writing—Original draft preparation. W.G.: Conceptualization Methodology, Supervision, Writing—Review and Editing. J.H.: Validation, Data curation. L.D. (Lin Du): Supervision, Writing—Review and Editing. L.D. (Liangmin Du): Software, Validation. All authors have read and agreed to the published version of the manuscript.

Funding

This research was funded by the National Key Research and Development Program of China (No. 2017YFC1502306).

Institutional Review Board Statement

Not applicable.

Informed Consent Statement

Not applicable.

Data Availability Statement

Data sharing not applicable.

Acknowledgments

We thank relevant organizations for providing the satellite-based precipitation products, namely, NASA for IMERG V6. In addition, we are grateful to Wuhan Regional Climate Center and National Meteorological Information Center of the China Meteorological Administration for providing observation gauge data.

Conflicts of Interest

The authors declare no conflict of interest.

References

  1. Akinbile, C.O.; Ogunmola, O.O.; Abolude, A.T.; Akande, S.O. Trends and spatial analysis of temperature and rainfall patterns on rice yields in nigeria. Atmos. Sci. Lett. 2020, 21, 13. [Google Scholar] [CrossRef]
  2. IPCC 2014. Climate Change 2014: Synthesis Report. In Contribution of Working Groups I, II and III to the Fifth Assessment Report of the Intergovernmental Panel on Climate Change; Core Writing Team, Pachauri, R.K., Meyer, L.A., Eds.; IPCC: Geneva, Switzerland, 2014; p. 151. [Google Scholar]
  3. Wang, F. Temporal pattern analysis of local rainstorm events in china during the flood season based on time series clustering. Water 2020, 12, 725. [Google Scholar] [CrossRef] [Green Version]
  4. Buarque, D.C.; de Paiva, R.C.D.; Clarke, R.T.; Mendes, C.A.B. A comparison of amazon rainfall characteristics derived from trmm, cmorph and the brazilian national rain gauge network. J. Geophys. Res.-Atmos. 2011, 116, 12. [Google Scholar] [CrossRef]
  5. Guo, H.; Chen, S.; Bao, A.M.; Hu, J.J.; Yang, B.H.; Stepanian, P.M. Comprehensive evaluation of high-resolution satellite-based precipitation products over china. Atmosphere 2016, 7, 6. [Google Scholar] [CrossRef] [Green Version]
  6. Jing, W.L.; Zhang, P.Y.; Jiang, H.; Zhao, X.D. Reconstructing satellite-based monthly precipitation over northeast china using machine learning algorithms. Remote Sens. 2017, 9, 781. [Google Scholar] [CrossRef] [Green Version]
  7. Tang, G.; Li, Z.; Xue, X.; Hu, Q.; Yong, B.; Hong, Y.J.W.S. A study of substitutability of trmm remote sensing precipitation for gauge-based observation in ganjiang river basin. Adv. Water Sci. 2015, 26, 340–346. [Google Scholar] [CrossRef]
  8. Xu, F.L.; Guo, B.; Ye, B.; Ye, Q.; Chen, H.N.; Ju, X.H.; Guo, J.Y.; Wang, Z.L. Systematical evaluation of gpm imerg and trmm 3b42v7 precipitation products in the huang-huai-hai plain, china. Remote Sens. 2019, 11, 697. [Google Scholar] [CrossRef] [Green Version]
  9. Mantas, V.M.; Liu, Z.; Caro, C.; Pereira, A. Validation of trmm multi-satellite precipitation analysis (tmpa) products in the peruvian andes. Atmos. Res. 2015, 163, 132–145. [Google Scholar] [CrossRef]
  10. Joyce, R.J.; Janowiak, J.E.; Arkin, P.A.; Xie, P. Cmorph: A method that produces global precipitation estimates from passive microwave and infrared data at high spatial and temporal resolution. J. Hydrometeorol. 2004, 5, 487–503. [Google Scholar] [CrossRef]
  11. Hsu, K.-L.; Gao, X.; Sorooshian, S.; Gupta, H.V. Precipitation estimation from remotely sensed information using artificial neural networks. J. Appl. Meteorol. 1997, 36, 1176–1190. [Google Scholar] [CrossRef]
  12. Shige, S.; Yamamoto, T.; Tsukiyama, T.; Kida, S.; Ashiwake, H.; Kubota, T.; Seto, S.; Aonashi, K.; Okamoto, K. The gsmap precipitation retrieval algorithm for microwave sounders-part i: Over-ocean algorithm. IEEE Trans. Geosci. Remote. Sens. 2009, 47, 3084–3097. [Google Scholar] [CrossRef]
  13. Guoqiang, T.; Wei, W.; Ziyue, Z.; Xiaolin, G.; Na, L.; Di, L.; Yang, H. An overview of the global precipitation measurement (gpm) mission and it’s latest development. Remote Sens. Technol. Appl. 2015, 30, 607–615. [Google Scholar]
  14. Yuan, F.; Zhang, L.M.; Win, K.W.W.; Ren, L.L.; Zhao, C.X.; Zhu, Y.H.; Jiang, S.H.; Liu, Y. Assessment of gpm and trmm multi-satellite precipitation products in streamflow simulations in a data-sparse mountainous watershed in myanmar. Remote Sens. 2017, 9, 302. [Google Scholar] [CrossRef] [Green Version]
  15. Ren, M.F.; Xu, Z.X.; Pang, B.; Liu, W.F.; Liu, J.T.; Du, L.G.; Wang, R. Assessment of satellite-derived precipitation products for the beijing region. Remote Sens. 2018, 10, 1914. [Google Scholar] [CrossRef] [Green Version]
  16. Ullah, W.; Wang, G.J.; Ali, G.; Hagan, D.F.T.; Bhatti, A.S.; Lou, D. Comparing multiple precipitation products against in-situ observations over different climate regions of pakistan. Remote Sens. 2019, 11, 628. [Google Scholar] [CrossRef] [Green Version]
  17. Lu, D.K.; Yong, B. Evaluation and hydrological utility of the latest gpm imerg v5 and gsmap v7 precipitation products over the tibetan plateau. Remote Sens. 2018, 10, 2022. [Google Scholar] [CrossRef] [Green Version]
  18. Tang, G.Q.; Ma, Y.Z.; Long, D.; Zhong, L.Z.; Hong, Y. Evaluation of gpm day-1 imerg and tmpa version-7 legacy products over mainland china at multiple spatiotemporal scales. J. Hydrol. 2016, 533, 152–167. [Google Scholar] [CrossRef]
  19. Asong, Z.E.; Razavi, S.; Wheater, H.S.; Wong, J.S. Evaluation of integrated multisatellite retrievals for gpm (imerg) over southern canada against ground precipitation observations: A preliminary assessment. J. Hydrometeorol. 2017, 18, 1033–1050. [Google Scholar] [CrossRef]
  20. Tan, M.L.; Ibrahim, A.; Duan, Z.; Cracknell, A.P.; Chaplot, V. Evaluation of six high-resolution satellite and ground-based precipitation products over malaysia. Remote Sens. 2015, 7, 1504–1528. [Google Scholar] [CrossRef] [Green Version]
  21. Ma, Y.Z.; Tang, G.Q.; Long, D.; Yong, B.; Zhong, L.Z.; Wan, W.; Hong, Y. Similarity and error intercomparison of the gpm and its predecessor-trmm multisatellite precipitation analysis using the best available hourly gauge network over the tibetan plateau. Remote Sens. 2016, 8, 569. [Google Scholar] [CrossRef] [Green Version]
  22. Hou, A.Y.; Kakar, R.K.; Neeck, S.; Azarbarzin, A.A.; Kummerow, C.D.; Kojima, M.; Oki, R.; Nakamura, K.; Iguchi, T. The global precipitation measurement mission. Bull. Amer. Meteorol. Soc. 2014, 95, 701–722. [Google Scholar] [CrossRef]
  23. Tang, S.X.; Li, R.; He, J.X.; Wang, H.; Fan, X.G.; Yao, S.Y. Comparative evaluation of the gpm imerg early, late, and final hourly precipitation products using the cmpa data over sichuan basin of china mdpi. Water 2020, 12, 554. [Google Scholar] [CrossRef] [Green Version]
  24. Navarro, A.; Garcia-Ortega, E.; Merino, A.; Sanchez, J.L.; Kummerow, C.; Tapiador, F.J. Assessment of imerg precipitation estimates over europe. Remote Sens. 2019, 11, 2470. [Google Scholar] [CrossRef] [Green Version]
  25. Dandridge, C.; Lakshmi, V.; Bolten, J.; Srinivasan, R. Evaluation of satellite-based rainfall estimates in the lower mekong river basin (southeast asia). Remote Sens. 2019, 11, 2709. [Google Scholar] [CrossRef] [Green Version]
  26. Yang, X.Y.; Lu, Y.; Tan, M.L.; Li, X.G.; Wang, G.Q.; He, R.M. Nine-year systematic evaluation of the gpm and trmm precipitation products in the shuaishui river basin in east-central china. Remote Sens. 2020, 12, 1042. [Google Scholar] [CrossRef] [Green Version]
  27. Zhang, A.S.; Xiao, L.S.; Min, C.; Chen, S.; Kulie, M.; Huang, C.Y.; Liang, Z.Q. Evaluation of latest gpm-era high-resolution satellite precipitation products during the may 2017 guangdong extreme rainfall event. Atmos. Res. 2019, 216, 76–85. [Google Scholar] [CrossRef]
  28. Huffman, G.J.; Bolvin, D.T.; Braithwaite, D.; Hsu, K.; Joyce, R.; Xie, P.; Yoo, S.-H. Nasa global precipitation measurement (gpm) integrated multi-satellite retrievals for gpm (imerg). Algorithm Theor. Basis Doc. 2015, 4, 26. [Google Scholar]
  29. Administration, C.M. Quality Control of Surface Meteorological Observational Data. Available online: http://www.cmastd.cn/ (accessed on 18 January 2021).
  30. Tan, J.; Huffman, G.J.; Bolvin, D.T.; Nelkin, E.J. Imerg v06: Changes to the morphing algorithm. J. Atmos. Ocean. Technol. 2019, 36, 2471–2482. [Google Scholar] [CrossRef]
  31. Mazzoglio, P.; Laio, F.; Balbo, S.; Boccardo, P.; Disabato, F. Improving an extreme rainfall detection system with gpm imerg data. Remote Sens. 2019, 11, 677. [Google Scholar] [CrossRef] [Green Version]
  32. Khan, S.; Maggioni, V. Assessment of level-3 gridded global precipitation mission (gpm) products over oceans. Remote Sens. 2019, 11, 255. [Google Scholar] [CrossRef] [Green Version]
  33. Zhang, L.; Ren, D.; Nan, Z.; Wang, W.; Wu, X. Interpolated or satellite-based precipitation? Implications for hydrological modeling in a meso-scale mountainous watershed on the qinghai-tibet plateau. J. Hydrol. 2020, 583, 124629. [Google Scholar] [CrossRef]
  34. Wei, G.H.; Lue, H.S.; Crow, W.T.; Zhu, Y.H.; Wang, J.Q.; Su, J.B. Evaluation of satellite-based precipitation products from imerg v04a and v03d, cmorph and tmpa with gauged rainfall in three climatologic zones in china. Remote Sens. 2018, 10, 30. [Google Scholar] [CrossRef] [Green Version]
  35. Chen, F.R.; Gao, Y.Q.; Wang, Y.G.; Li, X. A downscaling-merging method for high-resolution daily precipitation estimation. J. Hydrol. 2020, 581, 15. [Google Scholar] [CrossRef]
  36. Chen, H.Q.; Yong, B.; Gourley, J.J.; Liu, J.F.; Ren, L.L.; Wang, W.G.; Hong, Y.; Zhang, J.Y. Impact of the crucial geographic and climatic factors on the input source errors of gpm-based global satellite precipitation estimates. J. Hydrol. 2019, 575, 1–16. [Google Scholar] [CrossRef]
  37. Amjad, M.; Yilmaz, M.T.; Yucel, I.; Yilmaz, K.K. Performance evaluation of satellite- and model-based precipitation products over varying climate and complex topography. J. Hydrol. 2020, 584, 17. [Google Scholar] [CrossRef]
  38. Wang, L.; Wang, W.J.; Du, H.B.; Wu, Z.F.; Shen, X.J.; Ma, S. Decreasing precipitation occurs in daily extreme precipitation intervals across china in observations and model simulations. Clim. Dynam. 2020, 54, 2597–2612. [Google Scholar] [CrossRef]
  39. Li, L.; Hu, Q.; Huang, Y.; Wang, Y.; Cui, T.; Cao, S. Monitoring and analysis of the extreme heavy rainfall process on june 10, 2017 in nanjing using five near real time satellite rainfall estimations. Plateau Meteorol. 2018, 37, 806–814. [Google Scholar]
  40. Yang, M.X.; Liu, G.D.; Chen, T.; Chen, Y.; Xia, C.C. Evaluation of gpm imerg precipitation products with the point rain gauge records over sichuan, china. Atmos. Res. 2020, 246, 12. [Google Scholar] [CrossRef]
  41. Zhang, X.B.; Aguilar, E.; Sensoy, S.; Melkonyan, H.; Tagiyeva, U.; Ahmed, N.; Kutaladze, N.; Rahimzadeh, F.; Taghipour, A.; Hantosh, T.H.; et al. Trends in middle east climate extreme indices from 1950 to 2003. J. Geophys. Res.-Atmos. 2005, 110, 12. [Google Scholar] [CrossRef]
  42. Camarasa-Belmonte, A.M.; Butron, D. Estimation of flood risk thresholds in mediterranean areas using rainfall indicators: Case study of valencian region (spain). Nat. Hazards 2015, 78, 1243–1266. [Google Scholar] [CrossRef]
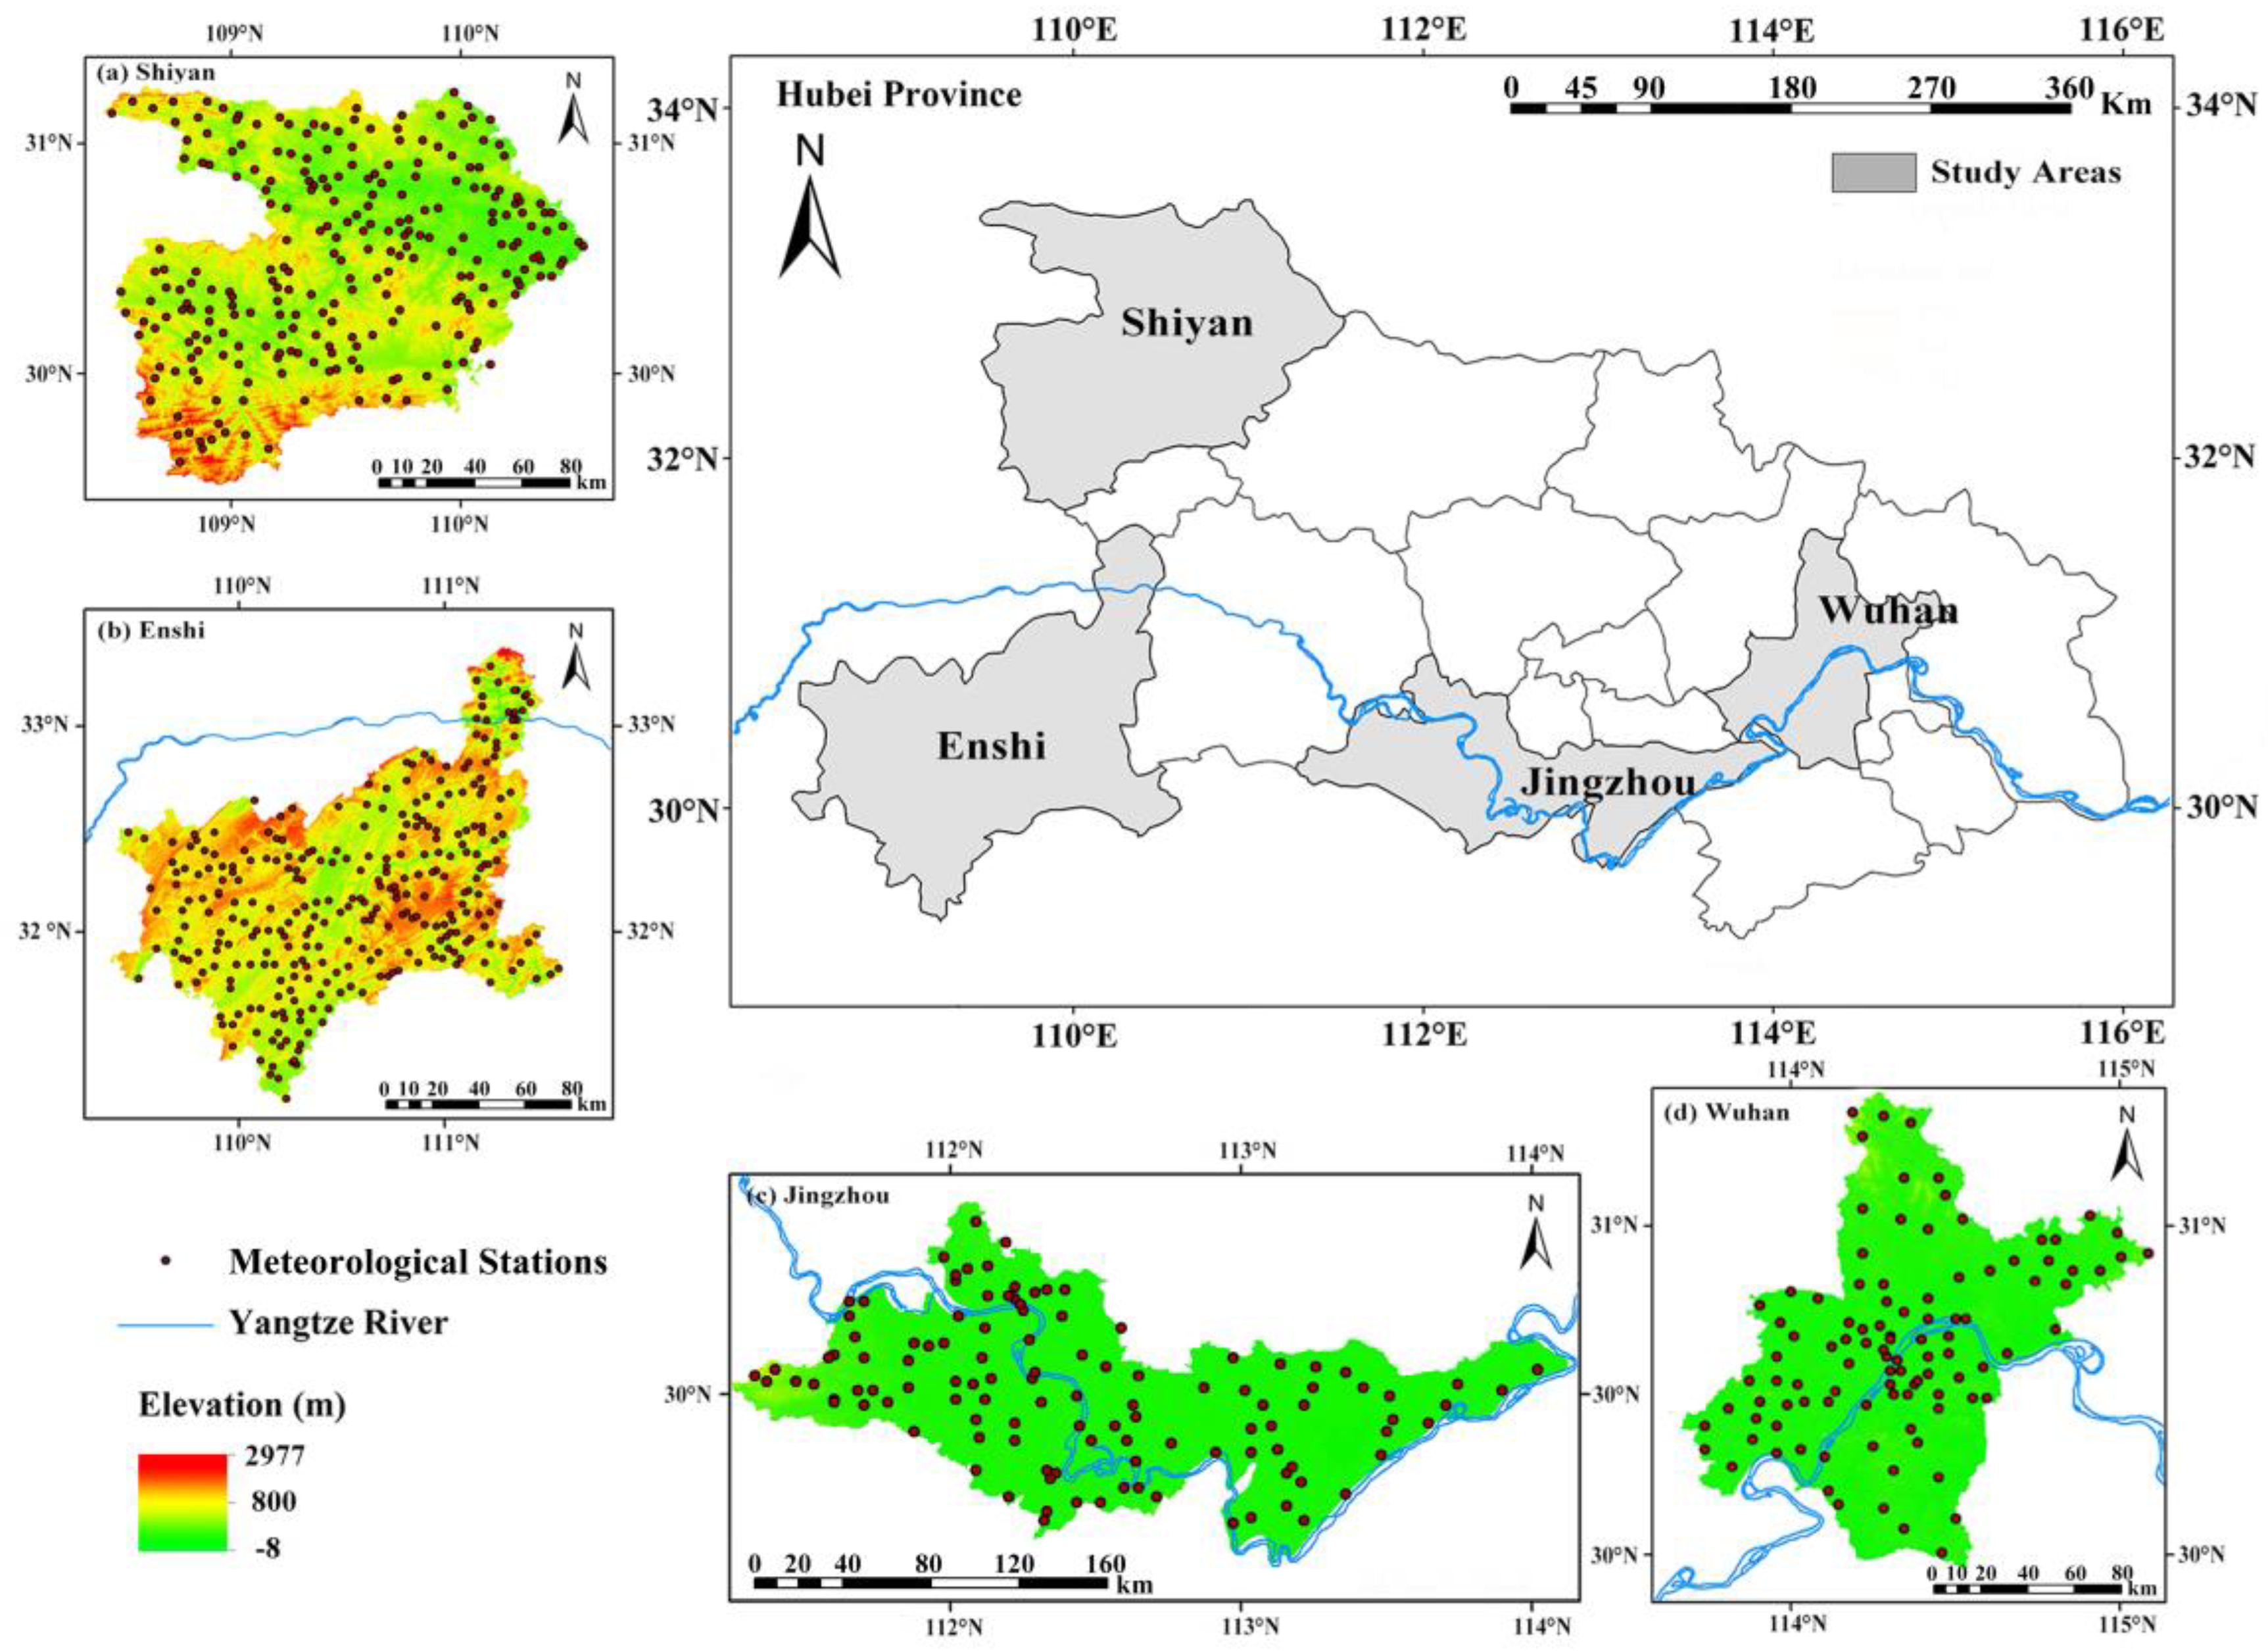
Figure 1. Location of the Shiyan (a), Enshi (b), Jingzhou (c), and Wuhan (d) regions in Hubei province and spatial distribution of the meteorological ground stations in each region.
Remotesensing 13 00689 g001
Figure 2. Spatial distribution of mean daily precipitation for gauges (a,e,i,m), IMERG-E (b,f,j,n), IMERG-L (c,g,k,o), and IMERG-F (d,h,l,p) over four regions and periods during the four extreme precipitation events, which are Event 1 (ad), Event 2 (eh), Event 3 (il), and Event 4 (mp).
Remotesensing 13 00689 g002
Figure 3. Average hourly precipitation of the three IMERG precipitation products and gauge-based precipitation data in Event 1 over Enshi (a), Hefeng (b), and Jianshi (c) regions between 18 and 20 July 2016.
Remotesensing 13 00689 g003
Figure 4. Average hourly precipitation of the three IMERG precipitation products and gauge-based precipitation data in Event 2 over Jingzhou (a) and Jianli (b) regions between 9 and 13 June 2016.
Remotesensing 13 00689 g004
Figure 5. Average hourly precipitation of the three IMERG precipitation products and gauge-based precipitation data in Event 3 over Shiyan (a) and Fangxian (b) regions between 23 and 24 June 2016.
Remotesensing 13 00689 g005
Figure 6. Average hourly precipitation of the three IMERG precipitation products and gauge-based precipitation data in Event 4 over Wuhan (a) region between 30 June and 6 July 2016, Jiangxia (b) between 30 June and 2 July 2016, and Caidian (c) between 5 and 6 July 2016.
Remotesensing 13 00689 g006
Figure 7. Statistical metrics for daily precipitation from IMERG-E (a,d,g,j), IMERG-L (b,e,h,k), and IMERG-F (c,f,i,l) compared with the gauge-based precipitation data for Event 1 (a,b,c), Event 2 (d,e,f), Event 3 (g,h,i), and Event 4 (j,k,l). The red dotted line denotes the 1:1 line.
Remotesensing 13 00689 g007
Figure 8. Statistical metrics for hourly precipitation from IMERG-E (a,d,g), IMERG-L (b,e,h), and IMERG-F (c,f,i) compared with the gauge-based precipitation data over Enshi (a,b,c), Hefeng (d,e,f), and Jianshi (g,h,i) in Event 1. The red dotted line denotes the 1:1 line.
Remotesensing 13 00689 g008
Figure 9. Statistical metrics for hourly precipitation from IMERG-E (a,d), IMERG-L (b,e), and IMERG-F (c,f) compared with the gauge-based precipitation data over Jingzhou (a,b,c) and Jianli (d,e,f) in Event 2. The red dotted line denotes the 1:1 line.
Remotesensing 13 00689 g009
Figure 10. Statistical metrics for hourly precipitation from IMERG-E (a,d), IMERG-L (b,e) and IMERG-F (c,f) compared with the gauge-based precipitation data over Shiyan (a,b,c) and Fangxian (d,e,f) in Event 3. The red dotted line denotes the 1:1 line.
Remotesensing 13 00689 g010
Figure 11. Statistical metrics for hourly precipitation from IMERG-E (a,d,g), IMERG-L (b,e,h), and IMERG-F (c,f,i) compared with the gauge-based precipitation data over Wuhan (a,b,c), Jiangxia (d,e,f), and Caidian (g,h,i) in Event 4. The red dotted line denotes the 1:1 line.
Remotesensing 13 00689 g011
Figure 12. Mean absolute difference between the mean cumulative precipitation from gauge-based precipitation data and from IMERG precipitation products, which includes IMERG-E (a,d,g,j), IMERG-L (b,e,h,k), and IMERG-F (e,f,i,l) over four regions: Enshi (a,b,c), Jingzhou (d,e,f), Shiyan (g,h,i), and Wuhan (j,k,l).
Remotesensing 13 00689 g012
Figure 13. The correlation coefficient (CC) for different accumulation periods from IMERG-E, IMERG-L, and IMERG-F compared with the gauge-based precipitation data in areas of complex topography (Enshi (a) and Shiyan (c)) and less complex topography (Jingzhou (b) and Wuhan (d)).
Remotesensing 13 00689 g013
Figure 14. Average cumulative precipitation observed by three IMERG precipitation products and gauge-based precipitation data, which for different accumulation periods over Enshi (a), Jingzhou (b), Shiyan (c), and Wuhan (d).
Remotesensing 13 00689 g014
Table 1. Information about the main regions during the four different extreme precipitation events.
EventRegionTimeLongitudeLatitudeNumber of StationsRainfall Centers
Event 1Enshi18–20 July 2016109.08°–109.98°E29.83°–30.65°N260Hefeng, Jianshi
Event 2Jingzhou9–13 June 2017111.25°–114.08°E29.43°–31.62°N114Jianli
Event 3Shiyan23–24 June 2016109.48°–111.27°E31.50°–33.53°N260Fangxian
Event 4Wuhan30 June–6 July 2016113.68°–115.08°E29.97°–31.37°N102Jiangxia, Caidian
Table 2. Definition of the hit, false, and missed for different precipitation thresholds.
IMERG Precipitation Estimates
in Threshold Interval
IMERG Precipitation Estimates
Not in Threshold Interval
Gauges in
Threshold Interval
Hit (H)Missed (M)
Gauges Not in
Threshold Interval
False (F)
Table 3. Statistical metrics of three IMERG precipitation products (IMERG-E, IMERG-L, and IMERG-F) against gauge-based precipitation data on the hourly scale in four different events.
EventRegionProductCCRMSE (mm)BIAS (%)
Event1EnshiIMERG-E0.633.33−43.74
IMERG-L0.613.38−42.11
IMERG-F0.613.38−28.25
HefengIMERG-E0.524.77−51.19
IMERG-L0.554.65−48.51
IMERG-F0.564.60−45.10
JianshiIMERG-E0.753.43−47.39
IMERG-L0.743.46−44.45
IMERG-F0.763.25−36.68
Event2JingzhouIMERG-E0.382.2110.92
IMERG-L0.382.1816.02
IMERG-F0.342.2712.81
JianliIMERG-E0.461.9720.99
IMERG-L0.432.0726.82
IMERG-F0.431.9915.11
Event3ShiyanIMERG-E0.492.4411.57
IMERG-L0.472.6824.50
IMERG-F0.492.075.35
FangxianIMERG-E0.634.1060.27
IMERG-L0.624.3775.23
IMERG-F0.642.6811.30
Event4WuhanIMERG-E0.634.54−15.67
IMERG-L0.644.48−11.36
IMERG-F0.624.60−12.64
JiangxiaIMERG-E0.414.7921.25
IMERG-L0.464.5217.25
IMERG-F0.424.6011.90
CaidianIMERG-E0.546.70−28.04
IMERG-L0.566.46−10.61
IMERG-F0.586.52−35.01
Table 4. Categorical metrics of IMERG-E, IMERG-L, and IMERG-F for four precipitation intensity levels in Event 1.
MetricsPrecipitation IntensityIMERG-EIMERG-LIMERG-F
PODLight rain0.710.710.75
Moderate rain0.620.610.62
Heavy rain0.150.200.24
Rainstorm0.550.510.76
CSILight rain0.330.290.35
Moderate rain0.210.220.28
Heavy rain0.100.120.18
Rainstorm0.520.470.68
FARLight rain0.620.670.60
Moderate rain0.760.750.67
Heavy rain0.800.780.60
Rainstorm0.100.120.12
Table 5. Categorical metrics of IMERG-E, IMERG-L, and IMERG-F for four precipitation intensity levels in Event 2.
MetricsPrecipitation IntensityIMERG-EIMERG-LIMERG-F
PODLight Rain0.460.460.52
Moderate Rain0.540.340.39
Heavy Rain0.340.370.37
Rainstorm0.230.300.21
CSILight Rain0.410.380.45
Moderate Rain0.310.210.24
Heavy Rain0.150.150.15
Rainstorm0.200.230.18
FARLight Rain0.210.310.24
Moderate Rain0.570.670.61
Heavy Rain0.780.800.80
Rainstorm0.420.480.47
Table 6. Categorical metrics of IMERG-E, IMERG-L, and IMERG-F for four precipitation intensity levels in Event 3.
MetricsPrecipitation IntensityIMERG-EIMERG-LIMERG-F
PODLight rain0.650.610.57
Moderate rain0.360.320.49
Heavy rain0.190.190.38
Rainstorm0.490.620.14
CSILight rain0.540.500.53
Moderate rain0.170.150.22
Heavy rain0.130.130.20
Rainstorm0.270.330.11
FARLight rain0.230.250.14
Moderate rain0.760.790.72
Heavy rain0.720.720.70
Rainstorm0.620.580.62
Table 7. Categorical metrics of IMERG-E, IMERG-L, and IMERG-F for four precipitation intensity levels in Event 4.
MetricsPrecipitation IntensityIMERG-EIMERG-LIMERG-F
PODLight Rain0.790.930.99
Moderate Rain0.220.300.16
Heavy Rain0.140.190.12
Rainstorm0.790.810.76
CSILight Rain0.420.550.54
Moderate Rain0.140.210.12
Heavy Rain0.070.100.05
Rainstorm0.700.720.68
FARLight Rain0.520.430.46
Moderate Rain0.730.590.72
Heavy Rain0.870.820.91
Rainstorm0.140.130.13
Publisher’s Note: MDPI stays neutral with regard to jurisdictional claims in published maps and institutional affiliations.