Abstract
The desert-oasis ecotone, as a crucial natural barrier, maintains the stability of oasis agricultural production and protects oasis habitat security. This paper investigates the dynamic evolution of the desert-oasis ecotone in the Tarim River Basin and predicts the near-future land-use change in the desert-oasis ecotone using the cellular automata–Markov (CA-Markov) model. Results indicate that the overall area of the desert-oasis ecotone shows a shrinking trend (from 67,642 km2 in 1990 to 46,613 km2 in 2015) and the land-use change within the desert-oasis ecotone is mainly manifested by the conversion of a large amount of forest and grass area into arable land. The increasing demand for arable land for groundwater has led to a decline in the groundwater level, which is an important reason for the habitat deterioration in the desert-oasis ecotone. The rising temperature and drought have further exacerbated this trend. Assuming the current trend in development without intervention, the CA-Markov model predicts that by 2030, there will be an additional 1566 km2 of arable land and a reduction of 1151 km2 in forested area and grassland within the desert-oasis ecotone, which will inevitably further weaken the ecological barrier role of the desert-oasis ecotone and trigger a growing ecological crisis.
1. Introduction
The spatial interface between two or more ecological regions and their material, energy, and structural and functional systems is called an ecotone or an ecological ecotone [1]. The desert-oasis ecotone is distributed along the periphery of an oasis and is characterized by a zone of desert vegetation that separates the extensive desert from the oasis [2]. The ecotone records the interaction and mutual transformation between the desert and oasis ecosystems [3] and serves as an ecological link connecting the two. A desert-oasis ecotone is a unique ecosystem between a desert and an oasis, usually characterized by low diversity, sparse cover, and dominance by perennial herbaceous grasses and semi-shrubs, such as Phragmites australis, Tamarix ramosissima, Karelinia caspia, and Alhagi sparsifolia. The ecotone can be used for ranching (of both livestock and wild animals); its vegetation can also increase the roughness of the underlying ground surface, thereby hindering the development of desertification and protecting the oasis from wind erosion and sand deposition [4,5,6,7]. At the same time, the desert-oasis ecotone is the interface between the oasis ecosystem and the desert ecosystem where energy, material, and information exchange occurs [8], which is highly sensitive to external environmental and human disturbances, affected easily by human activities, including the expansion of cultivated land and urbanization and precipitation [9]. A desert-oasis ecotone being a natural ecological barrier that prevents the desert from expanding into the oasis, its analysis provides an important indicator and an early warning of ecological changes. The desert-oasis ecotone also plays a large role in the development of the oasis economy. Therefore, the ecotone has been a topic of significant research in recent years. Previous research on this ecotone primarily focuses on characterizing and classifying the vegetation diversity, microclimate, and soil moisture, among other parameters in the ecotone and/or oasis [8,10,11,12]. The comparison of these studies has partially revealed the causes of formation and the ecological environment of ecotones in deserts and oases of different arid areas, thus providing the empirical basis for the ecological protection of desert-oasis ecotones.
The observed changes and development of ecotones are closely related to the dynamic evolution of the overall environment and climate of the region, as well as human influencing factors. Maintaining the stability and development of oases requires a comprehensive analysis of long-term trends and of the causes of the changes in the ecotone as well as within the entire basin. However, such studies are generally lacking. Previous studies have also shown that changes in the ecotone are closely related to changes in land-use type, which provides research ideas for predicting future changes in the ecotone. Thus, the future dynamic evolution of the ecotone can be inferred by predicting land-use changes.
There are many methods of simulating and predicting the evolution of land-use patterns, such as system dynamics, CLUE-S, artificial neural network (ANN), and cellular automata–Markov chain (CA-Markov) methods [13,14,15,16]. The system dynamics model is based on cybernetics, information theory, and system theory to analyze the drivers of land-use change. At present, the system dynamics simulation software STELLA has not been fully combined with the spatial analysis function of GIS to implement land-use change simulation and has not played its role as a powerful dynamics system. [17]. The CLUE-S model has limitations, and the setting of some parameters in the model mainly relies on expert knowledge, which will bring a high degree of subjectivity [13]. The ANN simulation of land-use change requires long simulation times, and the method does not provide the user with a specific evolution formula and contains large errors [18]. The CA-Markov model not only retains the advantages of the Markov model for long-term prediction but also integrates the ability of the cellular automata (CA) model to simulate complex spatiotemporal system changes. Thus, the CA-Markov model can better simulate land-use changes in time and space and has been widely used [19,20,21].
In the Tarim River Basin, artificial oasis [22] and desertification processes are increasing [23]. As a result, the desert-oasis ecotone has rapidly decreased in size and ecological concerns have become increasingly prominent. Meanwhile, the rapid advancement of urbanization in the Tarim River Basin, as well as the continuous development of the social economy, has led to significant changes in the pattern of land use, which have produced a series of impacts on the ecological environment of the ecotone.
The main purposes of this study are (1) to analyze the spatial and temporal variability and driving forces of the desert-oasis ecotone in the Tarim River Basin from 1990 to 2015, (2) to evaluate the applicability of the CA-Markov model, and (3) to further predict the near-future land-use changes in the Tarim River Basin. This study will deepen our knowledge of the evolution of the desert-oasis ecotone, which has important implications for the protection of the ecological environment in the arid zone and the construction of an ecological civilization in the Silk Road Economic Belt.
2. Study Area
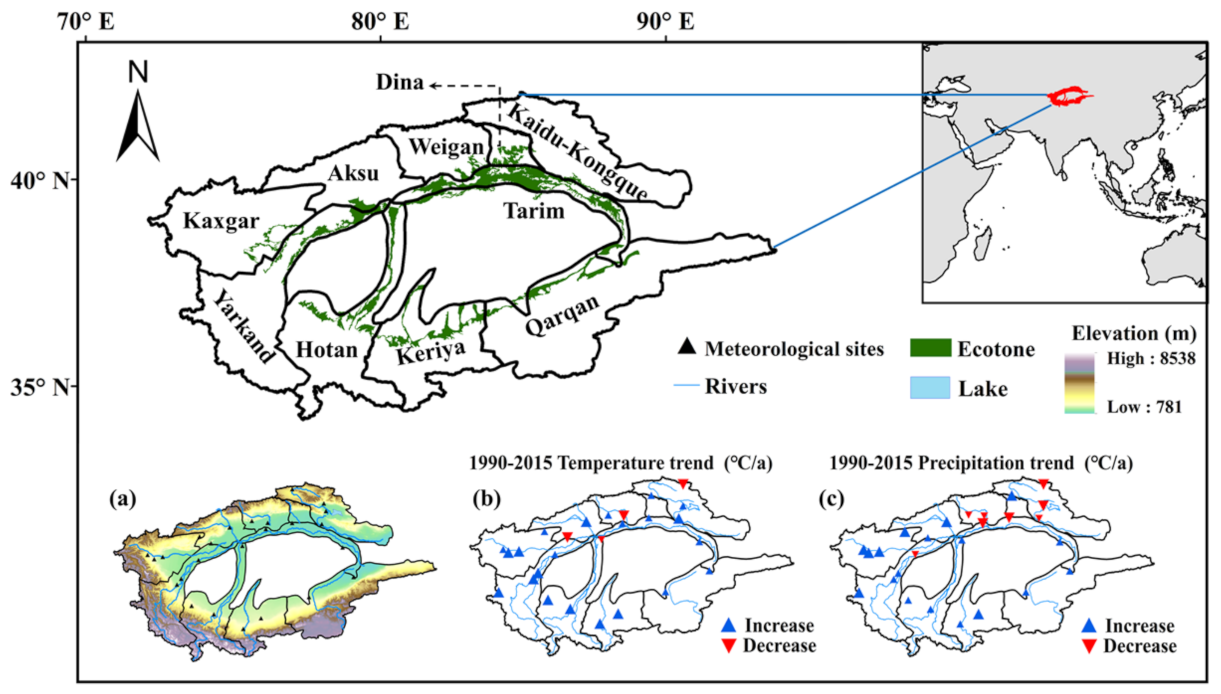
The Tarim River Basin is an inland basin located far from the ocean in northwest China (Figure 1). The area is characterized by a temperate arid continental climate with scarce precipitation and strong evaporation. In the study area, the average annual precipitation is about 53.14 mm, while the annual potential evaporation is much higher, about 2196 mm. The average annual temperature is about 3.9℃, which is typical of an inland arid climate. The basin covers an area of 1.02 × 10⁶ km2 and is the largest inland river basin in China (Figure 1). In response to the global climate change and increasing human activities, the natural ecosystems in the basin are facing a series of crises and challenges. Its fragile ecological environment possesses abundant natural resources [24]. The drainage network in the basin consists of the main stream of the Tarim River and 144 drainage systems associated with nine major tributary basins: the Yarkand River, the Aksu River, the Kaidu-Kongque River, the Hotan River, the Kaxgar River, the Weigan River, the Dina River, the Keriya River, and the Qarqan River. The tributaries to the main stream of the Tarim River form a centripetal shape around the Tarim Basin [25]. The Tarim River is a dissipative inland river whose runoff is mainly supplied by meltwater from glaciers and snow. The sources of the Tarim River runoff include glacial melt water, accounting for 48.2%; precipitation in the form of rain and snow, accounting for 27.4%; and river base flow, accounting for 24.4% of the total [26,27]. The Tarim River Basin is a typical oasis agricultural production area in China; the oasis area in the basin has been increasing, and arable land has increased during the past 30 years. This has led to a shortage of water in the basin, which is mainly used for agriculture. The demand for agricultural irrigation water is large and accounts for about 96% of the total water use in the Tarim River Basin [28].
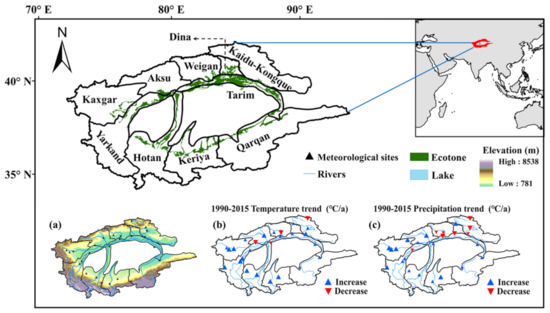
Figure 1.
Map of the study area showing the Tarim River Basin and its nine main tributary river basins: the Kaidu-Kongque, Aksu, Weigan, Yarkand, Qarqan, Dina, Hotan, Kaxgar, and Keriya river basins; (a) the elevation of this area ranges from 781 to 8538 m above sea level; the spatial and temporal distribution of (b) temperature and (c) precipitation changes from 1990 to 2015. The black triangles represent the meteorological stations. Blue and red represent the increase and decrease, respectively, and the size of the triangle represents the magnitude of the change.
3. Materials and Methods
3.1. Materials
To analyze the dynamic evolution of the Tarim River Basin and its ecotone, and the factors controlling the observed changes, this article mainly uses remote sensing, land use, and meteorological data collected between 1990 and 2015. The analyzed historical trends in such parameters as the area of land-use transfer were subsequently used to extrapolate and predict the potential future changes in the study area.
3.1.1. Remote Sensing Data
Landsat 5 Thematic Mapper (TM)/Landsat 7 Enhanced Thematic Mapper (ETM) +/Landsat 8 Operational Land Imager (OIL) satellite imagery from 1990, 2000, and 2015 (a total of 78 pieces, Table S1) was used in this study. The acquisition time was from June to September of each year. The cloud cover was less than 10%, and the pixel resolution of the data set was 30 m × 30 m. The ENVI 5.3 software was used to perform radiometric calibration, atmospheric correction, and Normalized Difference Vegetation Index (NDVI) extraction calculations on the remote sensing images.
3.1.2. LUCC Data
The land-use data set for the Tarim River Basin was obtained from the existing remote sensing monitoring data set of land use in China. It was provided by the Data Center for Resources and Environmental Sciences, Chinese Academy of Sciences (http://www.resdc.cn). In this paper, we used three periods of Chinese land-use data (30 m × 30 m), collected in 1990, 2000, and 2015. The database offers the most comprehensive coverage of China’s land use/land cover and has been used in a number of published studies [29,30]. The land-use types were classified into six categories: arable land, forest, grassland, water, built-up land, and unused land (Table S2).
3.1.3. Meteorological Data
Monthly scale meteorological information on temperature, precipitation, wind speed, humidity, and pressure from 1990 to 2015 for 26 meteorological stations in the Tarim River Basin were used to describe the recent changes in climatic conditions. The meteorological data were obtained from the China Meteorological Science Data Sharing Service Network, which have good continuity and has been tested for consistency. Station selection required the following: (1) the station was a national ground meteorological station, and (2) missing data accounted for less than 1% of the total data.
3.1.4. Groundwater Data
We selected groundwater-level data from the Yarkand, Kaxgar, and Weigan river basins. Three groundwater monitoring wells were selected for each basin. Groundwater data for the Yarkand River Basin (2004–2010) were obtained from the Kaxgar Hydrological Bureau, and the groundwater data for the Weigan River Basin (2000–2012) and the Kaxgar River Basin (2004–2010) were obtained from groundwater monitoring wells deployed by the Xinjiang Institute of Ecology and Geography of the Chinese Academy of Sciences for multi-year actual measurements.
3.2. Methods
3.2.1. NDVI Calculation
Vegetation indices are often used for vegetation analysis [31,32,33] and are typically formed by combining certain bands of image spectral data that possess vegetation-sensitive properties. Widely used vegetation indices include simple vegetation indices, ratio vegetation indices, NDVI, and transformed normalized vegetation indices [33,34]. The NDVI was used as the analysis index. It was calculated as follows:
where NIR is the TM near-infrared band value and R is the TM visible-red band value. The range of the image element values was -1 ≤ NDVI ≤ 1. Negative values indicate that the ground cover consists of clouds, water, snow, etc.; 0 indicates the occurrence of rock or bare soil; positive values indicate that there is vegetation cover, and the values increase with increasing coverage.
ENVI 5.3 was used to perform radiometric calibration, atmospheric correction, and mosaic and other processing of the Landsat images. The NDVI calculation tools were used to calculate and output images from the three selected years separately. The calculation results were then loaded into ArcGIS10.6, which was used to eliminate outliers. The GIS raster calculator was used to extract the desert-oasis ecotone.
Sun et al. (2020) indicated that when the NDVI is between 0.05 and 0.35, the scope of the delineated ecotone can match the actual scope of the ecotone to a greater extent [35]. On this basis, we also combined visual interpretation and field verification to exclude the artificial protection forest and arable land in this range, and with this criterion, the desert-oasis ecotones of the Tarim River Basin in 1990, 2000, and 2015 were obtained.
3.2.2. Land-Use Transfer Matrix
This research quantitatively studied the conversion between land-use types in different years. ArcGIS and MATLAB were used to process the land-use TIFF data from the study area and to calculate the land-use transfer matrix from 1990 to 2015.
The land-use transition matrix was derived from system analysis and was used to quantitatively describe the mutual feedback relationship between the system state and the state transition. Put differently, the matrix describes the change in conditions of the system from time T to time T + 1 [36]. At present, it is widely used to describe the internal characteristics of the transfer structure and transfer direction of land-use/land-cover changes in basins. This method can not only describe the structural characteristics of the land-use area within a period of time but also effectively describes the transfer area and transfer direction of various land-use types at the beginning and the end of the period, as follows:
where S is the area; i and j (i, j = 1,2..., n) are the land-use type before and after transfer, respectively; is the area where land use changes from type i to type j; and n is the number of land-use types before and after the transfer.
3.2.3. The Standardized Precipitation Evapotranspiration Index
The Standardized Precipitation Evapotranspiration Index (SPEI) is widely used in global and regional drought detection and characterization [37,38,39,40]. This study used monthly site data and the Penman–Monteith formula to calculate differences in potential evapotranspiration, which were needed to calculate the SPEI. Specifics of the calculation can be found in Allen et al. [2].
A positive SPEI value indicates a relatively wet condition, whereas a negative SPEI value indicates a dry state. An SPEI value between -0.5 and 0.5 indicates normal condition. In this study, SPEIs at 3-month, 6-month, 9-month, and 12-month timescales were used for analysis. The ranges of SPEI values were divided into five classes according to the national meteorological drought scale (Table S3).
3.2.4. The CA-Markov Model
The CA-Markov model was used herein to simulate and predict future land use in the Tarim River Basin. The Markov model is a method for predicting the probability of occurrence at a specified time based on the Markov chain process theory. It is often used for the prediction of geographic events with no after-effect characteristics [41,42]. The evolution of land use has the nature of the Markov process. In fact, land-use type corresponds to the “possible state” of the Markov process, and the area or ratio of the conversion between land-use types can be represented as a state transition probability matrix [43]. The model is expressed as follows:
In Equation (3), is the system state at and is the state transition probability matrix.
The cellular automata (CA) model is a lattice dynamics model with discrete time and space states. It focuses on the interaction of different temporal and spatial characteristic cells and has powerful spatial calculation and simulation capabilities [44,45]. In terms of land-use prediction, the Markov model focuses on the prediction of the amount of land-use change but it cannot spatially express the spatial distribution of the various types of land-use changes. The cellular automata model can express the spatiotemporal dynamic evolution of complex spatial systems, thereby making up for the deficiency in the Markov model [46].
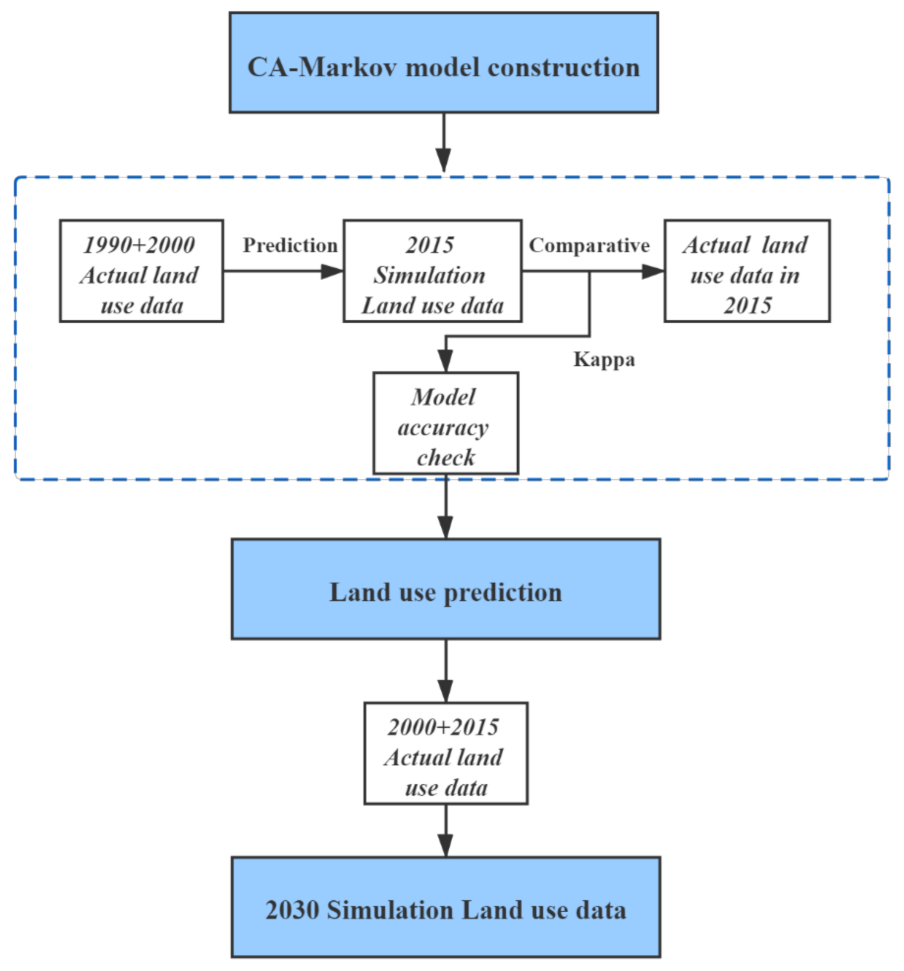
This study applied the CA-Markov model in the Idrisi 17.0 software to land-use data collected in 1990, 2000, and 2015. The first step in the approach used the 2000 data as the starting year and predicted the land use in 2015. The land-use predictions were then compared with the actual land use in 2015 to verify the reliability of the CA-Markov model simulation. Once verified, the spatial patterns in land use in 2030 were predicted using 2015 as the starting year (Figure 2). The images involved in the processing of the Idrisi software are portrayed as raster data, and the land raster size used in this analysis was 30 30 m. The spatial data processing was completed using ArcGIS software.
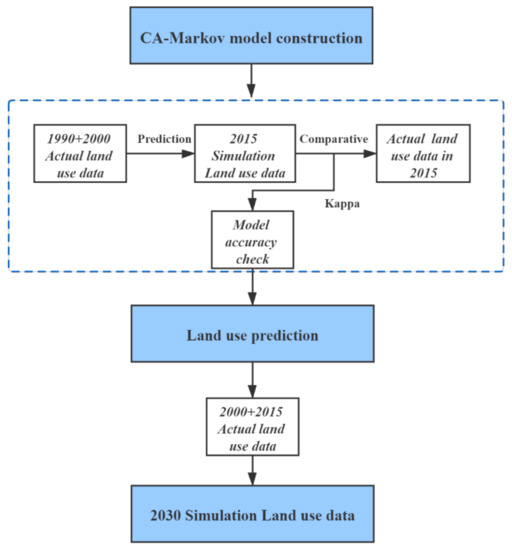
Figure 2.
Flow chart showing primary steps in the simulation process.
3.2.5. The Kappa Index
The Kappa index is often used to interpret remote sensing accuracy and to evaluate the similarity of two spatial maps. The Kappa index was used in this study to verify the accuracy of the CA-Markov model for simulating the evolution of land use in each tributary basin [47]. The index is calculated as follows:
where is the proportion of the raster that is correctly simulated, is the desired proportion of correctly simulated raster grid cells, is the proportion of correctly simulated grids for an ideal classification, n is the total number of grids, is the number of grids that are correctly simulated, and N is the number of land-use types (N = 6 in this study). The degree of consistency is weak when the Kappa index is less than 0.2 and significant when the Kappa index is greater than 0.8. A higher Kappa index means a better model simulation. (The detailed relationship between the Kappa index and consistency is shown in Table S4.)
4. Results
4.1. Desert-Oasis Ecotone and Land-Use Changes in the Tarim River Basin
4.1.1. Desert-Oasis Ecotone Changes in the Tarim River Basin
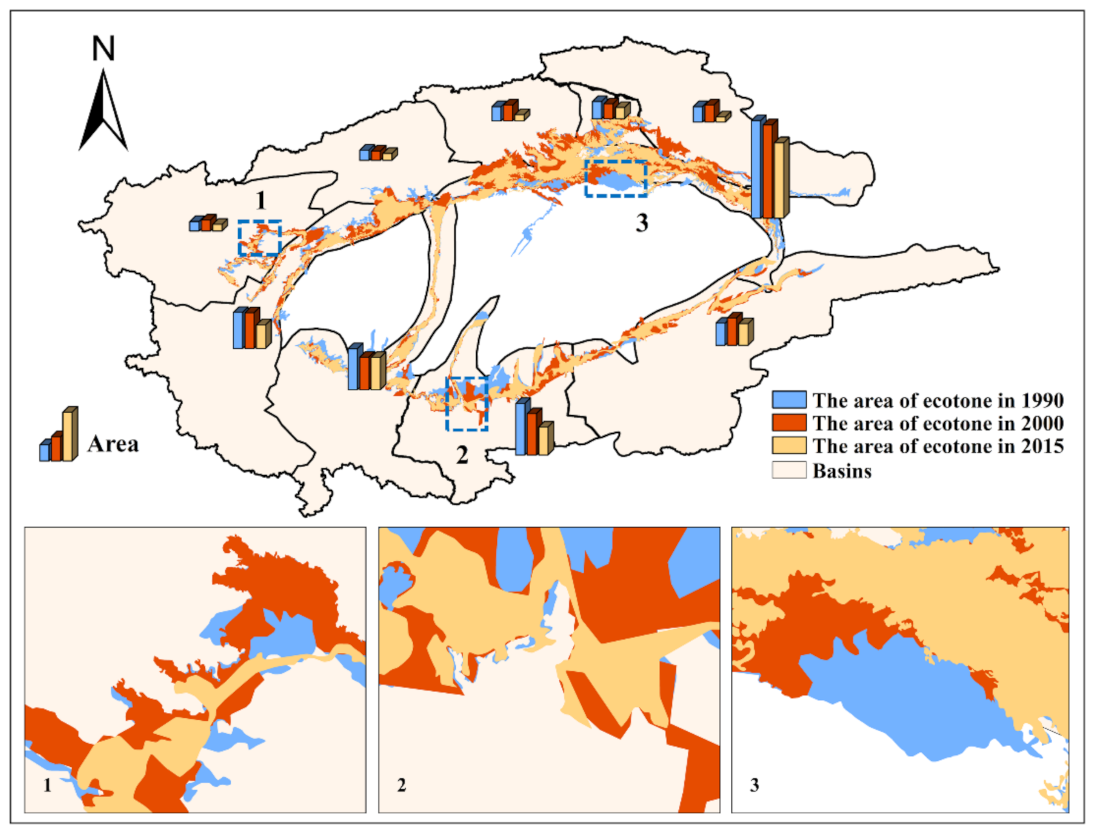
Figure 3 shows the changes in the extent of the desert-oasis ecotone in the Tarim River Basin and its various sub-basins in 1990, 2000, and 2015. The desert-oasis ecotone of the Tarim River Basin declined during this period, decreasing from 67,642 km2 in 1990 to 46,613 km2 in 2015. At the same time, the area of the desert in the study area expanded, with the proportion of desert area increasing from 59.88% in 1990 to 63.36% in 2015.
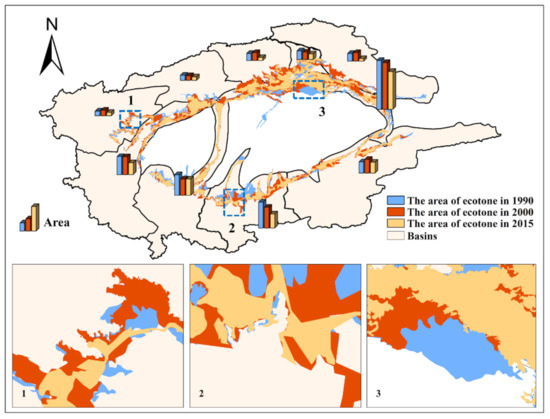
Figure 3.
The areal extent of the ecotone in 1990, 2000, and 2015 in each basin. The lower maps show changes in the local ecotone in (1) the Weigan River Basin, (2) the Keriya River Basin, and (3) the main stream of the Tarim River.
At the sub-basin scale, the area of the ecotone of each sub-basin also decreased by different degrees, among which the three basins with the most significant area reduction were the Kaidu-Kongque, Weigan and Keriya river basins; the areas of reduction were 2223 km2, 1704 km2, and 5090 km2, respectively (Table S5). While the ecotone decreased in size, the vegetation coverage also significantly decreased, as shown by a drop in the NDVI from 0.142 to 0.127. This indicates a deterioration in the desert-oasis ecotone in terms of area and quality between 1990 and 2015.
4.1.2. Land-Use Changes in the Tarim River Basin
The shrinkage of the desert-oasis ecotone in the Tarim River Basin is closely related to the strong land-use changes in the basin in recent decades. Table 1 further describes the area and proportion of each land-use type in the Tarim River Basin in 1990, 2000, and 2015. Overall, from 1990 to 2015, the area of arable land, water bodies, industrial land, and unused land increased. In contrast, the area of grassland decreased, whereas the area of forest land did not significantly change. Unused land was the dominant land-use type in this area (accounting for about 53%), increasing by 1419 km2 in the preceding two decades. Grassland also represented a dominant land-use type in the area. Grasslands decreased from 35.97% in 1990 to 34.60% in 2015; the areal decrease was 8911 km2. These land-use patterns reflect the intensity and nature of human activities; in fact, the expansion of arable land far exceeds the increase in the area of industrial land. Overall, the arable land area expanded drastically from 1990 to 2015, increasing by 7125 km2, while the area of industrial land increased by only 66 km2. The area of water bodies increased from 1990 to 2000 and then slightly decreased from 2000 to 2015. Over the entire period, the area of water bodies increased by 283 km2. Forest land, which occupies a relatively small proportion of the total, exhibited insignificant changes in the area; its relative proportion was stable, at about 1.90%.

Table 1.
Areas and proportions of land-use types in the study area in 1990, 2000, and 2015.
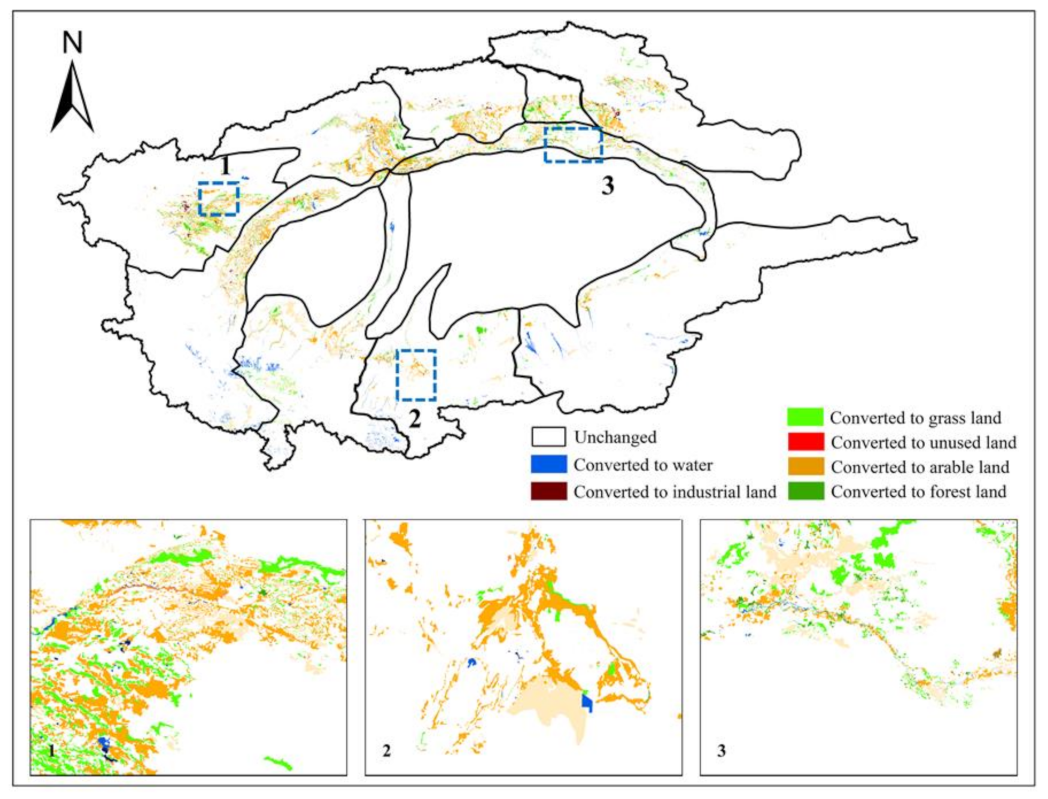
Figure 4 shows the spatial distribution of the interconversion between different land uses in the Tarim River Basin during the period 1990–2015. The increase in arable land in 1990–2015 was mainly in the periphery of the original arable land and oasis and extended to the unused land. The increase in the area of arable land was mainly at the expense of grass land, unused land, and forest land. The increase in unused land was mainly distributed near the location of arable land and original grassland, and its areal expansion mainly came from the degradation of some arable land, forest land, and grassland. The increase in water bodies was mainly distributed in the foothills of the southern edge of the Tarim Basin, such as in the upstream areas of the Hotan and Yarkand river basins, and it was mainly derived from the transformation of grassland (Table S6).
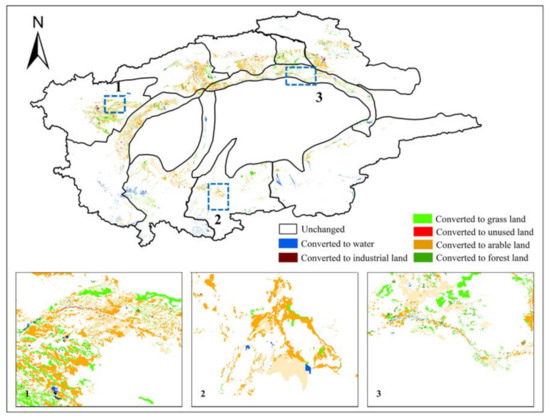
Figure 4.
Land-use transfer map of the Tarim River Basin from 1990 to 2015. The lower maps show the local changes in (1) the Weigan River Basin, (2) the Keriya River Basin, and (3) the main stream of the Tarim River.
4.2. Driving Force Analysis
Changes in the desert-oasis ecotone of the Tarim River Basin are inextricably linked to natural and anthropogenic factors. Therefore, this study investigated the intrinsic causes and drivers of the changes in the desert-oasis ecotone by changes in climatic parameters and anthropogenic activities.
4.2.1. Meteorological Factors
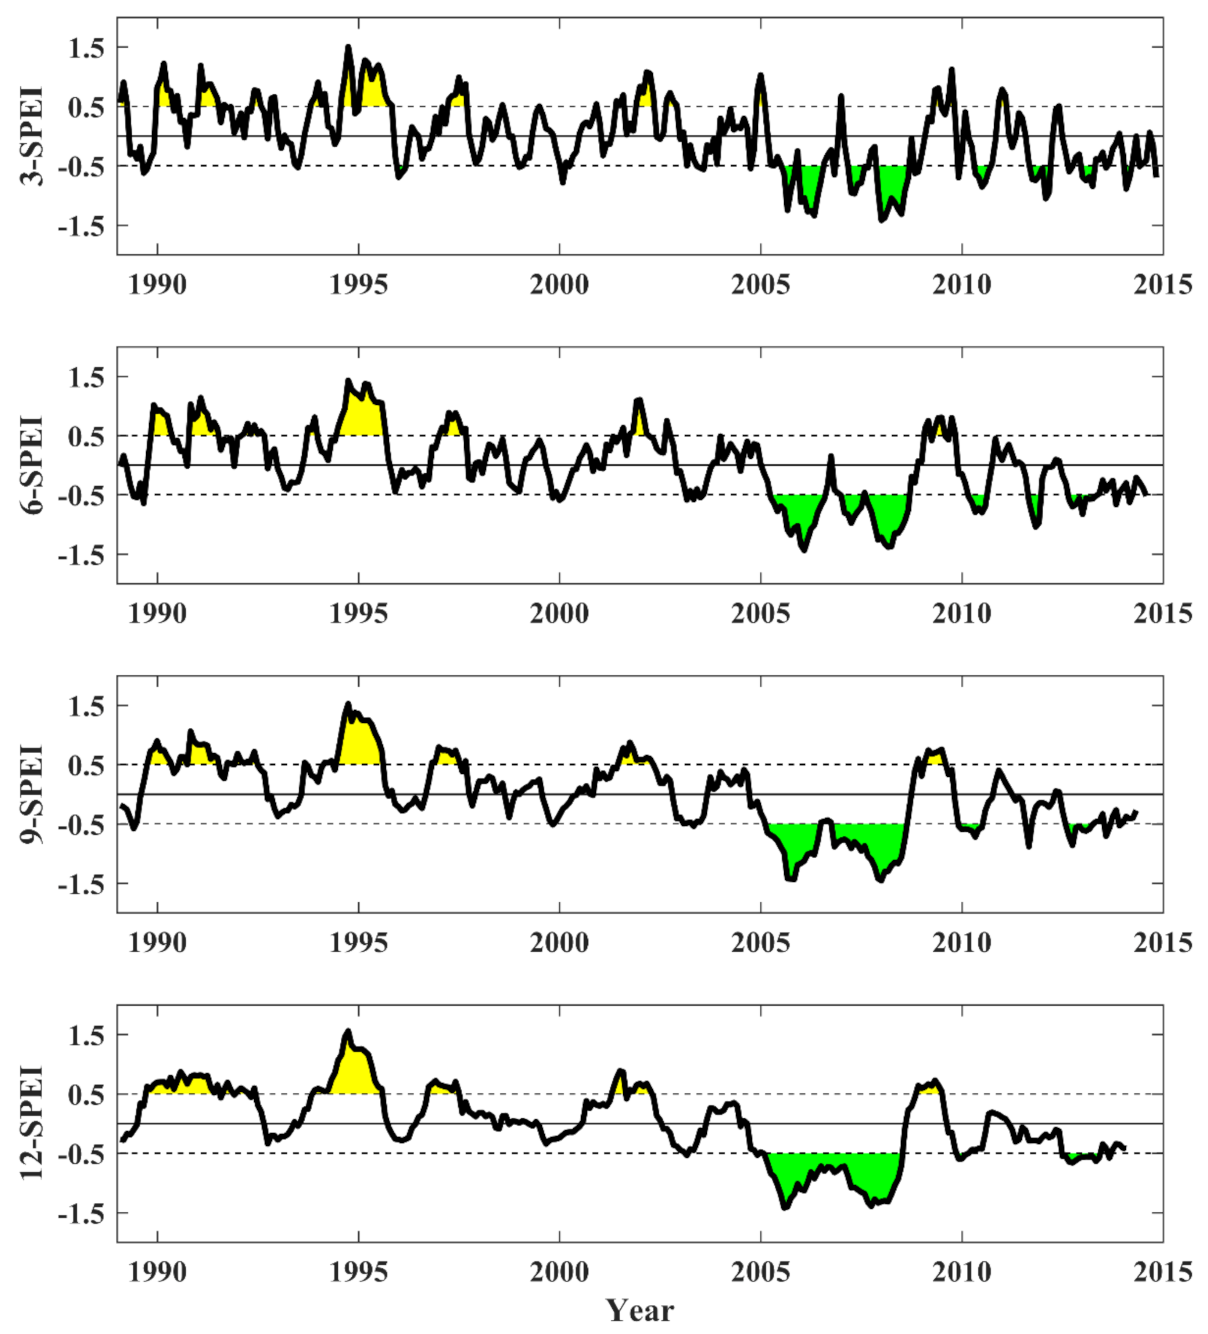
A total of 26 meteorological stations in the Tarim River Basin were selected, and temporal trends in mean annual temperature and annual precipitation were analyzed. Of the total stations, 22 stations exhibited an increase in temperature and 18 stations exhibited an increase in precipitation (Figure 1). Changes in dry and wet conditions were analyzed by calculating the SPEI for different time scales of drought in the Tarim River Basin from 1990 to 2015. At the 3-month, 6-month, 9-month, and 12-month time scales, average SPEI values exhibited a decrease, indicating enhanced aridification in the study area (Figure 5). Moderate droughts occurred in 2006 and 2008. Since 2000, the frequency and severity of droughts have become stronger, suggesting that droughts are an important reason for the accelerated decline in the ecotone after 2000. The results of the analysis also demonstrate that multi-scale SPEI can effectively show the degree of drought and drought duration in the Tarim Basin. SPEI of different scales show different degrees of interannual oscillations and interannual variability, but the overall direction of change was the same; the study area became more arid after 1990.
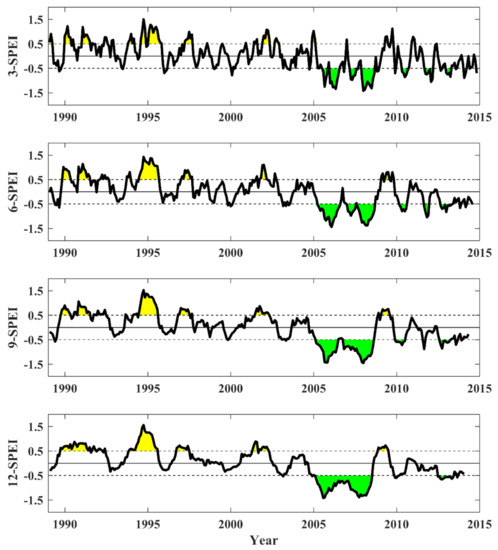
Figure 5.
Time series of the 3-, 6-, 9-, and 12-month SPEI values in Tarim River Basin from 1990 to 2015.
4.2.2. Human Factors: Groundwater Changes
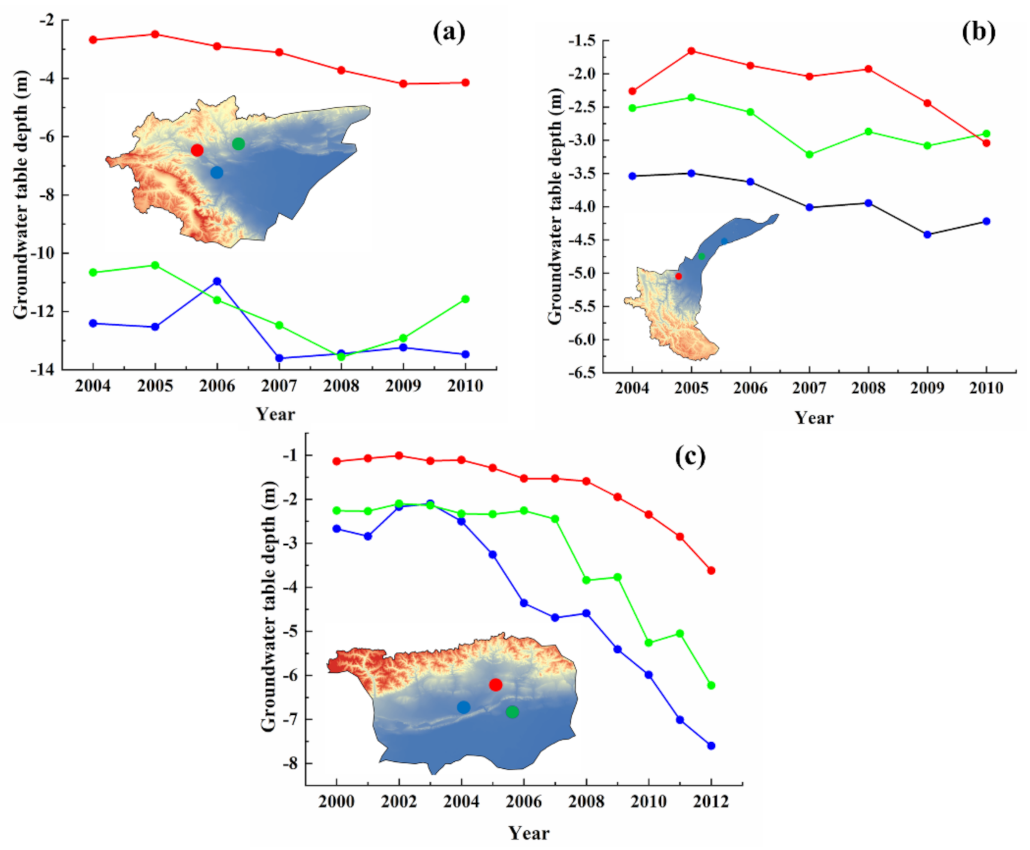
Within the Tarim River Basin, where precipitation is extremely low, groundwater is an important source of irrigation water. With the increase in arable land in the basin, the exploitation of groundwater has also increased. For example, groundwater monitoring data collected in the Yarkand, Kaxgar, and Weigan river basins show that groundwater levels have decreased during the 21st century (Figure 6). The most significant decline has been in the Weigan River Basin, where declines in groundwater levels of up to 2.48 m, 4.93 m, and 3.97 m have been observed. The expansion of oasis cultivation and irrigation in the basin has presumably caused a significant decrease in groundwater levels, which is a key hydrological element for the survival of natural vegetation and directly affects the growth and maintenance of natural vegetation in the desert-oasis ecotone.
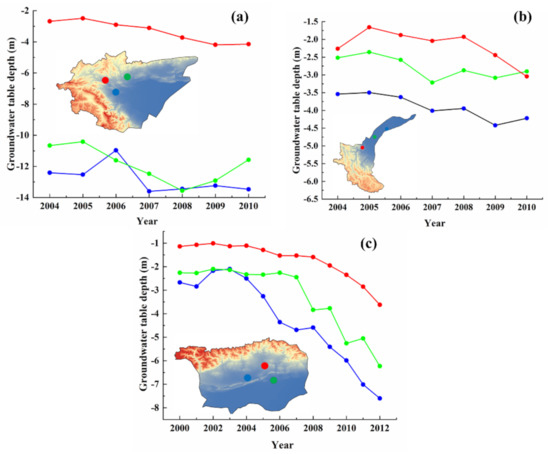
Figure 6.
Changes in the groundwater table in (a) the Kaxgar River Basin, (b) the Yarkand River Basin, and (c) the Weigan River Basin. The dots represent the observation points of the groundwater level, and the fold lines represent the change in the trend of the groundwater level. The color of the fold line is consistent with the color of the observation point of the groundwater level.
4.3. Simulation and Prediction of Land Use in the Ecotone and Its Basin in 2030
4.3.1. Accuracy Verification
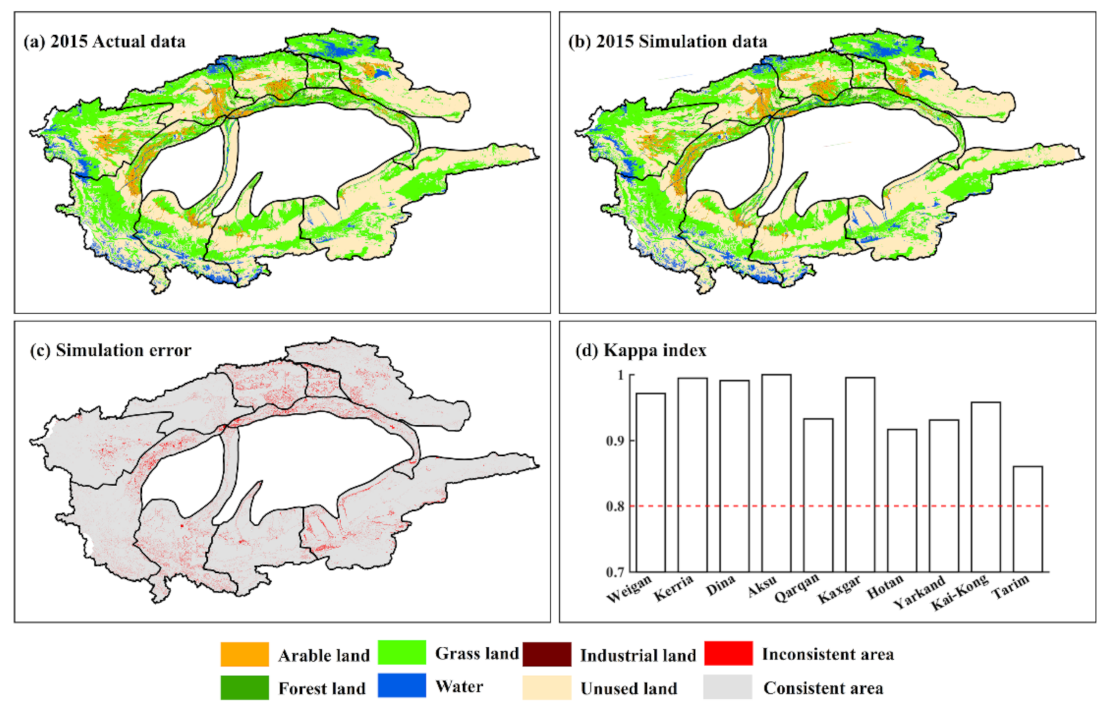
Since the shrinkage of the ecotone is closely related to land-use type changes, we also predicted future land-use changes based on the CA-Markov model in order to understand the future changes of the transition zone. To simulate future land-use changes in the basin, we first validated the accuracy of the 2015 land-use data. Since the desert-oasis ecotone of the Tarim River Basin is included in the whole Tarim River Basin area, we directly validated the accuracy of the simulation of the entire basin. The land-use structure of the study area was simulated and predicted based on the CA-Markov model. Land-use maps in 1990 and 2000 were defined as input data to simulate land use in 2015. Effectiveness of the simulation was assessed using spatial raster contrast in which the land-use type in specific spatial locations was compared to the actual 2015 land-use map.
Figure 7 shows that the simulation error, as determined by inconsistent land-use locations, was 3.62% of the total number of raster cells. Most inconsistencies appeared adjacent to water bodies and forest land. A total of 96.38% of the regions were consistent with the actual map in 2015. The Kappa index of the simulation result was 0.9551, also indicating the high reliability of the result and the CA-Markov model in predicting land-use types. The Kappa index of each sub-basin in the Tarim River Basin exceeded 0.80, which meets the accuracy requirement of the Kappa index.
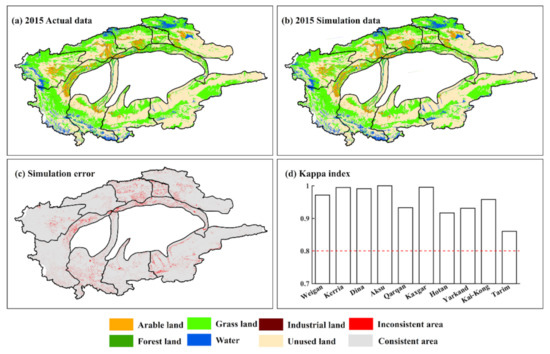
Figure 7.
Comparisons of measured (a) and simulated (b) land-use maps of the Tarim River Basin in 2015, along with verification of forecast accuracy; (c) The simulation error between 1990 and 2015; (d) the Kappa index for each river basin.
The quantitative accuracy of the area of each land type in the simulation was also evaluated by comparing it with the actual area in 2015 (Table 2). The prediction error in 2015 was expressed as the absolute value of the error between the predicted and actual values of each land-use type area. Except for forest land and water bodies, where the error was 6% and 8.56%, respectively, the error in predicting the land-use types was within 5%. The error associated with industrial land and unused land was less than 1%, indicating that the simulation method had a high precision and credibility. Therefore, the CA-Markov model was able to effectively simulate the land-use changes in the study area and can be used to simulate future land use.

Table 2.
Comparison between simulated and actual land use within the study area in 2015.
4.3.2. Forecast of Changes in the Desert-Oasis Ecotone in the Tarim River Basin
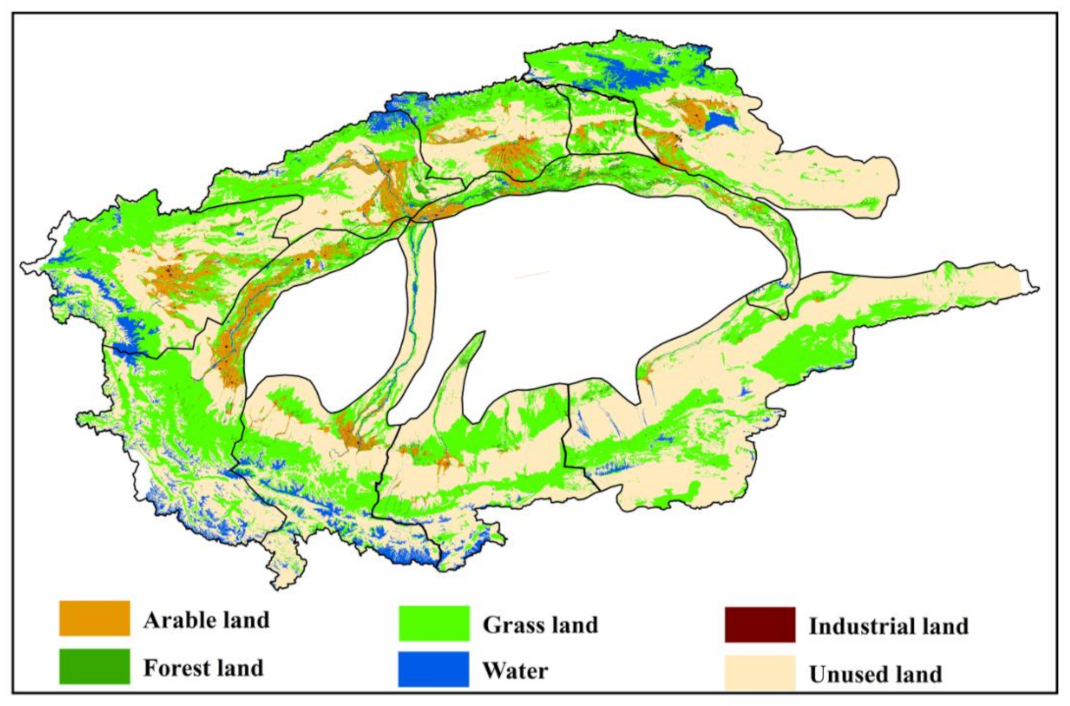
Figure 8 predicts the spatial distribution of land-use change in the Tarim River Basin in 2030 using the CA-Markov model. The prediction suggests that past land-use trends in the Tarim River Basin will continue in 2030 (Table S7). The land type with the greatest change will be arable land, whose area will increase from 31,647 km2 in 2015 to 34,909 km2 in 2030, an increase of 10.31%. The land-use type exhibiting the largest decrease will be grassland (it will decrease by 12,497 km2 compared to 2015), while forest land area, industrial land, water bodies, and unused land will exhibit a small increase. Future projections and simulations of land types within the Tarim River desert-oasis ecotone can infer its ecological status and development trends. This study simulated and predicted land-use changes within the ecotone by 2030, using the 2015 ecotone extent as the boundary. Land-use changes within the ecotone show a similar trend to the entire area. The simulation found that the arable land area in the ecotone will increase significantly, from 1033 km2 in 2015 to 2599 km2 in 2030, while the areas of forest and grassland will decrease by 318 km2 and 833 km2, respectively. As the area of natural vegetation decreases and the arable land increases within the ecotone, the quality of the future ecotone habitats will further deteriorate.
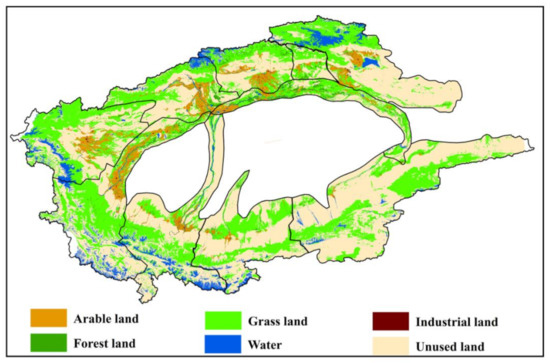
Figure 8.
Land-use in Tarim River Basin in 2030.
5. Discussion
5.1. Criteria for the Classification of the Desert-Oasis Ecotone
There are different approaches to the current delineation of the desert-oasis ecotone. Most scholars define the ecotone as a zone of limited width along the edge of the oasis [48], while others extend the ecotone to the entire foothills or define it as terrain without a clear spatial location [49]. In this study, we found that the usual criteria for delineating the desert-oasis ecotone do not work well in the Tarim River Basin, which consists of a large area composed of many watersheds. As a result, the ecotone is not uniformly distributed. Therefore, the NDVI contour data calculated from the TM images (30 m resolution) were used here, in conjunction with the remote sensing images of land-use/land-cover change in 1990, 2000, and 2015. The land-use type corresponding to the NDVI values in the range between 0.05 and 1 were interpreted to be forest and grassland, whereas the land-use type corresponding to NDVI values between 0.35 and 0.95 were mostly artificial oases organized in neat patterns of blocks and strips. Thus, NDVI values in the range between 0.05 and 0.35 were selected as the desert-oasis ecotone in the Tarim Basin. The results were verified by using ENVI and ACRGIS to interpret, classify, and digitize the images from the three analyzed years, and the results were verified by fieldwork.
5.2. Combined Effect of Climate Change and Human Activities on the Desert-Oasis Ecotone
Analysis of temperature and precipitation in the study area shows that both parameters have increased since 1990 (Figure 1) but the increase in temperature has been much greater than the increase in precipitation. By calculating the SPEI values of the basin for different time scales, we found that there has been an increase in drought conditions in the study area since 2005, especially during the years of 2005, 2006, and 2008, when droughts reaching the moderate level occurred year-round. The increase in droughts, and external climatic changes in general, may be an important reason for the accelerated decrease in the area of the ecotone after 2000. Runoff (flow) in the Tarim River Basin is primarily generated in high mountain areas where glaciers and snowmelt recharge dominate. The input from these water sources is very sensitive to global climate change. The increased hydrological volatility and water resource uncertainty caused by climate change may lead to more prominent conflicts between water supply and demand in the oasis economy and desert ecosystem in the basin [50].
Because of the expansion of arable land, agricultural water consumption remains high. Agricultural water has long been the main form of water in this area. The proportion of agricultural water is too large, and the water structure is seriously imbalanced. The proportion of agricultural water in the basin has long been as high as about 95%, which is much higher than the Chinese average (65%) and the world average (70%). At present, the development of water resources in the Tarim River Basin has greatly exceeded the carrying capacity of regional water resources [28]. For example, the groundwater level in the Kaxgar River Basin dropped by nearly 1 m between 2004 and 2010 and the water crisis has become more prominent [25]. Groundwater overexploitation has led to the degradation of desert vegetation and damage to ecosystems [51]. For instance, the 321 km river cutoff in the downstream reach of the Tarim River has caused shrinkage and even disappearance of oases [52,53]. The reduction in ecological water has also led to a decrease in surface vegetation cover, NDVI, and the area of the desert-oasis ecotone.
5.3. Applicability of the Land-Use Change Model and Future Work
Human influence on land use reflects not only natural factors but also economic and social factors. Therefore, predicting land-use changes is extremely important for promoting natural, economic, and sustainable development and protecting ecological balance. Relevant data show that the irrigated area of the Tarim River Basin has increased by 67% in the last 30 years [53] and the future expansion of cultivated land area will decrease ecological space and ecological water, leading to a shrinkage in the desert-oasis ecotone and a decline in its function as an ecological barrier. Therefore, it is necessary to perform quantitative prediction and analysis of future land-use and pattern changes in the Tarim River Basin. The CA-Markov model is widely used in urban land-use pattern simulation and in the assessment of watershed land-use change; however, the model has rarely been applied in arid areas, especially in areas with complex geographical features combining desert-oasis characteristics. This study experimentally applied and optimized the CA-Markov model using relevant, scientifically selected factors, and improved the simulation accuracy to obtain reliable prediction results. As a case study, it provides a good example and basis for the prediction of land-use change in arid areas.
The model also has a few shortcomings related to the quantification of some factors. For example, the influence of road distance, water body distance, and various administrative policies were not considered and the analysis of the social, geographical, economic, and resource environment that affects land-use changes was not fully characterized. Therefore, to improve model accuracy, future research should consider the influence of natural and human factors on the change in the geospatial system. In addition, future research can attempt to establish a model of land-use/land-cover change under the joint action of several different influencing factors and different decision makers by adding weighting elements.
6. Conclusions
This paper investigated the dynamic evolution of the desert-oasis ecotone in the Tarim River Basin and predicted the near-future land-use change in the desert-oasis ecotone using the CA-Markov model. The main findings of this paper are as follows:
With the decrease in the NDVI (from 0.142 in 1990 to 0.127 in 2015) of the desert-oasis ecotone, the area of the ecotone also shrank from 67,642 km2 in 1990 to 46,613 km2 in 2015. In the context of global climate change, the temperature showed a significant increase compared with precipitation, which led to an obvious increase in aridity in the study area. Meanwhile, the increase in arable land area led to a decrease in the groundwater table. The above factors have led to the shrinkage of the desert-oasis ecotone in the Tarim River Basin.
The CA-Markov model was verified to have good applicability in this study area, which was used to predict and simulate the future land dynamics of the study basin. Assuming the present development trend continues without intervention, the arable land area in the ecotone will increase from 1033 km2 in 2015 to 2599 km2 in 2030 and the woodland area and grassland area will decrease from 318 km2 to 833 km2, respectively. The main land-use types in the Tarim River Basin in 2030 will be arable land, unused land, and grassland.
In light of the above conclusions, it is necessary to establish reasonable management countermeasures for land-use planning in Tarim River Basin development to achieve sustainable development and protect the ecology of the basin.
Supplementary Materials
The following are available online at https://www.mdpi.com/2072-4292/13/4/647/s1: Table S1: The detailed information on Landsat images used in this study; Table S2: Land cover classification system; Table S3: SPEI categories; Table S4: Kappa index and consistency relationship; Table S5: Changes in the ecotone area of each basin in 1990, 2000, and 2015; Table S6: Transfer matrix of land-use area between 1990 and 2015 in the Tarim River Basin; and Table S7: Area of land-use types in the study area in 1990, 2000, 2015, and 2030.
Author Contributions
F.S. and Y.W. conceived the original design of this paper. Y.C. and Y.L. improved the structure of the paper. Q.Z., J.Q., and P.M.K. provided comments on this paper. All authors have read and agreed to the published version of the manuscript.
Funding
The research was supported by the National Youth Thousand Talents Project (Y771071001).
Institutional Review Board Statement
Not applicable.
Informed Consent Statement
Not applicable.
Data Availability Statement
The data presented in this study are available on request from the corresponding author.
Acknowledgments
We thank LetPub (www.letpub.com) for the linguistic assistance and scientific consultation provided during the preparation of this manuscript.
Conflicts of Interest
The authors declare no conflict of interest.
References
- Chen, Y.; Chen, Y.; Zhu, C.; Li, W. The concept and mode of ecosystem sustainable management in arid desert areas in northwest China. Acta Ecol. Sin. 2019, 39, 7410–7417. [Google Scholar]
- Allen, R.G. Crop Evapotranspiration-Guidelines for Computing Crop Water Requirements; FAO Irrigation and Drainage Paper No.56; FAO: Rome, Italy, 1998; p. 300. [Google Scholar]
- Zhou, X.; Tao, Y.; Wu, L.; Li, Y.; Zhang, Y. Divergent Responses of Plant Communities under Increased Land-Use Intensity in Oasis-Desert Ecotones of Tarim Basin. Rangel. Ecol. Manag. 2020, 73, 811–819. [Google Scholar] [CrossRef]
- Rosenfeld, D.; Rudich, Y.; Lahav, R. Desert dust suppressing precipitation: A possible desertification feedback loop. Proc. Natl. Acad. Sci. USA 2001, 98, 5975–5980. [Google Scholar] [CrossRef] [PubMed]
- Chen, Y.; Zhang, X.; Fang, G.; Li, Z.; Wang, F.; Qin, J.; Sun, F. Potential risks and challenges of climate change in the arid region of northwestern China. Reg. Sustain. 2020, 1, 20–30. [Google Scholar] [CrossRef]
- Gosz, J.R. Ecological functions in a biome transition zone: Translating local responses to broad-scale dynamics. In Landscape Boundaries; Springer: New York, NY, USA, 1992; pp. 55–75. [Google Scholar]
- Traut, B.H. The role of coastal ecotones: A case study of the salt marsh/upland transition zone in California. J. Ecol. 2005, 93, 279–290. [Google Scholar] [CrossRef]
- Li, X.; Yang, K.; Zhou, Y. Progress in the study of oasis-desert interactions. Agric. Meteorol. 2016, 230–231, 1–7. [Google Scholar] [CrossRef]
- Hou, J.; Du, L.; Liu, K.; Hu, Y.; Zhu, Y. Characteristics of vegetation activity and its responses to climate change in desert/grassland biome transition zones in the last 30 years based on GIMMS3g. Theor. Appl. Climatol. 2019, 136, 915–928. [Google Scholar] [CrossRef]
- Fan, Z.; Li, J.; Yue, T. Land-cover changes of biome transition zones in Loess Plateau of China. Ecol. Model. 2013, 252, 129–140. [Google Scholar] [CrossRef]
- Ji, S.; Bai, X.; Qiao, R.; Wang, L.; Chang, X. Width identification of transition zone between desert and oasis based on NDVI and TCI. Sci. Rep. 2020, 10, 8672. [Google Scholar] [CrossRef]
- Wang, J.; Gao, Y.; Sheng, W. Land use/cover change impacts on water table change over 25 years in a desert-oasis transition zone of the Heihe River basin, China. Water 2015, 8, 11. [Google Scholar] [CrossRef]
- Verburg, P.H.; Soepboer, W.; Veldkamp, A.; Limpiada, R.; Espaldon, V.; Mastura, S.S.A. Modeling the spatial dynamics of regional land use: The CLUE-S model. Environ. Manag. 2002, 30, 391–405. [Google Scholar] [CrossRef] [PubMed]
- Buckland, C.E.; Bailey, R.M.; Thomas, D.S.G. Using artificial neural networks to predict future dryland responses to human and climate disturbances. Sci. Rep. 2019, 9, 3855. [Google Scholar] [CrossRef]
- Memarian, H.; Balasundram, S.; Talib, J.; Teh, C.; Sood, A.; Abbaspour, K. Validation of CA-Markov for simulation of land use and cover change in the Langat Basin, Malaysia. J. Geogr. Inf. Syst. 2012, 44, 542–554. [Google Scholar] [CrossRef]
- Huang, Q.; Shi, P.; He, C.; Li, X. Modelling land use change dynamics under different aridification scenarios in Northern China. Acta Geogr. Sin. 2006, 61, 1299. [Google Scholar]
- Shen, Q.; Chen, Q.; Tang, B.; Yeung, S.; Hu, Y.; Cheung, G. A system dynamics model for the sustainable land use planning and development. Habitat Int. 2009, 33, 15–25. [Google Scholar] [CrossRef]
- Civco, D.L. Artificial neural networks for land-cover classification and mapping. Int. J. Geogr. Inf. Syst. 1993, 7, 173–186. [Google Scholar] [CrossRef]
- Nouri, J.; Gharagozlou, A.; Arjmandi, R.; Faryadi, S.; Adl, M. Predicting urban land use changes using a CA–Markov model. Arab. J. Sci. Eng. 2014, 39, 5565–5573. [Google Scholar] [CrossRef]
- Sang, L.; Zhang, C.; Yang, J.; Zhu, D.; Yun, W. Simulation of land use spatial pattern of towns and villages based on CA–Markov model. Math. Comput. Model. 2011, 54, 938–943. [Google Scholar] [CrossRef]
- Kamusoko, C.; Aniya, M.; Adi, B.; Manjoro, M. Rural sustainability under threat in Zimbabwe–Simulation of future land use/cover changes in the Bindura district based on the Markov-cellular automata model. Appl. Geogr. 2009, 29, 435–447. [Google Scholar] [CrossRef]
- Chen, H.; Chen, Y. Changes of desert riparian vegetation along the main stream of Tarim River, Xinjiang. Chin. J. Ecol. 2015, 34, 3166. [Google Scholar]
- Zhao, R.; Chen, Y.; Shi, P.; Zhang, L.; Pan, J.; Zhao, H. Land use and land cover change and driving mechanism in the arid inland river basin: A case study of Tarim River, Xinjiang, China. Environ. Earth Sci. 2013, 68, 591–604. [Google Scholar] [CrossRef]
- Chen, Y.; Hao, X.; Chen, Y.; Zhu, C. Study on water system connectivity and ecological protection countermeasures of Tarim River Basin in Xinjian. Bull. Chin. Acad. Sci. 2019, 34, 1156–1164. [Google Scholar]
- Fang, G.; Yang, J.; Chen, Y.; Li, Z.; Ji, H.; De Maeyer, P. How hydrologic processes differ spatially in a large basin: Multi-site and multi-objective modeling in the Tarim River Basin. J. Geophys. Res. Atmos. 2018, 123, 7098–7113. [Google Scholar]
- Chen, Y.; Xu, C.; Hao, X.; Li, W.; Chen, Y.; Zhu, C.; Ye, Z. Fifty-year climate change and its effect on annual runoff in the Tarim River Basin, China. Quat. Int. 2009, 208, 53–61. [Google Scholar]
- Xu, Z.; Chen, Y.; Li, J. Impact of climate change on water resources in the Tarim River basin. Water Resour. Manag. 2004, 18, 439–458. [Google Scholar] [CrossRef]
- Wang, F.; Chen, Y.; Li, Z.; Fang, G.; Li, Y.; Xia, Z. Assessment of the irrigation water requirement and water supply risk in the Tarim River Basin, Northwest China. Sustainability 2019, 11, 4941. [Google Scholar] [CrossRef]
- Lai, L.; Huang, X.; Yang, H.; Chuai, X.; Zhang, M.; Zhong, T.; Chen, Z.; Chen, Y.; Wang, X.; Thompson, J.R. Carbon emissions from land-use change and management in China between 1990 and 2010. Sci. Adv. 2016, 2, e1601063. [Google Scholar] [CrossRef] [PubMed]
- Zhang, W.; Lu, Y.; van der Werf, W.; Huang, J.; Wu, F.; Zhou, K.; Deng, X.; Jiang, Y.; Wu, K.; Rosegrant, M.W. Multidecadal, county-level analysis of the effects of land use, Bt cotton, and weather on cotton pests in China. Proc. Natl. Acad. Sci. USA 2018, 115, E7700. [Google Scholar] [CrossRef]
- Ma, M.; Veroustraete, F. Reconstructing pathfinder AVHRR land NDVI time-series data for the Northwest of China. Adv. Space Res. 2006, 37, 835–840. [Google Scholar] [CrossRef]
- Piao, S.; Wang, X.; Park, T.; Chen, C.; Lian, X.; He, Y.; Bjerke, J.W.; Chen, A.; Ciais, P.; Tømmervik, H. Characteristics, drivers and feedbacks of global greening. Nat. Rev. Earth Environ. 2020, 1, 14–27. [Google Scholar] [CrossRef]
- Zhang, Y.; Song, C.; Band, L.E.; Sun, G.; Li, J. Reanalysis of global terrestrial vegetation trends from MODIS products: Browning or greening? Remote Sens. Environ. 2017, 191, 145–155. [Google Scholar] [CrossRef]
- Deng, Y.; Wang, S.; Bai, X.; Luo, G.; Wu, L.; Chen, F.; Wang, J.; Li, C.; Yang, Y.; Hu, Z. Vegetation greening intensified soil drying in some semi-arid and arid areas of the world. Agric. For. Meteorol. 2020, 292, 108103. [Google Scholar] [CrossRef]
- Sun, F.; Wang, Y.; Chen, Y. Dynamic changes of the desert-oasis ecotone and its influencing factors in Tarim Basin. Chin. J. Ecol. 2020, 39, 3397–3407. [Google Scholar]
- Long, H.; Liu, Y.; Hou, X.; Li, T.; Li, Y. Effects of land use transitions due to rapid urbanization on ecosystem services: Implications for urban planning in the new developing area of China. Habitat Int. 2014, 44, 536–544. [Google Scholar] [CrossRef]
- Li, Y.; Chen, Y.; Li, Z. Dry/wet pattern changes in global dryland areas over the past six decades. Glob. Planet. Chang. 2019, 178, 184–192. [Google Scholar] [CrossRef]
- Stagge, J.H.; Tallaksen, L.M.; Gudmundsson, L.; Van Loon, A.F.; Stahl, K. Candidate distributions for climatological drought indices (SPI and SPEI). Int. J. Climatol. 2015, 35, 4027–4040. [Google Scholar] [CrossRef]
- Beguería, S.; Vicente-Serrano, S.M.; Reig, F.; Latorre, B. Standardized precipitation evapotranspiration index (SPEI) revisited: Parameter fitting, evapotranspiration models, tools, datasets and drought monitoring. Int. J. Climatol. 2014, 34, 3001–3023. [Google Scholar] [CrossRef]
- Manzano, A.; Clemente, M.A.; Morata, A.; Luna, M.Y.; Beguería, S.; Vicente-Serrano, S.M.; Martín, M.L. Analysis of the atmospheric circulation pattern effects over SPEI drought index in Spain. Atmos. Res. 2019, 230, 104630. [Google Scholar] [CrossRef]
- Veldkamp, A.; Lambin, E.F. Predicting land-use change. Agric. Ecosyst. Environ. 2001, 85, 1–6. [Google Scholar] [CrossRef]
- Fischer, G.; Sun, L. Model based analysis of future land use development in China. Agric. Ecosyst. Environ. 2001, 85, 163–176. [Google Scholar] [CrossRef]
- Pijanowski, B.; Brown, D.; Shellito, B.; Manik, G. Using neural networks and GIS to forecast land use changes: A land transformation model. Comput. Environ. Urban Syst. 2002, 26, 553–575. [Google Scholar] [CrossRef]
- Van Vliet, J.; Hurkens, J.; White, R.; van Delden, H. An activity-based cellular automaton model to simulate land-use dynamics. Environ. Plan. B Plan. Des. 2011, 39, 198–212. [Google Scholar] [CrossRef]
- Li, X.; Liu, X. Defining agents’ behaviors to simulate complex residential development using multicriteria evaluation. J. Environ. Manag. 2007, 85, 1063–1075. [Google Scholar] [CrossRef] [PubMed]
- Wood, E.C.; Lewis, J.E.; Tappan, G.G.; Lietzow, R.W. The development of a land cover change model for southern Senegal. In Land Use Modeling Workshop; EROS Data Center: Sioux Falls, SD, USA, 1997; pp. 5–6. [Google Scholar]
- Pontius, R.; Huffaker, D.; Denman, K. Useful techniques of validation for spatially explicit land-change models. Ecol. Model. 2004, 179, 445–461. [Google Scholar] [CrossRef]
- Jiang, P.; Cheng, L.; Li, M.; Zhao, R.; Duan, Y. Impacts of LUCC on soil properties in the riparian zones of desert oasis with remote sensing data: A case study of the middle Heihe River basin, China. Sci. Total Environ. 2015, 506, 259–271. [Google Scholar] [CrossRef]
- Li, J.; Zhao, C.; Zhu, H.; Li, Y.; Wang, F. Effect of plant species on shrub fertile island at an oasis–desert ecotone in the South Junggar Basin, China. J. Arid Environ. 2007, 71, 350–361. [Google Scholar] [CrossRef]
- Chen, Z.; Chen, Y.; Li, B. Quantifying the effects of climate variability and human activities on runoff for Kaidu River Basin in arid region of northwest China. Theor. Appl. Climatol. 2013, 111, 537–545. [Google Scholar] [CrossRef]
- Shen, Y.; Chen, Y. Global perspective on hydrology, water balance, and water resources management in arid basins. Hydrol. Process. 2009, 24, 129–135. [Google Scholar] [CrossRef]
- Chen, Y.; Ye, Z.; Shen, Y. Desiccation of the Tarim River, Xinjiang, China, and Mitigation Strategy. Quat. Int. 2011, 244, 264–271. [Google Scholar] [CrossRef]
- Fang, G.; Chen, Y. Variation in agricultural water demand and its attributions in the arid Tarim River Basin. J. Agric. Sci. 2018, 156, 1–11. [Google Scholar] [CrossRef]
Publisher’s Note: MDPI stays neutral with regard to jurisdictional claims in published maps and institutional affiliations. |
© 2021 by the authors. Licensee MDPI, Basel, Switzerland. This article is an open access article distributed under the terms and conditions of the Creative Commons Attribution (CC BY) license (http://creativecommons.org/licenses/by/4.0/).

