Abstract
The Chinese Ocean Color and Temperature Scanner (COCTS) onboard the Haiyang-1C (HY-1C) satellite was launched in September 2018. Accurate and stable calibration is one of the important factors when deriving geophysical parameters with high quality. The first assessment of HY-1C COCTS thermal infrared calibration is conducted in this research. We choose the Infrared Atmospheric Sounding Interferometer (IASI) onboard the MetOp-B satellite as the reference instrument, mainly due to its hyper-spectral characteristic and accurate calibration superiority. The brightness temperatures (BTs) from the two HY-1C COCTS thermal infrared bands centered near 11 and 12 µm are collocated with the IASI in the spatial window of 0.12° × 0.12° and temporal window of half an hour. The homogeneity filtering of matchups is also carried out by setting the relative standard deviation (RSD) thresholds on each collocated grid and its neighboring grids. Based on the filtered matchups, the HY-1C COCTS BTs from the 11 and 12 µm channels are compared with IASI. The mean differences of COCTS minus IASI are 2.68 and 3.18 K for the 11 and 12 μm channels, respectively. The corresponding standard deviations (SDs) are also 0.29 and 0.28 K, respectively. In addition, the BT differences show latitude-dependence and BT-dependence. In order to correct the HY-1C COCTS thermal infrared BTs, the latitude-dependent coefficients are obtained to express the relationship between the BT differences and IASI BTs using the linear robust regression. After the BT correction, the biases and BT-dependence of the COCTS original BT minus IASI differences are removed. Further, the SDs decrease to 0.21 K for the 11 and 12 μm channels. Overall, the calibration of the HY-1C COCTS thermal infrared channels remains stable and the accuracy is around 0.2 K after inter-calibration.
1. Introduction
Accurate and stable calibration is one of the important factors when deriving geophysical parameters with high quality. Inter-calibration provides an effective method for the quality assessment, stability monitoring, uncertainty analysis, and correction of the target instrument calibration by choosing the appropriate reference instrument. Quantifying the bias between the target sensor and the reference sensor, correcting the bias, and analyzing the uncertainty are the main objectives of inter-calibration [1]. Currently, the simultaneous nadir overpass (SNO) method, the double-difference method, and the statistical method are extensively applied to instrument inter-calibration [1]. The choice of reference instrument plays one of the important roles in inter-calibration. The accuracy, stability, and traceability are the key features of the reference instrument. In addition, the spectral coverage and the adjustment of spectral difference also need to be considered. The well-characterized hyper-spectral instruments, for example, the Advanced Infrared Sounder (AIRS), the Infrared Atmospheric Sounding Interferometer (IASI), and the Cross-track Infrared Sounder (CrIS), have been chosen as the reference instruments in much inter-calibration research [2,3,4,5,6,7,8,9,10,11].
The Haiyang-1C (HY-1C) satellite was launched in September 2018, operated by the National Ocean Satellite Application Center (NSOAS) of China. The HY-1C satellite is the follow-on mission to the Haiyang-1A (HY-1A) and Haiyang-1B (HY-1B) satellites, being the first operational mission of the Chinese HY-1 series satellites. HY-1C operates in a near-sun-synchronous polar orbit. The swath width is 2900 km. The Chinese Ocean Color and Temperature Scanner (COCTS) on the HY-1C satellite has eight visible and near-infrared channels (called channel 1 to channel 8) for ocean color measurements, including chlorophyll concentration, dissolved organic matter, suspended sediment concentration, and pollutants, as well as two thermal infrared channels (called channel 9 and channel 10) used for measuring sea surface temperature (SST) [12]. The spatial resolution of HY-1C COCTS is 1.1 km at nadir [12]. The HY-1C COCTS visible and near-infrared bands were inter-calibrated with MODIS as the reference instrument, and the reflectance was retrieved by using the inter-calibration coefficients [13]. The initial comparison results indicated that the root-mean-square error (RMSE) of the HY-1C COCTS SST products minus buoy SST difference was around 0.8 K [14]. Although there also exists a gap compared with high-quality infrared SST products [15], the accuracy of HY-1C COCTS SST products has been improved a lot compared with HY-1B COCTS [16]. The thermal infrared calibration plays an important role in SST quality; thus, the first assessment of the HY-1C COCTS thermal infrared calibration is conducted in this study.
The reference instrument we used for the evaluation of HY-1C COCTS thermal infrared calibration was the IASI onboard the MetOp-B satellite. IASI is a hyper-spectral instrument, with the capability of measuring the spectral range from 3.63 to 15.5 µm with a spectral resolution of 0.25 cm−1 [17,18]. It is verified that the IASI calibration is accurate and stable [18,19]. As there is no on-orbit SI source to detect the IASI traceability, a comparison with an external large-area reference blackbody (HBB) traceable to SI standards was done to fully assess the IASI before launch, demonstrating that the difference in IASI measurement with HBB was within 0.25 K [18,20]. The routine monitoring of the IASI on-orbit performance demonstrated that the absolute radiometric calibration was better than 0.35 K, which met well the design requirement of 0.5 K, and the orbital stability of IASI was well within 0.04 K [18,19,20]. In addition, the radiance from IASI was compared with AIRS onboard Aqua, indicating that their differences were less than 0.1 K and there were no significant long-term changes in the IASI minus AIRS differences [21]. Due to its hyper-spectral characteristics and accurate calibration, IASI is an excellent reference instrument for other instrument inter-calibrations. The Global Space-based InterCalibration System (GSICS) uses IASI as the reference sensor to develop the inter-calibration algorithm and products for other geostationary and polar orbital instruments [5,7]. In our previous study, the inter-calibration of the HY-1B COCTS infrared channels with IASI onboard the MetOp-A satellite in the Northwest Pacific region was carried out [9]. The comparison results showed that the overall mean differences of the HY-1B COCTS 11 and 12 µm channel original brightness temperatures (BTs) with IASI were −4.08 and −4.76 K, respectively, with the corresponding standard deviations of 0.50 and 0.39 K, and a strong dependence of difference on BT in the case of the 11 µm channel [9].
In this research, the assessment of calibration from the HY-1C COCTS infrared channels is carried out in the global region using IASI as the reference sensor. The checkout phase of HY-1C COCTS starts from May 2019. The comparison of the HY-1C COCTS thermal infrared BTs with IASI is based on the measurements from 1 May to 31 July 2019 in this study. This paper is organized as follows. The data sets used in this research are described in Section 2. In Section 3, the inter-calibration methodology is introduced. In Section 4, the HY-1C COCTS thermal infrared BTs from the 11 and 12 µm channel are compared with IASI. The analysis of the BT comparison results is discussed in Section 5. The correction of the HY-1C COCTS BTs is described in Section 6. The primary conclusion is summarized in Section 7.
2. Data Set
2.1. HY-1C COCTS Radiance Data
The HY-1C COCTS Level 1B radiance data in version 1.0 were provided in HDF format by NSOAS. Users can apply for the HY-1C COCTS data at the NSOAS data distribution site [22]. The radiance data fields of 10 channels are included in the data file. In addition, the geophysical data, scanning time, and calibration information of the radiometer are also included in the HY-1C COCTS Level 1B data file.
2.2. IASI Spectral Radiance Data
The IASI Level 1C products are re-sampled spectrum radiances with apodization, consisting of 8461 spectral radiances every 0.25 cm−1, provided in EUMETSAT Polar System (EPS) native format by EUMETSAT Data Center [23]. The general structure of the IASI L1C EPS products contains several sections, and each section contains one or more records of different classes. The satellite scan time, satellite zenith angle, spectral radiance, and wavenumber are included in the body section [23].
2.3. ECMWF ERA5 Data
ERA5 is the latest climate reanalysis production, provided by the European Centre For Medium Range Weather Forecasts (ECMWF). The ERA5 data include hourly atmospheric, oceanic, and land variables including the atmospheric temperature, humidity, SST, total column water vapor (TCWV), ozone etc. [24,25]. The ERA5 data are stored on regular 0.25° × 0.25° latitude–longitude grids [24,25]. In this study, we use the ERA5 TCWV data for the HY-1C COCTS BT error analysis.
3. Methodology
3.1. Instrument Characteristics
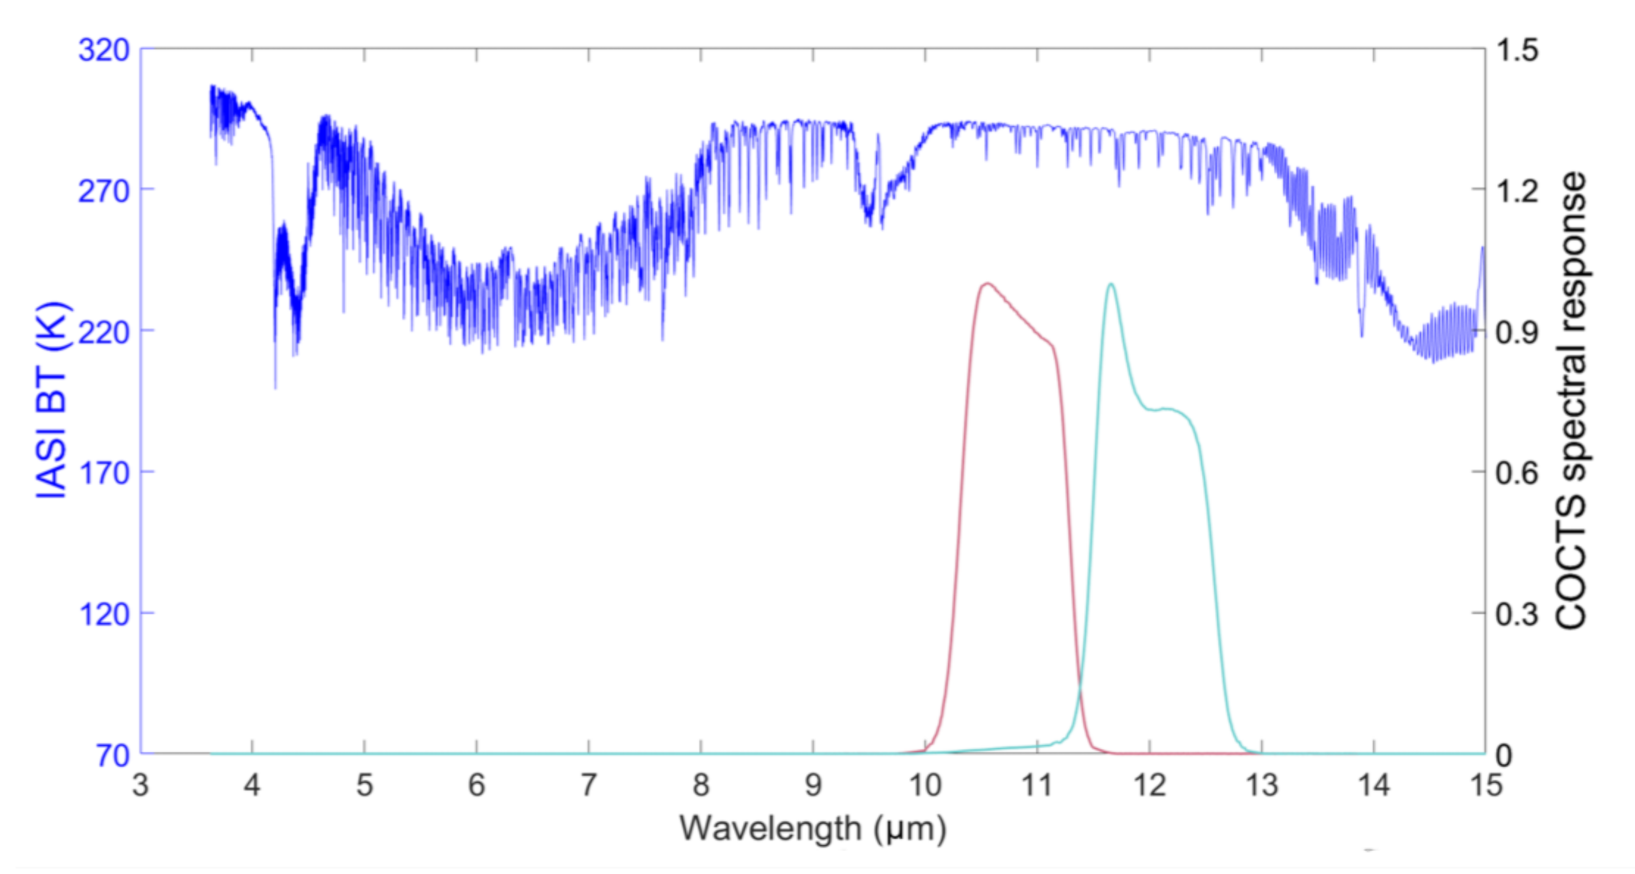
Table 1 shows the instrument characteristics of HY-1C COCTS and IASI. The HY-1C COCTS has eight visible and near-infrared channels, as well as two thermal infrared channels. For the two HY-1C COCTS thermal infrared channels, the dynamic ranges for BT measurements are from 200 to 320 K and the noise-equivalent temperature differences are both 0.20 K around 300 K [12]. The spectral range of IASI is from 3.63 to 15.5 µm, fully covering the two HY-1C COCTS thermal infrared channels. Figure 1 shows a demo of the IASI-measured spectral BTs for 8461 channels with the spectral response functions of the two HY-1C COCTS thermal infrared channels (red: 11 µm channel; green: 12 µm channel). For HY-1C COCTS, there are in total 1656 samples per scan line, with the Earth scanning angle of ±57° from nadir. The spatial resolution of HY-1C COCTS is 1.1 km. For IASI, the Earth scan angle is ±48°20′ from nadir, and there are, in total, 30 scan positions per scan line, each consisting of 2 × 2 instantaneous fields of view (IFOV). The spatial resolution of each IFOV for IASI is around 12 km at nadir. Radiometric calibration of the HY-1C COCTS and IASI is both based on the cold space and internal blackbody measurements [13,19].

Table 1.
The instrument characteristics of the Haiyang-1C (HY-1C) Chinese Ocean Color and Temperature Scanner (COCTS) and Infrared Atmospheric Sounding Interferometer (IASI).
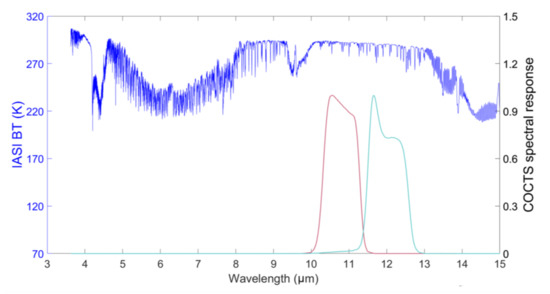
Figure 1.
The IASI measured spectral brightness temperatures (BTs) for 8461 channels with the spectral response functions of the HY-1C COCTS thermal infrared channels (red: 11 µm channel; green: 12 µm channel).
3.2. Generation and Filtering of the Matchups
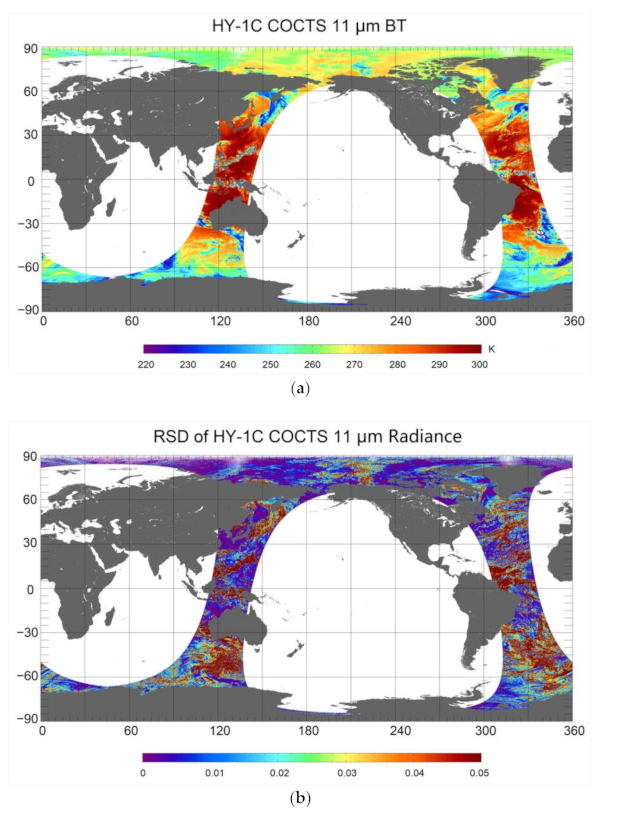
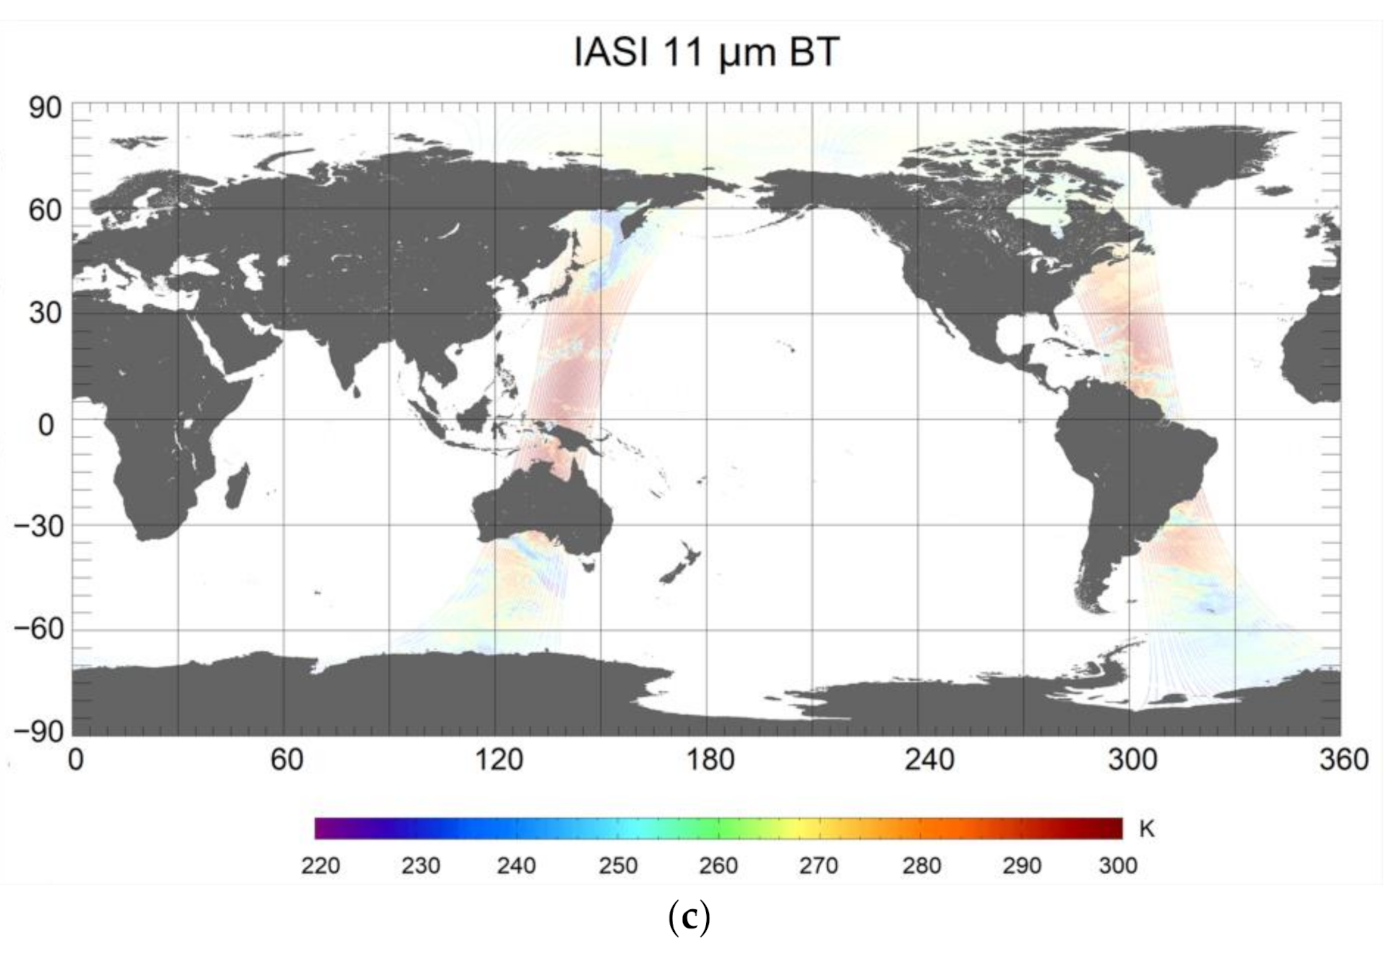
The spectral radiances of IASI are convolved with the HY-1C COCTS 11 and 12 µm spectral response functions, to calculate the reference radiances corresponding to the two HY-1C COCTS thermal infrared channels. Considering that the spatial resolution of IASI and HY-1C COCTS are 12 km and 1.1 km from nadir, respectively, the IASI-convolved and HY-1C COCTS 11 and 12 µm radiances are projected on a grid of 0.12° × 0.12° and converted to BTs for the following comparison. The radiances of the HY-1C COCTS pixels located in the 0.12° × 0.12° grid are evenly averaged. In addition, the relative standard deviations (RSD), that is, the ratio of the standard deviation (SD) to the average value of these pixels inside each grid, is also recorded for the homogeneity detection. Figure 2a,c show HY-1C COCTS and IASI-convolved 11 µm BT images for one orbit on 22 May 2019, with the corresponding HY-1C COCTS RSD image shown in Figure 2b. It is obvious that the swath width of HY-1C COCTS is wider than IASI. Next, the COCTS BTs are collocated with the IASI BTs. The spatial window of the COCTS-IASI matchups is set as 0.12° × 0.12° in the global region. Moreover, the temporal window of the matchups is set as ±30 min. In addition, to diminish the impact of the atmospheric path difference on the BT comparison, the threshold of the absolute difference in the secant of the satellite zenith angles is set as 0.03, constraining the difference of the COCTS and IASI atmospheric paths to be less than 3%. The total number of collocations is 886,097.
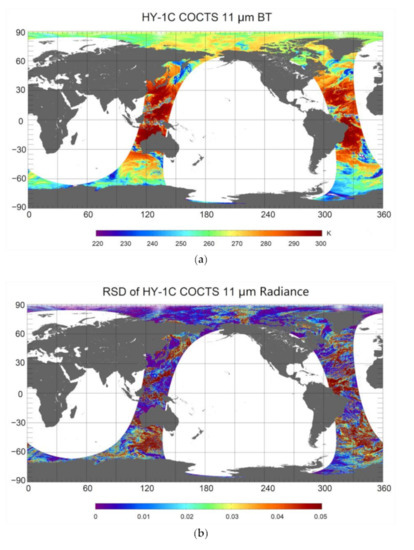
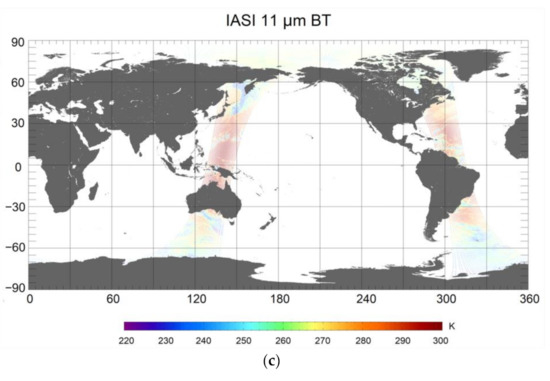
Figure 2.
(a) The HY-1C COCTS 11 µm BT, (b) the RSD of HY-1C COCTS 11 µm radiance, and (c) the IASI 11 µm BT for one orbit on 22 May 2019.
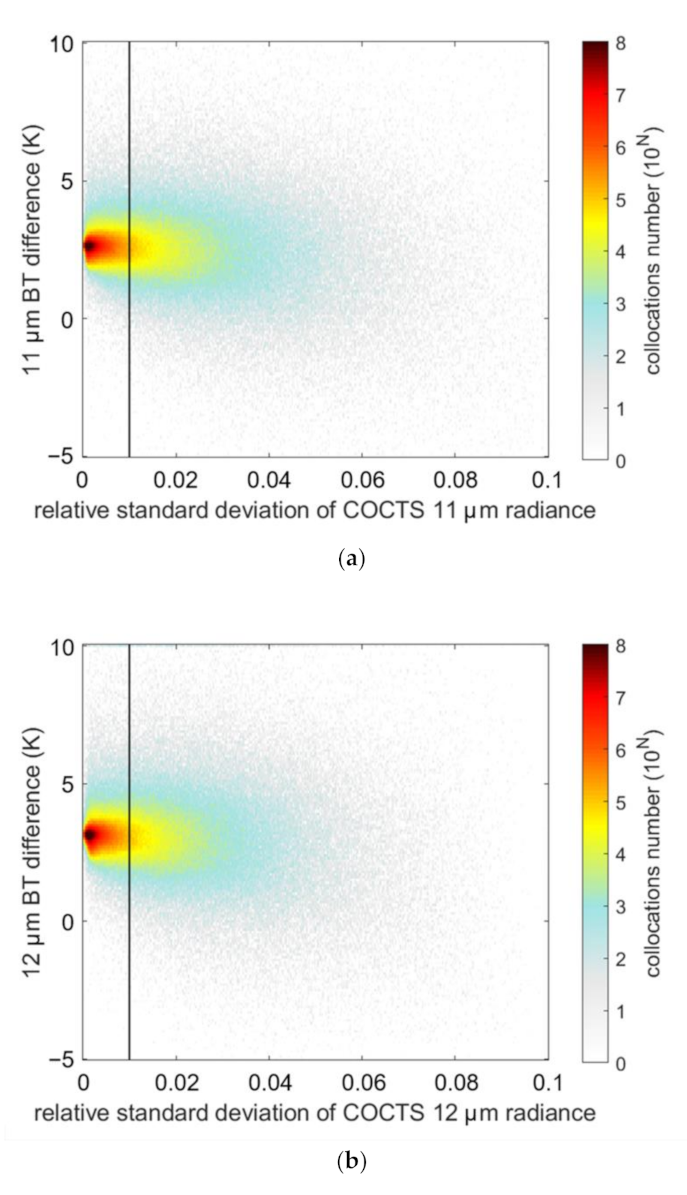
As the point spread functions of COCTS and IASI are different, the filtering of matchups located in the uniform scene is important because it reduces the spatial uncertainties of matchups [10]. Therefore, the homogeneity filtering of matchups is a necessary step. The RSD of the valid HY-1C COCTS pixels on each collocated grid is one effective indicator when quantifying the spatial homogeneity [9]. Figure 3a,b show the variations in HY-1C COCTS minus IASI BTs against the RSDs for the 11 and 12 µm channels, respectively. The background color represents the matchup number in each 0.00025 RSD bin and 0.1 K BT-difference bin. The dispersion degree of BT differences become significant with increasing RSDs. We set both the RSD thresholds for 11 and 12 µm channels as 0.01 to select the matchups located in the uniform scene. In addition, the homogeneity in the wider surroundings is also detected using the RSDs of the surrounding projected grids. If all the RSDs of the collocated grid and its eight surrounding grids are lower than 0.01, this collocated pair is considered to be located in the uniform region. After the homogeneity filtering of the matchups, the total number of the filtered matchups is 197,489. The subsequent assessment of the HY-1C COCTS BT accuracy from the 11 and 12 µm channels is based on these filtered collocations in the following part.
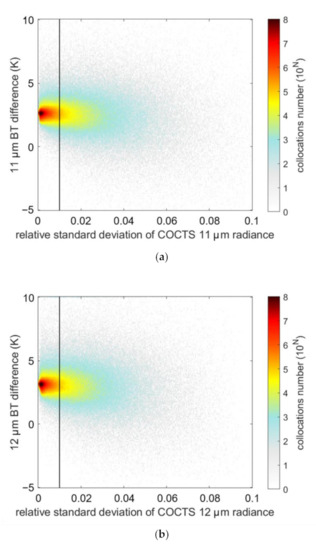
Figure 3.
The distribution of the HY-1C COCTS minus IASI BT differences against the RSDs of the HY-1C COCTS radiance in the collocated grids: (a) 11 μm channel; (b) 12 μm channel.
4. Comparison Results of the HY-1C COCTS Thermal Infrared BTs with IASI
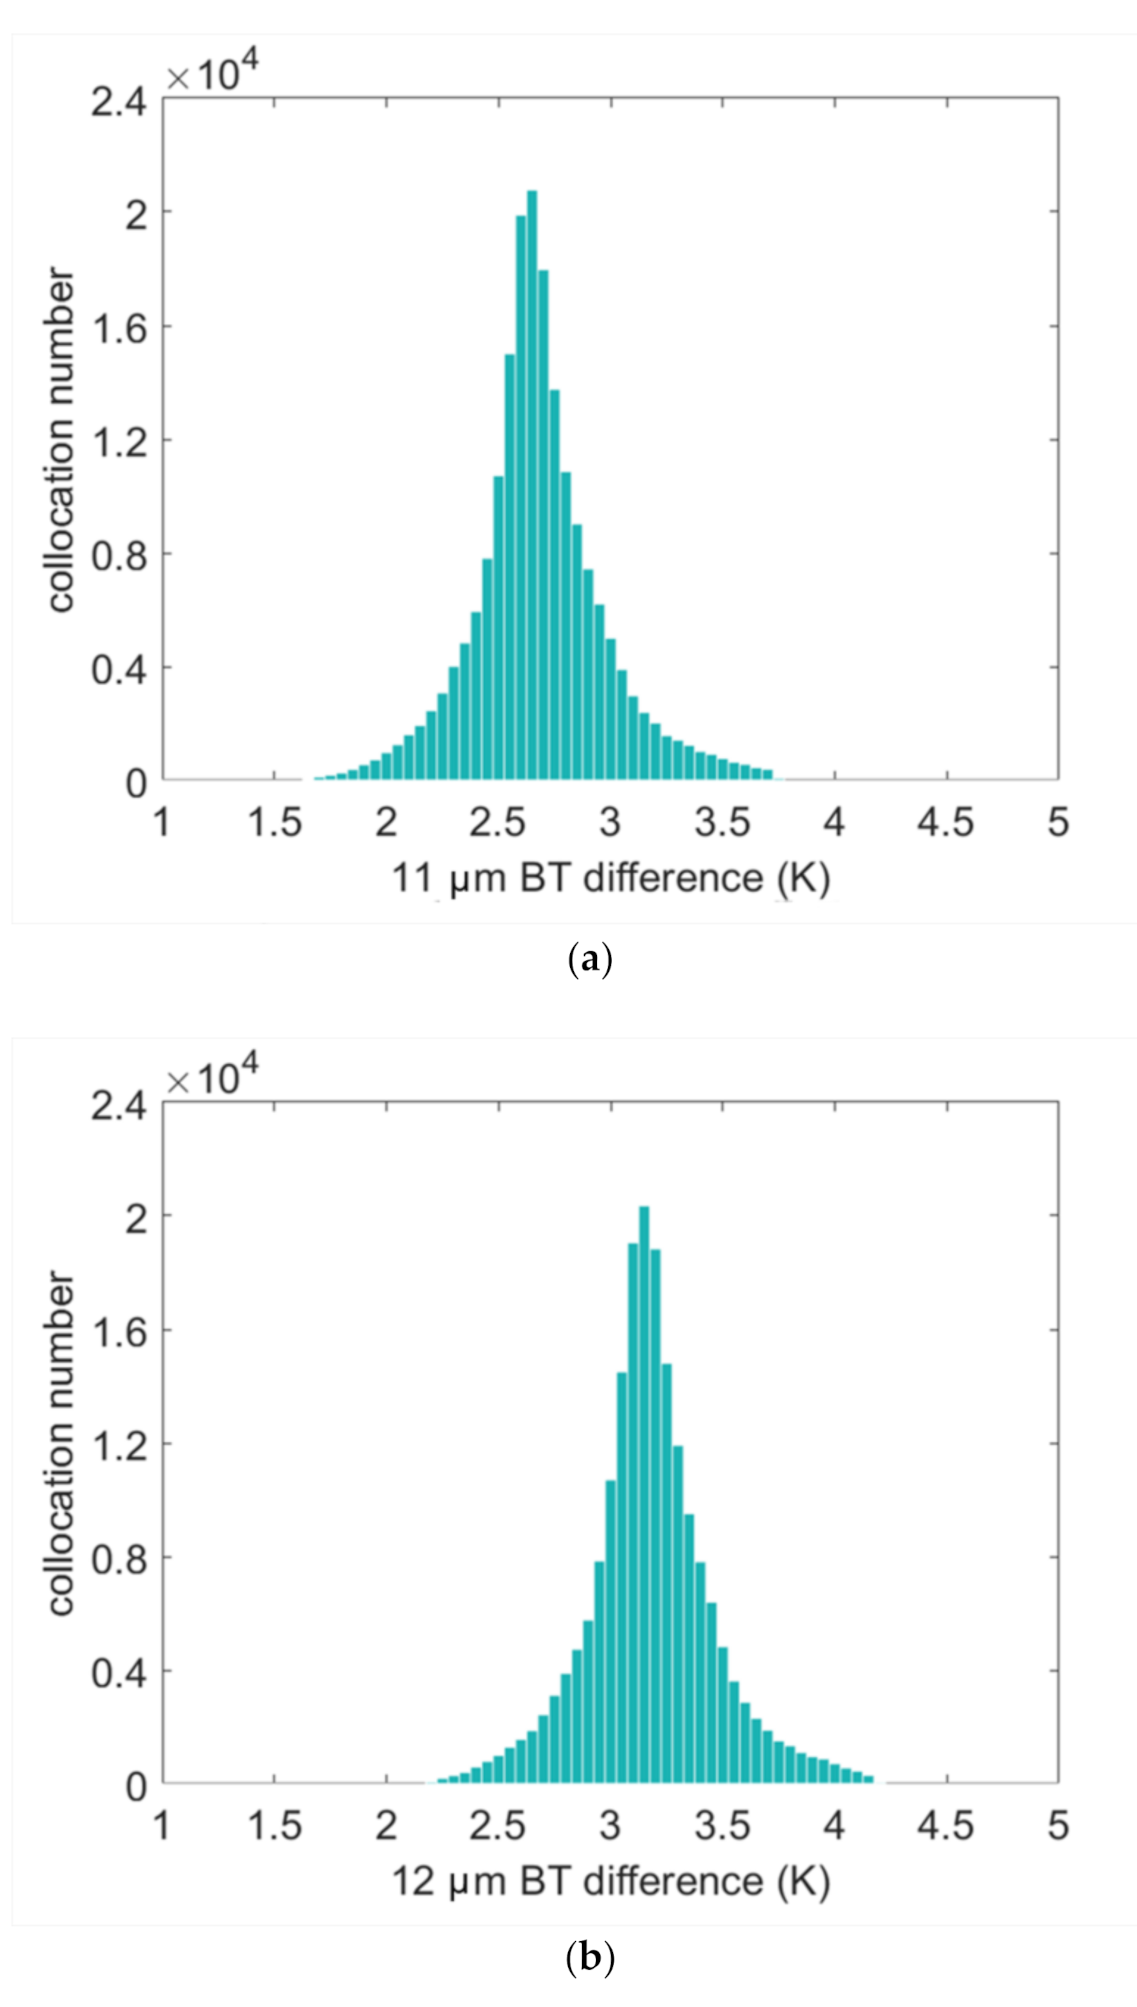
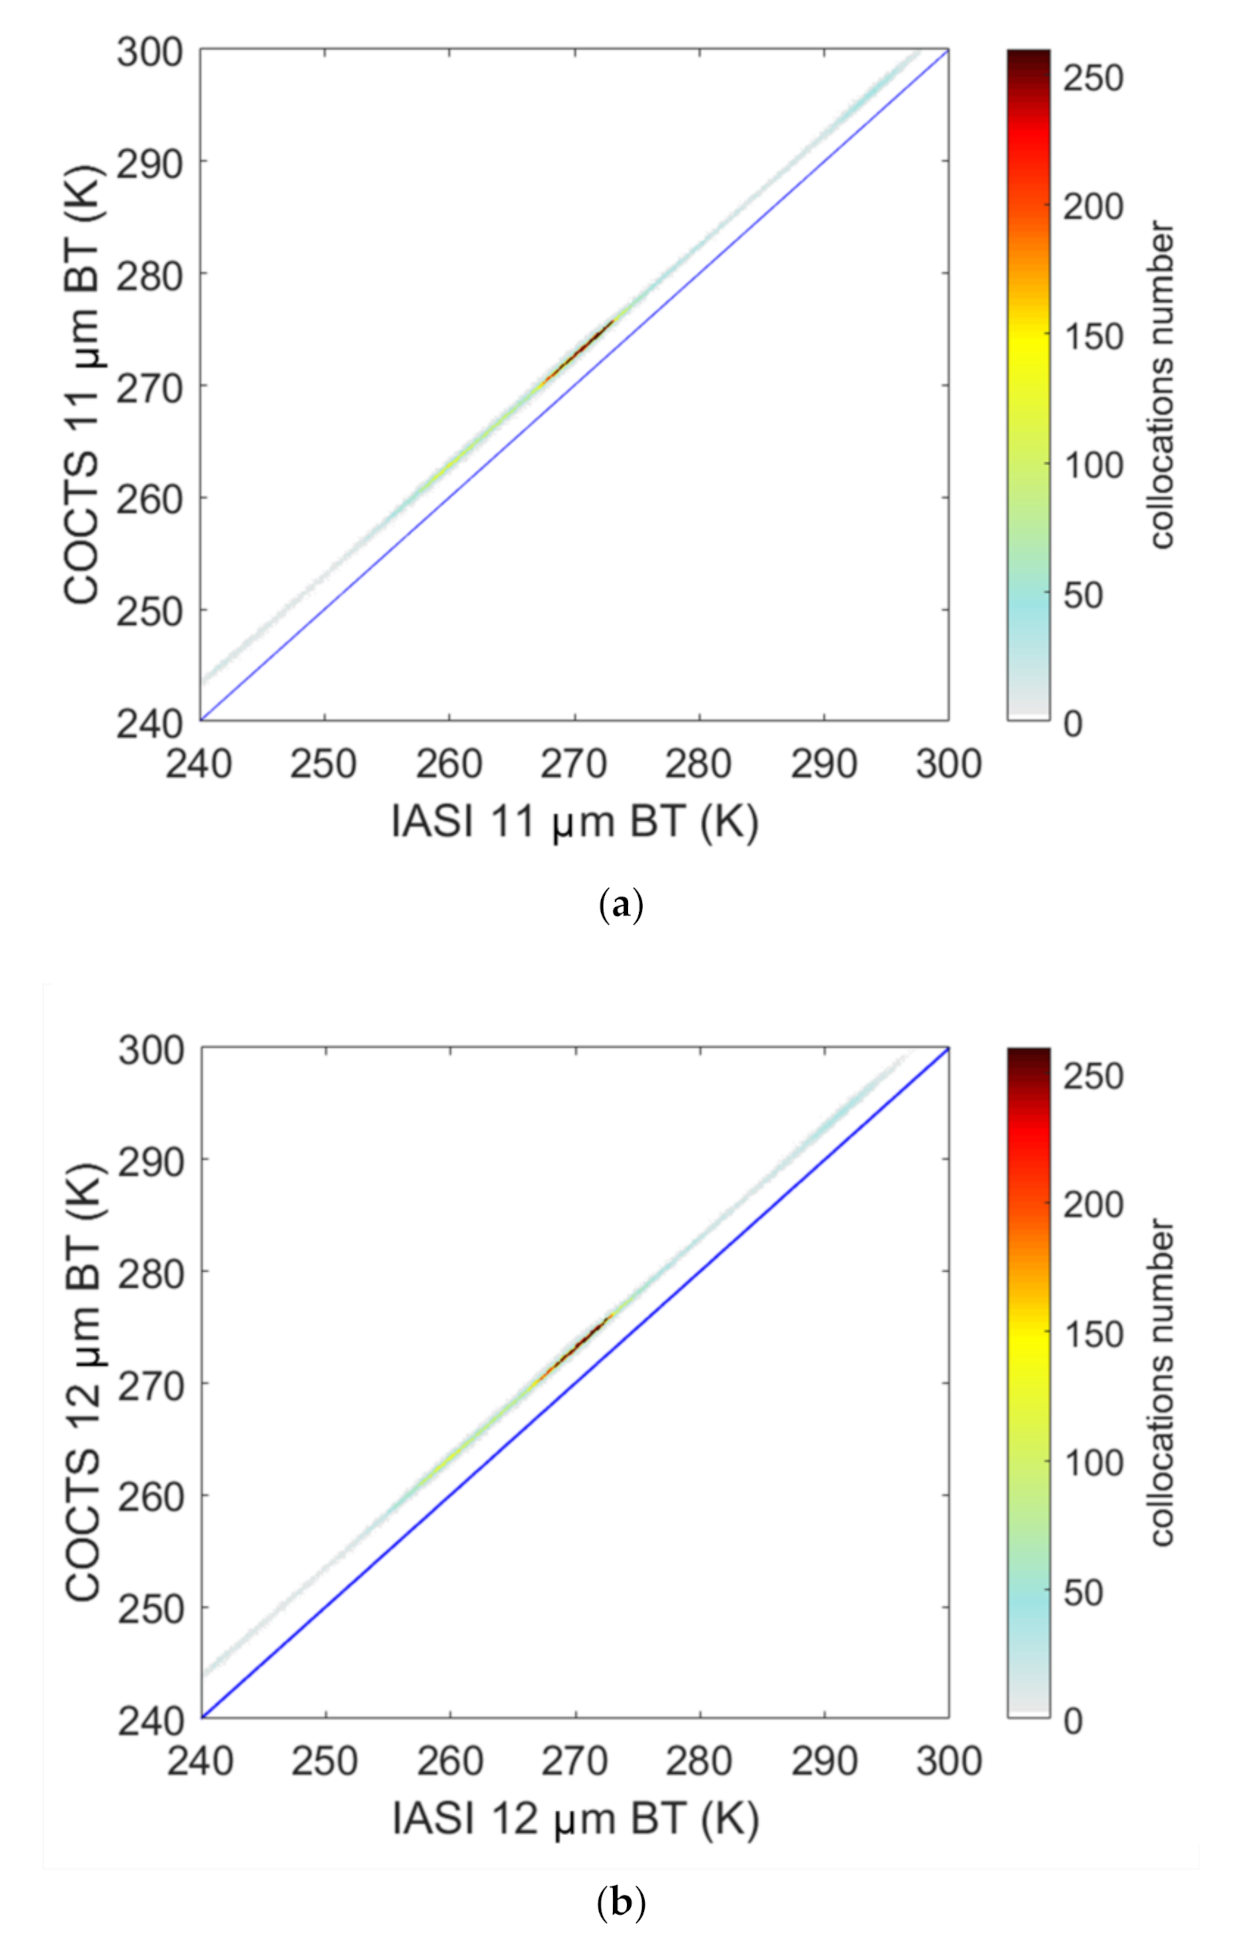
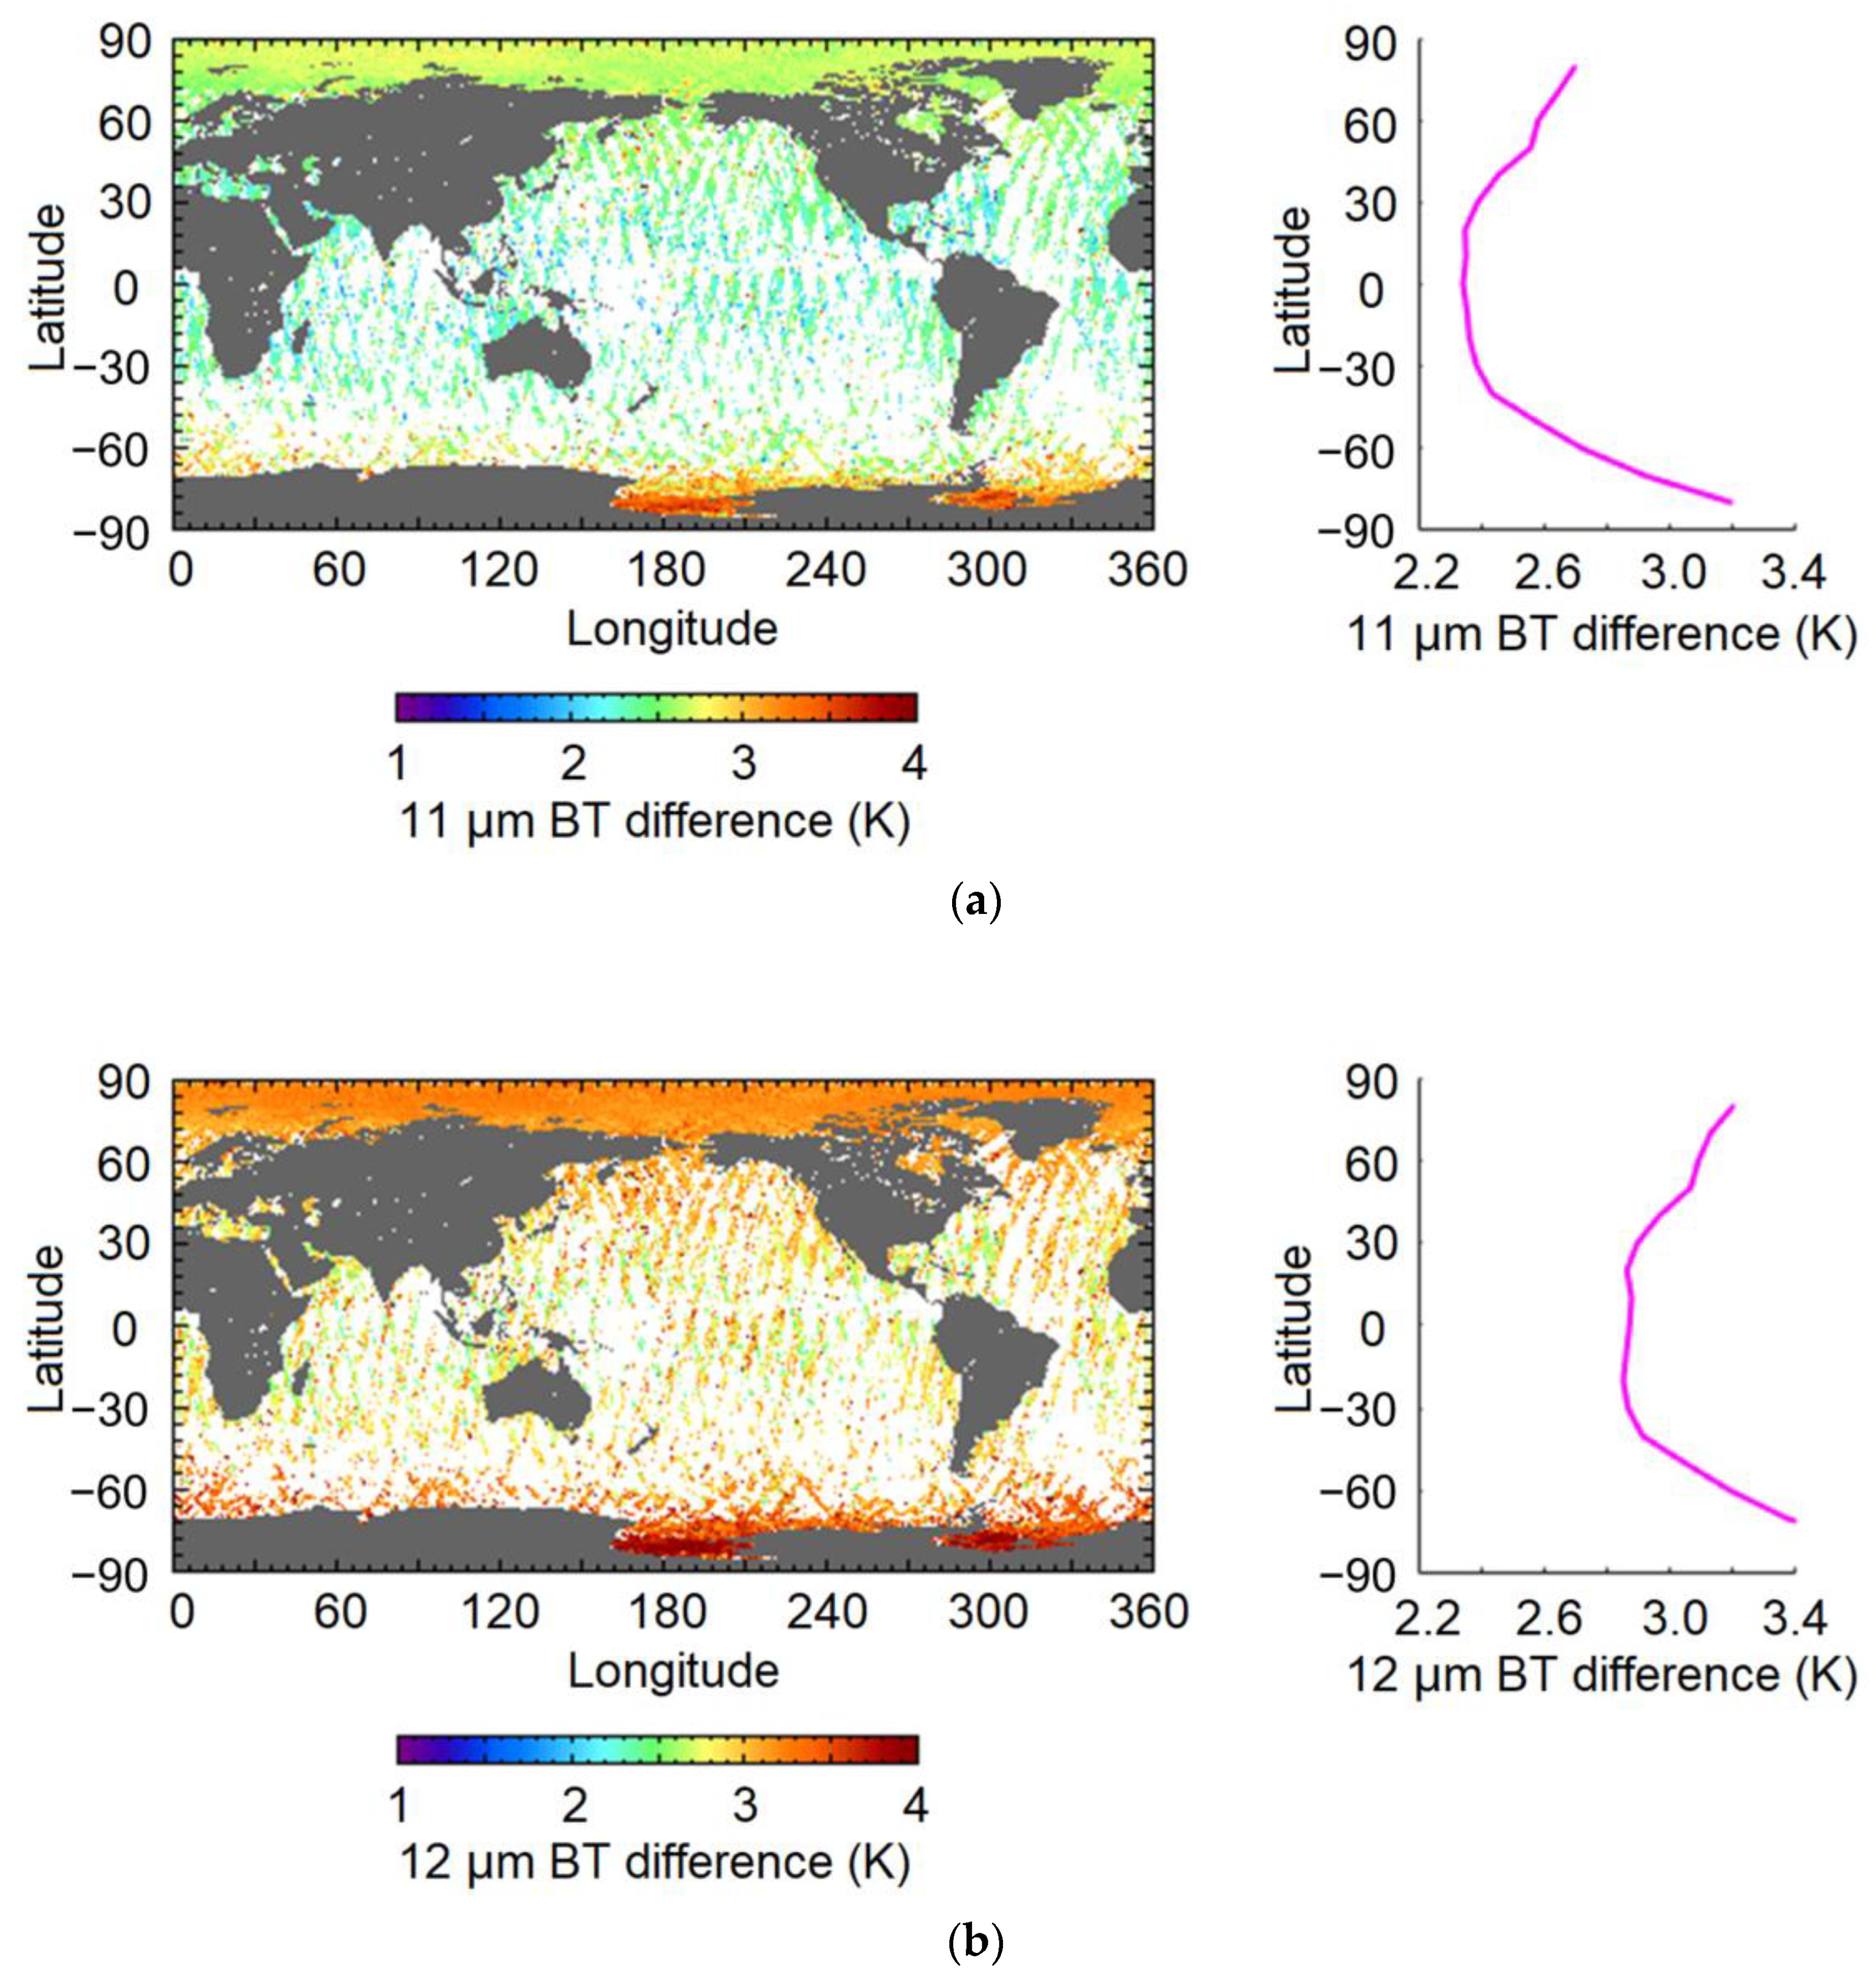
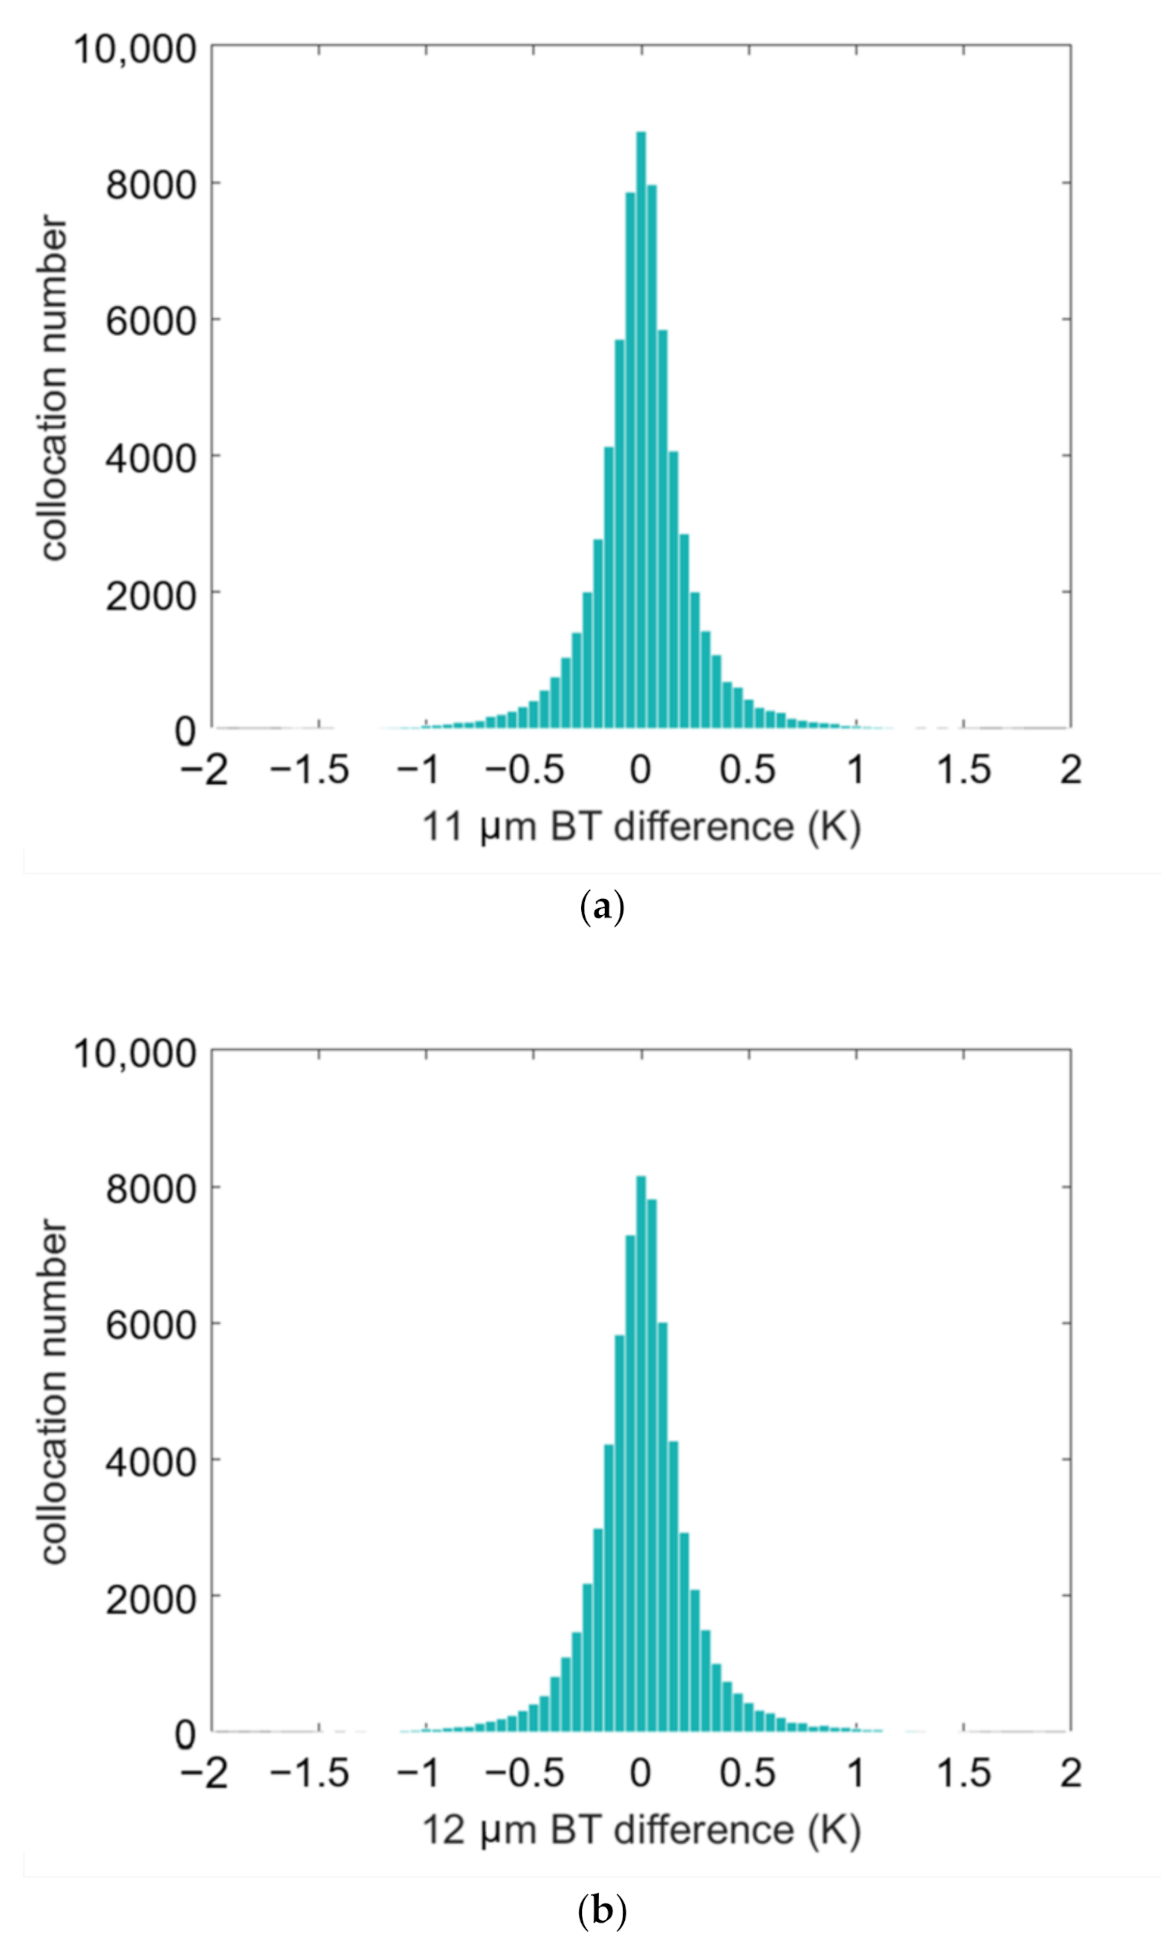
Based on the filtered matchups, the HY-1C COCTS 11 and 12 µm BTs are compared with IASI. Figure 4a,b show the histograms of the HY-1C COCTS minus IASI BT differences for the 11 and 12 µm channels. Figure 5a,b show the scatter diagrams of HY-1C COCTS BT and IASI BT for the 11 and 12 µm channels. The color in Figure 5 indicates the matchup numbers located in every 0.1 K HY-1C COCTS BT and 0.1 K IASI BT bin. The blue lines represent the positions where the HY-1C COCTS BTs equal IASI. It is obvious that the HY-1C COCTS 11 and 12 µm BTs are larger than those of IASI. In addition, the relationships between the HY-1C COCTS BTs and IASI are approximately linear for both channels. The overall statistics of the matchups show that the mean differences of HY-1C COCTS minus IASI for the 11 µm channel is 2.68 K, with a SD of 0.29 K. In addition, the bias of the BT difference between the COCTS 12 µm channel and IASI is 3.18 K, and the SD is 0.28 K. The left panels of Figure 6a,b show the geolocation distributions of the collocations in the global region, and the right panels show the plots of BT differences against latitude. The color in the left panels indicates the COCTS minus IASI BT differences of the collocations. The purple lines in the right panels are the plots of the mean values of the BT differences in 10° latitude bins. The distribution features for the 11 and 12 µm BT differences are similar. The positive BT differences of COCTS minus IASI show the obvious dependence on latitude, with larger values in high-latitude oceans. The span of the BT differences is around 0.8 and 0.6 K for the 11 and 12 µm channel, respectively. In addition, the collocations are densely distributed in the high-latitude region, because of the orbital overlap of COCTS and IASI.
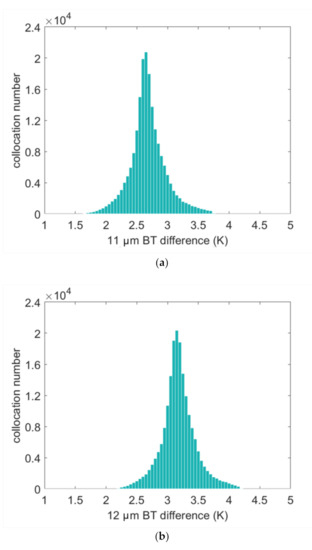
Figure 4.
The histograms of the HY-1C COCTS minus IASI BT differences: (a) 11 µm channel; (b) 12 µm channel.
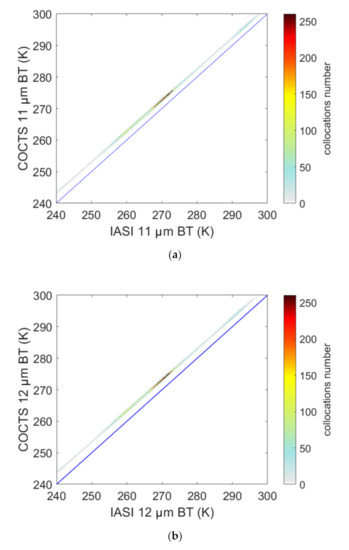
Figure 5.
The scatter diagrams of the HY-1C COCTS and IASI BTs for the (a) 11 and (b) 12 µm channel. The colored points show the collocated BT values of COCTS and IASI measurements. The blue lines represent the situation where COCTS BTs are equal to IASI BTs.
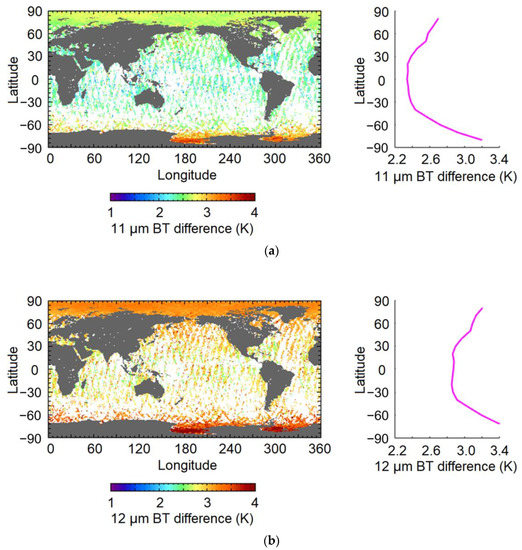
Figure 6.
The geophysical distribution of the COCTS minus IASI BT differences for (a) 11 and (b) 12 µm channel. The color in the left panels indicates the COCTS minus IASI BT differences of the collocations. The purple lines in the right panels are the variations in the mean values of BT differences in every 10° latitude bin.
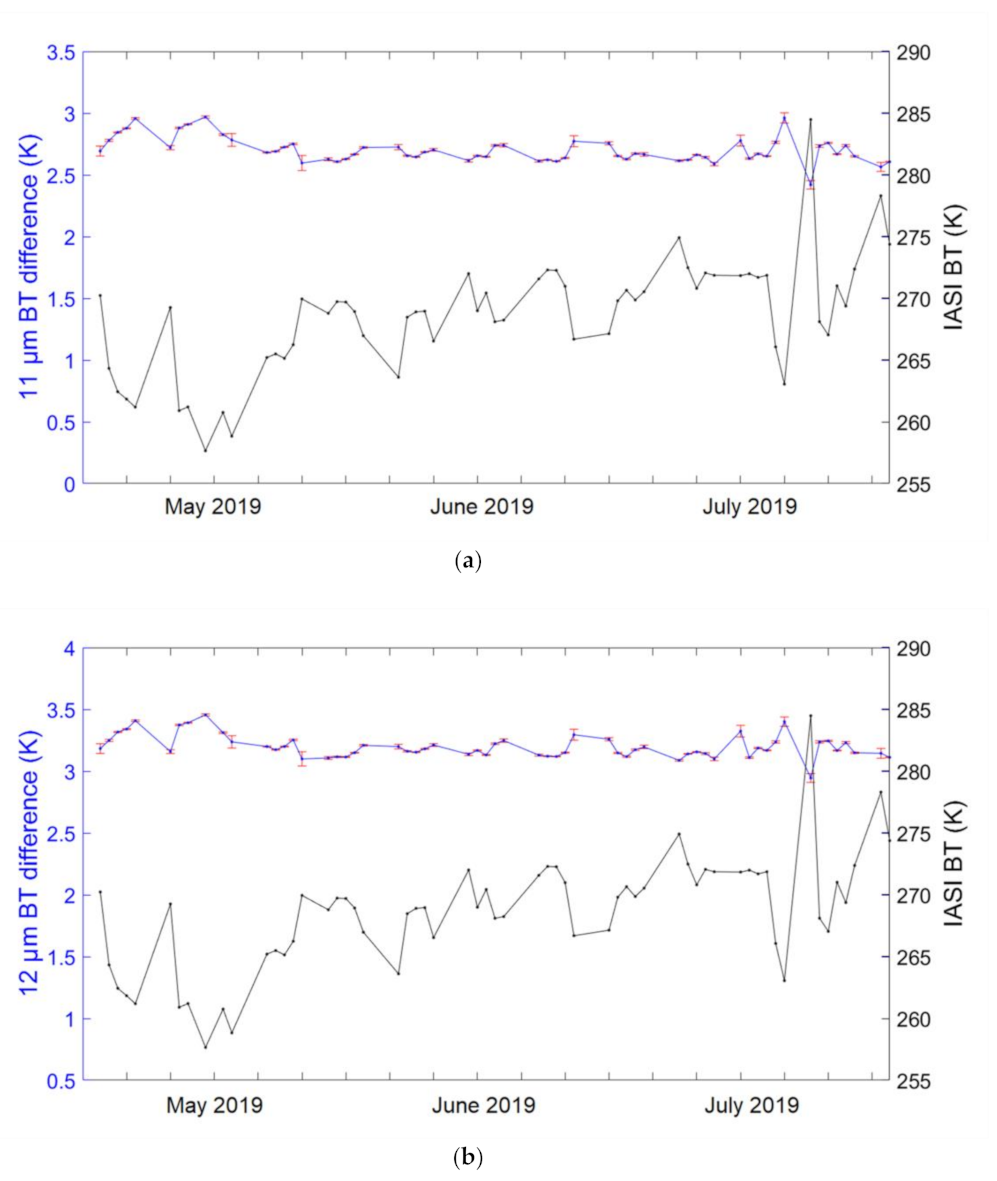
Figure 7a,b show the daily BT differences between COCTS and IASI in the period from 1 May to 31 July 2019. The upper blue lines show the variations in the daily mean differences, accompanied with the red vertical bars indicating the daily uncertainties in the mean (i.e., the SD/√n, n is the daily matchup number). The lower black lines represent the mean values of the IASI daily BTs. Each minor tick on the x-axis represents five days. The missing points indicate that the matchup numbers are smaller than 20 or the HY-1C COCTS data are invalid on these days. For the 11 µm channel, the daily biases change from 2.42 to 2.97 K with a median value of 2.67 K. For the 12 µm channel, the daily biases change from 2.95 to 3.46 K with a median value of 3.17 K. The fluctuation trends of the daily biases for both the 11 and 12 µm channel show the negative correlation with IASI daily BTs. Whether the fluctuations in daily biases are dominated by the time-dependent variation will be analyzed in Section 5.
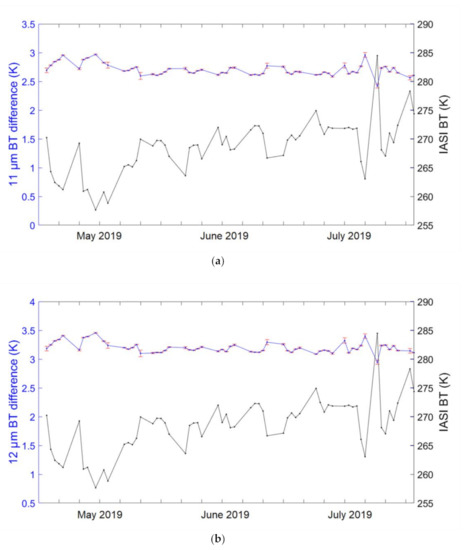
Figure 7.
The time series plot of the BT difference between COCTS and IASI from May to July 2019 for the (a) 11 and (b) 12 µm channels. The upper blue lines show the variations in the daily mean differences, accompanied with the red vertical bars indicating the daily uncertainties in the mean, corresponding to the left y-axis. The lower black lines represent the mean values of the IASI daily BTs corresponding to the right y-axis.
5. Discussions
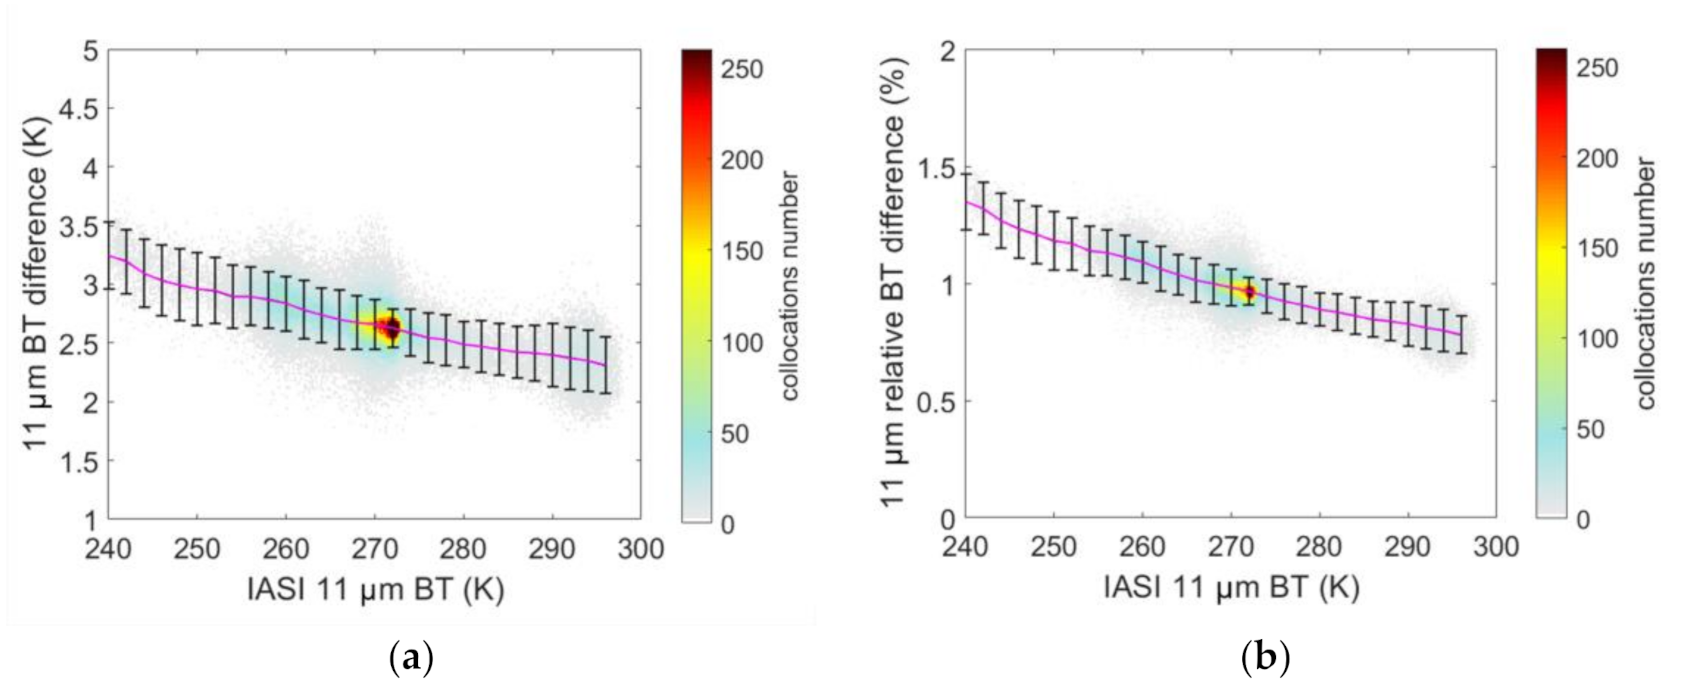
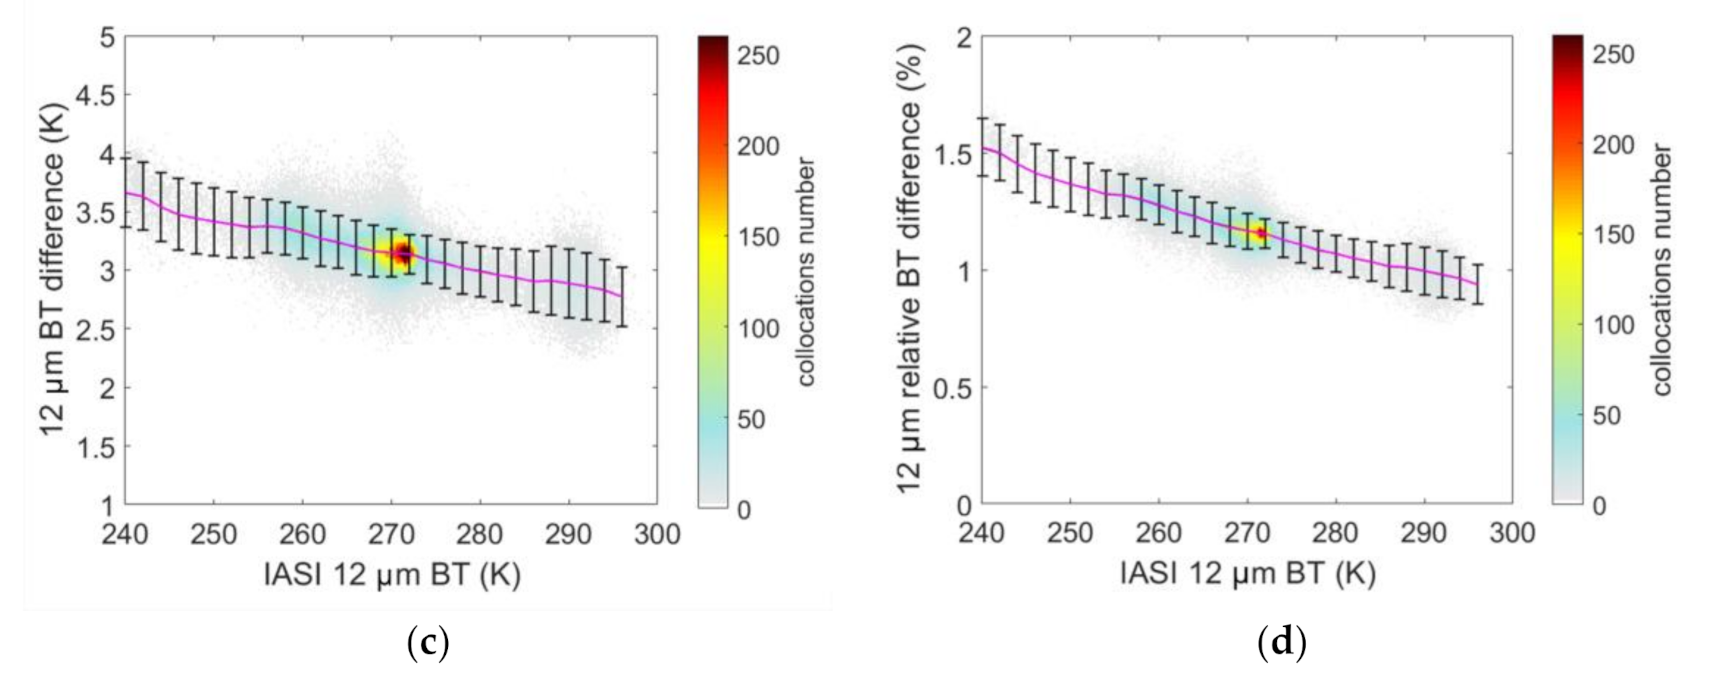
Based on the above comparison results, the dependences of the COCTS minus IASI BT differences on BT and TCWV are analyzed as follows. Figure 8a,c show the variations in the COCTS minus IASI BT differences against IASI BTs for the 11 and 12 µm channels, respectively. The background color indicates the distribution density of matchups, that is, the number of collocations in every minizone of 0.2 K IASI BT by 0.02 K BT difference. The purple curve shows the biases of the BT difference in every 2 K IASI BT bin, with the corresponding black vertical lines representing the SDs in the mean. Figure 8b,d show the variations in the COCTS minus IASI BT relative differences against IASI BTs for the 11 and 12 µm channels, respectively. The relative BT difference is calculated by dividing the IASI BT into the corresponding BT difference. The background color indicates the number of collocations in every minizone of 0.2 K IASI BT by a 0.005% relative BT difference. Both the absolute and relative BT differences of two channels represent an approximately linear dependence on IASI BTs. For the 11 µm channel, the mean value of the absolute BT difference is about 3.24 K when the IASI BT is around 240 K, and then keeps decreasing to 2.31 K when the IASI BT is about 296 K. The mean value of the absolute BT difference of the 12 µm channel has a similar dependence on the IASI BT, from 3.66 to 2.77 K. Overall, the mean values of the 11 and 12 µm BT differences in different IASI BT bins change around 1 K over the matchup range, corresponding to the range of the relative difference change around 5%, and the SDs remain stable around 0.2–0.3 K.
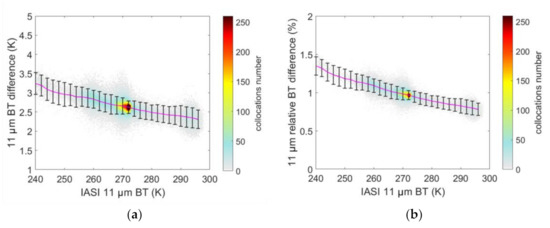
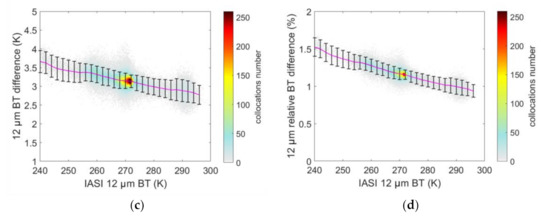
Figure 8.
The variations in (a) the 11 µm COCTS minus IASI BT difference, (b) the 11 µm COCTS minus IASI relative BT difference, (c) the 12 µm COCTS minus IASI BT difference, and (d) the 12 µm COCTS minus IASI relative BT difference against the IASI BTs.
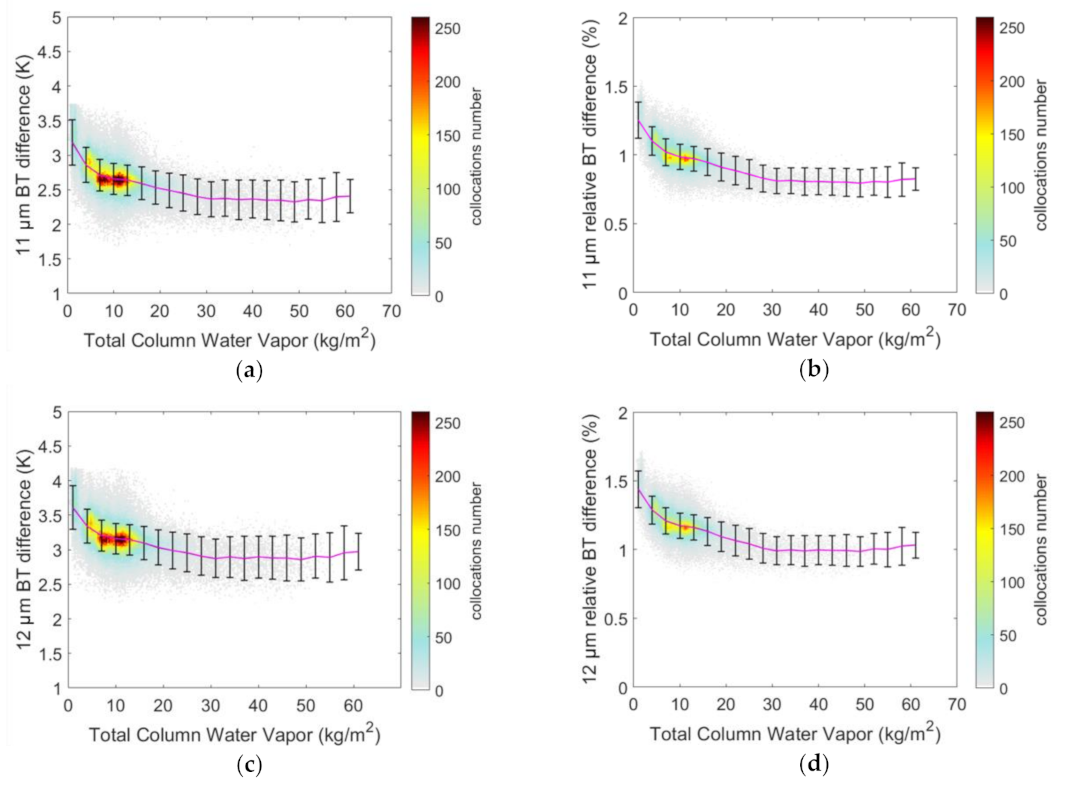
Next, the dependence of the BT differences on TCWV is analyzed. The TCWV data are provided from the ECMWF ERA5 hourly analysis data. As the spatial resolution of the TCWV data is on 0.25°, not equal to the spatial window of collocations, the TCWV data need to be interpolated to the collocation location. For each collocation, the nearest four TCWV pixels are found and then bi-linearly interpolated on the collocation position. In addition, on the time scale, the closest hour for TCWV is selected. Figure 9a,c show the variations in the absolute BT differences against TCWVs for 11 and 12 µm channels, respectively. Figure 9b,d show the corresponding variations in the relative BT differences against TCWVs. As the TCWVs are low in the high-latitude region, the TCWVs are lower than 20 kg/m2 for most collocations. For the 11 and 12 µm channel, the BT differences are relatively large in lower TCWV regions, and then decrease with increasing TCWVs. When the TCWVs are higher than 30 kg/m2, the BT differences basically remain stable. The absolute BT differences vary around 0.7 K and the relative BT differences change around 4% over the whole TCWV range.
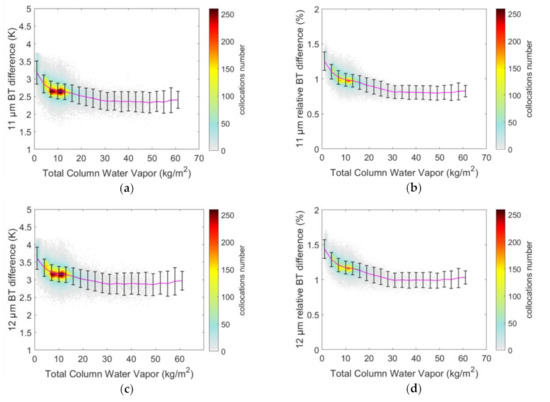
Figure 9.
The variations in (a) the 11 µm COCTS minus IASI BT difference, (b) the 11 µm COCTS minus IASI relative BT difference, (c) the 12 µm COCTS minus IASI BT difference, and (d) the 12 µm COCTS minus IASI relative BT difference against the total column water vapor (TCWV).
In addition, the BT-dependent bias in overall comparison results shown in Figure 8 and in the time series plots shown in Figure 7 are consistent, demonstrating that the fluctuation in daily biases is mainly because of the variation in daily BTs. In other words, this fluctuation is not the time-dependent variation. The uncertainty of nonlinearity correction and the stary light effect are possible reasons causing the BT-dependent and TCWV-dependent biases [10,26]. On the whole, the performance of the HY-1C COCTS thermal infrared calibration remain stable in the early operational stage. A further investigation will be carried out to verify the stability for longer time series. Although there still exist the mean BT differences around 3 K for the two HY-1C COCTS infrared channels, the SDs of the BT differences are lower than those between HY-1B COCTS and IASI, and the BT-dependences of BT differences are weaker compared with the HY-1B COCTS case, demonstrating that the calibration performance of HY-1C COCTS is greater than HY-1B COCTS. The systematic error of the HY-1C COCTS infrared calibration will be further carried out in our future study based on the L1A level data.
6. Corrections of the HY-1C COCTS Thermal Infrared BTs
Based on the analysis of the HY-1C COCTS minus IASI BT differences for the 11 and 12 μm channels, the HY-1C COCTS infrared original BTs are corrected in this section. Considering the approximately negative linear dependence of the BT differences on IASI BTs, the expression that represents the relationship between BT differences and IASI BTs can be shown as Equation (1), where and represent the COCTS and IASI BTs before correction, respectively. The slope and the offset are obtained using the robust linear regression; thus, the COCTS-corrected BTs, , are calculated using Equation (2). Furthermore, considering the matchup numbers are unevenly distributed against latitude, the latitude-dependent correction coefficients are obtained. We divided the global region into six latitude zones every 30° from 90° S to 90° N. Each regression was trained using the matchups in the corresponding latitude bin. For the COCTS pixel located at boundaries, the coefficients of its two neighboring latitude bins are used for BT correction, and the calculated BTs are linearly interpolated as the corrected BT. Two thirds of the matchups were randomly selected and used in the regression analysis.
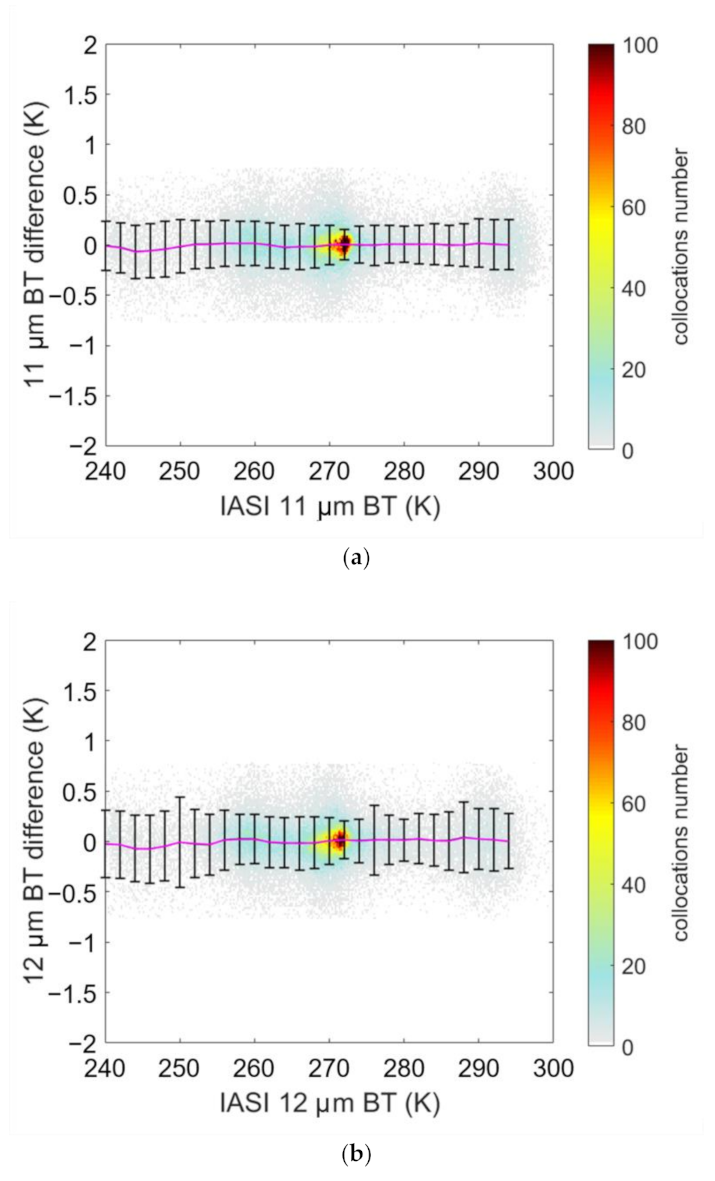
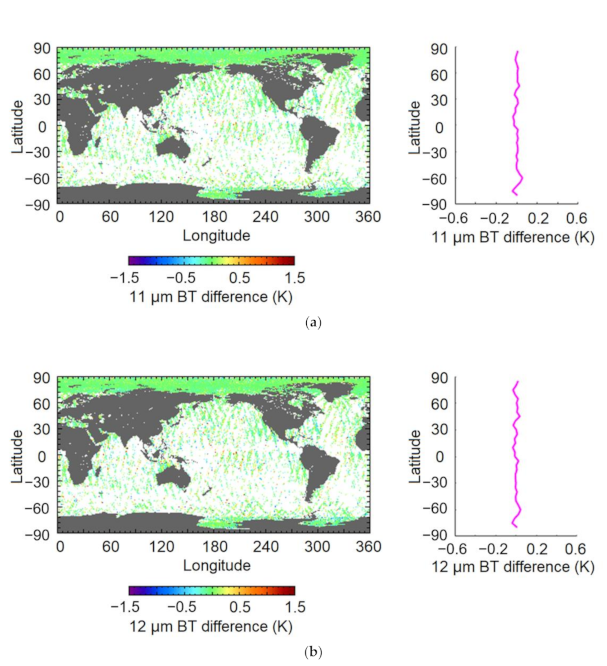
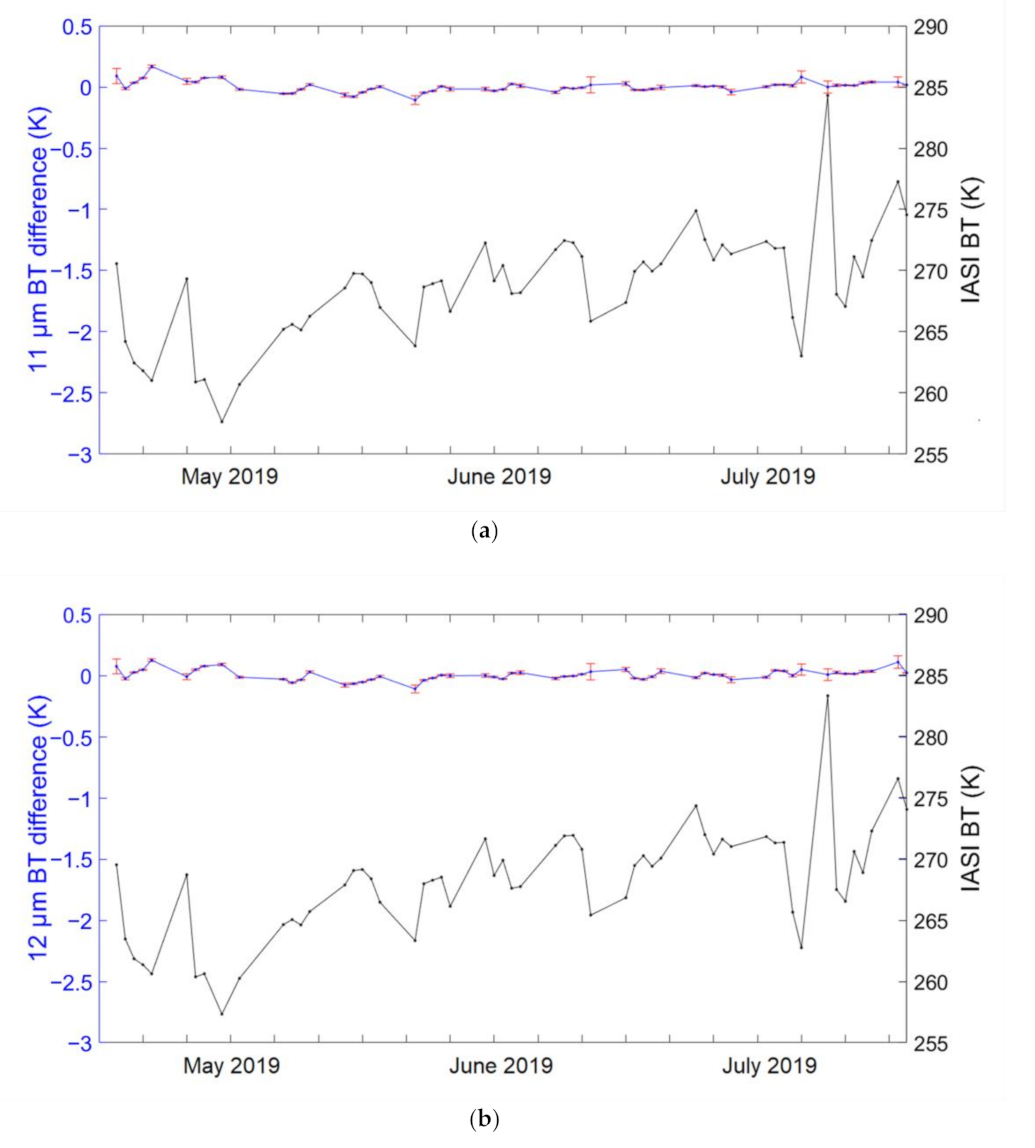
The remaining third of the matchups comprising 65,829 pairs were used to validate the regression. The histograms of the COCTS-corrected BT minus IASI BT differences for the 11 and 12 µm channels are shown in Figure 10a,b, respectively. Figure 11a,b show the variations in the COCTS-corrected BT minus IASI BT differences against the IASI BTs for 11 and 12 µm channels, respectively. It is obvious that the large biases between the COCTS Level 1B BTs and IASI BTs are removed. The BT-dependences of the BT differences are also corrected for these two channels. The overall statistics for the validation matchups show that the biases are both smaller than 0.01 K. The SDs are reduced to 0.21 K for both 11 and 12 µm channels. Figure 12a,b show the geolocation distributions of the COCTS-corrected BT minus IASI BT differences for the 11 and 12 µm channels, respectively, with the corresponding variations in the BT differences with latitude shown in the right panels. The significant regional differences in the original comparison results disappear. The absolute BT differences are lower than 0.2 K in most sea areas, although the collocations still exist with the relatively larger BT difference around 0.5 K. In addition, the variation curves against latitudes also become flatter compared to the right panels in Figure 6, indicating that the dependences of BT difference on latitude are also corrected. Figure 13a,b show the time series plots of the difference between the COCTS 11 and 12 µm channel-corrected BTs and IASI. Similar to Figure 7, the upper blue lines represent the daily biases and the red vertical bars represent the corresponding uncertainties. The lower black lines are the daily mean values of the IASI BT. Each minor tick on the x-axis represents five days. Table 2 shows the overall statistics and daily statistics of the COCTS-corrected BTs minus IASI BT differences for the 11 and 12 µm channels. For the 11 µm channel, the daily biases change from −0.11 to 0.17 K with a median value of 0.002 K. For the 12 µm channel, the daily biases change from −0.11 to 0.13 K with a median value of 0.002 K. The correlation between the daily BT differences and IASI BTs also disappears.
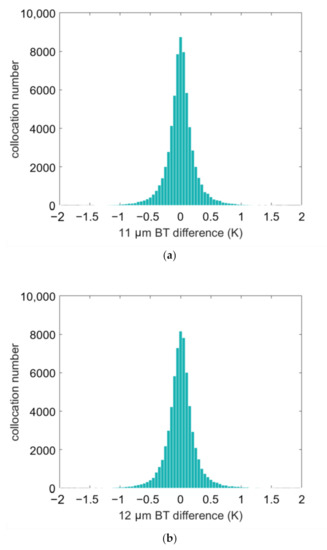
Figure 10.
The histograms of the COCTS-corrected BT minus IASI BT differences for the (a) 11 and (b) 12 µm channels.
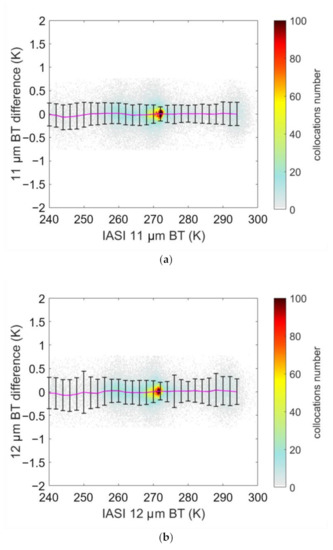
Figure 11.
The variations in the COCTS-corrected BT minus IASI BT differences against the IASI BTs for the (a) 11 and (b) 12 µm channels.
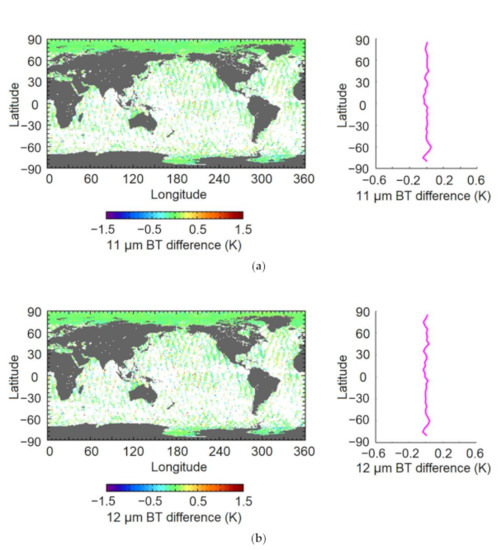
Figure 12.
The geophysical distribution of the COCTS-corrected BT minus IASI BT differences for the (a) 11 and (b) 12 µm channel. The color in the left panels indicates the COCTS-corrected BT minus IASI BT differences in the collocations. The purple lines on the right panels are the variations in mean values of the BT differences in every 10° latitude bin.
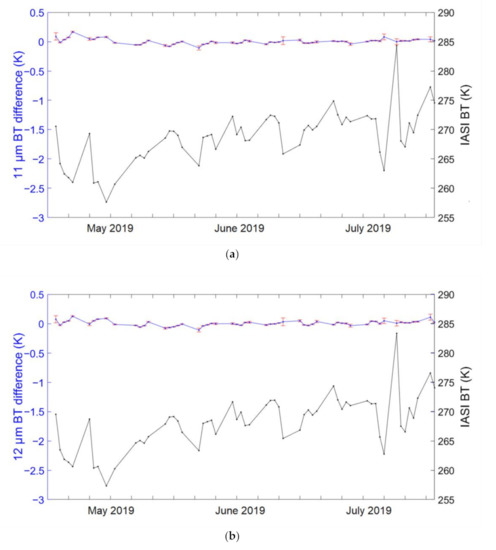
Figure 13.
The time series plots of the COCTS-corrected BT minus IASI BT difference from May to July 2019 for the (a) 11 and (b) 12 μm channels. The upper blue lines show the variations in the daily mean differences, accompanied with the red vertical bars indicating the daily uncertainties in the mean, corresponding to the left y-axis. The lower black lines represent the mean values of the IASI daily BTs corresponding to the right y-axis.

Table 2.
The statistics of the HY-1C COCTS-corrected BTs minus IASI BT differences for the 11 and 12 µm channels.
7. Conclusions
In this paper, the first assessment of the HY-1C COCTS thermal infrared calibration is conducted using IASI as the reference instrument. The HY-1C COCTS and IASI measurements are collocated and the matchups located in a uniform scene are selected. The statistics show that the biases of the COCTS 11 μm BT minus IASI differences are 2.68 K and the SD is 0.29 K. For the 12 μm channel, the mean difference of COCTS minus IASI BT is 3.18 K and the SD is also 0.28 K. The dependences of the BT difference on IASI BT are both obvious for these two channels. The time series plots of the BT differences demonstrate that no obvious time-dependent variation appears. Overall, the thermal infrared calibration of HY-1C COCTS is stable, with a low SD, although a systematic bias indeed exists. Based on the comparison analysis, the systematic biases of COCTS infrared BTs are corrected using the linear robust regression. After the inter-calibration, the mean differences between the COCTS-corrected BTs and IASI are removed, with the values lower than 0.01 K, and the SDs are reduced to 0.21 K for both 11 and 12 μm channels. The BT-dependences of the BT differences are also corrected. The long time series assessment and the monitoring of the HY-1C COCTS thermal infrared calibration performance will be further carried out. In our future study, we will also investigate the calibration procedure and improve the onboard calibration model for the new release of updated products.
Author Contributions
Conceptualization, M.L., L.G. and J.L.; data curation, J.L., Q.S. and C.M.; formal analysis, M.L., L.G., Q.S. and C.M.; funding acquisition, M.L. and L.G.; methodology, M.L. and L.G.; software, M.L. and N.L.; writing—original draft, M.L.; writing—review and editing, L.G., J.L., Q.S., C.M. and N.L. All authors have read and agreed to the published version of the manuscript.
Funding
This research was funded by the National Natural Science Foundation of China, grant number 42006161; the National Key R&D Program of China, grant number 2019YFA0607001; the National Program on Global Change and Air–Sea Interaction, grant number GASI-02-PACINDYGST2-03; and Natural Science Foundation of Shandong, grant number ZR2020QD109.
Institutional Review Board Statement
Not applicable.
Informed Consent Statement
Not applicable.
Data Availability Statement
MetOp-B IASI spectral radiance data can be requested from the EUMETSAT Earth Observation Portal website (https://eoportal.eumetsat.int/ accessed on 8 February 2021). HY-1C COCTS data can be requested from the NSOAS data distribution website (https://osdds.nsoas.org.cn/#/ accessed on 8 February 2021). ERA5 TCWV data can be requested from the Copernicus Climate Data Store (https://cds.climate.copernicus.eu/cdsapp#!/dataset/reanalysis-era5-single-levels?tab=form accessed on 8 February 2021). The analysis data presented in this study are available on request from the corresponding author.
Acknowledgments
EUMETSAT provided the MetOp-B IASI data. NSOAS provided the HY-1C COCTS data. ECMWF provided the ERA5 data.
Conflicts of Interest
The authors declare no conflict of interest.
References
- Chander, G.; Hewison, T.J.; Fox, N.; Wu, X.; Xiong, X.; Blackwell, W.J. Overview of intercalibration of satellite instruments. IEEE Trans. Geosci. Remote Sens. 2013, 51, 1056–1080. [Google Scholar] [CrossRef]
- Gunshor, M.; Schmit, T.; Menzel, P.; Tobin, D. Intercalibration of broadband geostationary imagers using AIRS. J. Atmos. Ocean. Technol. 2009, 51, 746–758. [Google Scholar] [CrossRef]
- Tobin, D.C.; Revercomb, H.E.; Moeller, C.C.; Pagano, T. Use of Atmospheric Infrared Sounder high–spectral resolution spectra to assess the calibration of Moderate resolution Imaging Spectroradiometer on EOS Aqua. J. Geophys. Res. 2006, 111, D09S05. [Google Scholar] [CrossRef]
- Wang, L.; Cao, C.; Ciren, P. Assessing NOAA-16 HIRS radiance accuracy using simultaneous nadir overpass observations from AIRS. J. Atmos. Oceanic Technol. 2007, 24, 1546–1561. [Google Scholar] [CrossRef]
- Hewison, T.J.; Wu, X.; Yu, F.; Tahara, Y.; Hu, X.; Kim, D.; Koenig, M. GSICS inter-calibration of infrared channels of geostationary imagers using Metop/IASI. IEEE Trans. Geosci. Remote Sens. 2013, 51, 1160–1170. [Google Scholar] [CrossRef]
- Hewison, T.J. An evaluation of the uncertainty of the GSICS SEVIRI-IASI intercalibration products. IEEE Trans. Geosci. Remote Sens. 2013, 51, 1171–1181. [Google Scholar] [CrossRef]
- Hewison, T.J.; Doelling, D.R.; Lukashin, C.; Tobin, D.; John, V.O.; Joro, S.; Bojkov, B. Extending the Global Space-Based Inter-Calibration System (GSICS) to Tie Satellite Radiances to an Absolute Scale. Remote Sens. 2020, 12, 1782. [Google Scholar] [CrossRef]
- Illingworth, S.M.; Remedios, J.J.; Parker, R.J. Intercomparison of integrated IASI and AATSR calibrated radiances at 11 and 12 µm. Atmos. Chem. Phys. 2009, 9, 6677–6683. [Google Scholar] [CrossRef]
- Liu, M.; Merchant, C.J.; Guan, L.; Mittaz, J.P.D. Inter-Calibration of HY-1B/COCTS Thermal Infrared Channels with MetOp-A/IASI. Remote Sens. 2018, 10, 1173. [Google Scholar] [CrossRef]
- Wang, L.; Cao, C. On-orbit calibration assessment of AVHRR longwave channels on MetOp-A using IASI. IEEE Trans. Geosci. Remote Sens. 2008, 46, 4005–4013. [Google Scholar] [CrossRef]
- Li, Y.; Wu, A.; Xiong, X. Inter-comparison of S-NPP VIIRS and Aqua MODIS thermal emissive bands using hyperspectral infrared sounder measurements as a transfer reference. Remote Sens. 2016, 8, 72. [Google Scholar] [CrossRef]
- HY-1C Official Introduction on NSOAS Website. Available online: http://www.nsoas.org.cn/eng/item/204.html (accessed on 4 August 2020).
- Song, Q.; Chen, S.; Xue, C.; Lin, M.; Du, K.; Li, S.; Ma, C.; Tang, J.; Liu, J.; Zhang, T.; et al. Vicarious calibration of COCTS-HY1C at visible and near-infrared bands for ocean color application. Opt. Express 2019, 27, A1615–A1626. [Google Scholar] [CrossRef] [PubMed]
- Ye, X.; Wang, Q.; Liu, J.; Shi, L.; Zou, B.; Ding, J.; Song, Q. Sea Surface Temperature of China Ocean Color and Temperature Scanner (COCTS) onboard HY-1C Satellite. In Proceedings of the 20th GHRSST International Science Team Meeting, Frascati, Italy, 3–7 June 2019. [Google Scholar]
- Merchant, C.J.; Embury, O.; Bulgin, C.E.; Block, T.; Corlett, G.K.; Fiedler, E.; Good, S.A.; Mittaz, J.; Rayner, N.A.; Berry, D.; et al. Satellite-based time-series of sea surface temperature since 1981 for climate applications. Sci. Data 2019, 6, 223. [Google Scholar] [CrossRef] [PubMed]
- Guan, L.; Men, C. Sea Surface temperature from HY-1B COCTS. In Proceedings of the 2013 IEEE International Geoscience and Remote Sensing Symposium-IGARSS, Melbourne, Australia, 21–26 July 2013. [Google Scholar] [CrossRef]
- IASI Level 1: Product Guide; EUMETSAT: Darmstadt, Germany, 2017.
- Blumstein, D.; Chalon, G.; Carlier, T.; Buil, C.; Hebert, P.; Maciaszek, T.; Ponce, G.; Phulpin, T.; Tournier, B.; Simeoni, D.; et al. IASI instrument: Technical overview and measured performances. In Proceedings of the Infrared Spaceborne Remote Sensing XII, Denver, CO, USA, 4 November 2004; Volume 5543, pp. 196–208. [Google Scholar]
- Hilton, F.; Armante, R.; August, T.; Barnet, C.; Bouchard, A.; Camy-Peyret, C.; Capelle, V.; Clarisse, L.; Clerbaux, C.; Coheur, P.F.; et al. Hyperspectral Earth observation from IASI: Five years of accomplishments. Bull. Am. Meteorol. Soc. 2012, 93, 347–370. [Google Scholar] [CrossRef]
- GSICS Traceability Statement for IASI and AIRS; EUMETSAT: Darmstadt, Germany, 2011.
- Wang, L.; Goldberg, M.; Wu, X.; Cao, C.; Iacovazzi, R.A.; Yu, F.; Li, Y. Consistency assessment of Atmospheric Infrared Sounder and Infrared Atmospheric Sounding Interferometer radiances: Double differences versus simultaneous nadir overpasses. J. Geophys. Res. 2011, 116, D11111. [Google Scholar] [CrossRef]
- HY-1C COCTS Data Distribution Website. Available online: https://osdds.nsoas.org.cn/#/ (accessed on 2 August 2020).
- IASI Level 1 Product Format Specification; EUMETSAT: Darmstadt, Germany, 2017.
- ERA5 Data Introduction. Available online: https://climate.copernicus.eu/climate-reanalysis (accessed on 4 August 2020).
- Hersbach, H.; Bell, B.; Berrisford, P.; Hirahara, S.; Horányi, A.; Muñoz-Sabater, J.; Nicolas, J.; Peubey, C.; Radu, R.; Schepers, D.; et al. The ERA5 global reanalysis. Q. J. R. Meteorol. Soc. 2020, 146, 1999–2049. [Google Scholar] [CrossRef]
- Hunt, S.E.; Mittaz, J.P.D.; Smith, D.; Polehampton, E.; Yemelyanova, R.; Woolliams, E.; Donlon, C. Comparison of the Sentinel-3A and B SLSTR Tandem Phase Data Using Metrological Principles. Remote Sens. 2020, 12, 2893. [Google Scholar] [CrossRef]
Publisher’s Note: MDPI stays neutral with regard to jurisdictional claims in published maps and institutional affiliations. |
© 2021 by the authors. Licensee MDPI, Basel, Switzerland. This article is an open access article distributed under the terms and conditions of the Creative Commons Attribution (CC BY) license (http://creativecommons.org/licenses/by/4.0/).

