Article

Analysis of the Characteristics of Climate Change in the Ecologically Vulnerable Area of the Mu Us Dune Field under the Background of Global Warming

College of Geology Engineering and Geomatics, Chang’an University, Xian 710054, Shaanxi, China
*
Author to whom correspondence should be addressed.
Remote Sens. 2021, 13(4), 627; https://doi.org/10.3390/rs13040627
Submission received: 12 January 2021 / Revised: 2 February 2021 / Accepted: 4 February 2021 / Published: 9 February 2021
(This article belongs to the Special Issue Societal Applications of Remote Sensing Data)

Abstract

:
The Mu Us dune field is one of China’s four major dune fields, which are ecologically vulnerable areas of northwest semiarid land across Shaanxi, Ningxia, and Inner Mongolia, also very sensitive to the global temperature rise and environmental changes. This paper uses data on the temperature, precipitation, and precipitable water vapor (PWV) in the Mu Us dune field and its surrounding areas to analyze and discuss the time series and spatial distribution characteristics of these three factors in this area. The results of the study show that, in recent years, the trend of temperature increase in the Mu Us dune field has been higher than the average level in China, but this trend has gradually subsided since 2000. The spatial distribution of temperature presents an obvious characteristic of gradual increase from north to south and is affected by latitude, altitude, and topography. The annual cumulative precipitation of the Mu Us dune field is lower than the average level in China. However, in recent years, the rate of the increase in precipitation in this area has been significantly higher than that of the average rate of increase in China. The eastern part of the dune field has the most precipitation, which gradually decreases to the west. The spatial distribution of precipitation is greatly affected by monsoon factors in the region and the distribution of rivers. In the research field, PWV has been rising in recent years, which is greatly related to the increase of vegetation coverage in this region. This demonstrates that the Mu Us dune field has experienced a “warmer and wetter” trend in recent years.

1. Introduction

Climate change has always been a hot issue, focused on by scientific researchers around the world [1,2,3,4,5,6]. Deepening the understanding of climate change can provide a scientific basis for human beings to conduct reasonable practical activities [7]. Ecologically vulnerable areas are areas where the current ecological conditions are no longer able to support continued social and economic development, or where the current economic development model will seriously affect ecological security. Ecologically vulnerable areas have the characteristics of eco-fragile environments, a low resistance to external interference, a poor stability, and a higher sensitivity to global climate change than other areas.
Vegetation is a natural link that connects the soil, atmosphere, and precipitation, and has the effect of cooling and dampening, which stabilizes the regional climate [8]. However, the impact of vegetation on climate is a two-way process, i.e., climatic factors can also affect the distribution of vegetation and promote or inhibit its growth. Temperature and precipitation are two basic elements of climate and two major environmental factors affecting the ecological environment, directly impacting the growth and development of vegetation. Water vapor is one of the most active components in the atmosphere, and its content is closely related to surface evaporation and atmospheric circulation, directly affecting the redistribution of global water resources. It is also an important factor in the assessment of ecological environment changes. As early as 1998, Yang et al. [7] analyzed the relationship between North American grassland climatic factors and NDVI (Normalized Difference Vegetation Index). They demonstrated that there is a positive correlation between NDVI and precipitation in summer, and an obvious negative correlation with evapotranspiration in spring. Liu et al. [9] discussed the changing trend of global NDVI from 1982 to 1990 and analyzed its correlation with climatic elements. Additionally, Liu et al. [10] found that an increase in forest coverage makes a region cool in summer and warm in winter. Many scholars have discussed the important role of vegetation in regional climate change.
With the progress of global warming and the implementation of protection and restoration policies proposed by the Chinese government for semiarid eco-fragile areas, the environmental and climatic conditions of these ecologically vulnerable areas have undergone tremendous changes. Scientific assessment of climate development is required to respond to climate change. In the past hundred years, many experts and scholars have conducted relevant studies on climate change in the northwest of China and the whole of China [11,12,13,14,15,16,17], and have drawn many valuable and meaningful conclusions. However, due to objective factors, such as technical conditions and a lack of observational data, how the climate in the eco-fragile area of the Mu Us dune field in China has responded to global warming over the years, and the actual impact of the project of returning sand to forests on climatic factors such as temperature and precipitation in the region, have been less well researched. At the same time, the restoration and maintenance of the ecologically vulnerable sandy land is a major issue that needs continuous attention. Whether the current natural conditions can help the restoration of cultivated land vegetation and natural vegetation is also an important issue that needs to be urgently evaluated. Therefore, this article takes the Mu Us dune field as the research area to conduct a scientific and systematic analysis of relevant climatic factors. It lays a theoretical foundation for the development of forestry, agriculture, and other regional economic construction in China’s sandy eco-fragile areas and provides useful guidance for studying the characteristics of climate change in sandy eco-fragile areas, as well as responses to global warming.

2. Material and Methods
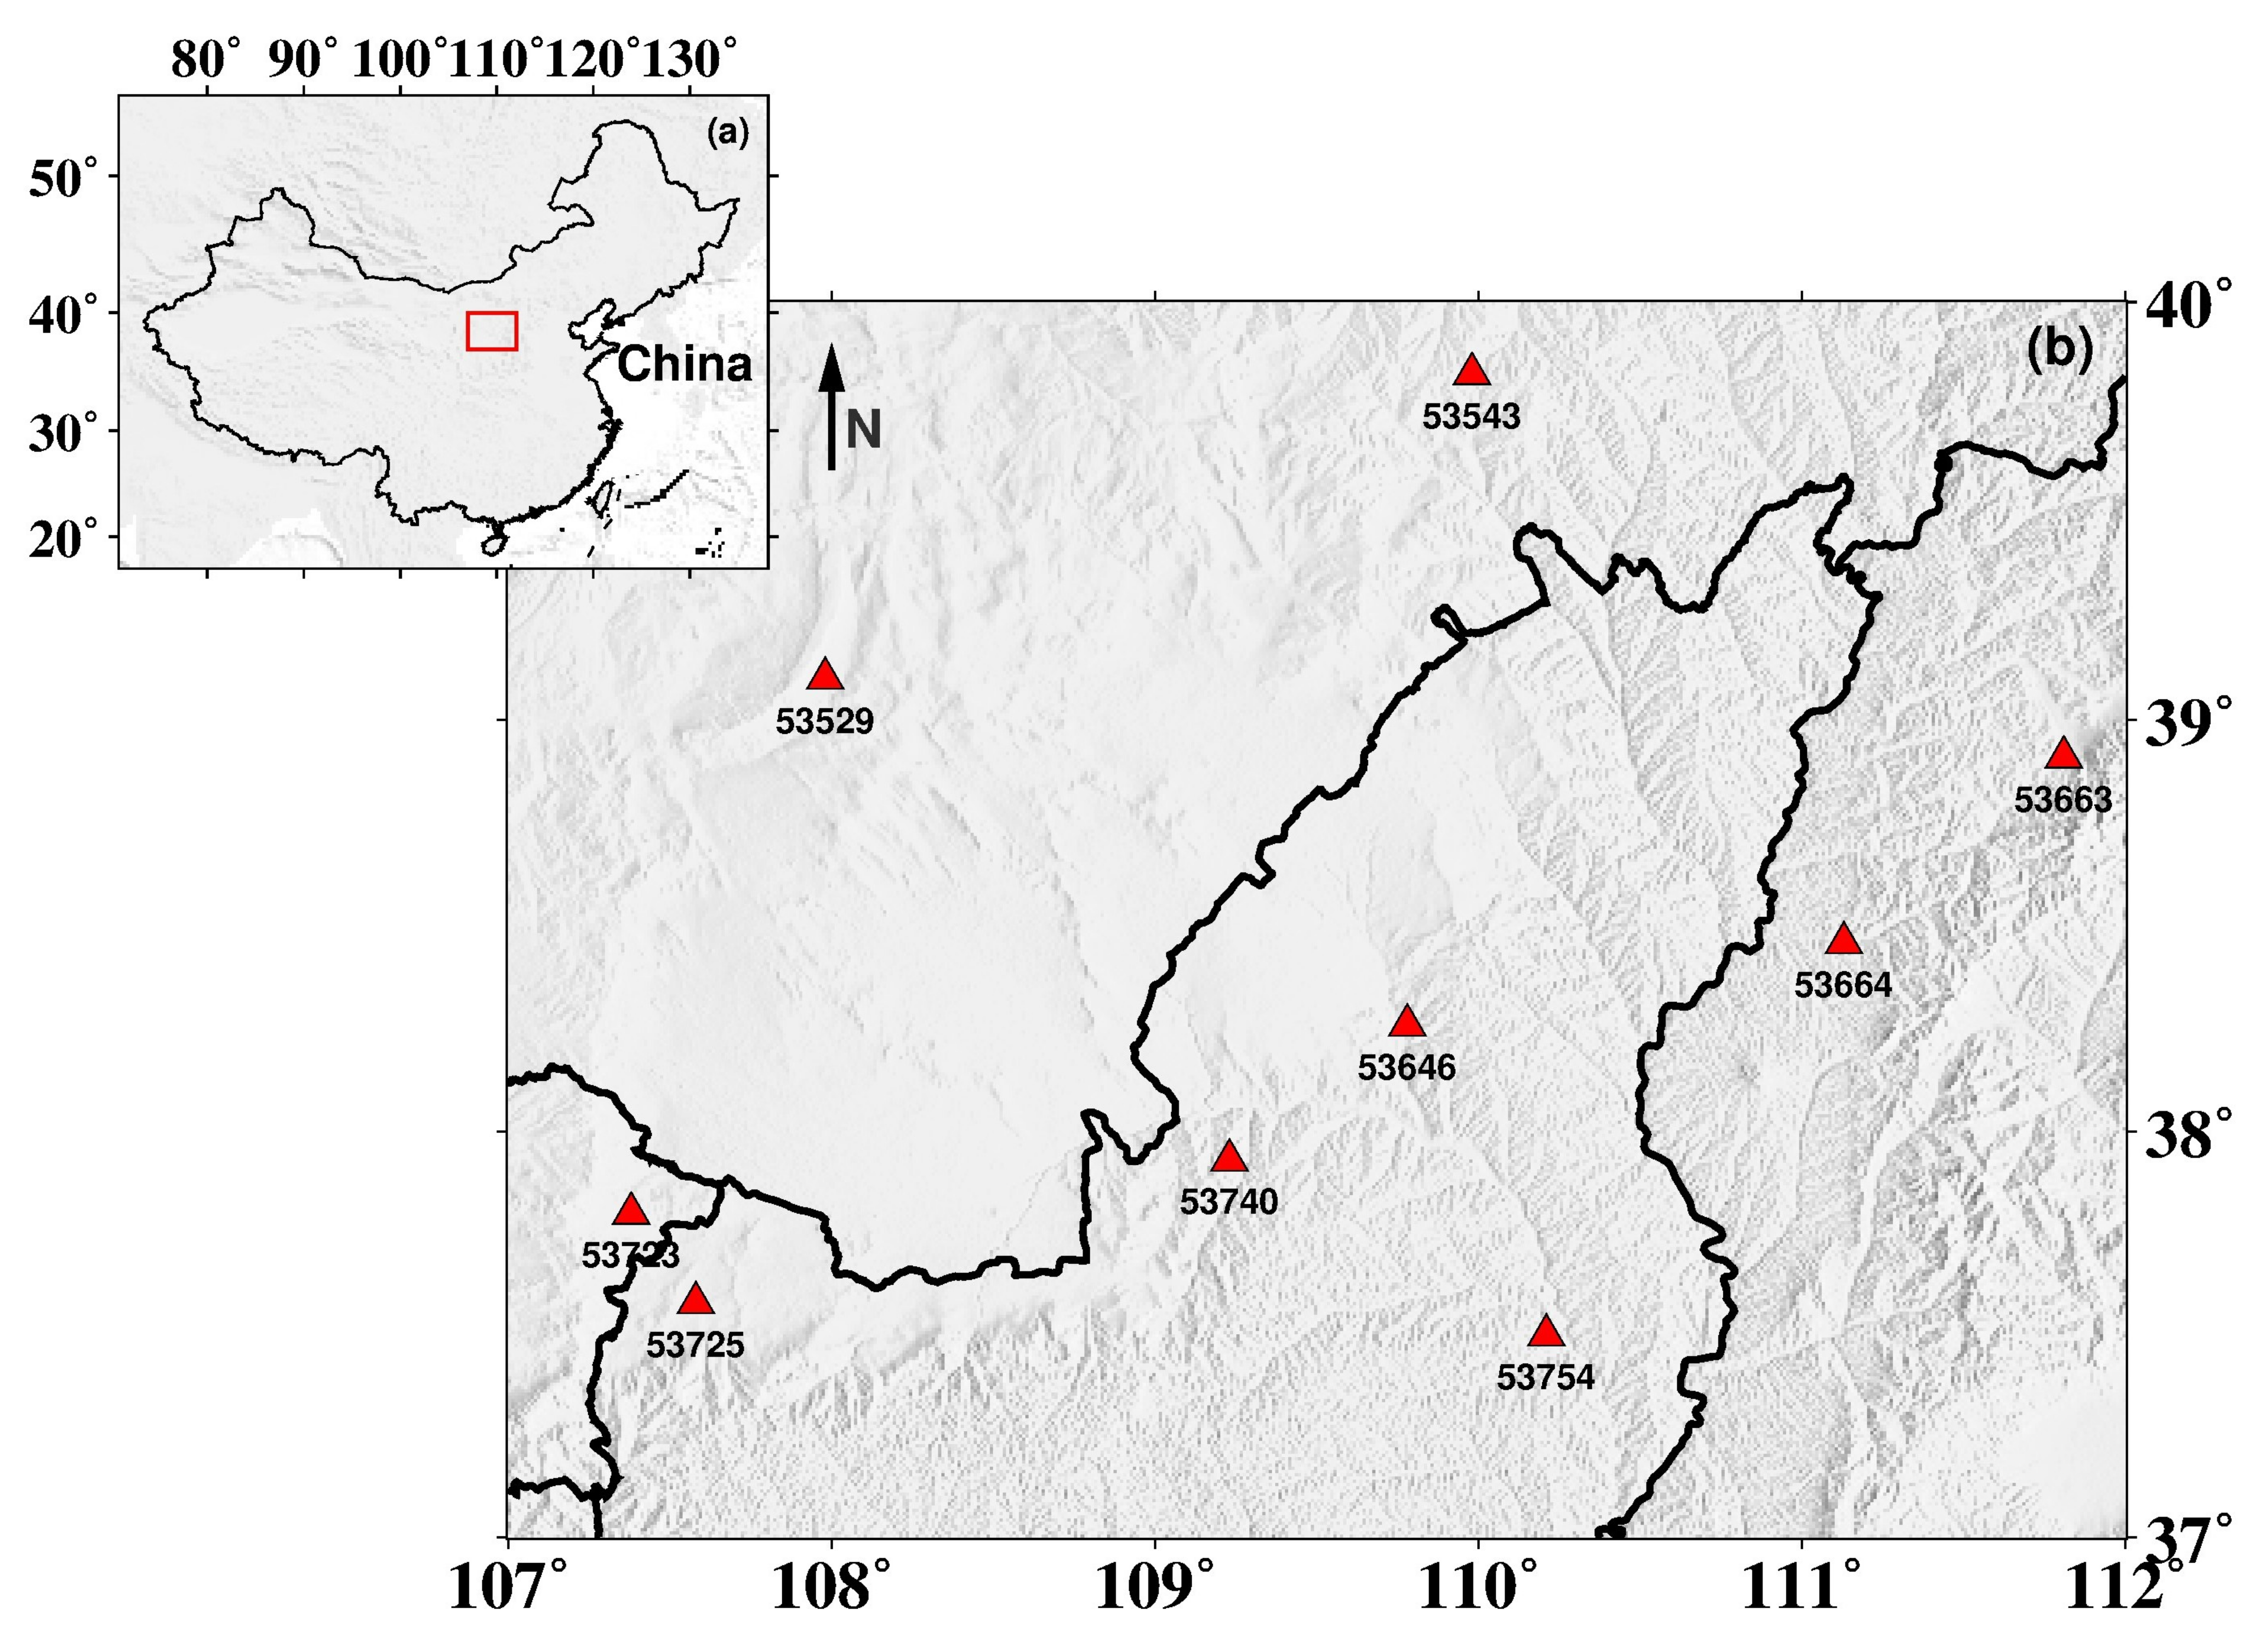
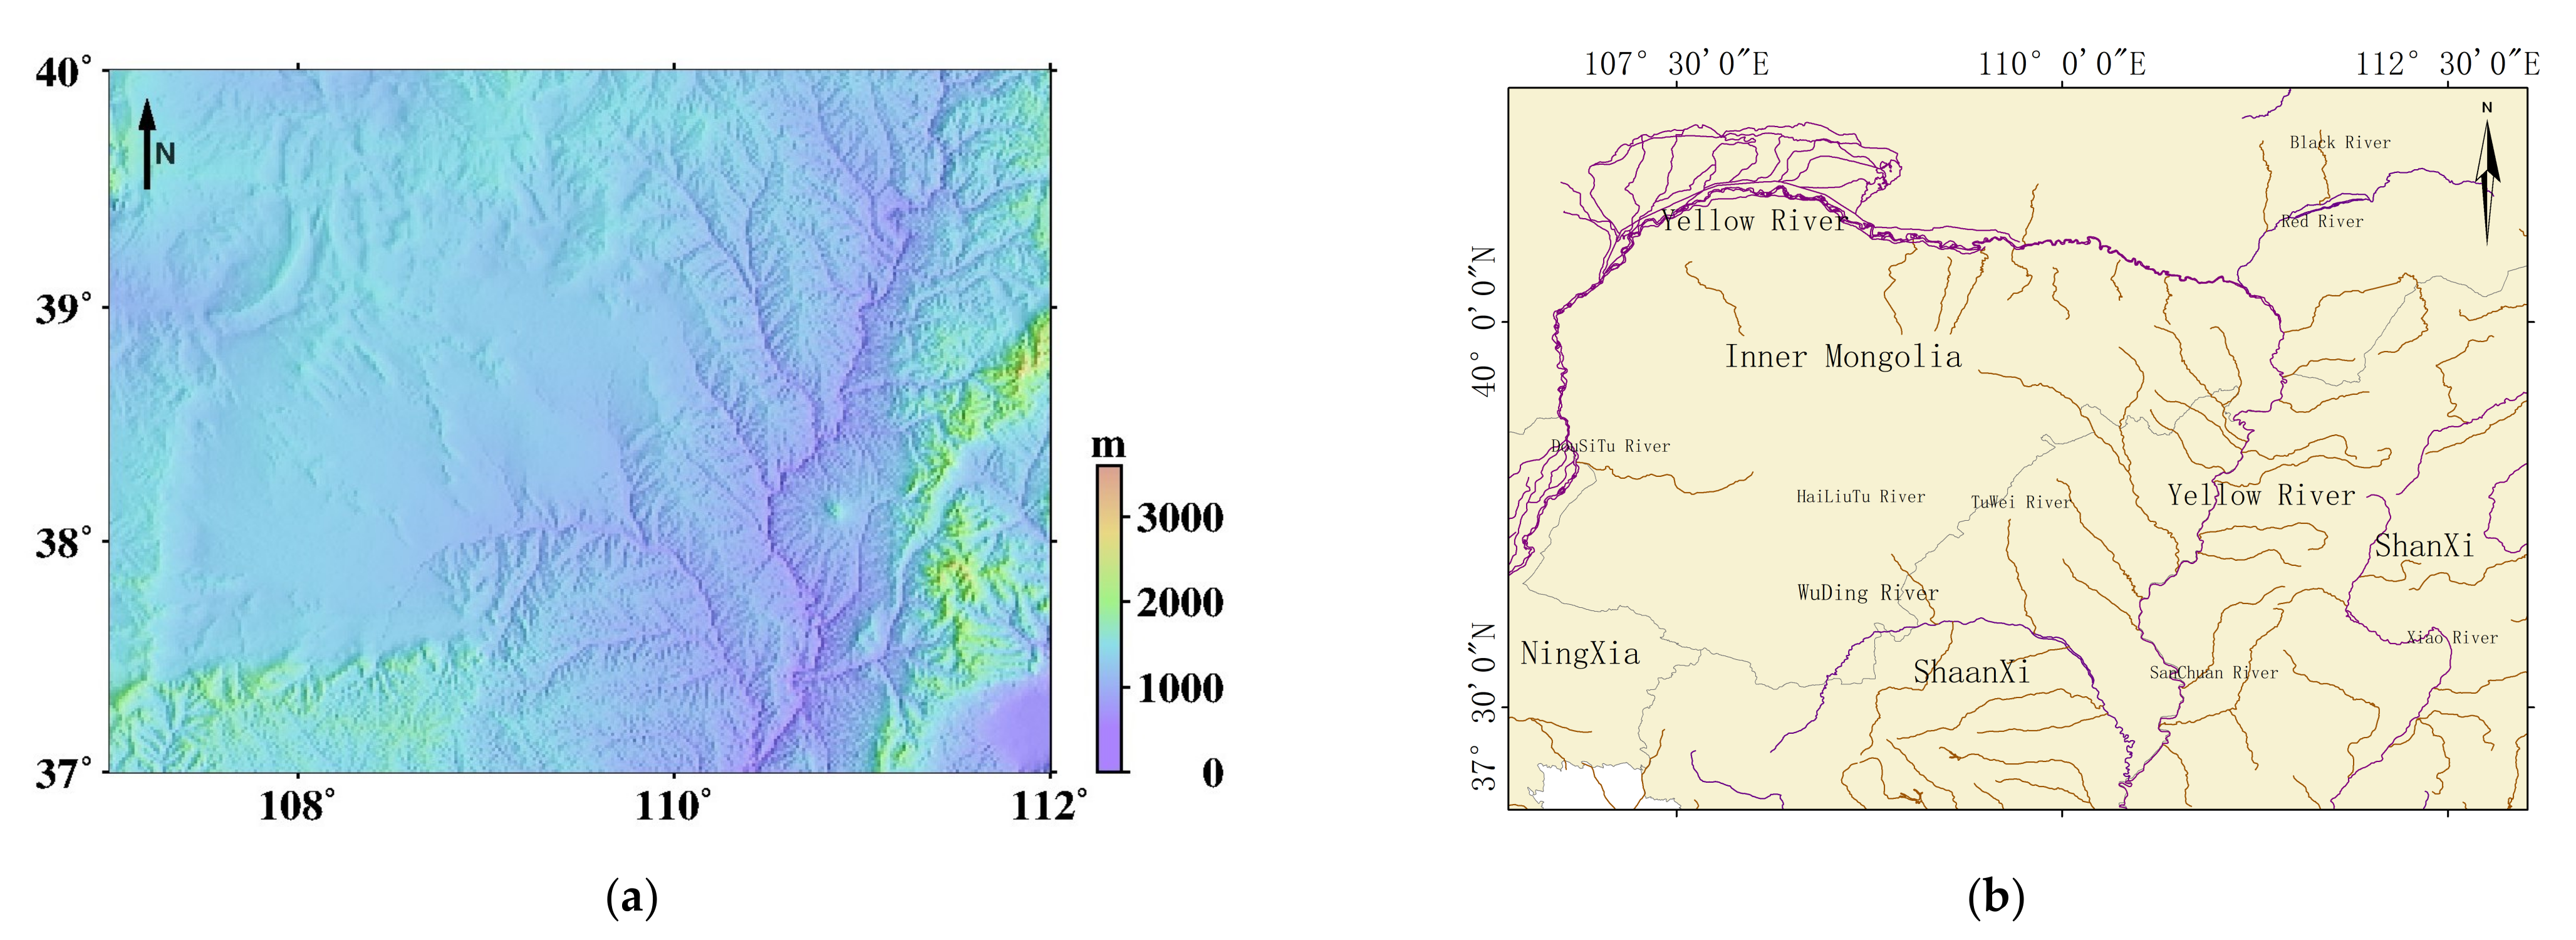
2.1. Research Area

The Mu Us dune field is a semiarid eco-fragile zone in the northwest of China [18,19] that is very sensitive to global temperature rise and environmental changes [20,21]. An analysis of the characteristics of long-period changes in this area can deepen knowledge of the impact of global climate change on semiarid ecological vulnerable regions in order to formulate scientific countermeasures. The Mu Us dune field is a practical example of China’s “green hills and clear waters”. Since 1959, people have made unremitting efforts to build windbreak forest belts and carried out a series of “returning sand to forest” activities. In April 2020, statistics from the Shaanxi Forestry Bureau showed that more than six million mu of sandy land has been covered with vegetation. The forest coverage rate in the Mu Us dune field has reached about 34%, and the land management rate has reached over 93.24% [22]. However, the effects of climate change on the ecological environment are a two-way process, and may inhibit the development of the ecological environment. At present, the ecological environment in this area is still fragile. Therefore, at this critical point in time, it is necessary to evaluate the current natural environment and provide guidance for reconstruction of the ecological environment in this area.
In the 1950s and 1960s, Peking University and other relevant experts conducted field investigations in the Mu Us dune field, and designated the range of the Mu Us dune field as 37°27.5′~39°22.5′N, 107°20′~111°30′E, including the areas north of Yu-lin, Shaanxi Province; south of Inner Mongolia; and northeast of Yanchi, Ningxia Hui Autonomous Region [18]. Therefore, a range of 40~37°N and 107~112°E (Figure 1), including the whole area of the Mu Us dune field, was selected as the research area in this study. In addition, nine meteorological stations in the research area (Table 1) were uniformly selected as the research data sources.
The spatial distribution of temperature, precipitation, and precipitable water vapor (PWV) can be affected by the elevation and water resource distribution in the research area. Therefore, when studying the spatial distribution of the above climatic elements, this study combined the high-resolution, high-precision Digital Elevation Model (DEM) provided by the Shuttle Radar Topography Mission (Figure 2a) and the distribution map of rivers provided by the National Basic Geographic Information Center (Figure 2b) to analyze the spatial impact of the elevation and water resource distribution on the temperature, precipitation, and PWV in the research area.

2.2. China Meteorological Data Service Center

This study used the temperature (°C) and precipitation (mm) data of nine synoptic stations from 1960 to 2018 in the “Daily Data Set of China surface Climatic Data” provided by the China Meteorological Data Service Center to study the temperature, precipitation changes, and spatial distribution characteristics of the Mu Us dune field.
The data series of meteorological stations are complete, with a high spatial and temporal resolution and long time series, so can be used to study the characteristics of climate change in this region. Information on the synoptic stations is shown in Table 1, and their spatial distribution is shown in Figure 1.

2.3. ECMWF Data

The total content of integrated water vapor in the atmosphere above the ground is known as PWV, which represents the potential precipitation of a region. Water vapor change is a very important link in the global energy and water cycle and is an important monitoring object of climate change [23]. The ECMWF (European Centre for Medium-Range Weather Forecasts) reanalysis data are the global grid data obtained by satellite remote sensing inversion and assimilation and have become a very important data source for global weather forecasts, climate change, and other fields. The reasons for using ERA5 data are twofold. On the one hand, ERA5 has a high spatial and temporal resolution. On the other hand, ERA5 has improved its performance through more advanced assimilation methods, allowing it to absorb more recent satellite observations [24]. In this study, PWV data from 1978 to 2018 with a spatial resolution of 0.25 × 0.25° listed in the monthly averaged dataset of ERA5 provided by ECMWF were used to analyze the overall spatial and temporal distribution of air water resources in the Mu Us dune field. Due to the research area being small and entirely located in a mid-latitude region, this study considered the area of each grid corresponding to the reanalysis data in this region to be equal.
In other words, when calculating the average PWV, the data of all grid points in the study region were averaged, as follows:
W m e a n = i = 1 m j = 1 n w i j .
In the above equation, W m e a n represents the PWV average value in the whole region, and w i j is the PWV value on grid points.

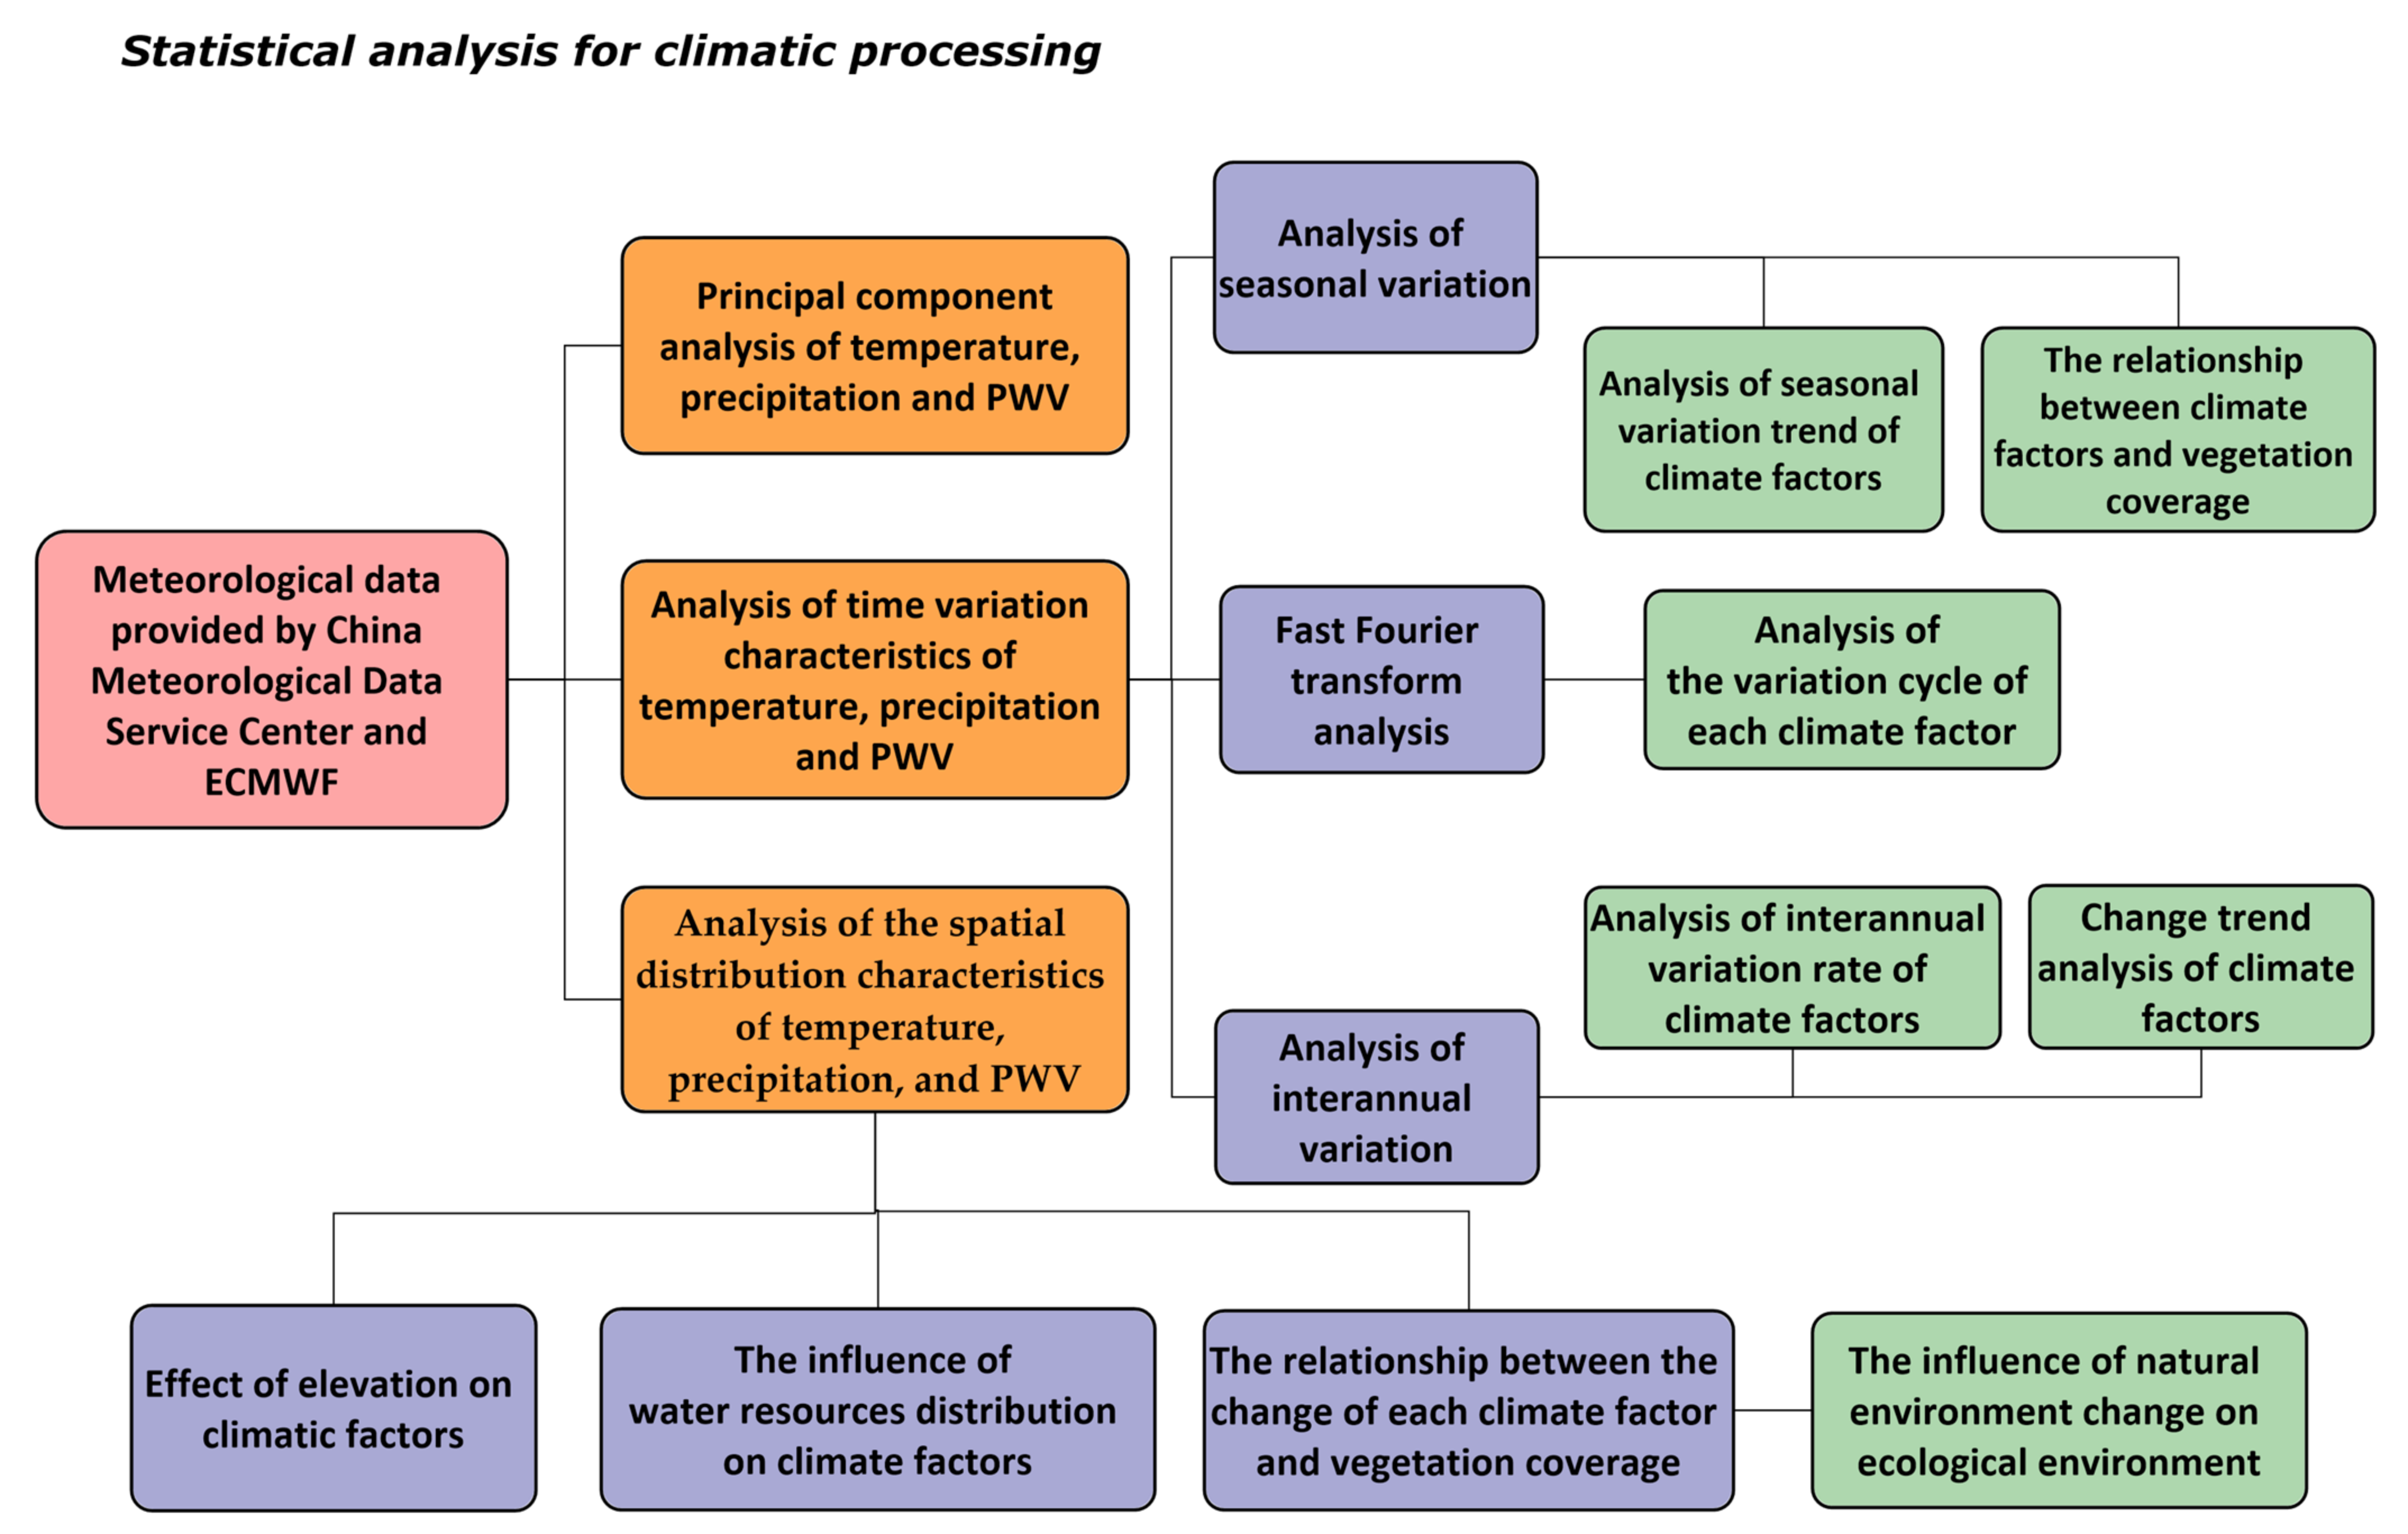
2.4. Statistical Analysis for Climatic Processing

In order to reveal the characteristics of climate change in the ecologically fragile area of the Mu Us dune field against the background of global warming, we must know their temporal and spatial changes. Therefore, we first carried out a principal component analysis of various climatic factors to initially determine the temporal and spatial characteristics of the region, as preparation and verification work for follow-up research. For the time change, we mainly detected and determined periodic change, so we carried out the fast Fourier transform to determine the period of each climatic factor, and then analyzed the seasonal change and inter-annual change of each climatic factor. Regarding spatial changes, we separately described the spatial distribution of various climatic factors in the study area and analyzed the spatial changes of each climatic factor in the region in different time periods. At the same time, we studied the relationship between various climatic factors and NDVI. The principal diagram of the main program is shown in Figure 3.

3. Results

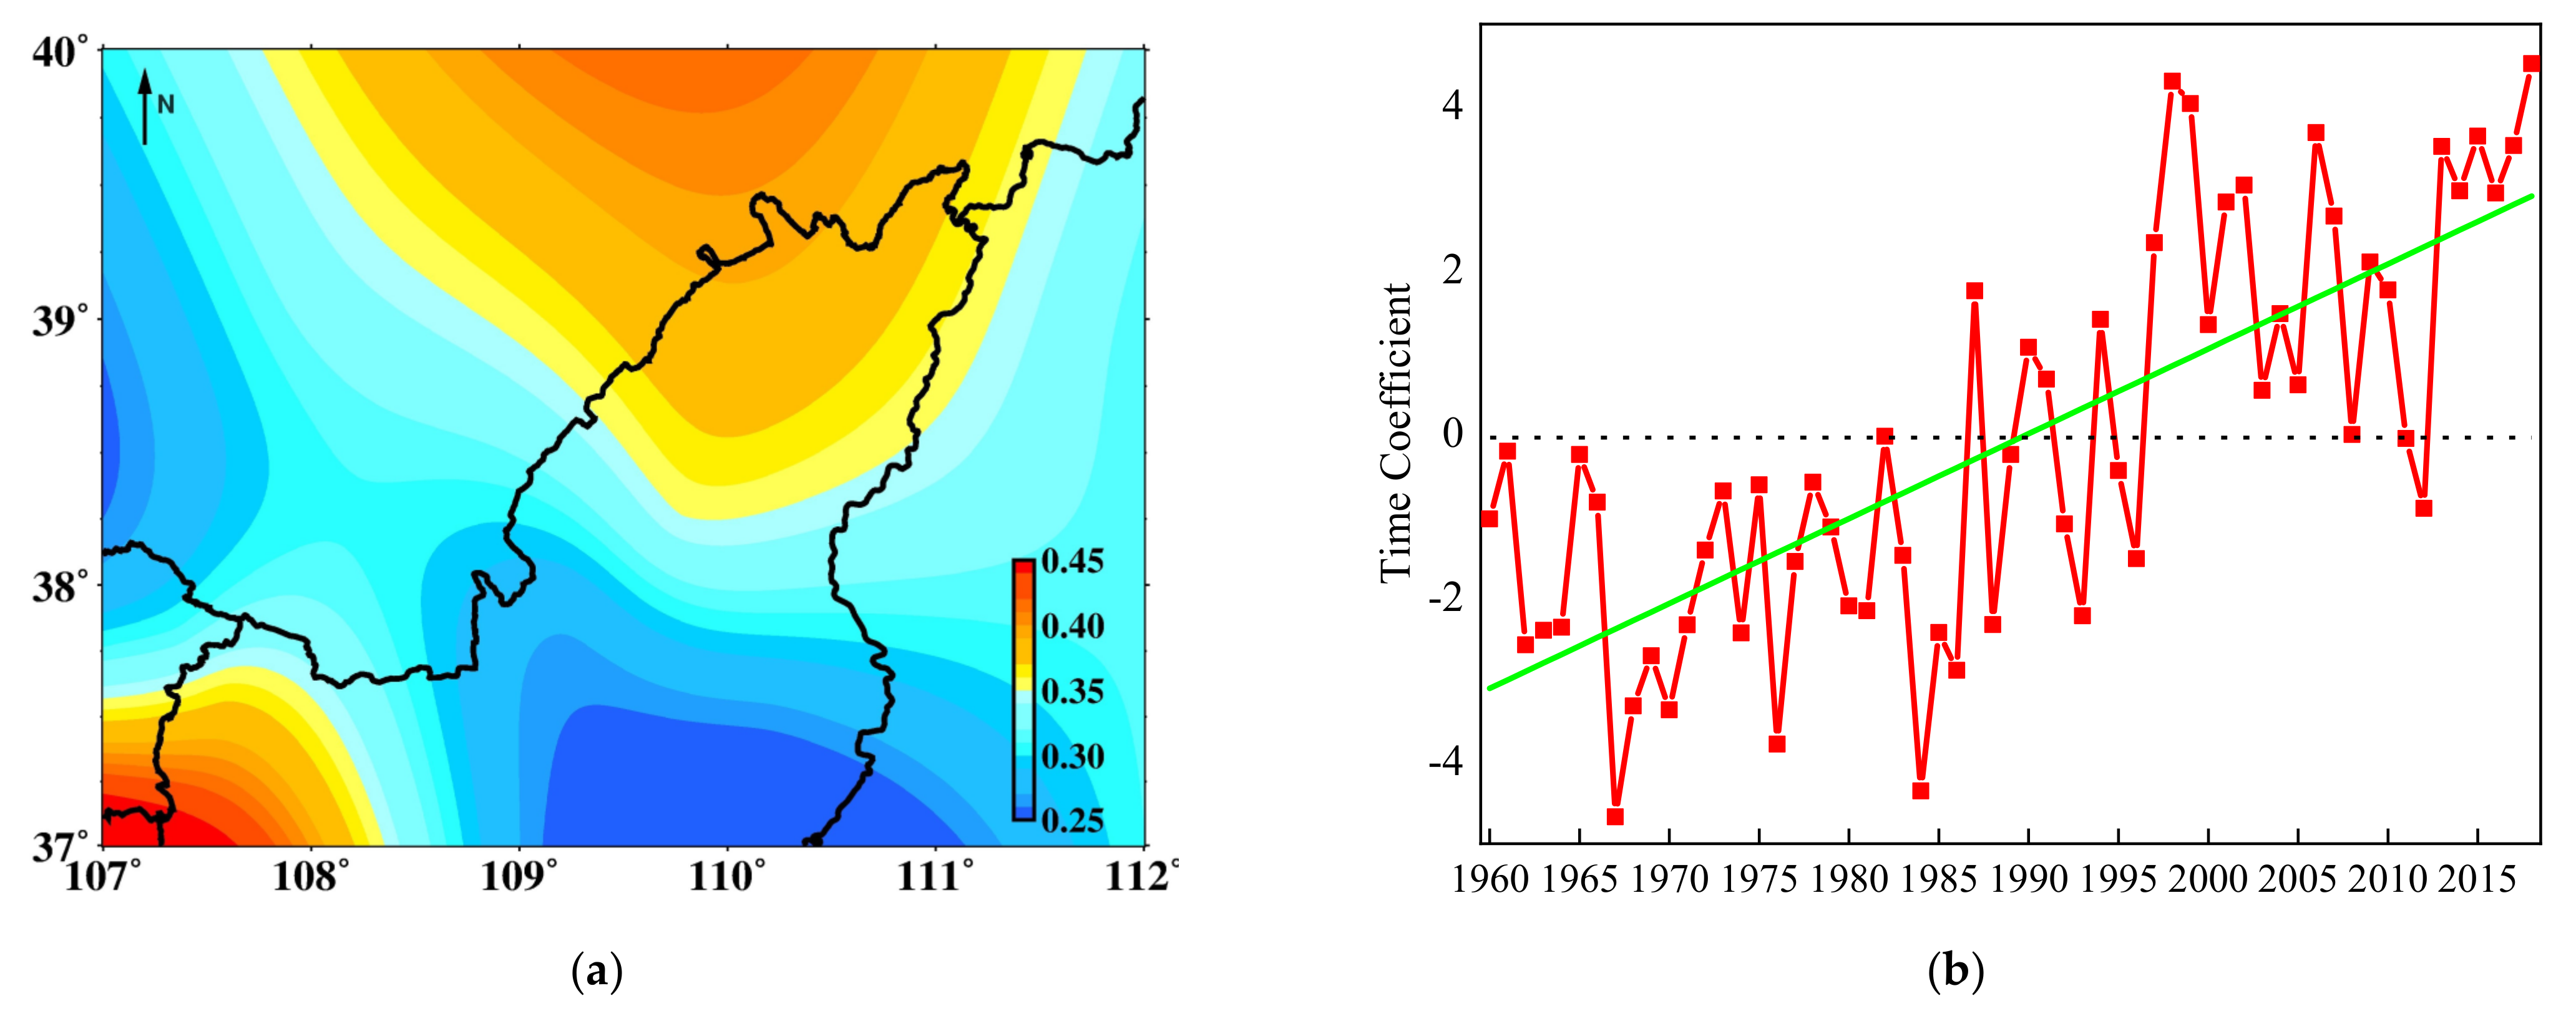
3.1. Principal Component Analysis of Temperature, Precipitation, and PWV

Principal component analysis (PCA) is also known as Eigenvector Analysis, or the Empirical Orthogonal Function (EOF), and is a statistical method employed for analyzing the features of a matrix structure and turning multiple variables into a few principal components by means of dimensionality reduction technology. It is one of the most important dimensionality reduction methods. Lorenz first applied this method to meteorology and climate in 1950, and it has now become an important analysis method in the field of meteorology and climate [25]. PCA is applicable to the field of space points that change with time. It can make the interpretation variance of a variable increase through the method of linear combination. Variables with large explanatory variance are called principal components, representing an approach of data dimensionality reduction commonly used in climatology. Therefore, we used principal component analysis to analyze the long-term trend and spatial distribution characteristics of meteorological elements.
In the actual process of data processing, a significance test is required to determine whether the principal component is meaningful. The North test is usually adopted, i.e., when the eigenvalue passes the North test, the eigenvector corresponding to the eigenvalue is considered to be meaningful. In this study, the average annual temperature, annual precipitation, and average annual PWV data were treated as anomalies for PCA to obtain the contribution rates of the first three feature vectors of the average annual temperature, annual precipitation, and average annual PWV in the Mu Us dune field, as shown in Table 2.
The variance contribution rate of the first eigenvector field of temperature in the Mu Us dune field is 95%, which is much higher than that of the other eigenvector fields. Therefore, the first eigenvector field is the main spatial distribution form of temperature field in the Mu Us dune field. The eigenvalues of all synoptic stations in the first eigenvector field are positive (Figure 4a), indicating that the variation trend of the average temperature in the Mu Us dune field from 1960 to 2018 is highly consistent. At the same time, the time coefficient represents the time variation characteristics of the research area, and it can be observed that the time coefficient of the first feature vector field shows a significant increasing trend (Figure 4b), indicating that the whole Mu Us dune field is heating up, which will be conducive to the germination and transpiration of vegetation. The high-value center is located in the northern and southwest region of the research area, reflecting the large temperature variation in this region, while the low-value center is mostly located in the southern region, reflecting the relatively small temperature variation in this region.
The variance contribution rate of the first eigenvector field of precipitation in the Mu Us dune field is 61.68%, which is the main spatial distribution of the precipitation field. The variance contribution rate of the second and third eigenvector field is 10.29% and 9.35%, respectively, which are also the typical spatial distribution forms of the precipitation field in the Mu Us dune field. The cumulative variance contribution rate of the first three eigenvectors reaches 81.32%, which is much higher than the values for other eigenvector fields. Therefore, the first three feature vectors are able to explain well the spatial distribution of precipitation in the Mu Us dune field from 1960 to 2018 (Figure 5).
All the eigenvalues of the first eigenvector field of precipitation are positive, indicating that the variation trend of the average precipitation in this area is also highly consistent. It can be seen from the trend of its time coefficient (Figure 6a) that the precipitation in the Mu Us dune field presents an overall rising trend. The high-value region appears in the southeast region, which reflects the relatively large change of precipitation in this region. The second characteristic vector field is basically a northwest-southeast inverse type, with the northwest being positive and the southeast being negative, and the slope of the fitting line corresponding to the time coefficient (Figure 6b) being negative, indicating that the precipitation in the northwest area of the Mu Us dune field has decreased, while that in the southeast area has increased. The value of the feature vector gradually decreases from northwest to southeast of the Mu Us dune field, but the negative trend of the time coefficient shows that the precipitation change in this area shows an increase from the northwest to southeast, which indicates that the precipitation in the southeast area has increased more, while the precipitation in the northwest area has increased less. Therefore, the ecological environment in the southeast of the Mu Us dune field has recovered more rapidly than that in the northwest. The distribution of the third eigenvector field shows a north-south reverse pattern with the change of altitude (Figure 5c), indicating that there is a north-south reverse difference in precipitation in this region. The trend of the zero value line roughly coincides with that of the Yellow River at the boundary of Shaanxi Province (Figure 2b). The time coefficient shows fluctuation, but no obvious trend. It can be briefly summarized as follows: the spatial variation of precipitation in the Mu Us dune field is relatively complex. The precipitation in the northwest region is slightly reduced, while the precipitation in the southeast region is obviously increased, and the overall precipitation tends to increase further, which plays a positive role in enhancing the anti-interference ability of the ecological environment and improving the stability of the ecological environment.
The variance contribution rate of the first eigenvector field of PWV is 92.66%, which is also much higher than that of other eigenvector fields, similar to the temperature field in this region. The first eigenvector field is the main spatial distribution form of PWV field of the Mu Us dune field.
The eigenvalues of all synoptic stations in the first feature vector field of PWV are positive (Figure 7a), indicating that the variation trend of PWV in the Mu Us dune field from 1978 to 2018 is consistent. The time coefficient of the first characteristic vector field exhibits an obvious increasing trend (Figure 7b), indicating that the overall PWV of the Mu Us dune field has increased. The high-value center is located in the southern region of the research area, and its scope basically covers the whole region, reflecting the large variation of the overall PWV in this region. This indicates that the air water resources in the Mu Us dune field are increasing, the potential of precipitation is gradually increasing, and the air humidity is increasing, which is related to the increase of vegetation coverage in the Mu Us dune field in recent years. Vegetation affects the exchange of water between groundwater and the atmosphere in the area. In recent years, the Mu Us dune field has displayed a tendency of becoming more “wet”, and this long-term trend is driven by regional ecological environment change and global warming to a large extent.

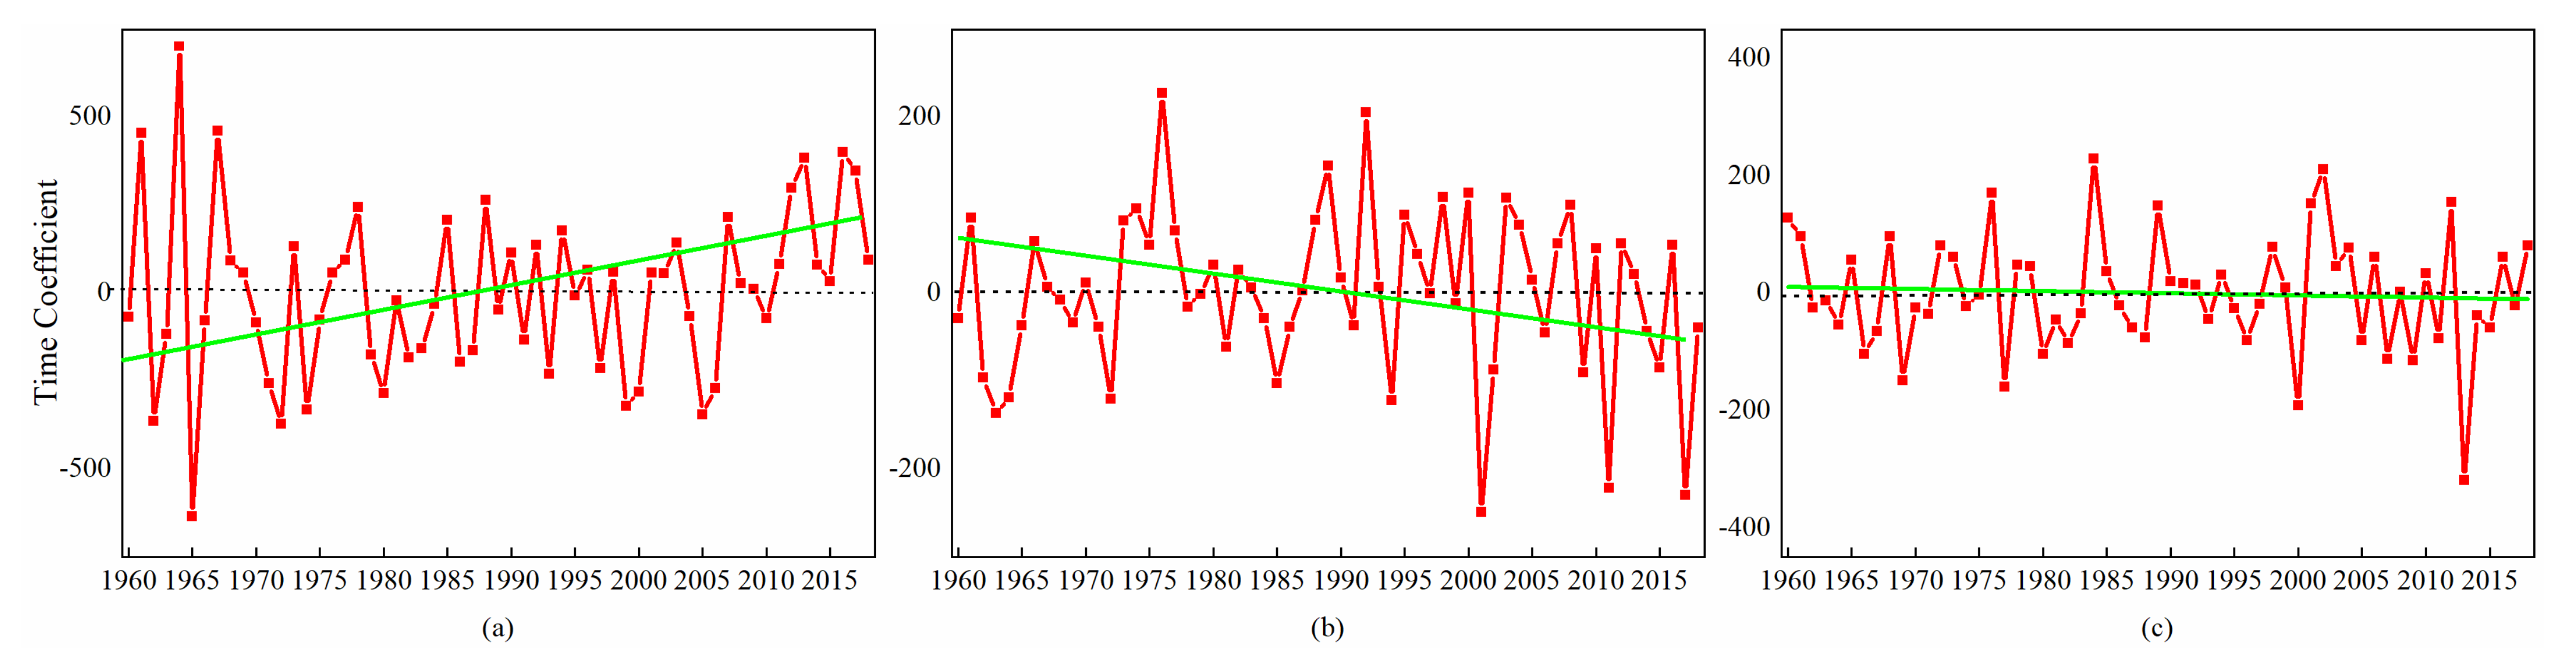
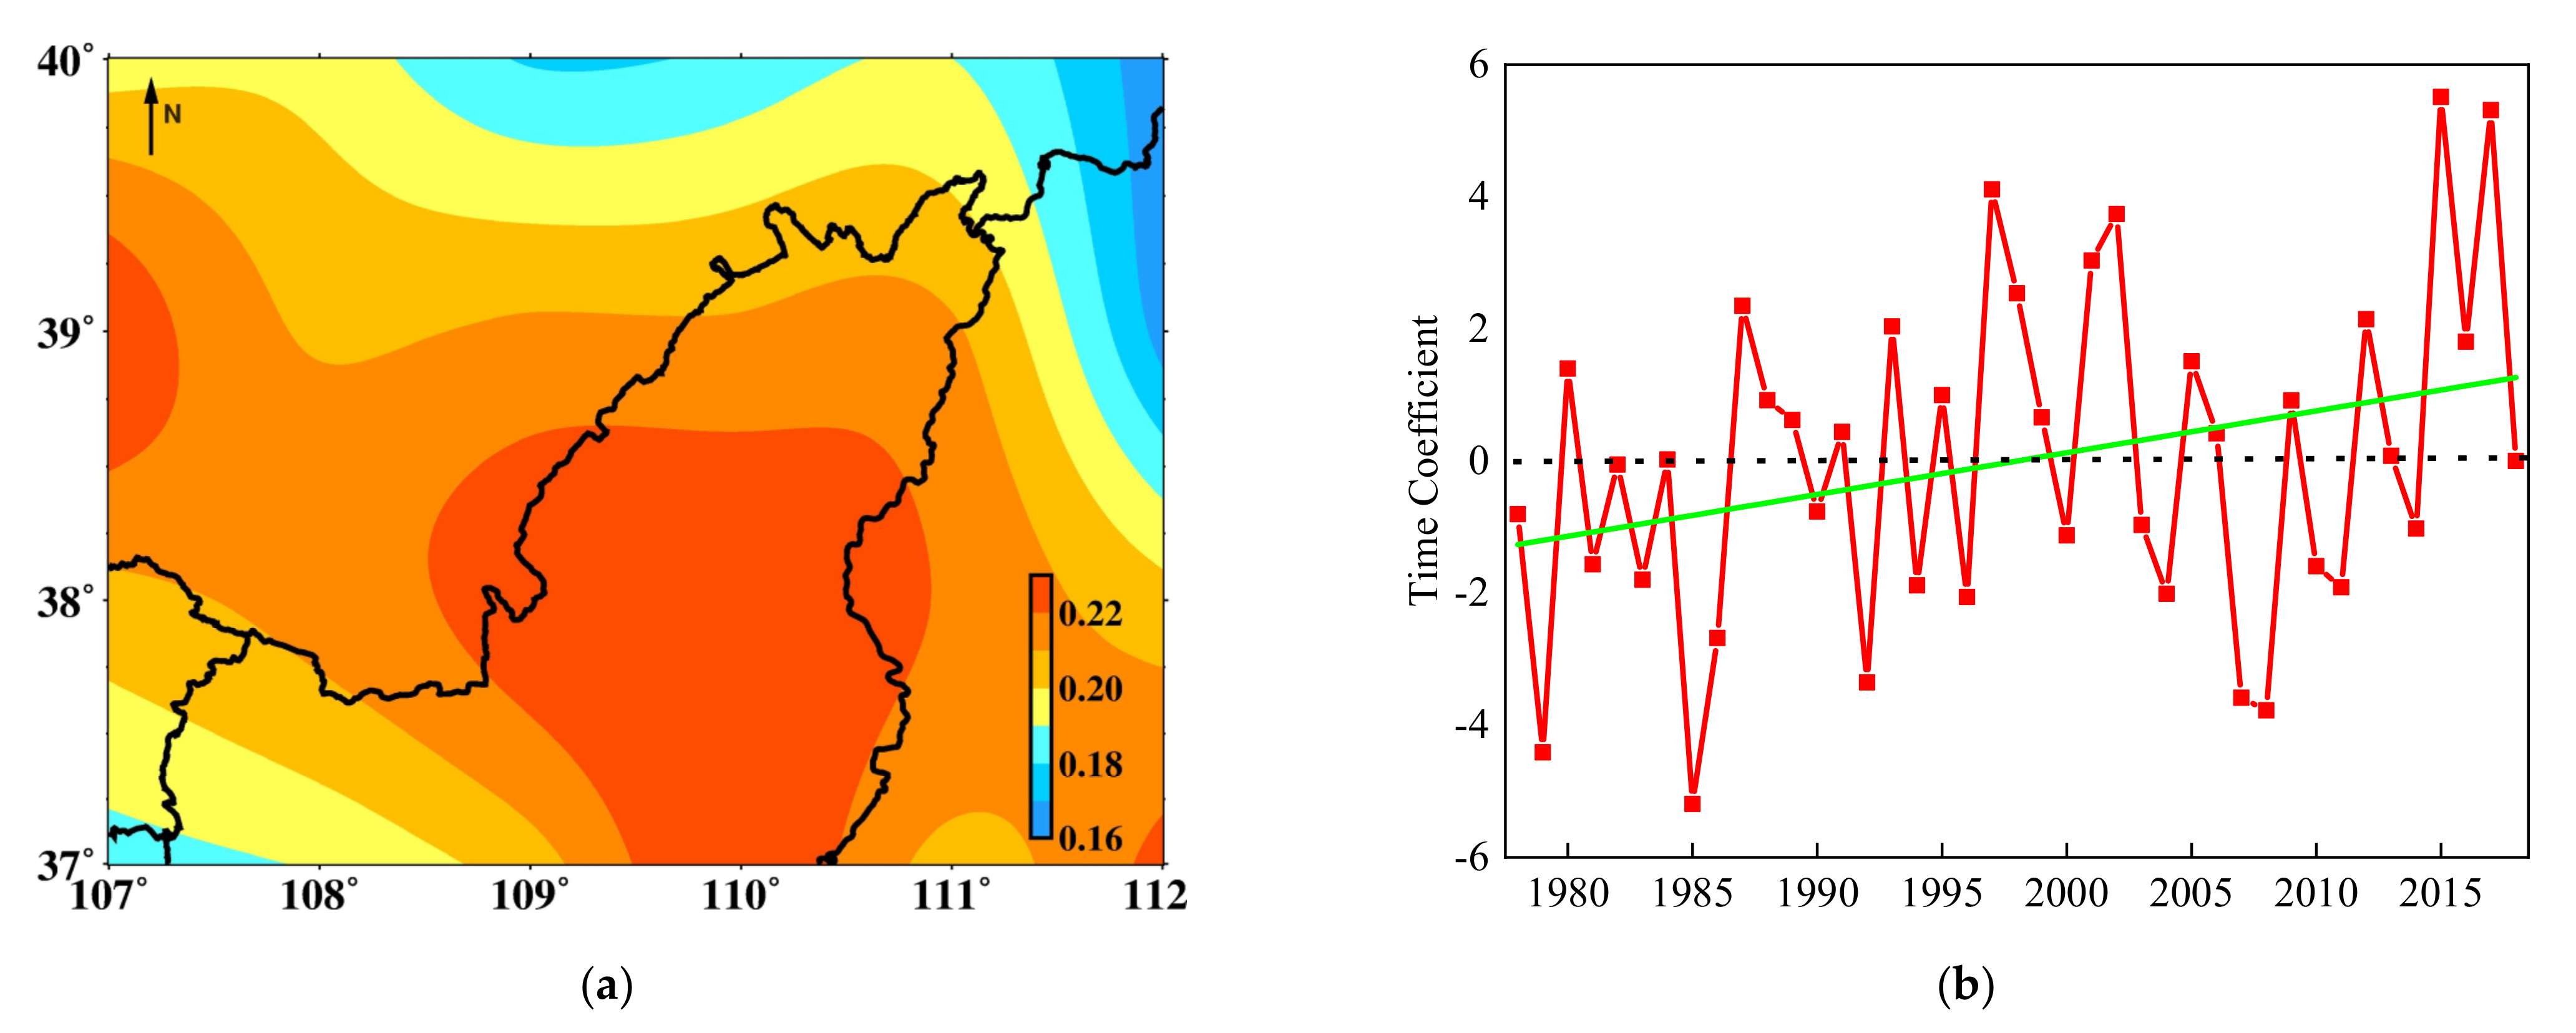
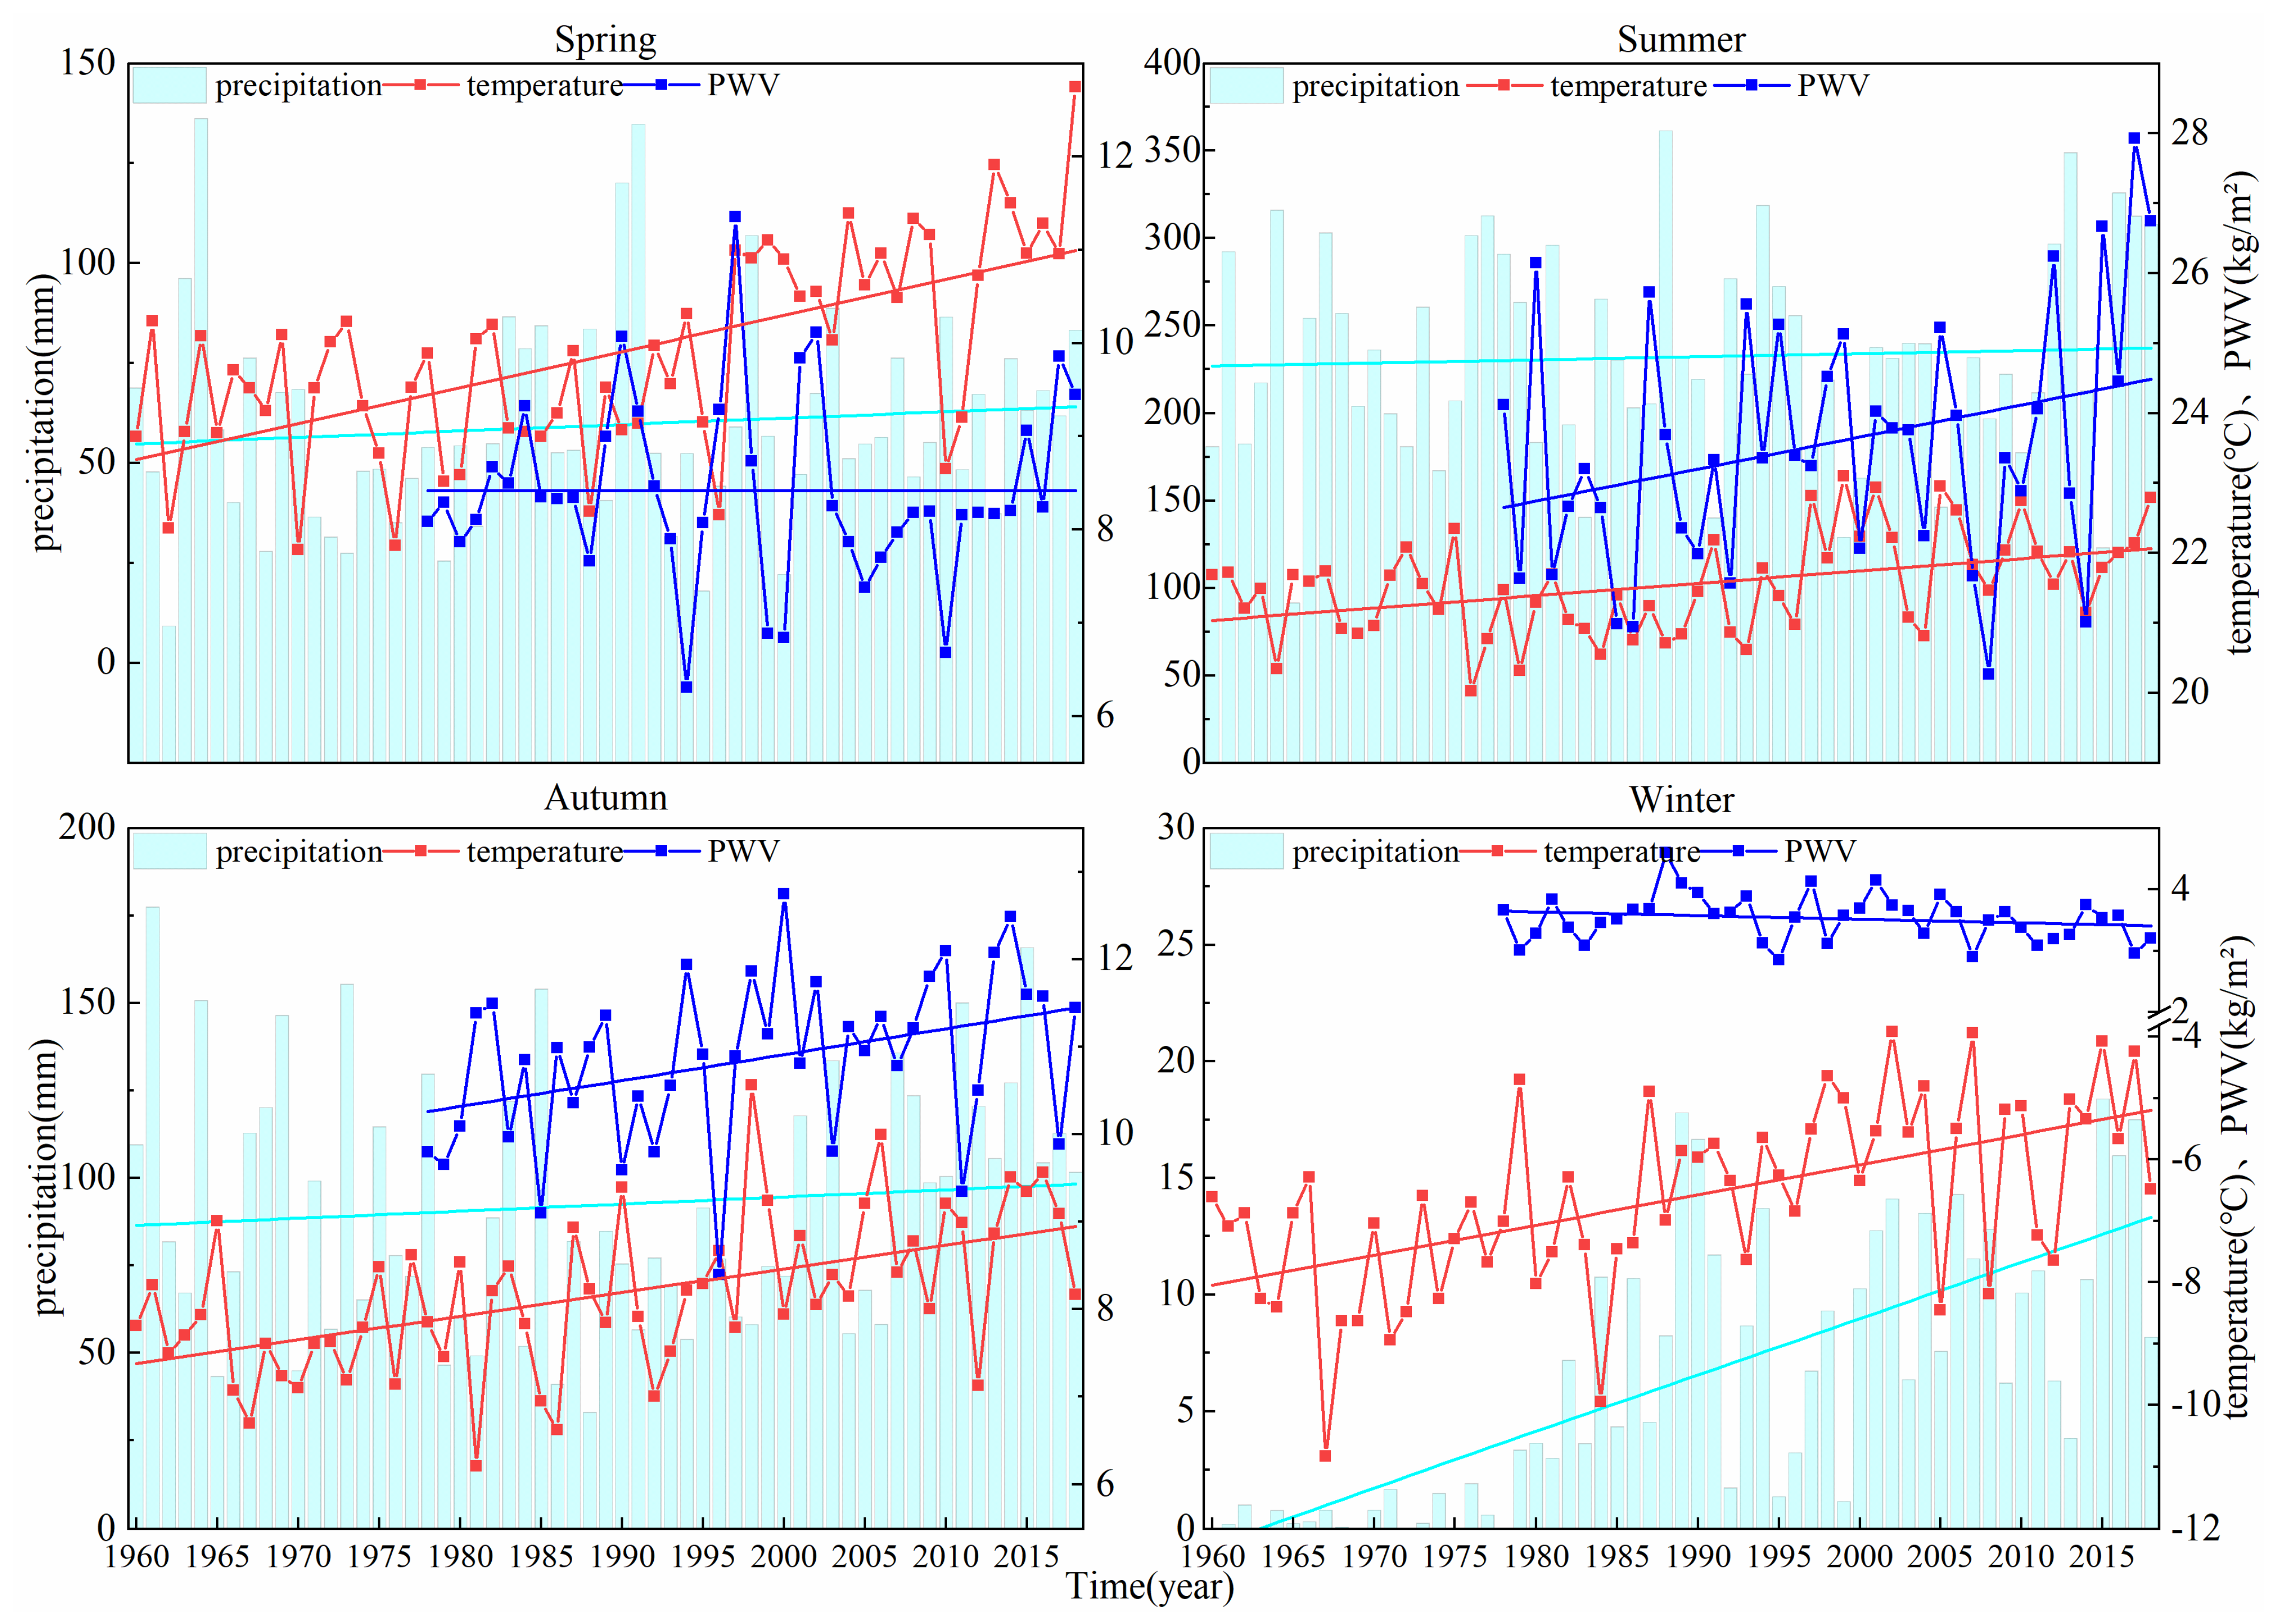
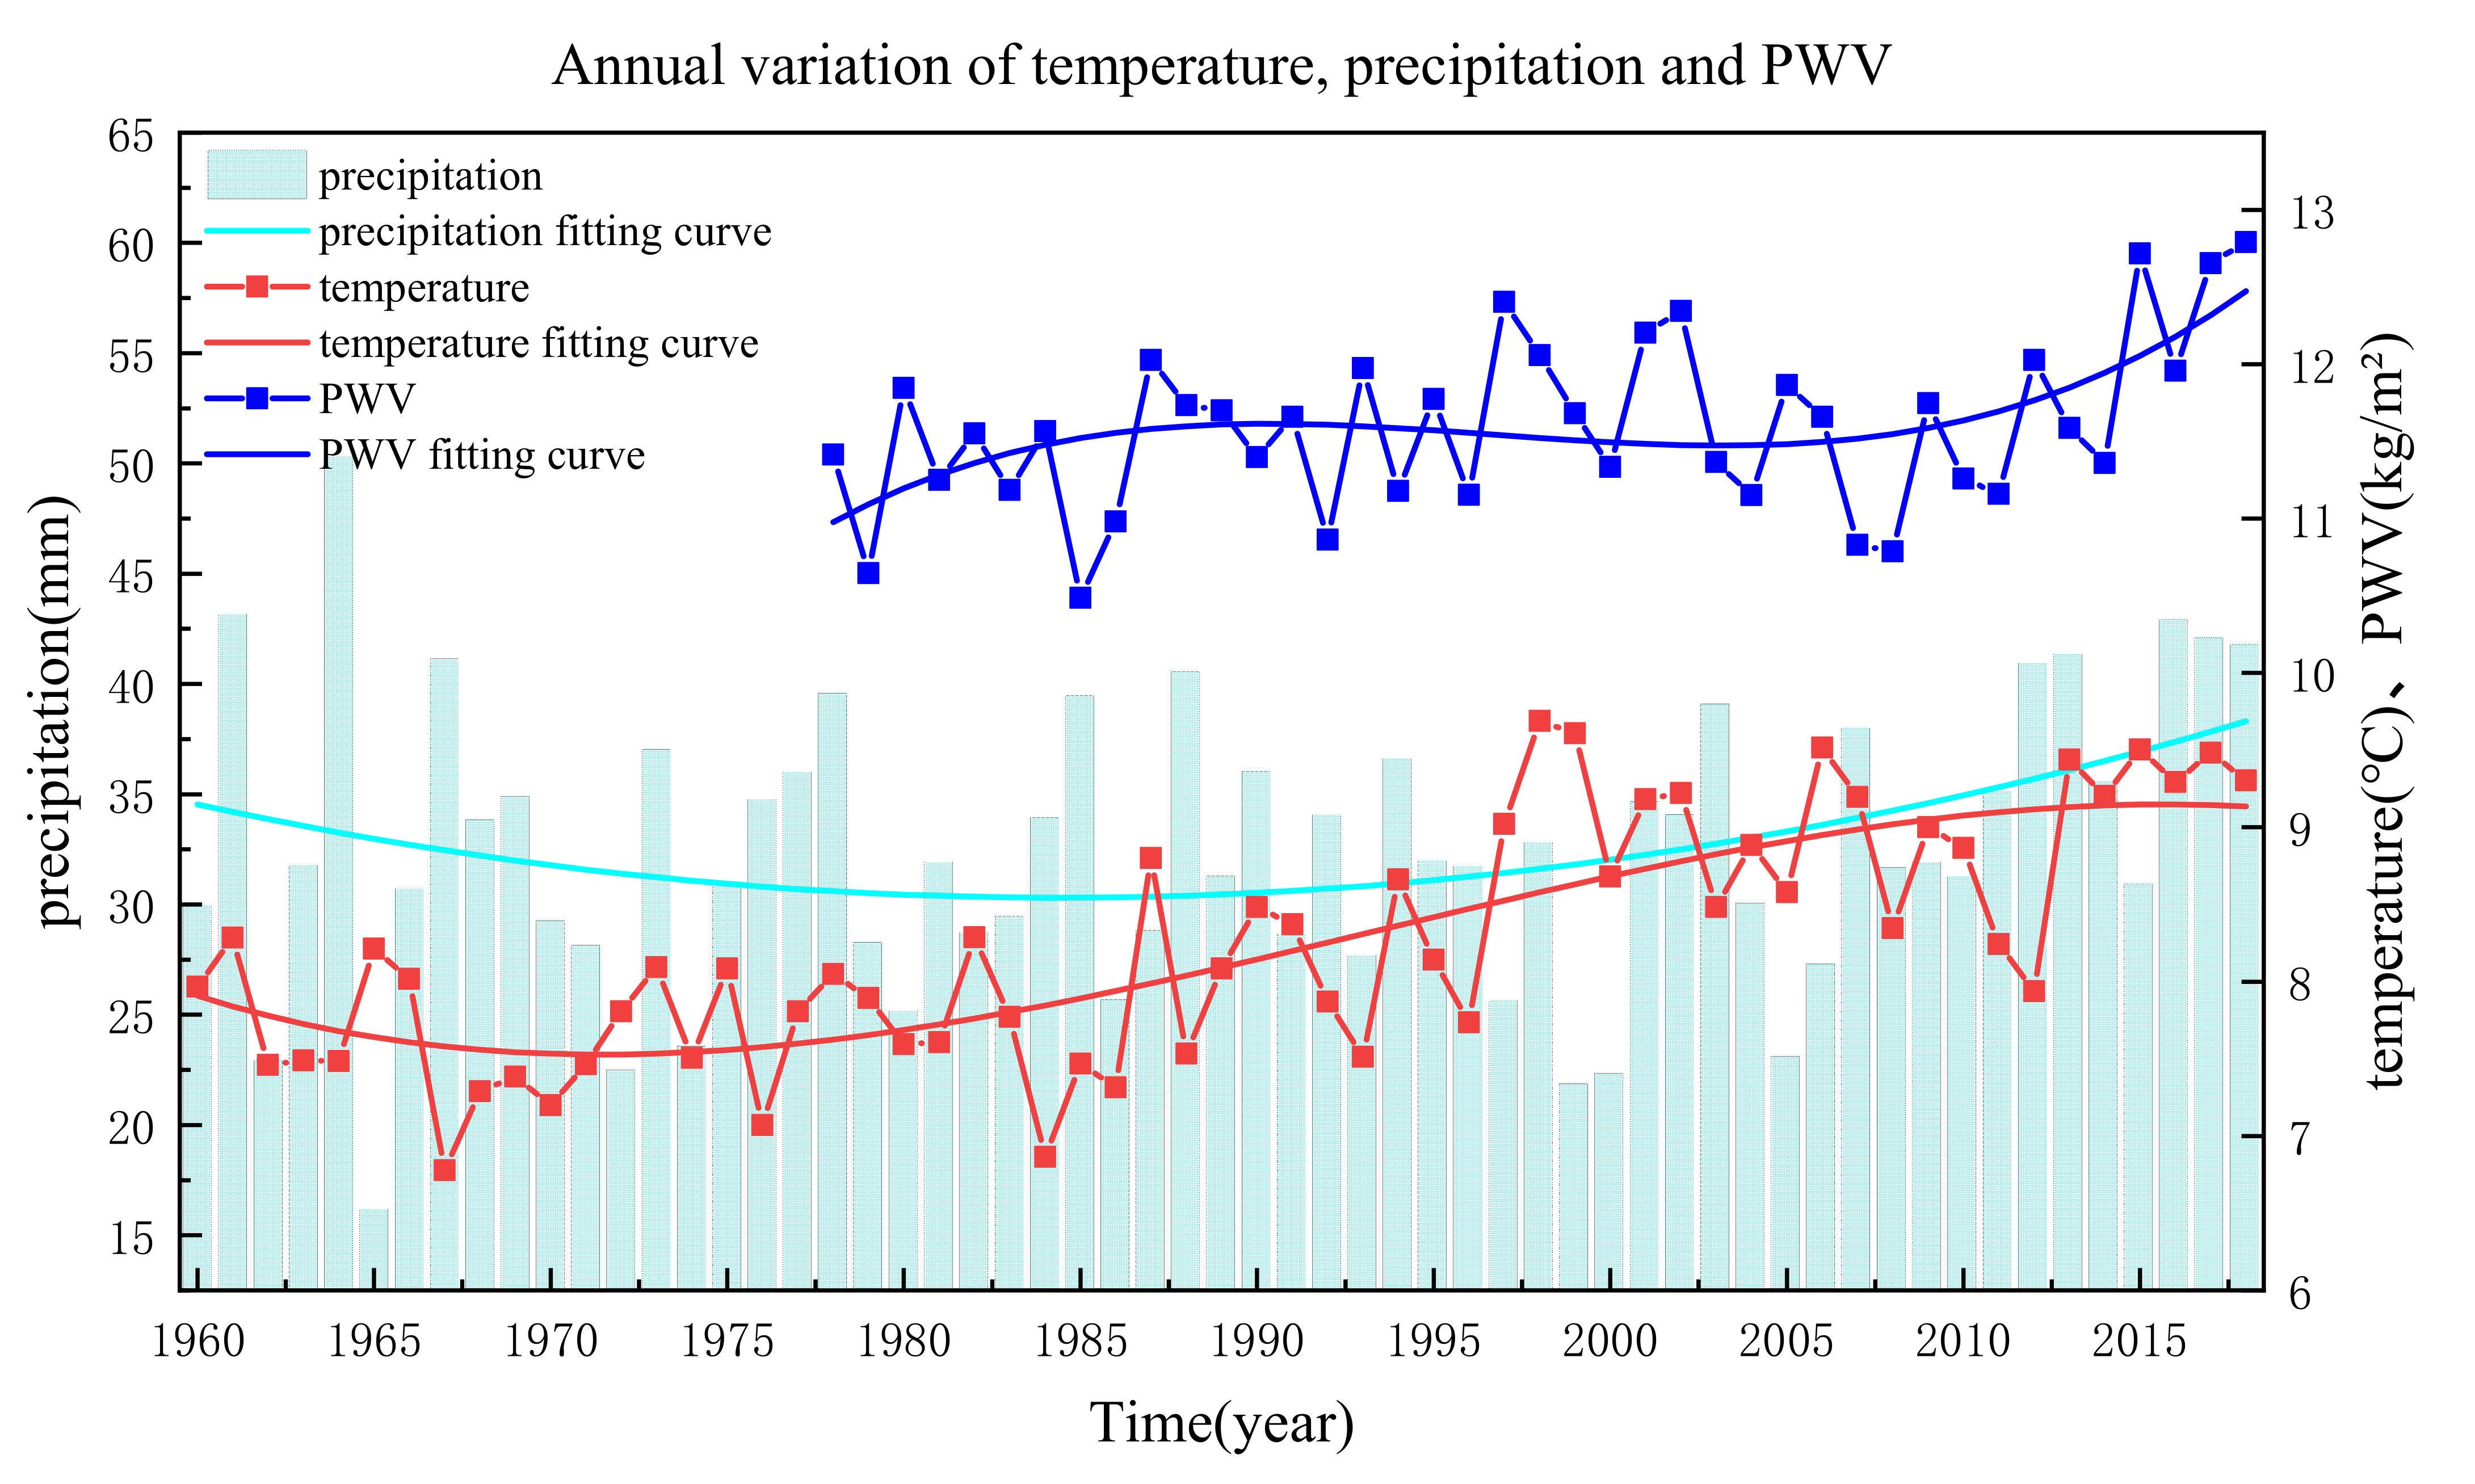
3.2. Analysis of Time Variation Characteristics of Temperature, Precipitation, and PWV

In order to better reveal the changes of climatic factors in the Mu Us dune field, this investigation conducted more detailed studies in the area of the annual and interannual changes of temperature and precipitation from 1960 to 2018 and PWV from 1978 to 2018. The data were analyzed by season, including spring (March–May), summer (June–August), autumn (September–November), and winter (December–February) (Figure 8). It can be seen that the temperature of the four seasons in the Mu Us dune field displays a rising trend. The average temperature in spring and autumn is almost the same, ranging from 6 to 12 °C. The annual temperature growth rate is about 0.038 and 0.027 °C/a, respectively. The average temperature in summer is the highest, ranging from 20 to 24 °C and the annual temperature growth rate is about 0.017 °C/a. In winter, the temperature is the lowest and the temperature difference is the largest, ranging from −12 to −3 °C. The annual growth rate is about 0.049 °C/a, and the temperature increase trend is the most obvious. The precipitation changes in the four seasons in the Mu Us dune field also exhibit significant differences, but the change trend is roughly consistent with the temperature. Summer is the season with the most precipitation, and winter is the season with the least. The increasing rates of precipitation in the four seasons are 0.202, 0.16, 0.177, and 0.24 mm/a, respectively. The correlation between precipitation and temperature is relatively high. The growth rates of the four seasons of PWV in the Mu Us dune field are 0.0001, 0.0458, 0.0296, and −0.0059 mm/a, respectively. The PWV in summer is obviously higher than that in winter, which may be related to vegetation coverage or temperature.
In order to observe the change trend of temperature, precipitation, and precipitation in this area more intuitively, third-order polynomial fitting with a higher fitting coefficient was used for many years instead of linear fitting to analyze the temperature, precipitation, and PWV in the Mu Us dune field. The average temperature from 1960 to 2018 shows an overall upward trend (Figure 9), and the temperature increase rate is about 0.033 °C/a. This study also used the principle of least squares to fit the temperature data from 1960 to 1979, 1980 to 1999, and 2000 to 2018, and the slopes of the heating trend of the three periods are 0.0294, 0.0658, and 0.0161 °C/a, respectively. We call these three stages of temperature change the “fluctuation period”, “rising period”, and “flat period”, respectively. It is especially important to emphasize that the temperature rose rapidly during the period from 1980 to 2000, and this trend was suppressed after 2000. The change in average precipitation from 1960 to 2018 displays a slight increasing trend, the precipitation increase rate is 0.781 mm/a, and the average annual precipitation is lower than the national average level of precipitation. When observing the trend line (Figure 9), the precipitation exhibits fluctuations before 1980, and there is no obvious trend. There is a slight downward trend in precipitation from 1980 to 2000, and the precipitation in the Mu Us dune field shows an obvious increasing trend after 2000. This means that, after 2000, precipitation gradually increased. The growth rates of PWV from 1980 to 2000 and 2000 to 2018 were 0.0131 and 0.0367 mm/a, respectively. The interannual variation of the PWV (Figure 9) shows an overall upward trend in fluctuations. The increase rate of the PWV is about 0.0177 mm/a. In 1985, the lowest value was 10.48 mm, and there was no obvious trend before 2000. The upward trend of fluctuation began in 2000, and the highest value in 2018 was 12.79 mm.
Fast Fourier Transform (FFT) was used to extract the temperature and precipitation frequency spectrum characteristics for 59 years, and it was found that the temperature and precipitation in this area had an obvious consistent cycle of about 363.63 days. It also extracted the spectral characteristics of the monthly average PWV for 41 years and found that the temperature in this area has an obvious cycle of approximately one year.

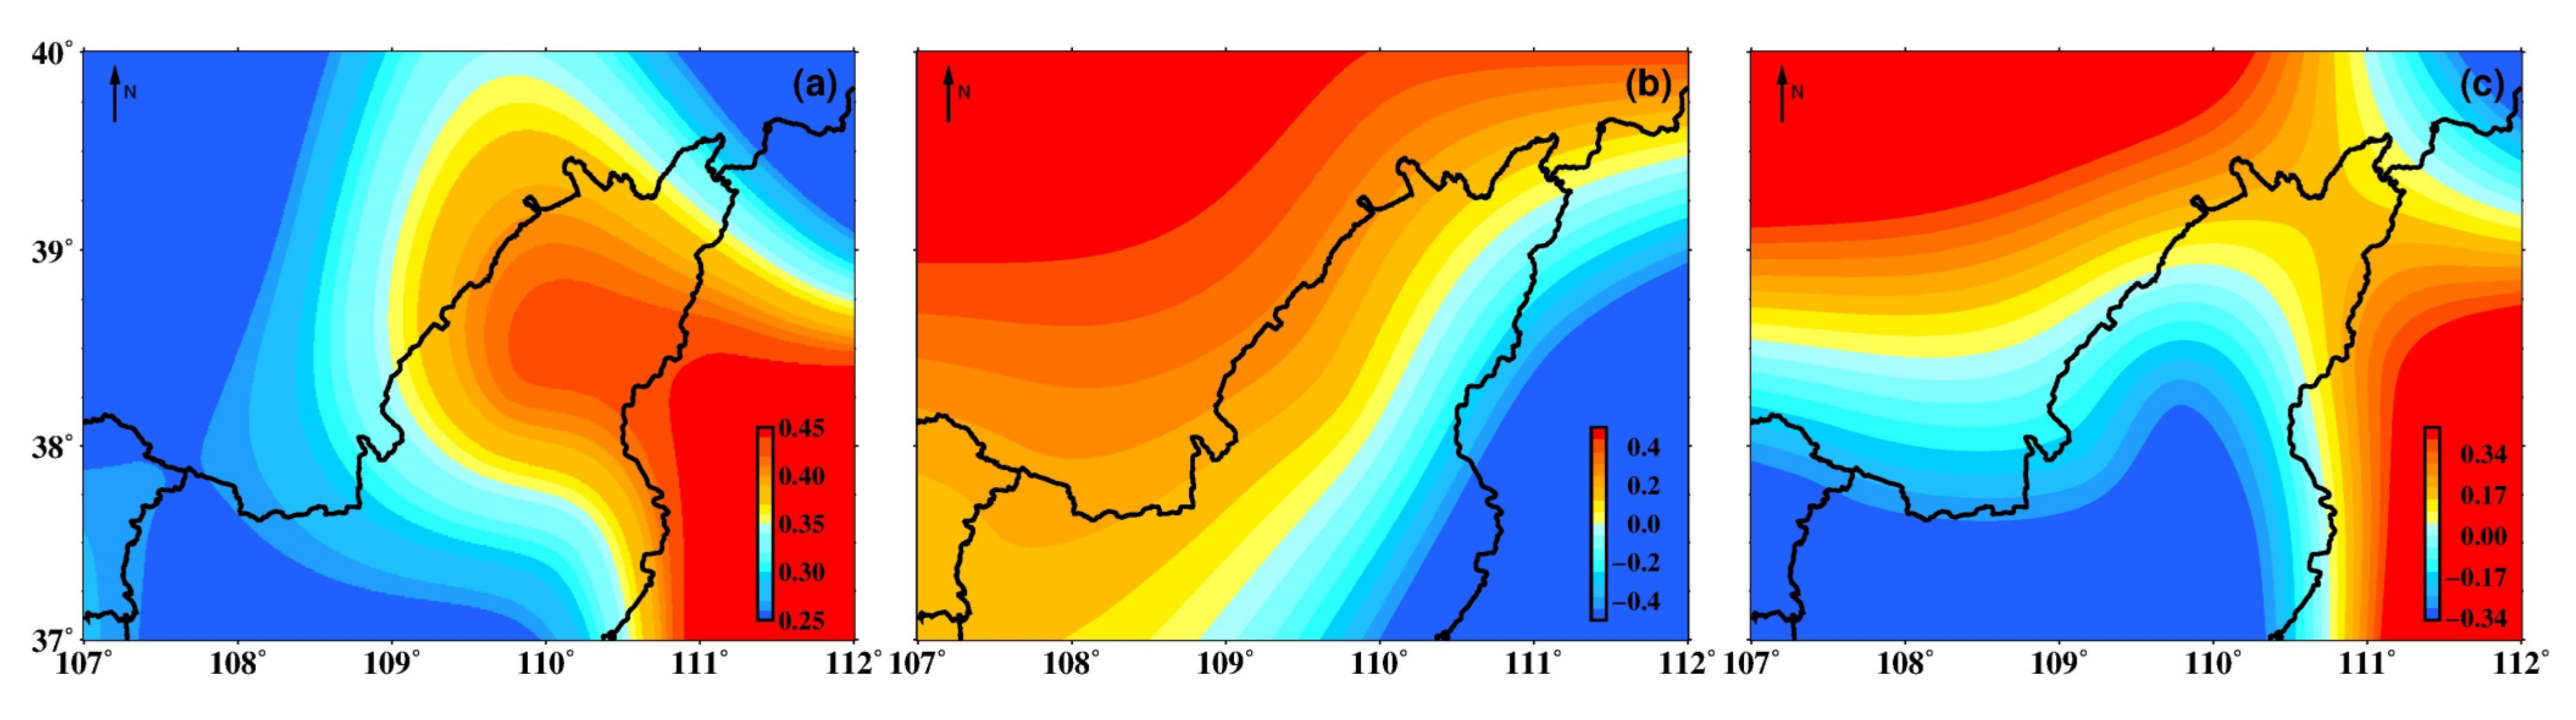
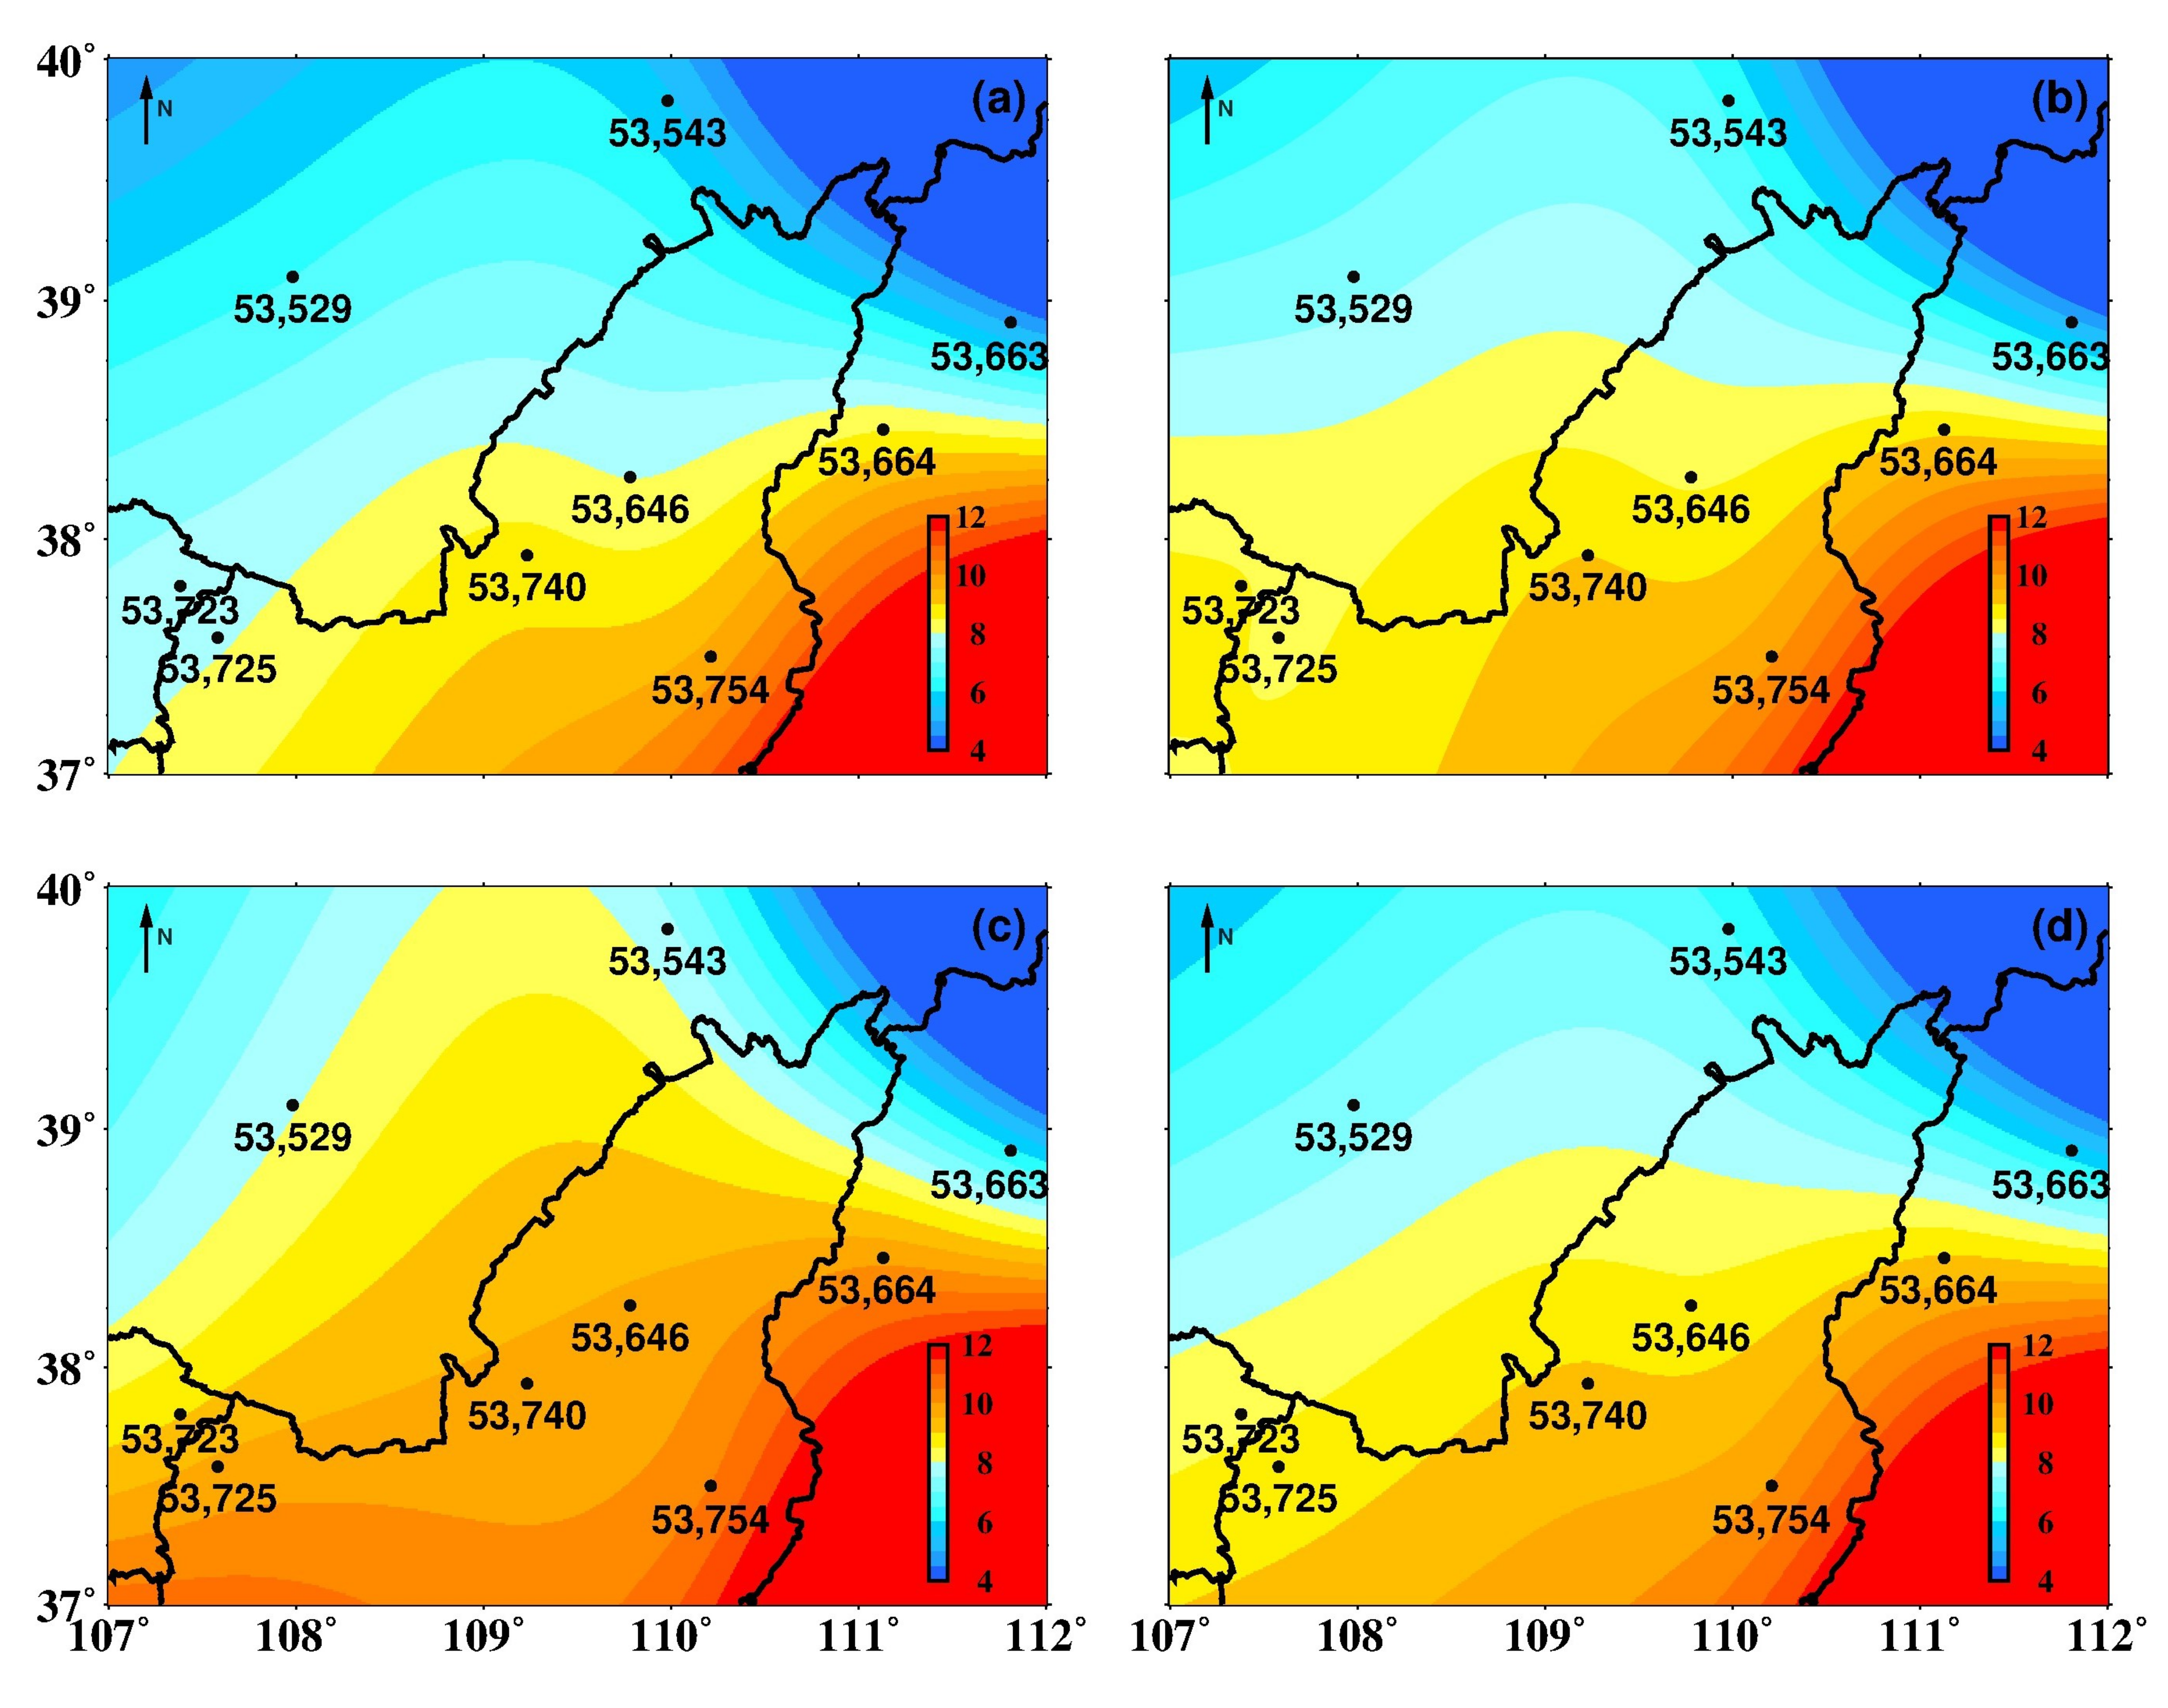
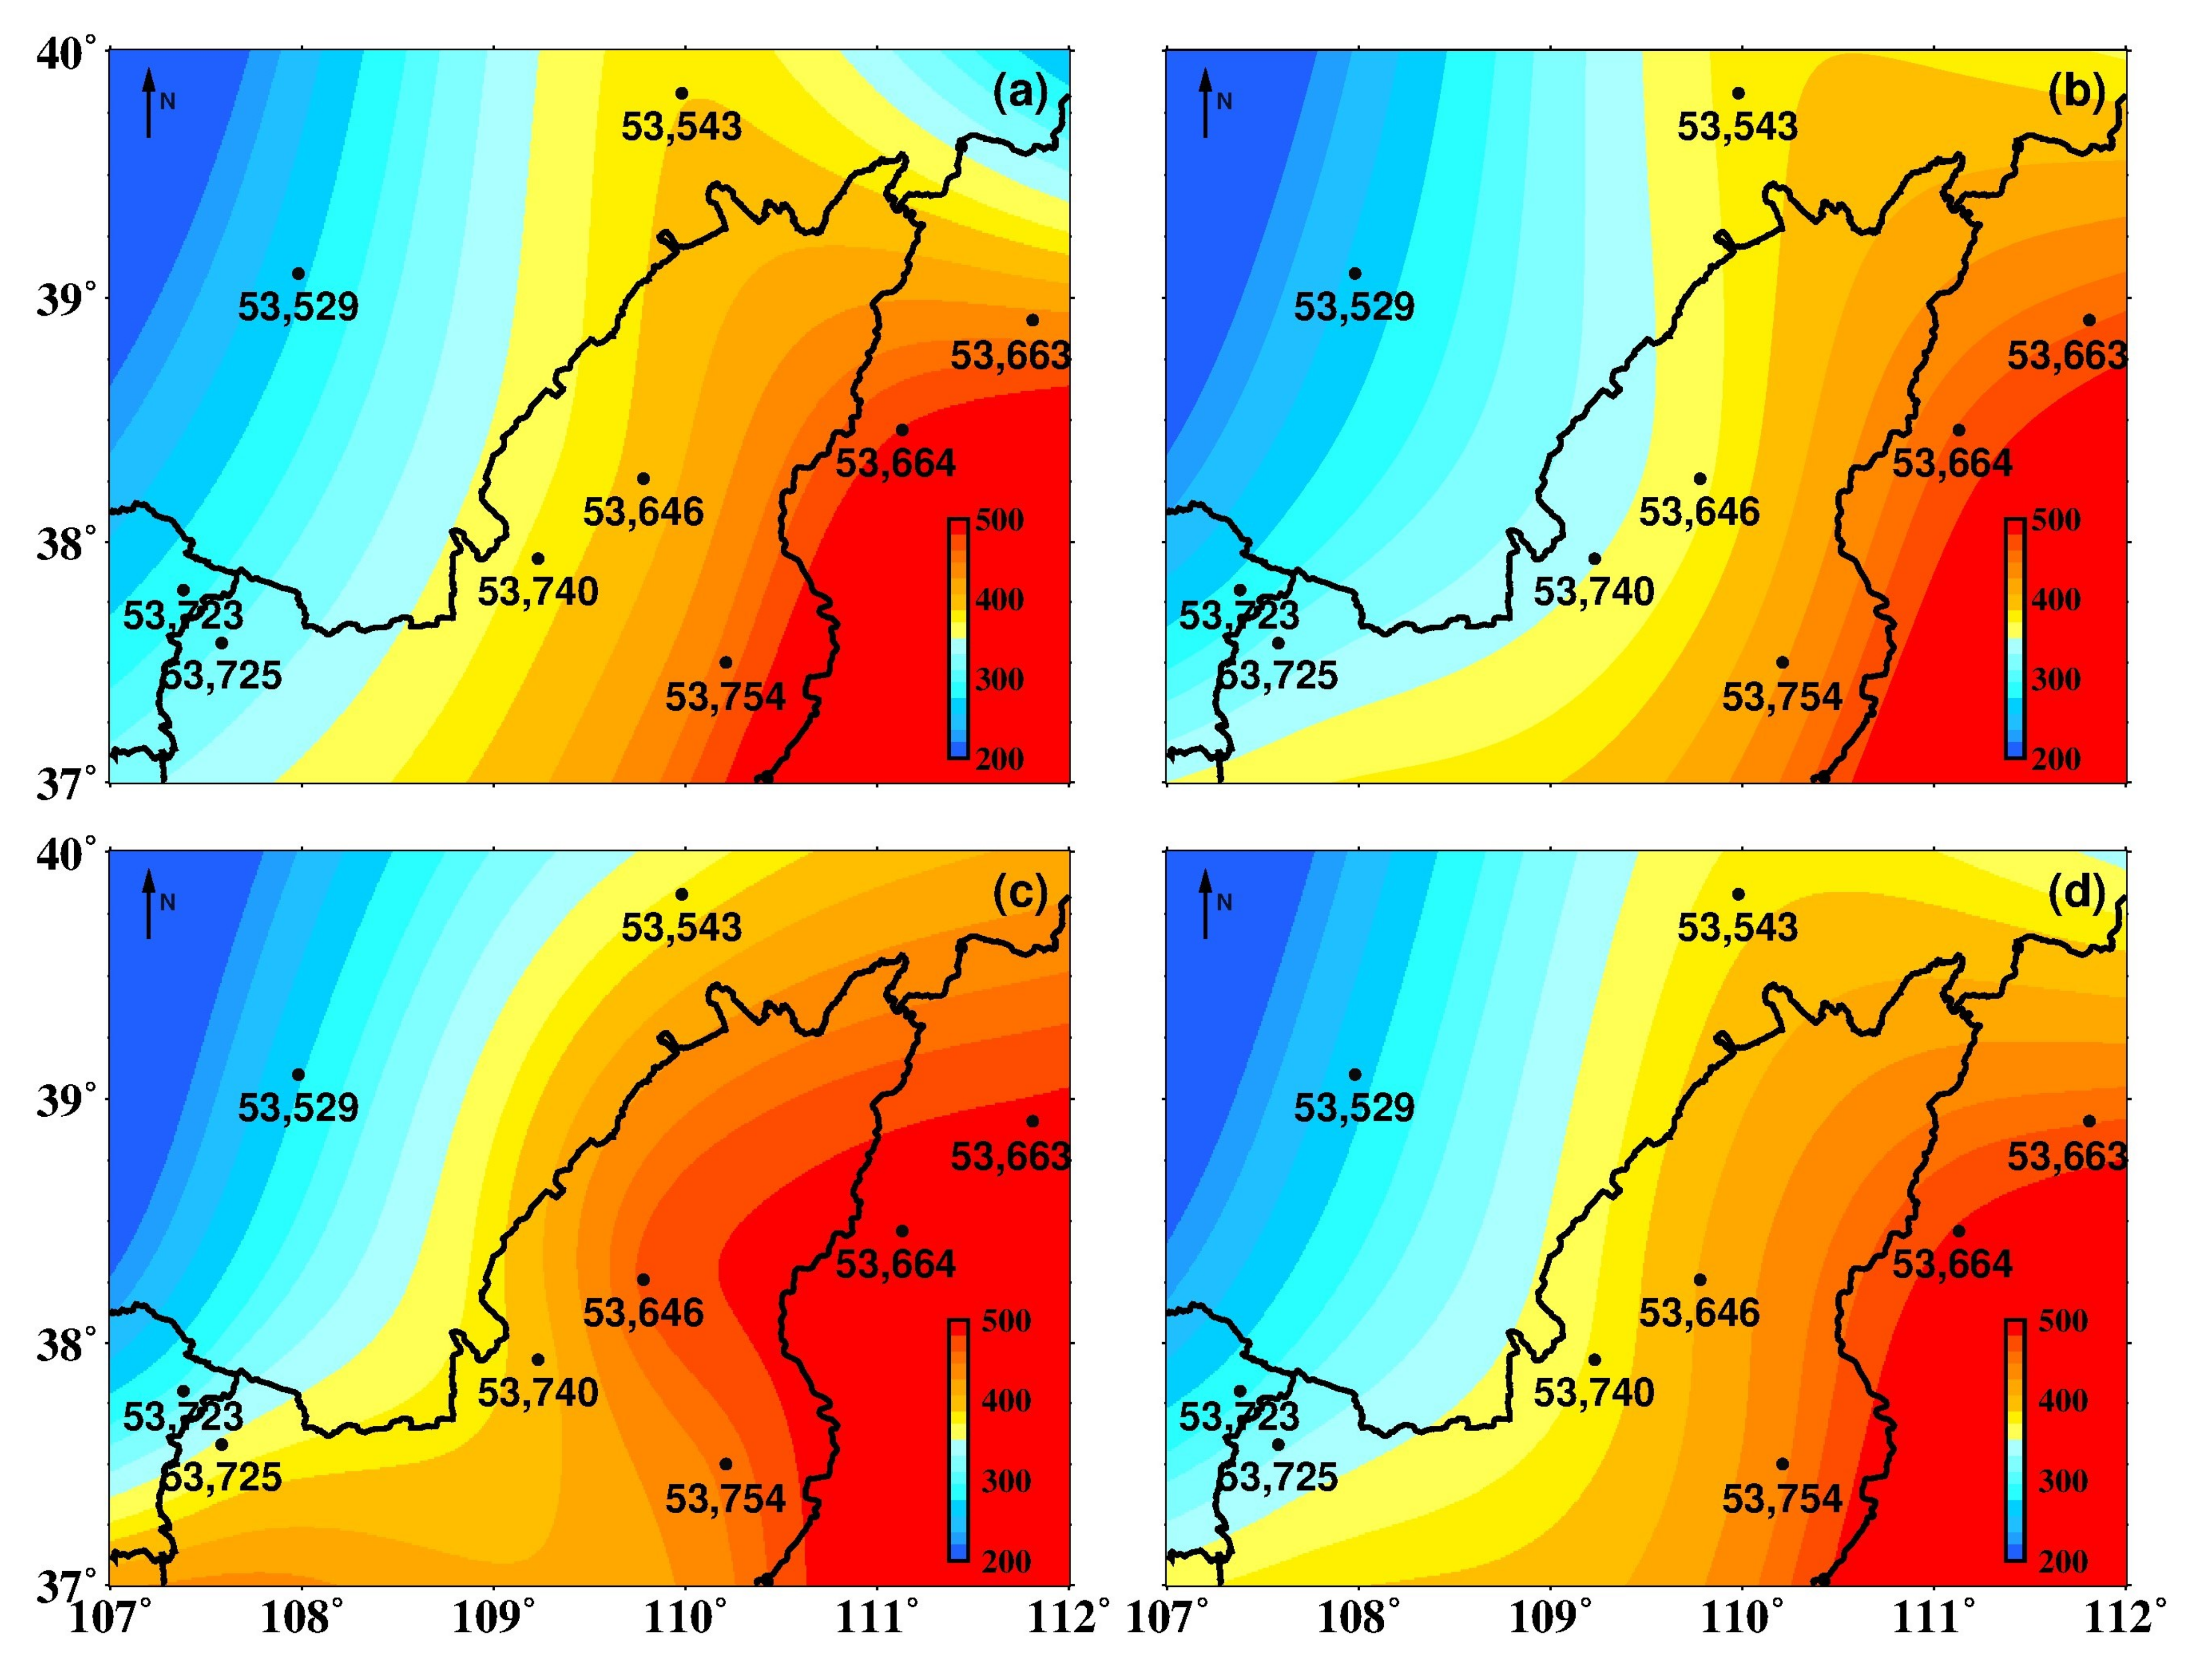
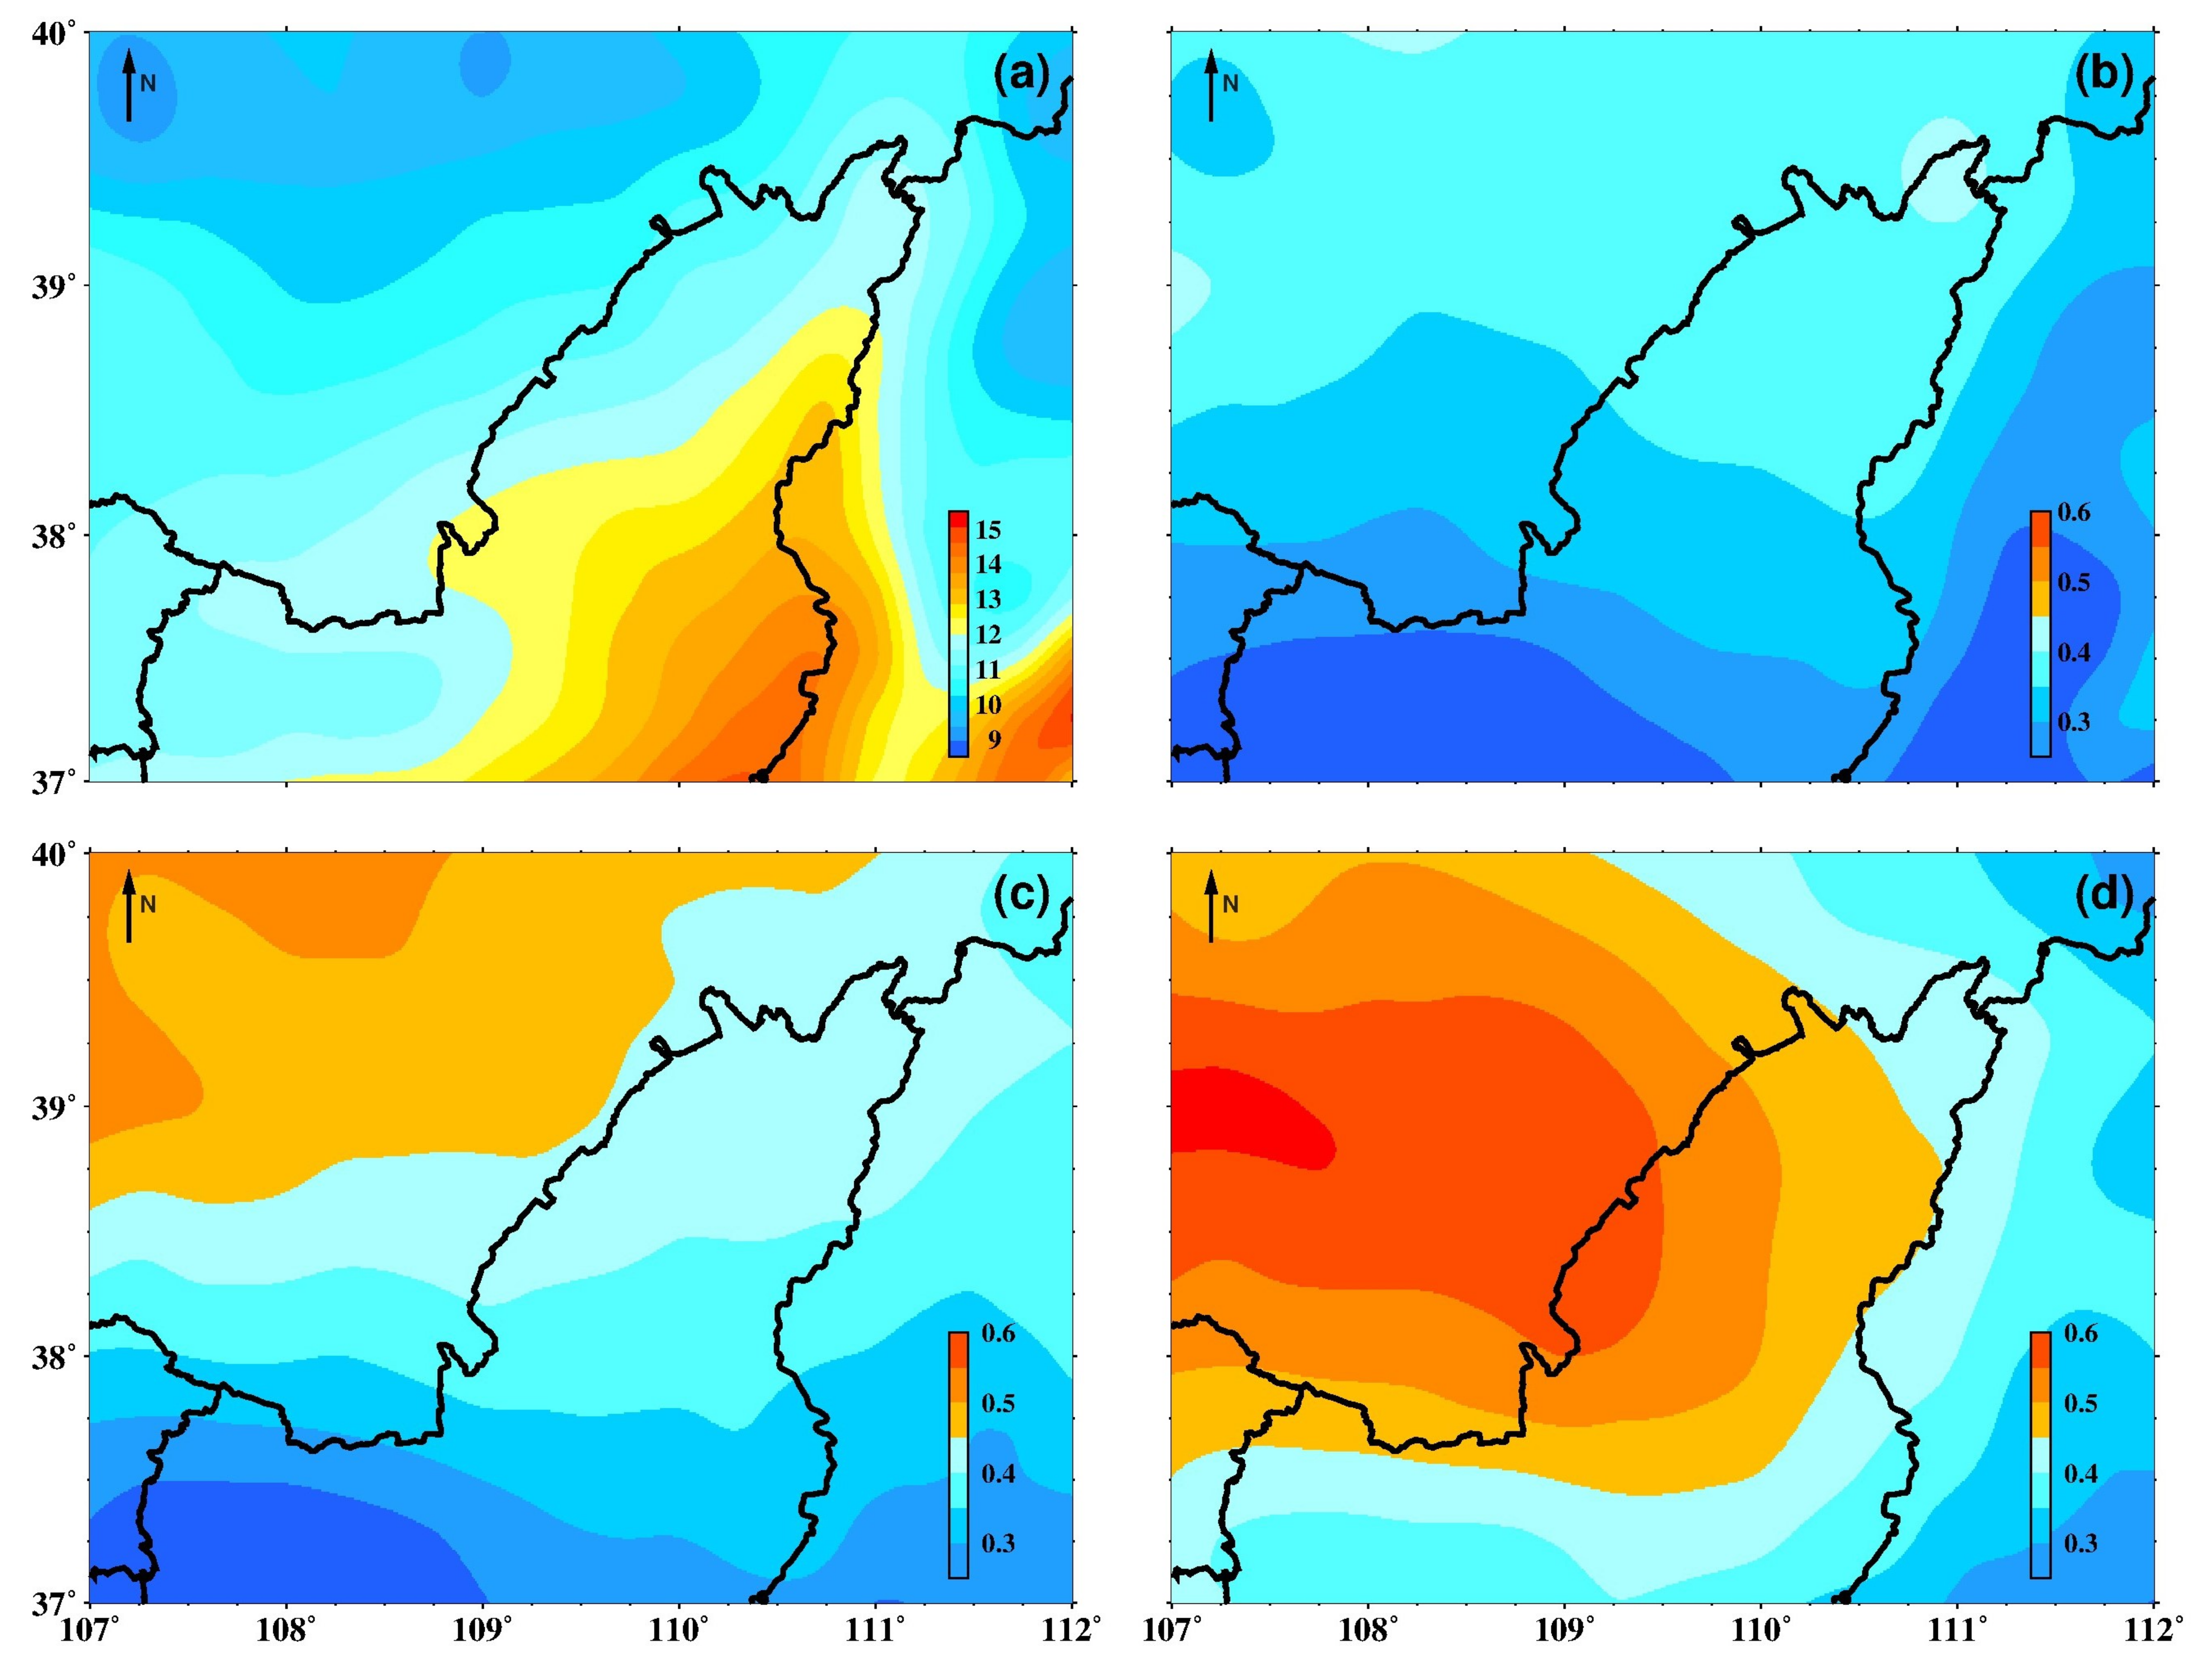
3.3. Analysis of the Spatial Distribution Characteristics of Temperature, Precipitation, and PWV

The general spatial change characteristics of the Mu Us dune field were obtained through principal component analysis. When analyzing the change characteristics of temperature, precipitation, and PWV, this study found that all three have phase characteristics. Therefore, in order to obtain more refined distribution and change information on the temperature and precipitation in the research area from 1960 to 2018, this investigation divided the 59 years from 1960 to 2018 into three stages, namely, 1960 to 1979, 1980 to 1999, and 2000 to 2018, in order to research the spatial distribution of temperature and precipitation in the region. This information was then compared with the overall spatial distribution from 1960 to 2018, which was conducted to obtain the changes in the spatial distribution of temperature and precipitation in various periods.
The temperature distribution in the Mu Us dune field (Figure 10d) can be summarized as an uneven spatial distribution. The temperature of the entire research area shows an obvious characteristic of gradually increasing from north to south with latitude and altitude (Figure 2a). The overall average temperature in the Mu Us dune field is between 4.5 and 12 °C. The temperatures in Suide, Hengshan, and Yulin, Shaanxi province, are relatively high, with an annual average temperature of around 8.5 to 10.5 °C. The Dingbian and Yanchi, Shaanxi, and Ningxia province are second, with an average temperature of around 8–10 °C. Etuoke Banner and Dongsheng, Inner Mongolia, are relatively high in altitude, so the average temperature is relatively low, and the average temperature for many years is around 6–8 °C. Xingxian and Wuzhai, both in Shanxi Province, are located at different altitudes, so the temperature is between 8.5 and 10 and 5.5 and 6.5 °C, respectively. Zhao et al. [26] believe that the temperature distribution in northwest China is quite different and is affected by terrain and altitude. This conclusion is consistent with this paper. According to the research data in this article, in the second period of the Mu Us dune field, the high temperature area in the second period moved to the north compared to the first period, showing a certain degree of temperature rise as a whole, and the overall temperature rise trends in Yulin, Suide, and Hengshan are obvious. From the third period, this trend gradually became significant. The temperature in the entire region rose significantly, and the high temperature area extended to the entire research area. The temperature in the entire region rose more than 1.5 °C and the temperature difference decreased.
The overall precipitation in the Mu Us dune field is between 200 and 500 mm, and the spatial distribution of precipitation is uneven. The eastern part has the most precipitation, ranging from 400 to 500 mm, gradually decreasing to the west (Figure 11d). Zhao et al. [26] believe that, due to the interphase distribution of topography and plains in the northwest, the mountain system blocks and uplifts water vapor, resulting in more precipitation in mountainous areas and less precipitation in plain areas. In addition to the monsoon and topographic factors, the factor that caused the precipitation in the east to be significantly higher than that in the west is also closely related to the distribution of rivers in the Mu Us dune field (Figure 2b). The Wuding River, Tuwei River, and other tributaries are distributed along the Yellow River on the Shaanxi-Shanxi boundary. The evaporation of river water is also one of the main factors for rainfall. The total precipitation in the research area decreased to a certain extent during the second time period compared with the first period, which was mainly manifested by a small decrease in the high precipitation value to the east, and a certain increase in the third time period. The highest value precipitation area in the whole study area developed to the west, and the precipitation in Dongsheng, Hengshan, and Yulin increased the most, with an increase of 30–40 mm.
Water vapor is the most active component in the atmosphere. Compared with temperature and precipitation, water vapor changes rapidly and drastically. In order to better capture the water vapor changes during this period, this study divided the 41 years of PWV from 1978 to 2018 into four stages, namely, 1978–1987, 1988–1997, 1998–2007, and 2008–2018. The average PWV of the first stage was considered to be the initial value. Then, the initial value of the first stage was subtracted from the average PWV of the last three stages to get the difference value of PWV of the three stages and this value was used to reflect the spatial variation of PWV with time. In the four stages, the PWV showed an increasing trend, and most of the northwestern part of the study area increased significantly (Figure 12). Among them, the Etuoke Banner, Dongsheng, and other areas in the second stage exhibited a small increase compared with the first stage, and the increase was between 0.2 and 0.4 mm, whilst the increase in Yulin, Hengshan, Suide, and other areas was not large. By the third stage, the increase in the amount of PWV in the entire study area began to be significant. The increase in the Etuoke Banner area reached 0.43–0.52 mm, and the increase in Yulin and Hengshan areas reached 0.36–0.44 mm. In the fourth stage, the area where the water vapor content increased in Dongsheng, Etuoke Banner, and other regions increased significantly compared with the first stage (Figure 12d), with an increase of 0.45–0.57 mm. Yulin, Hengshan, and other areas followed, with an increase of 0.41–0.54 mm. Compared with the first stage, the water vapor growth over Wuzhai, Xingxian, and other regions also increased.

4. Discussion

4.1. Responses of Temperature, Precipitation, and PWV to Global Warming

From a seasonal point of view, the temperature in the four seasons in the Mu US dune field increased by about 2.243, 1.003, 1.593, and 2.891 °C, respectively. The rising rates of temperature were 0.038, 0.017, 0.027, and 0.049 °C/a, respectively. Wu et al. [23] believe that the average temperature in China from 1951 to 2012 showed an upward trend, and the four seasonal temperature growth rates were 0.0255, 0.0207, 0.0258, and 0.0348 °C/a, respectively. This demonstrates that the seasonal temperature changes in the Mu Us dune field over the years are significantly higher than those in China as a whole, and are more sensitive to the global climate response. The regional performance is particularly obvious, especially in terms of the phenomenon of rising winter temperatures and decreasing temperature differences throughout the year. Liu et al. [21] also pointed out that the winter temperature in the Mu Us dune field has increased significantly in recent decades, and the phenomenon of a warm winter has appeared. The precipitation in the four seasons increased by 11.18, 10.443, 9.44, and 14.16 mm, respectively, and the precipitation increase rate was 0.202, 0.16, 0.177, and 0.24 mm/a, respectively. In the Mu Us dune field, the precipitation in spring, summer, and autumn has increased, but not significantly, and it can be seen that the precipitation increase in winter is more obvious. The reason for this phenomenon is related to the greater temperature rise in winter. Some scholars have conducted relevant research on precipitation in China and northwest China. Zhao et al. [26] pointed out that the winter precipitation in northwest China has increased significantly, but the total amount of precipitation is relatively small.
From the perspective of the annual average, the average temperature from 1960 to 2018 showed an overall upward trend (Figure 9), and the temperature increase rate was about 0.033 °C/a, which is the same as the average temperature increase trend in China [17,19,20]. Wu et al. [23] pointed out that, in the past 62 years, the annual average temperature increase rate in China has been 0.026 °C/a, and the global average temperature increase rate has been 0.012 °C/a. It can be concluded that the temperature increase trend in the Mu Us dune field in recent years is higher than the average level in China, and much higher than the global average temperature increase rate. Liu et al. [20] believe that the temperature increase rate in the Mu Us dune field from 1960 to 2000 was 0.0442 °C/a, and pointed out that the Mu Us dune field is developing towards “warming and drying”. The change in average precipitation from 1960 to 2018 showed a slight increasing trend, the precipitation increase rate was 0.781 mm/a, and the average annual precipitation was lower than the national average level of precipitation. Some scholars have conducted research on precipitation in China and even in northwest China. Chen et al. [27] believe that during the 50 years from 1961 to 2010, there was a slight increase in precipitation within China, with an average rate of 0.49 mm/a. Jia et al. [13] believe that, in the past 59 years, the temperature and precipitation in the arid area of northwestern China have increased. Shang et al. [28] pointed out that, in the past 55 years, the precipitation of China has not exhibited a significant change trend, and the frequency of precipitation has decreased, but the intensity has increased. Yao et al. [29] believe that with the progress of the greenhouse effect, although there is a trend of warming and humidification in the arid area of northwest China, an increase of water resources will not be enough to change the drought characteristics of the area. However, from the analysis results of this paper, the increasing trend of precipitation in the Mu Us dune field in recent years is higher than the average level in China. The growth rates of the four seasons of PWV in the Mu Us dune field are 0.0001, 0.0458, 0.0296, and -0.0059 mm/a, respectively. The interannual variation of the PWV (Figure 9) shows an overall upward trend of fluctuations. The increase rate of the PWV is about 0.0177 mm. Miao [30] pointed out that the increase rate of the PWV in northwest China in the past 56 years has been 0.011 mm, and the amount of PWV in the Mu Us dune field is higher than that in northwest China as a whole. This means that the “wetness” of the Mu Us dune field is not only reflected in the amount of precipitation, but also in the increase in atmospheric precipitation over the area, and this trend is continuing. According to the research results, the changing trend of temperature and precipitation before 2000 did tend to “warming and drying”, but since 2000, the rate of the temperature rise has become relatively flat, and the increase in temperature has become smaller compared with the same period.
The temperature and precipitation in the Mu Us dune field showed a new trend. With the increase of temperature, precipitation, and PWV, Mu Us dune field has been becoming “warmer and wetter” in recent years. The variation of temperature and precipitation in the eco-fragile area of the Mu Us dune field is significantly higher than that of China and of global temperature and precipitation, and it responds strongly to global climate change. Therefore, it can be used as a representative of an ecologically vulnerable area when studying global climate change.

4.2. Effects of Temperature, Precipitation, and PWV on Vegetation Coverage

Using principal component analysis to analyze the temperature, precipitation, and PWV of the Mu Us dune field for many years, it was found that the first vector fields of temperature, precipitation, and PWV all have positive values, indicating that the change trend is highly consistent. The time coefficient has an increasing trend, indicating that the area is warming up and getting wet, and the atmospheric water vapor content is increasing. These phenomena indicate that the above climatic elements are currently developing in a direction that is conducive to vegetation growth. The second eigenvector field of precipitation is a northwest-southeast reverse type, and its time coefficient has a decreasing trend, indicating that the precipitation in the northwestern region has decreased, while precipitation in the southeast region has increased. The third eigenvector of precipitation is reversed from north to south, indicating that there are differences in precipitation between the north and south, but there is no obvious trend from the time coefficient. Therefore, the characteristic sequence of long-term climatic factors in the Mu Us dune field indicates that climate warming has a positive impact on the restoration and improvement of the ecological environment in this area. The rising temperature makes the area humid, which is beneficial to the growth of vegetation and the restoration of the ecological environment.
From 1960 to 2018, the average temperature displays a significant increasing trend. Some scholars have investigated the correlation between temperature and vegetation coverage in the Mu Us dune field. Feng [8] believes that the correlation coefficient between the vegetation coverage and air temperature in the Mu Us dune field was 0.52 from 2000 to 2013. The reason for this phenomenon is that temperature and vegetation coverage are mutually affected. Vegetation can change the solar radiation and heat balance by changing the surface coverage and ground reflection. The reflection and radiation of vegetation change the elements of the heat balance, and then change the partial circulation process, and temperature can also act on the germination and transpiration of vegetation, affecting the actual vegetation coverage changes. Therefore, climatic warming may lead to insufficient water content in the soil, which will have a negative impact on vegetation growth. However, a rising temperature may increase the photosynthetic efficiency and extend the growing season, thereby promoting vegetation growth. Xu et al. [31] believe that, in recent years, the Mu Us dune field has basically shown a significant warming trend, and the correlation between temperature and NDVI is not significant, but it cannot be ruled out that the increase in vegetation coverage is partly due to the reaction of global warming. Therefore, improvement of the ecological environment mainly depends on precipitation.
The annual precipitation showed a small increasing trend. However, the rate of precipitation rise is gradually increasing and this is a good trend for the development of vegetation. The increase in precipitation could meet the demand of more vegetation for water resources. Feng [8] pointed out that, since 2000, the vegetation coverage in this area has increased significantly, and the spatial distribution of vegetation coverage has a positive correlation with the spatial distribution of precipitation. Xu et al. [31] believe that precipitation in the Mu Us dune field is the main limiting factor for vegetation growth, and vegetation growth has a strong dependence on precipitation. Li et al. [32] pointed out that the change of vegetation coverage will affect the precipitation by affecting the atmospheric circulation situation. The reason for the changes in the spatial distribution of precipitation in 1960–2018 in the Mu Us dune field is the result of the combined effect of the vegetation coverage and the increase in temperature in the area. The increase in temperature increases the water vapor in the area, and the vegetation changes the distribution of rainfall and affects the exchange of groundwater with the atmosphere, which are factors that change the precipitation. Compared with before 2000, the precipitation after 2000 is more conducive to the growth and development of vegetation and has a certain role in promoting the restoration of the ecological environment in the region, and this trend will continue.
From 1978 to 2018, the annual average PWV showed an increasing trend. Zhu [8] pointed out that the vegetation coverage in the Mu Us dune field showed an increasing trend from northwest to southeast, and there are seasonal differences. The average vegetation coverage in the four seasons is 23.13%, 40.92%, 34.4%, and 15.21%, respectively. When the vegetation coverage is high, the PWV is higher than when the vegetation coverage is low. The reason for this phenomenon is that, when the vegetation coverage is high, the soil can hold more water resources. The transpiration of vegetation affects water evaporation to a much greater extent than natural evaporation. In sunshine, the water on the leaves of plants will also evaporate into the air, resulting in a higher PWV content. Accordingly, the rise of vegetation cover can affect the PWV of the region. Li et al. [32] pointed out that the change of vegetation cover will affect the PWV by affecting the atmospheric circulation situation. Therefore, it can be considered that the reduction of the sandy land area and the increase of vegetation coverage have a significant impact on the increase of water vapor in the area, which has greatly improved and stabilized the climate and ecological environment.

4.3. Effects of Human Practices on Vegetation Coverage

Climate is the main natural factor that affects vegetation coverage and regional ecological environments, but in the series of activities of “returning sand to forest” that have been in progress since 1960, human factors cannot be ignored. The Chinese government has implemented a number of large-scale ecological protection projects in the Mu Us dune field in China, starting from the “Three North Shelterbelt” project in 1979, to the implementation of the “Law of the People’s Republic of China on Sand Prevention and Control” in 2002 and the State Council’s “About Further Improvement Several Opinions on Policies and Measures for Returning Farmland to Forests”. In this way, China has been contributing efforts to desertification prevention and control. According to statistics, Yulin City, Shaanxi Province has planted more than 10,000 mu of forest in the hinterland of the Mu Us dune field. The vegetation coverage in Shaanxi has advanced 400 km northward, and the forest coverage rate has increased from 0.9% to 34.8%. The phenomenon of soil erosion has basically disappeared completely. Judging from the results of this paper, an increase in vegetation coverage [33] and decrease in sandy land area change the surface coverage and ground reflection, which in turn changes the solar radiation and heat balance, which has a certain restraining effect on the temperature rise in this area. At the same time, the increase in vegetation coverage affects the exchange of groundwater and atmospheric water in the area, thereby changing the amount of precipitation and PWV, and has a significant impact on the increase in the atmosphere and groundwater resources, making the climate of the area improve and stabilize to a large extent.
The data we use cannot clearly distinguish whether the increase in vegetation coverage is due to human or natural factors. However, they still have an important implication. This study thus provides a good example for showing humankind how to respond to global climate change in semiarid-arid eco-fragile areas and has far-reaching significance for the restoration of ecological environments in semi-arid ecologically vulnerable areas.

5. Conclusions

In this study, the daily temperature and precipitation data for 59 years of nine meteorological observatories and the ERA5 data for 41 years of monthly average PWV data in the Mu Us dune field were analyzed. Time series and the spatial distribution of temperature, precipitation, and PWV were discussed. We first carried out a principal component analysis of various climatic factors to initially determine the temporal and spatial characteristics of the region, as preparation and verification work for follow-up research. For the time change, we mainly wanted to detect and determine its periodic change, so we carried out the fast Fourier transform to determine the period of each climatic factor, and then analyzed the seasonal change and inter-annual change of each climatic factor. Regarding spatial changes, we separately described the spatial distribution of various climatic factors in the study area, and analyzed the spatial changes of each climatic factor in the region in different time periods. At the same time, the relationship between various climatic factors and NDVI have been described. The above-mentioned climatic factors’ change trends show that the Mu Us dune field has been getting more sensitive to global climate changes and becoming “warmer and wetter” in recent years. This long-term trend is largely driven by regional ecological environment changes and global warming. Finally, this study shows that the present natural conditions are favorable for the growth and development of vegetation.

Author Contributions

G.H., H.Z., J.Z., and B.L., conceived and designed the experiments; G.H., H.Z., and J.Z., performed the experiments; G.H., H.Z., and J.Z. analyzed and interpreted the results. All authors have read and agreed to the published version of the manuscript.

Funding

This study was supported by The National Natural Science Foundation of China (Nos. 41731066; 41774025), The National Key Research and Development Program of China (No. 2018YFC1505102), The Outstanding Youth Foundation of Shaanxi (No. 2019JC-20), The Grand Projects of the BeiDou-2 System (No. GFZX0301040308), and The Special Fund for Basic Scientific Research of Central Colleges (Nos. CHD300102268305; CHD300102268305).

Institutional Review Board Statement

Not applicable.

Informed Consent Statement

Not applicable.

Data Availability Statement

Not applicable.

Acknowledgments

The ground meteorological data prepared by China Meteorological Administration (CMA) are available at http://data.cma.cn/. The reanalysis data, consisting of ERA5 products, have been released by ECMWF at https://www.ecmwf.int/.

Conflicts of Interest

The authors declare no conflict of interest.

References

  1. Diaz, H.F.; Bradley, R.S.; Eischeid, J.K. Precipitation fluctuations over global land areas since the late 1800’s. J. Geophys. Res. Atmos. 1989, 94, 1195–1210. [Google Scholar] [CrossRef]
  2. Hansen, J.; Lebedeff, S. Global trends of measured surface air temperature. J. Geophys. Res. 1987, 92, 13345–13372. [Google Scholar] [CrossRef] [Green Version]
  3. Hansen, J.; Lebedeff, S. Global surface air temperatures: Update through 1987. Geophys. Res. Lett. 2013, 15, 323–326. [Google Scholar] [CrossRef] [Green Version]
  4. Jones, P.D.; Raper, S.C.B.; Bradley, R.S.; Diaz, H.F.; Wigley, T.M.L. Northern Hemisphere Surface Air Temperature Variations: 1851–1984. J. Appl. Meteorol. 1986, 25, 161–179. [Google Scholar] [CrossRef] [Green Version]
  5. Jones, P.D.; Wigley, T.M.L.; Wright, P.B. Global temperature variations between 1861 and 1984. Nature 1986, 322, 430–434. [Google Scholar] [CrossRef]
  6. Kumar, P.; Sharma, M.C.; Saini, R.; Singh, G.K. Climatic variability at Gangtok and Tadong weather observatories in Sikkim, India, during 1961–2017. Sci. Rep. 2020, 10, 15177. [Google Scholar] [CrossRef]
  7. Yang, L.; Wylie, B.K.; Tieszen, L.L.; Reed, B.C. An Analysis of Relationships among Climate Forcing and Time-Integrated NDVI of Grasslands over the U.S. Northern and Central Great Plains. Remote Sens. Environ. 1998, 65, 25–37. [Google Scholar] [CrossRef]
  8. Feng, Y. Vegetation Coverage Change in Mu Us Sandy Land and Its Response to Climate Change. Ph.D. Thesis, Beijing Forestry University, Beijing, China, 2015. [Google Scholar]
  9. Kawabata, A.; Ichii, K.; Yamaguchi, Y. Global monitoring of interannual changes in vegetation activities using NDVI and its relationships to temperature and precipitation. Int. J. Remote Sens. 2001, 22, 1377–1382. [Google Scholar] [CrossRef]
  10. Ma, D.; Notaro, M.; Liu, Z.; Chen, G.; Liu, Y. Simulated impacts of afforestation in East China monsoon region as modulated by ocean variability. Clim. Dyn. 2013, 41, 2439–2450. [Google Scholar] [CrossRef]
  11. Gao, X.; Zhao, Z.; Ding, Y. The Greenhouse Effect Caused by the Numerical Simulation of China Regional Climate Change Ⅰ: Mode of China’s Climate Simulation Ability Test. J. Meteorol. 2003, 61, 20–28. [Google Scholar]
  12. Huang, J.; Wen, C.; Wen, Z.; Zhang, G.; Li, Z. Atmospheric Science in China Since the Founding of New China 70 Years Ago: Climate and Climate Change. Sci. Sin. 2019, 49, 1607–1640. [Google Scholar]
  13. Jia, Y.; Bo, Z.; Bin, M.; Bin, C.; Wu, Q. Spatio-temporal evolution characteristics of persistent drought in Southwest China in 1960–2015. J. Arid Land Resour. Environ. 2019, 5, 171–176. [Google Scholar]
  14. Bin, M.; Bo, Z. Spatio-temporal distribution of the climatic seasons in China from 1961 to 2016. Acta Geogr. Sin. 2020, 75, 458–469. [Google Scholar]
  15. Ma, P.; Han, L.; Zhang, X.; Liu, W. Regional Characteristics of Drought in China under the Background of Climate Warming. J. Desert Res. 2019, 39, 209–215. [Google Scholar]
  16. Wu, S.; Yong, L.; Hao, W.; Wang, J. Climate change impacts and Adaptation in China: Trends and Prospects. Chin. Sci. Bull. 2016, 61, 1042–1054. [Google Scholar]
  17. Zhang, D.; Gao, X. RegCM3 High Resolution Simulation of China’s Regional Climate Change in the 21st Century. Chin. Sci. Bull. 2020, 65, 2516–2526. [Google Scholar]
  18. Department of Geography Panjab University. The Natural Conditions and Their Improved Utilization in the Mu Us Dune Field; Science Press: Beijing, China, 1983. [Google Scholar]
  19. Zhu, F. Temporal and Spatial Changes of Desertification and Climate Impacts in the Four Sandy Lands of Northern China in the Past 30 Years. Ph.D. Thesis, Nanjing University, Nanjing, China, 2015. [Google Scholar]
  20. Liu, D.; Yan, Y. Spatial differentiation of climate changes in MU US desert region. Resour. Sci. 2003, 25, 71–76. [Google Scholar]
  21. Liu, D.; Zhang, Y. The Characteristics of Climate Changes in Mu Us Desert Under Global Climate Changes. J. Arid Land Resour. Environ. 2003, 17, 78–81. [Google Scholar]
  22. He, T. The Environment Change of Mu Us Desert in Historical Period. Ph.D. Thesis, Lanzhou University, Lanzhou, China, 2008. [Google Scholar]
  23. Wu, X.; Yu, W.; Liang, Z. Spatio Temporal Distribution and Variation Trend of Temperature and Precipitation over China Based on High Resolution Gridded Datasets. Meteorol. Disaster Reduct. Res. 2016, 39, 241–251. [Google Scholar]
  24. Wang, S.; Xu, T.; Nie, W.; Jiang, C.; Zhang, Z. Evaluation of Precipitable Water Vapor from Five Reanalysis Products with Ground-Based GNSS Observations. Remote Sens. 2020, 12, 1817. [Google Scholar] [CrossRef]
  25. Yao, Y.; Lei, X.; Liang, Z.; Bao, Z.; Hai, P.; Zhang, J. Analysis of precipitable water vapor and surface temperature variation over Qinghai-Tibetan Plateau from 1979 to 2014. Chin. Sci. Bull. 2016, 61, 1462–1477. [Google Scholar] [CrossRef] [Green Version]
  26. Zhao, C.; Wang, Y.; Ding, Y. Spatial-Temporal Variations of Temperature and Precipitation in Northern China in Recent 50 Years. Plateau Meteorol. 2011, 30, 385–390. [Google Scholar]
  27. Chen, J.; Liu, Y.; Tao, P.; Wu, H. Spatiotemporal Variation of Precipitation in China and Its Impact on Surface Dry-Wet Conditions During 1961–2010. J. Nat. Resour. 2019, 34, 2440–2453. [Google Scholar]
  28. Shang, S.; Lian, L.; Ting, M.; Kun, Z.; Tuo, H. Spatiotemporal Variation of Temperature and Precipitation in Northwest China in Recent 54 Years. Arid Zone Res. 2018, 35, 68–76. [Google Scholar]
  29. Yao, J.; Qing, Y.; Chen, Y.; Hu, W. Climate change in arid areas of Northwest China in past 50 years and its effects on the local ecological environment. J. Nat. Resour. 2013, 32, 1283. [Google Scholar]
  30. Miao, W. The Influence of Vegetation Change in Northwest Region on China’s Summer Climate. Master’s Thesis, Lanzhou University, Lanzhou, China, 2018. [Google Scholar]
  31. Xu, Z.; Rui, H.; Wang, K.; Mason, J.A.; Wu, S.; Lu, H. Recent greening (1981–2013) in the Mu Us dune field, north-central China, and its potential causes. Land Degrad. Dev. 2018, 29, 1509–1520. [Google Scholar] [CrossRef]
  32. Li, Q. Spatial-temporal pattern of vegetation coverage in Northwest China and its response to climate change. J. Northwest Univ. 2012, 4, 667–672. [Google Scholar]
  33. Li, D.; Zhao, W. Changes of fractional vegetation coverage after returning farmland to forests and its response to climate in Shaanxi. J. Nat. Resour. 2020, 39, 1–10. [Google Scholar]
Figure 1. Geographic location (a) and meteorological stations (b) in the research area.
Remotesensing 13 00627 g001
Figure 2. Digital Elevation Model (DEM) (a) and river distribution map (b) of the Mu Us dune field.
Remotesensing 13 00627 g002
Figure 3. Main program schematic diagram for this study.
Remotesensing 13 00627 g003
Figure 4. Variation of the first characteristic vector field (a) and its time coefficient (b) of temperature in the Mu Us dune field.
Remotesensing 13 00627 g004
Figure 5. The first (a), second (b), and third (c) eigenvector fields of precipitation in the Mu Us dune field.
Remotesensing 13 00627 g005
Figure 6. Time coefficient changes of the first (a), second (b), and third (c) feature vectors of precipitation in the Mu Us dune field.
Remotesensing 13 00627 g006
Figure 7. Changes of the first characteristic vector (a) and time coefficient (b) of precipitable water vapor (PWV) in the Mu Us dune field.
Remotesensing 13 00627 g007
Figure 8. Distribution of seasonal air temperature, precipitation, and PWV in the Mu Us dune field.
Remotesensing 13 00627 g008
Figure 9. Interannual variation of temperature, precipitation, and PWV in the Mu Us dune field.
Remotesensing 13 00627 g009
Figure 10. Temperature spatial distribution (°C) in the Mu Us dune field in 1960–1979 (a), 1980–1999 (b), 2000–2018 (c), and 1960–2018 (d).
Remotesensing 13 00627 g010
Figure 11. Annual precipitation spatial distribution (mm) in the Mu Us dune field from 1960–1979 (a), 1980–1999 (b), 2000–2018 (c), and 1960–2018 (d).
Remotesensing 13 00627 g011
Figure 12. Difference between the initial precipitation (a) and the second (b), third (c), and fourth (d) stages in the Mu Us dune field (mm).
Remotesensing 13 00627 g012
Table 1. List of synoptic stations used in this study.
Station-NumberNameProvinceLatitude
(°)
Longitude
(°)
Altitude
(m)
53529Etuoke-BannerInner-Mongolia39.1107.981380.3
53543Dong ShengInner-Mongolia39.83109.981461.9
53646Yu LinShaan Xi38.26109.781157
53663Wu ZhaiShan Xi38.91111.811401
53725Ding BianShaan Xi37.58107.581360.3
53723Yan ChiNing Xia37.80107.381349.3
53754Sui DeShaan Xi37.50110.21929.7
53664Xing XianShan Xi38.46111.131012.6
53740Heng ShanShaan Xi37.93109.231111
Table 2. Variance contribution rate of climatic factors in the Mu Us dune field (%).
Variance Contribution RateIIIIII
Temperature95.04 11.771.31
Precipitation61.68 110.29 19.35 1
PWV92.66 14.272.01
1 passing the North test.
Publisher’s Note: MDPI stays neutral with regard to jurisdictional claims in published maps and institutional affiliations.

