Article

Automatic Detection of Optical Signatures within and around Floating Tonga-Fiji Pumice Rafts Using MODIS, VIIRS, and OLCI Satellite Sensors

1
Aix Marseille Université, Université de Toulon, IRD, CNRS/INSU, Observatoire des Sciences de l’Univers Pythéas, UM 110, Mediterranean Institute of Oceanography (MIO), CEDEX 09, 13288 Marseille, France
2
Pacific Centre for Environment and Sustainable Development (PaCE-SD), The University of the South Pacific, Laucala Campus, Suva, Fiji
3
Scripps Institution of Oceanography, University of California San Diego, 8810 Shellback Way, La Jolla, CA 92093, USA
4
ENTROPIE, Centre IRD de Nouméa, BP A5, 98848 Nouméa, New Caledonia
*
Author to whom correspondence should be addressed.
Remote Sens. 2021, 13(3), 501; https://doi.org/10.3390/rs13030501
Submission received: 31 December 2020 / Revised: 27 January 2021 / Accepted: 27 January 2021 / Published: 31 January 2021
(This article belongs to the Special Issue Atmospheric Correction for Remotely Sensed Ocean Color Data)

Abstract

:
An underwater volcanic eruption off the Vava’u island group in Tonga on 7 August 2019 resulted in the creation of floating pumice on the ocean’s surface extending over an area of 150 km2. The pumice’s far-reaching effects from its origin in the Tonga region to Fiji and the methods of automatic detection using satellite imagery are described, making it possible to track the westward drift of the pumice raft over 43 days. Level 2 Moderate Resolution Imaging Spectroradiometer (MODIS), Visible Infrared Imaging Radiometer Suite (VIIRS), Sentinel-3 Ocean and Land Color Instrument (OLCI), and Sentinel-3 Sea and Land Surface Temperature Radiometer (SLSTR) imagery of sea surface temperature, chlorophyll-a concentration, quasi-surface (i.e., Rayleigh-corrected) reflectance, and remote sensing reflectance were used to distinguish consolidated and fragmented rafts as well as discolored and mesotrophic waters. The rafts were detected by a 1 to 3.5 °C enhancement in the MODIS-derived “sea surface temperature” due to the emissivity difference of the raft material. Large plumes of discolored waters, characterized by higher satellite reflectance/backscattering of particles in the blue than surrounding waters (and corresponding to either submersed pumice or associated white minerals), were associated with the rafts. The discolored waters had relatively lower chlorophyll-a concentration, but this was artificial, resulting from the higher blue/red reflectance ratio caused by the reflective pumice particles. Mesotrophic waters were scarce in the region of the pumice rafts, presumably due to the absence of phytoplanktonic response to a silicium-rich pumice environment in these tropical oligotrophic environments. As beach accumulations around Pacific islands surrounded by coral shoals are a recurrent phenomenon that finds its origin far east in the ocean along the Tongan trench, monitoring the events from space, as demonstrated for the 7 August 2019 eruption, might help mitigate their potential economic impacts.

Graphical Abstract

1. Introduction

The question of detecting floating pumice is interesting for islands in the Pacific. Pumice is an important agent for rafting that effectively can increase the dispersal of marine biodiversity and link isolated shallow coastal and marine ecosystems [1]. Poorly understood, this natural phenomenon creates dynamic interactions between volcanism and marine biology [1]. Despite often going unnoticed, large pumice rafts are capable of creating nuisances for Pacific economies including causing propeller damage and scraped hulls [2], affecting mariners traveling from one island to another. Harbors may be blocked for months, diverting maritime traffic [3,4,5,6]. Moreover, if clasts end up completely populating beaches it could lead to their closure, thus potentially affecting tourism [2]. This is particularly crucial for the Pacific island country of Fiji, which predominantly relies on ocean tourism for revenue generation and job creation.
Since the late 1700s, there have been recordings of more than 70 volcanic eruptions occurring in the Tongan section of the Tofua-Kermadec Arc, which is greater than 2500 km long and located within the Tofua-Kermadec Ridge [7]. Often following a submarine volcanic activity is the formation of pumice rafts [6,8,9], which has been well documented for the 6–8 August 2019 episode [2,10]. Long-distance raft drifts from Tonga to the Great Barrier Reef are suspected to bring colonial epibionts to the Great Barrier Reef [1]. Ref. [11] raised the hypothesis that volcanic ash at a global scale could enrich iron-deficient areas and that the release of such iron and large proportions of different nutrients from volcanic sources could feed primary production (in their case Chaetoceros bloom near La Soufrière at Montserrat island). In the Tongan Oceanic region, [9] documented pumice rafts drifting immediately after the 2006 Home Reef volcanic eruption and described their association with a specific optical signature, such as discolored waters described in the form of a highly reflective (Type I) plume. Indeed, together with pumice, discoloration associated with eruptions is identifiable using satellite imagery and results from the mixing of various hydrous oxides (SiO2, Al2O3, Fe2O3) with seawater [12]. The authors also described large chlorophyll enrichments, but those were restricted in size and length and lagged temporally (two months after the eruption). In addition to examining chlorophyll-a concentration (Chla) and remote sensing reflectance (Rrs), findings from [9] showed a general increase in sea surface temperature (SST), reaching its peak in December 2006. Another study by [8] indicated that satellite observations at Home Reef off Tonga during this same eruption, which formed a new volcanic island, showed increased SST.
Upon further investigation and based on satellite imagery from the National Aeronautics and Space Administration (NASA), the raft that followed the 6–8 August 2019 eruption appeared as early as 8 August 2019 in a rear-arc location between Fonualei and Late, the volcanic islands in Tonga [10]. Over time, the larger consolidated pumice raft progressively dispersed into smaller rafts, drifting past Lakeba Island in Fiji on 2 September 2019, stranding on the two main Fijian islands on 19 September 2019, and eventually later making its way to the western shorelines of the Yasawa Group (Western Division of Fiji) for more than two months before being released back into the open ocean [2]. On 14 October 2019, another event occurred in Tonga where intermittent smoke eruption towered 15,000–17,000 feet above the summit of the Metis Shoal Volcano Ha’apai, triggering an aviation VONA (Volcanic Observatory Notice for Aviation) alert to Orange, according to the Tonga Meteorological Service [13]. This October eruption was not accompanied by rafts or discolored waters at least as seen from Moderate Resolution Imaging Spectroradiometer (MODIS) imagery.
Satellite sensors like MODIS are used widely for the detection, monitoring, and mapping of phytoplankton blooms through Chla, a direct proxy for phytoplankton abundance (e.g., [14]). Nevertheless, it has been shown that in the case of floating objects, atmospheric correction is usually erroneous and can lead to negative surface reflectance retrievals or flagged pixels. This is the case for particularly dense surface algae blooms causing red tides, as Trichodesmium can do [14,15,16,17,18,19], or floating sargassum rafts [20,21] for which red channels are impacted by vegetation material at the surface and cannot be used to isolate atmospheric effects.
In this paper, we investigate the diversity of floating material that can be automatically detected following the August 2019 submarine volcanic eruption in Tonga and examine optical and biological influences on regional waters. This is accomplished by looking into SST and Rrs imagery from satellite sensors. Using optical signatures, Chla obtained within the pumice raft area is used to detect any potential influence from the eruption event relative to nutrient supply. First, we describe optical signatures and SST within and around the raft using Level 2 (L2) satellite imagery post-eruption and define criteria allowing for identification of different water types in addition to the rafts. Second, we follow the evolution of these different water types from the first stage when the raft was initially consolidated and then fragmented as it drifted from the eruption site towards Fijian Waters. Finally, we conclude on the magnitude and causes of Chla changes that may occur in the proximity of the rafts or discolored waters.

2. Data and Methods

To describe the variety of optical signatures associated with the pumice rafts, a series of images, acquired by the MODIS sensors onboard the Aqua and Terra satellites at 1 km resolution as well as from the Visible Infrared Imaging Radiometer Suite (VIIRS) at 750 m resolution onboard the Suomi National Polar-orbiting Partnership (NPP) after the August 2019 Tonga eruption, covering the period 8 August–27 September 2019, were selected and extracted from NASA’s Ocean Color website. Information about the locations and observed dates of the selected images are shown in Table 1. Furthermore, the only Sentinel-3 Ocean and Land Color Instrument (OLCI) L2 images (300 m resolution) corresponding to the MODIS series were retrieved via the Data Access Centre on the European Organisation for the Exploitation of Meteorological Satellites (EUMETSAT) website and compared to MODIS and VIIRS images. In a similar approach, SST was also extracted from the Ocean Color and EUMETSAT websites to observe any differences in sea surface temperatures within and around the rafts toward the end of August (Table 1).

2.1. Sentinel-3 Utilization

Sentinel-3 OLCI Water Full Resolution (WFR) Level 1B and L2 data were selected to observe spectral signatures in the visible and infrared channels. Sentinel-3 Sea and Land Surface Temperature Radiometer (SLSTR) L2 Water Product data were used to observe sea surface temperatures. Sentinel Application Platform (SNAP) software packages allowed reprojecting the imagery at source resolution onto a Mercator projection, to produce ocean color and SST images and extract all parameter data, and to compare the spectral signatures around pumice rafts. Blue Rrs values from OLCI data were retrieved by dividing Oa3 reflectance (water-leaving radiance) values by π to make comparisons with MODIS and VIIRS images. These data were used only in an exploratory way as the series did not allow a temporal analysis.

2.2. Methods for the Automatic Definition of Radiometric Signatures around Pumice Rafts

To define different spectral signatures of interest, we used L2 SST and ocean color reflectance before atmospheric correction and after atmospheric correction. SeaDAS 7.5 software packages were used to re-project the imagery at source resolution onto a Mercator projection, to produce ocean color and SST images, extract all parameter data, and compare the spectral signatures around pumice rafts. As it was shown earlier that floating objects are masked by default atmospheric corrections [16], the rhos SeaDAS product, here defined as ρ, i.e., quasi-surface reflectance (surface + aerosol, i.e., Top of Atmosphere reflectance minus Rayleigh reflectance) was extracted. Therefore, the following L2 products were used:
(1)
Chla
(2)
Rhos (ρ product at all wavelengths)
(3)
Ocean color Rrs reflectance suite
(4)
Generalized Inherent Optical Properties suite (GIOP inversion for particle backscattering coefficient, bbp)
(5)
Quality control (QC) L2_flags
(6)
SST

2.2.1. Infrared Spectrum Usage for Defining Automatically Consolidated Rafts

For L2 MODIS and VIIRS products, clouds were detected as having lower than normal ocean temperatures (~14–24.5 °C for MODIS). When applied, the L2 cloud mask identified both clouds and parts of the consolidated raft as clouds in the SST channels. To automatically find anomalous responses in regions corresponding to consolidated rafts of pumice as detected in true color, we used the L2 SST products of MODIS and VIIRS. The SST readings showed that the consolidated raft distinctly displayed higher temperatures than its environment. Using SeaDAS L2_flags and SST product, an appropriate SST threshold for consolidated raft detection, SSTraft, was designed by following a two-step process: (1) generation of SST’, a by-product from SST after data screening by removing pixels with poor quality using the following L2_flags: STRAYLIGHT (stray light), CLDICE (cloud or ice), ATMFAIL (atmospheric correction failure), PRODWARN (generic product warning), HIGLINT (high sun glint), HILT (high radiance), HISATZEN (high view zenith), COASTZ (bathymetry), TURBIDW (turbid water), HISOLZEN (high solar zenith), LAND (land), MODGLINT (moderate glint), and ATMWARN (atmospheric correction warning); and (2) computation of SSTraft from max(SST’) + 0.1 °C.
Clear depiction of the shapes of the raft over time were identified as on 12 August UTC for MODIS and VIIRS. This temperature difference may not be a true depiction of actual temperatures within the raft due to the emissivity of pumice (temperature of the consolidated pumice would appear to be higher for this reason), but rather allows only automatic definition of a mask for the consolidated raft. Corresponding ρ, as shown by boxplots of pixels under the SST mask, shows very high values especially in the near infrared (Figure 1). This explains why, like clouds, raft pixels in MODIS and VIIRS images were impacted by inaccurate atmospheric correction [9,19,21] and why the consolidated pumice raft is represented as NaN (Not a Number) in these images. Indeed, the first criterion to detect surface phytoplankton mats, i.e., negative reflectance in the red or near-infrared, identified pixels of the aerosol reflectance that were over-corrected due to the false hypothesis that the ocean has a null signal in this spectral range [19].

2.2.2. SeaDAS Masks for Defining Automatically Fragmented Rafts

Fragmented pumice is well observed in ocean true color, but unfortunately, could not be as easily differentiated with the SST mask. To discriminate fragmented pumice, we used L2 QC processing flags produced by SeaDAS for L2 marine reflectance resulting from complete atmospheric correction (Rayleigh and aerosols). These flags are generally used to gather satellite measurements of low quality, i.e., to identify and exclude questionable pixels [22]. In this instance, however, it was discovered that two masks in particular, ATMWARN and LOWLV (low-level water-leaving radiance), were useful in detecting the presence of fragmented streams of pumice (“fragmented pumice”) throughout the studied dates.

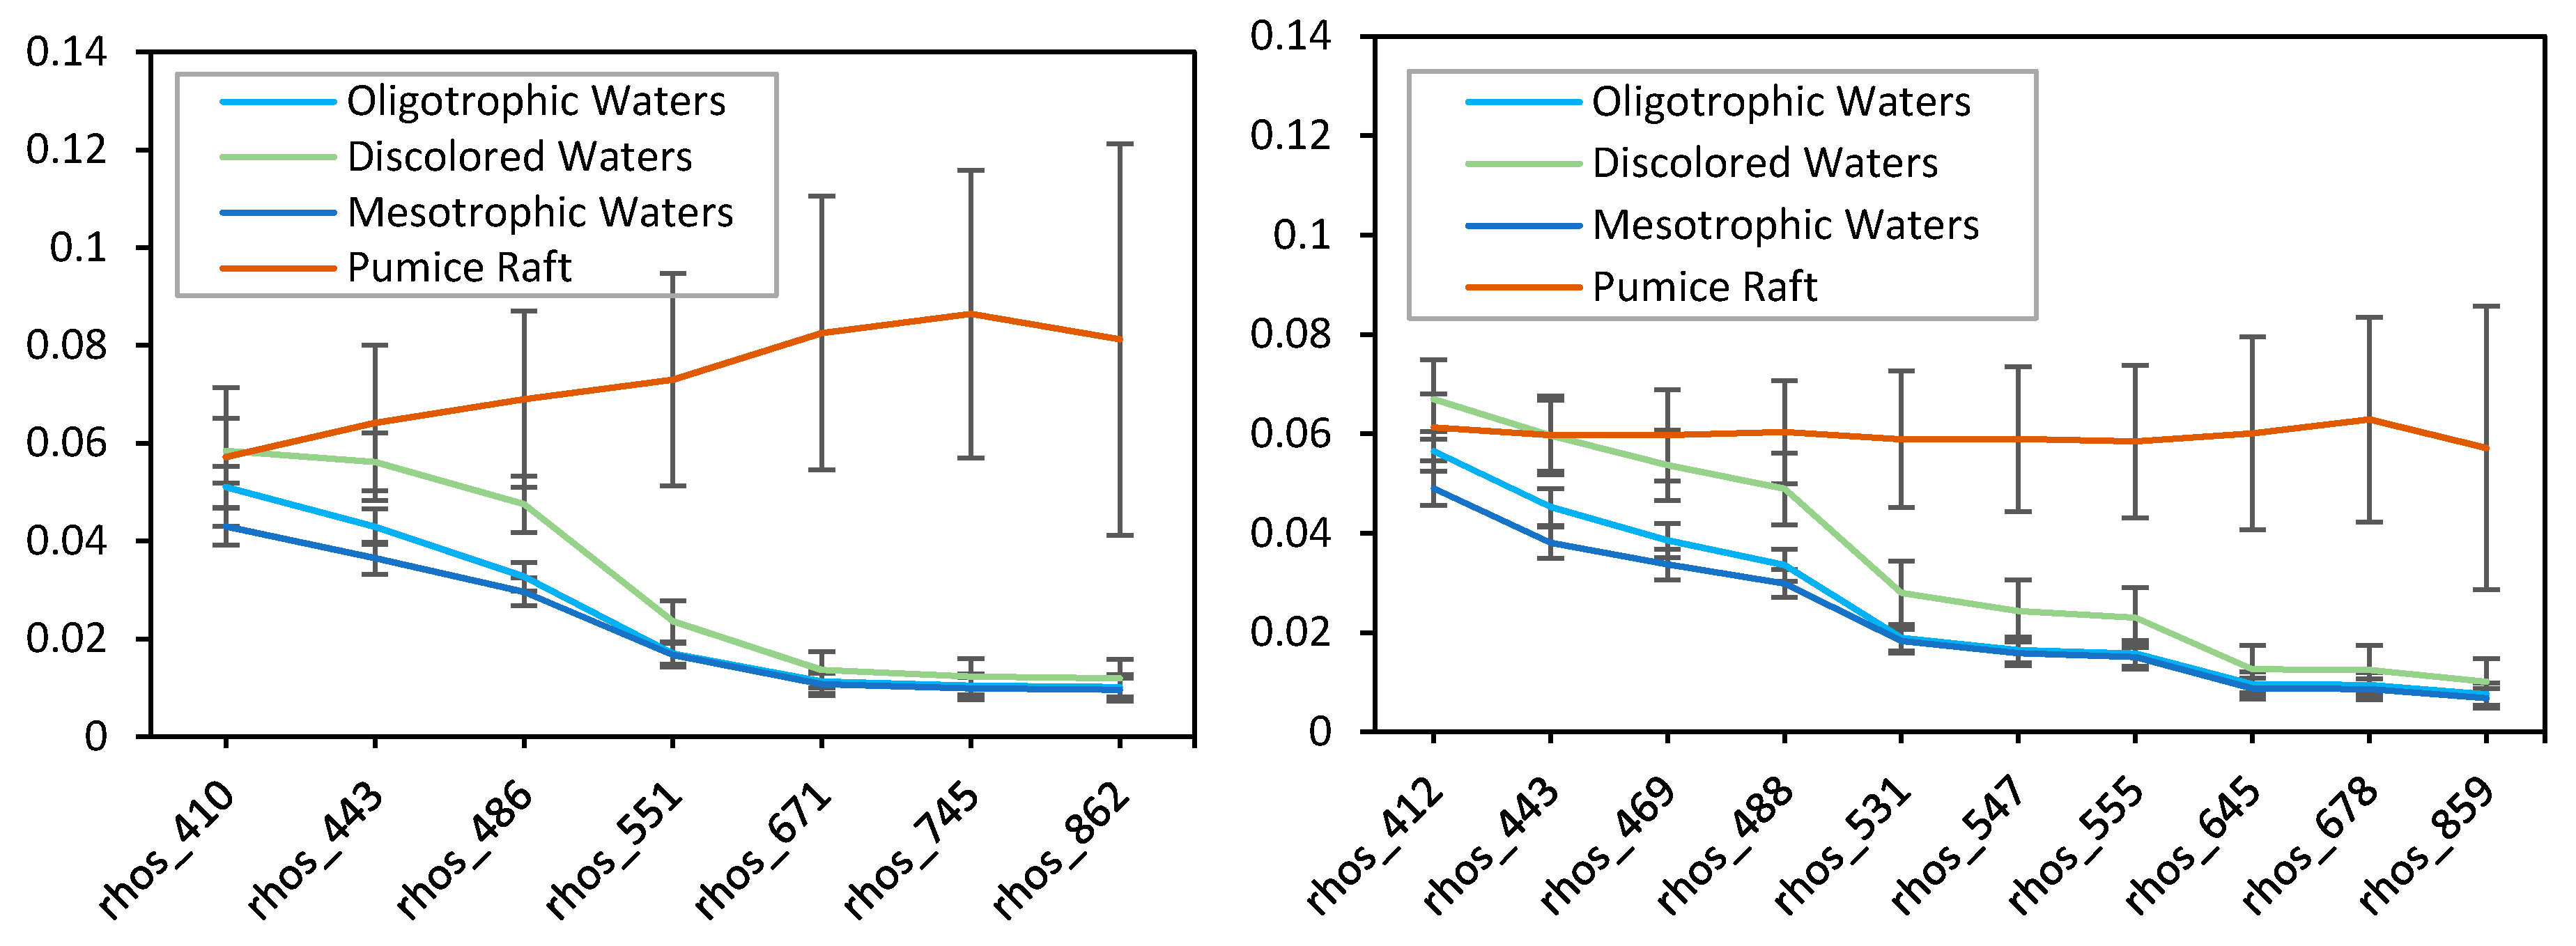
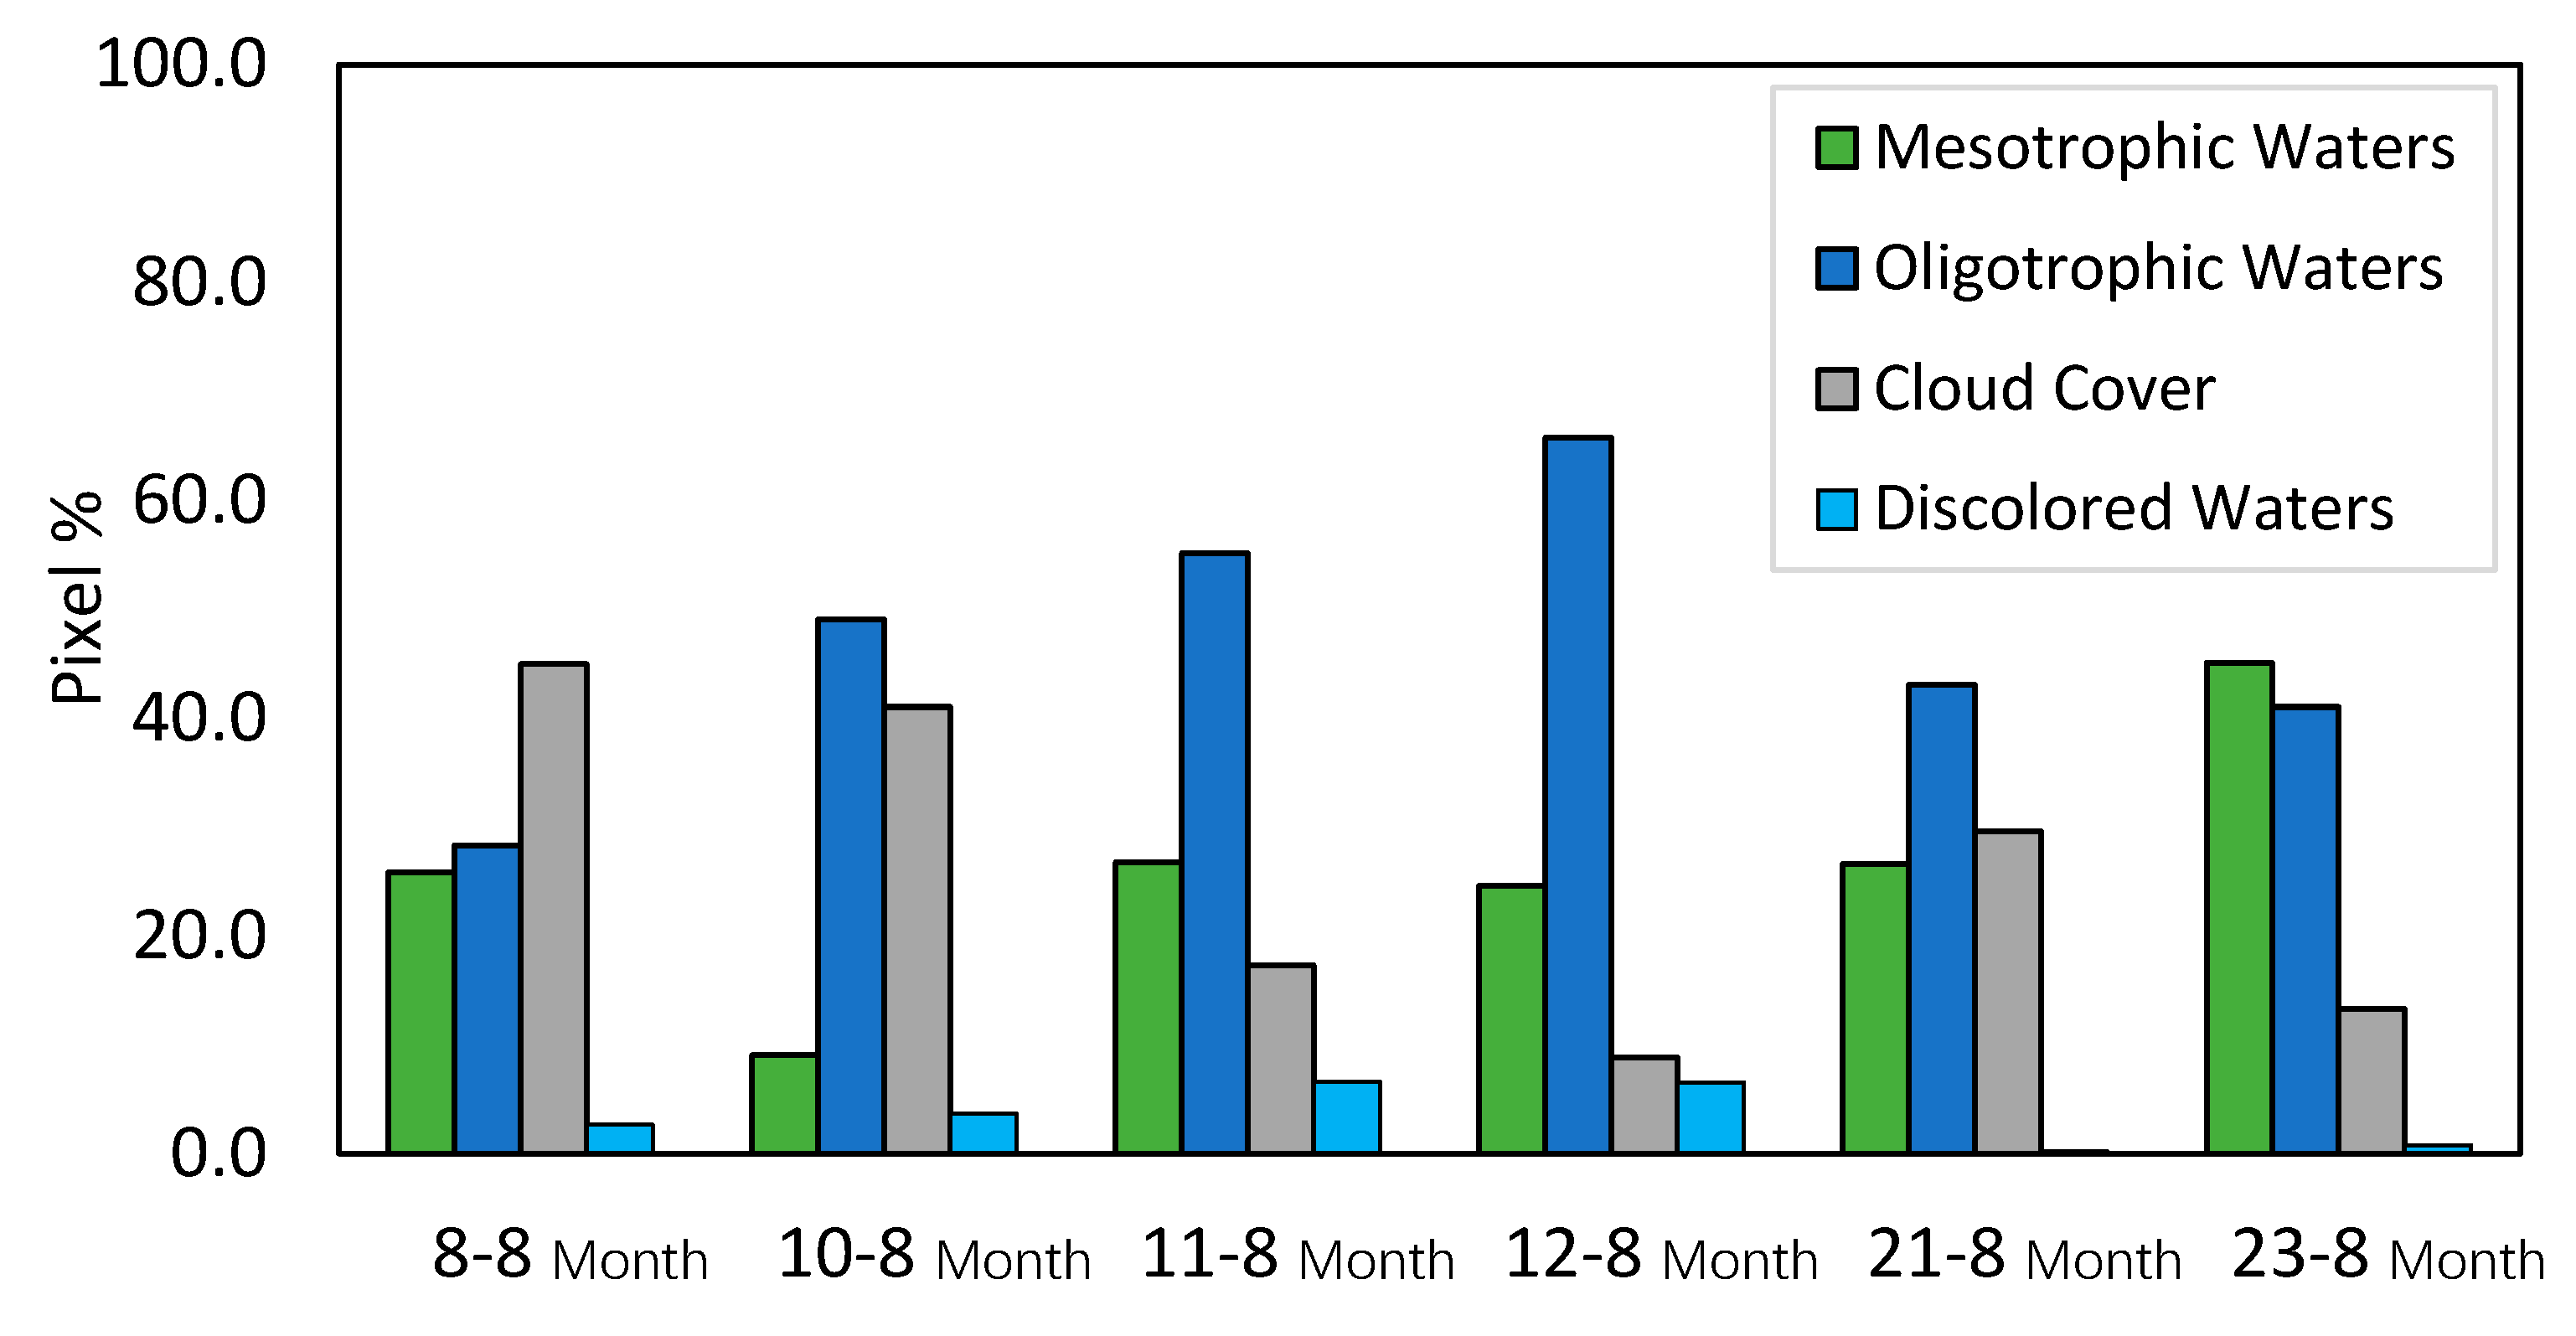
2.2.3. Ocean Color Thresholds for Automatically Defining Discolored, Mesotrophic, and Normal Oceanic Waters

No clear distinction in the SST signal was found to detect discolored waters from open ocean waters. For other objects, water reflectance after atmospheric correction (L2 Ocean Color products) was used to find thresholds. To automatically differentiate clusters, we also used specific thresholds on L2 OC products derived from water reflectance and issued from the default SeaDAS algorithm.
To define specifically “discolored waters” (Table 2, Figure 2) a threshold in the backscattering coefficient of particles calculated by SeaDAS (“bbp _giop at 443 nm”) of 0.0032 m−1 was used.
Corresponding ρ, as shown by boxplots of pixels under the bbp_giop mask, shows very high values in the UV-blue to blue (410 nm, 443 nm, 486 nm) channels for MODIS as well as for VIIRS (Figure 2). When OC3 (a 3-band bio-optical algorithm for the retrieval of Chla) is used, the disproportion of the blue channel versus the green one creates lower Chla concentrations than the surrounding concentrations, and the discolored waters appear as “ultra-oligotrophic” (an artefact of OC3 in the case of the discolored waters). Note that none of the pixels in discolored waters were masked.
To define “mesotrophic” waters (Chla enhancement around the rafts), the pixels outside the masks and QC flags were sorted according to the threshold of 0.1 mg·m−3. This threshold distinguishes oligotrophic and mesotrophic waters in the Pacific Ocean [22,23] and also corresponds to the value at which the OC3 MODIS algorithm branches from one algorithm to another [24].
For comparison purposes only, Figure 3 shows the ρ spectra from VIIRS and MODIS of different components and water types including the pumice raft, discolored waters, and oligotrophic and mesotrophic waters. As expected, the mesotrophic and oligotrophic waters differ from the discolored waters, notably in the blue reflectance.

3. Results

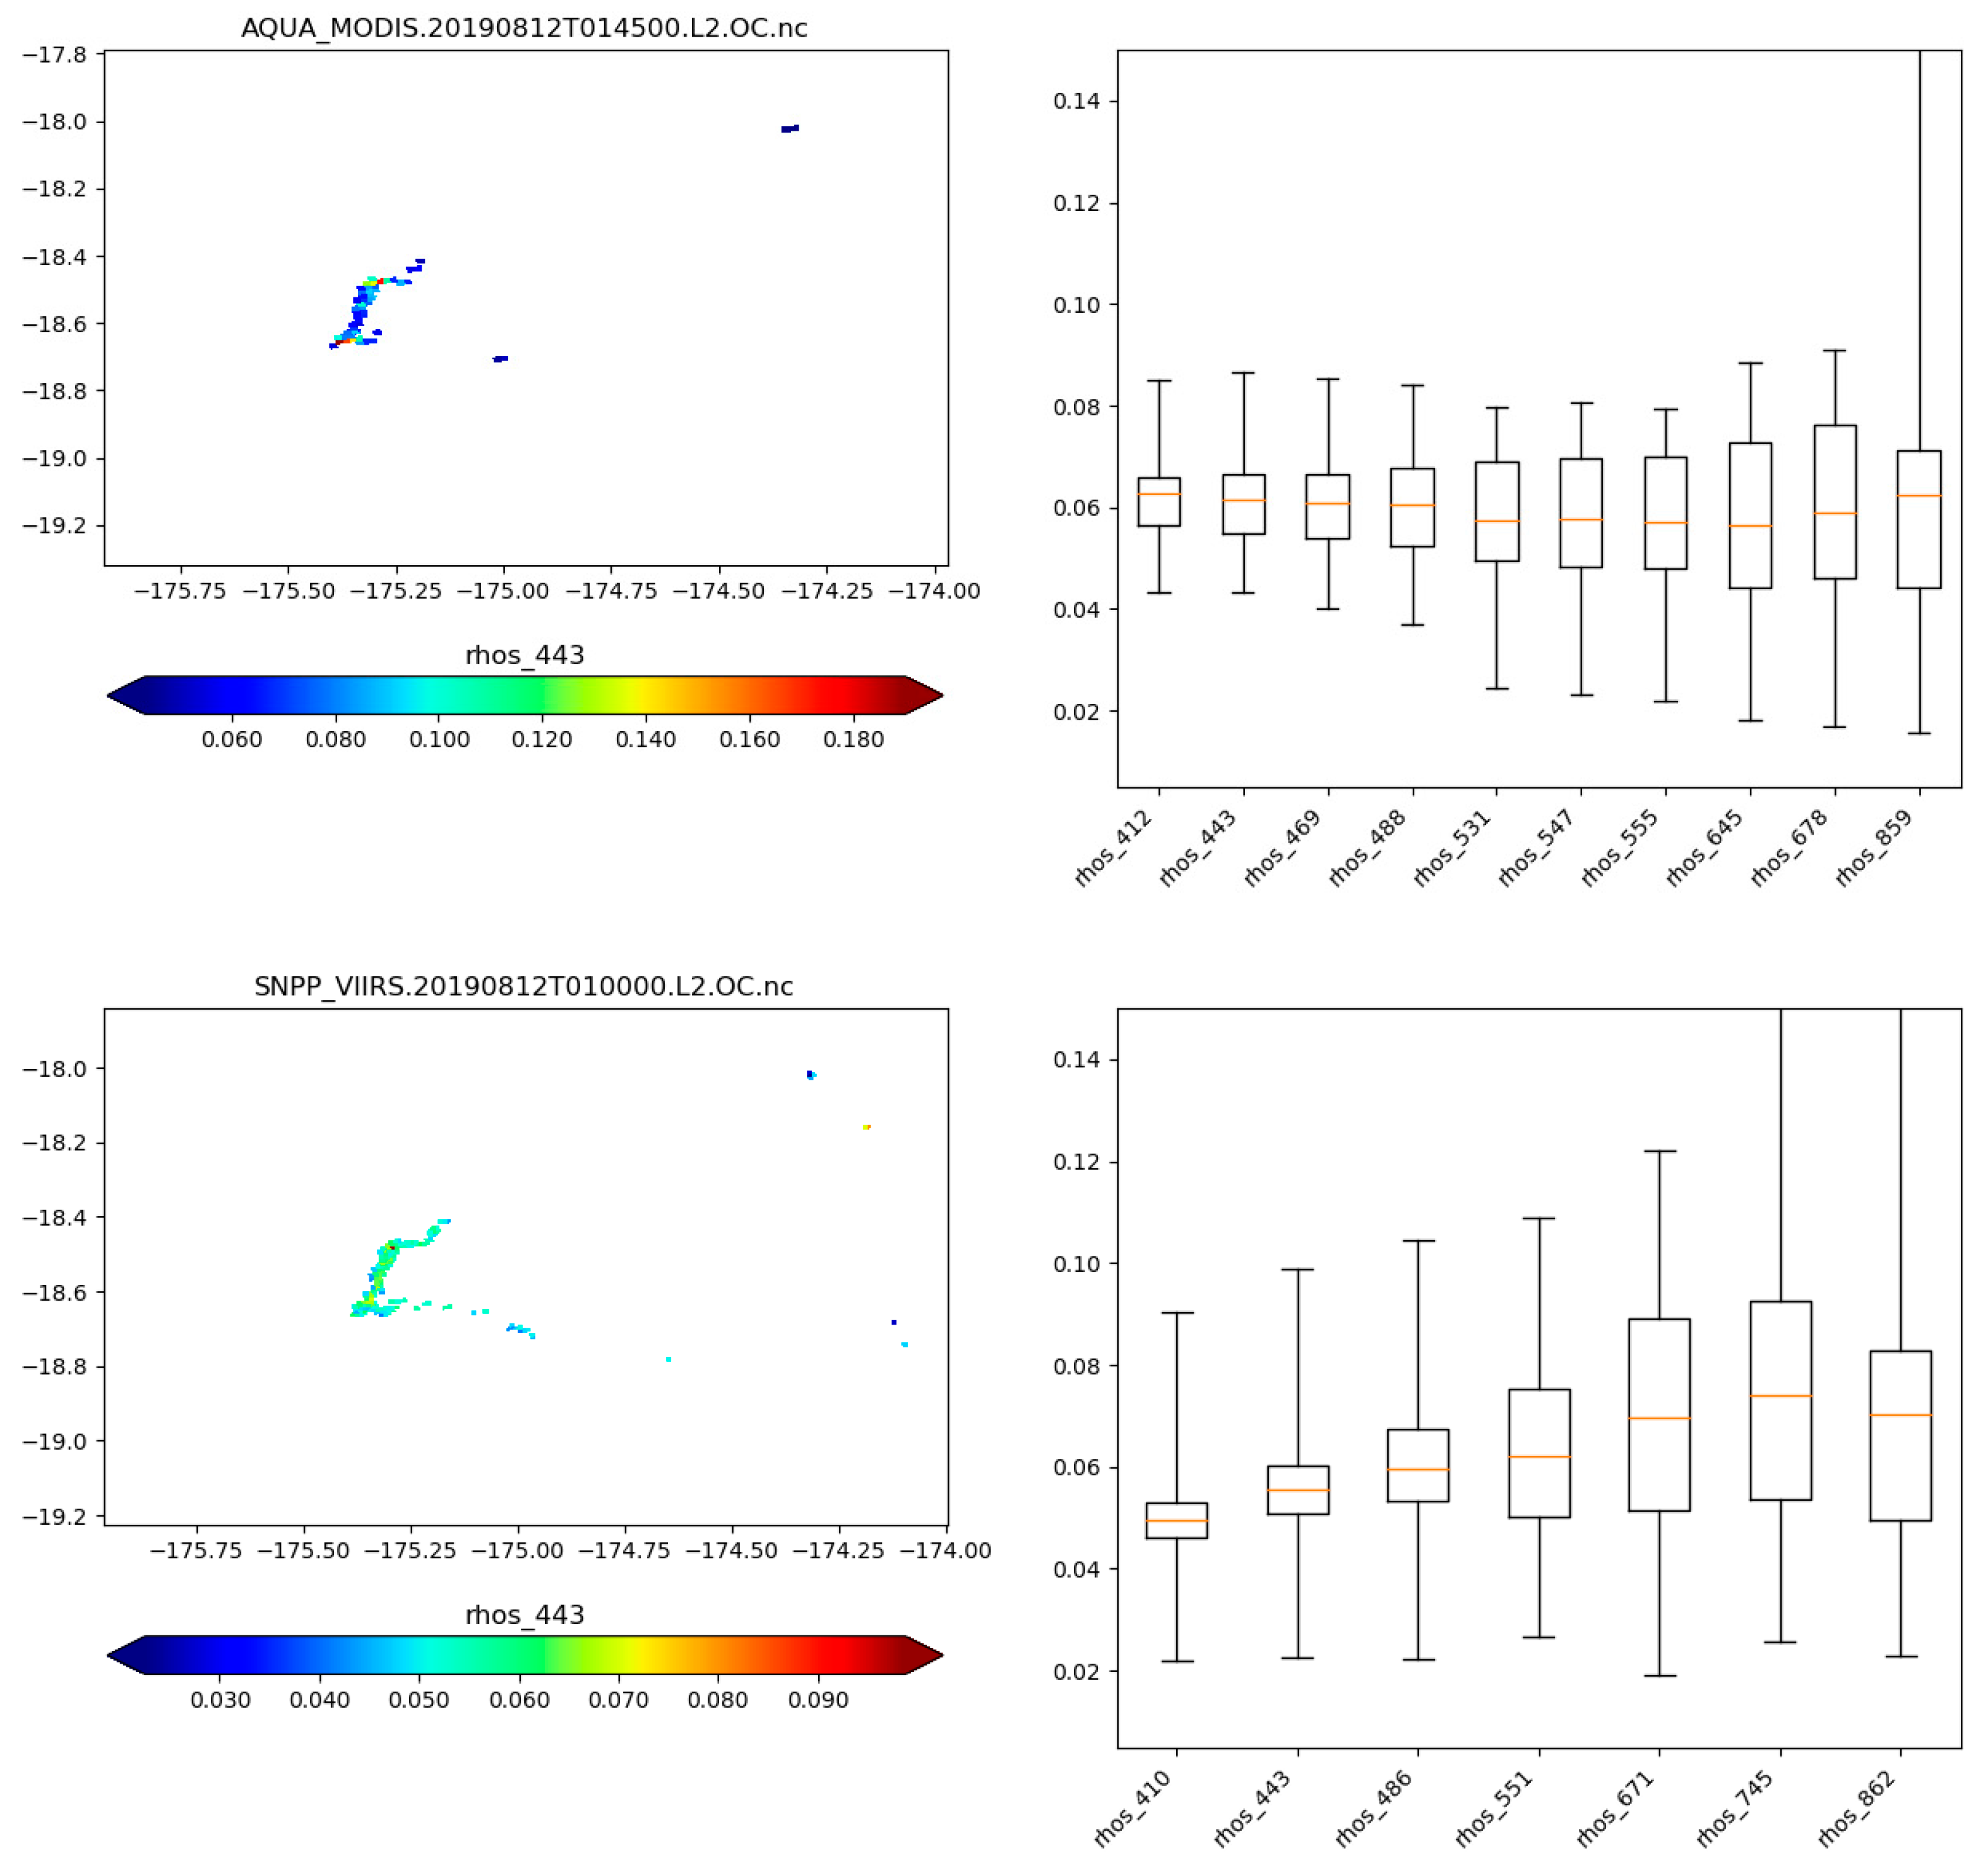
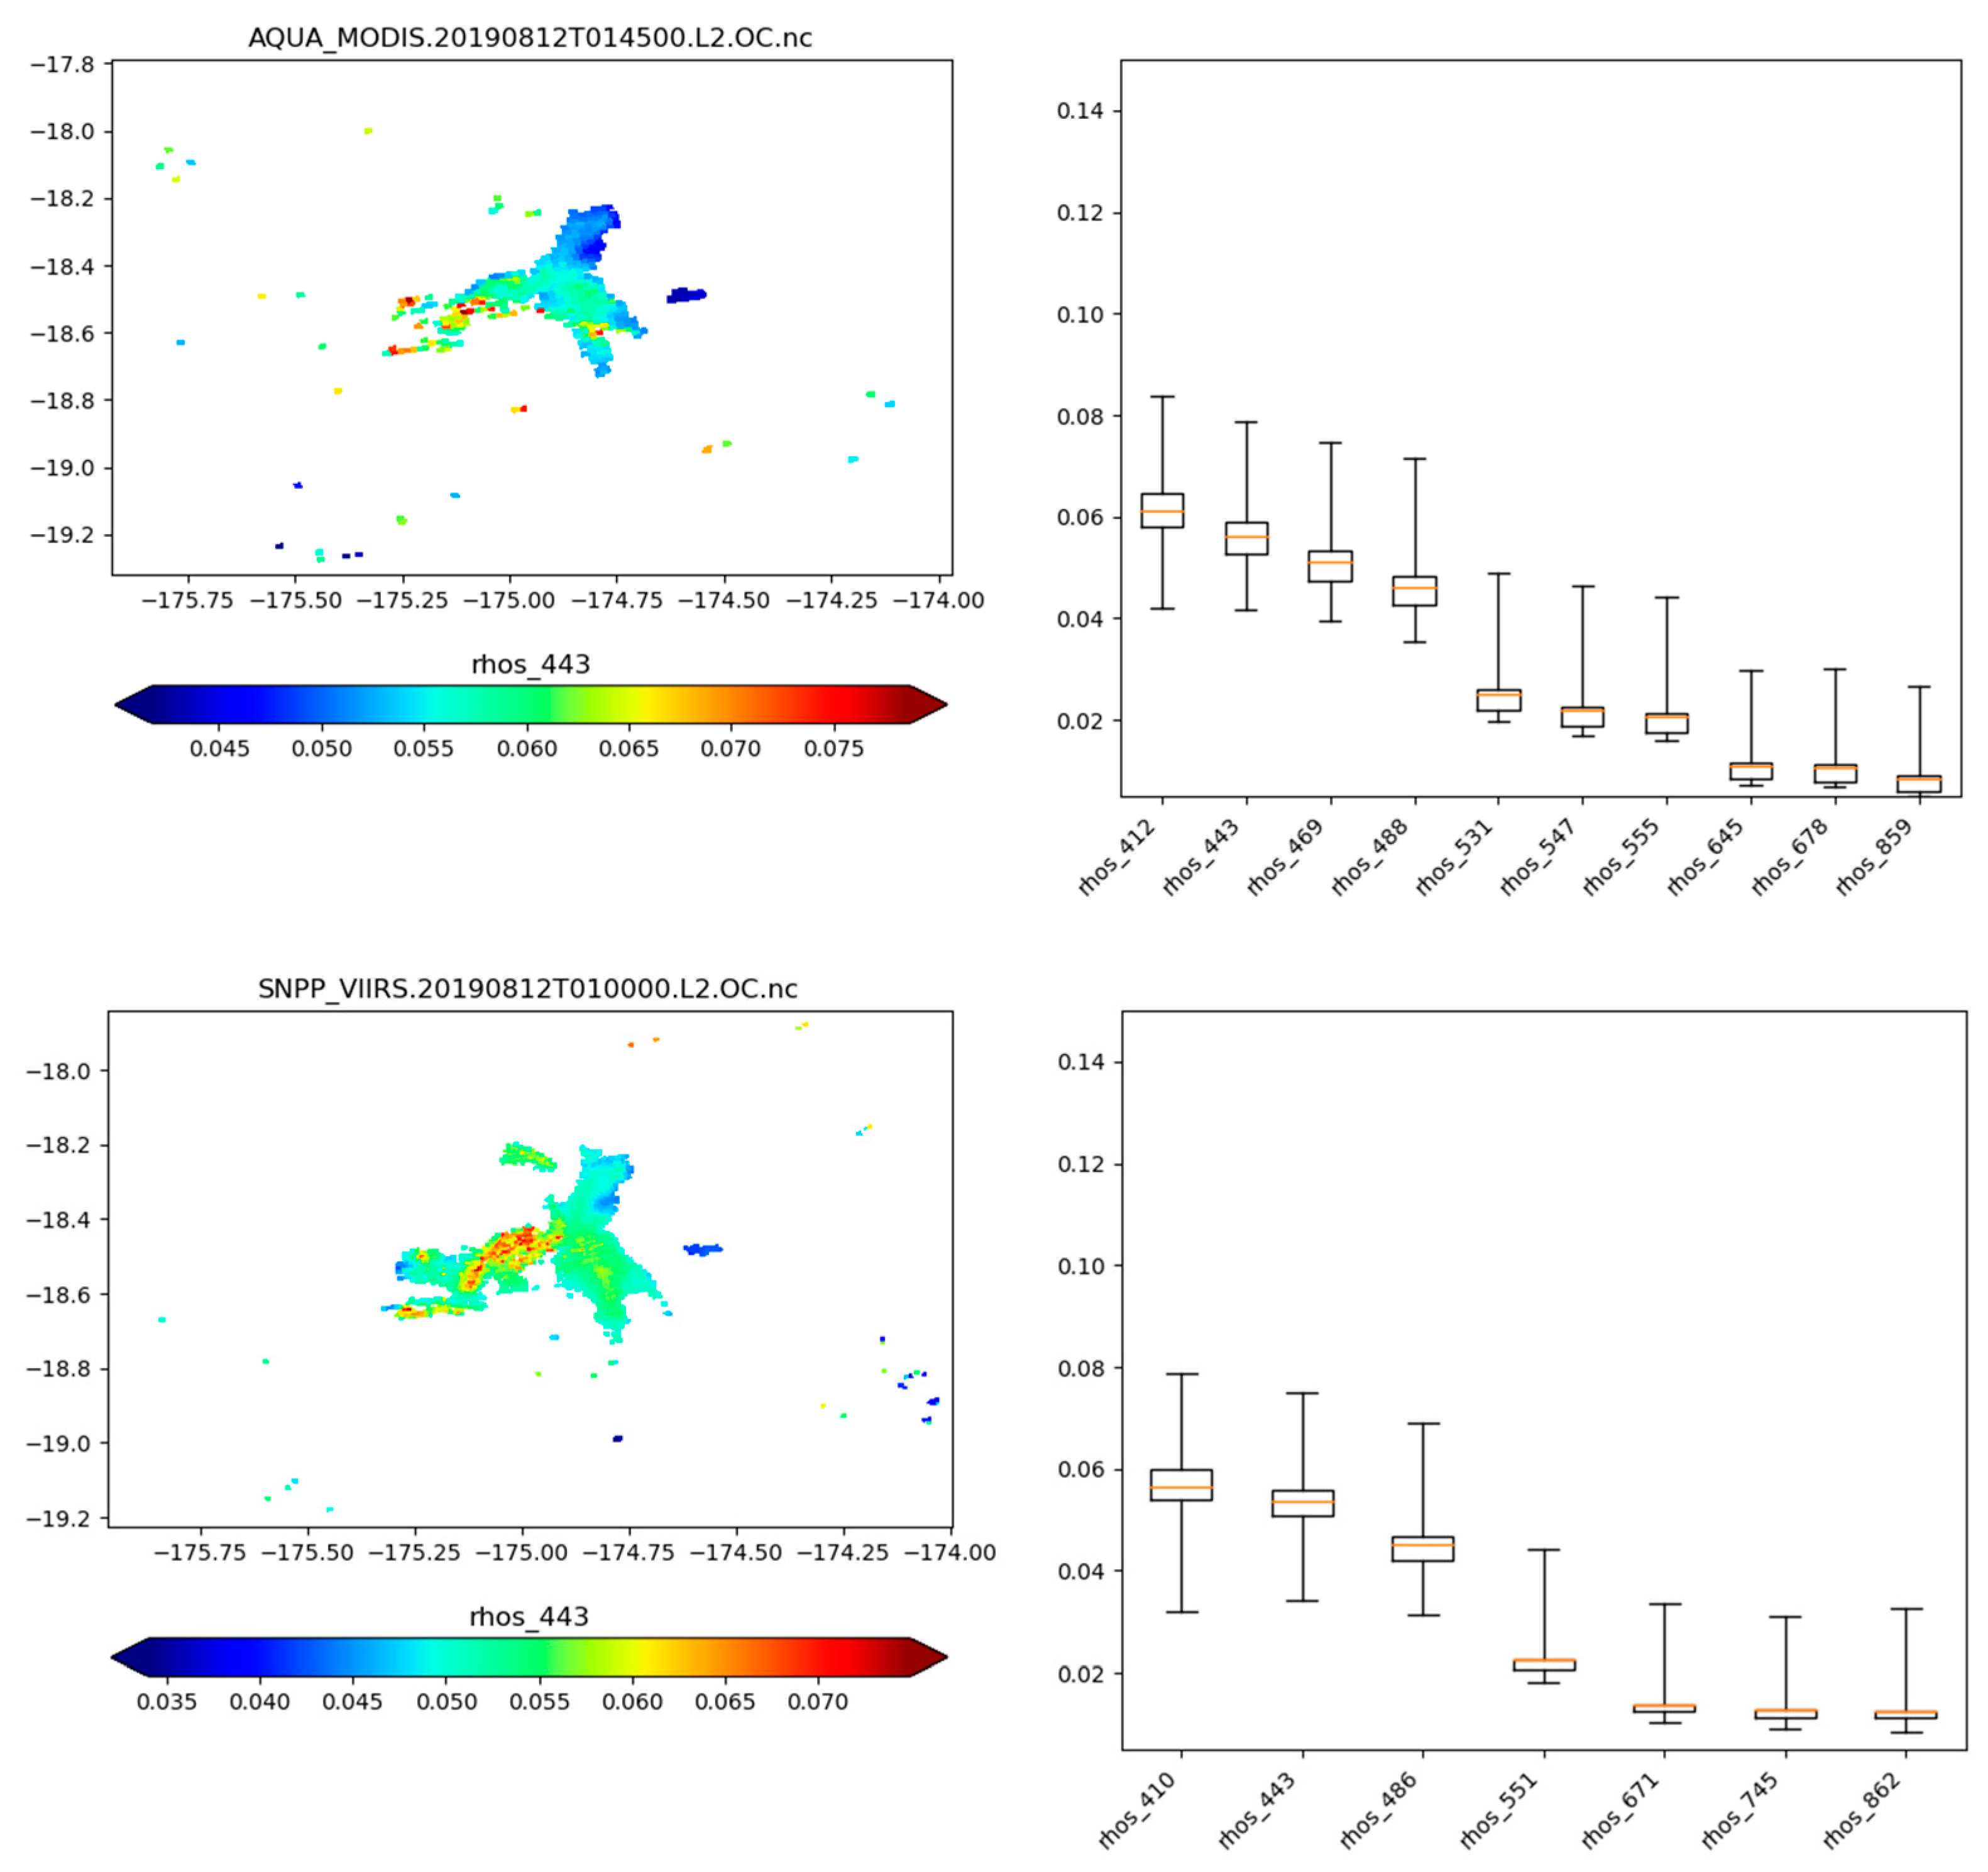
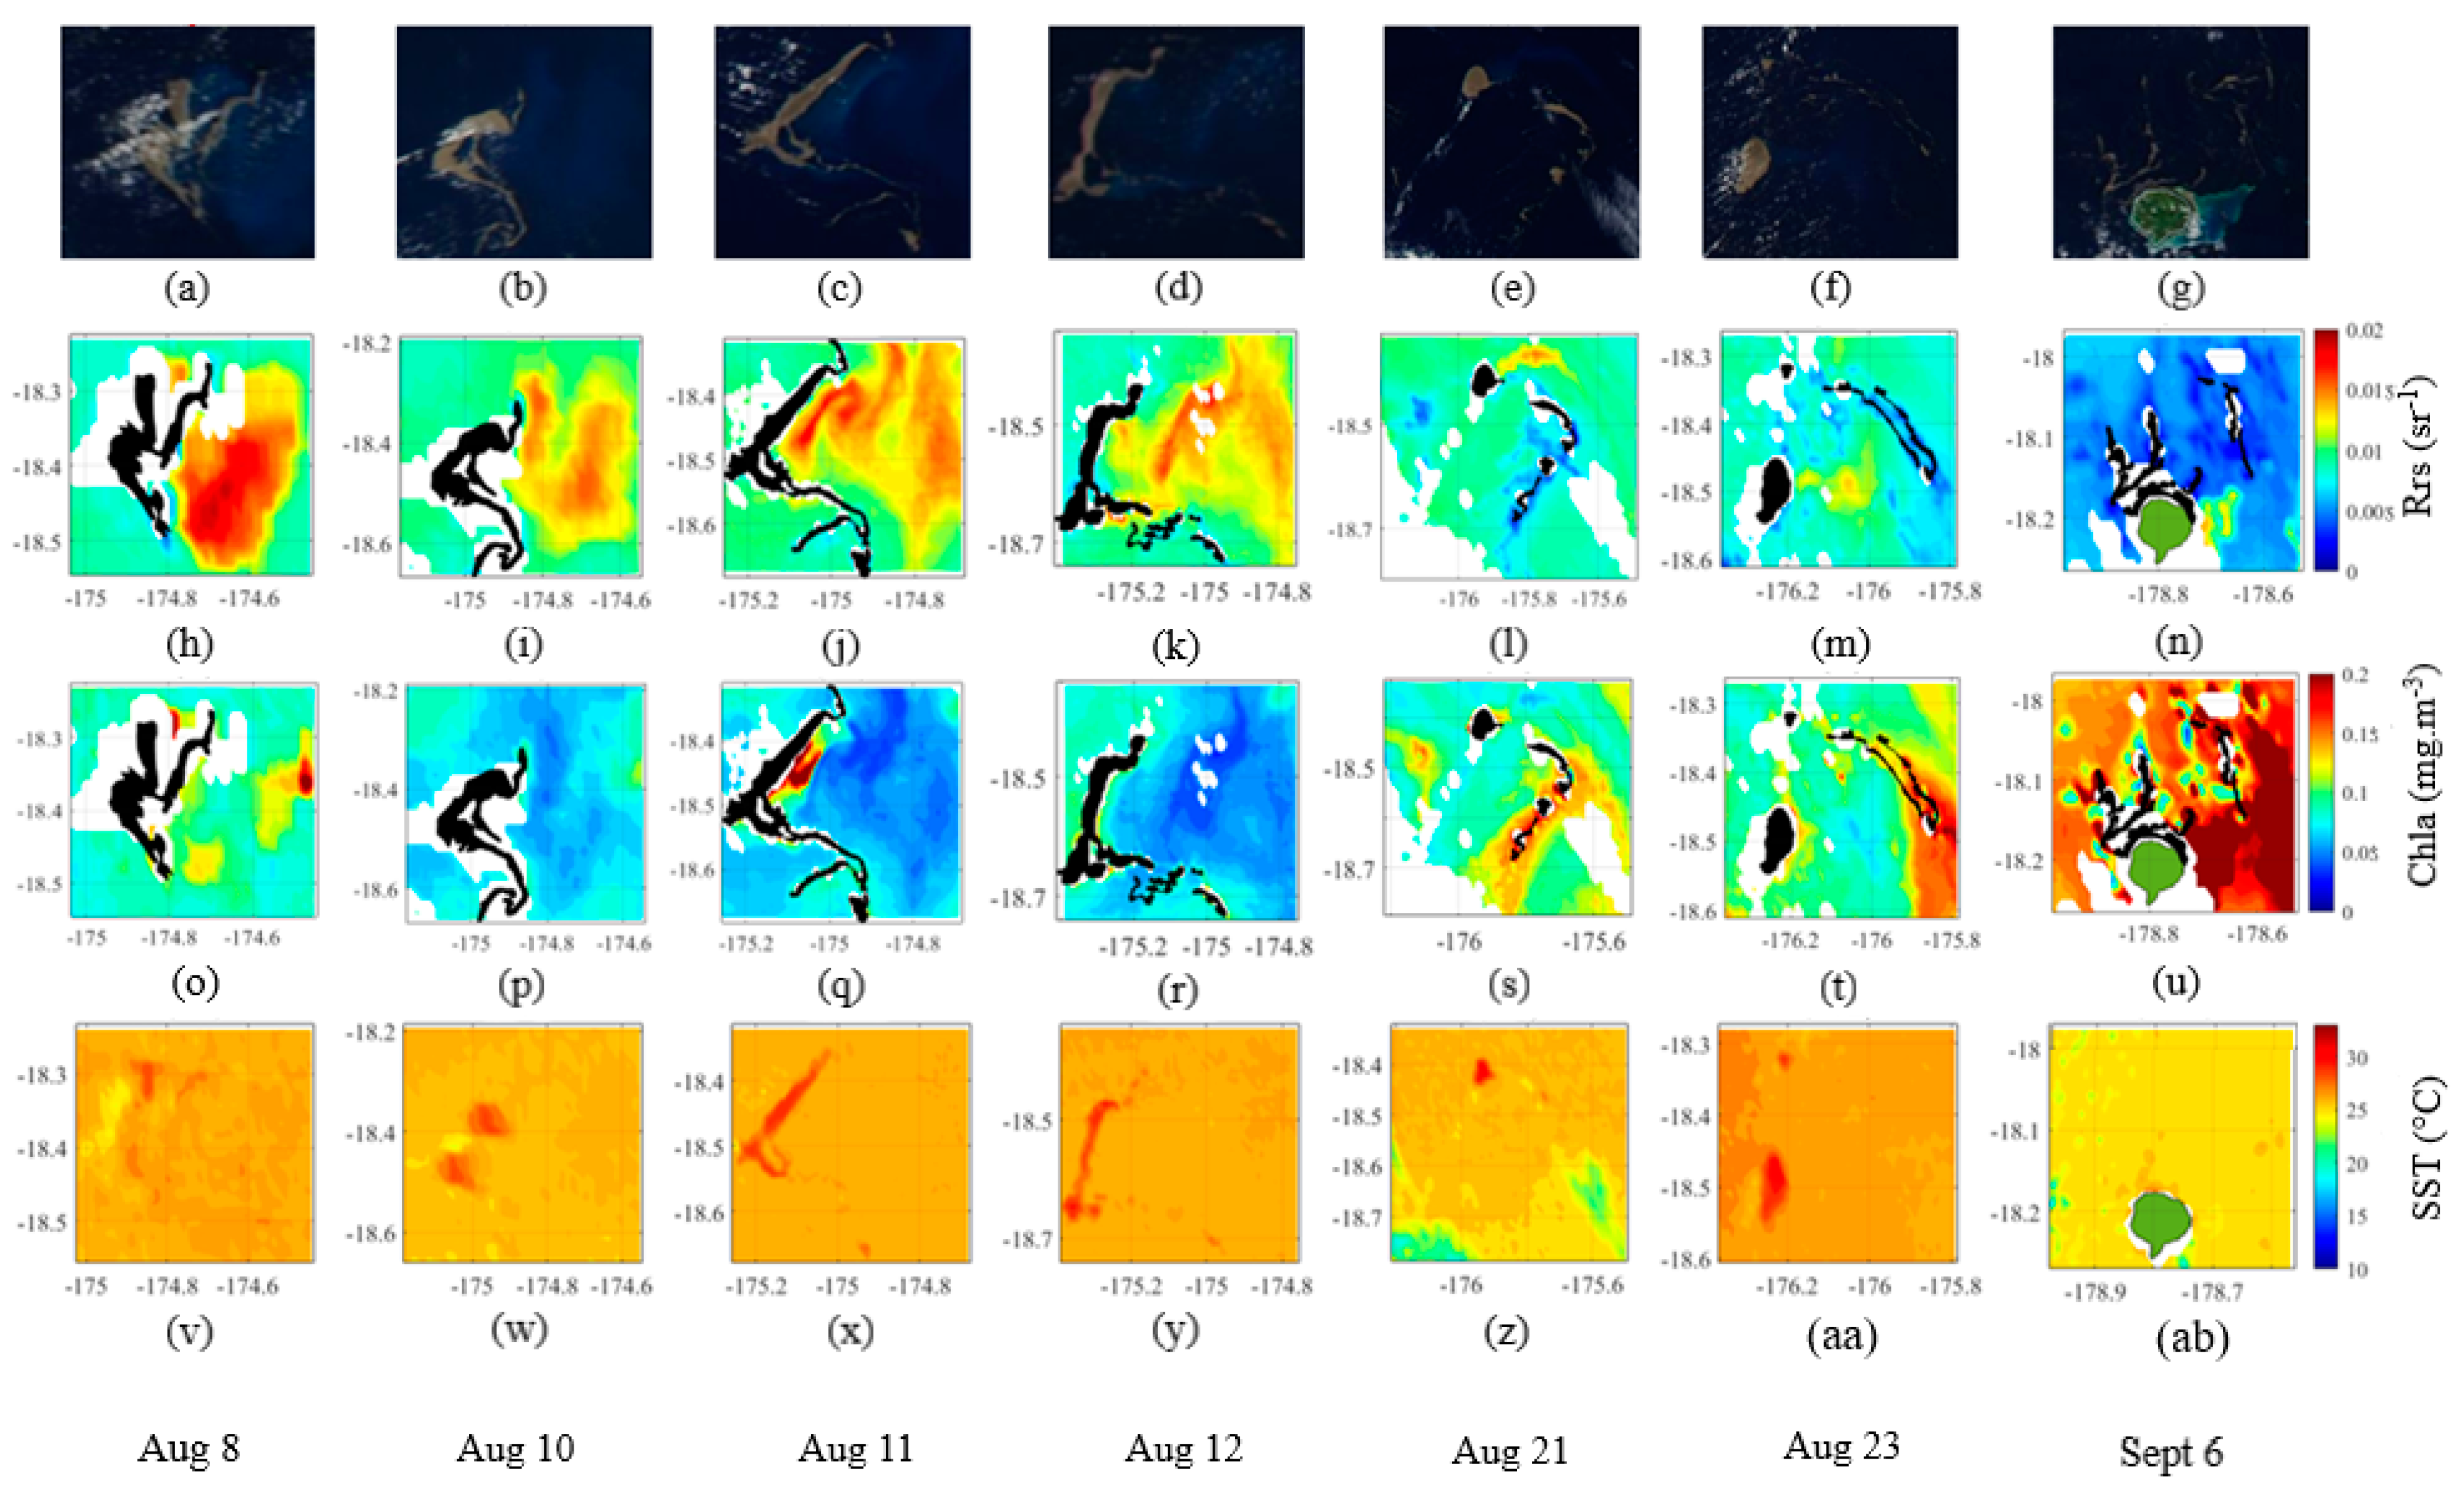
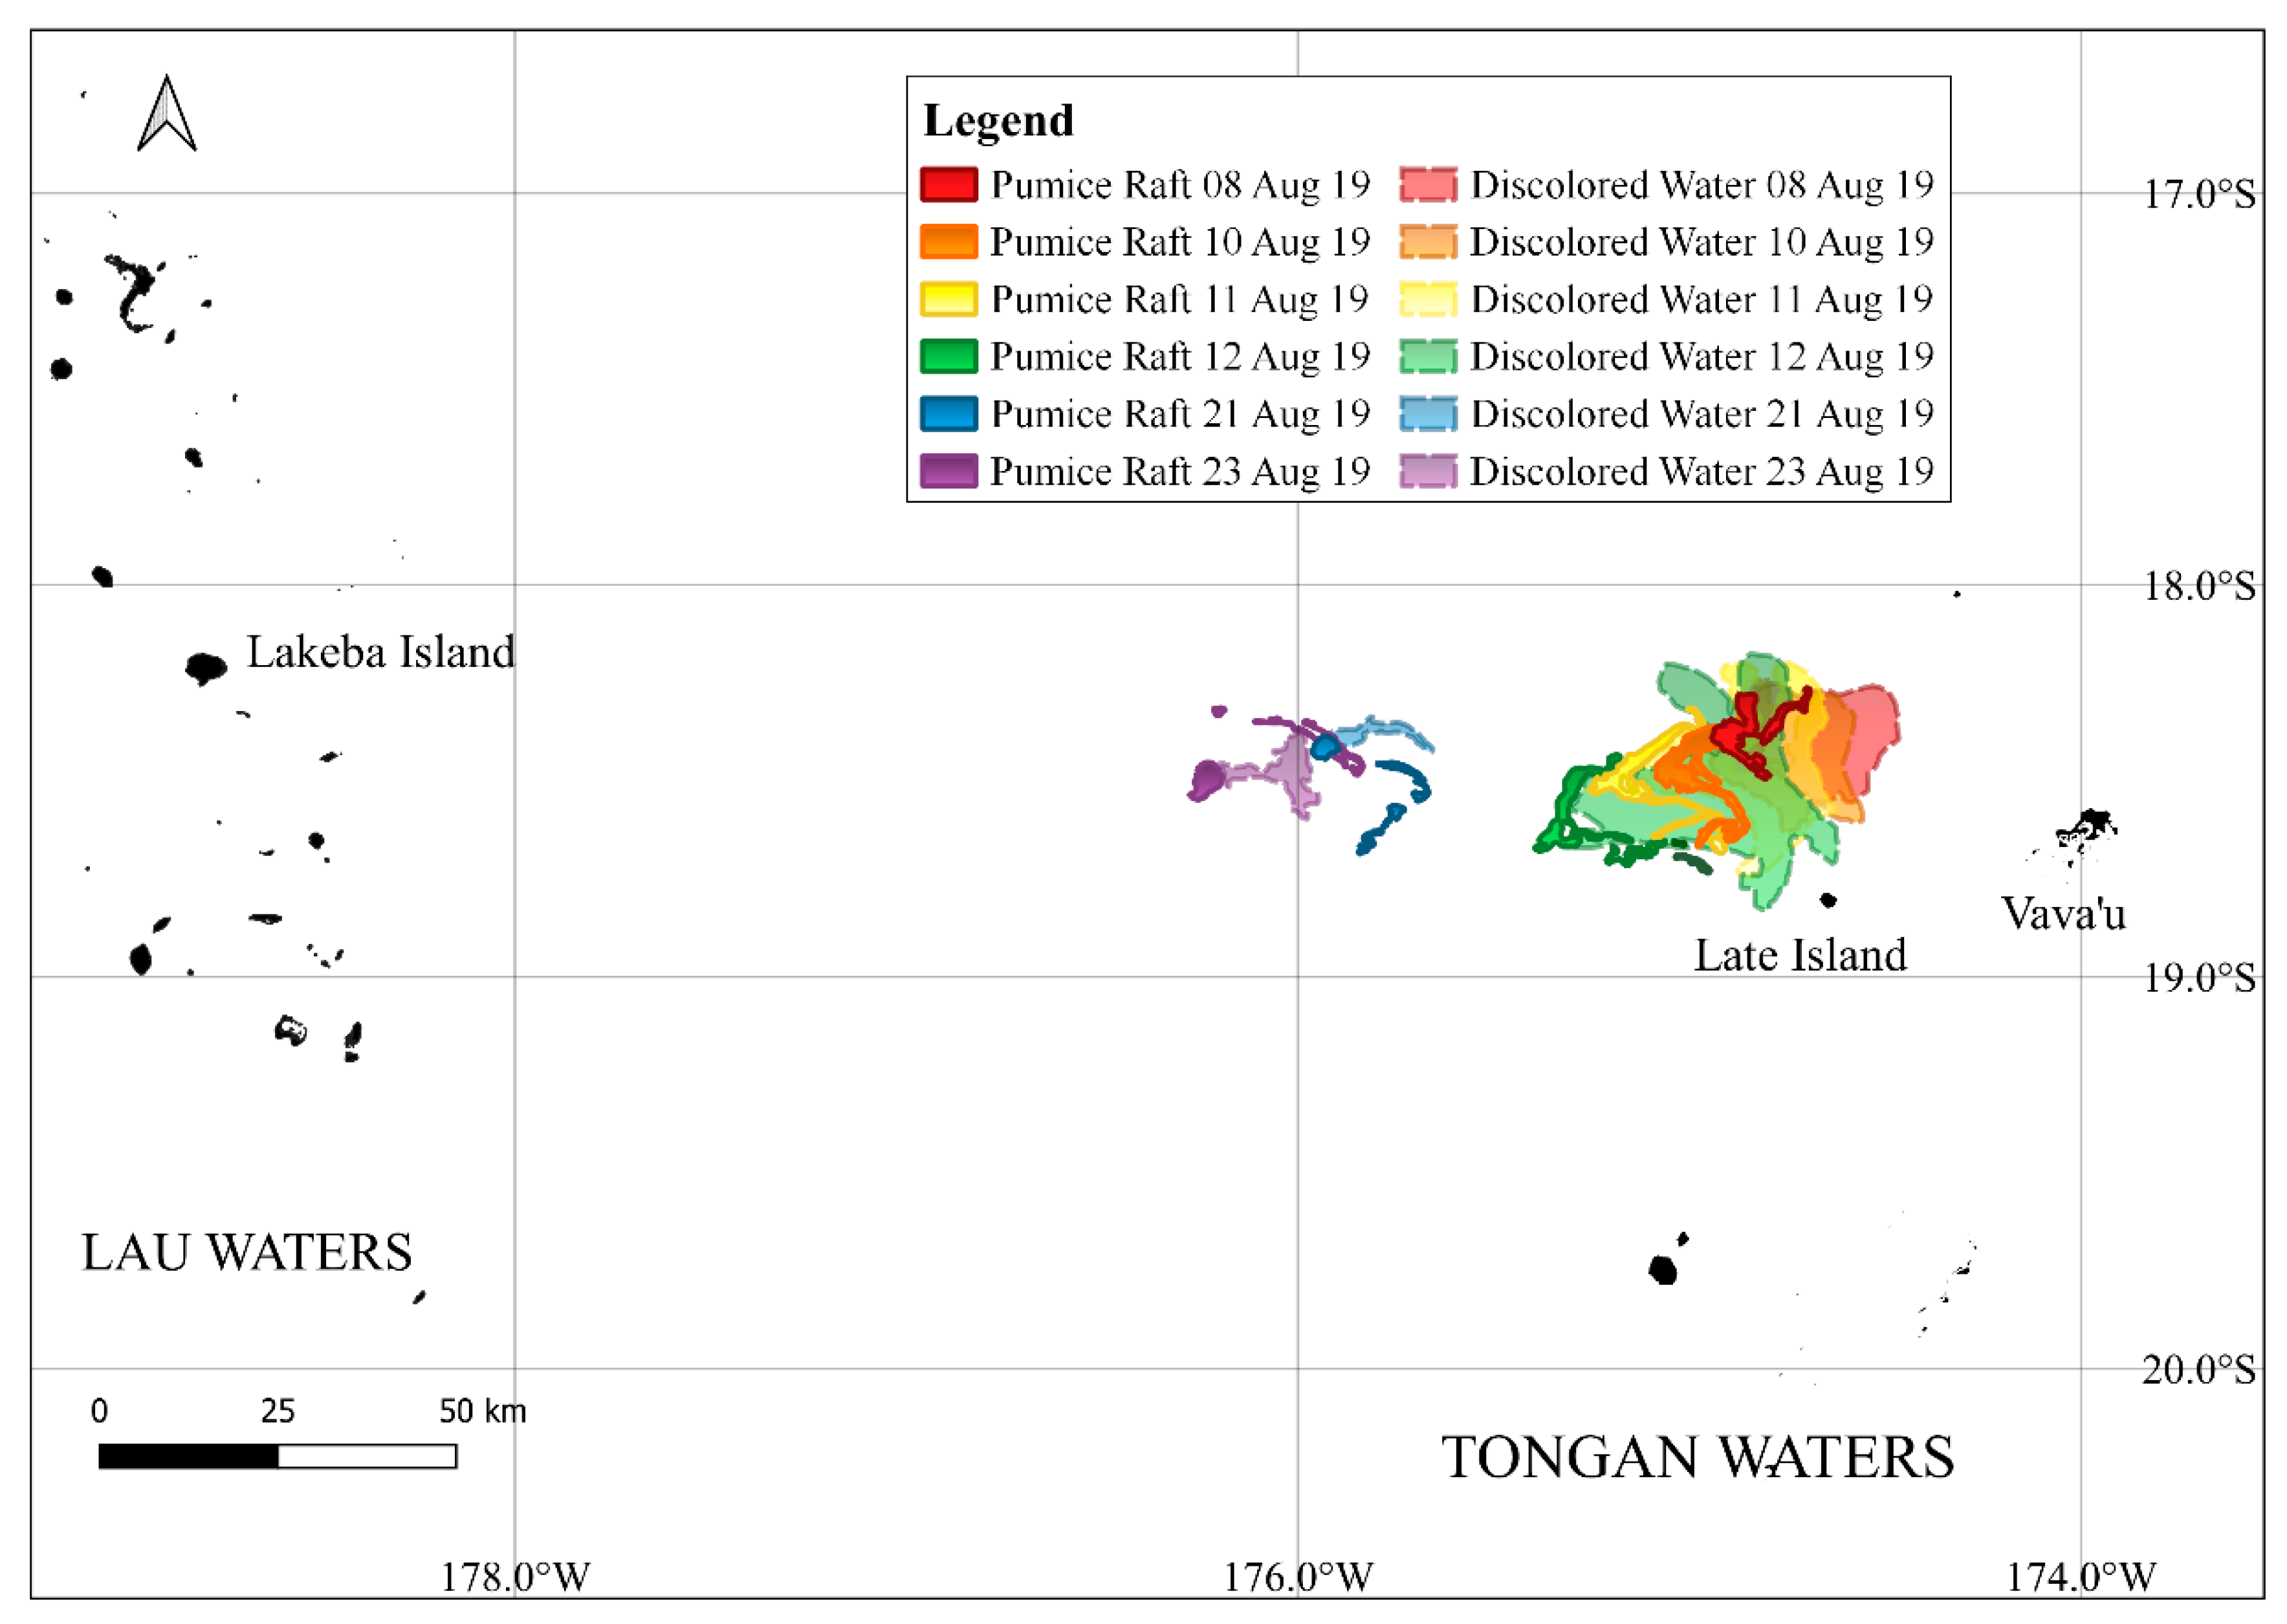
3.1. Temporal Evolution from MODIS and VIIRS

Figure 4 summarizes all different parameters retrieved from ocean color products by NASA, from L2 thresholds indicated in Table 2 (“consolidated pumice” from the SST mask, “fragmented pumice” from the two L2 QC flags, “discolored waters” from bbp_giop at 443 nm, and “mesotrophic/oligotrophic waters” from Chla). The SST mask and L2 QC flags created were used to build corresponding shapefiles and were delineated using Quantum Geographic Information System (QGIS) and superimposed on the MODIS and VIIRS image series (both in black, Figure 4).
Figure 4a–g (first row) shows the pumice rafts, from 8–23 August 2019, the large raft of pumice appearing at the sea surface off Late Island, drifting westward. The first phase of the underwater volcanic eruption off the Vava’u group of islands in Tonga began on 7 August 2019 (21:40 UTC). Reports of the pumice raft approximate its area to extend over 150 km2 [25]. The eruption resulted in the creation of a rock rubble slick known to be pumice floating on the ocean’s surface. Pumices were visible from the 8 to 12 August in Tongan Waters (18°–19° S and 174.8°–176° W), ~40 km north-north-west of Late Island at the earliest date detected, then drifting approximately 25 to 70 km northwest of Late from 10 to 12 August as already described by [2] and [10]. Two yacht crews on 9 August 2019 traveling between Tonga and Fiji in the Southwest Pacific were the first to discover and sail through a newly formed pumice raft created from an underwater eruption [2]. As anticipated, the pumice raft was at its largest on the days immediately following the eruption, i.e., 8 to 12 August 2019. Four days later, the rafts appeared around 95 km west of Late, and were 164 km northwest by 23 August. On 6 September the pumices, located in the Lau Group of Fiji (18–18.3°S and 178.6–179°W), were found drifting west toward the coral shoals north of Lakeba island in Lau. By 21 and 23 August, the oval-shaped consolidated raft depleted in size, inevitably disintegrating into fragmented streams of pumice, clearly seen in early September 2019 [2,10]. This was further described through in situ observations by locals, approximately 30 days post-eruption, and was reported by Fijian national media, the Fiji Sun newspaper [26]. About 180 km further northwest, the pumice raft appeared to be scattered across the main islands of Fiji by 27 September. Figure 4h–n (second row) shows the evolution of the discolored water plume. With an approximate area of 990 km2 and a diameter of 43 km on 8 August, discolored waters, depicted by relatively high Rrs at 443 nm (high backscattering coefficient at 443 nm), gradually disappeared from satellite view over the following days and were completely gone by the end of August. The high Rrs at 443 nm, linked to the pumice raft in the initial days post-underwater eruption, was evident in August. Discolored waters were remnant on 21 and 23 August in the vicinity of the rafts. Figure 4o–u (third row) shows that generally, the studied region between Tonga and Fiji experienced Chla values around 0.1 mg·m−3. Pumice rafts crossed low chlorophyll areas from 8 to 11 August, then crossed chlorophyll-rich waters on 21 and 23 August. On 6 September, the high chlorophyll-a levels were caused by the bottom of the inshore coastal zones off Lakeba Island and off other neighboring islands as bathymetry in these shallow areas indicates depths under 100 m. The areas with high Chla levels (i.e., >0.5 mg·m−3) were seen later along the Bligh Waters at the northern Fijian archipelago toward the western part of Fiji. Mesotrophic waters were present without any connection with the raft. There was an exceptionally rich patch of Chla interpreted by the NASA OC3 algorithm on 11 August, closely related to the raft and nearby discolored waters. This high Chla patch was an outlier that disappeared on 12 August and was not seen until the end of the drift on 27 September. This was most probably due to an overcorrection of aerosol effects, representing a small fraction of the total pixels in the scenes observed. With this exception on 11 August, waters surrounding the raft show no direct influence on chlorophyll levels from immediately after the eruption to two months post-eruption. Sea surface temperatures in both VIIRS and MODIS showed that the consolidated raft, in particular, displayed higher temperature readings than that of the surrounding ocean (Figure 4v–ab). Clouds, however, were detected at lower-than-normal ocean temperatures (~14–24.5 °C for MODIS), while fragmented pumice and discolored waters could not be easily distinguished from normal water temperature readings.
Rafts and discolored waters drifted west from 8 August until 23 August as shown in Figure 5. Pumices were visible in Tongan waters (18°–19°S and 174.8°–176°W), i.e., ~40 km north-northwest (NNW) of Late Island at the earliest date of detection. Discolored waters could be visibly seen in true-color imagery, trailing the main raft and appearing larger at first, then decreasing in size by 21 and 23 August. It is extremely interesting to see that even on 23 August, they were still accompanied by deep rafts. These deep rafts are not visible by fishermen but may have a greater impact than expected, i.e., by affecting the light available and fishery conditions.
Percentages of pixels of each class over an extracted area of Figure 5 (174.0°–176.5° W longitude, 18.0°–19.0° S latitude) for all dates around the surface pumice are displayed in a histogram (Figure 6) representing the 4 classes defined in Table 2 for each date. The “discolored waters” class was seen persistently for at least 15 days. The highest percentages of pixels in this class were observed in the first four days and were between 2.7–6.6% (Figure 6). Oligotrophic waters dominated mainly from 10–12 August with approximately 49–66% of pixels in the surrounding region of the raft. These percentages then decreased to 41% by 23 August. Low percentages of mesotrophic waters (Chla > 0.1 mg·m−3) were evident in the first few days (8–21 August), i.e., 9–25% of pixels, and then increased to over 45% by 23 August.

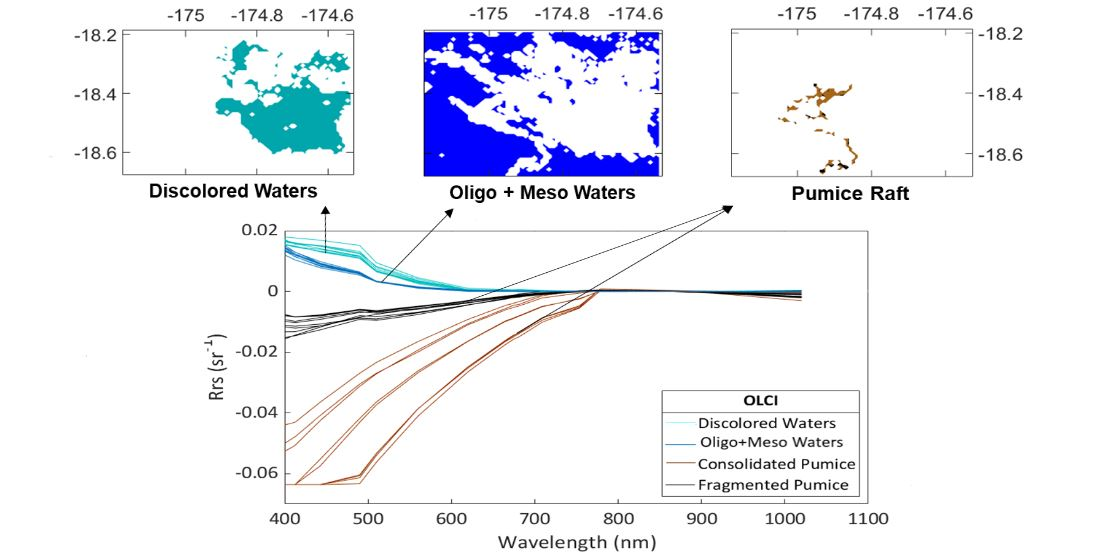
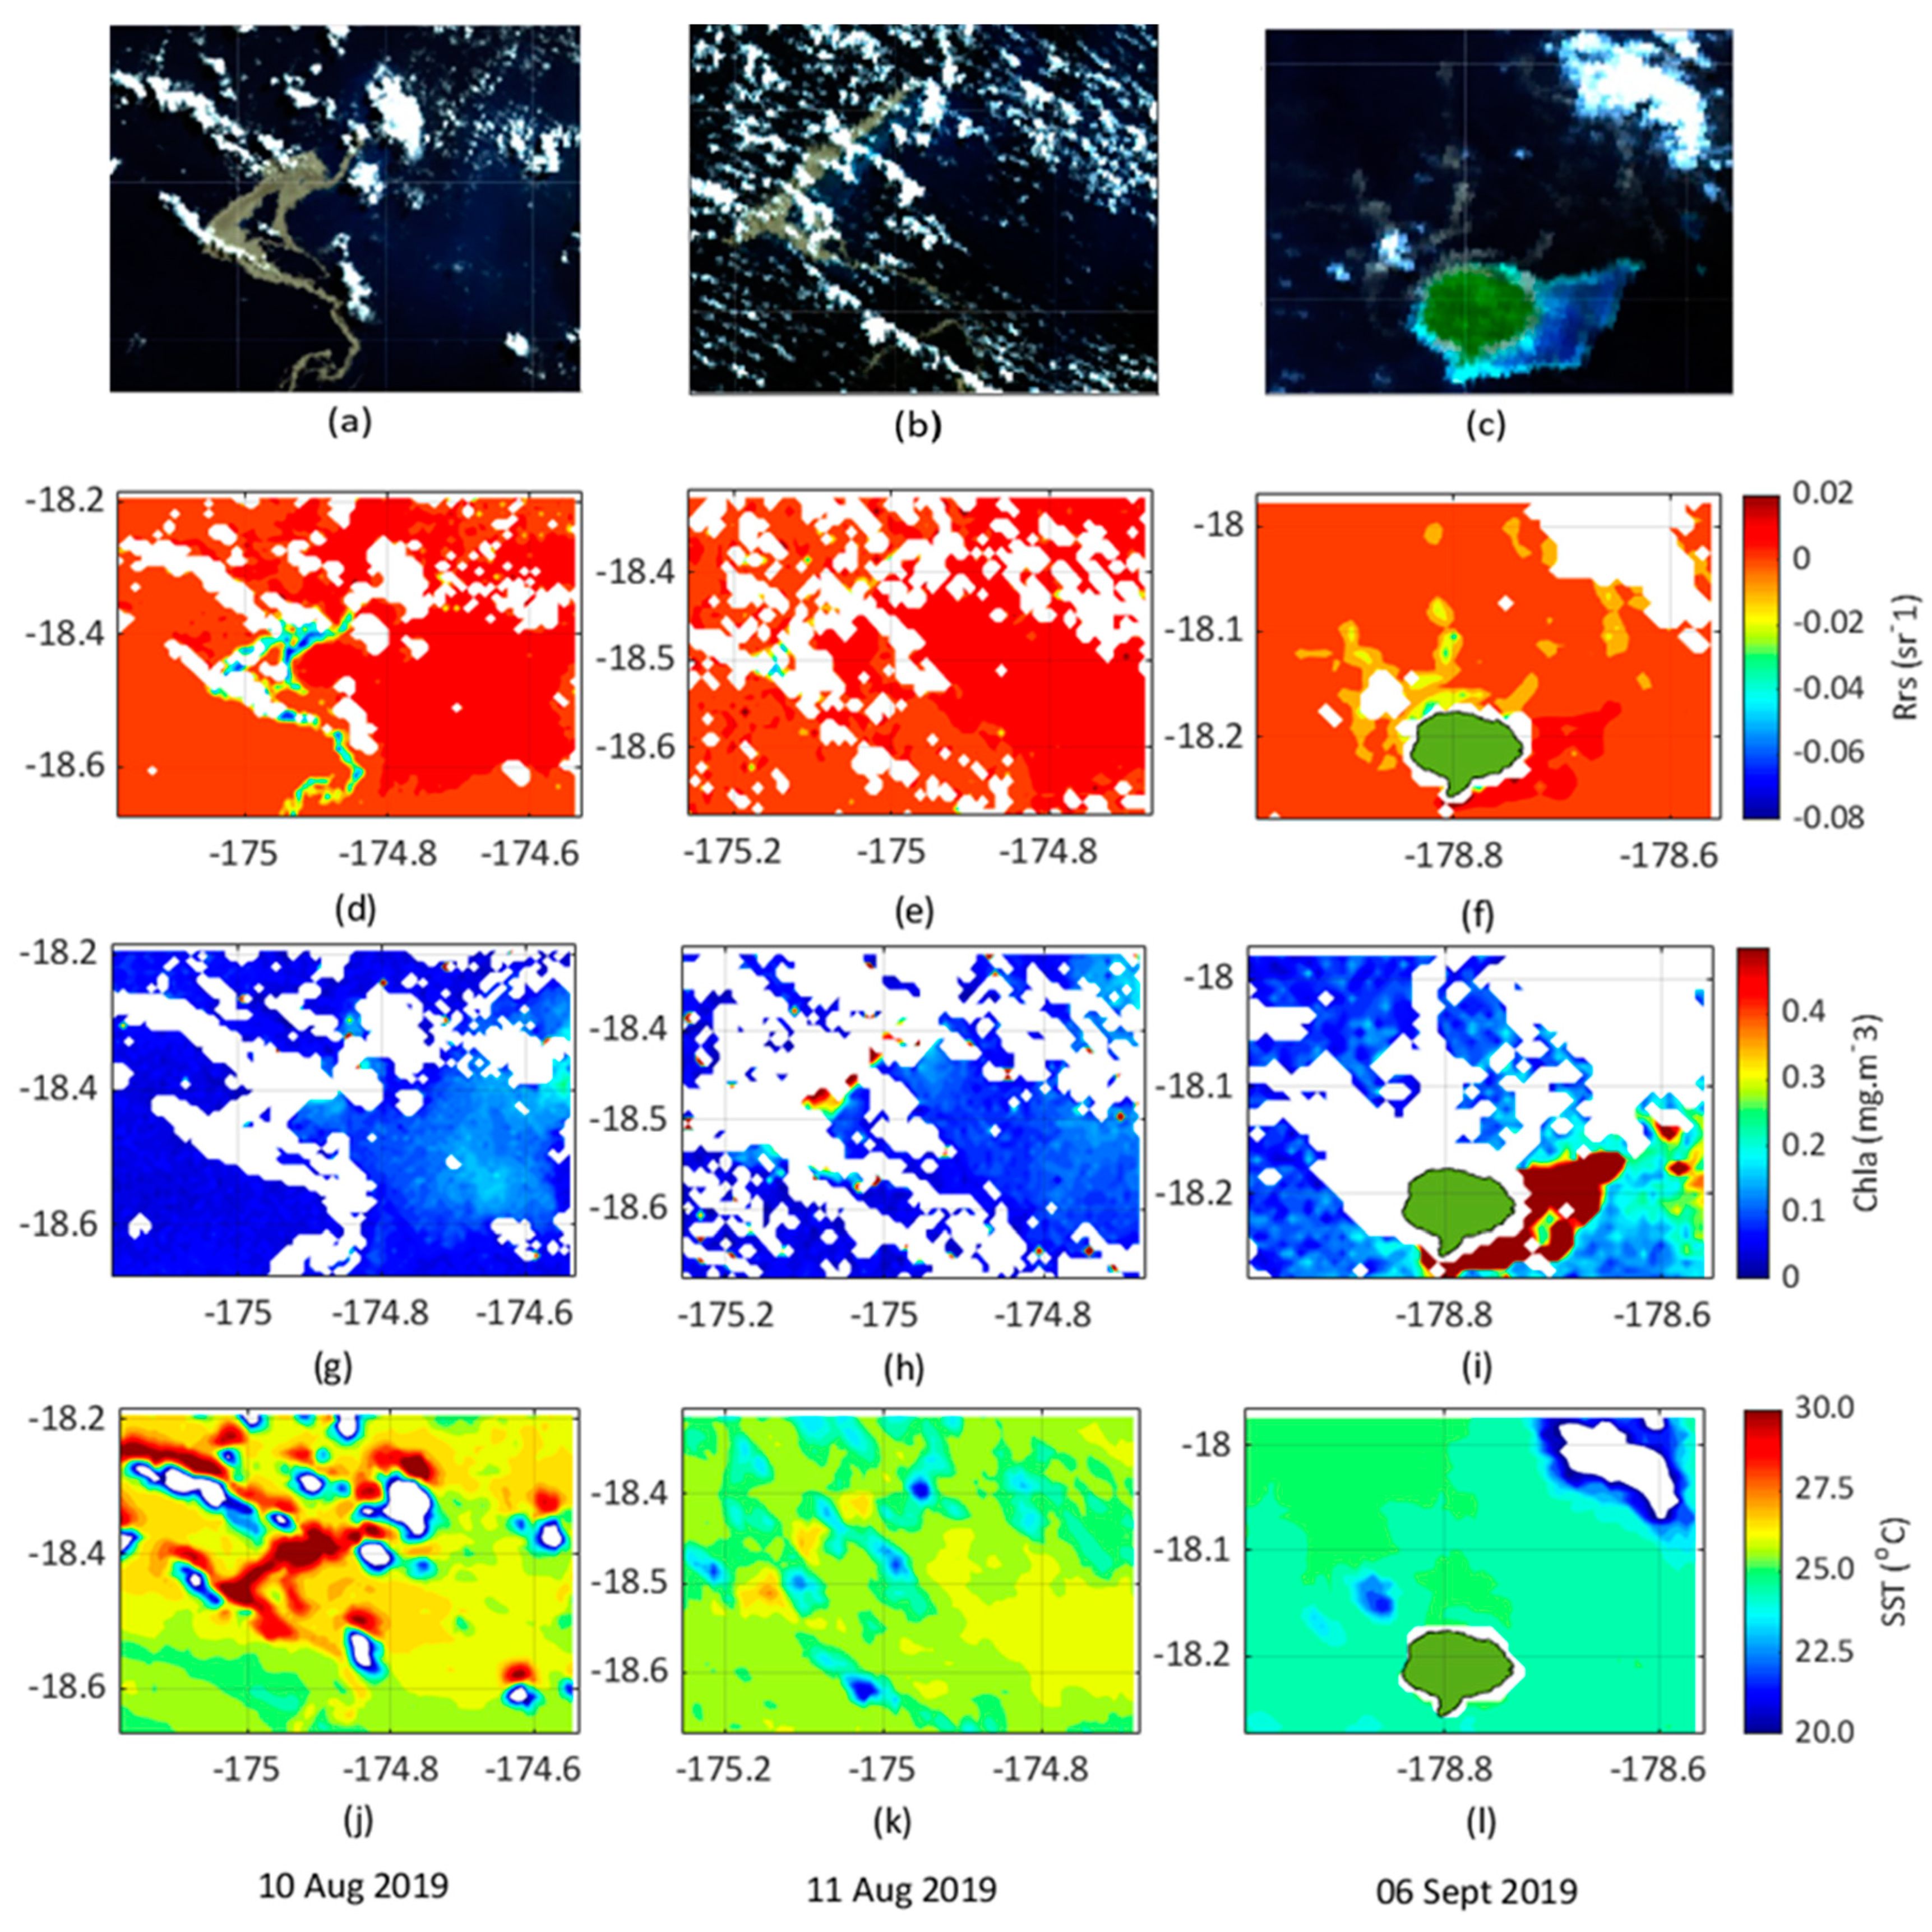
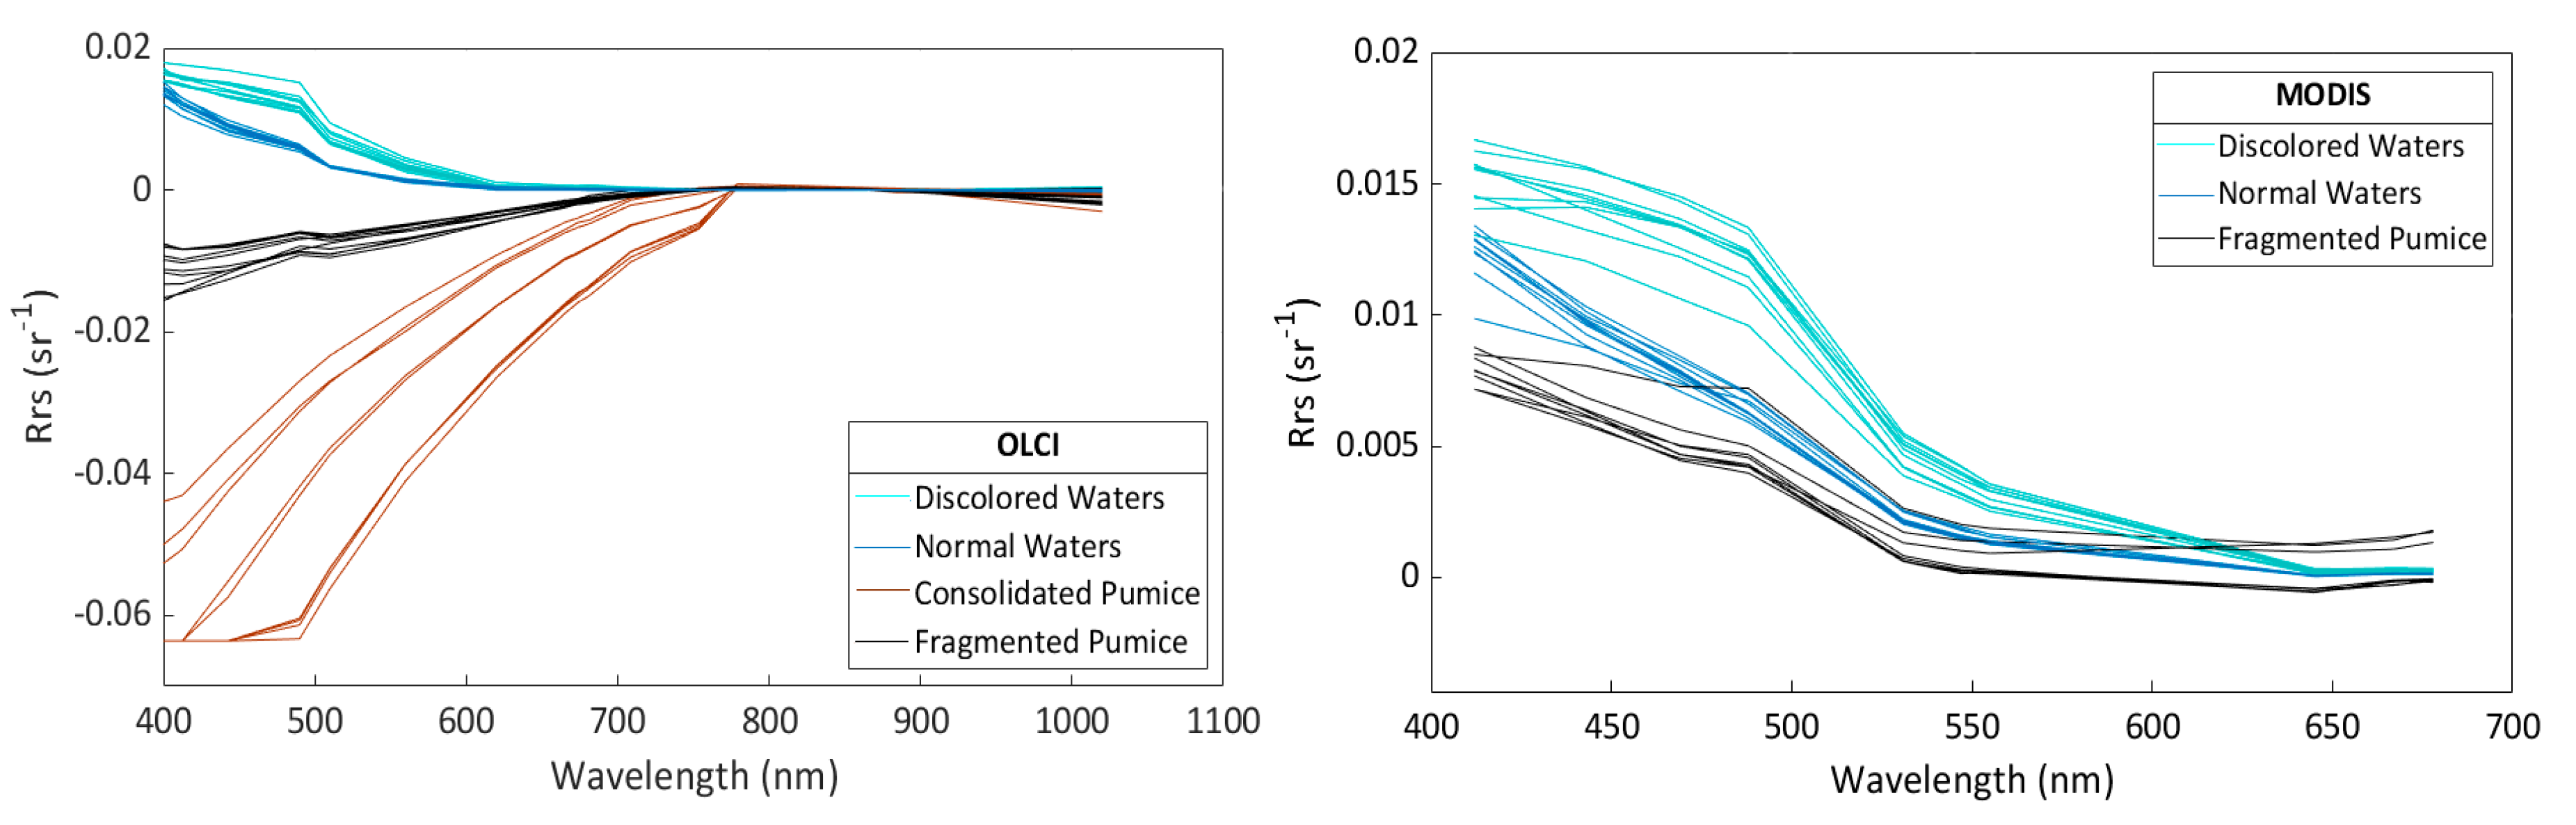
3.2. Temporal Evolution from OLCI and SLSTR, and OLCI Rrs Spectra

In Sentinel-3 OLCI L2 imagery, the consolidated pumice on 10–11 August exhibited negative values as well as parts of the fragmented pumice, while some pumice showed very low positive values (Figure 7). On 6 September, fragmented pumice streams off Lakeba Island were detectable in the blue Rrs (Figure 7f) and were differentiated from the surrounding ocean and shoals by their negative values. In Figure 7g–i, the pumice rafts appeared to be mixed in with cloud, reading as NaN. Shoals adjacent to Lakeba were well discriminated in the Chla channel displaying higher than normal values (Figure 7i). In observing SLSTR SST L2 data (Figure 7j–l), consolidated pumice exhibited higher than surrounding water sea surface temperatures.
As shown in Figure 8 (left), the Rrs values of discolored waters were higher in the visible range, notably at the blue and green/yellow wavelengths, compared to normal waters. However, the near-infrared channels showed far less distinction in the OLCI imagery. Surface pumice presented negative values in the visible region after atmospheric correction, while as indicated earlier, these pixels associated with pumice appeared as NaN in MODIS and VIIRS (Figure 8 right).

4. Discussion

This study demonstrates the influence of a sudden oceanic underwater volcanic eruption on SST and optical signatures around pumice rafts. Pumice rafts have been extensively described in the recent scientific literature such as [2,6], however, in this instance, other spectral signatures were examined which could constitute a more powerful description of ocean color modifications after eruptions. The reliance on MODIS, VIIRS, OLCI, and SLSTR data was critical in making observations for detecting pumice rafts, chlorophyll-a concentration, and large plumes of discolored waters, resulting from submerged pumice or minerals associated with the eruption. Though pixels were at 1 km resolution and were coarse particularly when rafts fragmented, detection by all sensors was successful in ascertaining these parameters.
Readings in all sensors showed SST increase within the consolidated pumice region, and higher than the surrounding elements. The thermal emissivity of pumice compared to seawater (see [26] for igneous rocks) could explain why pumice rafts appear to be higher in temperature using remote sensing products, indicating that SST is a useful tool to detect pumice but not to attach temperature values to pumice. On the other hand, the SST increase may suggest a relation to heat specificity of water, higher than that of solid matter (in this case, the compact thick raft), resulting in the more rapid heating up of pumice, unable to regulate its temperature as effectively as the ocean. This mechanism may partly explain this temperature rise; however, higher values could also be due to natural thermal emissivity of pumice, as mentioned above. Therefore, one cannot conclude with certainty that the raft itself exhibited higher temperature than adjacent waters.
We did not observe any strong Chla increase associated with the pumice fragmentation and drift in the overall subregions studied except directly adjacent to the consolidated pumice (a probable artifact of OC3 products). The enrichment in chlorophyll in the region occurred only during a second phase, a month later [9]. Ref. [1] stated that the pumice clasts collected from the 2011 eruption were acidic while [10] described the 2019 ones as rhyolitic. Such silicium would be favorable to pico- and eukaryotic algae such as diatoms, which are a variable component of phytoplankton south of Fiji at the surface [27]. Indeed, silicium in this pumice-dominated environment may not be in a form readily available for phytoplankton. A general enrichment of chlorophyll was already seen on 30 July with a maximum of Chla > 0.12 mg·m−3 all over the area without any relation to the eruption. These enrichments that are evidenced at a larger scale on the ocean color imagery are, rather, linked to large meanders corresponding to the northern border of the subtropical front, which is at its northernmost latitude in austral winter (at 18°S), and/or to algal growth triggered by submarine iron sources in the Tonga trench [28]. In general, cyanobacteria is the major group in tropical islands [29]; and they need a combination of high temperature, phosphate, and iron to grow [30]. They are not triggered by the pumice rafts and aerial eruption during this period (August–austral winter). This may explain why pumice rafts are not accompanied by chlorophyll-rich waters.
Another explanation is the speed of the drift of pumice as we estimated the drift at 2.5 m/s from the center of the pumice raft. This value is consistent with and shown by [2]. As such, this speed may have prevented the enrichment processes from occurring (as the pumice raft moves too fast). Discolored waters adjacent to the raft until late August (high backscattering coefficient for particles < 0.0032 m−1) followed to the east of the pumice raft. [9] explains that this discolored water is unlikely to be linked to the submarine eruption plume, but rather contains a fine suspension of glass shards generated by abrasion in the pumice raft, in addition to the sinking of pumice clasts that later reach the seafloor [6]. Ref. [8] presumed the brightest areas of discoloration that followed the August 2006 eruption in the Vava’u island group of Tonga were the most concentrated and shallow, fading to a darker blue as it moved away from the source. Additionally, the blue/green color may be indicative of iron and aluminum oxides precipitating from the mixing of hydrothermal waters with cooler seawater [12]. As stated earlier, the low Chla calculated by OC3 is only an artifact. Still, there is a general underestimation of chlorophyll values in the region of the pumice raft because the large, discolored waters considered to be oligotrophic.

5. Conclusions

Using L2 MODIS, VIIRS, and OLCI ocean color imagery at 1 km, 750 m, and 300 m resolution, respectively, we were able to detect, associated with a 7 August 2019 Tonga underwater volcanic eruption, compact and fragmented pumice, the so-called “discolored” waters, and the presence of chlorophyll post-eruption. Though pixels were coarse when following fragmented pumice, it could still be viewed and tracked at this resolution.
Consolidated pumice was traced on L2 data from their anomalous SST signal compared to that of the surrounding waters. Higher than average temperatures were observed within the raft, but these temperatures, although useful to detect the raft, do not necessarily provide a true depiction of actual temperatures within the raft due to differences in emissivity of the pumice and ocean.
By exploiting the default atmospheric correction scheme to retrieve marine reflectance in the case of floating material, evidence of fragmented pumice could be traced by ATMWARN and LOWLV masked flags using NASA MODIS and VIIRS L2 products, and by very low or negative reflectance values using OLCI data.
High spectral reflectance of discolored waters around the pumice rafts in the early days following the event could be seen clearly in the MODIS and VIIRS reflectance in the blue (Rrs at 443 nm), with a smaller effect in the green (Rrs at 551 or 555 nm), in comparison to the surrounding ocean. This discoloration is likely due to the presence of small pumice particles or pumicite at depth. When mixed with water, these dark brown particles reflect, unlike oligotrophic waters, more in the red than in the blue, but flatten spectral variations in that range, the signal in the red being strongly attenuated by water absorption. As they tend to enhance the water reflectance in the blue rather than in the green, OC3 Chla values are erroneously interpreted as low, i.e., corresponding to ultra-oligotrophic waters.
Mesotrophic waters’ delineation (Chla threshold of 0.1 mg·m−3) allowed us to describe the biological impact on the chlorophyll field at a local scale within the months following the eruption. The pumice had crossed low chlorophyll areas from 8 to 12 August and then chlorophyll-rich waters on 21 and 23 August and into September. Based on the dates studied, the region between Tonga and Fiji experienced chlorophyll values above 0.1 mg·m−3, but these enrichments were not related to pumice rafts but rather to enrichments present in Tonga and Lau Waters before and during the eruption (August), and later (September) to high Chla linked to shoals as they reached the coasts of Fiji.
This study shows the value of satellite monitoring, particularly in regions such as the South Pacific with limited resources to conduct ground truthing exercises across vast ocean expanses. Such detection methods could be used for other floating material after sudden oceanic events. Importantly, pumice rafts have implications for mariners who encounter them. Prior knowledge of their location with the use of satellite imagery could assist in preventing damage to vessels.
Remote sensing in the Pacific Island region is necessary for documenting and monitoring oceanic activities and changes in ocean processes as in situ observations are limited. Future research could assess how such monitoring could impact the economic costs and ocean status of these island countries.

Author Contributions

Conceptualization, A.W. and C.D.; methodology, A.S. and J.L.; software, J.L. and A.S.; validation, R.F., C.D. and C.M.; formal analysis, C.D.; investigation, A.S.; resources, J.L.; data curation, J.L.; writing—original draft preparation, A.W.; writing—review and editing, A.W., A.S., C.D. and R.F.; visualization, A.S. and A.W.; supervision, C.D.; project administration, C.D.; funding acquisition, C.D. All authors have read and agreed to the published version of the manuscript.

Funding

This research was supported by the French Ministry of Foreign affairs Fonds Pacifique COMETE project and by Institut de Recherche for Sustainable Development (IRD) M.I.O. Actions. A.W’s PhD is funded by the « Allocations de recherché pour une thèse au Sud (ARTS-IRD) » program and receives support from the Ecole Doctorale Sciences de l’environnement—ED 251- Aix Marseille Université, 2019–2022. RF’s work was supported by NASA under various grants.

Institutional Review Board Statement

Not Applicable.

Informed Consent Statement

Not Applicable.

Data Availability Statement

The data related to the thresholds of different water types and masks presented in this study are available on request from the corresponding author.

Acknowledgments

We thank NASA for providing online collections of NASA Terra and Aqua MODIS and Suomi NPP VIIRS data, and we thank Copernicus for OLCI Sentinel-3 data. All MODIS and VIIRS data products acquired through the Level-1 and Atmosphere Archive and Distribution System (LAADS) Distributed Active Archive Center (DAAC) are provided without any monetary charge and have no restrictions on subsequent use or redistribution.

Conflicts of Interest

The authors declare no conflict of interest.

References

  1. Bryan, S.E.; Cook, A.G.; Evans, J.P.; Hebden, K.; Hurrey, L.; Colls, P.; Jell, J.S.; Weatherley, D.; Firn, J. Rapid, long-distance dispersal by pumice rafting. PLoS ONE 2012, 7, e40583. [Google Scholar] [CrossRef] [Green Version]
  2. Jutzeler, M.; Marsh, R.; Sebille, E.; Mittal, T.; Carey, R.; Fauria, K.; Manga, M.; McPhie, J. Ongoing dispersal of the 7 August 2019 pumice raft from the tonga arc in the Southwestern Pacific Ocean. Geophys. Res. Lett. 2020, 47. [Google Scholar] [CrossRef]
  3. Hurlbut, G.C.; Verbeek, R.D.M. Krakatau. J. Am. Geogr. Soc. N. Y. 1887, 19, 233–255. [Google Scholar] [CrossRef]
  4. Sigurdsson, H.; Cashdollar, S.; Sparks, S.R.J. The Eruption of Vesuvius in A. D. 79: Reconstruction from historical and volcanological evidence. Am. J. Archaeol. 1982, 86, 39–51. [Google Scholar] [CrossRef] [Green Version]
  5. Oppenheimer, C. Climatic, environmental and human consequences of the largest known historic eruption: Tambora volcano (Indonesia) 1815. Progr. Phys. Geogr. 2003, 27, 230–259. [Google Scholar] [CrossRef]
  6. Jutzeler, M.; Marsh, R.; Carey, R.J.; White, J.D.L.; Talling, P.J.; Karlstrom, L. On the fate of pumice rafts formed during the 2012 Havre submarine eruption. Nat. Commun. 2014, 5, 3660. [Google Scholar] [CrossRef] [Green Version]
  7. Smithsonian Institute Most Recent Weekly Report: 14 August to 20 August 2019. Available online: https://volcano.si.edu/volcano.cfm?vn=243091 (accessed on 30 November 2020).
  8. Vaughan, R.; Abrams, M.; Hook, S.; Pieri, D. Satellite Observations of new volcanic island in Tonga. Eos. Trans. Am. Geophys. Union 2007, 88. [Google Scholar] [CrossRef]
  9. Mantas, V.M.; Pereira, A.J.S.C.; Morais, P.V. Plumes of discolored water of volcanic origin and possible implications for algal communities. The case of the home reef eruption of 2006 (Tonga, Southwest Pacific Ocean). Remote Sens. Environ. 2011, 115, 1341–1352. [Google Scholar] [CrossRef]
  10. Brandl, P.A.; Schmid, F.; Augustin, N.; Grevemeyer, I.; Arculus, R.J.; Devey, C.W.; Petersen, S.; Stewart, M.; Kopp, H.; Hannington, M.D. The 6–8 August 2019 eruption of ‘Volcano F’ in the Tofua Arc, Tonga. J. Volcanol. Geotherm. Res. 2020, 390, 106695. [Google Scholar] [CrossRef] [Green Version]
  11. Duggen, S.; Croot, P.; Schacht, U.; Hoffmann, L. Subduction zone volcanic ash can fertilize the surface ocean and stimulate phytoplankton growth: Evidence from biogeochemical experiments and satellite data. Geophys. Res. Lett. 2007, 34, L01612. [Google Scholar] [CrossRef] [Green Version]
  12. Urai, M.; Machida, S. Discolored seawater detection using ASTER reflectance products: A case study of Satsuma-Iwojima, Japan. Remote Sens. Environ. 2005, 99, 95–104. [Google Scholar] [CrossRef]
  13. Matangi Tonga Online Aviation Alert as Metis Shoal Smoke Eruption Towers. Available online: https://matangitonga.to/2019/10/15/aviation-alert-metis-shoal-smoke-eruption-towers (accessed on 23 November 2020).
  14. Blondeau-Patissier, D.; Gower, J.F.R.; Dekker, A.G.; Phinn, S.R.; Brando, V.E. A review of ocean color remote sensing methods and statistical techniques for the detection, mapping and analysis of phytoplankton blooms in coastal and open oceans. Progr. Oceanogr. 2014, 123, 123–144. [Google Scholar] [CrossRef] [Green Version]
  15. Kahru, M.; Savchuk, O.; Elmgren, R. Satellite measurements of cyanobacterial bloom frequency in the Baltic Sea: Interannual and spatial variability. Mar. Ecol. Progr. Ser. 2007, 343, 15–23. [Google Scholar] [CrossRef]
  16. Hu, C.; Cannizzaro, J.; Carder, K.; Muller-Karger, F.; Hardy, R. Remote Detection of Trichodesmium blooms in optically complex coastal waters: Examples with MODIS full-spectral data. Remote Sens. Environ. 2010, 114, 2048–2058. [Google Scholar] [CrossRef]
  17. Gower, J.K. Young global remote sensing of Trichodesmium. Int. J. Remote Sens. 2014, 35. [Google Scholar] [CrossRef]
  18. Mckinna, L. Three decades of ocean-color remote-sensing Trichodesmium Spp. in the world’s oceans: A review. Progr. Oceanogr. 2014, 131, 177–199. [Google Scholar] [CrossRef]
  19. Rousset, G.; De Boissieu, F.; Menkes, C.; Lefèvre, J.; Frouin, R.; Rodier, M.; Ridoux, V.; Laran, S.; Bonnet, S.; Dupouy, C. Remote sensing of Trichodesmium Spp. mats in the western tropical South Pacific. Biogeosciences 2018, 15, 5203–5219. [Google Scholar] [CrossRef] [Green Version]
  20. Hu, C.; Feng, L.; Hardy, R.; Hochberg, E. Spectral and spatial requirements of remote measurements of Pelagic Sargassum macroalgae. Remote Sens. Environ. 2015, 167. [Google Scholar] [CrossRef]
  21. Ody, A.; Thibaut, T.; Berline, L.; Changeux, T.; André, J.-M.; Chevalier, C.; Blanfuné, A.; Blanchot, J.; Ruitton, S.; Stiger-Pouvreau, V.; et al. From in situ to satellite observations of Pelagic Sargassum distribution and aggregation in the tropical North Atlantic Ocean. PLoS ONE 2019, 14. [Google Scholar] [CrossRef] [Green Version]
  22. Dupouy, C.; Frouin, R.; Tedetti, M.; Maillard, M.; Rodier, M.; Fabien, L.; Guidi, L.; Picheral, M.; Duhamel, S.; Charrière, B.; et al. Diazotrophic Trichodesmium influence on ocean color and pigment composition in the South West Tropical Pacific. Biogeosci. Discuss. 2018, 1–43. [Google Scholar] [CrossRef]
  23. EUMETSAT Sentinel-3A Product Notice–OLCI Level-2 Ocean Colour; EUMETSAT: Darmstadt, Germany, 2019.
  24. Hu, C.; Lee, Z.; Franz, B. Chlorophyll a Algorithms for Oligotrophic Oceans: A novel approach based on three-band reflectance difference. J. Geophys. Res. 2012, 117, C01011. [Google Scholar] [CrossRef] [Green Version]
  25. The Guardian Massive Pumice “raft” Spotted in the Pacific Could Help Replenish Great Barrier Reef. The Guardian. 25 August 2019. Available online: https://www.theguardian.com/environment/2019/aug/25/massive-pumice-raft-spotted-in-the-pacific-could-help-replenish-great-barrier-reef (accessed on 31 January 2021).
  26. Chand, S. Pumice Menace Hits Parts of Lau Group. Available online: https://fijisun.com.fj/2019/09/12/pumice-menace-hits-parts-of-lau-group/ (accessed on 26 August 2020).
  27. Leblanc, K.; Cornet, V.; Rimmelin-Maury, P.; Grosso, O.; Hélias-Nunige, S.; Brunet, C.; Claustre, H.; Ras, J.; Leblond, N.; Quéguiner, B. Silicon CYCLE IN THE TROpical South Pacific: Contribution to the global si cycle and evidence for an active pico-sized siliceous plankton. Biogeosciences 2018, 15, 5595–5620. [Google Scholar] [CrossRef] [Green Version]
  28. Guieu, C.; Bonnet, S.; Anne, P.; Menkes, C.; Chavagnac, V.; Desboeufs, K.; Maes, C.; Moutin, T. Iron from a submarine source impacts the productive layer of the Western Tropical South Pacific (WTSP). Sci. Rep. 2018, 8. [Google Scholar] [CrossRef] [PubMed]
  29. Dupouy, C.; Frouin, R.; Tedetti, M.; Maillard, M.; Rodier, M.; Lombard, F.; Guidi, L.; Picheral, M.; Neveux, J.; Duhamel, S.; et al. Diazotrophic Trichodesmium impact on UV–Vis radiance and pigment composition in the Western Tropical South Pacific. Biogeosciences 2018, 15, 5249–5269. [Google Scholar] [CrossRef] [Green Version]
  30. Moutin, T.B.B.; Beker, B.; Dupouy, C.; Rimmelin, P.; Bouteiller, A. Phosphate availability controls Trichodesmium Spp. biomass in the SW Pacific Ocean. Mar. Ecol. Prog. Ser. 2005, 297, 15–21. [Google Scholar] [CrossRef] [Green Version]
Figure 1. Left: Satellite ρ (rhos) reflectance data at 443 nm under the sea surface temperature (SST) mask of consolidated pumice for 12 August Coordinated Universal Time (UTC) from a threshold in Level 2 (L2) SST Moderate Resolution Imaging Spectroradiometer (MODIS) (top) and Visible Infrared Imaging Radiometer Suite (VIIRS) (bottom) data. Right: Satellite ρ (rhos) data of MODIS and VIIRS at different wavelengths under the “consolidated pumice raft”.
Remotesensing 13 00501 g001
Figure 2. Left: Blue (443 nm) satellite reflectance ρ (rhos, quasi-surface reflectance) of MODIS and VIIRS for the 12 August 2019 discolored waters made from a threshold on the backscattering coefficient > 0.0032 m−1 mask on L2 MODIS (top) and VIIRS (bottom) data. Right: Satellite reflectance data ρ (rhos) at different wavelengths under the mask “discolored waters”. The backscattering coefficient “bbp_giop at 443 nm” threshold was defined from the pixels under this rhos mask.
Remotesensing 13 00501 g002
Figure 3. Satellite reflectance data ρ (rhos) spectra of the different water types for VIIRS (left) and MODIS (right). Averages of 3 days of data from each sensor (10, 11, and 12 August for VIIRS; 11, 12, and 14 August for MODIS), with their standard deviations calculated.
Remotesensing 13 00501 g003
Figure 4. Series of true color (first row) and results of different masks obtained on L2 products outlining parameters of extracted, consolidated, and fragmented pumice rafts; discolored waters (corresponding to the backscattering coefficient at 443 nm > 0.0032 m−1); and mesotrophic waters (Chla > 0.1 mg·m−3) during the 8 August–6 September series. The second row represents remote sensing reflectance (Rrs) at 443 nm, the third row chlorophyll-a concentration (Chla), and the last row SST images. Dates at the bottom are aligned to columns directly above them. The white pixels correspond to cloud cover in Rrs at 443 nm and Chla images. The black pixels correspond to the pumice raft associated with the L2 SST mask and two QC L2 flags.
Remotesensing 13 00501 g004
Figure 5. Map showing the combined drift of both pumice raft and discolored waters post-volcanic eruption between 8 and 23 August 2019. The pumice raft formed within the Vava’u group in Tongan Waters and drifted West toward Fiji by 23 August.
Remotesensing 13 00501 g005
Figure 6. Pixel percentage of the observed area for the dates studied in August 2019 of different classes described above (see text). Pixel percentage of cloud cover (Not a Number (NaN)) and mesotrophic (Chla > 0.1 mg·m−3), oligotrophic (Chla < 0.1 mg·m−3), and discolored water (bbp at 443 nm > 0.0032 m−1) values are represented along the y-axis. Note: percentages have been calculated on equivalent areas of 2.5 degrees in longitude and 1 degree latitude (area extraction 174.0°–176.5°W, 18.0°–19.0°S).
Remotesensing 13 00501 g006
Figure 7. Sentinel-3 OLCI L2 Water Surface Reflectance at Full Resolution (WFR) images for 10–11 August and 6 September 2019: (ac) true color (RGB) extracted from Level 1B processing, and Level 2 data for: (df) Rrs at 442.5 nm, (gi) chlorophyll-a concentration, and (jl) sea surface temperatures. NAN values are shown in white in Rrs, Chla, and SST images. Rrs values at 442.5 nm were retrieved by dividing Oa3 reflectance (water-leaving radiance) values by π.
Remotesensing 13 00501 g007
Figure 8. Spectra of Rrs pixels within surface pumice, discolored waters, and normal waters for (left) 9 August 2019 (21:33 UTC) using Sentinel-3A OLCI L2 Water Surface Reflectance at Full Resolution (WFR), and (right) 10 August 2019 (01:55 UTC) MODIS Aqua L2 data. Note that Rrs values were retrieved by dividing Oa3 reflectance (water-leaving radiance) values by π to make them comparable with MODIS values.
Remotesensing 13 00501 g008
Table 1. Zoomed pumice area locations from OLCI, SLSTR, VIIRS, and MODIS-Aqua and -Terra sensors for observed dates in Coordinated Universal Time (UTC).
DATE (UTC)SENSORTILE ID
(Chla and Rrs)
TILE ID
(SST)
ACQUISITION PERIOD (UTC)N LAT.S LAT.W LON.E LON.
8 August 19 MODIS TerraT2019220223000TERRA_MODIS.20190808T223001.L2.SST22:30–21:34–18.231–18.565–175.032–174.433
9 August 19OLCI, SLSTR
Sentinel-3A
S3A_OL_2_WFR____20190809T213305_20190809T213605_20190809T233806_0179_048_043_3240_MAR_O_NR_002S3A_SL_2_WST____20190809T213305_20190809T213605_20190809T233506_0179_048_043_3240_MAR_O_NR_00321:33–21:36–18.189–18.678–175.176–174.530
10 August 19MODIS AquaA2019222015500AQUA_MODIS.20190809T213501.L2.SST01:55–02:00–18.189–18.678–175.176–174.530
OLCI, SLSTR
Sentinel-3A
S3A_OL_2_WFR____20190810T210654_20190810T210954_20190810T231200_0179_048_057_3240_MAR_O_NR_002S3A_SL_2_WST____20190810T210654_20190810T210954_20190810T231059_0179_048_057_3240_MAR_O_NR_00321:06–21:09–18.312–18.682–175.256–174.672
11 August 19 VIIRSV2019223011800SNPP_VIIRS.20190811T011800.L2.SST01:18–01:23–18.312–18.682–175.256–174.672
12 August 19 VIIRSV2019224010000SNPP_VIIRS.20190812T010000.L2.SST01:00–01:05–18.338–18.746–175.388–174.749
21 August 19 MODIS AquaA2019233014000AQUA_MODIS.20190821T014001.L2.SST01:40–01:44–18.324–18.802–176.216–175.483
23 August 19 MODIS AquaA2019235012500AQUA_MODIS.20190823T012501.L2.SST01:25–01:30–18.271–18.621–176.365–175.772
6 September 19MODIS TerraT2019249215500TERRA_MODIS.20190906T215500.L2.SST21:55–21:59–17.971–18.281–178.981–178.558
OLCI, SLSTR
Sentinel-3A
S3A_OL_2_WFR____20190906T210652_20190906T210952_20190906T231514_0179_049_057_3240_MAR_O_NR_002.SEN3S3A_SL_2_WST____20190906T210652_20190906T210952_20190906T230139_0179_049_057_3240_MAR_O_NR_00321:06–21:09–17.971–18.281–178.981–178.558
Table 2. Thresholds defined for different parameters using L2 MODIS and VIIRS SST and ocean color information.
ClassesSST (°C)Ocean Color Parameter
Consolidated pumice SST mask on NAN
Fragmented pumiceSST mask offATMWARN and LOWLV masked pixel numbers
Discolored watersSST mask off bbp at 443 nm > 0.0032 m−1
Oligotrophic watersSST mask off Chla < 0.1 mg·m−3
Mesotrophic watersSST mask offChla > 0.1 mg·m−3
Publisher’s Note: MDPI stays neutral with regard to jurisdictional claims in published maps and institutional affiliations.

