
Ground-Based MAX-DOAS Observations of Tropospheric NO2 and HCHO During COVID-19 Lockdown and Spring Festival Over Shanghai, China

 ,
,  ,
,
Abstract
1. Introduction
2. Materials and Methods
2.1. Observation Site
2.2. MAX-DOAS Instrument
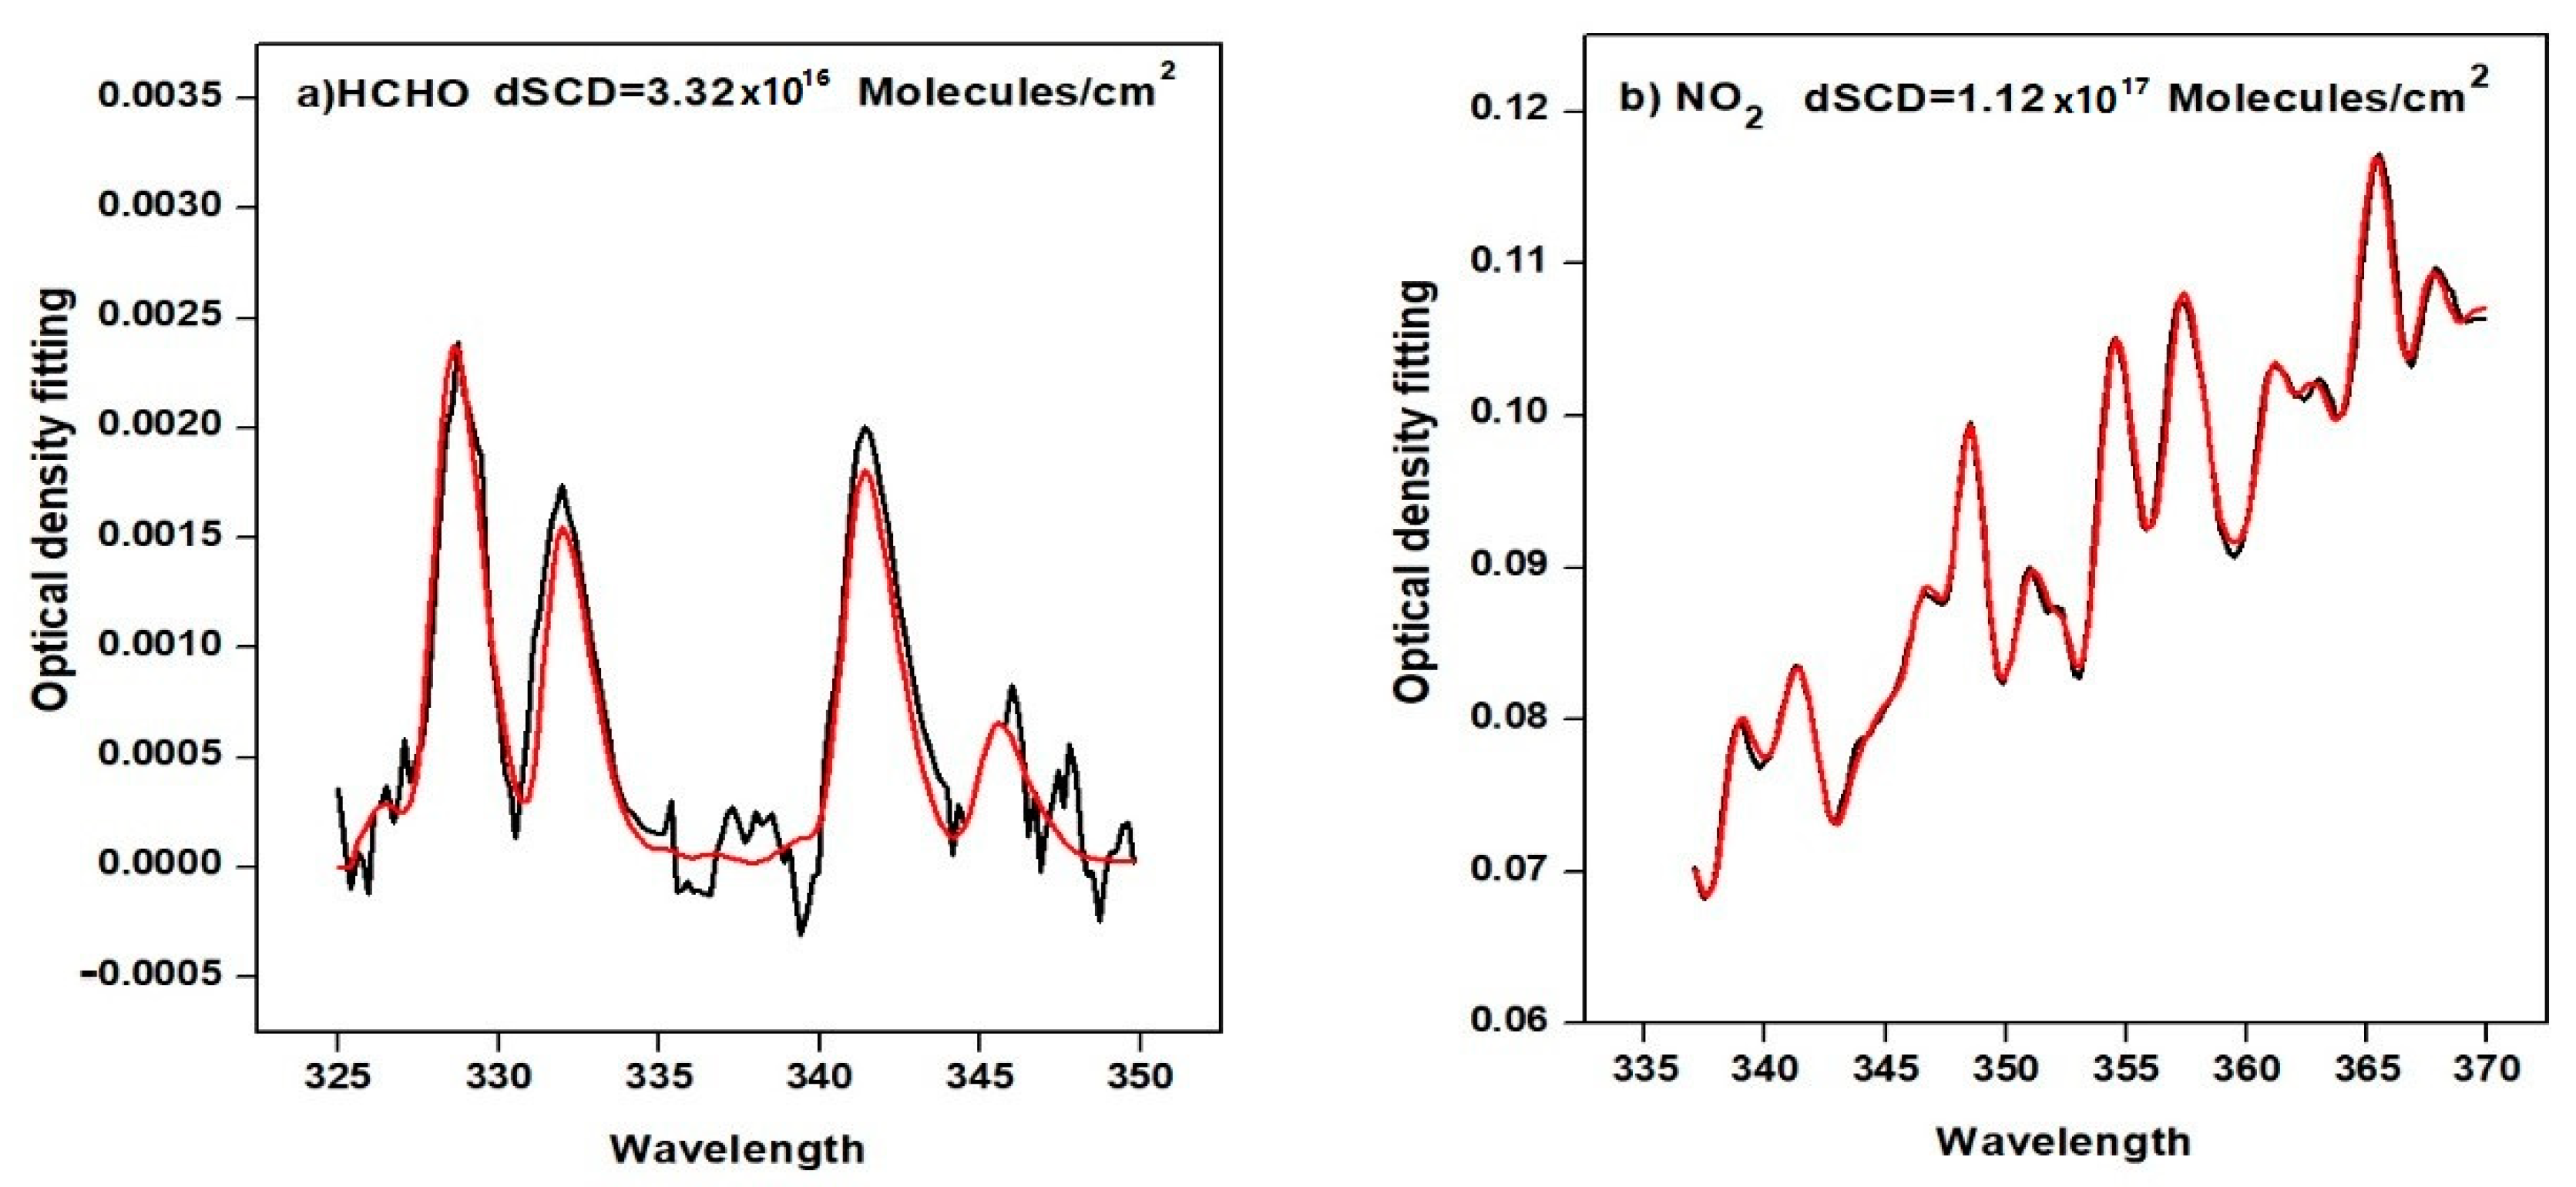
2.3. DOAS Analysis
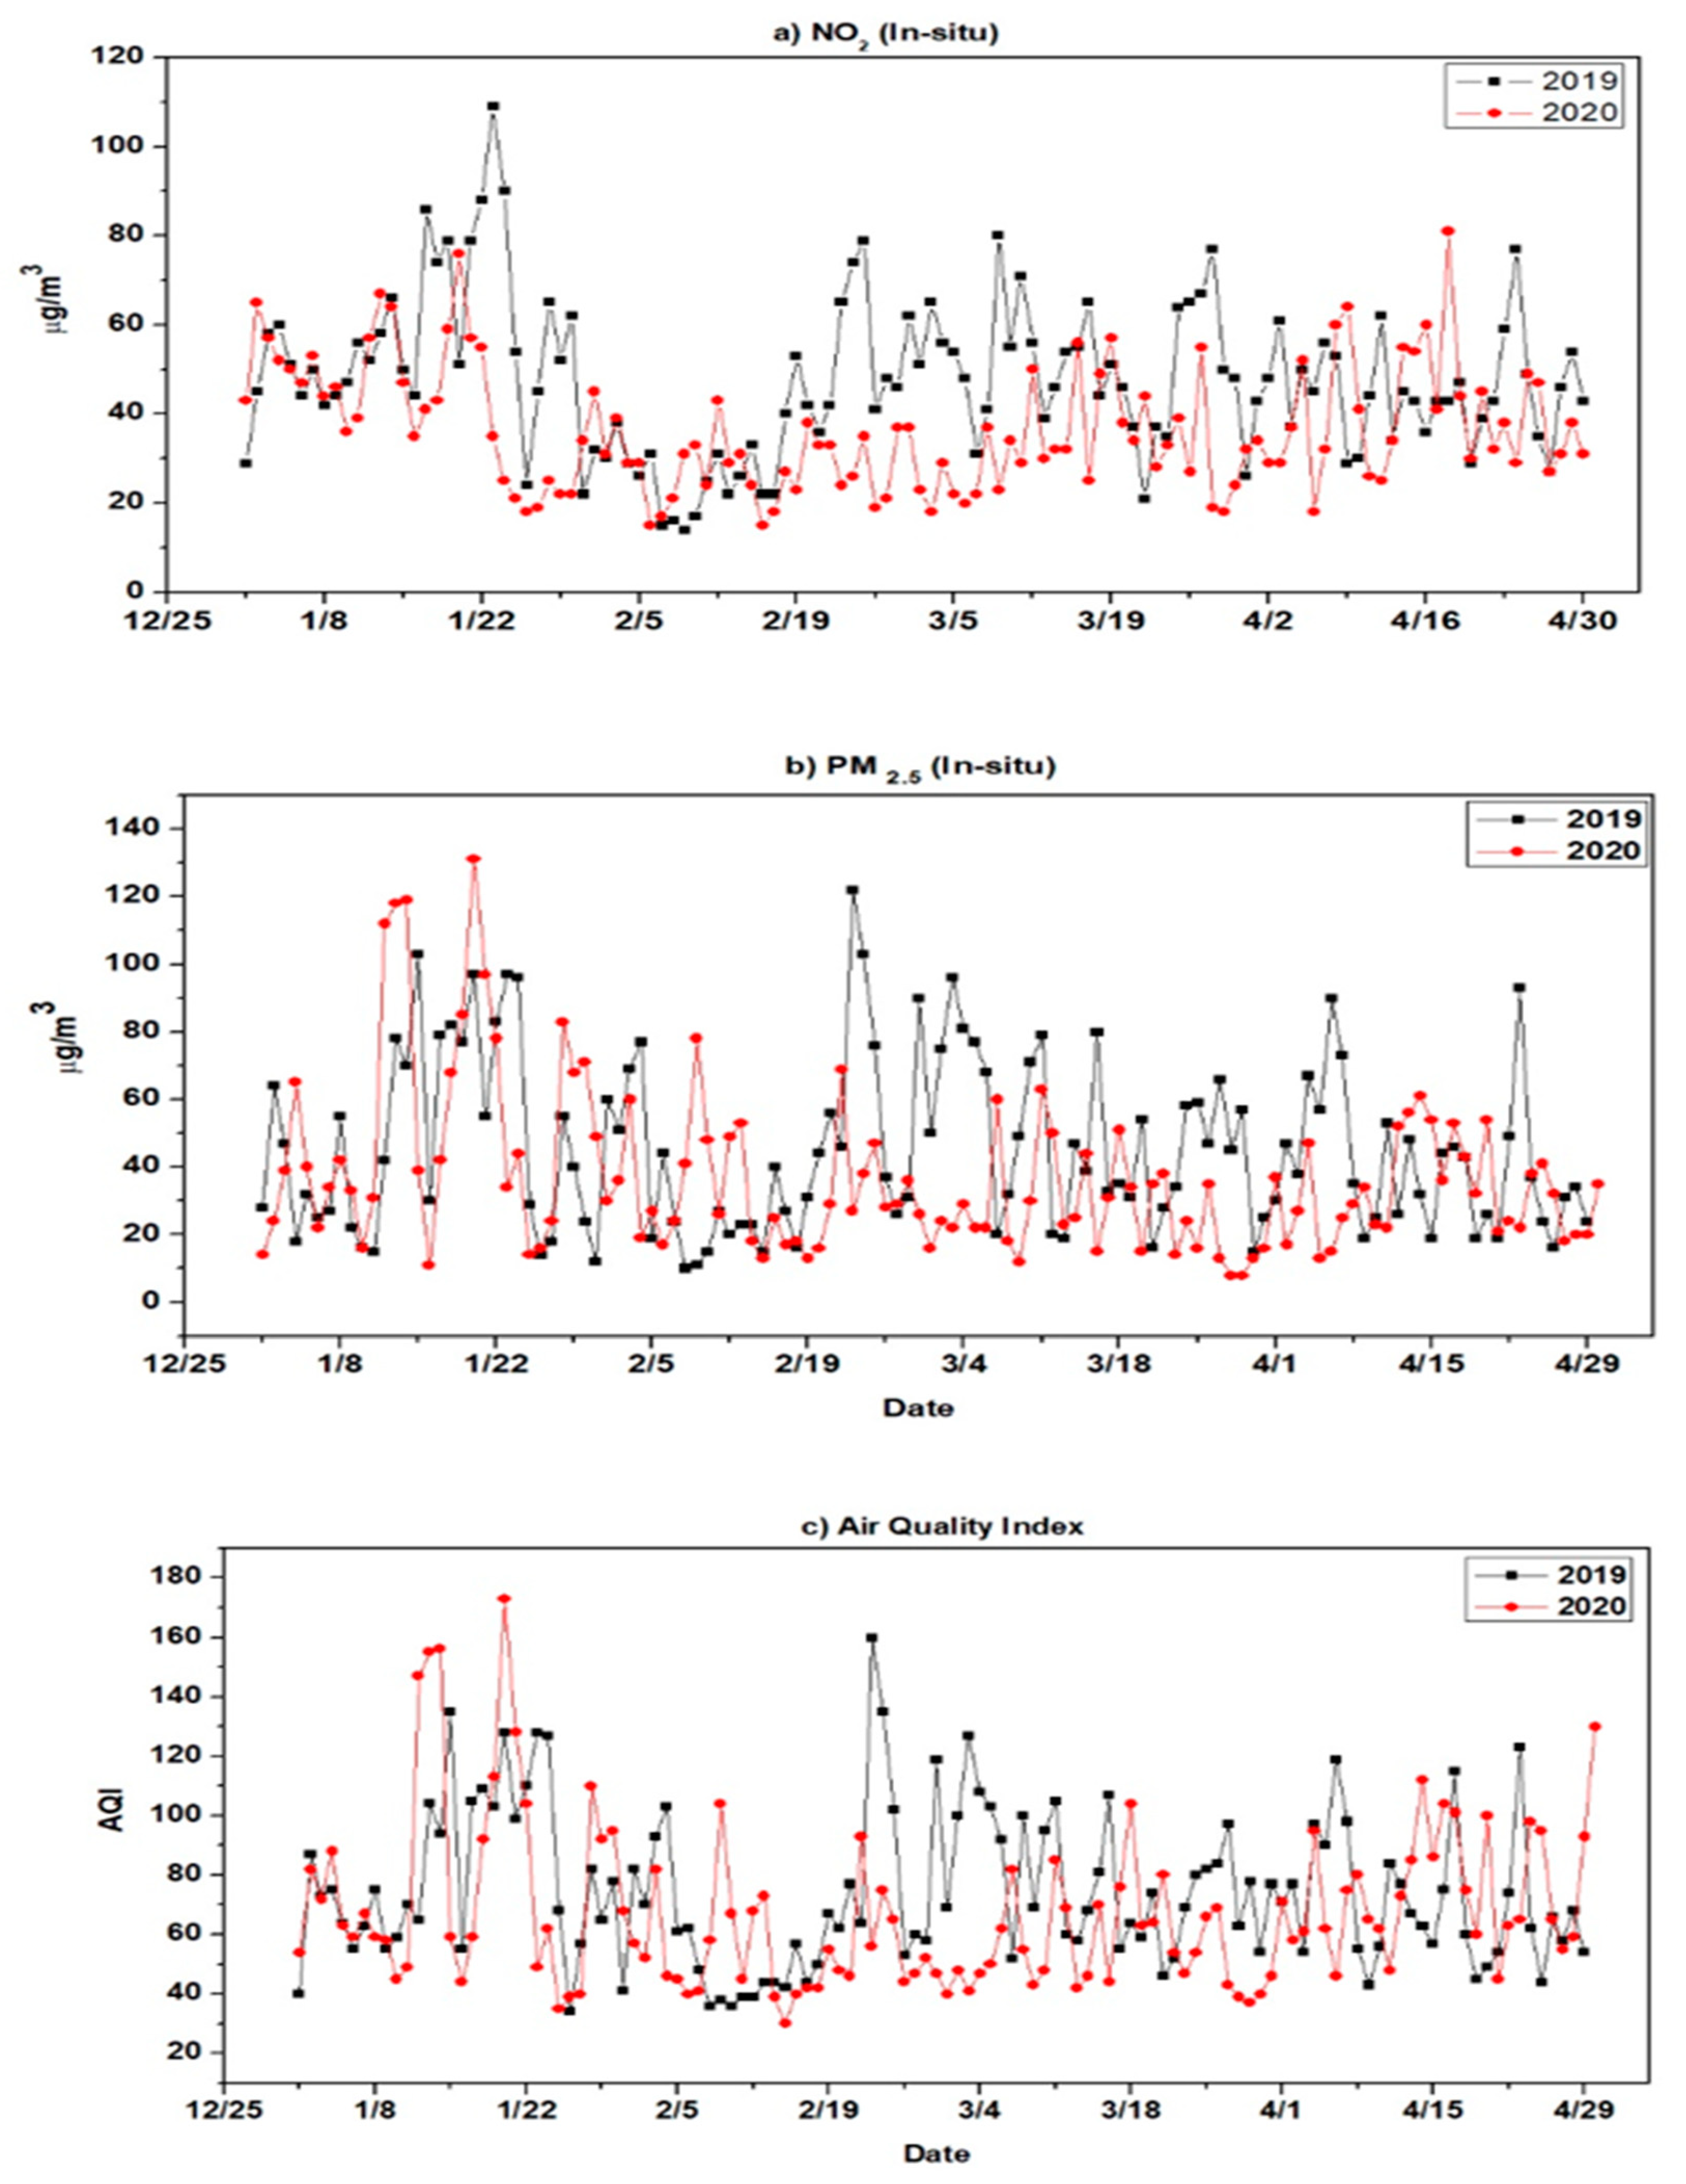
2.4. Ancillary Data
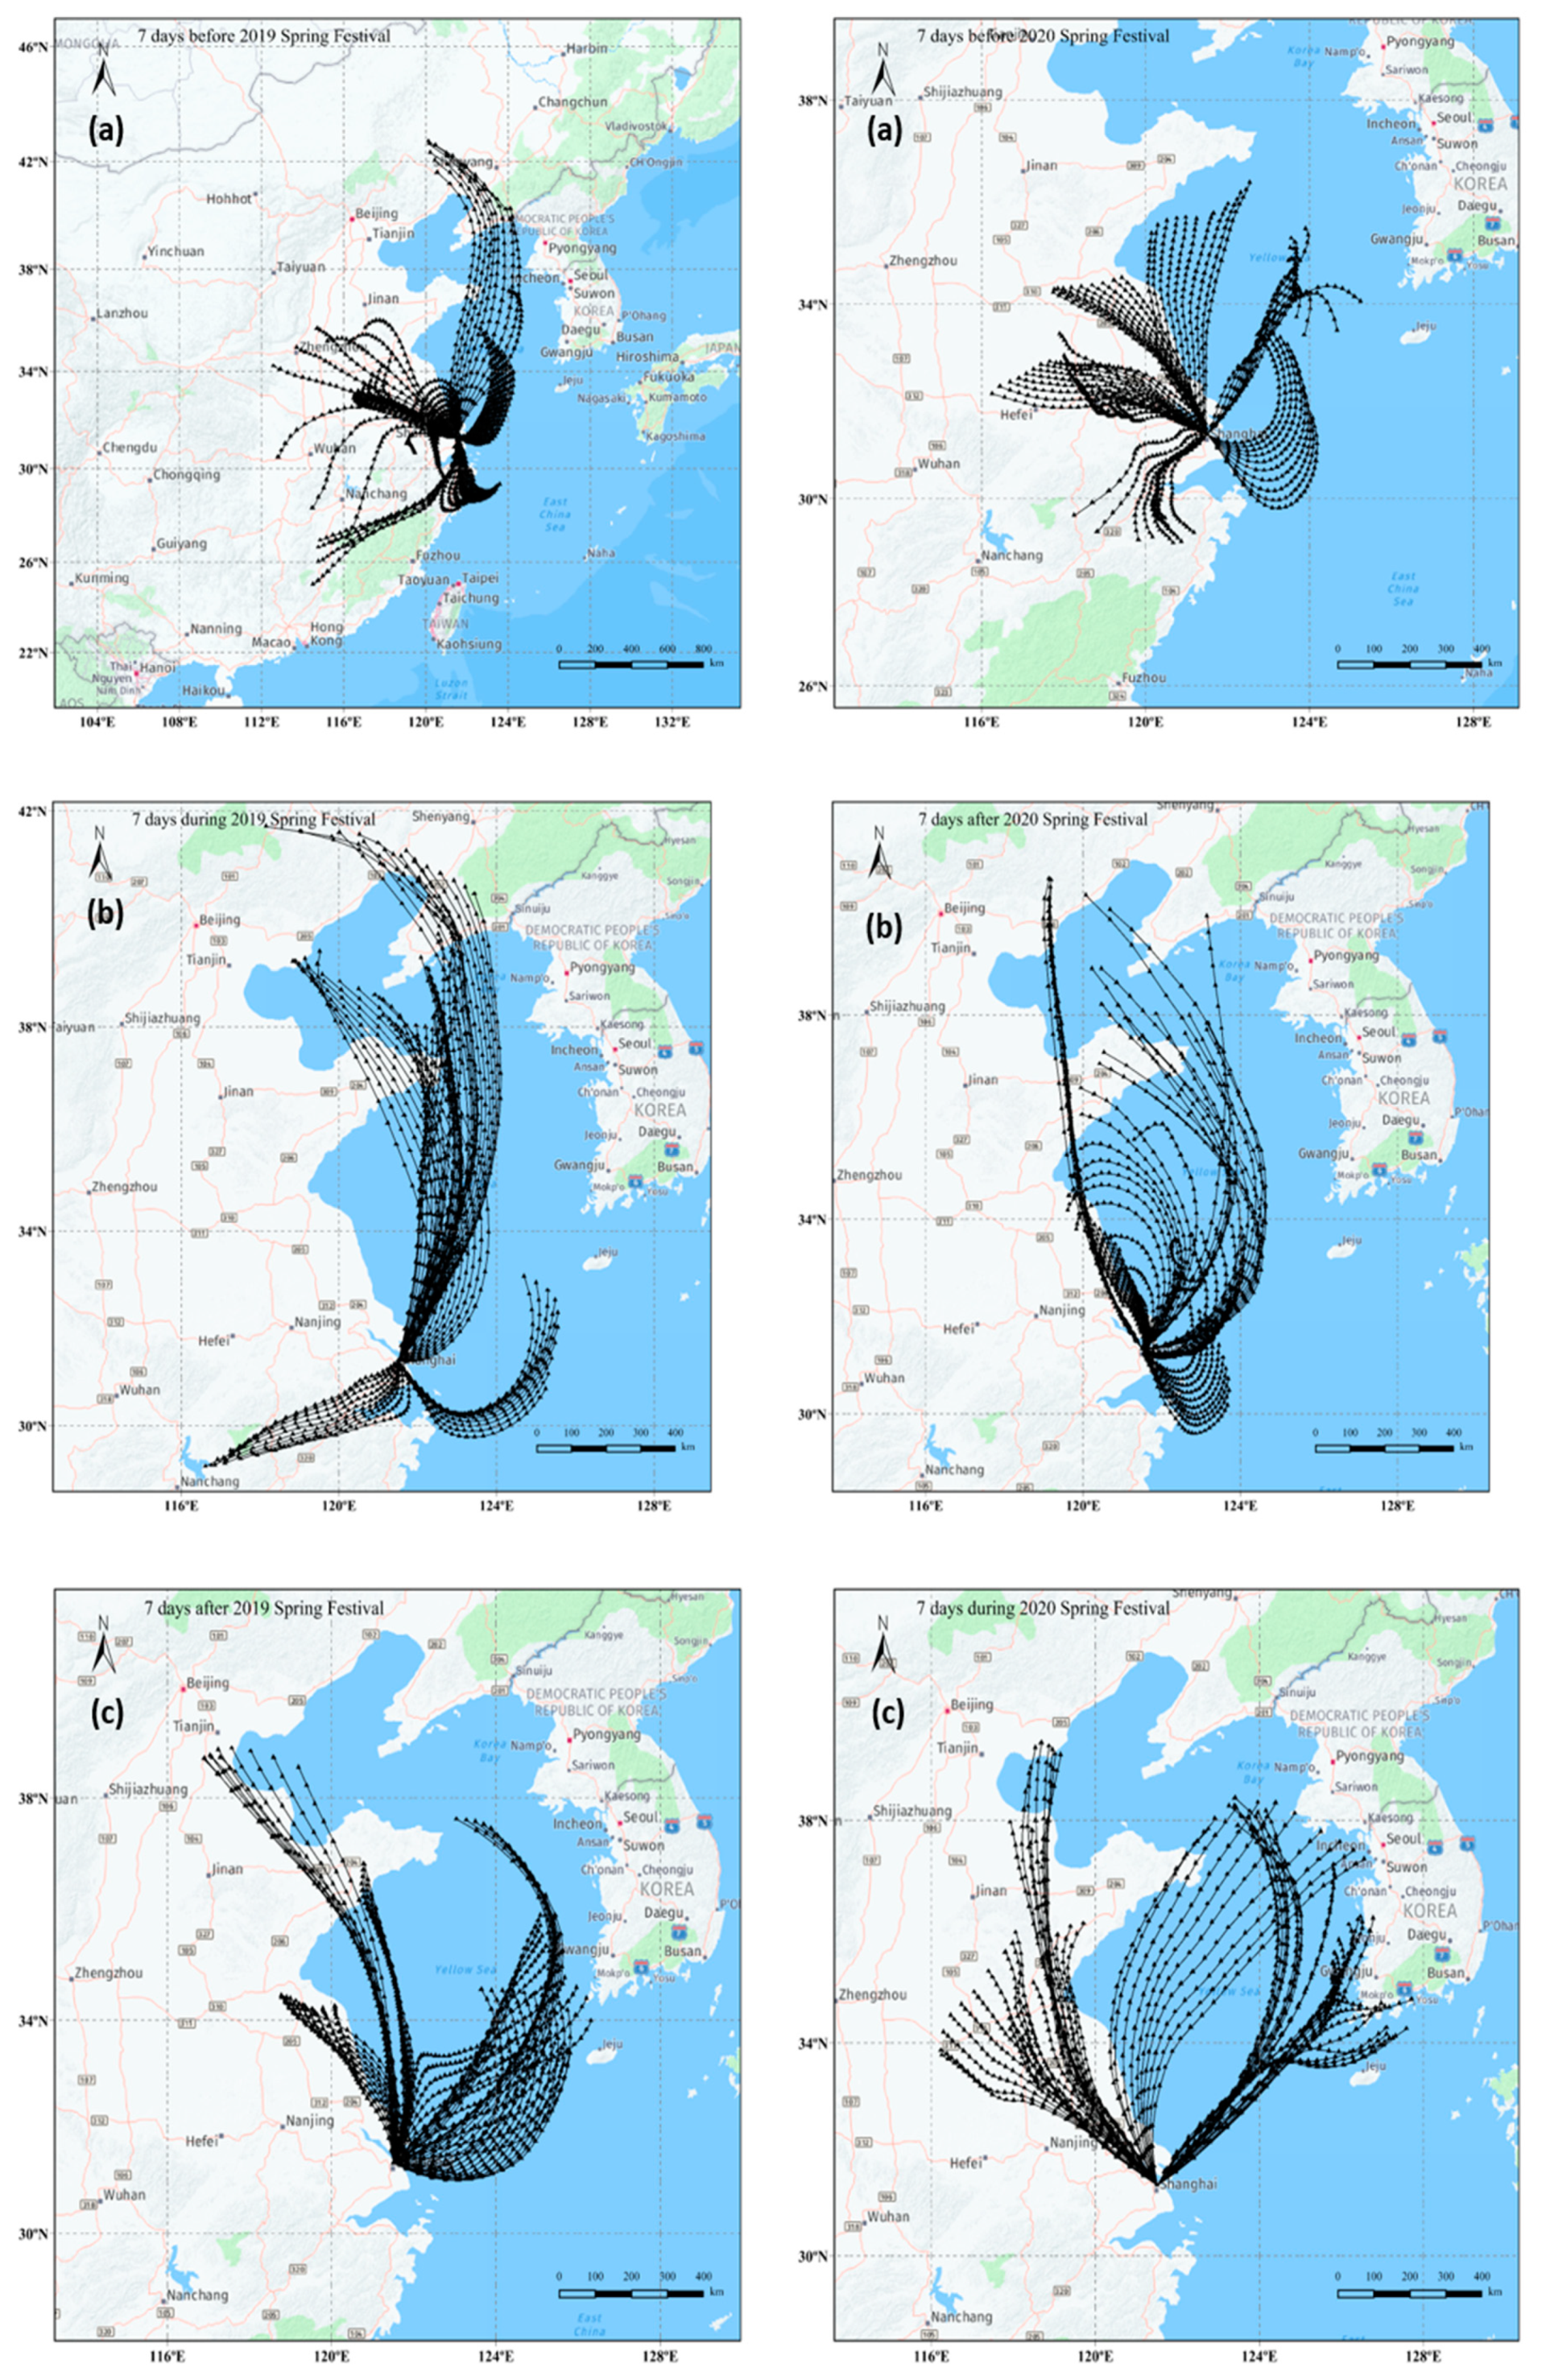
2.5. Backward Trajectory Modeling
3. Results
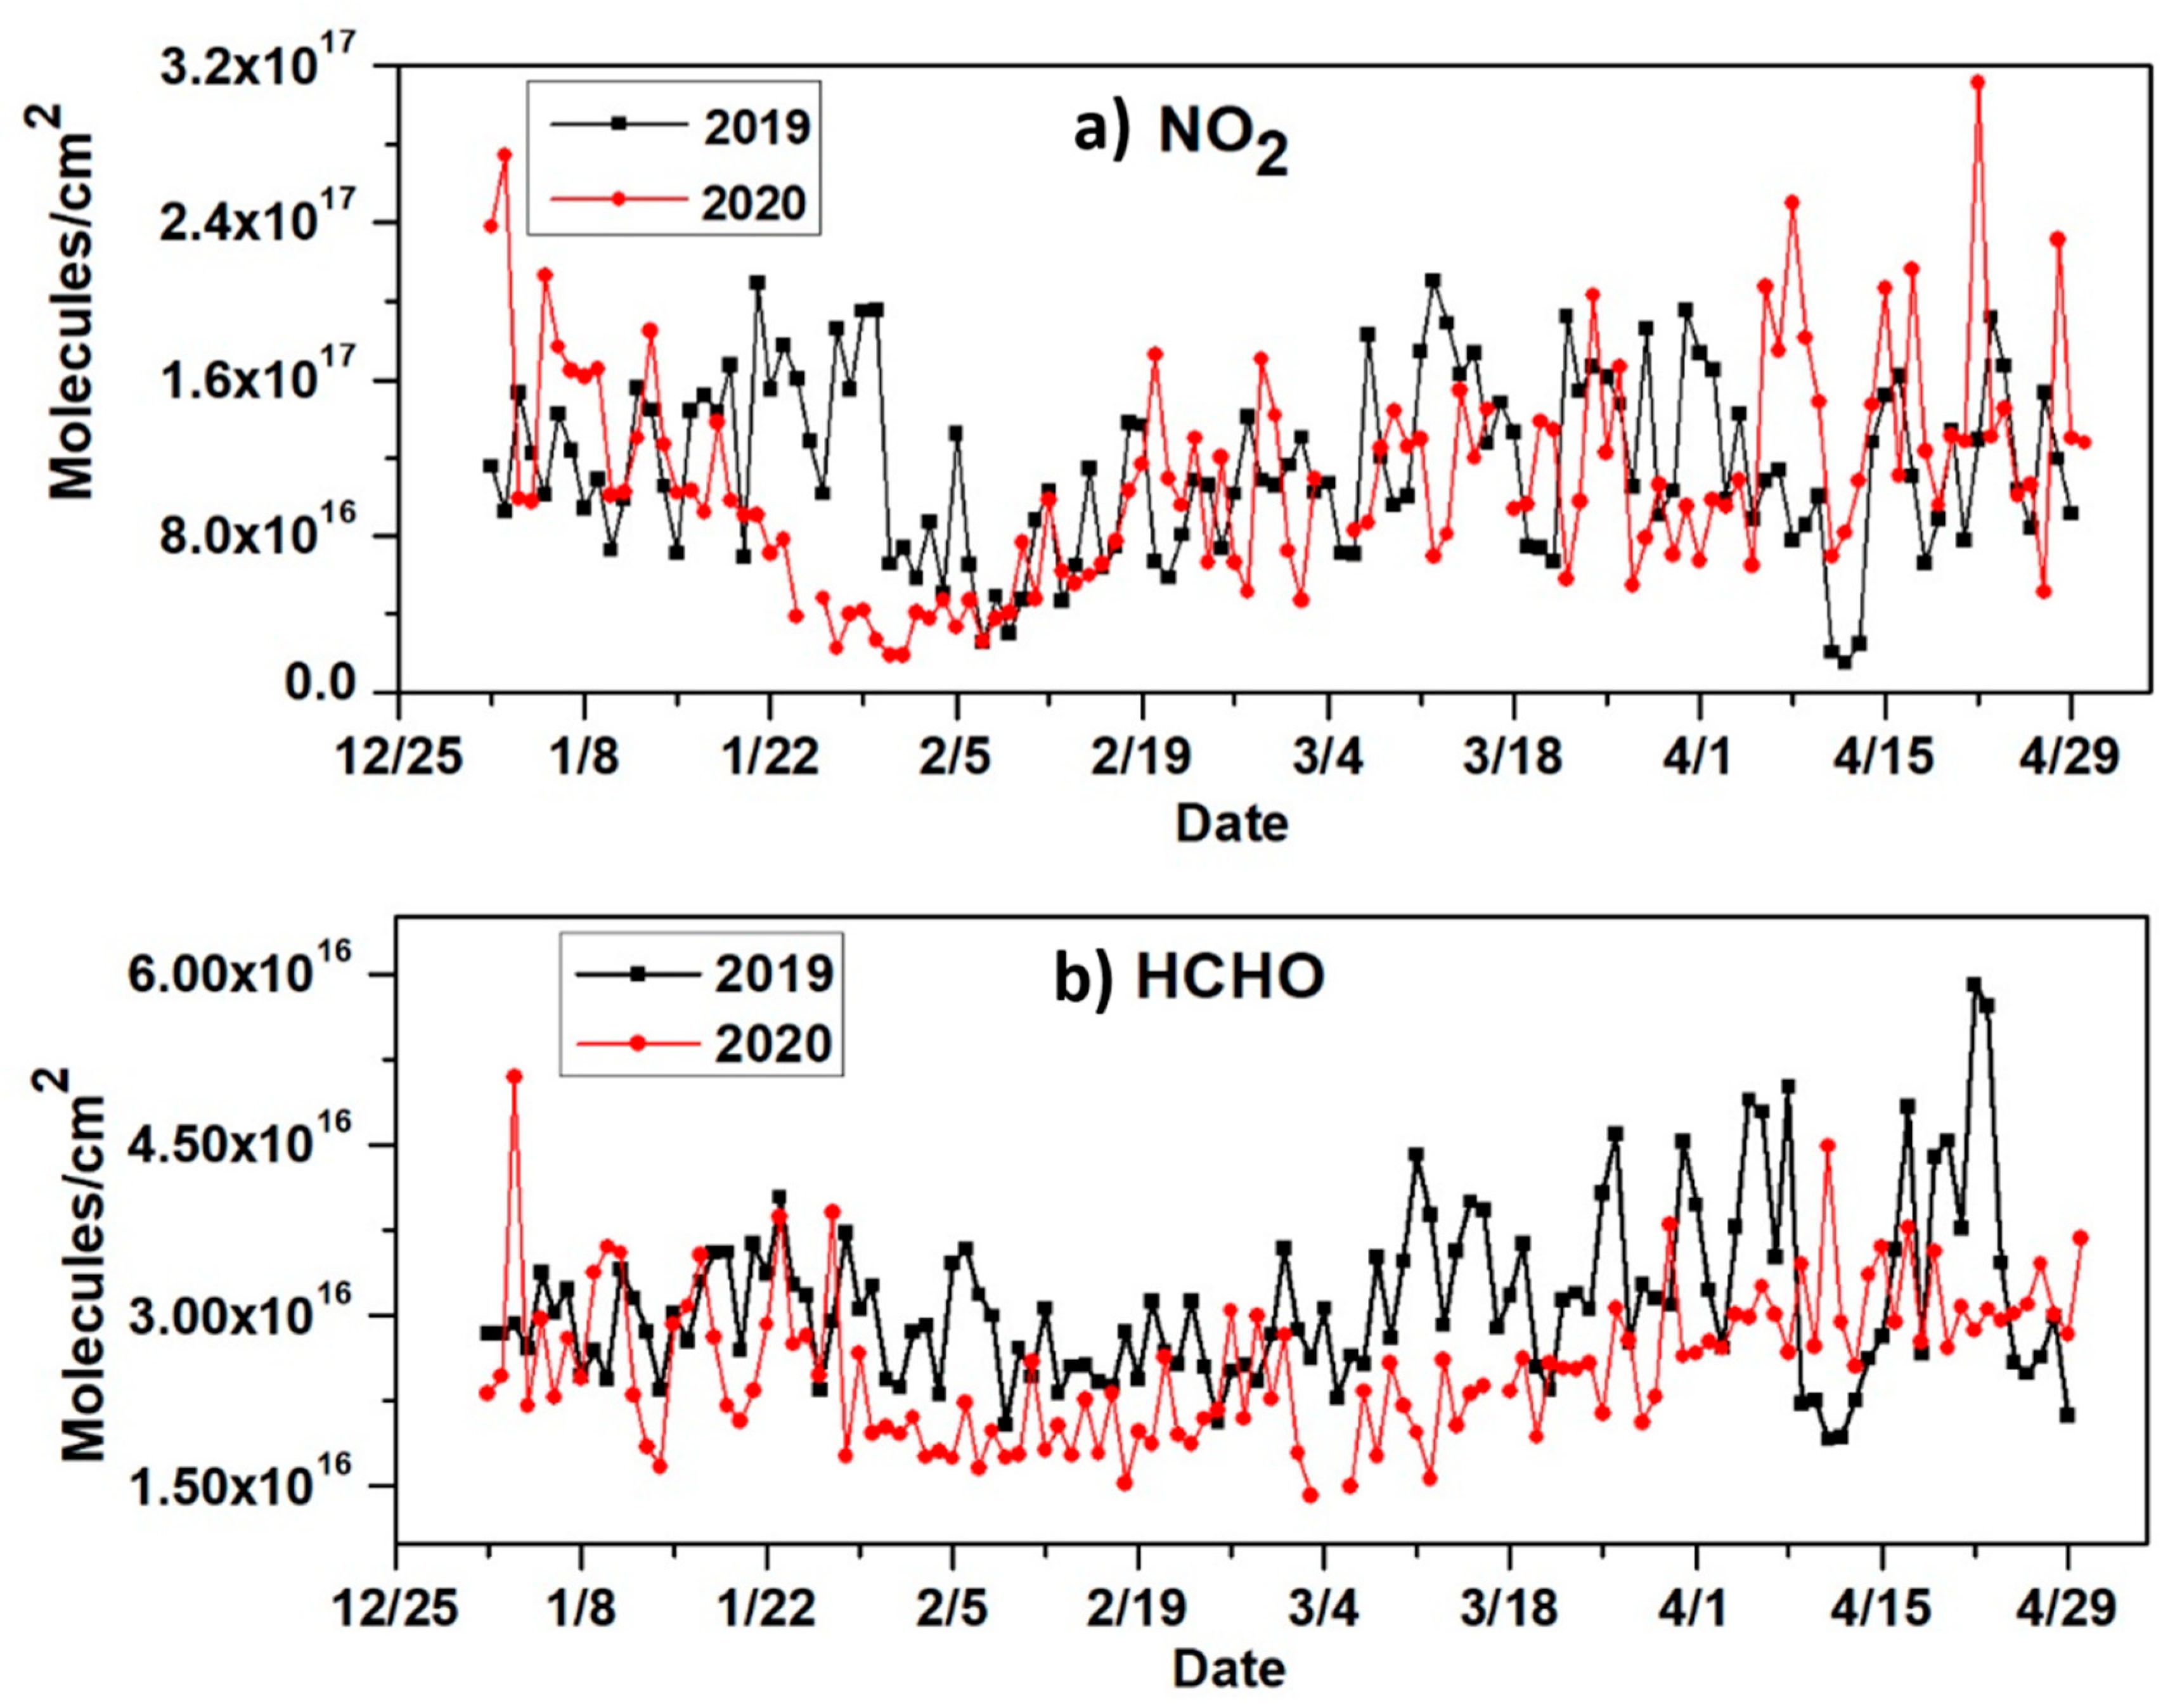
3.1. Overview of the Observations
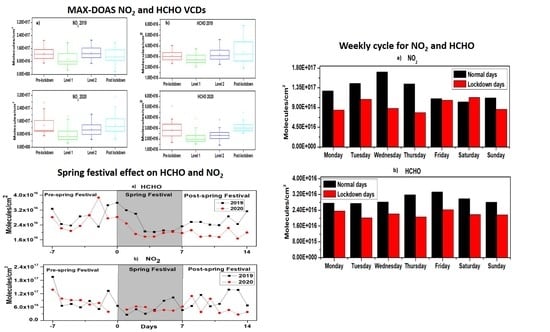
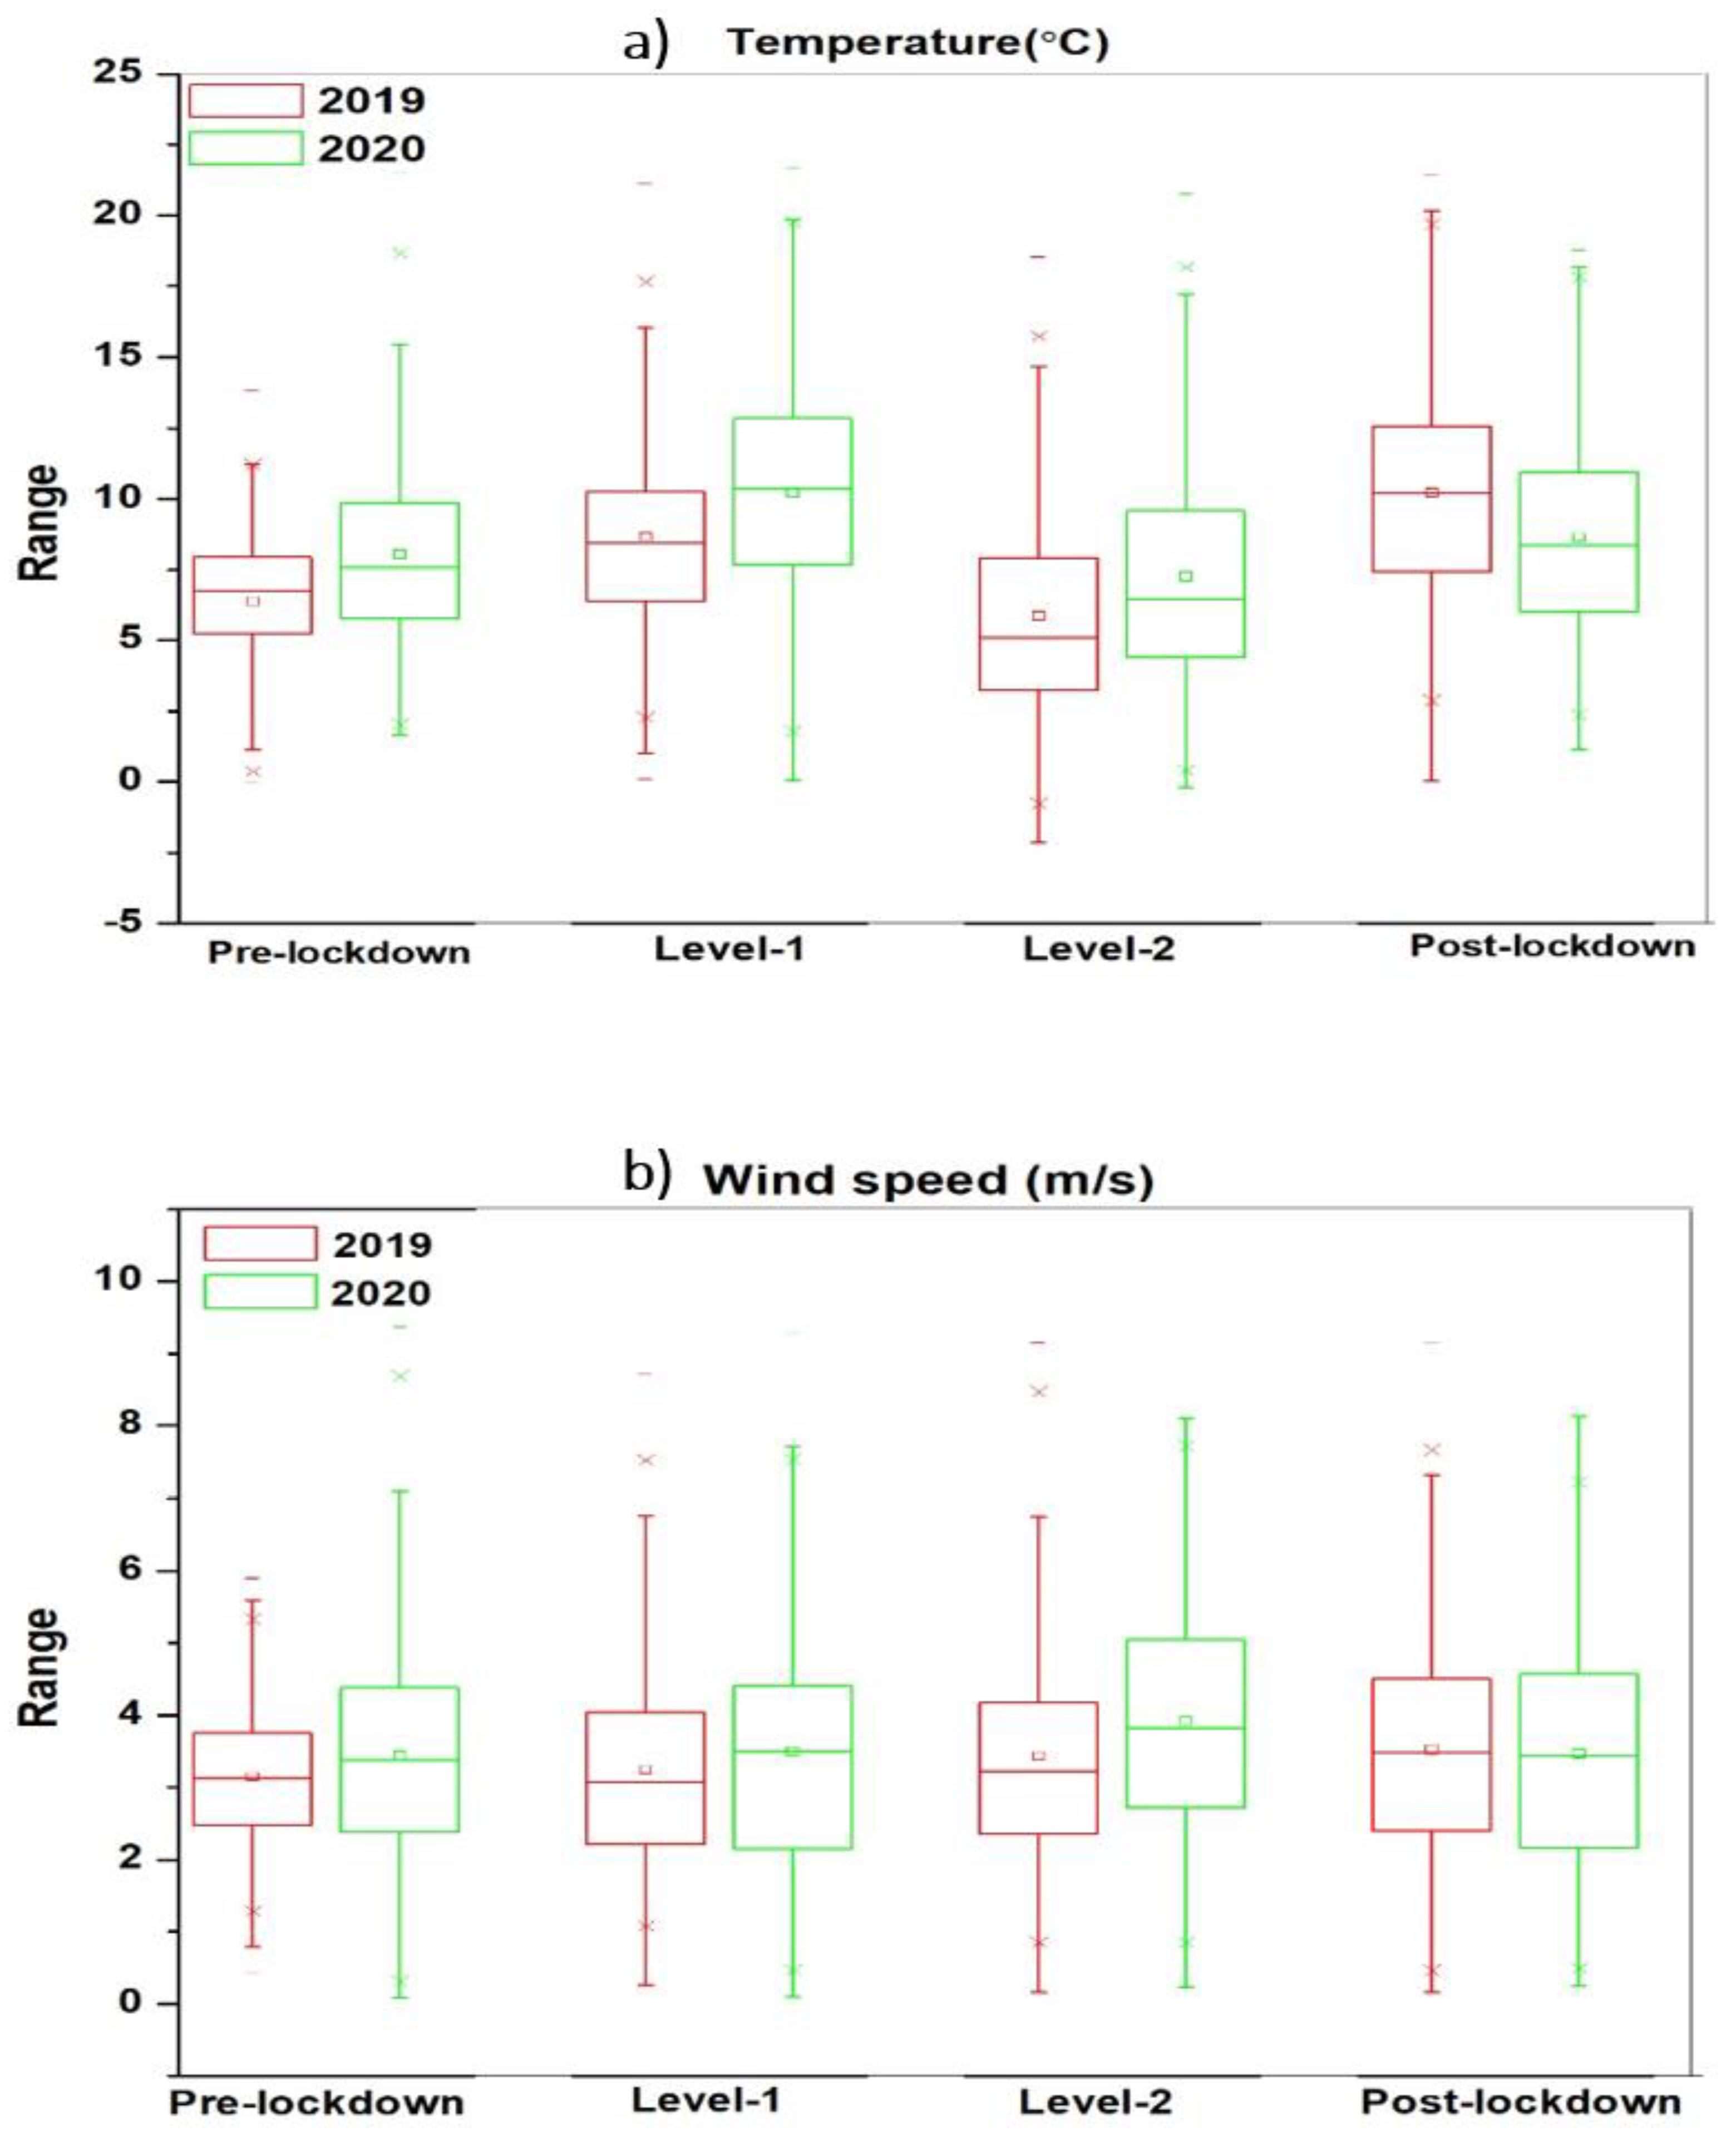
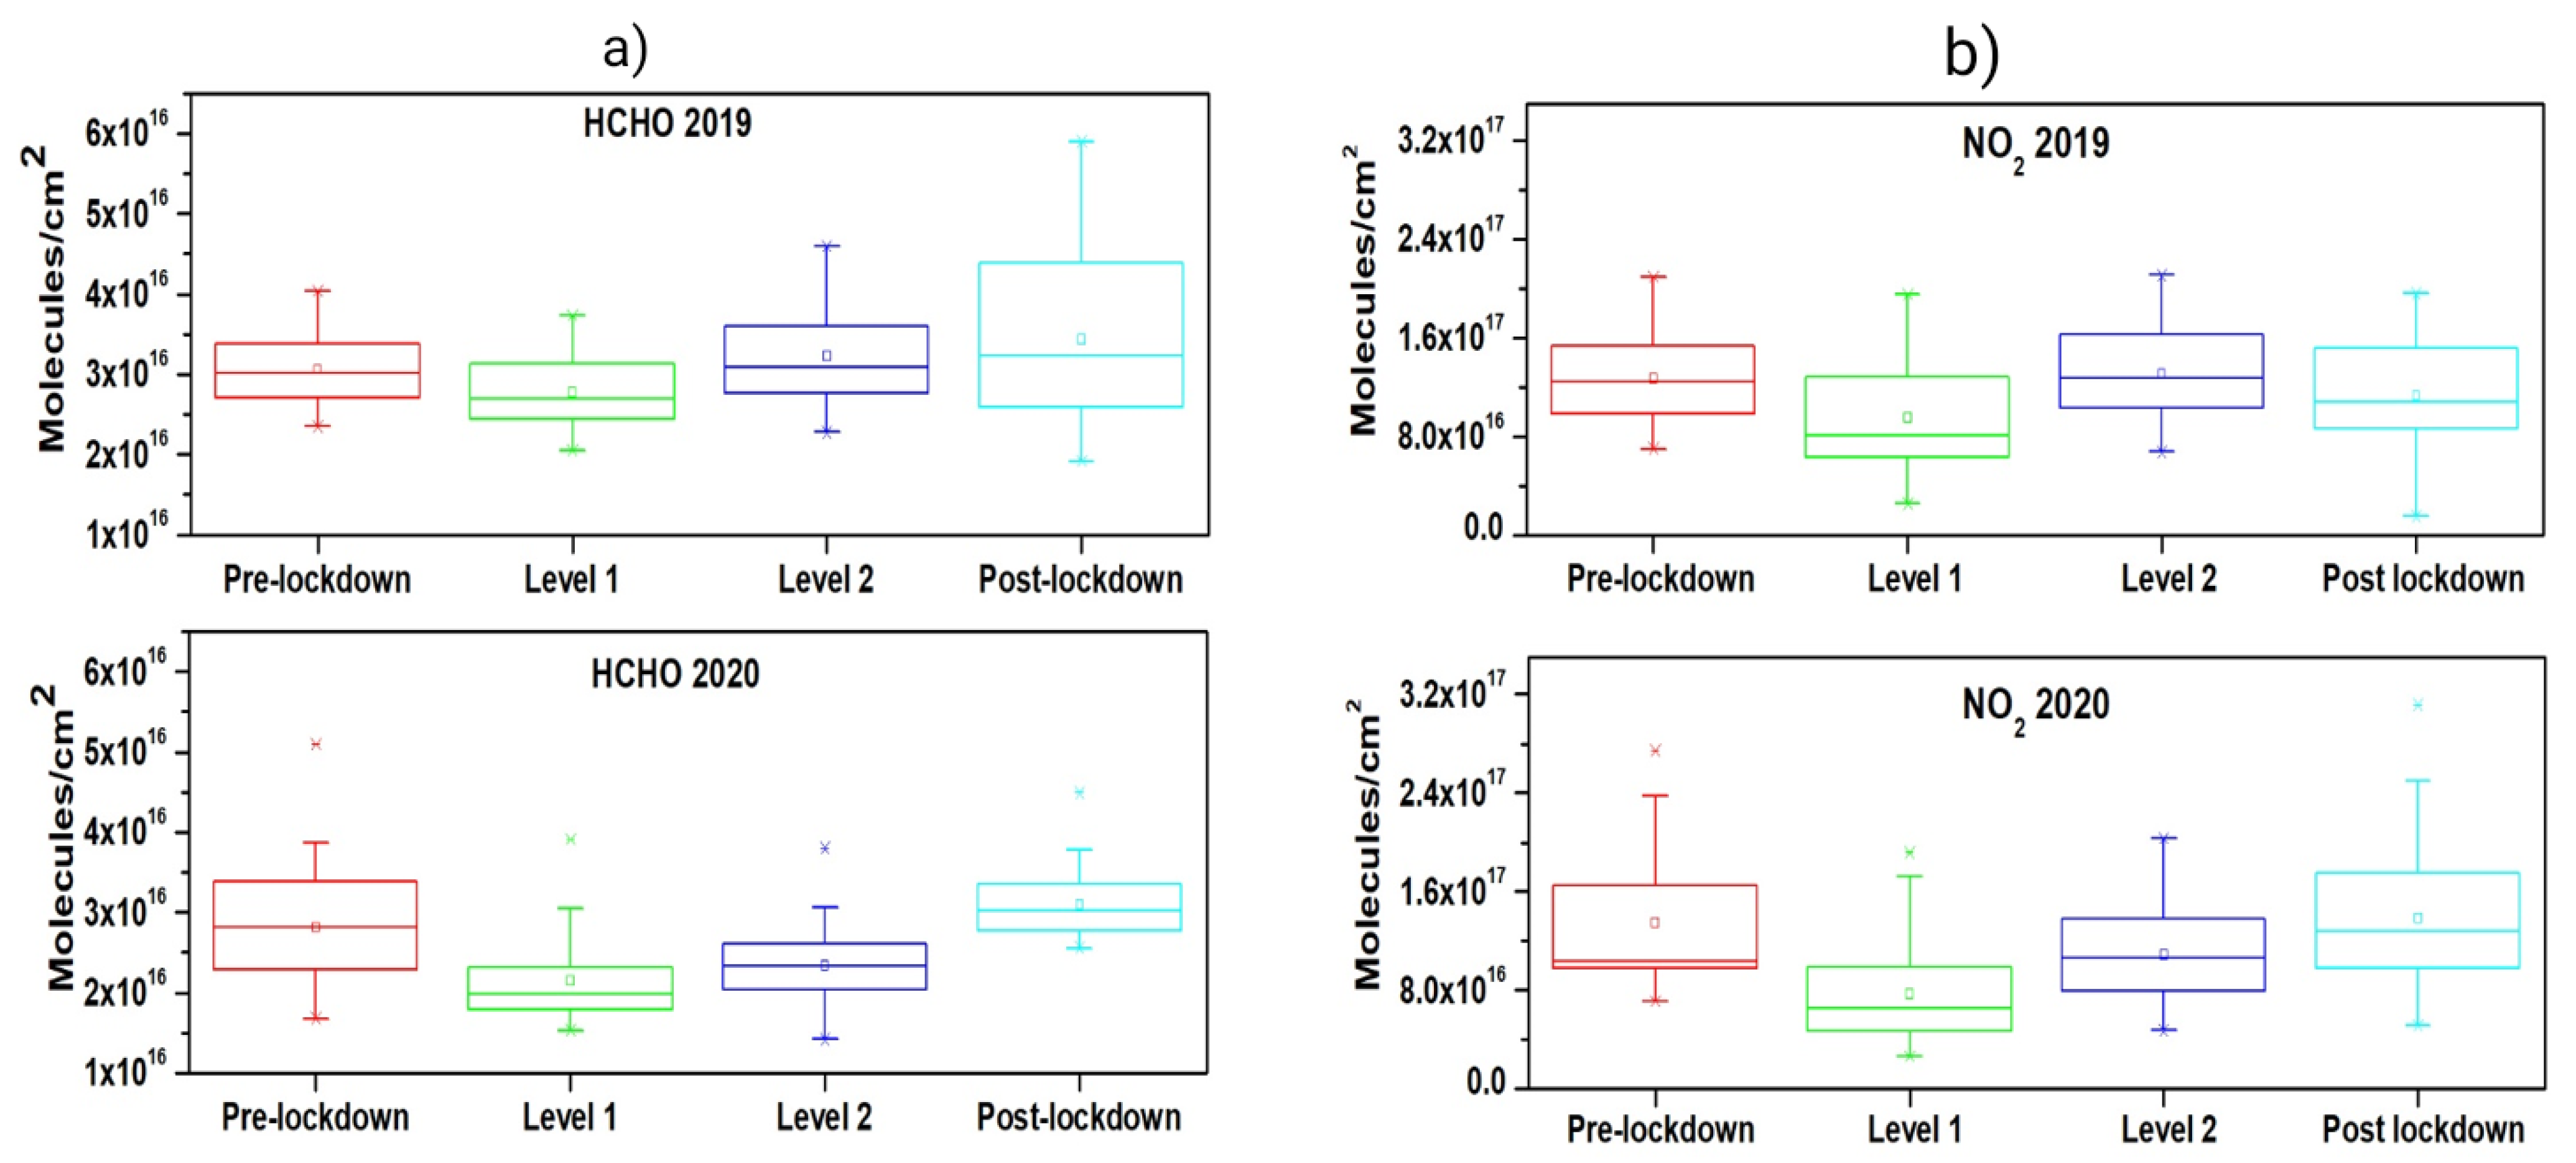
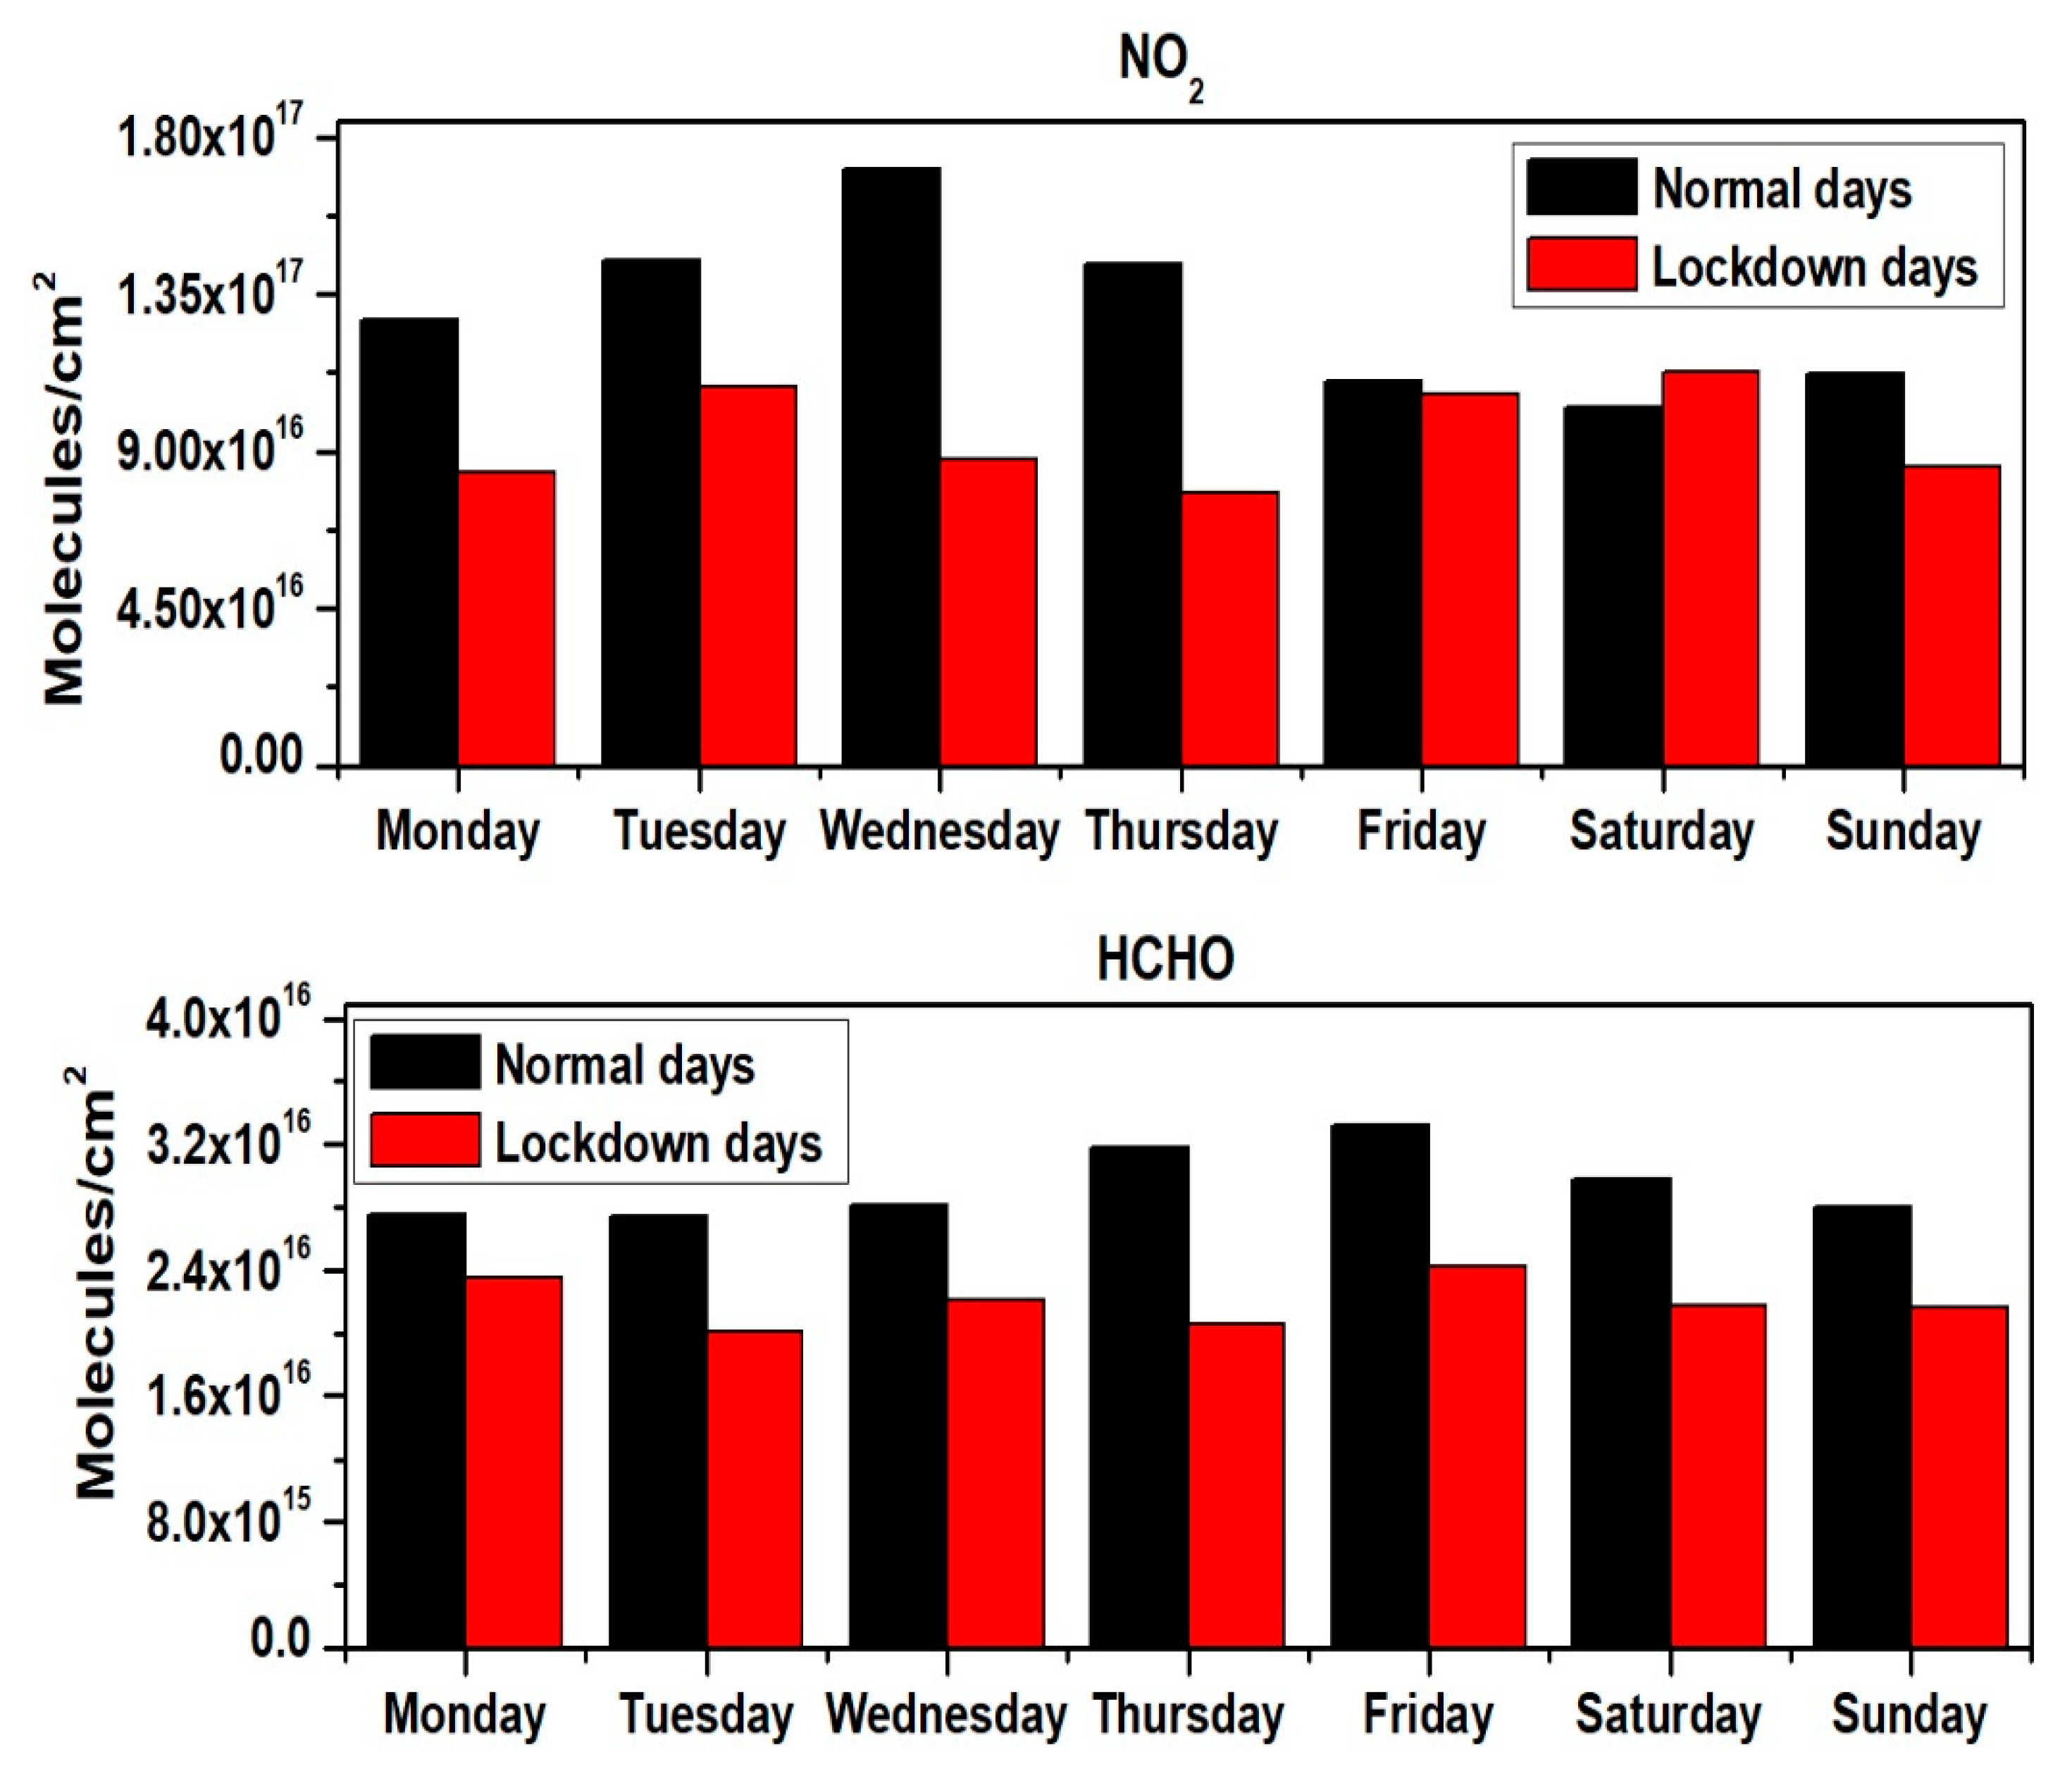
3.2. Impact of COVID-19 Lockdown
Weekly Cycle
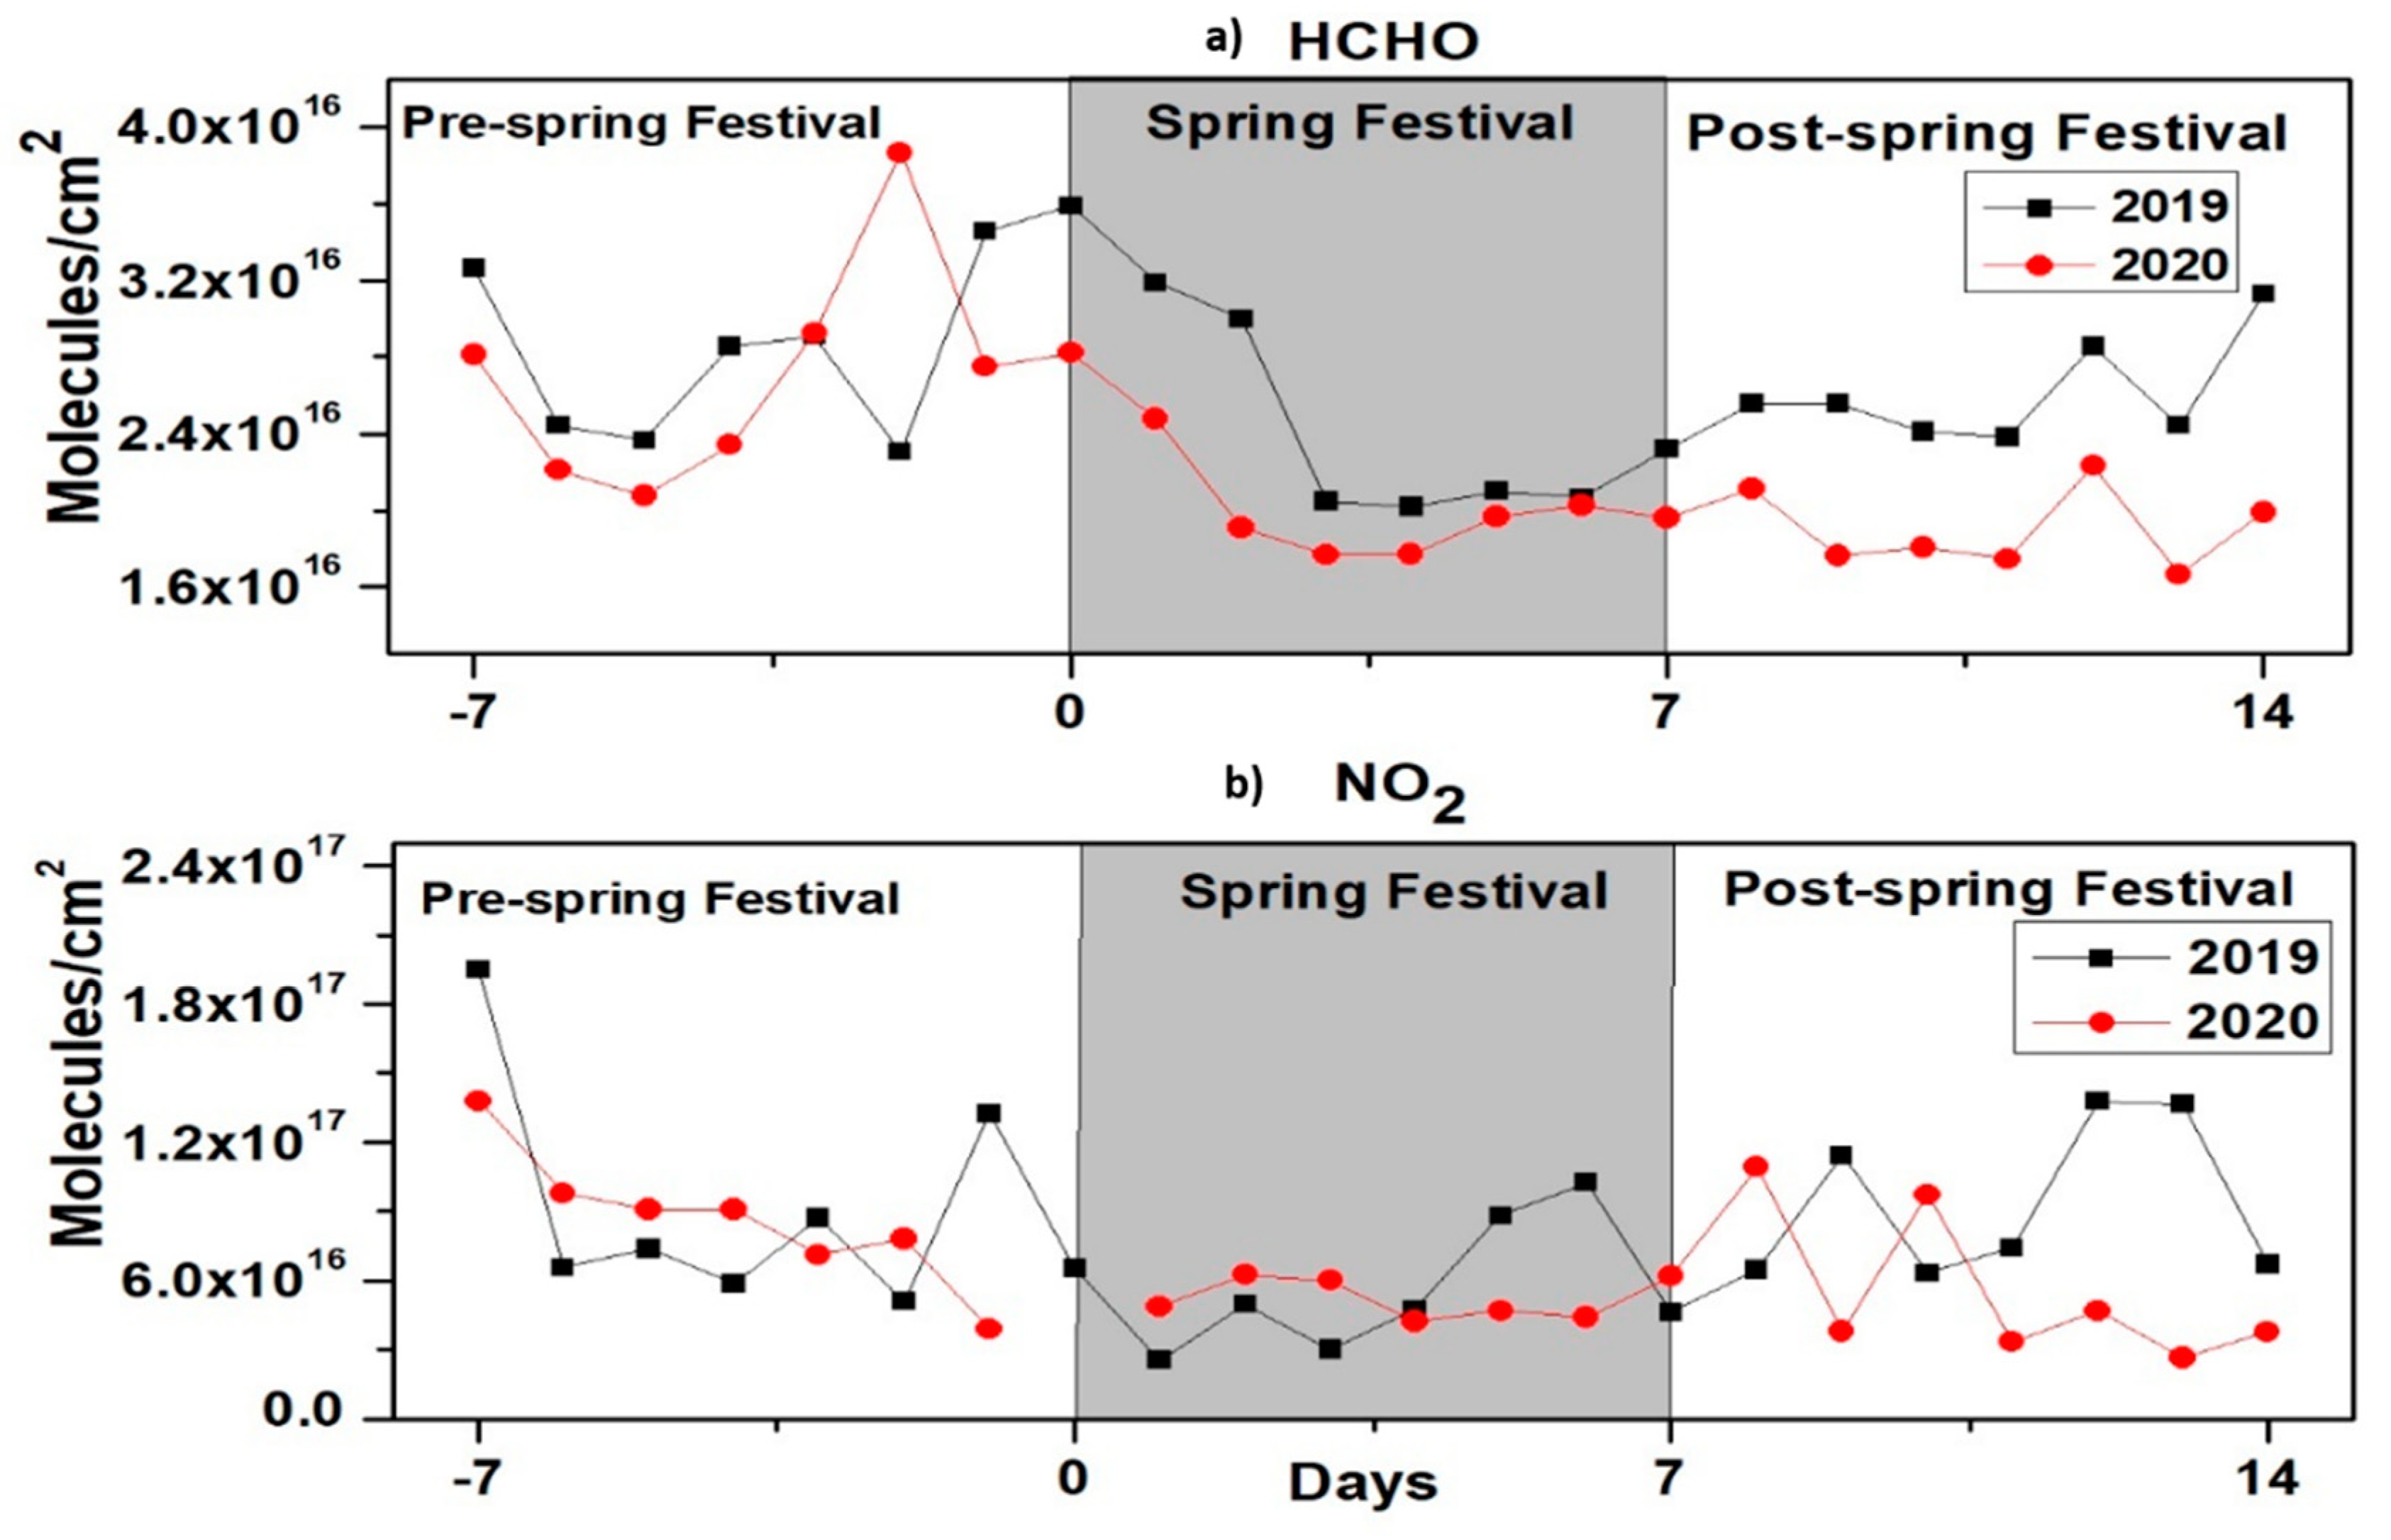
3.3. Spring Festival and Regional Transport
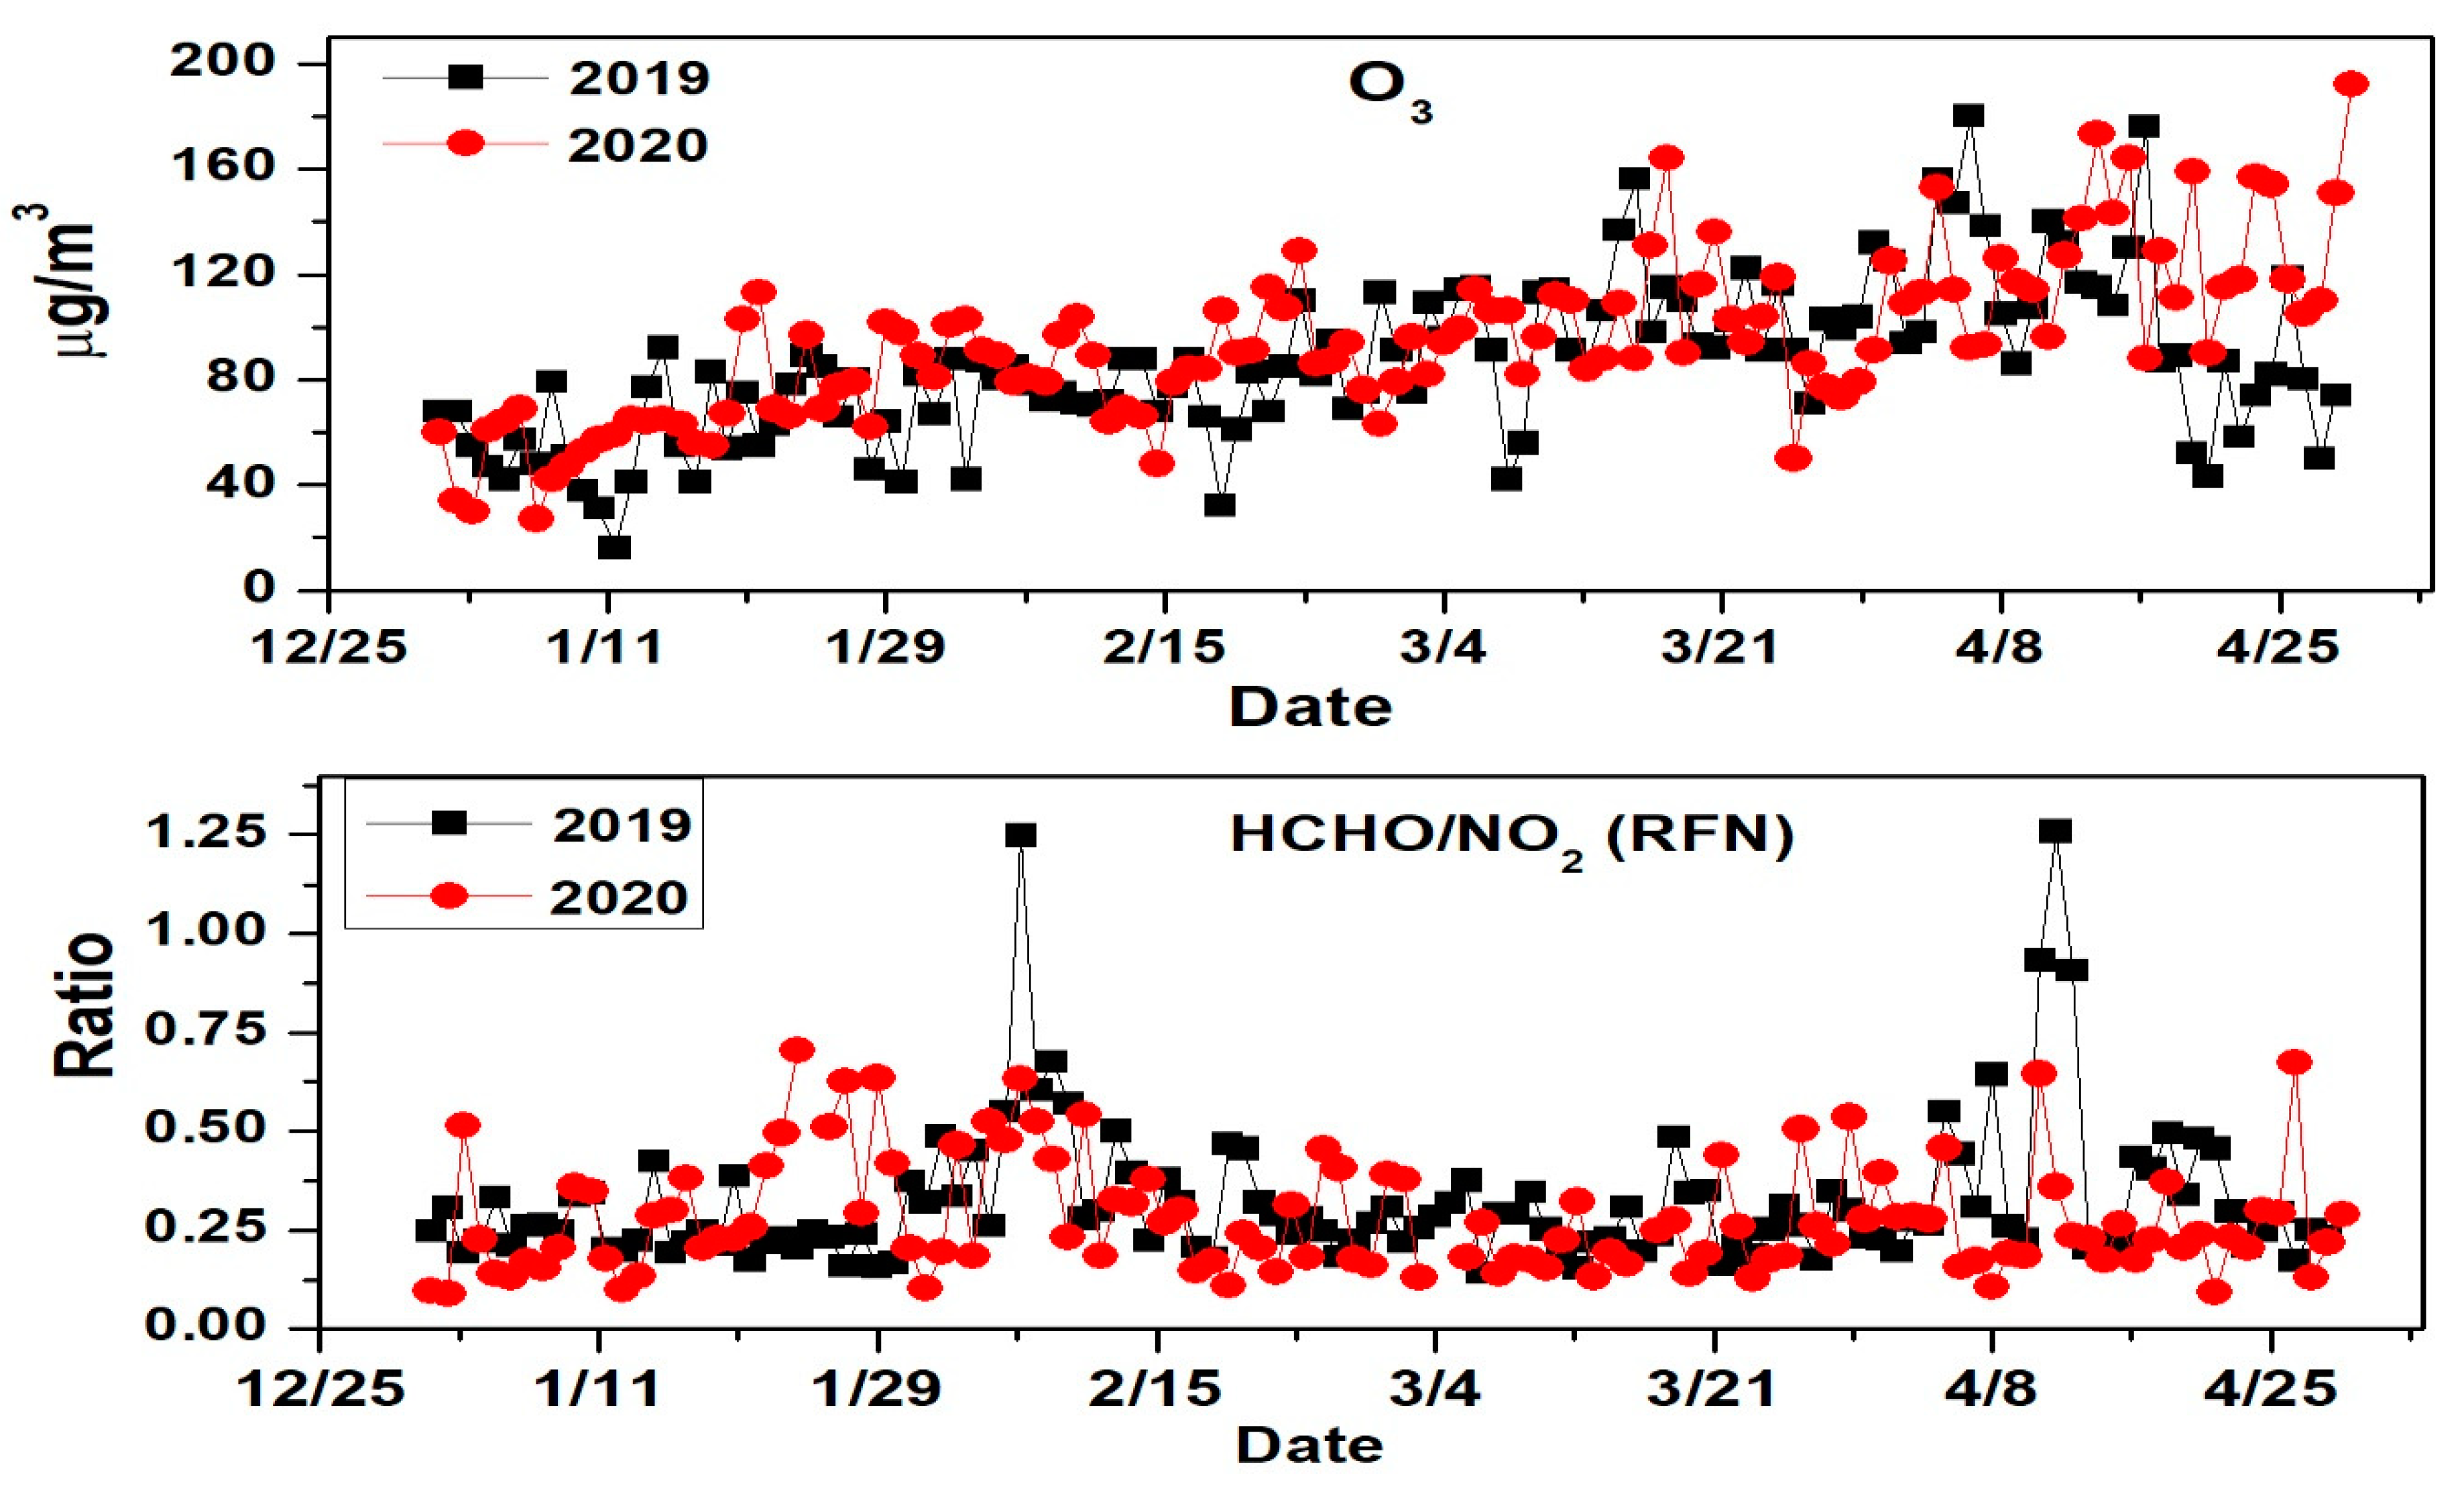
3.4. Trends in Ozone (O3) Concentration
4. Discussion
5. Conclusions
Author Contributions
Funding
Institutional Review Board Statement
Informed Consent Statement
Data Availability Statement
Acknowledgments
Conflicts of Interest
References
- Javed, Z.; Liu, C.; Khokhar, M.F.; Tan, W.; Liu, H.; Xing, C.; Ji, X.; Tanvir, A.; Hong, Q.; Sandhu, O.; et al. Ground-based MAX-DOAS observations of CHOCHO and HCHO in Beijing and Baoding, China. Remote Sens. 2019, 11, 1524. [Google Scholar] [CrossRef]
- Javed, Z.; Liu, C.; Ullah, K.; Tan, W.; Xing, C.; Liu, H. Investigating the effect of different meteorological conditions on MAX-DOAS observations of NO2 and CHOCHO in Hefei, China. Atmosphere 2019, 10, 353. [Google Scholar] [CrossRef]
- Crutzen, P.J. The role of NO and NO2 in the chemistry of the troposphere and stratosphere. Annu. Rev. Earth Planet Sci. 1979, 7, 443–472. [Google Scholar] [CrossRef]
- Crutzen, P.J. The influence of nitrogen oxides on the atmospheric ozone content. Q. J. R. Meteorol. Soc. 1970, 96, 320–325. [Google Scholar] [CrossRef]
- Jang, M.; Kamens, R.M. Characterization of secondary organic aerosol from the photooxidation of toluene in the presence of NOx and 1-propene. Environ. Sci. Technol. 2001, 35, 3626–3639. [Google Scholar] [CrossRef]
- Finlayson-Pitts, B.J.; Pitts, J.N. Chemistry of the Upper and Lower Atmosphere: Theory, Experiments and Applications; Academic Press: San Diego, CA, USA, 2000. [Google Scholar]
- Delmas, R.; Serça, D.; Jambert, C. Global inventory of NOx sources. Nutr. Cycl. Agroecosyst. 1997, 48, 51–60. [Google Scholar] [CrossRef]
- Beirle, S.; Boersma, K.F.; Platt, U.; Lawrence, M.G.; Wagner, T. Megacity emissions and lifetimes of nitrogen oxides probed from space. Science 2011, 333, 1737–1739. [Google Scholar] [CrossRef]
- Schreier, S.F.; Richter, A.; Peters, E.; Ostendorf, M.; Schmalwieser, A.W.; Weihs, P.; Burrows, J.P. Dual ground-based MAX-DOAS observations in Vienna, Austria: Evaluation of horizontal and temporal NO2, HCHO, and CHOCHO distributions and comparison with independent data sets. Atmos. Environ. X 2020, 5, 100059. [Google Scholar] [CrossRef]
- Sillman, S. The relation between ozone, NOx and hydrocarbons in urban and polluted 744 rural environments. Atmos. Environ. 1999, 33, 1821–1845. [Google Scholar] [CrossRef]
- Souri, A.H.; Nowlan, C.R.; Wolfe, G.M.; Lamsal, L.N.; Miller, C.E.C.; Abad, G.G.; Janz, S.J.; Fried, A.; Blake, D.R.; Weinheimer, A.J.; et al. Revisiting the effectiveness of HCHO/NO2 ratios for inferring ozone sensitivity to its precursors using high resolution airborne remote sensing observations in a high ozone episode during the KORUS-AQ campaign. Atmos. Environ. 2020, 224, 117341. [Google Scholar] [CrossRef]
- Richter, A.; Burrows, J.P.; Nusz, H.; Granier, C.; Niemeier, U. Increase in tropospheric nitrogen dioxide over China observed from space. Nat. Cell Biol. 2005, 437, 129–132. [Google Scholar] [CrossRef] [PubMed]
- Li, X.; Brauers, T.; Hofzumahaus, A.; Lu, K.; Li, Y.P.; Shao, M.; Wagner, T.; Wahner, A. MAX-DOAS measurements of NO2, HCHO and CHOCHO at a rural site in Southern China. Atmos. Chem. Phys. Discuss. 2013, 13, 2133–2151. [Google Scholar] [CrossRef]
- Feng, J.; Yu, H.; Su, X.; Liu, S.; Li, Y.; Pan, Y.; Sun, J.-H. Chemical composition and source apportionment of PM2.5 during Chinese Spring Festival at Xinxiang, a heavily polluted city in North China: Fireworks and health risks. Atmos. Res. 2016, 182, 176–188. [Google Scholar] [CrossRef]
- Tang, M.; Ji, D.-S.; Gao, W.-K.; Yu, Z.-W.; Chen, K.; Cao, W. Characteristics of air quality in Tianjin during the Spring Festival period of 2015. Atmos. Ocean Sci. Lett. 2016, 9, 15–21. [Google Scholar] [CrossRef]
- Wang, C.; Huang, X.-F.; Zhu, Q.; Cao, L.-M.; Zhang, B.; He, L.-Y. Differentiating local and regional sources of Chinese urban air pollution based on the effect of the Spring Festival. Atmos. Chem. Phys. 2017, 17, 9103–9114. [Google Scholar] [CrossRef]
- Yao, L.; Wang, D.; Fu, Q.; Qiao, L.; Wang, H.; Li, L.; Sun, W.; Li, Q.; Wang, L.; Yang, X. The effects of firework regulation on air quality and public health during the Chinese Spring Festival from 2013 to 2017 in a Chinese megacity. Environ. Int. 2019, 126, 96–106. [Google Scholar] [CrossRef]
- Chen, C.; Sun, Y.L.; Xu, W.Q.; Du, W.; Zhou, L.B.; Han, T.T.; Wang, Q.Q.; Fu, P.Q.; Wang, Z.F.; Gao, Z.Q. Characteristics and sources of submicron aerosols above the urban canopy (260 m) in Beijing, China, during the 2014 APEC summit. Atmos. Chem. Phys. 2015, 15, 12879–12895. [Google Scholar] [CrossRef]
- Ding, J.; van der A, R.J.; Mijling, B.; Levelt, P.F.; Hao, N. NOx emission estimates during the 2014 Youth Olympic Games in Nanjing. Atmos. Chem. Phys. 2015, 15, 9399–9412. [Google Scholar] [CrossRef]
- Okuda, T.; Matsuura, S.; Yamaguchi, D.; Umemura, T.; Hanada, E.; Orihara, H.; Tanaka, S.; He, K.; Ma, Y.; Cheng, Y.; et al. The impact of the pollution control measures for the 2008 Beijing Olympic Games on the chemical composition of aerosols. Atmos. Environ. 2011, 45, 2789–2794. [Google Scholar] [CrossRef]
- Xu, H.M.; Tao, J.; Ho, S.S.H.; Ho, K.F.; Cao, J.J.; Li, N.; Chow, J.C.; Wang, G.H.; Han, Y.M.; Zhang, R.J. Characteristics of fine particulate non-polar organic compounds in Guangzhou during the 16th Asian Games: Effectiveness of air pollution controls. Atmos. Environ. 2013, 76, 94–101. [Google Scholar] [CrossRef]
- Zhao, J.; Du, W.; Zhang, Y.; Wang, Q.; Chen, C.; Xu, W.; Han, T.; Wang, Y.; Fu, P.; Wang, Z. Insights into aerosol chemistry during the 2015 China Victory Day parade: Results from simultaneous measurements at ground level and 260m in Beijing. Atmos. Chem. Phys. 2017, 17, 3215. [Google Scholar] [CrossRef]
- Sharma, S.; Zhang, M.; Anshika; Gao, J.; Zhang, H.; Kota, S.H. Effect of restricted emissions during COVID-19 on air quality in India. Sci. Total Environ. 2020, 728, 138878. [Google Scholar] [CrossRef] [PubMed]
- Dantas, G.; Siciliano, B.; França, B.B.; da Silva, C.M.; Arbilla, G. The impact of COVID-19 partial lockdown on the air quality of the city of Rio de Janeiro, Brazil. Sci. Total Environ. 2020, 729, 139085. [Google Scholar] [CrossRef] [PubMed]
- Fan, C.; Li, Y.; Guang, J.; Li, Z.; Elnashar, A.; Allam, M.; de Leeuw, G. The Impact of the Control Measures during the COVID-19 Outbreak on Air Pollution in China. Remote Sens. 2020, 12, 1613. [Google Scholar] [CrossRef]
- Muhammad, S.; Long, X.; Salman, M. COVID-19 pandemic and environmental pollution: A blessing in disguise? Sci. Total Environ. 2020, 728, 138820. [Google Scholar] [CrossRef]
- Tobías, A.; Carnerero, C.; Reche, C.; Massagué, J.; Via, M.; Minguillón, M.C.; Alastuey, A.; Querol, X. Changes in air quality during the lockdown in Barcelona (Spain) one month into the SARS-CoV-2 epidemic. Sci. Total Environ. 2020, 726, 138540. [Google Scholar] [CrossRef]
- Collivignarelli, M.C.; Abbà, A.; Bertanza, G.; Pedrazzani, R.; Ricciardi, P.; Carnevale Miino, M. Lockdown for CoViD-2019 in Milan: What are the effects on air quality? Sci. Total Environ. 2020, 732, 139280. [Google Scholar] [CrossRef]
- Platt, U.; Stutz, J. Differential Optical Absorption Spectroscopy—Principles and Applications; Springer: Berlin/Heidelberg, Germany, 2008. [Google Scholar]
- Ma, J.Z.; Beirle, S.; Jin, J.L.; Shaiganfar, R.; Yan, P.; Wagner, T. Tropospheric NO2 vertical column densities over Beijing: Results of the first three years of ground-based MAXDOAS measurements (2008–2011) and satellite validation. Atmos. Chem. Phys. 2013, 13, 1547–1567. [Google Scholar] [CrossRef]
- Chan, K.L.; Hartl, A.; Lam, Y.F.; Xie, P.H.; Liu, W.Q.; Cheung, H.M.; Lampel, J.; Pöhler, D.; Li, A.; Xu, J.; et al. Observations of tropospheric NO2 using ground based MAX-DOAS and OMI measurements during the Shanghai World Expo 2010. Atmos. Environ. 2015, 119, 45–58. [Google Scholar] [CrossRef]
- Chan, K.L.; Wiegner, M.; Wenig, M.; Pöhler, D. Observations of tropospheric aerosols and NO2 in Hong Kong over 5 years using ground based MAX-DOAS. Sci. Total Environ. 2018, 619–620, 1545–1556. [Google Scholar] [CrossRef]
- Clémer, K.; Van Roozendael, M.; Fayt, C.; Hendrick, F.; Hermans, C.; Pinardi, G.; Spurr, R.; Wang, P.; De Mazière, M. Multiple wavelength retrieval of tropospheric aerosol optical properties from MAXDOAS measurements in Beijing. Atmos. Meas. Tech. 2010, 3, 863–878. [Google Scholar] [CrossRef]
- Cheng, Y.; Wang, S.; Zhu, J.; Guo, Y.; Zhang, R.; Liu, Y.; Zhang, Y.; Yu, Q.; Ma, W.; Zhou, B. Surveillance of SO2 and NO2 from ship emissions by MAX-DOAS measurements and the implications regarding fuel sulfur content compliance. Atmos. Chem. Phys. 2019, 19, 13611–13626. [Google Scholar] [CrossRef]
- Zhang, J.; Wang, S.; Guo, Y.; Zhang, R.; Qin, X.; Huang, K.; Wang, D.; Fu, Q.; Wang, J.; Zhou, B. Aerosol vertical profile retrieved from ground-based MAX-DOAS observation and characteristic distribution during wintertime in Shanghai, China. Atmos. Environ. 2018, 192, 193–205. [Google Scholar] [CrossRef]
- Danckaert, T.; Fayt, C.; Van Roozendael, M.; De Smedt, I.; Letocart, V.; Merlaud, A.; Pinardi, G. QDOAS Software User Manual; Belgian Institute for Space Aeronomy: Brussels, Belgium, 2013. [Google Scholar]
- Chance, K.; Kurucz, R.L. An improved high-resolution solar reference spectrum for earth’s atmosphere measurements in the ultraviolet, visible, and near infrared. J. Quant. Spectrosc. Radiat. Transf. 2010, 111, 1289–1295. [Google Scholar] [CrossRef]
- Meller, R.; Moortgat, G.K. Temperature dependence of the absorption cross sections of formaldehyde between 223 and 323 K in the wavelength range 225–375 nm. J. Geophys. Res. Space Phys. 2000, 105, 7089–7101. [Google Scholar] [CrossRef]
- Vandaele, A.C.; Hermans, C.; Simon, P.C.; Carleer, M.; Colin, R.; Fally, S.; Merienne, M.-F.; Jenouvrier, A.; Coquart, B. Measurements of the NO2 absorption cross-section from 42000 cm− 1 to 10000 cm− 1 (238–1000 nm) at 220 K and 294 K. J. Quant. Spectrosc. Radiat. Transf. 1998, 59, 171–184. [Google Scholar] [CrossRef]
- Fleischmann, O.C.; Hartmann, M.; Burrows, J.P.; Orphal, J. New ultraviolet absorption cross-sections of BrO at atmospheric temperatures measured by time-windowing Fourier transform spectroscopy. J. Photochem. Photobiol. A Chem. 2004, 168, 117–132. [Google Scholar] [CrossRef]
- Serdyuchenko, A.; Gorshelev, V.; Weber, M.; Chehade, W.; Burrows, J.P. High spectral resolution ozone absorption cross-sections–Part 2: Temperature dependence. Atmos. Meas. Tech. 2014, 7, 625–636. [Google Scholar] [CrossRef]
- Thalman, R.; Volkamer, R. Temperature dependent absorption cross-sections of O2–O2 collision pairs between 340 and 630 nm and at atmospherically relevant pressure. Phys. Chem. Chem. Phys. 2013, 15, 15371–15381. [Google Scholar] [CrossRef]
- Wagner, T.; Ibrahim, O.; Shaiganfar, R.; Platt, U. Mobile MAX-DOAS observations of tropospheric trace gases. Atmos. Meas. Tech. 2010, 3, 129–140. [Google Scholar] [CrossRef]
- Solomon, S.; Schmeltekopf, A.L.; Sanders, R.W. On the interpretation of zenith sky absorption measurements. J. Geophys. Res. Space Phys. 1987, 92, 8311–8319. [Google Scholar] [CrossRef]
- Celarier, E.A.; Brinksma, E.J.; Gleason, J.F.; Veefkind, J.P.; Cede, A.; Herman, J.R.; Ionov, D.; Goutail, F.; Pommereau, J.; Lambert, J. Validation of Ozone Monitoring Instrument nitrogen dioxide columns. J. Geophys. Res. Space Phys. 2008, 113. [Google Scholar] [CrossRef]
- Stein, A.F.; Draxler, R.R.; Rolph, G.D.; Stunder, B.J.B.; Cohen, M.D.; Ngan, F. NOAA’s HYSPLIT Atmospheric Transport and Dispersion Modeling System. Bull. Am. Meteorol. Soc. 2015, 96, 2059–2077. [Google Scholar] [CrossRef]
- Zhan, D.; Kwan, M.; Zhang, W.; Yu, X.; Meng, B.; Liu, Q. The driving factors of air quality index in China. J. Clean. Prod. 2018, 197, 1342–1351. [Google Scholar] [CrossRef]
- Cleveland, W.S.; Graedel, T.E.; Kleiner, B.; Warner, J.L. Sunday and workday variations in photochemical air pollutants in New Jersey and New York. Science 1974, 186, 1037–1038. [Google Scholar] [CrossRef]
- Stockwell, W.R.; Forkel, R. Ozone and volatile organic compounds: Isoprene, terpenes, aldehydes, and organic acids. In Trace Gas Exchange in Forest Ecosystems; Springer: Berlin/Heidelberg, Germany, 2002; pp. 257–276. [Google Scholar]
- Sillman, S. The use of NOy, H2O2, and HNO3 as indicators for ozone-NOx-hydrocarbon sensitivity in urban locations. J. Geophys. Res. Atmos. 1995, 100, 14175–14188. [Google Scholar] [CrossRef]
- Duncan, B.N.; Yoshida, Y.; Sillman, S.; Retscher, C.; Pickering, K.E.; Martin, R.V.; Celarier, E.A. The Sensitivity of US Surface Ozone Formation to NOx, and VOCs as Viewed from Space. In Proceedings of the 8th Annual CMAS Conference, Chapel Hill, NC, USA, 19–21 October 2009. [Google Scholar]
- Javed, Z.; Liu, C.; Khokhar, M.F.; Xing, C.; Tan, W.; Subhani, M.A.; Rehman, A. and Tanvir, A. Investigating the impact of Glyoxal retrieval from MAX-DOAS observations during haze and non-haze conditions in Beijing. J. Environ. Sci. 2019, 80, 296–305. [Google Scholar] [CrossRef]
- Li, L.; Li, Q.; Huang, L.; Wang, Q.; Zhu, A.; Xu, J.; Liu, Z.; Li, H.; Shi, L.; Li, R.; et al. Air quality changes during the COVID-19 lockdown over the Yangtze River Delta Region: An insight into the impact of human activity pattern changes on air pollution variation. Sci. Total Environ. 2020, 732, 139282. [Google Scholar] [CrossRef]
- Ali, S.M.; Malik, F.; Anjum, M.S.; Siddiqui, G.F.; Anwer, M.N.; Lam, S.S.; Nizami, A.S.; Khokhar, M.F. Exploring the linkage between PM2.5 levels and COVID-19 spread and its implications for socio-economic circles. Environ. Res. 2020, 193, 110421. [Google Scholar] [CrossRef]
- Kerimray, A.; Baimatova, N.; Ibragimova, O.P.; Bukenov, B.; Kenessov, B.; Plotitsyn, P.; Karaca, F. Assessing air quality changes in large cities during COVID-19 lockdowns: The impacts of traffic-free urban conditions in Almaty, Kazakhstan. Sci. Total Environ. 2020, 730, 139179. [Google Scholar] [CrossRef]
- Mahato, S.; Pal, S.; Ghosh, K.G. Effect of lockdown amid COVID-19 pandemic on air quality of the megacity Delhi, India. Sci. Total. Environ. 2020, 730, 139086. [Google Scholar] [CrossRef] [PubMed]
- Javed, Z.; Wang, Y.; Xie, M.; Tanvir, A.; Rehman, A.; Ji, X.; Xing, C.; Shakoor, A.; Liu, C. Investigating the Impacts of the COVID-19 Lockdown on Trace Gases Using Ground-Based MAX-DOAS Observations in Nanjing, China. Remote Sens. 2020, 12, 3939. [Google Scholar] [CrossRef]


| Parameters | Data Source | Trace Gases | |
|---|---|---|---|
| NO2 | HCHO | ||
| Wavelength (nm) | 337–370 | 325–350 | |
| HCHO | 297 K, [38] | ✓ | ✓ |
| SO2 | 298 K, [39] | X | ✓ |
| NO2 | 220 K, [39] | ✓ | ✓ |
| NO2 | 298 K, [39] | ✓ | ✓ |
| BrO | 223 K, [40] | ✓ | X |
| O3 | 223 K, [40] | ✓ | ✓ |
| O3 | 243 K, [41] | ✓ | X |
| O4 | 293 K, [42] | ✓ | ✓ |
| Ring | Calculated with QDOAS | ✓ | ✓ |
| Polynomial degree | 5 | 5 | |
| Parameter | 2019 (Avg ± Std) | 2020 (Avg ± Std) |
|---|---|---|
| Temperature/°C | 10.3 ± 5.2 | 10.9 ± 4.8 |
| Wind Speed/m·s−1 | 3.5 ± 1.4 | 3.7 ± 1.6 |
| Pressure/hPa | 1021.3 ± 7.1 | 1021.8 ± 5.4 |
| Species | Instrument | Year | Level-1 | Level-2 |
|---|---|---|---|---|
| NO2 | MAX-DOAS | 2019 | −24% | 1% |
| 2020 | −43% | −20% | ||
| HCHO | MAX-DOAS | 2019 | −6.62% | +2% |
| 2020 | −24% | −22% |
| Year | Pre-Spring Festival | Spring Festival | Post-Spring Festival |
|---|---|---|---|
| 2019 | 28 January–3 February | 4 February–10 February | 11 February–17 February |
| 2020 | 18 January–24 January | 25 January–31 January | 1 February–7 February |
Publisher’s Note: MDPI stays neutral with regard to jurisdictional claims in published maps and institutional affiliations. |
© 2021 by the authors. Licensee MDPI, Basel, Switzerland. This article is an open access article distributed under the terms and conditions of the Creative Commons Attribution (CC BY) license (http://creativecommons.org/licenses/by/4.0/).
Share and Cite
Tanvir, A.; Javed, Z.; Jian, Z.; Zhang, S.; Bilal, M.; Xue, R.; Wang, S.; Bin, Z. Ground-Based MAX-DOAS Observations of Tropospheric NO2 and HCHO During COVID-19 Lockdown and Spring Festival Over Shanghai, China. Remote Sens. 2021, 13, 488. https://doi.org/10.3390/rs13030488
Tanvir A, Javed Z, Jian Z, Zhang S, Bilal M, Xue R, Wang S, Bin Z. Ground-Based MAX-DOAS Observations of Tropospheric NO2 and HCHO During COVID-19 Lockdown and Spring Festival Over Shanghai, China. Remote Sensing. 2021; 13(3):488. https://doi.org/10.3390/rs13030488
Chicago/Turabian StyleTanvir, Aimon, Zeeshan Javed, Zhu Jian, Sanbao Zhang, Muhammad Bilal, Ruibin Xue, Shanshan Wang, and Zhou Bin. 2021. "Ground-Based MAX-DOAS Observations of Tropospheric NO2 and HCHO During COVID-19 Lockdown and Spring Festival Over Shanghai, China" Remote Sensing 13, no. 3: 488. https://doi.org/10.3390/rs13030488
APA StyleTanvir, A., Javed, Z., Jian, Z., Zhang, S., Bilal, M., Xue, R., Wang, S., & Bin, Z. (2021). Ground-Based MAX-DOAS Observations of Tropospheric NO2 and HCHO During COVID-19 Lockdown and Spring Festival Over Shanghai, China. Remote Sensing, 13(3), 488. https://doi.org/10.3390/rs13030488