Article

Inversion of Terrain Slope and Roughness with Satellite Laser Altimeter Full-Waveform Data Assisted by Shuttle Radar Topographic Mission

1
School of Electronic Information, Wuhan University, Wuhan 430072, China
2
Land Satellite Remote Sensing Application Center, Ministry of Natural Resources of China, Beijing 100048, China
*
Author to whom correspondence should be addressed.
Remote Sens. 2021, 13(3), 424; https://doi.org/10.3390/rs13030424
Submission received: 9 December 2020 / Revised: 13 January 2021 / Accepted: 22 January 2021 / Published: 26 January 2021

Abstract

:
Slope and roughness are basic geophysical properties of terrain surface, and also sources of error in satellite laser altimetry systems. The full-waveform satellite laser altimeter records the complete echo waveform backscattered from the target surface worldwide, so it may be used for both range measurement and inversion analysis of geometric parameters of the target surface. This paper proposes a new method for inversion of slope and roughness of the bare or near-bare terrain within laser footprint using full-waveform satellite laser altimeter data, Shuttle Radar Topographic Mission (SRTM) and topographic prior knowledge. To solve the non-uniqueness of the solution to the inversion problem, this paper used the SRTM and airborne Light Detection and Ranging (LiDAR) data in North Rhine-Westphalia, Germany, to establish a priori hypothesis about real information of topographic parameters. Then, under the constraints of prior hypothesis, the theoretical formulas and rules for slope and roughness inversion using the pulse-width broadening knowledge of satellite laser altimeter echo full-waveform were developed. Finally, based on the full-waveform data from the Geoscience Laser Altimeter System (GLAS) that was borne on ICE, Cloud, and Land Elevation Satellite (ICESat) and SRTM in the West Valley City, Utah and Jackson City, Wyoming, United States of America, the inversion was carried out. The experiment compares the results of proposed method with those of existing ones and evaluates the inversion results using high precision terrain slope and roughness information, which indicates that our proposed method is superior to the state-of-the-art methods, and the inversion accuracy for slope is 0.667 ° (Mean Absolute Error, MAE) and 1.054 ° (Root Mean Square Error, RMSE), the inversion accuracy for roughness is 0.171 m (MAE) and 0.250 m (RMSE).

Graphical Abstract

1. Introduction

Satellite Laser altimeters provide a new and active remote sensing method to obtain the topographic information of Earth, Moon, Mars and other planets from several hundred kilometers [1,2,3,4]. By measuring the round-trip flight time of the laser pulse, combined with the position and attitude of satellite platform, the target surface elevation can be determined at decimeter or even centimeter accuracy level [5].
After the satellite laser altimeter emits the laser pulse, several backscattered returns of the target surface can be obtained which contain abundant information of profile elevation, and the exact number of the returns is dependent on the target surface geometry [6]. The full-waveform satellite laser altimeter is able to record the complete waveform of the backscattered signal echo. Thus, in addition to range measurements, further physical properties of objects included in the diffraction cone, such as slope, roughness and reflectance may be derived with an analysis of the backscattered waveforms [7]. The Geoscience Laser Altimeter System (GLAS) on board on the NASA’s Ice, Cloud, and land Elevation Satellite (ICESat) was the first orbiting full-waveform satellite laser altimeter for earth observation, launched on 12 January 2003, and had completed its mission in October 2009 [8,9]. Further full-waveform laser altimeters for earth observation include Global Ecosystem Dynamics Investigation (GEDI, launched on 5 December 2018) [10], Gaofen-7 (launched on 3 November 2019, China) and Terrestrial Ecosystem Carbon Monitoring Satellite (To be launched, China).
Slope and roughness are two major topographic parameters of the terrain surface and have a wide range of applications in the field of planetary science. For example, in the field of geological hazards, the terrain slope has the strongest impacts on the slope stability and the occurrence rates of landslide and debris flow and has been a basic data for simulation and evaluation of regional landslide hazards [11]. Research on the glacial fluctuation shows that the surface roughness of glaciers is an important component of energy balance models and meltwater runoff estimates through its influence on turbulent fluxes of latent and sensible heat [12]. During the landing of space probe on the extraterrestrial planet, such as China’s Chang’e-4 Probe on the moon, landing site selection requires the terrain slope and roughness information of the planet surface as a reference [13]. Terrain slope and roughness information are also necessary in estimation of forest canopy height and aboveground biomass using the full-waveform satellite laser altimeter data, which is complicated by the pulse width broadening that occurs in received echo waveform when the laser footprint illuminates vegetation on a sloped and rough surface [14].
Besides the above scientific research and engineering practice, terrain slope and roughness are also the significant error sources in the range measurements of satellite laser altimetry [15] and are closely related to the potential elevation errors of laser footprint geolocation position [16]. Given a fully-calibrated campaign of ICESat, for instance, surface slope of 3° may result in elevation errors of laser footprint geolocation of up to 22.5 cm [16], which is not negligible considering the further applications of satellite laser data as ground control points in continental or even global mapping missions or evaluation data of the global terrain elevation models [17,18]. Thus, the precision surface slope and roughness are required before making an evaluation of the satellite laser ranging accuracy and the geolocation errors [15,19,20].
Along with the publicly available global (or near-global) digital elevation models, such as SRTM [21], topographic parameter inversion based on full-waveform satellite laser altimeter data is one of the few effective ways for acquisition of topographic parameters over large scale areas. Many researches have been carried out towards this problem. Due to the incapability to distinguish the contribution of terrain slope and roughness to the pulse width broadening of received waveform, ICESat/GLAS Algorithm Theoretical Basis Documents (hereafter referred to as GLAS-ATBD) assumed that the terrain surface is completely smooth when inverting the slope, and the terrain surface is horizontal when inverting the roughness [22]. Such an extreme assumption does not conform to the actual case, leading to an approximate result of terrain slope and roughness. To measure the Greenland ice sheet surface and roughness using ICESat/GLAS data, Yi and others used elevation difference and ground distance between the adjacent laser footprints to calculate the ice sheet slope and the elevation changes among multiple adjacent laser footprints to calculate the ice sheet roughness [23]. With the large ground distance between adjacent laser footprints in the along-track and cross-track direction, surface slope at 1 and 10 km scale were separately measured in both directions, and surface roughness at 10 km scale was measured in cross-track direction; thus, the slope and roughness at finer scale of less than 1 km could not be acquired. To estimate within-footprint terrain slope, Nie and others proposed a new model based on overlapping footprints of GLAS data, deriving the mathematical expressions between the projection extent of laser footprint in surface aspect and the ground vertical change which is estimated using the two regression models of waveform width and waveform extent to the ground vertical change derived from the Airborne Topographic Mapper (ATM) [24]. The whole process involved the collation and selection of laser data with overlapping areas acquired at multiple times; thus, the data acquisition times may have a large interval, and the surface roughness contribution to the waveform width broadening was neglected. Xie and others [25] made a comparison of surface slopes extracted from ICESat/GLAS waveform data and High resolution Digital Elevation Model (DEM), and the slopes are retrieved by establishing the trigonometric geometric model of terrain surface within the laser footprint [26]. However, the roughness of the terrain surface was ignored. Grigsby and others [27] proposed a new method to derive surface roughness product for the Greenland Ice Sheet using ICESat/GLAS data. Firstly, they established a library of simulated waveform and its associated terrain surface using ICESat instrument specifications and high-resolution digital surface model. Then by matching the ICESat/GLAS waveform with the waveforms in the library using morphological method, the roughness of corresponding terrain surface of the best match is the final result. This method is dependent of the accuracy of waveform simulation, and different terrains may result in the echo waveform output with similar morphology. Therefore, it is difficult to indirectly and accurately describe the surface geometric information using waveform morphological similarity matching. The non-uniqueness of solutions to inversion problems in geosciences is mostly due to the inadequate measurements or imprecise physical models. Imposition of a priori constraints is a common approach to improve such drawbacks. To invert the roughness of the Tibet Plateau using ICESat/GLAS full-waveform data, Shi and others used the Advanced Spaceborne Thermal Emission and Reflection Radiometer (ASTER) Global Digital Elevation model (GDEM) with 1 arc second resolution as a priori knowledge, assuming that the slope calculated based on GDEM is truth of terrain slope while inverting the terrain roughness using the theoretical model for return pulse signal [28]. However, slope calculated using coarse resolution of 1 arc second, GDEM, may be far from the true value of the surface slope, and the final inversion results were variable compared with GDEM derived roughness.
In this paper, a new method for inversion of the slope and roughness of bare or near-bare terrain within the laser footprint using ICESat/GLAS full-waveform data, SRTM and topographic prior knowledge is proposed. Firstly, to deal with the non-uniqueness of the solution to the inversion problem, a priori hypothesis about real terrain slope and roughness was established using the SRTM digital elevation data and airborne lidar data in North Rhine-Westphalia, Germany. Then, the theoretical formulas and rules for slope and roughness inversion using the pulse-width broadening knowledge of satellite laser altimeter full-waveform echo under the constraints of prior hypothesis were developed. Finally, based on the ICESat/GLAS full-waveform data and SRTM in the West Valley City, Utah and Jackson City, Wyoming, United States of America, the inversion of the terrain slope and roughness within the laser footprint was carried out, and the inversion results were evaluated using the airborne lidar data derived topographic parameters.

2. Materials and Methods

2.1. Study Area

The study area can be divided into two categories: one for topographic prior knowledge establishment in North Rhine-Westphalia, Germany, and the other for final inversion experiment results evaluation in West Valley City, Utah and Jackson City, Wyoming, United States of America.
The North Rhine-Westphalia, Germany (50 ° 21′–52 ° 30′ N, 6°–9°23′ E, Figure 1a) covers about 34,080 km2 and contains a variety of terrains such as plains, hills, mountains and valleys. Its elevation varies from 293 m below sea level at Hambach opencast mine to 843.2 m above sea level at Langenberg and has a mean value of 109 m above sea level. The area also shows a diversity of terrain slope and roughness. The terrain slope ranges from 0 ° to 44 ° , with a mean value of 1.4 ° . The terrain roughness varies from 0 m to 19.42 m, with a mean value of 0.5 m.
The part areas of West Valley City, Utah and Jackson City, Wyoming, were selected at which the final topographic parameters inversion results were evaluated. The selected area in West Valley City (Figure 1b) ranges from 40 ° 28′ N to 40 ° 47′ N and 112 ° 1′ W to 111 ° 57′ W. The elevation varies from 1275 m to 1462 m and has a mean value of 1367 m. The terrain slope ranges from 0 ° to 16 ° , and the terrain roughness varies from 0 m to 4.2 m. The selected area in Jackson City (Figure 1c) ranges from 43 ° 18′ N to 43 ° 58′ N and 110 ° 85′ W to 110 ° 80′ W. The elevation varies from 1830 m to 2491 m and has a mean value of 1922 m. The terrain slope ranges from 0 ° to 40 ° , and the terrain roughness varies from 0 m to 4.8 m.

2.2. Data Collections

2.2.1. ICESat/GLAS Data

The ICESAT/GLAS contains two channels, at 1064 and 532 nm, with a ground footprint diameter of about 70 m and spaced by 172 m in the along-track direction. The first channel is used for surface altimetry and dense cloud height measurement and the second for vertical distribution of clouds and aerosols detection. There are three lasers on ICESat/GLAS. Laser 1 started to work in February 2003, and it failed shortly after its launch. To maximize the longevity of the remaining two GLAS lasers, Lasers 2 and 3 were re-planned to operate for three 33-day campaigns per year. Both the GLAS laser emitter and receiver work at 40 HZ frequency, and the receiver records the echo-waveform in 200 bins over sea and 544 bins over land [4,8,9]. The ICESat/GLAS laser footprint is vertically referenced to the Topography Experiment (TOPEX)/Poseidon ellipsoid, and its horizontal location shows a tiny difference only in the latitude direction with that in World Geodetic System 1984 (WGS 84), which can be considered unchanged after coordinate transformation [29].
The ICESat/GLAS data used in this paper can be divided into two categories. To establish the prior hypothesis about the real terrain slope and roughness, 21,830 ICESat/GLAS laser shots (Figure 1a), acquired across full campaign of ICESat/GLAS, were used to extract the existing terrain data of SRTM and airborne lidar data within the footprint (21,830 pairs), from which 4933 pairs of extracting terrain data were identified as the bare (or near-bare) ground terrain elevation model. A total of 437 ICESat/GLAS laser shots acquired from campaign L3e to L3j, from February 2006 to March 2008 (Figure 1b,c), were used to derive the terrain slope and roughness in the final inversion experiment. Among the 15 available GLAS products (from GLAH01 to GLAH15) provided by National snow and Ice Data Center (NSIDC), GLAH01 [30] (L1A Global Altimetry), GLAH05 [31] (L1B Global Waveform-based Range Corrections) and GLAH14 [32] (L2 Global Land Surface Altimetry) are used in this paper.

2.2.2. SRTM Data

Launched in February 2000, the Shuttle Radar Topography Mission (SRTM) [33] was a joint endeavor of NASA, the National Geospatial-Intelligence Agency (NGA), and the German and Italian space agencies. It used dual radar antennas (Radar-C/X) to acquire interferometric radar data from 56 ° south latitude to 60 ° north latitude worldwide, processed to digital topographic data at 1 arc second resolution, which achieved a better horizontal and vertical accuracy than mission specifications of 20 m (circular error at 90% confidence) and 16 m (linear error at 90% confidence), respectively. In September 2014, the NGA announced that SRTM(Radar-C) digital elevation model (more precisely, digital surface model) at 1 arc-second (SRTMGL1) [21] was to be released gradually by the beginning of 2015. The SRTMGL1 DEMs are horizontally referenced to the WGS84 and vertically referenced to the Earth Gravitational Model 1996 (EGM96) [34].
In this paper, the SRTMGL1 data was firstly used as one of the sources to establish the prior hypothesis in Section 2.3.3, and then, it was combined with the ICESat/GLAS full waveform to invert the terrain slope and roughness within the laser footprint in Section 3.

2.2.3. Airborne Lidar Data

This paper uses the high resolution and precision publicly available lidar data [35] of North Rhine-Westphalia (hereafter referred to as NRW-DEM) as another data source for establishing the prior hypothesis in Section 2.3.3. The data was collected by the state government of North Rhine-Westphalia, and had been released to the public from 1 January 2017 [36]. The NRW-DEM are horizontally referenced to a projected coordinate reference system of European Terrestrial Reference System 1989 (ETRS89_UTM32N) and vertically referenced to the DE_DHHM2016_NH [37]. According to the metadata, the average resolution of the DEM data is 1 m, and the horizontal and vertical accuracy are 0.5 m and 0.2 m, respectively.
The airborne Lidar data [38] in West Valley City, Utah, United States of America (hereafter referred to as WVC-DEM) was used to evaluate the final inversion results in Section 3. The dataset was acquired by the state of Utah and its partners using a Leica ALS70 sensor on a piper Navajo aircraft from October 2013 to 31 May 2014.
The airborne Lidar data [39] in Jackson City, Wyoming, United States of America (hereafter referred to as JKS-DEM) was also used to evaluate the final inversion results in Section 3. The dataset was provided by the Teton Conservation District and collected by Sanborn using a Leica ALS50 sensor from 13 August 2008 to 18 August 2008.
Both the WVC-DEM and JKS-DEM are horizontally referenced to the projected coordinate reference system of North American Datum of 1983 (NAD83_UTM12N) and vertically referenced to North American Vertical Datum of 1988 (NAVD 88). The point cloud density of WVC-DEM and JKS-DEM are 7.33 points/m2 and 2.62 points/m2, respectively.

2.2.4. National Land Cover Database (NCLD)

The National Land Cover Database (NLCD) products were released by the U.S. Geological survey (USGS) and its partners and had provided spatially explicit and reliable information of United Nation’s land cover and land cover change [40]. The Database is stored in raster format of 30 m spatial resolution, with cells classified into one of 20 land cover classes. The NLCD 2006 Land Cover were used to exclude the GLAS waveforms returned from vegetation or multiple height features in the final inversion experiments.
Given the time discrepancies among the above datasets may have several years span, we assumed that the topographic changes of bare or near-bare terrain surface within the laser footprint remains almost unchanged except that there were vast movements of the Earth’s crust, such as earthquake, or human geomorphic activity, such as surface mining, road construction occurring in this area.

2.3. Methodology

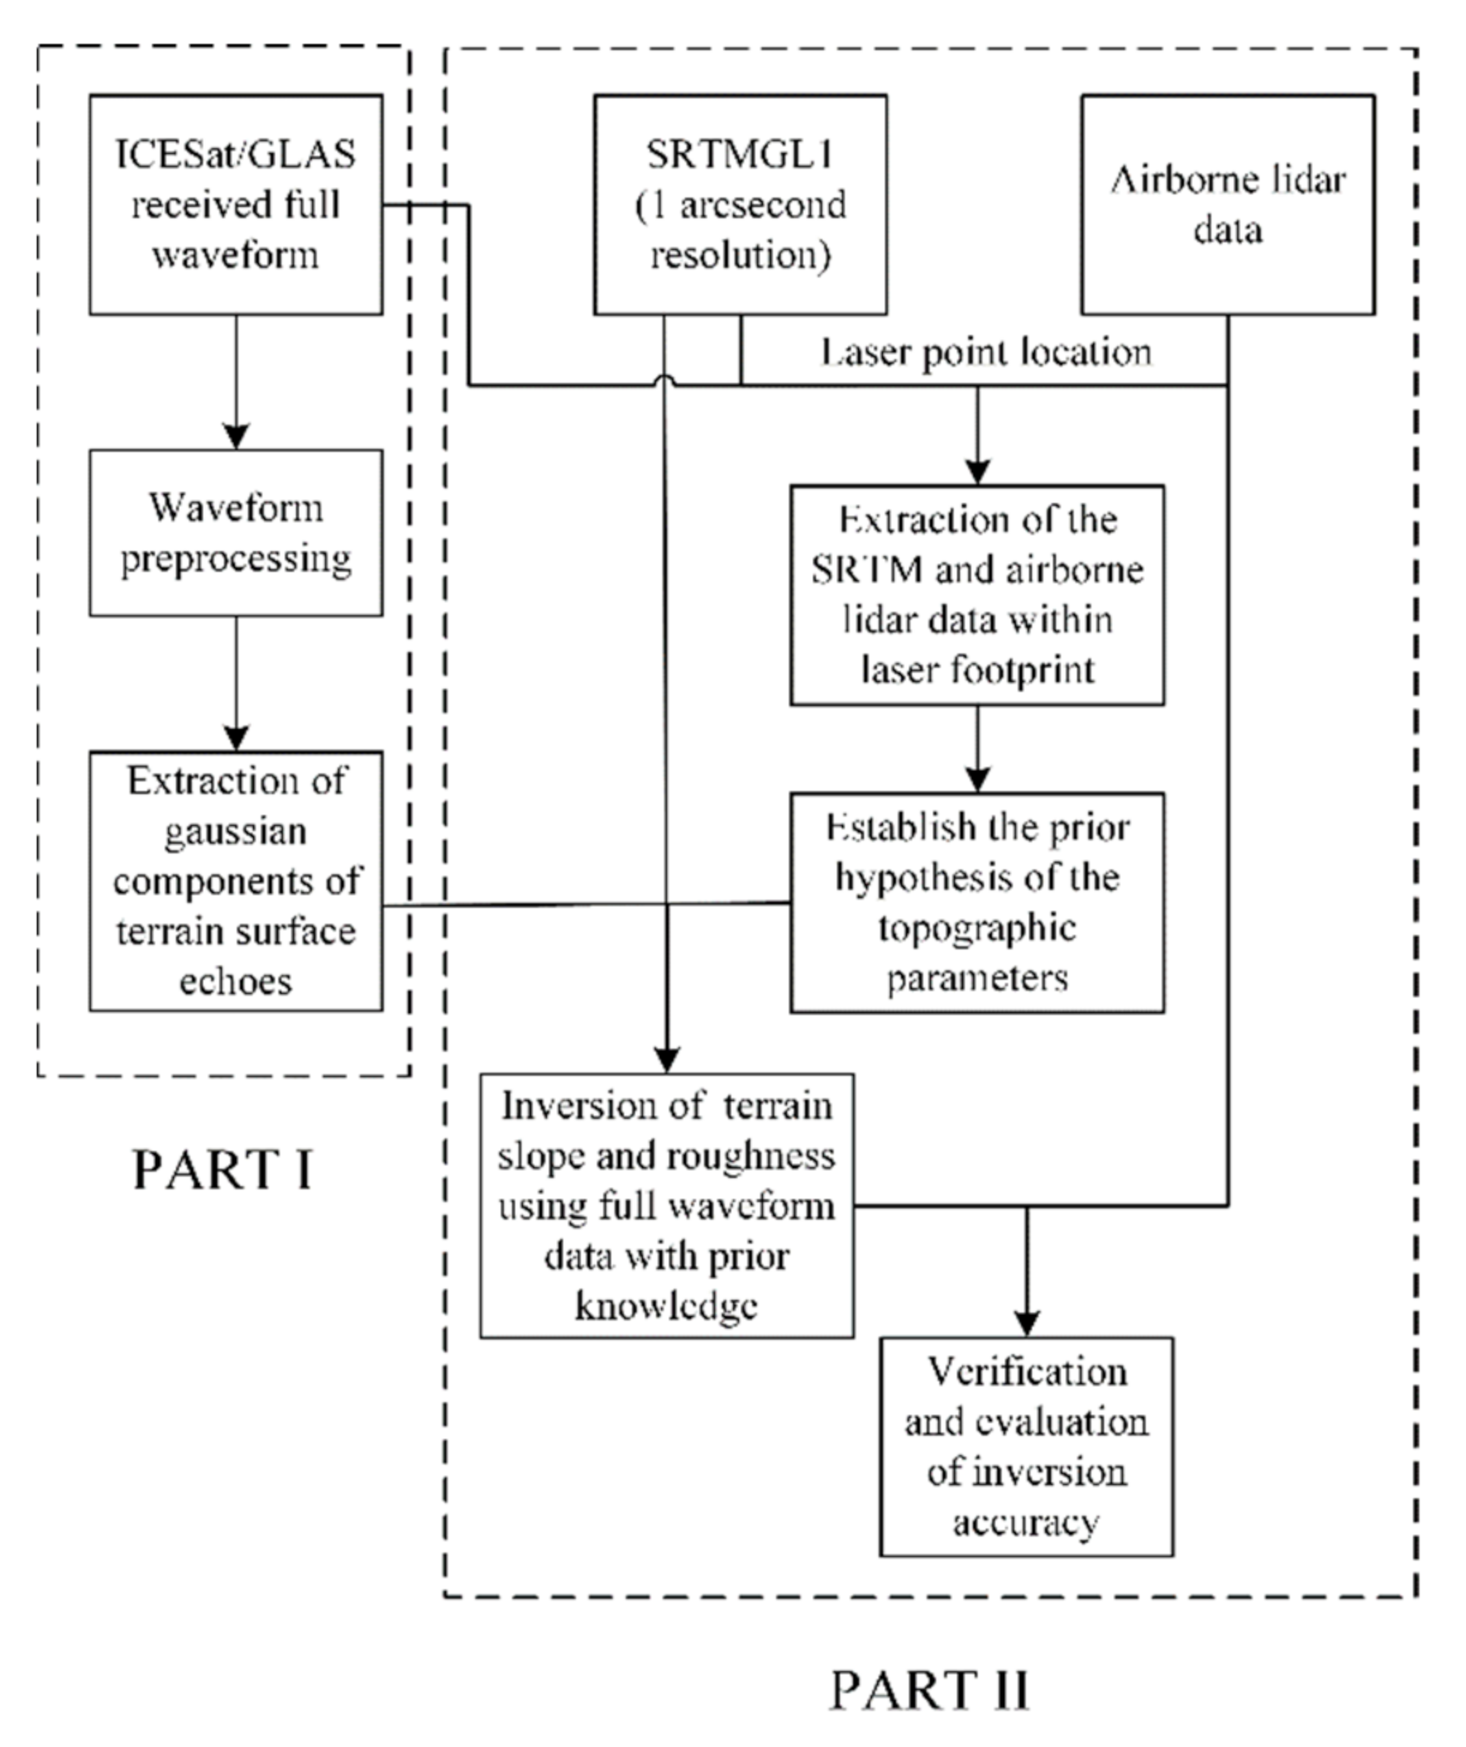
The procedures of inversion method of terrain slope and roughness using ICESat/GLAS full waveform data, SRTM and our established prior knowledge in this paper are summarized in Figure 2.

2.3.1. ICESat/GLAS Data Processing

After the GLAS emitted laser pulse illuminates the earth’s surface and is backscattered, the echo waveforms can be received by the satellite laser altimeter, and may contain multiple distinct peaks due to the different elevation of the terrain features within the laser footprint. The waveform can be modeled as a sum of Gaussian components plus a bias [41]:
w t , a , T , σ = m = 1 N p W m + ϵ
W m = a m e t T m 2 2 σ m 2
where w t , a , T , σ is the waveform function; a , T , and σ are multidimensional ( 1 × N p ) variables; W m is the function of m t h Gaussian component, and ϵ denotes the noise in raw waveform. a m , T m , and σ m are the pulse amplitude, center position, and 1 / 2 2 In 2 full width at half maximum (FWHM) of the m t h Gaussian component, respectively.
The model parameters of the above equations can be estimated using nonlinear least squares fitting method, such as Damped Gauss-Newton Method [42]. That is, the model parameters can be obtained by fitting the theoretical model to the discrete full waveform data with a constraint that the difference between the model and the waveform is minimized in the least squares sense.
The waveform’s Gaussian components correspond to the multiple features of different elevation within the laser footprint, and the common practice is to assume that last Gaussian component corresponds to the ground surface while the earlier ones correspond to the overlaying vegetation or building [41,43]. However, Qi [44] suggested that the last Gaussian component peak location tends to underestimate the ground elevation while the location of Gaussian component that has stronger peak among the last two ones is closest to the ground surface elevation for both bare terrain and mountain forest areas. That is, the Gaussian component with stronger peak among the last two ones has a greater consistency with the terrain surface returns. This paper adopts such suggestion, and further assumes that if there are no overlapping regions between the last two Gaussians and the amplitude intensity ratio [45] of last Gaussian to penultimate one is greater than 15%, the last gaussian component corresponds to the terrain surface.

2.3.2. Theoretical Model of Pulse Signal of Land Echo

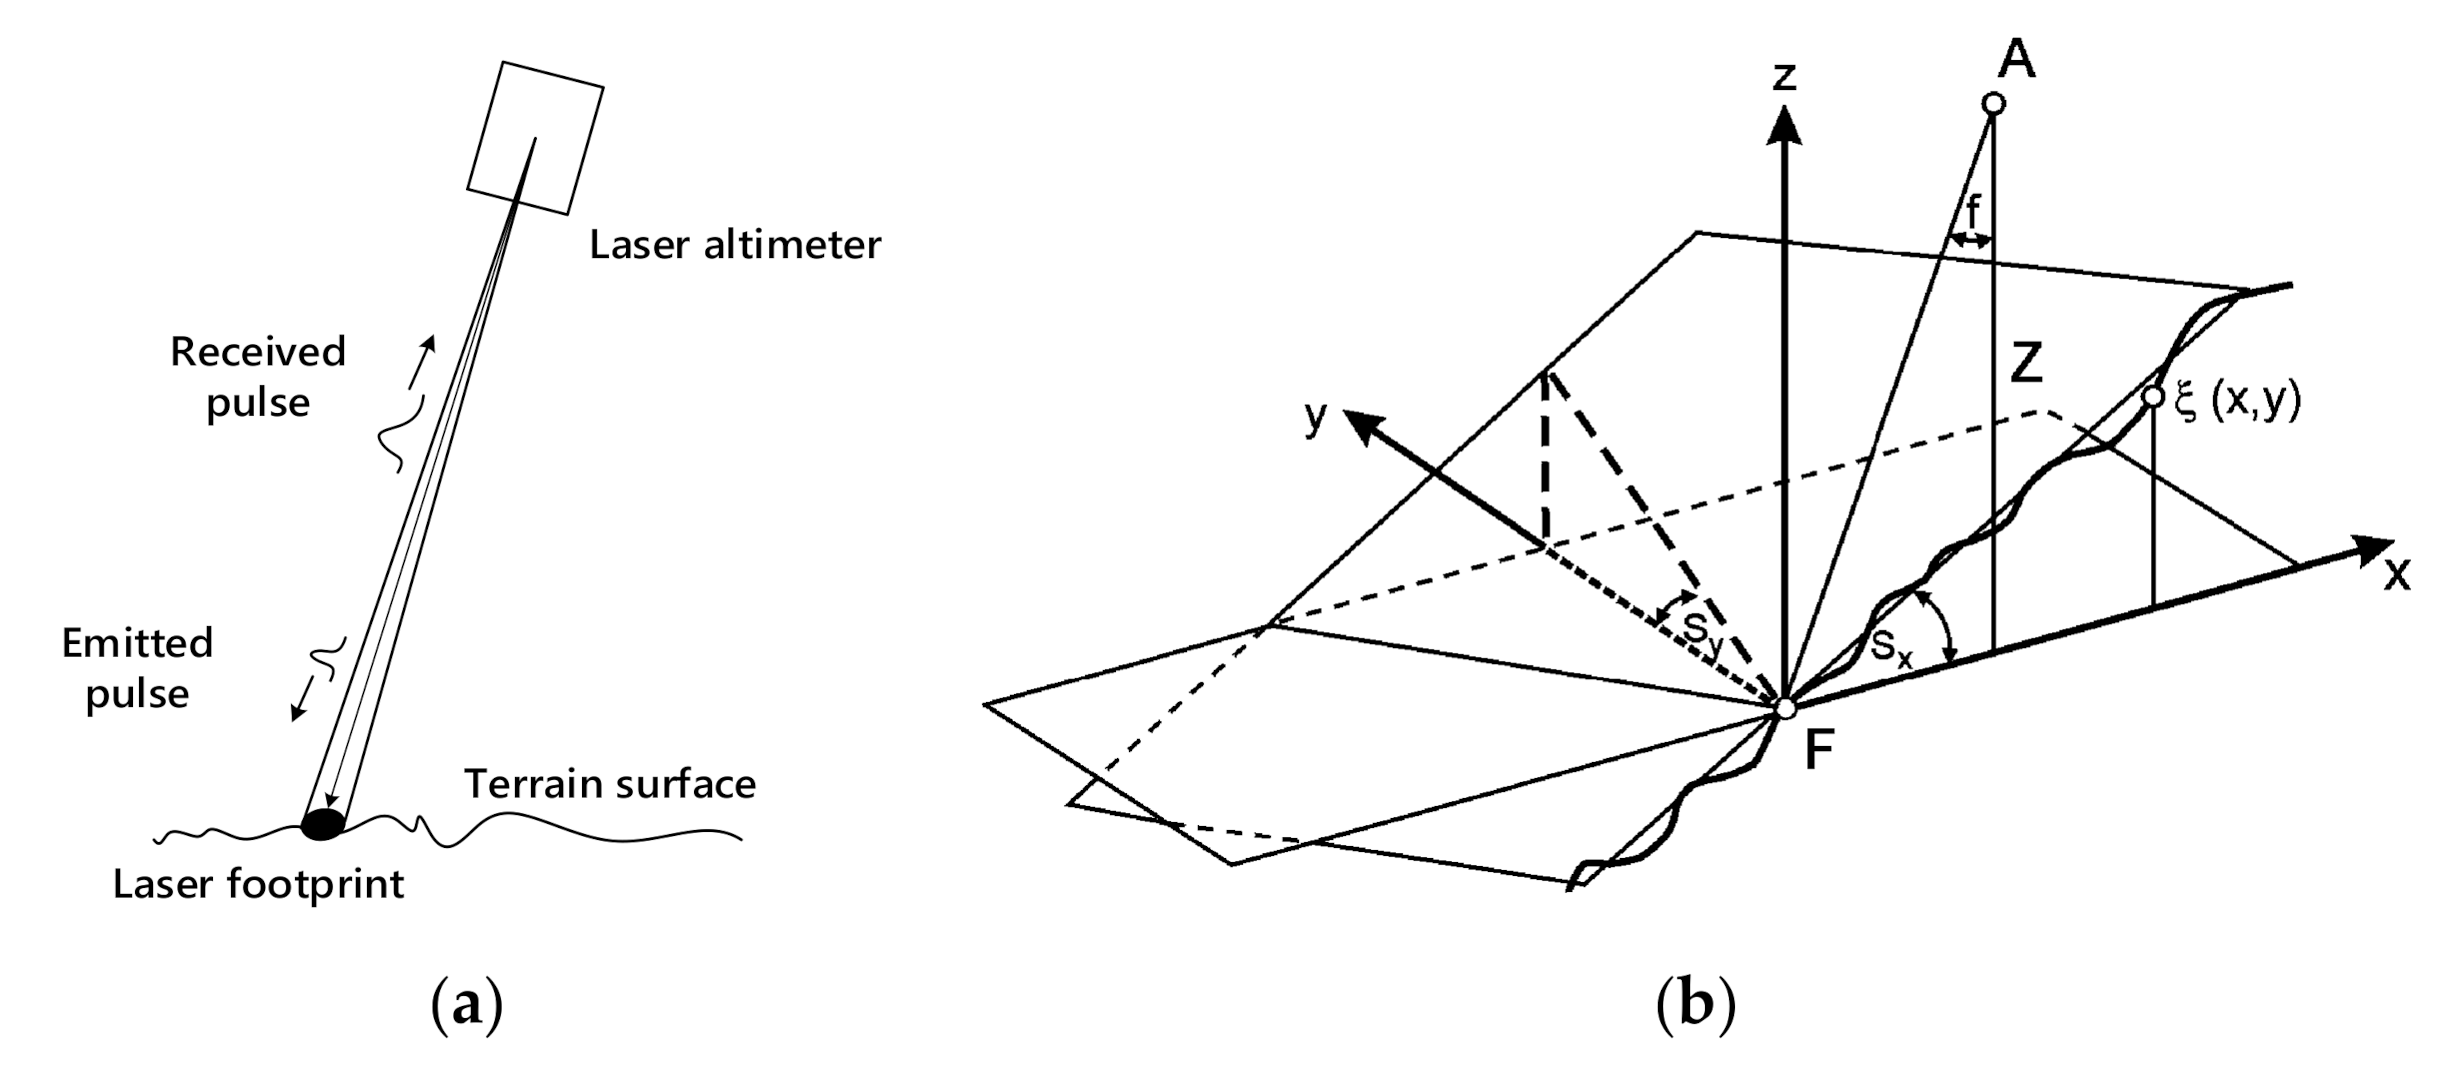
The laser pulse emitted by the satellite laser altimeter undergoes a Fresnel diffraction during its propagation and then reaches the earth surface and is diffusely reflected by the target. With another Fresnel diffraction, the laser reaches the telescope field of view and is received by the photoelectric detector (Figure 3a). After the signal gain, photoelectric conversion and sampling, the digitized discrete full-waveform data of the surface echo is finally acquired [20]. There are functions of the temporal moments of the laser pulse full-waveform data, which is defined as follows [15]:
N = 0 p t d t
T s = 1 N 0 t · p t d t
σ s 2 = 1 N 0 t T s 2 · p t d t
where the p t is the signal power of the echo pulse received by the telescope and N is the photon count, T s is the centroid time of the echo pulse signal and σ s represents the Root Mean Square (RMS) pulse width of the echo full-waveform.
Assuming that the surface profile within the footprint satisfies the ergodicity, the terrain has a stationary surface (the statistical parameters such as mean and standard deviation do not change over any measured scale) [46]. The theoretical model of land echo waveform related to the transmitted pulse, topographic parameters, and beam characteristics can be expressed as follows [20]:
σ s 2 = σ f 2 + σ h 2 + 4 V a r Δ ξ cos 2 S x c 2 cos 2 φ + S x + 4 Z s a t 2 t a n 2 θ t c 2 cos 2 φ · t a n 2 θ t + tan 2 φ + S x + tan 2 S y cos 2 S x cos 2 φ + S x
where σ s is the RMS pulse width of received waveform in (5), σ f is the RMS pulse width of emitted laser pulse, and σ h is the RMS width of the receiver impulse response. V a r Δ ξ is the Root Mean Square (RMS) roughness (Rq), defined as the RMS of the elevation differences of the terrain surface with the locally best-fitting plane (9), and S x and S y are the two slope angles of terrain surface within footprint in the direction parallel and perpendicular to the flight direction of satellite (Figure 3b), respectively. φ (the f in Figure 3b) and θ t are the pointing angle and divergence angle of transmitted laser pulse. Z s a t is the satellite orbital altitude, and c is the speed of light in the vacuum.
Figure 3 depicts that the satellite laser altimeter emits laser pulse in a non-nadir direction and is obliquely incident on the terrain surface. In Figure 3b, A is the orbital position of the satellite laser altimeter, and F is the location of laser spot on the terrain surface. The coordinate system’s origin is located on F, and it uses the satellite flight direction as the +x axis, the direction of local zenith as the +z axis, and the +y axis is chosen to be perpendicular to the orbital plane in order to comply with the right-hand rule.
S x and S y are the two slope angles of terrain surface within the laser footprint in the direction parallel and perpendicular to the flight direction of satellite, respectively. The surface profile within laser footprint is modeled as
ξ x , y = x tan S x + y tan S y + Δ ξ x , y + ξ 0
where Δ ξ x , y represents the terrain relief with respect to the slope plane ( z = x tan S x + y tan S y + ξ 0 ). As the origin is located at the intersection point of laser pulse and the terrain surface, we have ξ 0 = 0 , and the slope of terrain within the footprint can be expressed as a dimensionless quantity (or in degrees of tan 1 Slope π · 180 ° ):
Slope = z x 2 + z y 2 = tan 2 S x + tan 2 S y
The surface roughness can be defined in several different ways [47]. In this paper, it is used specifically as Root Mean Square of the elevation differences of the terrain surface with the locally best-fitting plane. According to (7), assuming that there are n points ( p i ,   1 i n ) within the surface profile, the roughness is defined as follows,
V a r Δ ξ =   R q = 1 n i = 1 n ξ x p i , y p i x p i tan S x y p i tan S y ξ 0 2
Given the two slope angles of S x and S y in (6), we can derive the terrain slope (8) and roughness ( V a r Δ ξ , Root Mean Square Roughness):
V a r Δ ξ = cos 2 φ + S x 4 cos 2 S x c 2 σ s 2 σ f 2 σ h 2 4 Z s a t 2 t a n 2 θ t cos 2 φ · t a n 2 θ t + tan 2 φ + S x + tan 2 S y cos 2 S x cos 2 φ + S x
However, based only on the above theoretical model of pulse signal of land echo (6), it is impossible to distinguish the respective contribution of the slope and roughness of the terrain surface to the RMS pulse width broadening of the echo full-waveform, which is a problem with nonunique solutions. That is, different solutions of terrain slope and roughness may cause the same pulse width broadening (same value for σ s in (6). A priori hypothesis about the topographic statistical and geometrical parameters (slope and two slope angles) within the laser footprint is going to be established to deal with non-uniqueness of solution to this inversion problem.

2.3.3. Prior Hypothesis of Terrain Slope and Roughness

The diameter of GLAS laser footprint is about 50~90 m. We extract the SRTM DEMs with 1 arc-second resolution within the GLAS laser footprint using the laser spot’s geolocation coordinates from GLAS product GLAH14 (Figure 4).
A plane fitting in the least squares sense can be applied to the extracted SRTM DEMs:
H X , Y = r · X + s · Y + p
Thus, the slope of SRTM DEMs within the laser footprint is r 2 + s 2 , and the RMS roughness is 1 9 i = 1 9 H i r · X i + s · Y i + p 2 . The tan 1 r is the slope angle of terrain surface in due east direction, and tan 1 s is the slope angle of terrain surface in the due north direction.
However, the terrain information of SRTM cannot be used as the prior information about corresponding truth value directly, as it is a very coarse representation of terrain surface. And one thing to be noted is that the SRTMGL1 is the digital surface model [33], as it includes canopy, buildings and other infrastructures.
Thus, to establish the prior hypothesis about real-world terrain information using the SRTM DEMs, the NRW-DEM within the GLAS laser footprint is extracted and regarded as the true information of terrain surface. The SRTM DEMs that include canopy, buildings or other infrastructures within the GLAS laser footprints should be excluded before the establishment of prior hypothesis of terrain information.
21,830 pairs of terrain data (SRTM-DEM and NRW-DEM) were extracted from SRTM-DEMs and NRW-DEMs using transit GLAS laser footprints in North Rhine-Westphalia, Germany, and 4933 sets of extracting terrain data were identified as the bare ground terrain elevation model. The plane fitting is applied to both SRTM-DEM and NRW-DEM of each pair within laser footprint. With two fitted results of the i t h pair ( i = 1 , 2 , 4933 ) as follows:
H S R T M , i = r S R T M , i · X S R T M , i + s S R T M , i · Y S R T M , i + p S R T M , i H N R W , i = r N R W , i · X N R W , i + s N R W , i · Y N R W , i + p N R W , i
We chose the components r (the rate of change of terrain surface in x-axis direction), s (the rate of change of terrain surface in y-axis direction) and the slope r 2 + s 2 of these two planes fitted results as the comparison parameters to establish the prior hypothesis of SRTM DEMs to NRW-DEMs.
① The X component of the fitted plane, r = H X ( H = rX + sY + p )
We calculated the differences between these two X components (12), and the difference obeys a Gaussian distribution. Based on the differences ( Δ r i = r N R W , i r S R T M , i ,   1 i 4933 ) between the two X-directions components on the respective fitted plane of SRTMGL1 and NRW-DEM data, the mean and the standard deviation can be estimated in (13):
μ Δ r = i = 1 4933 Δ r i 4933 = 0.000234 σ Δ r = i = 1 4933 Δ r i μ Δ r 2 4933 = 0.019966
② The Y component of the fitted plane, s = H Y ( H = rX + sY + p )
The differences between these two Y components (12) are calculated, and the difference obeys a Gaussian distribution.
Similar to the above estimation of difference of X-direction components, we estimate the mean and the standard deviation of difference ( Δ s i = s N R W , i s S R T M , i ,   1 i 4933 ) between the two Y-directions components on the respective fitted plane of SRTMGL1 and NRW-DEM data:
μ Δ s = i = 1 4933 Δ s i 4933 = 0.001336 σ Δ s = i = 1 4933 Δ s i μ Δ s 2 4933 = 0.023938
③ Slope of the fitted plane, Slope =   r 2 + s 2 ( H = rX + sY + p )
We calculated the differences between these slopes of the fitted planes Equation (12), and the difference also obeys a Gaussian distribution.
Based on the difference ( Δ Slope i = S l o p e N R W , i S l o p e S R T M , i ,   1 i 4933 ) between the slopes of the respective fitted plane of SRTMGL1 and NRW-DEM data, the mean and the standard deviation can be estimated as follows:
μ Δ S l o p e = i = 1 4933 Δ S l o p e i 4933 = 0.005236 σ Δ S l o p e = i = 1 4933 Δ S l o p e i μ Δ S l o p e 2 4933 = 0.030351  
From the above ①, ②, and ③, we have obtained the prior knowledge of the SRTM-DEMs to the NRW-DEMs in slope and two slope angles. Given the SRTM-DEM within the laser footprint, two coefficients of x component and y component of the fitted plane and the slope can be calculated, and their confidence intervals for the corresponding true parameters are set to be 2 times the standard deviation from the mean value.
For the x component of the fitted plane, ( r T r u e r S R T M ) μ Δ r 2 σ Δ r , μ Δ r + 2 σ Δ r , and the confidence is 94.61%:
r T r u e r S R T M 0.03969 , r S R T M + 0.04016
For the y component of the fitted plane, ( s T r u e s S R T M ) μ Δ s 2 σ Δ s , μ Δ s + 2 σ Δ s , and the confidence is 94.05%:
s T r u e s S R T M 0.04921 , s S R T M + 0.04654
For the slope component of the fitted plane, ( S l o p e T r u e S l o p e S R T M ) μ Δ S l o p e 2 σ Δ S l o p e , μ Δ S l o p e + 2 σ Δ S l o p e , and the confidence is 95.19%:
S l o p e T r u e S l o p e S R T M 0.06593 , S l o p e S R T M + 0.05546

2.3.4. Proposed Method for Inversion of Terrain Slope and Roughness

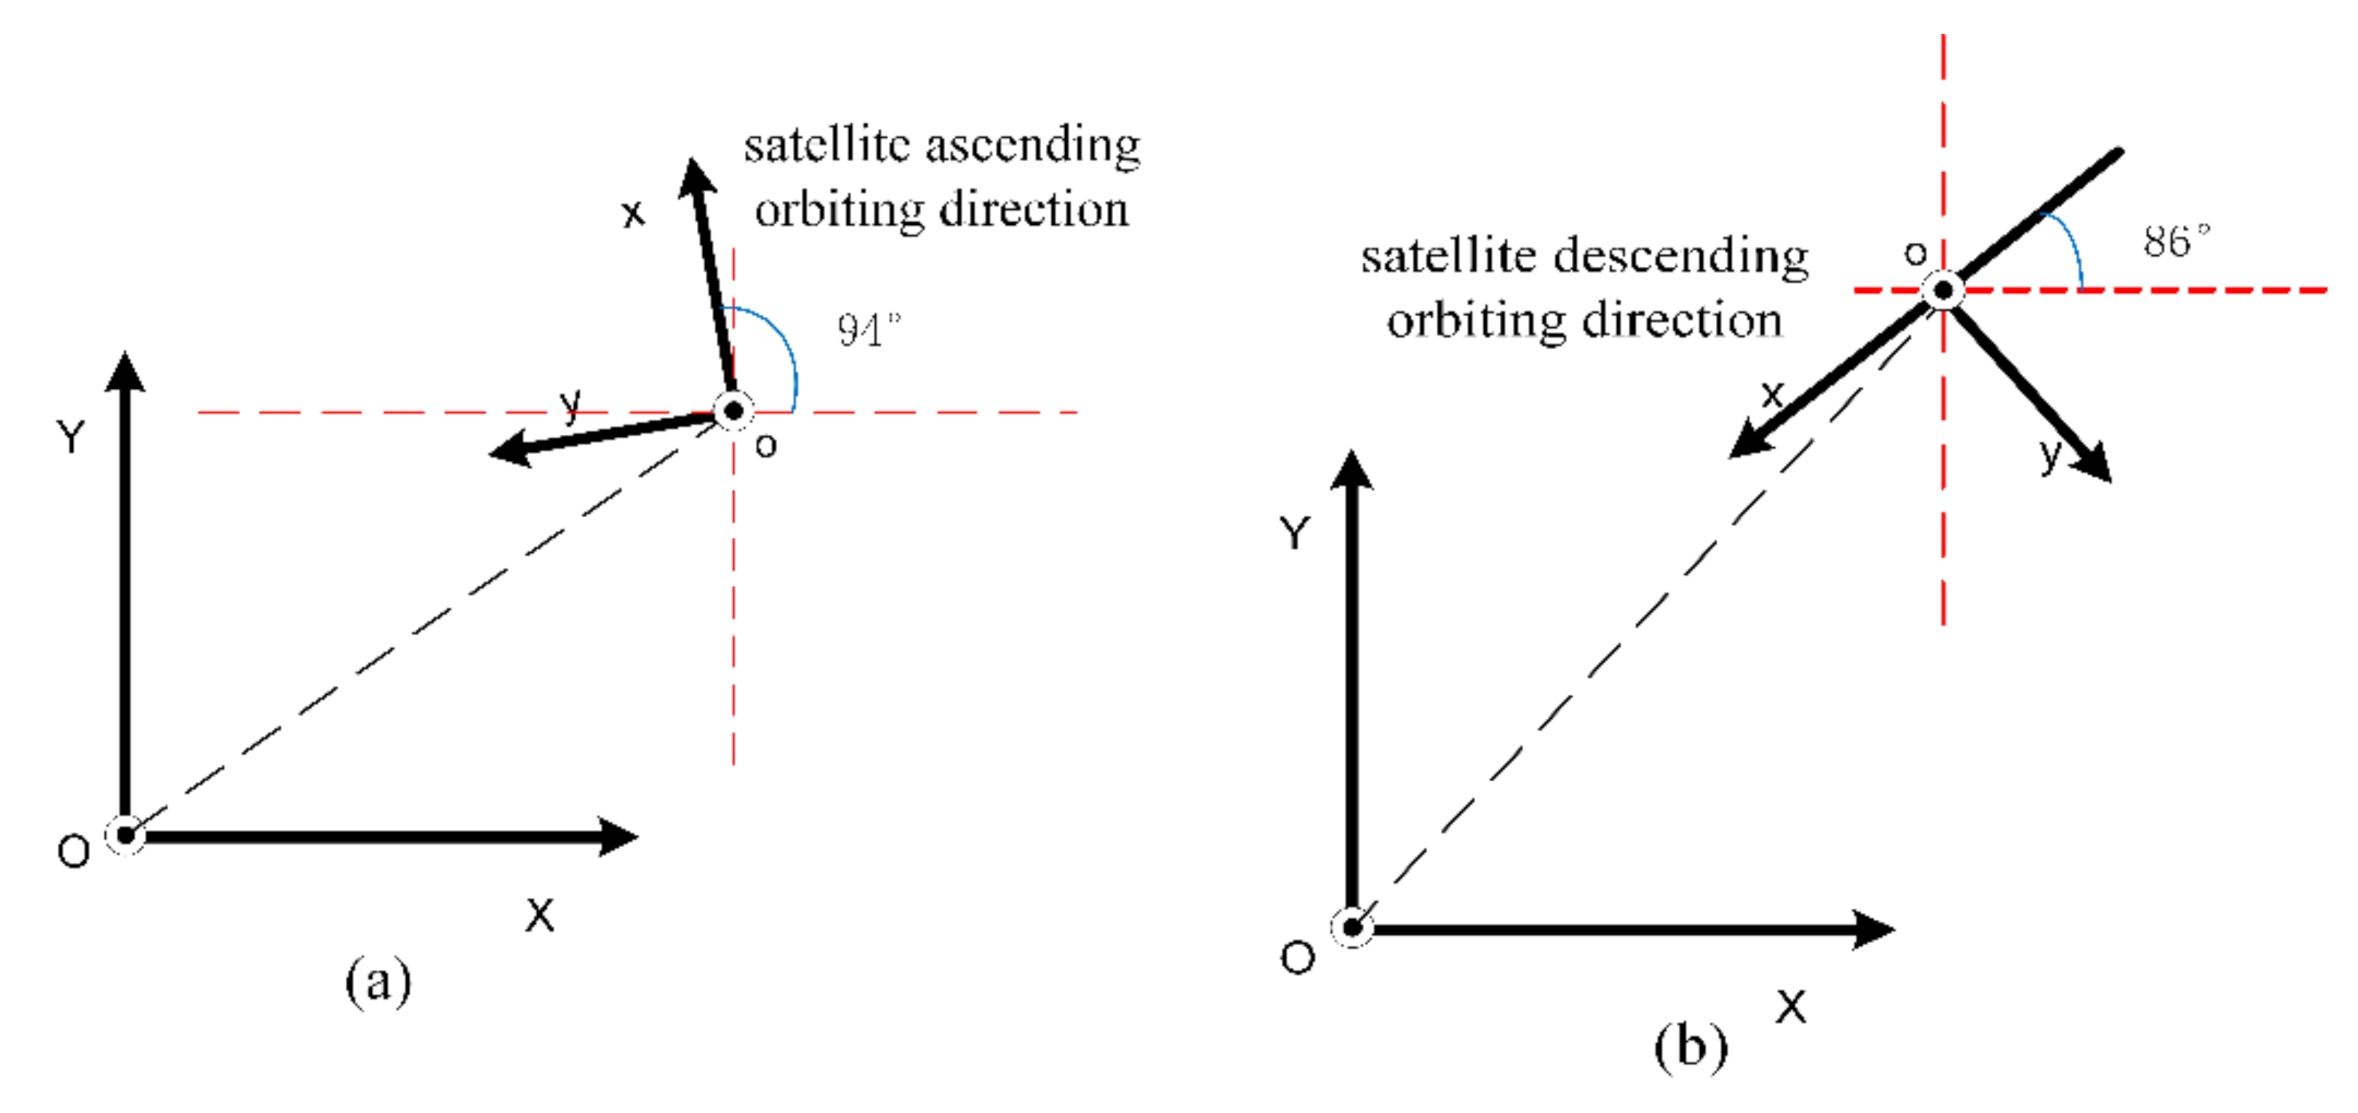
We have established the prior hypothesis of slope and two slope angles of the terrain surface within laser footprint using the SRTM-DEMs and NRW-DEMs in the previous subsection. However, it should be noted that, these prior parameters are all calculated in the locally ground coordinate system, whose +X axis and +Y axis are in the local horizontal plane (normal to zenith direction) and are parallel to East and North direction, respectively, and the +Z axis is pointing towards Zenith direction (Figure 5, Z direction is not shown, but normal to the plane of OXY). It is much different from the locally ground coordinate system (Figure 3b) constructed when the laser altimetry system oblique incidence to the surface, which is using the satellite flight direction as the +x axis, the direction of local zenith as the +z axis, and the +y axis is chosen to be perpendicular to the orbital plane, and the geometric relations between these two coordinate systems can be shown in Figure 5.
Since that the above two coordinate systems conform to the right-hand rule, and they have the same direction in z-axis, the coordinate system transformation matrix is
X Y Z = cos θ sin θ 0 sin θ cos θ 0 0 0 1 r o t a t i o n   m a t r i x · x y z + O x O y O z t r a n s l a t i o n   v e c t o r
The X , Y , Z is the coordinate in ground projection coordinate system OXY, while the x , y , z is in the ground coordinate system oxy associated with the laser altimetry system (Figure 3b). When the satellite orbiting is in ascending modes, θ = 94 ° (the orbit inclination of ICESat is about 94 ° ), otherwise, θ = 266 ° .
If we apply the plane fitting to the terrain surface within laser footprint in ground projection coordinate system OXY, the plane equations can be
Z = aX + bY + l
we may substitute (19) into (20),
z = a cos θ + b sin θ · x + b cos θ a sin θ · y + a O x + b O y O z + l
According to (7), (8), and (21), the terrain slope and two slope angles ( S x and S y ) of terrain surface within footprint in the direction parallel and perpendicular to the flight direction of satellite can be derived as follows:
tan S x = a cos θ + b sin θ tan S y = b cos θ a sin θ S l o p e = z x 2 + z y 2 = a cos θ + b sin θ 2 + b cos θ a sin θ 2 = a 2 + b 2
As we have established, the prior hypothesis of SRTM-DEMs to the authentic terrain in slope and two slope angles of the terrain surface within laser footprint in ground projection plane coordinate system. Thus, using the (16), (17), (18), and (22), given the SRTM-DEM within the laser footprint with the plane fitting result of H = r S R T M X + s S R T M Y + p , the confidence interval of the true-value of corresponding parameters in ground coordinate system oxy associated with laser altimetry system during the ascending flight of satellite can be expressed as follows (confidence intervals in descending flight modes are not listed),
S l o p e r S R T M 2 + s S R T M 2 0.06593 , r S R T M 2 + s S R T M 2 + 0.05546
tan S x tan S x _ m i n , tan S x _ m a x tan S y tan S y _ m i n , tan S y _ m a x
where tan S x _ m i n = r S R T M + 0.04016 cos 94 + ( s S R T M 0.04921 ) sin 94 , tan S x _ m a x = r S R T M 0.03969 cos 94 + ( s S R T M + 0.04654 ) sin 94 , tan S y _ m i n = ( s S R T M + 0.04654 ) · cos 94 r S R T M + 0.04016 · sin 94 , tan S y _ m a x = ( s S R T M 0.04921 ) · cos 94 r S R T M 0.03969 · sin 94 .
Given two slope angles ( S x and S y ) in the ground coordinate system oxy associated with laser altimetry system, using (6), we can now calculate the RMS roughness of the terrain surface ( V a r Δ ξ ) (10) within laser footprint.
By traversing the slope angles in the confidence interval, and calculating the roughness, we can obtain the serial data of tan S x , tan S y , V a r Δ ξ (Figure 6):
With all the possible data series of slope and roughness of the terrain surface within the laser footprint being calculated using the satellite full-waveform data under the constraints of prior hypothesis of two slope angles of terrain surface, we developed the following rules based on prior knowledge of terrain slope (Figure 7) to determine the final result S l o p e i n v , R q i n v from terrain parameter inversion sequence using the prior hypothesis of terrain slope (23):
  • ① (a) and (b) in Figure 7, if S l o p e t r u e _ m i n + S l o p e t r u e _ m a x 2 < S l o p e i n v _ m i n , then S l o p e i n v = S l o p e i n v _ m i n and R q i n v = R q i n v _ 1 ;
  • ② (c) and (d) in Figure 7, if S l o p e t r u e _ m i n + S l o p e t r u e _ m a x 2 > S l o p e i n v _ m i n and S l o p e t r u e _ m i n + S l o p e t r u e _ m a x 2 < S l o p e i n v _ m a x , then find the slope in inversion data sequence Slope i , Ra i (1 i N ) with minimum distance to S l o p e t r u e _ m i n + S l o p e t r u e _ m a x 2 , assuming to be Slope i n v _ k , then S l o p e i n v e r = Slope i n v _ k and R q i n v e r = R q i n v _ k ;
  • ③ (e) and (f) in Figure 7, if S l o p e t r u e _ m i n + S l o p e t r u e _ m a x 2 > S l o p e i n v _ m a x , then S l o p e i n v = S l o p e i n v _ m a x and R q i n v = R q i n v _ N .
Based on the prior hypothesis of slope and two slope angles of the terrain surface within laser footprint, we have proposed the method for inversion of terrain slope and roughness in this subsection.

3. Results

In this section, based on the ICESat/GLAS full-waveform data passing over the West Valley City, Utah, United States of America (Figure 1b), a total of 1130 laser spots from February 2006 to February 2008) and Jackson City, Wyoming, United Sates of America (Figure 1c), a total of 311 laser spots from April 2007 to March 2008), 185 laser echo waveforms in West Valley City received from flat land and urban areas and 54 laser echo waveforms in Jackson City received from flat land and mountainous areas, supplemented by the SRTM and established prior hypothesis of terrain topographic parameters, were used to invert the terrain slope and roughness using the proposed method. The inversion results are evaluated based on the high precision airborne lidar data (WVC-DEM and JKS-DEM) derived terrain slope and roughness.

3.1. ICESat/GLAS Full-Waveform Data Selection for Inversion

Using the methodology proposed in this paper for terrain slope and roughness inversion, the following criteria for GLAS waveform data selection for inversion experiment were considered:
C1: The Gaussian decomposition of the satellite laser altimetry full-waveform data can be affected when the waveform is deformed due to atmospheric forward scattering or high reflectance, which may lead to an inaccurate result. Therefore, the laser shots that are possible likely affected by clouds and surface high reflectivity (the flag FRir_qa_flg > 13 and d_reflctUC 1 in the GLAH14 products) were not used in the final inversion experiments. To further remove the effects of the cloud, aerosol and the satellite attitude unreliability which may lead to geolocation errors, GLAS waveforms were also excluded if their elevations on this record should not be used (the elevation were 16 m above or below the SRTM and the flag elev_use_flg =1 in GLAH14 products), or the attitude quality is not the good (the flag sigma_att_flg > 0 in GLAH14 products).
C2: The GLAS land echo full-waveform is the convolution result of the emitted laser pulse with the topographic distribution. Thus, the terrain surface covered by dense vegetation is difficult to be expressed in the GLAS waveform output, and the theoretical model of pulse waveform of land echo assumes that the surface profile within the footprint satisfy the ergodicity, that is, the terrain has a stationary surface. For the terrain surface with multiple heights (there are buildings or trees within one laser footprint), the above assumption is not met. We used the National Land Cover Database (NLCD2006) to screen the GLAS waveforms returned from bare or near-bare ground. The returned waveforms were excluded if the terrain surface within the GLAS laser footprints were labeled as Developed or Forest areas (if the label values are 23, 24, 41, 42, 43, 51, 52, 90 in NLCD2006).
Based on the above selection criterion C1, 616 ICESat laser shot were excluded from the total of 1130 laser shots passing over West Valley City, and from the remaining 514 laser shots, 185 laser shots were selected using the above selection criterion C2. For the ICESat laser shots passing over Jackson City, 138 laser shots were excluded from the total of 311 laser shots using the selection criterion C1, and from the remaining 173 laser shots, 54 laser shots were selected using the selection criterion C2.

3.2. Inversion Results and Evaluation

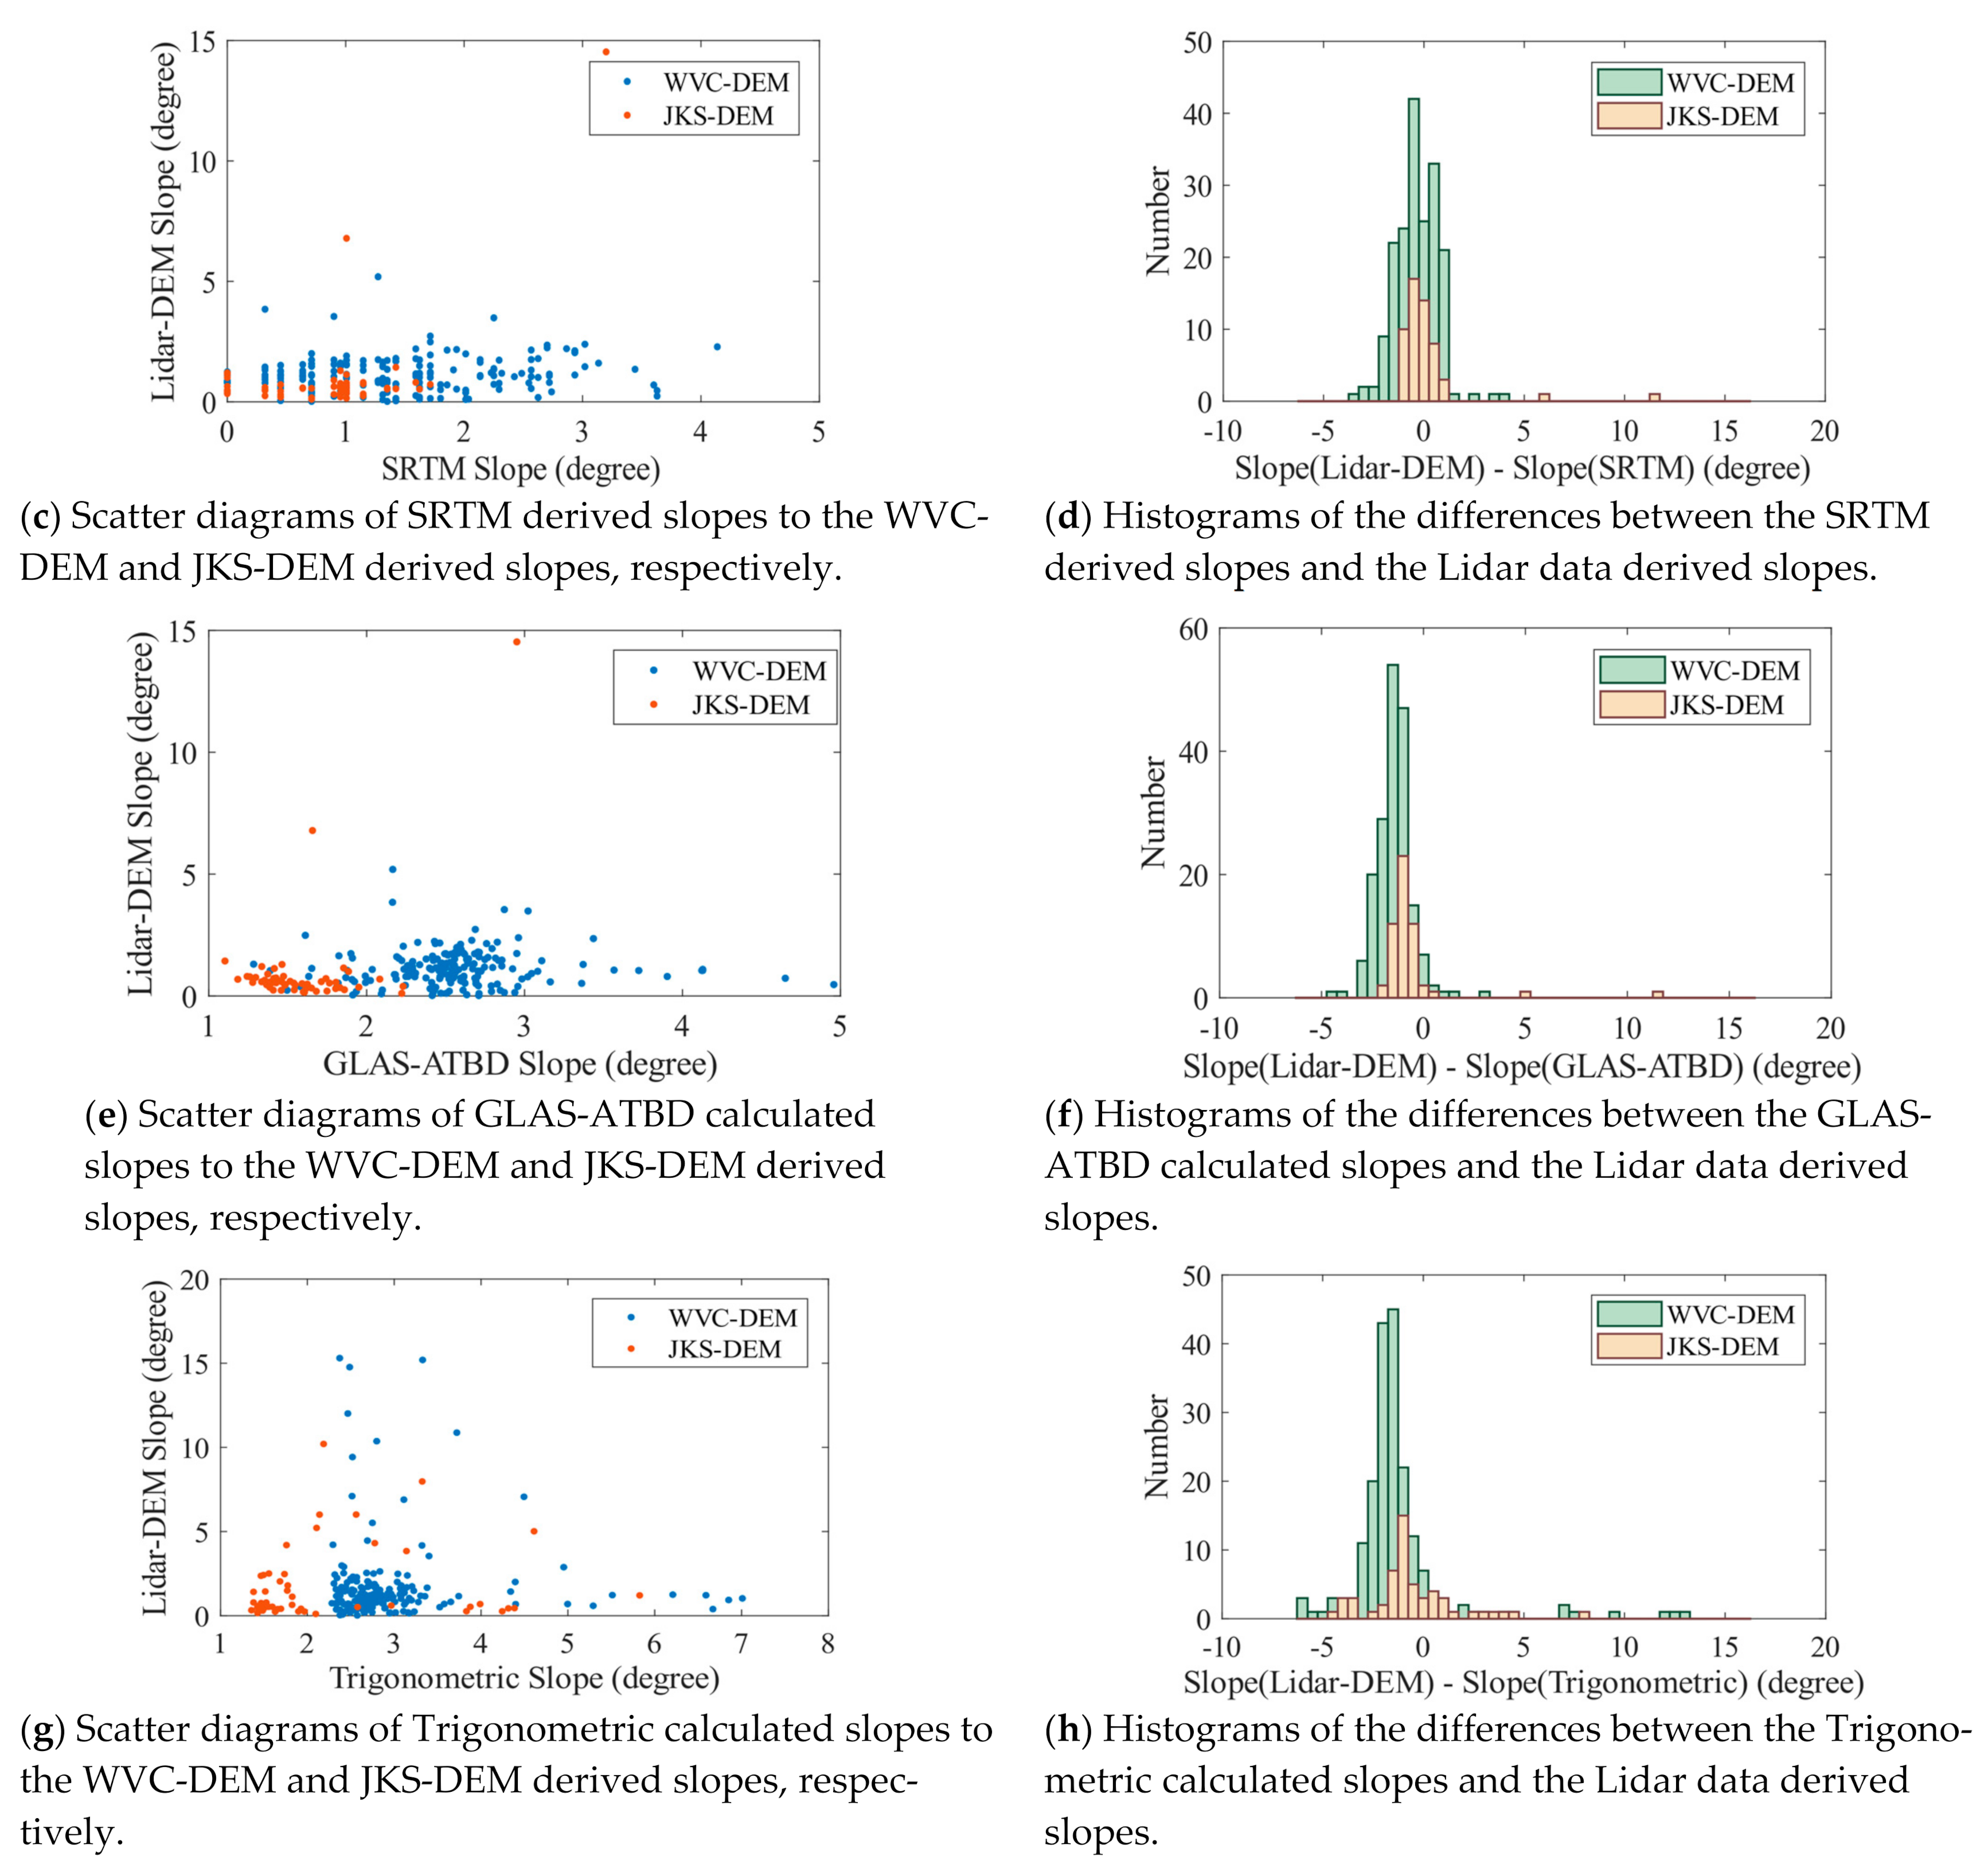
Using the proposed method, we inverted the slope and roughness of terrain surface within the laser footprint. The parameters (slope and roughness) were also calculated using the GLAS-ATBD inversion algorithm [22], slope inversion method (hereafter referred to as Trigonometric) used by Xie and others [25], roughness inversion method (hereafter referred to as Shi) proposed by Shi and others [28], the SRTM data, the WVC-DEM data, and JKS-DEM data, separately. We used the WVC-DEM and JKS-DEM derived terrain slope and roughness to evaluate the inversion results from different methods (or data), which can be used to draw comparisons between our proposed method and other methods. The inversion results of terrain slope and roughness using different methods are shown in the following Figure 8 and Figure 9.
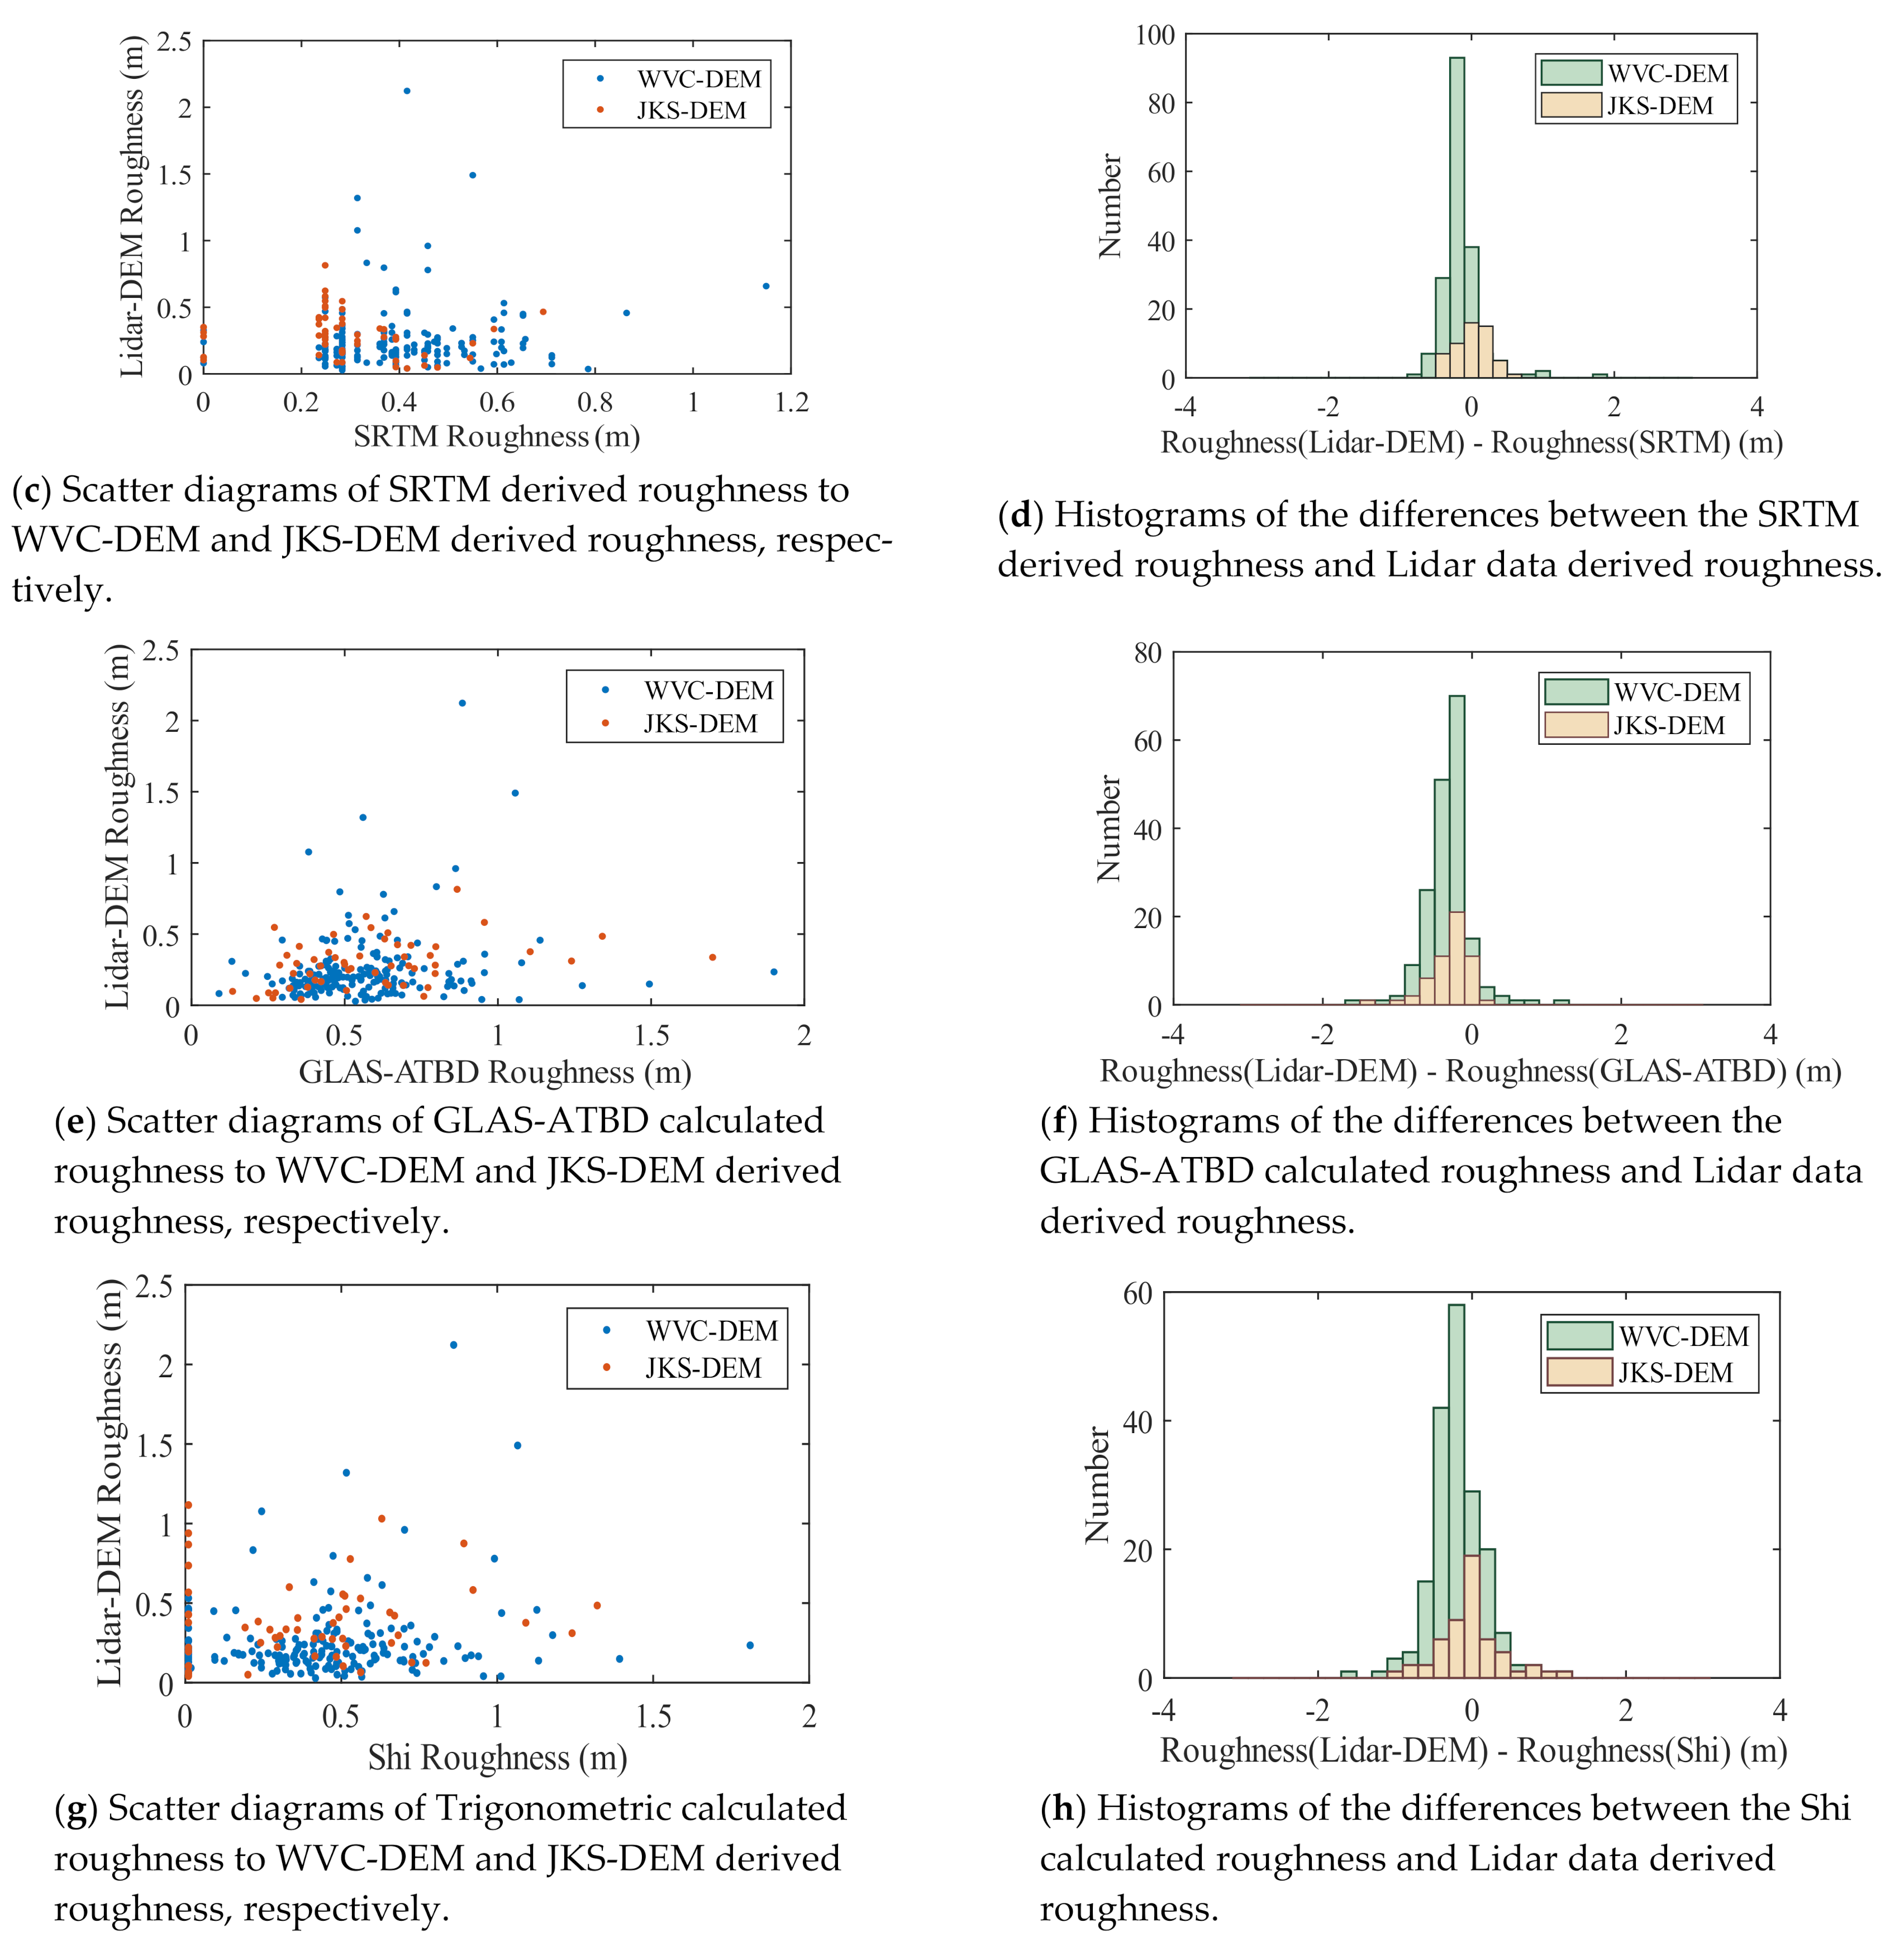
From (a), (c), (e), and (g) in Figure 8 and Figure 9, we can find that the inversion (calculation) accuracy of terrain slope and roughness are all decreased as the truth-value for slope and roughness increased. However, from (b), (d), (f), and (h) in Figure 8, we may also notice that the differences of Lidar-DEM derived slope to inverted slope are more intensive within ± 1 degree, compared with that of SRTM derive slope, GLAS-ATBD calculated slope and Trigonometric calculated slope, respectively. For roughness inversion results in Figure 9, from (b), (d), (f), and (h), the differences of Lidar-DEM derived roughness to inverted roughness are more intensive within ± 0.4 m, compared with that of SRTM derived roughness, GAS-ATBD calculated roughness, and Shi calculated roughness, respectively.
To validate the above qualitative analysis results, we estimate the proportions of the terrain slope difference within ± 1 ° (Table 1) and terrain roughness difference within ± 0.4 m (Table 2) from the (b), (d), (f), and (h) in Figure 8 and Figure 9, respectively.
We can find that the terrain slope and roughness inverted using the proposed method correspond to the more concentrated difference distribution in the given interval of slope difference within ± 1 ° and roughness difference within ± 0.4   m . The proportions of slope inversion results that lie within the interval of ± 1 ° centered on the WVC-DEM and JKS-DEM derived slopes are 76.2% and 96.3%, respectively. The proportions of roughness inversion results that lie within the interval of ± 0.4   m centered on the WVC-DEM and JKS-DEM derived roughness are 86.5% and 96.3%, respectively.
To make further quantitative evaluation of the inversion results, the statistical parameters of Mean Absolute Error (MAE) and Root Mean Square Error (RMSE) are used.
Assuming that the inversion result of topographic parameter p r of terrain surface within the N footprints are p r 1 , p r 2 , p r 3 p r N , and the corresponding true values are t r 1 , t r 2 , t r 3 t r N , then the Mean Absolute Error and Root Mean Square Error of the inversion results are as follows,
MAE = 1 N i = 1 N t r i p r i RMSE = 1 N i = 1 N t r i p r i 2
Using the statistical parameters of MAE and RMSE, we made quantitative evaluation of the above inversion results of terrain slope and roughness within laser footprint. The evaluations are shown in the following Table 3 and Table 4.
It can be found that the inversion results of terrain slope and roughness using our method have achieved a higher consistency with those derived from WVC-DEM and JKS-DEM.
Quantitative evaluation of the inversion experiment in West Valley City, Utah, shows that the inversion accuracy for slope is about 0.694 ° (MAE) and 0.835 ° (RMSE) and that for roughness is 0.175 m (MAE) and 0.268 m (RMSE). The inversion accuracy for slope has improved at least 0.168 ° , 0.778 ° and 1.45 ° compared with those of SRTM, GLAS-ATBD and Trigonometric slope calculation results, respectively. The inversion accuracy for roughness has improved at least 0.062, 0.183 and 0.136 m compared with those of SRTM, GLAS-ATBD, and Shi methods, respectively.
Quantitative evaluation of the inversion experiment in Jackson City, Wyoming, shows that the inversion accuracy for slope is about 0.575 ° (MAE) and 1.561 ° (RMSE), and that for roughness is 0.154 m (MAE) and 0.182 m (RMSE). The inversion accuracy for slope has improved at least 0.194 ° , 0.693 ° , and 1.157 ° compared with those of SRTM, GLAS-ATBD, and Trigonometric slope calculation results, respectively. The inversion accuracy for roughness has improved at least 0.04, 0.156, and 0.138 m compared with those of SRTM, GLAS-ATBD, and Shi methods, respectively.
However, in West Valley City, the accuracy index RMSE of the inversion slope and inversion roughness has only a minor improvement compared with that of GLAS-ATBD slopes and SRTM roughness. These may be ascribed to the larger temporal displacement (7 years) between ICESat data and validation data in West Valley City, compared with only 2 years of that in Jackson City, where better results are obtained.

4. Discussion

Through the qualitative and quantitative evaluations of the inversion results in two experimental areas of West Valley City and Jackson City in Section 3, the accuracy (MAE and RMSE) of our proposed method for parameter inversion of terrain slope and roughness has been proved to be superior to that of SRTM, GLAS-ATBD, Trigonometric slopes inversion algorithm and Shi roughness inversion method. However, in West Valley City, the accuracy index RMSE of the inversion slope and inversion roughness has only a minor improvement compared with that of GLAS-ATBD slopes and SRTM roughness. We hold the opinion that these may result from the larger temporal displacement (7 years) between ICESat/GLAS data and validation data in West Valley City, compared with only 2 years of that in Jackson City, where better results are obtained. We can also find that there are decreasing tendencies of the inversion accuracies with increasing slope and roughness in two experimental areas, which is still a challenge to be explored.
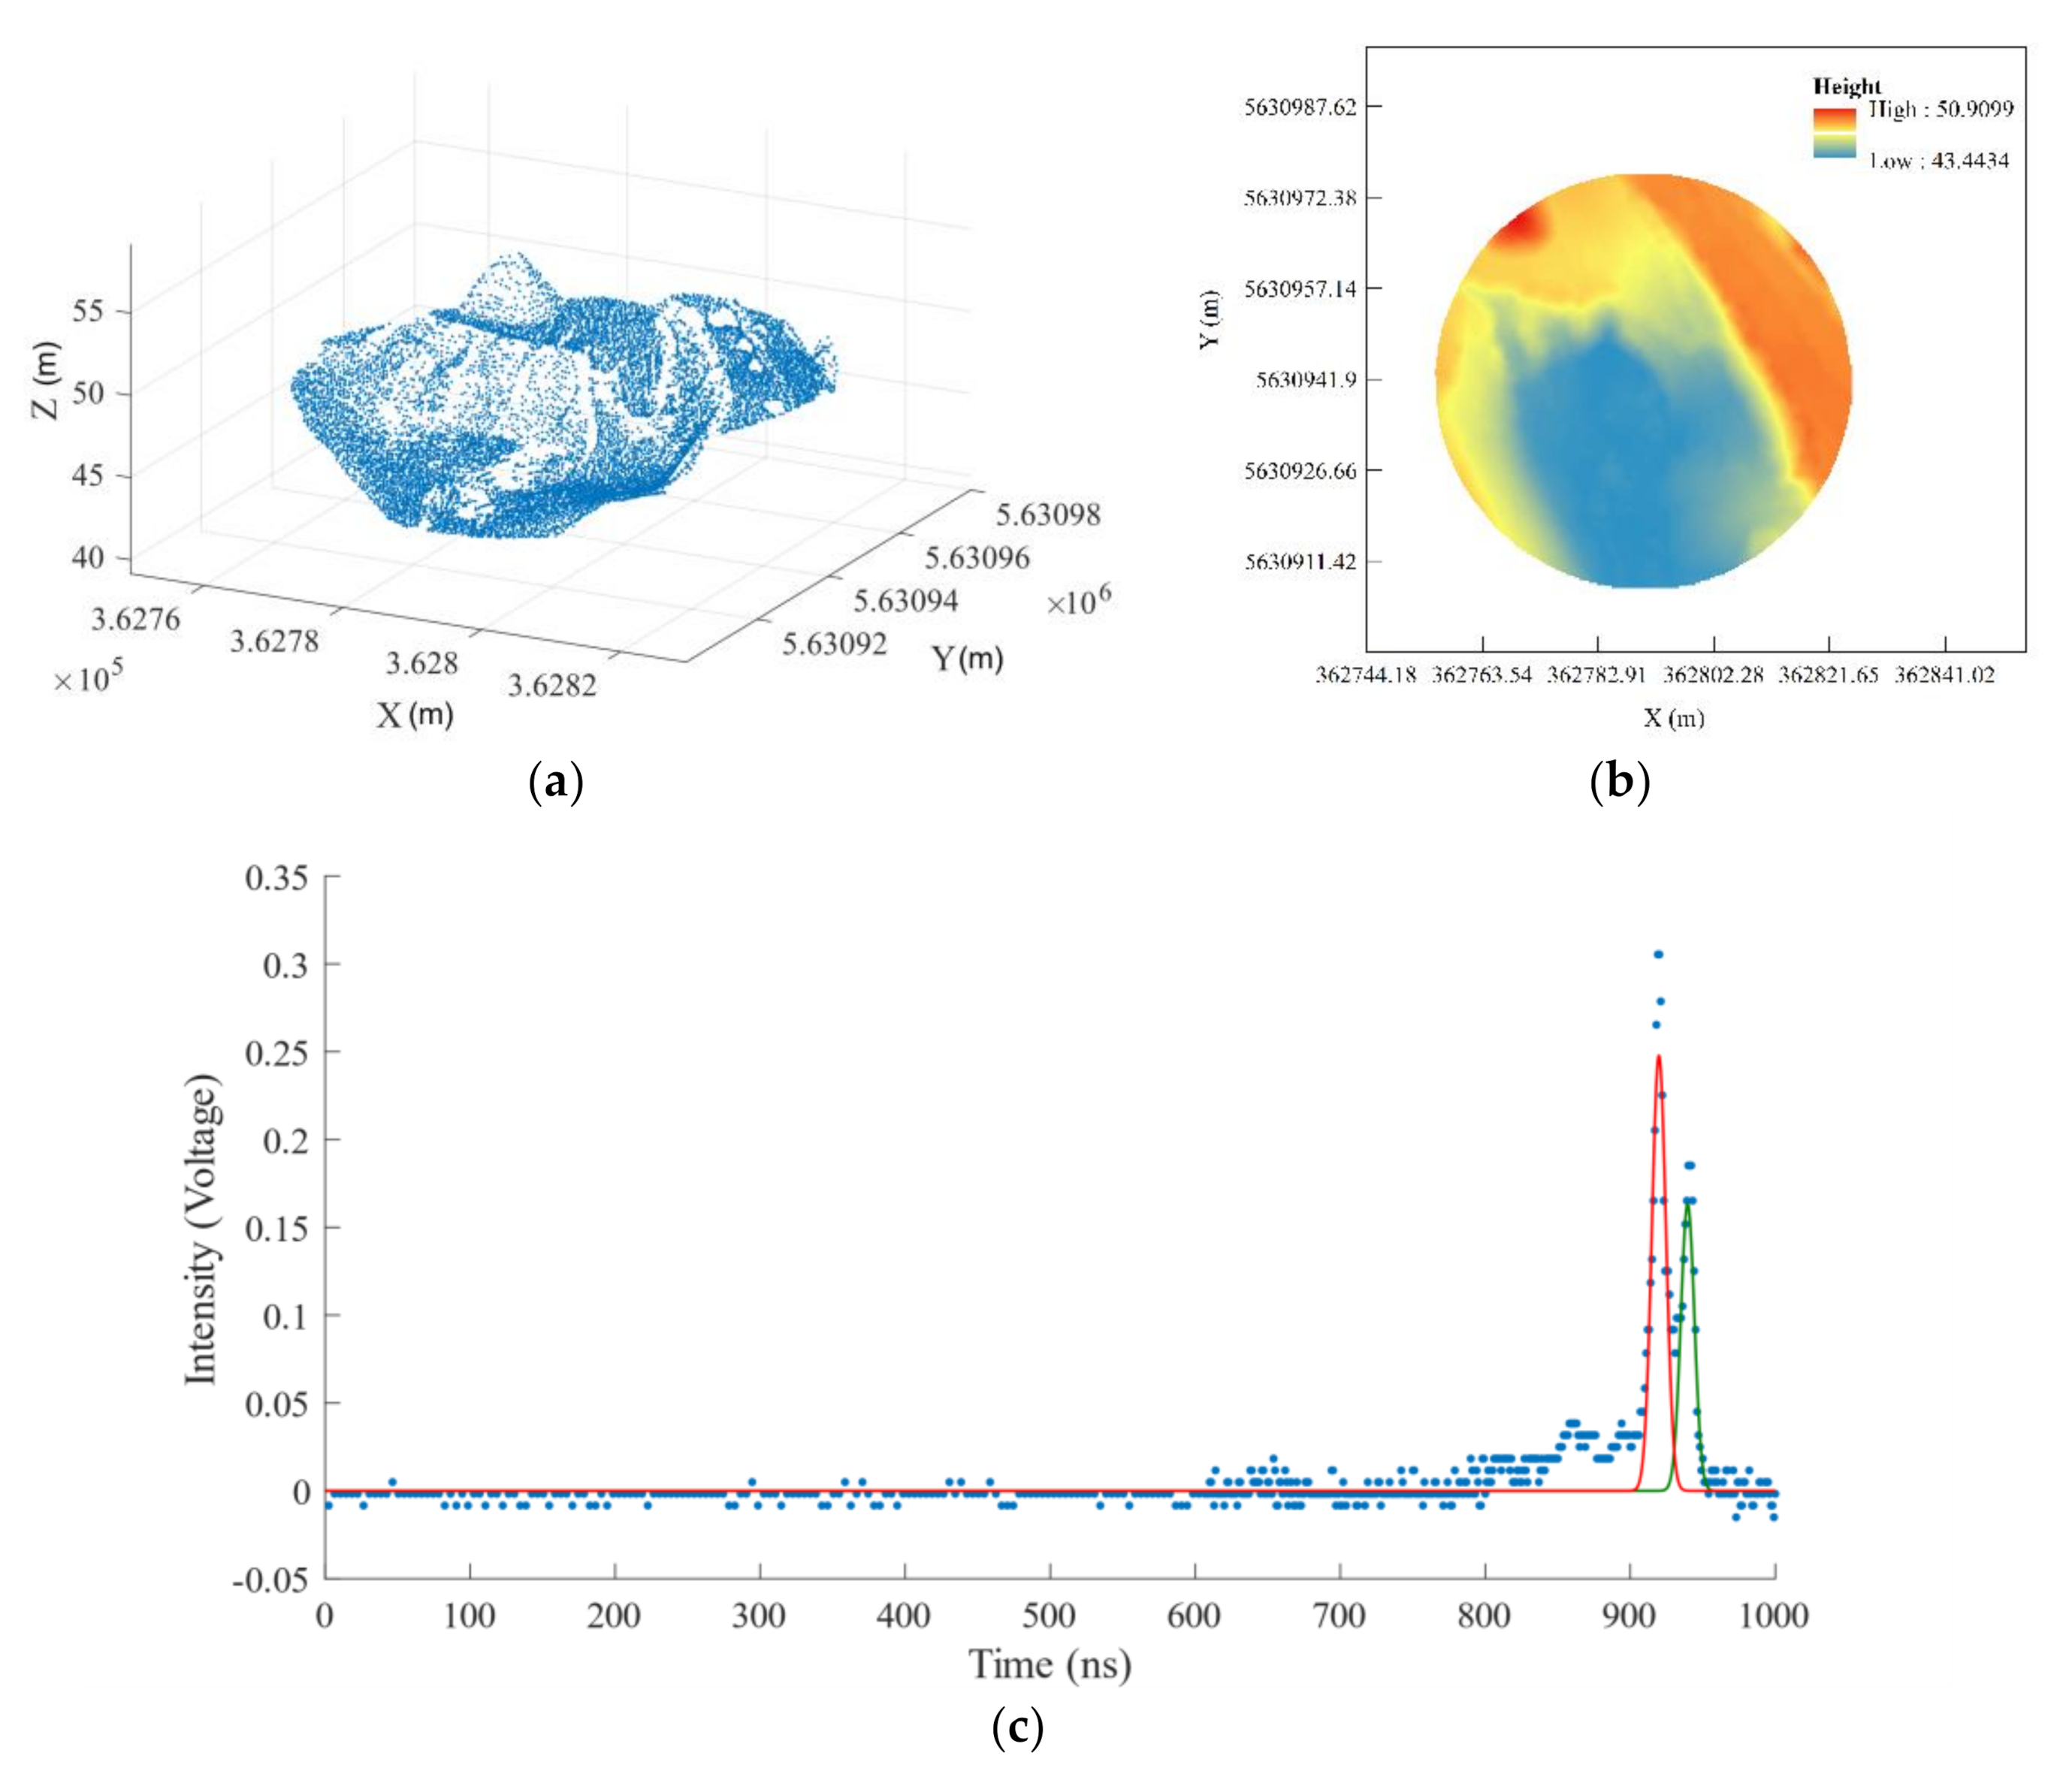
We may also note that in Figure 8 and Figure 9, some inversion results deviate far from the truth value, which may result from dramatic terrain fluctuation (Figure 10, for example).
As shown in Figure 10, the terrain surface within the laser footprint is in a funnel shape, with a dramatic fluctuation, and does not conform to the ergodicity assumption. The slope meaning of this topography is ambiguous, and the value is more like the methodological result rather than the actual description of the topography relief. We consider such ambiguity is caused by the scale of GLAS laser footprint (50–90 m). On the one hand, we believe that this ambiguity of topographic parameters caused by the scale of laser footprint will be reduced with smaller footprint diameter of satellite altimeter, such as GDEI and GaoFen-7 (20~30 m), and on the other hand, we assumed that the surface profile within the footprint satisfy the ergodicity; however, this is not the actual case for all the terrain surface [48]; thus, the inversion result may deviate far from the true value. The theoretical model capable of more accurately describing the satellite laser echo waveform scattered from different land surface topography needs to be further studied.

5. Conclusions

Slope and roughness are basic geophysical properties of terrain surfaces and also sources of error in satellite laser altimetry systems. The precise slope and roughness of the terrain within the satellite laser footprint are necessary for evaluation of the satellite laser ranging accuracy and the geolocation errors, considering the application of satellite laser data as ground control points in continental or even global mapping missions. In this paper, we proposed a new method for inversion of slope and roughness of the bare or near-bare terrain within the laser footprint with the satellite laser altimeter full-waveform data assisted by SRTM.
Firstly, to deal with the non-uniqueness of the solution to the inversion problem, we established the prior hypothesis about real information of the slope and two slope angles (in the direction parallel and perpendicular to the flight direction of satellite) of terrain surface within laser footprint. Then, to invert the precise terrain slope and roughness using the satellite laser altimeter full-waveform data and SRTM, the prior knowledge of terrain slope and two slope angles were introduced in the iteration solution of the theoretical model of pulse signal of land echo, and the theoretical formulas and rules for its optimal solution under constraints were developed. Finally, based on 185 and 54 laser shots of ICESat/GLAS full-waveform data and SRTM in West Valley City, Utah and Jackson City, Wyoming, United States of America, the inversion experiments of the terrain slope and roughness were carried out. Through the qualitative and quantitative evaluation of the inversion results of our proposed method and comparison with the existing ones, the inversion accuracy of terrain slope and roughness has been proved to be superior to that of the state-of-the-art, with the mean absolute error (MAE) of 0.667 ° and 0.171 m, and the root mean square error (RMSE) of 1.054 ° and 0.250 m, respectively.
However, we also found that the inversion accuracy decreased with the increasing magnitude of slope and roughness for the surface, which is still a challenge to be explored. Due to the large scale of ICESat/GLAS laser footprint diameter (50~90 m), there is an ambiguity for terrain slope calculation for some dramatic undulating terrain surface, which is also incongruent with the ergodicity assumption of theoretical model of pulse waveform of land echo. The theoretical model capable of more accurately describing the satellite laser echo waveform scattered from different land surface topography needs to be further studied.

Author Contributions

Conceptualization, Z.Z. and X.T.; methodology, Z.Z., X.T., Y.M., and S.L.; software, Z.Z and W.Z.; validation, Z.Z. and G.L.; writing—original draft preparation, Z.Z. and G.L.; writing—review and editing, Z.Z., G.L., Y.M., and S.L.; supervision, X.T.; project administration, X.T. and G.L.; funding acquisition, X.T. and G.L. All authors have read and agreed to the published version of the manuscript.

Funding

This research was funded by the National Natural Science Foundation of China (41871382) and the National Key Research and Development Scheme, Strategic International Cooperation in Science and Technology Innovation Key Programme of China (2016YFE0205300).

Data Availability Statement

The data presented in this study are available on request from the first author. The data are not yet publicly available.

Acknowledgments

The authors would like to thank National Snow and Ice Data Center for providing the GLAS data; the SLR and NASA for providing the SRTM data; the Interministerial Committee for the Development of the Spatial Data Infrastructure in North Rhine-Westphalia (IMA GDI.NRW) for providing high resolution and precision lidar data of North Rhine-Westphalia; the State of Utah and its partners for providing high resolution and precision lidar data of West Valley City, Utah; the Teton Conservation District for providing high resolution and precision lidar data of Jackson City, Wyoming.

Conflicts of Interest

The authors declare no conflict of interest.

References

  1. Thomas, N.; Spohn, T.; Barriot, J.-P.; Benz, W.; Beutler, G.; Christensen, U.; Dehant, V.; Fallnich, C.; Giardini, D.; Groussin, O. The BepiColombo Laser Altimeter (BELA): Concept and baseline design. Planet. Space Sci. 2007, 55, 1398–1413. [Google Scholar] [CrossRef]
  2. Smith, D.E.; Zuber, M.T.; Jackson, G.B.; Cavanaugh, J.F.; Neumann, G.A.; Riris, H.; Sun, X.; Zellar, R.S.; Coltharp, C.; Connelly, J. The lunar orbiter laser altimeter investigation on the lunar reconnaissance orbiter mission. Space Sci. Rev. 2010, 150, 209–241. [Google Scholar] [CrossRef]
  3. Smith, D.E.; Zuber, M.T.; Frey, H.V.; Garvin, J.B.; Head, J.W.; Muhleman, D.O.; Pettengill, G.H.; Phillips, R.J.; Solomon, S.C.; Zwally, H.J. Mars Orbiter Laser Altimeter: Experiment summary after the first year of global mapping of Mars. J. Geophys. Res. Planets 2001, 106, 23689–23722. [Google Scholar] [CrossRef]
  4. Abshire, J.B.; Sun, X.; Riris, H.; Sirota, J.M.; McGarry, J.F.; Palm, S.; Yi, D.; Liiva, P. Geoscience laser altimeter system (GLAS) on the ICESat mission: On-orbit measurement performance. Geophys. Res. Lett. 2005, 32, 1–4. [Google Scholar] [CrossRef] [Green Version]
  5. Flood, M. Laser altimetry: From science to commercial lidar mapping. Photogramm. Eng. Remote Sens. 2001, 67, 1209–1217. [Google Scholar]
  6. Hilbert, C.; Schmullius, C. Influence of surface topography on ICESat/GLAS forest height estimation and waveform shape. Remote Sens. 2012, 4, 2210–2235. [Google Scholar] [CrossRef] [Green Version]
  7. Mallet, C.; Bretar, F. Full-waveform topographic lidar: State-of-the-art. ISPRS J. Photogramm. Remote Sens. 2009, 64, 1–16. [Google Scholar] [CrossRef]
  8. Zwally, H.J.; Schutz, B.; Abdalati, W.; Abshire, J.; Bentley, C.; Brenner, A.; Bufton, J.; Dezio, J.; Hancock, D.; Harding, D. ICESat’s laser measurements of polar ice, atmosphere, ocean, and land. J. Geodyn. 2002, 34, 405–445. [Google Scholar] [CrossRef] [Green Version]
  9. Schutz, B.E.; Zwally, H.; Shuman, C.; Hancock, D.; DiMarzio, J. Overview of the ICESat mission. Geophys. Res. Lett. 2005, 32, L21S01. [Google Scholar] [CrossRef] [Green Version]
  10. Dubayah, R.; Blair, J.B.; Goetz, S.; Fatoyinbo, L.; Hansen, M.; Healey, S.; Hofton, M.; Hurtt, G.; Kellner, J.; Luthcke, S.; et al. The Global Ecosystem Dynamics Investigation: High-resolution laser ranging of the Earth’s forests and topography. Sci. Remote Sens. 2020, 1, 100002. [Google Scholar] [CrossRef]
  11. Zhang, K.; Wang, S.; Bao, H.; Zhao, X. Characteristics and influencing factors of rainfall-induced landslide and debris flow hazards in Shaanxi Province, China. Nat. Hazards Earth Syst. Sci. 2019, 19, 93–105. [Google Scholar] [CrossRef] [Green Version]
  12. Smith, M.W.; Quincey, D.J.; Dixon, T.; Bingham, R.G.; Carrivick, J.L.; Irvine-Fynn, T.D.; Rippin, D.M. Aerodynamic roughness of glacial ice surfaces derived from high-resolution topographic data. J. Geophys. Res. Earth Surf. 2016, 121, 748–766. [Google Scholar] [CrossRef] [Green Version]
  13. Li, B.; Yue, Z.; Zhang, J.; Fu, X.; Ling, Z.; Chen, S.; Chen, J.; Yao, P.J.E.; Science, S. High-resolution terrain analysis for lander safety landing and rover path planning based on Lunar Reconnaissance Orbiter Narrow Angle Camera images: A case study of China’s Chang’e-4 probe. Earth Space Sci. 2019, 6, 398–410. [Google Scholar] [CrossRef]
  14. Dong, L.; Tang, S.; Min, M.; Veroustraete, F. Estimation of Forest Canopy Height in Hilly Areas Using Lidar Waveform Data. IEEE J. Sel. Top. Appl. Earth Obs. Remote Sens. 2019, 12, 1559–1571. [Google Scholar] [CrossRef]
  15. Gardner, C.S. Ranging performance of satellite laser altimeters. IEEE Trans. Geosci. Remote Sens. 1992, 30, 1061–1072. [Google Scholar] [CrossRef] [Green Version]
  16. Urban, T.J.; Schutz, B.E.; Neuenschwander, A.L. A Survey of ICESat Coastal Altimetry Applications: Continental Coast, Open Ocean Island, and Inland River. Terr. Atmos. Ocean. Sci. 2008, 19, 1–19. [Google Scholar] [CrossRef] [Green Version]
  17. Shean, D.E.; Alexandrov, O.; Moratto, Z.M.; Smith, B.E.; Joughin, I.R.; Porter, C.; Morin, P. An automated, open-source pipeline for mass production of digital elevation models (DEMs) from very-high-resolution commercial stereo satellite imagery. ISPRS J. Photogramm. Remote Sens. 2016, 116, 101–117. [Google Scholar] [CrossRef] [Green Version]
  18. Cheng, C.; Huang, G.; Wen, H.; Zhang, J.; Zhang, L.; Zuo, Z. Method for Extracting Elevation Control Point with Assistance of Satellite Laser Altimetry Data. U.S. Patent 16/702,503, 2 April 2020. [Google Scholar]
  19. Harding, D.J.; Bufton, J.L.; Frawley, J.J. Satellite laser altimetry of terrestrial topography: Vertical accuracy as a function of surface slope, roughness, and cloud cover. IEEE Trans. Geosci. Remote Sens. 1994, 32, 329–339. [Google Scholar] [CrossRef]
  20. Gardner, C. Target signatures for laser altimeters: An analysis. Appl. Opt. 1982, 21, 448–453. [Google Scholar] [CrossRef]
  21. NASA Shuttle Radar Topography Mission Global 1 arc Second; LP DAAC: Sioux Falls, SD, USA, 2013. [CrossRef]
  22. Brenner, A.C.; Zwally, H.J.; Bentley, C.R.; Csathó, B.M.; Harding, D.J.; Hofton, M.A.; Minster, J.-B. Derivation of Range and Range Distributions From Laser Pulse Waveform Analysis for Surface Elevations, Roughness, Slope, and Vegetation Heights. GLAS Algorithm Theoretical Basis Document V5.0. 2011, pp. 1–125. Available online: http://www.csr.utexas.edu/glas/pdf/Atbd_20031224.Pdf (accessed on 1 August 2020).
  23. Yi, D.; Zwally, H.J.; Sun, X. ICESat measurement of Greenland ice sheet surface slope and roughness. Ann. Glaciol. 2005, 42, 83–89. [Google Scholar] [CrossRef] [Green Version]
  24. Nie, S.; Wang, C.; Dong, P.; Li, G.; Xi, X.; Wang, P.; Yang, X. A novel model for terrain slope estimation using ICESat/GLAS waveform data. IEEE Trans. Geosci. Remote Sens. 2017, 56, 217–227. [Google Scholar]
  25. Xie, H.; Tang, H.; Du, W.; Tong, X. A Comparison of Surface Slopes Extracted from ICESat Waveform Data and High Resolution DEM. In Proceedings of EPJ Web of Conferences; EDP Sciences: Les Ulis, France, 2020; p. 01001. [Google Scholar]
  26. Li, X.; Xu, L.; Tian, X.; Kong, D. Terrain slope estimation within footprint from ICESat/GLAS waveform: Model and method. J. Appl. Remote Sens. 2012, 6, 063534. [Google Scholar]
  27. Grigsby, S.; Abdalati, W.; Colgan, L.; Rajaram, H. Sub-footprint Surface Extraction & Classification of ICESat Laser Waveforms in Southwest Greenland. Remote Sens. Environ. 2021. under review. [Google Scholar]
  28. Shi, J.; Menenti, M.; Lindenbergh, R. Parameterization of surface roughness based on ICESat/GLAS full waveforms: A case study on the Tibetan Plateau. J. Hydrometeorol. 2013, 14, 1278–1292. [Google Scholar] [CrossRef] [Green Version]
  29. Jiancheng, L.; Chunbo, F.; Chu, Y.; Shengkai, Z. Using ICESAT altimeter data to determine the Antarctic ice sheet elevation model. Geomat. Inf. Sci. Wuhan Univ. 2008, 33, 226–228. [Google Scholar]
  30. Zwally, H.J.; Schutz, R.; Bentley, C.R.; Bufton, J.L.; Thomas, H.; Jean-Bernard, M.; James, S.; Thomas, R. GLAS/ICESat L1A Global Altimetry Data (HDF5); Version 33; NASA National Snow and Ice Data Center Distributed Active Archive Center: Boulder, CO, USA, 2013. [Google Scholar] [CrossRef]
  31. Zwally, H.J.; Schutz, R.; John, D.; Hancock, D. GLAS/ICESat L1B Global Waveform-based Range Corrections Data (HDF5); Version 34; NASA National Snow and Ice Data Center Distributed Active Archive Center: Boulder, CO, USA, 2014. [Google Scholar] [CrossRef]
  32. Zwally, H.J.; Schutz, R.; Hancock, D.; John, D. GLAS/ICESat L2 Global Land Surface Altimetry Data (HDF5); Version 34; NASA National Snow and Ice Data Center Distributed Active Archive Center: Boulder, CO, USA, 2014. [Google Scholar] [CrossRef]
  33. Farr, T.G.; Rosen, P.A.; Caro, E.; Crippen, R.; Duren, R.; Hensley, S.; Kobrick, M.; Paller, M.; Rodriguez, E.; Roth, L. The shuttle radar topography mission. Rev. Geophys. 2007, 45, 1–33. [Google Scholar] [CrossRef] [Green Version]
  34. Lemoine, F.G.; Kenyon, S.C.; Factor, J.K.; Trimmer, R.G.; Pavlis, N.K.; Chinn, D.S.; Cox, C.M.; Klosko, S.M.; Luthcke, S.B.; Torrence, M.H. The Development of the Joint NASA GSFC and NIMA Geopotential Model EGM96; NASA Goddard Space Flight Center: Greenbelt, MD, USA, 1998. [Google Scholar]
  35. Land NRW. Digitales Geländemodell mittlerer Punktabstand 1m-dl-de/by-2-0. 2019; Available online: http://www.govdata.de/dl-de/by-2-0 and https://www.opengeodata.nrw.de/produkte/geobasis/dgm/dgm1/; (accessed on 9 August 2020). [Google Scholar]
  36. Caffier, A.; Elsner, C.; Rath, C.; Robens, F.; Seidel, J.; Will, K. Offene Geobasisdaten für NRW. Zeitschrift für Geodäsie Geoinformation und Landmanagement 2017, 142, 133–145. [Google Scholar]
  37. Federal Agency for Cartography and Geodesy. Quasigeoid of the Federal Republic of Germany—GCG2016; Federal Agency for Cartography and Geodesy: Frankfurt, Germany, 2017; Available online: https://upd.geodatenzentrum.de/docpdf/quasigeoid_eng.pdf (accessed on 10 August 2020).
  38. State of Utah and Partners. Regional Utah High-Resolution Lidar Data 2015–2017; OpenTopography Facility: La Jolla, CA, USA, 2019. [Google Scholar]
  39. TCDWY. Teton Conservation District, Wyoming Lidar; OpenTopography Facility: La Jolla, CA, USA, 2008. [Google Scholar]
  40. Yang, L.; Jin, S.; Danielson, P.; Homer, C.; Gass, L.; Bender, S.M.; Case, A.; Costello, C.; Dewitz, J.; Fry, J.; et al. A new generation of the United States National Land Cover Database: Requirements, research priorities, design, and implementation strategies. ISPRS J. Photogramm. Remote Sens. 2018, 146, 108–123. [Google Scholar] [CrossRef]
  41. Wagner, W.; Ullrich, A.; Ducic, V.; Melzer, T.; Studnicka, N. Gaussian decomposition and calibration of a novel small-footprint full-waveform digitising airborne laser scanner. ISPRS J. Photogramm. Remote Sens. 2006, 60, 100–112. [Google Scholar] [CrossRef]
  42. Hartley, H.O. The modified Gauss-Newton method for the fitting of non-linear regression functions by least squares. Technometrics 1961, 3, 269–280. [Google Scholar] [CrossRef]
  43. Duong, V.; Lindenbergh, R.; Pfeifer, N.; Vosselman, G. Single and two epoch analysis of ICESat full waveform data over forested areas. Int. J. Remote Sens. 2008, 29, 1453–1473. [Google Scholar] [CrossRef]
  44. Chen, Q. Assessment of terrain elevation derived from satellite laser altimetry over mountainous forest areas using airborne lidar data. ISPRS J. Photogramm. Remote Sens. 2010, 65, 111–122. [Google Scholar] [CrossRef]
  45. Neuenschwander, A.L.; Magruder, L.A.; Tyler, M. Landcover classification of small-footprint, full-waveform lidar data. J. Appl. Remote Sens. 2009, 3, 033544. [Google Scholar] [CrossRef]
  46. Bhushan, B. Surface roughness analysis and measurement techniques. In Modern Tribology Handbook, Two Volume Set; CRC Press: Boca Raton, FL, USA, 2000; pp. 79–150. [Google Scholar]
  47. DeGarmo, E.P.; Black, J.T.; Kohser, R.A.; Klamecki, B.E. Materials and Process in Manufacturing; Prentice Hall: Upper Saddle River, NJ, USA, 1997. [Google Scholar]
  48. Shepard, M.K.; Campbell, B.A.; Bulmer, M.H.; Farr, T.G.; Gaddis, L.R.; Plaut, J.J. The roughness of natural terrain: A planetary and remote sensing perspective. J. Geophys. Res. Planets 2001, 106, 32777–32795. [Google Scholar] [CrossRef]
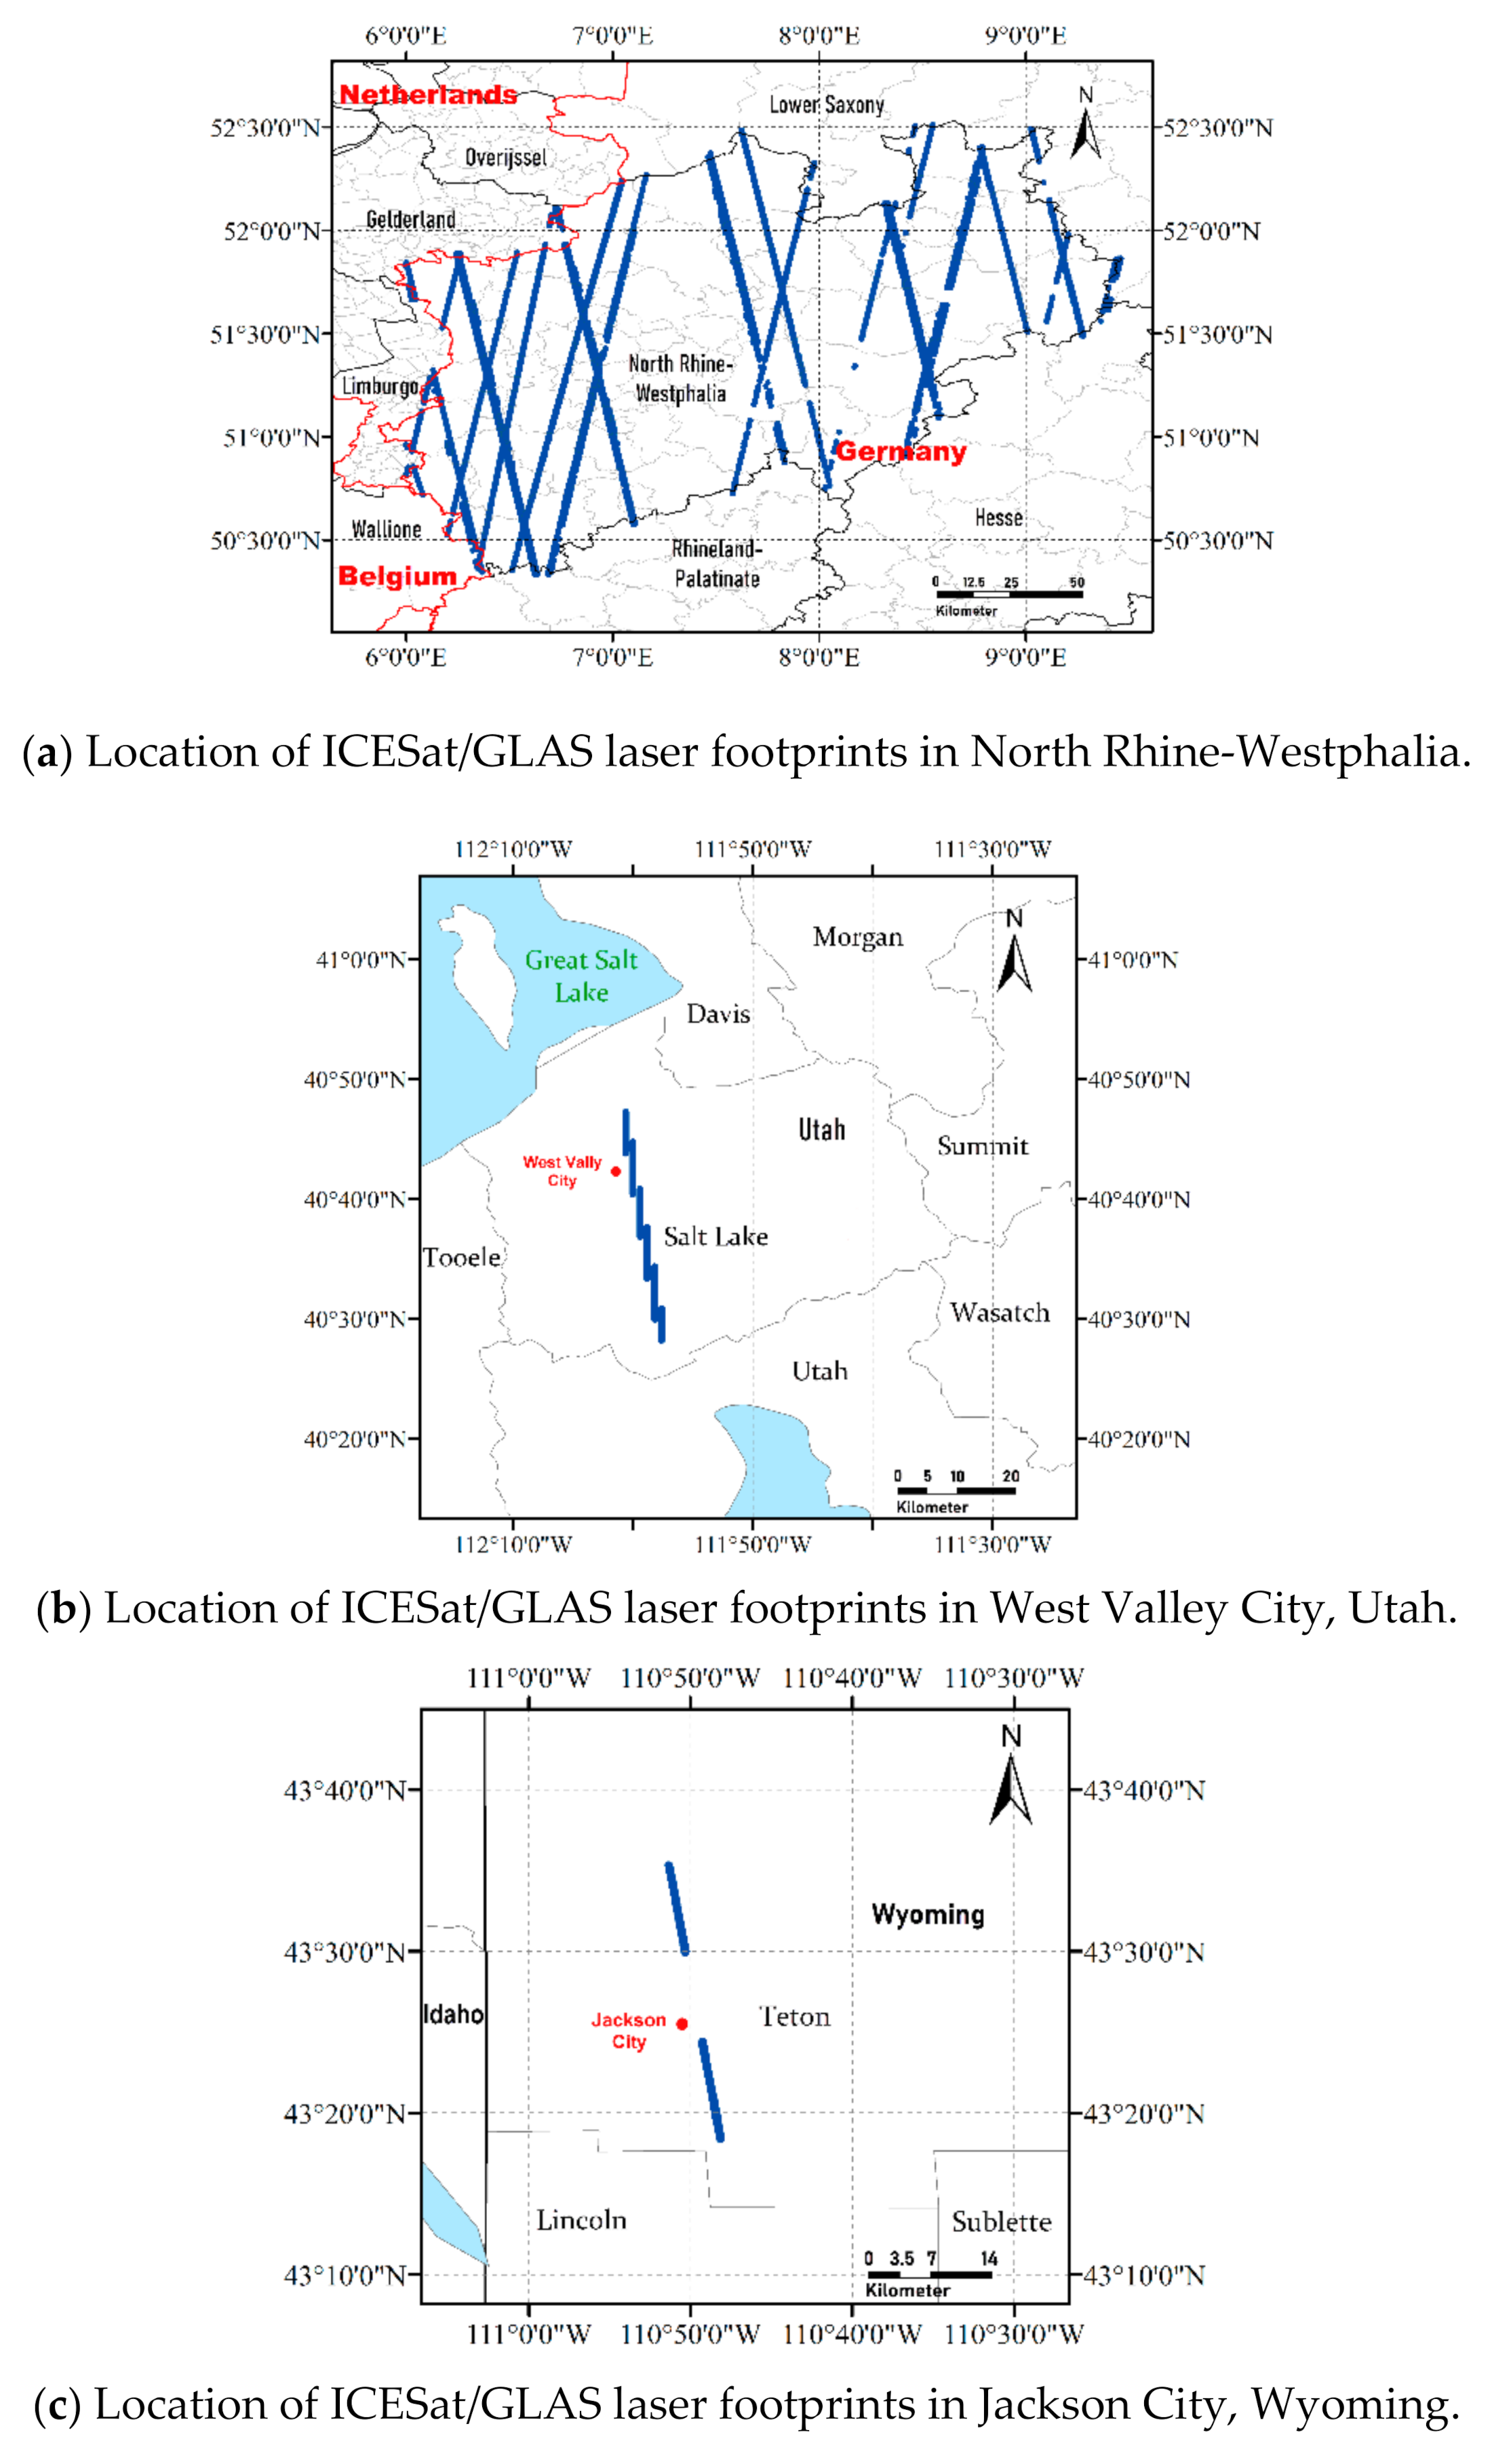
Figure 1. Study area and distribution of ICESat/GLAS laser footprints: (a) is for the topographic prior knowledge establishment; (b,c) are for the final inversion experiment results evaluation.
Remotesensing 13 00424 g001
Figure 2. The procedures of inversion of terrain slope and roughness using ICESat/GLAS full waveform data and Shuttle Radar Topography Mission (SRTM) in the paper. PART Ⅰ is the module for waveform processing, and the PART Ⅱ includes our proposed inversion method and the final accuracy evaluation.
Remotesensing 13 00424 g002
Figure 3. Schematic diagram of laser altimetry system: (a) oblique incidence of the laser pulse emitted by altimeter to the terrain surface and the reception of the echo signal from terrain surface; (b) the constructed locally ground Cartesian coordinate system according to the process in (a) [15].
Remotesensing 13 00424 g003
Figure 4. Example of the SRTM DEMs of the terrain surface within the ICESat/GLAS laser footprint. Each grid has a resolution of 30 × 30 m, and H i 1 i 9 is the elevation of each grid.
Remotesensing 13 00424 g004
Figure 5. The geometric relations between these two coordinate systems changes with satellite orbiting modes: (a) ground coordinate system oxy associated with laser altimetry system during the ascending flight of satellite (in +   x direction) and ground projected plane coordinate system OXY; (b) ground coordinate system oxy associated with laser altimetry system during the descending flight of satellite (in +   x direction) and ground projection plane coordinate system OXY.
Remotesensing 13 00424 g005
Figure 6. Slope angles and roughness sequence inferred from a GLAS laser waveform with constraints: every red point corresponds to a one kind of terrain tan S x , tan S y , V a r Δ ξ and the grid is generated by the point interpolation.
Remotesensing 13 00424 g006
Figure 7. Confidence interval of terrain slope in red and numerical interval of the slope sequence inferred from the GLAS full-waveform with constraints of terrain slope angles in black, and the yellow line is the determined slope. TSMin S l o p e t r u e _ m i n , TSMax S l o p e t r u e _ m a x and TSMean S l o p e t r u e _ m e a n represent the minimum ( 0), maximum and mean value of confidence interval of Slope True separately. ISmin ( S l o p e i n v _ m i n ) and ISmax S l o p e i n v _ m a x represent the minimum and maximum values of range of sequential inversion results of slope values (Inversion).
Remotesensing 13 00424 g007
Figure 8. Inversion results of terrain slope (degree) within the laser footprints of 185 laser spots in West Valley City and 54 laser spots in Jackson City. The Lidar-DEM data refers to the WVC-DEM and JKS-DEM. The class interval of histograms (b,d,f,h) is 0.5 degree.
Remotesensing 13 00424 g008aRemotesensing 13 00424 g008b
Figure 9. Inversion results of terrain roughness (meter) within the laser footprints of 185 laser spots in West Valley City and 54 laser spots in Jackson City. The Lidar-DEM data refers to the WVC-DEM and JKS-DEM. The class interval of histograms (b,d,f,h) is 0.2 m.
Remotesensing 13 00424 g009aRemotesensing 13 00424 g009b
Figure 10. Echo waveform of the undulating terrain surface within the laser footprint: (a) is the lidar point cloud within the laser footprint and (b) is the raster digital elevation model with an average resolution less than 0.5 m, interpolated from lidar point cloud (a); (c) is the received waveform of ICESat/GLAS scattered from the terrain surface of (a), and this waveform has been decomposed into two Gaussians. The slope meaning of this dramatic undulated terrain surface is ambiguous.
Remotesensing 13 00424 g010
Table 1. Proportion of the difference distribution of slope within ±1°.
Slope Difference (°)NumberProportion
(Difference within ± 1°)
Slope (WVC-DEM)—Slope (Inversion)18576.20%
Slope (WVC-DEM)—Slope (SRTM)18566.40%
Slope (WVC-DEM)—Slope (GLAS-ATBD)18527.00%
Slope (WVC-DEM)—Slope (Trigonometric)18517.80%
Slope (JKS-DEM)—Slope (Inversion)5496.30%
Slope (JKS-DEM)—Slope (SRTM)5488.80%
Slope (JKS-DEM)—Slope (GLAS-ATBD)5446.30%
Slope (JKS-DEM)—Slope (Trigonometric)5438.90%
Slope (Lidar-DEM) *—Slope (Inversion)23980.70%
Slope (Lidar-DEM)—Slope (SRTM)23971.50%
Slope (Lidar-DEM)—Slope (GLAS-ATBD)23931.30%
Slope (Lidar-DEM)—Slope (Trigonometric)23922.60%
Slope (Lidar-DEM) * is obtained by taking a plane of best fit of airborne Lidar points within spaceborne laser footprint. Lidar-DEM is the combination of WVC-DEM and JKS-DEM.
Table 2. Proportion of the difference distribution of roughness within ± 0.4 m.
Roughness Difference (meter)NumberProportion
(Difference within ± 0.4 m)
Roughness (WVC-DEM)—Roughness (Inversion)18586.50%
Roughness (WVC-DEM)—Roughness (SRTM)18585.40%
Roughness (WVC-DEM)—Roughness (GLAS-ATBD)18568.60%
Roughness (WVC-DEM)—Roughness (Shi)18573.50%
Roughness (JKS-DEM)—Roughness (Inversion)5496.30%
Roughness (JKS-DEM)—Roughness (SRTM)5494.40%
Roughness (JKS-DEM)—Roughness (GLAS-ATBD)5472.20%
Roughness (JKS-DEM)—Roughness (Shi)5470.30%
Roughness (Lidar-DEM)—Roughness (Inversion)23988.70%
Roughness (Lidar-DEM)—Roughness (SRTM)23987.40%
Roughness (Lidar-DEM)—Roughness (GLAS-ATBD)23969.40%
Roughness (Lidar-DEM)—Roughness (Shi)23972.80%
Table 3. Quantitative evaluation of inversion slopes.
Calculated Slope (°)Slope True-Value (°)MAE (°)RMSE (°)
Inversion slopeWVC-DEM slope0.6940.835
SRTM slopeWVC-DEM slope0.8621.051
GLAS-ATBD slopeWVC-DEM slope1.4720.874
Trigonometric slopeWVC-DEM slope2.1442.604
Inversion slopeJKS-DEM slope0.5751.561
SRTM slopeJKS-DEM slope0.7691.831
GLAS-ATBD slopeJKS-DEM slope1.2681.939
Trigonometric slopeJKS-DEM slope1.7322.245
Inversion slopeLidar-DEM slope0.6671.054
SRTM slopeLidar-DEM slope0.8411.279
GLAS-ATBD slopeLidar-DEM slope1.4261.237
Trigonometric slopeLidar-DEM slope2.0512.538
Table 4. Quantitative evaluation of inversion roughness.
Calculated Roughness (m)Roughness True-Value (m)MAE (m)RMSE (m)
Inversion roughnessWVC-DEM roughness0.1750.268
SRTM roughnessWVC-DEM roughness0.2370.275
GLAS-ATBD roughnessWVC-DEM roughness0.3580.303
Shi RoughnessWVC-DEM roughness0.3110.351
Inversion roughnessJKS-DEM roughness0.1540.182
SRTM roughnessJKS-DEM roughness0.1940.235
GLAS-ATBD roughnessJKS-DEM roughness0.310.28
Shi roughnessJKS-DEM roughness0.2920.407
Inversion roughnessLidar-DEM roughness0.1710.25
SRTM roughnessLidar-DEM roughness0.2280.274
GLAS-ATBD roughnessLidar-DEM roughness0.3470.298
Shi roughnessLidar-DEM roughness0.3070.37
Publisher’s Note: MDPI stays neutral with regard to jurisdictional claims in published maps and institutional affiliations.