Article

Continuous Multi-Angle Remote Sensing and Its Application in Urban Land Cover Classification

1
National Engineering Research Center for Multimedia Software, Computer School & State Key Laboratory of Information Engineering in Surveying, Mapping and Remote Sensing, Wuhan University, Wuhan 430079, China
2
Institute of Future Cities, The Chinese University of Hong Kong, Shatin, New Territories, Hong Kong, China
3
Department of Geography and Resource Management, The Chinese University of Hong Kong, Shatin, New Territories, Hong Kong, China
4
School of Mathematics and Statistics & National Engineering Laboratory for Algorithm and Analysis Technologiy on Big Data, Xi’an Jiaotong University, Xi’an 710049, China
*
Author to whom correspondence should be addressed.
Remote Sens. 2021, 13(3), 413; https://doi.org/10.3390/rs13030413
Submission received: 22 December 2020 / Revised: 14 January 2021 / Accepted: 20 January 2021 / Published: 25 January 2021
(This article belongs to the Section Remote Sensing Image Processing)

Abstract

:
Because of the limitations of hardware devices, such as the sensors, processing capacity, and high accuracy altitude control equipment, traditional optical remote sensing (RS) imageries capture information regarding the same scene from mostly one single angle or a very small number of angles. Nowadays, with video satellites coming into service, obtaining imageries of the same scene from a more-or-less continuous array of angles has become a reality. In this paper, we analyze the differences between the traditional RS data and continuous multi-angle remote sensing (CMARS) data, and unravel the characteristics of the CMARS data. We study the advantages of using CMARS data for classification and try to capitalize on the complementarity of multi-angle information and, at the same time, to reduce the embedded redundancy. Our arguments are substantiated by real-life experiments on the employment of CMARS data in order to classify urban land covers while using a support vector machine (SVM) classifier. They show the superiority of CMARS data over the traditional data for classification. The overall accuracy may increase up to about 9% with CMARS data. Furthermore, we investigate the advantages and disadvantages of directly using the CMARS data, and how such data can be better utilized through the extraction of key features that characterize the variations of spectral reflectance along the entire angular array. This research lay the foundation for the use of CMARS data in future research and applications.

Graphical Abstract

1. Introduction

A variety of sensors have been brought into use since the launch of the first Earth observation satellite, including visible light, infrared ray, hyperspectral, synthetic aperture radar (SAR), dual light sensors for stereo mapping, etc. [1]. With the increasing number of observation satellites being launched, the Global Earth Observation System of Systems (GEOSS) has been established to make better use of those satellites [2]. Although spectral reflectances of the same land cover are different under different observation angles, traditional RS is deficient in providing a full coverage via an array of observation angles. We still have problems in establishing a precise model for the relationship between spectral reflectance and different observation angles. Finding an exact expression for the spectral reflectance of the earth surface at different observation angles is still a challenge [3,4,5].
Traditional optical remote sensing (RS) satellites and sensors (e.g., MODIS, TM/ETM+, CBERS, ASTER, Quickbird) could only obtain data with one or a limited number of discontinuous angles of observation. Because the insufficient number of observation angles and atmospheric condition may vary at different observation times for most traditional remote sensing imageries, a precise and accurate model is yet to be developed that can depict the relationship between spectral reflectance of terrestrial features and changing observation angles. Images that are acquired based on a continuous array of observation angles may help to develop such a model.
The classification of the earth’s surface is one of the most common applications of RS data [6,7]. In addition to single RS image, temporal and multi-source RS data have been used for classification over the decades. It has been demonstrated that, with additional sources of data, classification accuracy that is based on single RS image [8,9,10,11] and multi-source RS data [12] can be effectively improved. Multi-observation-angle data can also be used for stereoscopic observation [13] and analysis of the influence and correction in spectral reflectance field from ground to space [14,15].
Because video satellite data contain much more information than conventional discontinuous angle RS images, they will play an important role in earth observation and smart city research [16,17]. Nowadays, we can efficiently and effectively obtain and store video data with the advancement of spatial information technology.
Continuous multi-angle remote sensing (CMARS) data are satellite data acquired by video sensors that can continuously stare at a target area. They are video data acquired with a continuously changing observation angles (i.e., multi-angle) within one orbital period. Hundreds of discrete images can also be extracted from this set of CMARS data with each captured at a different angle of observation. Several video satellites are now in operation, being equipped with video sensors, advanced processors, and high accuracy altitude control equipment. For example, LAPAN-A1(A2), Sky-sat-1 video, Iris, Jilin-1 agile video satellite, and OVS—1A(1B) have been launched to obtain the new kind of optical satellite dynamic video RS data. Video data from satellites, especially those with high resolution, can be widely used in a variety of applications, such as vehicle, ship and motion detection, traffic density monitoring, image registration, super resolution reconstruction, scene interpretation, etc. [18,19,20,21,22,23,24,25,26,27].
The purpose of this study is to analyze the characteristics of the CMARS data and evaluate the advantages of using them in the classification of the earth surface. We will study the new dimension that is offered by CMARS data and the ways that we can use them to improve land cover classification. A critical examination will be made against the traditional RS data.
The remainder of this paper is organized, as follows. In Section 2, the characteristics of CMARS data and their differences from traditional RS data are investigated. We discuss the classification results based on the raw CMARS data by support vector machine (SVM) in Section 3. Section 4 uses extracted geometric features from CMARS data and the underlying dimensions of principal component analysis (PCA) for classification in order to reduce the angular dimension of CMARS data. A summary and conclusion is then made in Section 5.

2. Characteristics of the Experimental Data

2.1. Differences between CMARS Data and Traditional RS Data

The satellite video data used in this study were obtained from the Jilin-1 agile video satellite that was made by Chang Guang satellite technology Co., Ltd. (www.charmingglobe.com), and it was launched on 7 October 2015 [28]. Differing from the traditional earth observation satellites, this satellite can obtain high-resolution multispectral video data of the same scene at a maximum duration of 120 s with 25 frames per second. The video width can be extended to 3600 × 2500 pixels. The ground resolution of every pixel at the nadir point is up to 1.13 m. It contains the red, green, and blue band. The Jilin-1 agile video satellite has the ability to obtain hundreds of uncompressed continuous multi-observation-angle images instead of the highly compressed video data, such as H.264, H.265, and MP4. Thus, it generates and retains much more information, but simultaneously increases the data volume.
Figure 1 shows three color images of different observation angles that were selected from the experimental CMARS data. It can be observed that the relationship between buildings and their shadows changes from image-to-image. The train on the light rail and vehicles on the road are obviously moving during the period of continuous observation.
Traditional RS data only contain images that are taken from one or several discontinuous observation angles of the same location in one orbiting period. With the capability of obtaining continuous images of the same location within a short period of time, the new CMARS data with continuous multiple observation angles have the following advantages over the traditional data:
  • similar solar radiation;
  • similar solar incident angle;
  • similar atmospheric conditions; and,
  • same ground objects except for the moving objects (for example, vegetation in summer and winter is totally different, and dry soil is different after rain).
With the advantages of obtaining images under similar condition of solar radiation, solar incident angle, atmospheric condition, etc., differences of spectral reflectance among different observation angles can be more accurately modeled. This means that we can establish a more exact relationship between land cover and spectral reflectance along the trajectory of the observation angles.
Every land cover exhibits different spectral reflectance along the changing observation angles. The reflectance of some bands may increase, while that of the others may decrease. Some may be similar to specular reflection while some others may be similar to diffuse reflection. Such information can obviously increase our capability in land cover recognition and classification. With more optical video sensors being deployed in the future, we can even establish a highly accurate relationship among different optical RS satellites that are based on the compatible angles.
From the perspective of CMARS data, we consider that every observation angle of the same pixel is different. It is similar to the observation of pyramid from different observation angles with the same solar incident angle.
In this paper, we analyze the CMARS data at the pixel level in order to better understand the similarity and difference among different observation angles. Because the CMARS data are hundreds of times larger than the traditional RS data, if we use the whole original dataset, then the computation time will be too expensive. Thus, we design an efficient experimental procedure for classification from single angle to all angles in order to unravel the relationship between the number of angles used and classification accuracy achieved. In order to be parsimonious, we also try to take advantage of the geometric features and commonality in CMARS data for classification.

2.2. Experimental Data

In the experiment, we choose an urban area of 600 × 950 pixels in New Delhi with a rich variety of land covers, which amounts to a 1.13-Gigabyte of data. New Delhi is one of the largest cities in the world. The spectral reflectance of high reflective surface in this area exhibits a dramatic changing curve, which shows a most representative characteristic of CMARS data. Table 1 efly describes the experimental data.
To obtain ground truth data, we first find the location of the experimental area in Google Earth to obtain higher resolution image and register it to one image of CMARS data. Subsequently, we compare the data from Google Earth and the original CMARS data to select manually 11 different land covers (see Table 2) according to both data. Figure 2 shows a color image of CMARS data from the first angle and the ground-truth labeled map of 11 classes.

2.3. Pixel Level Analysis

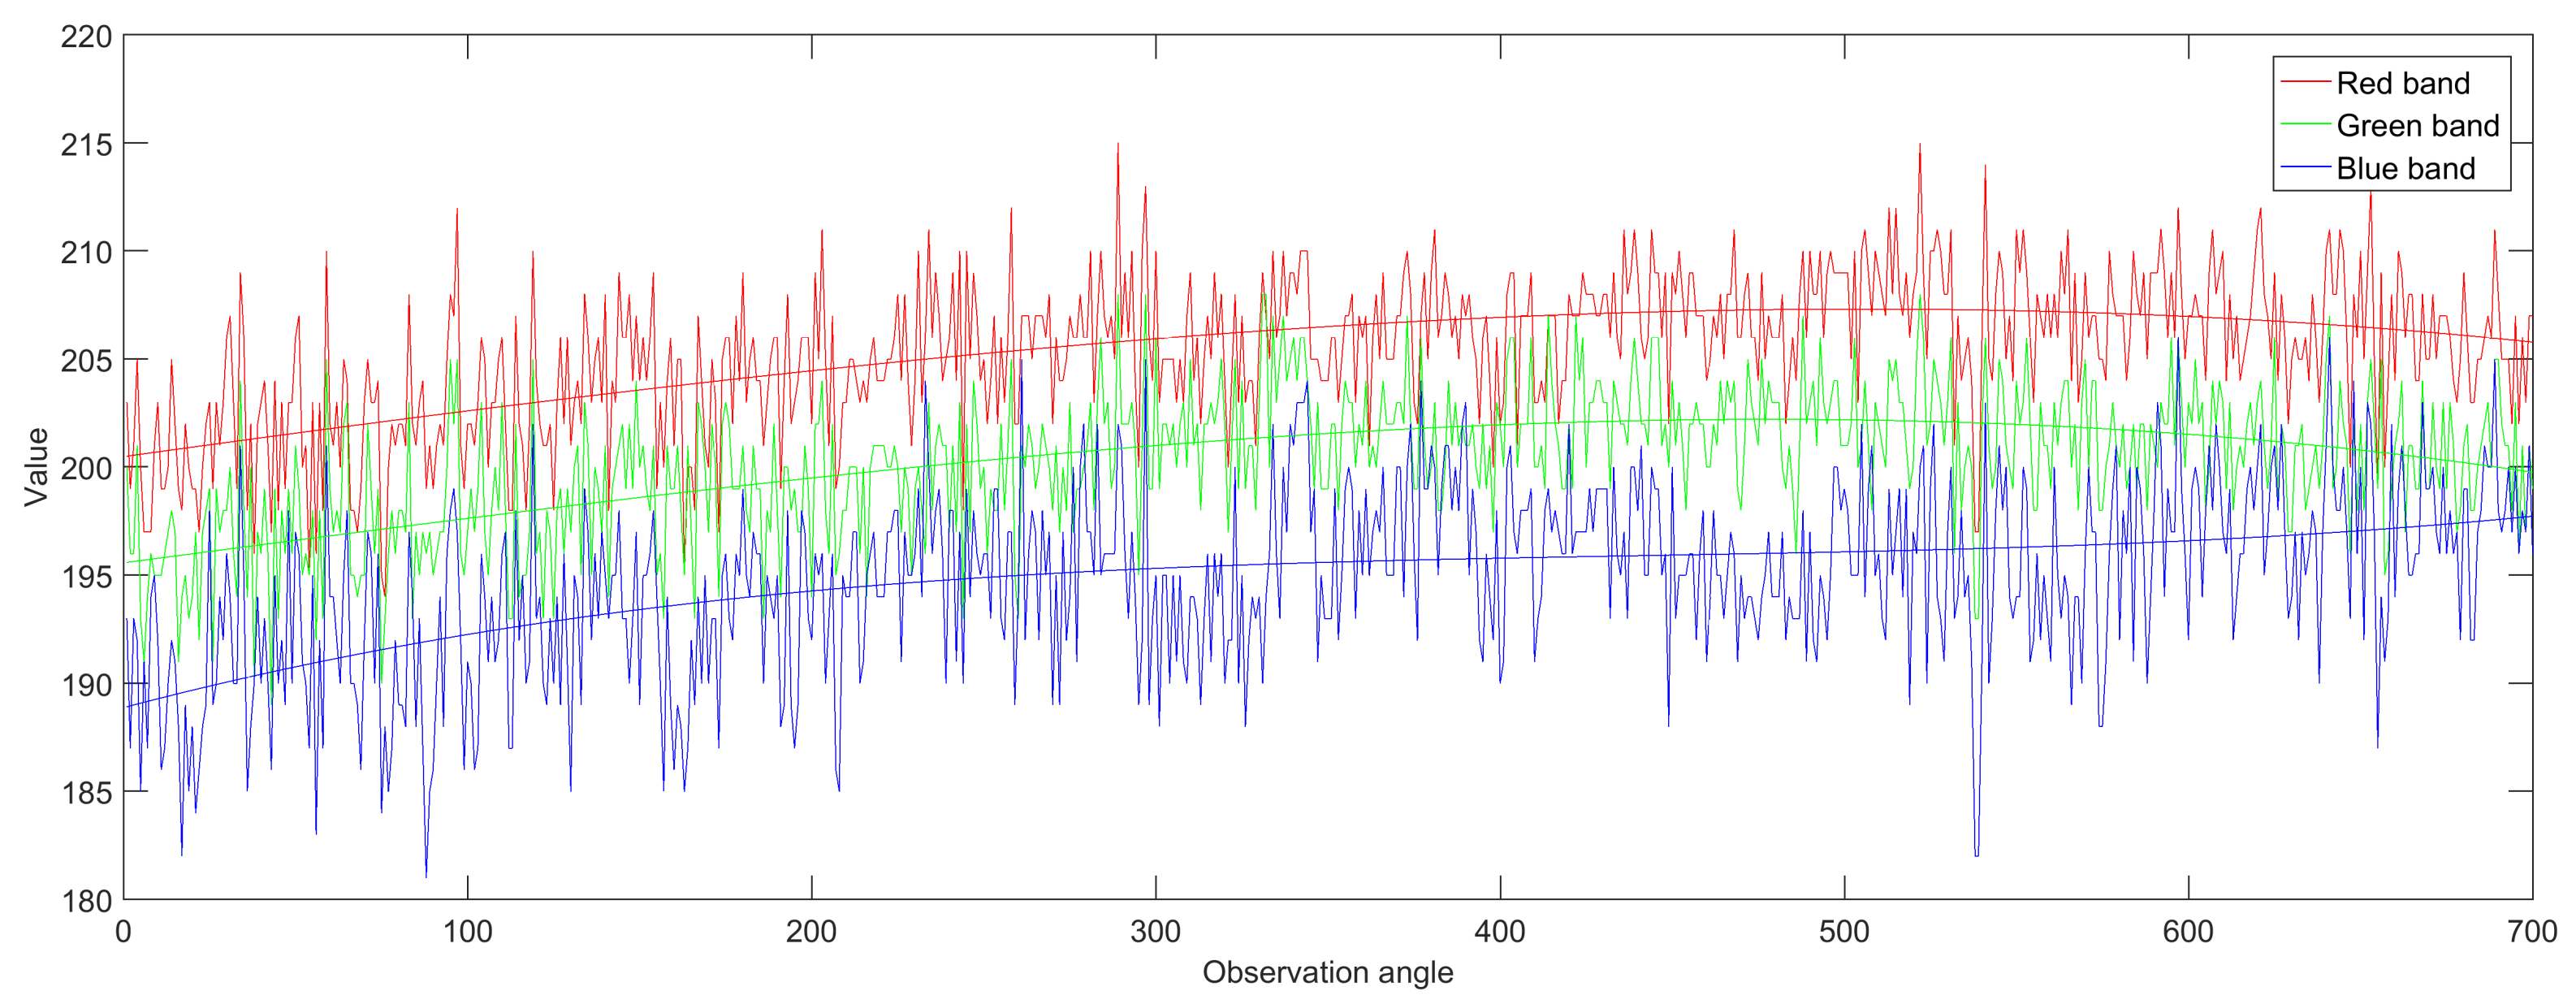
Figure 3 shows the polyline of spectral values of the red, green, and blue bands of a randomly selected pixel of the soil class under all of the observation angles. In general, at the pixel level, digital numbers of every band exhibit great variation along the observation angles with fluctuations around an obvious trend. Apparently it is difficult to discern some objects at the pixel level on the basis of one single observation angle.
However, from the fitted curves, we can observe that spectral values intermittently increase, decrease, or remain relatively constant within different angle ranges under different bands. The spectral reflectance of the three bands are rather different at some angles. Because the original CMARS data are rather noisy, we can only roughly discover the characteristics of the data. Thus, using a single angle for classification is unreliable. However, the trends along the variation of angles exhibited by different land covers may be more useful in distinguishing different land covers. Additionally, it will achieve higher classification accuracy.

2.4. Analysis of Multiple Classes

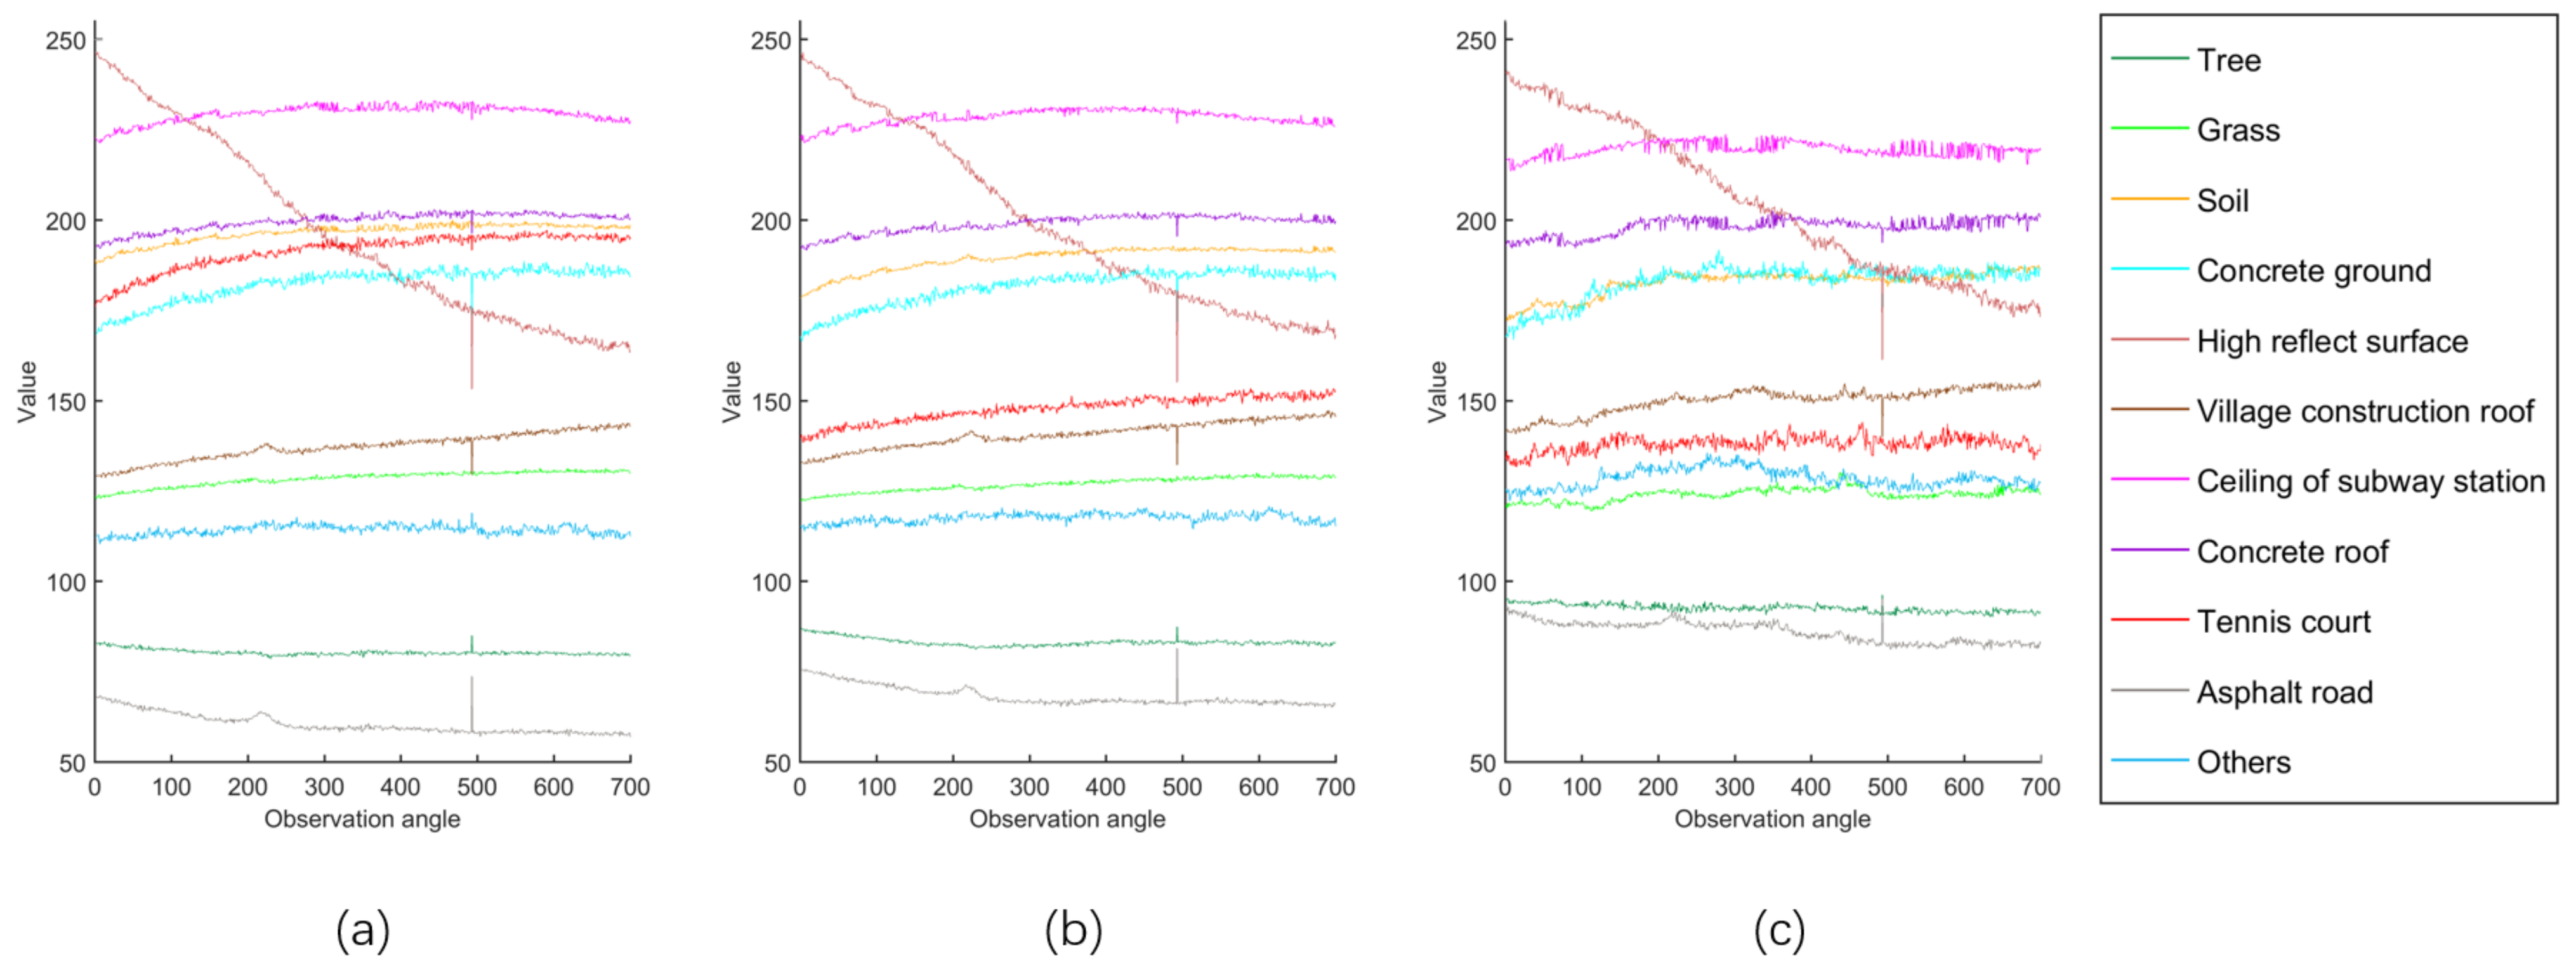
Figure 4 displays the spectral reflectance of 11 land covers in three bands. Each curve means the average value of all samples in one class changes with observation angles. It shows that every land cover exhibits different spectral reflectance along the changing observation angles. Some spectral reflectance curves may increase, while others may decrease. Some may be similar to specular reflection, while some others may be similar to diffuse reflection. Such information can obviously increase our capability in land cover recognition and classification.
The high reflecting surface exhibits a significant reduction in digital number from 245 to 170 as the CMARS data changes its observation angles during the image acquisition time. It is found that it starts off as a specular reflection from a metallic surface roof, which gradually reduces in reflectance. This phenomenon is consistent among the three visible bands. Asphalt road is the other land cover showing reduction in reflectance with the changing observation angles. However, the reduction is much more subtle.
A few land cover categories exhibit a gradual increase in reflectance as the observation angles change. These land covers include the tennis court, village construction roof, and concrete ground. The increasing trend is more consistent in the blue and green bands.
We also discover that the average digital number at the 493th angle is obviously abnormal in Figure 4. After checking the original color image of this angle, we discover a large displacement error. Most pixels of this image under this angle are at the wrong location because of this displacement error, and, thus, with wrong spectral values in the three bands. If one unfortunately uses this angle for classification, the result bounds to be erroneous. However, we can easily discover such abnormality from the CMARS data and make suitable adjustment for it.
All of the remote sensing data are embedded with noise. It is difficult to detect and analyze the noise distribution by just using only one image of the same location taken at a particular angle in traditional RS. However, with CMARS data, it is possible for us to discover the noise pattern and abnormality in the dataset. With such a wealth of information obtained from multiple observation angles, CMARS data can help us to improve the classification accuracy to a certain extent. The following experiment gives support to it.

3. Results

SVM is a popular and effective classifier for classifying traditional RS data [29,30,31,32]. It performs classification that is based on the statistical learning theory of structural risk minimization. The raw multi-dimensional data are transformed into linearly separated higher-dimensions. For the training set with two different labels, the SVM training algorithm maps training data to a space and learns a classifier that can best separate two classes with the maximum margin between them. Subsequently the learned classifier is used to classify the testing set. The successful SVM can then be used for classification. In the following, the multiple-class SVM, which is implemented in Matlab with the support of LIBSVM toolbox [33], is employed as a basis for the evaluation of land cover classification while using CMARS data. It is difficult to find a traditional RS image with similar solar and atmospheric condition to the experimental CMARS data. Therefore, for a fair comparison, one angle of CMARS data is selected as the traditional RS data.

3.1. Single-Angle Classification on Raw Data

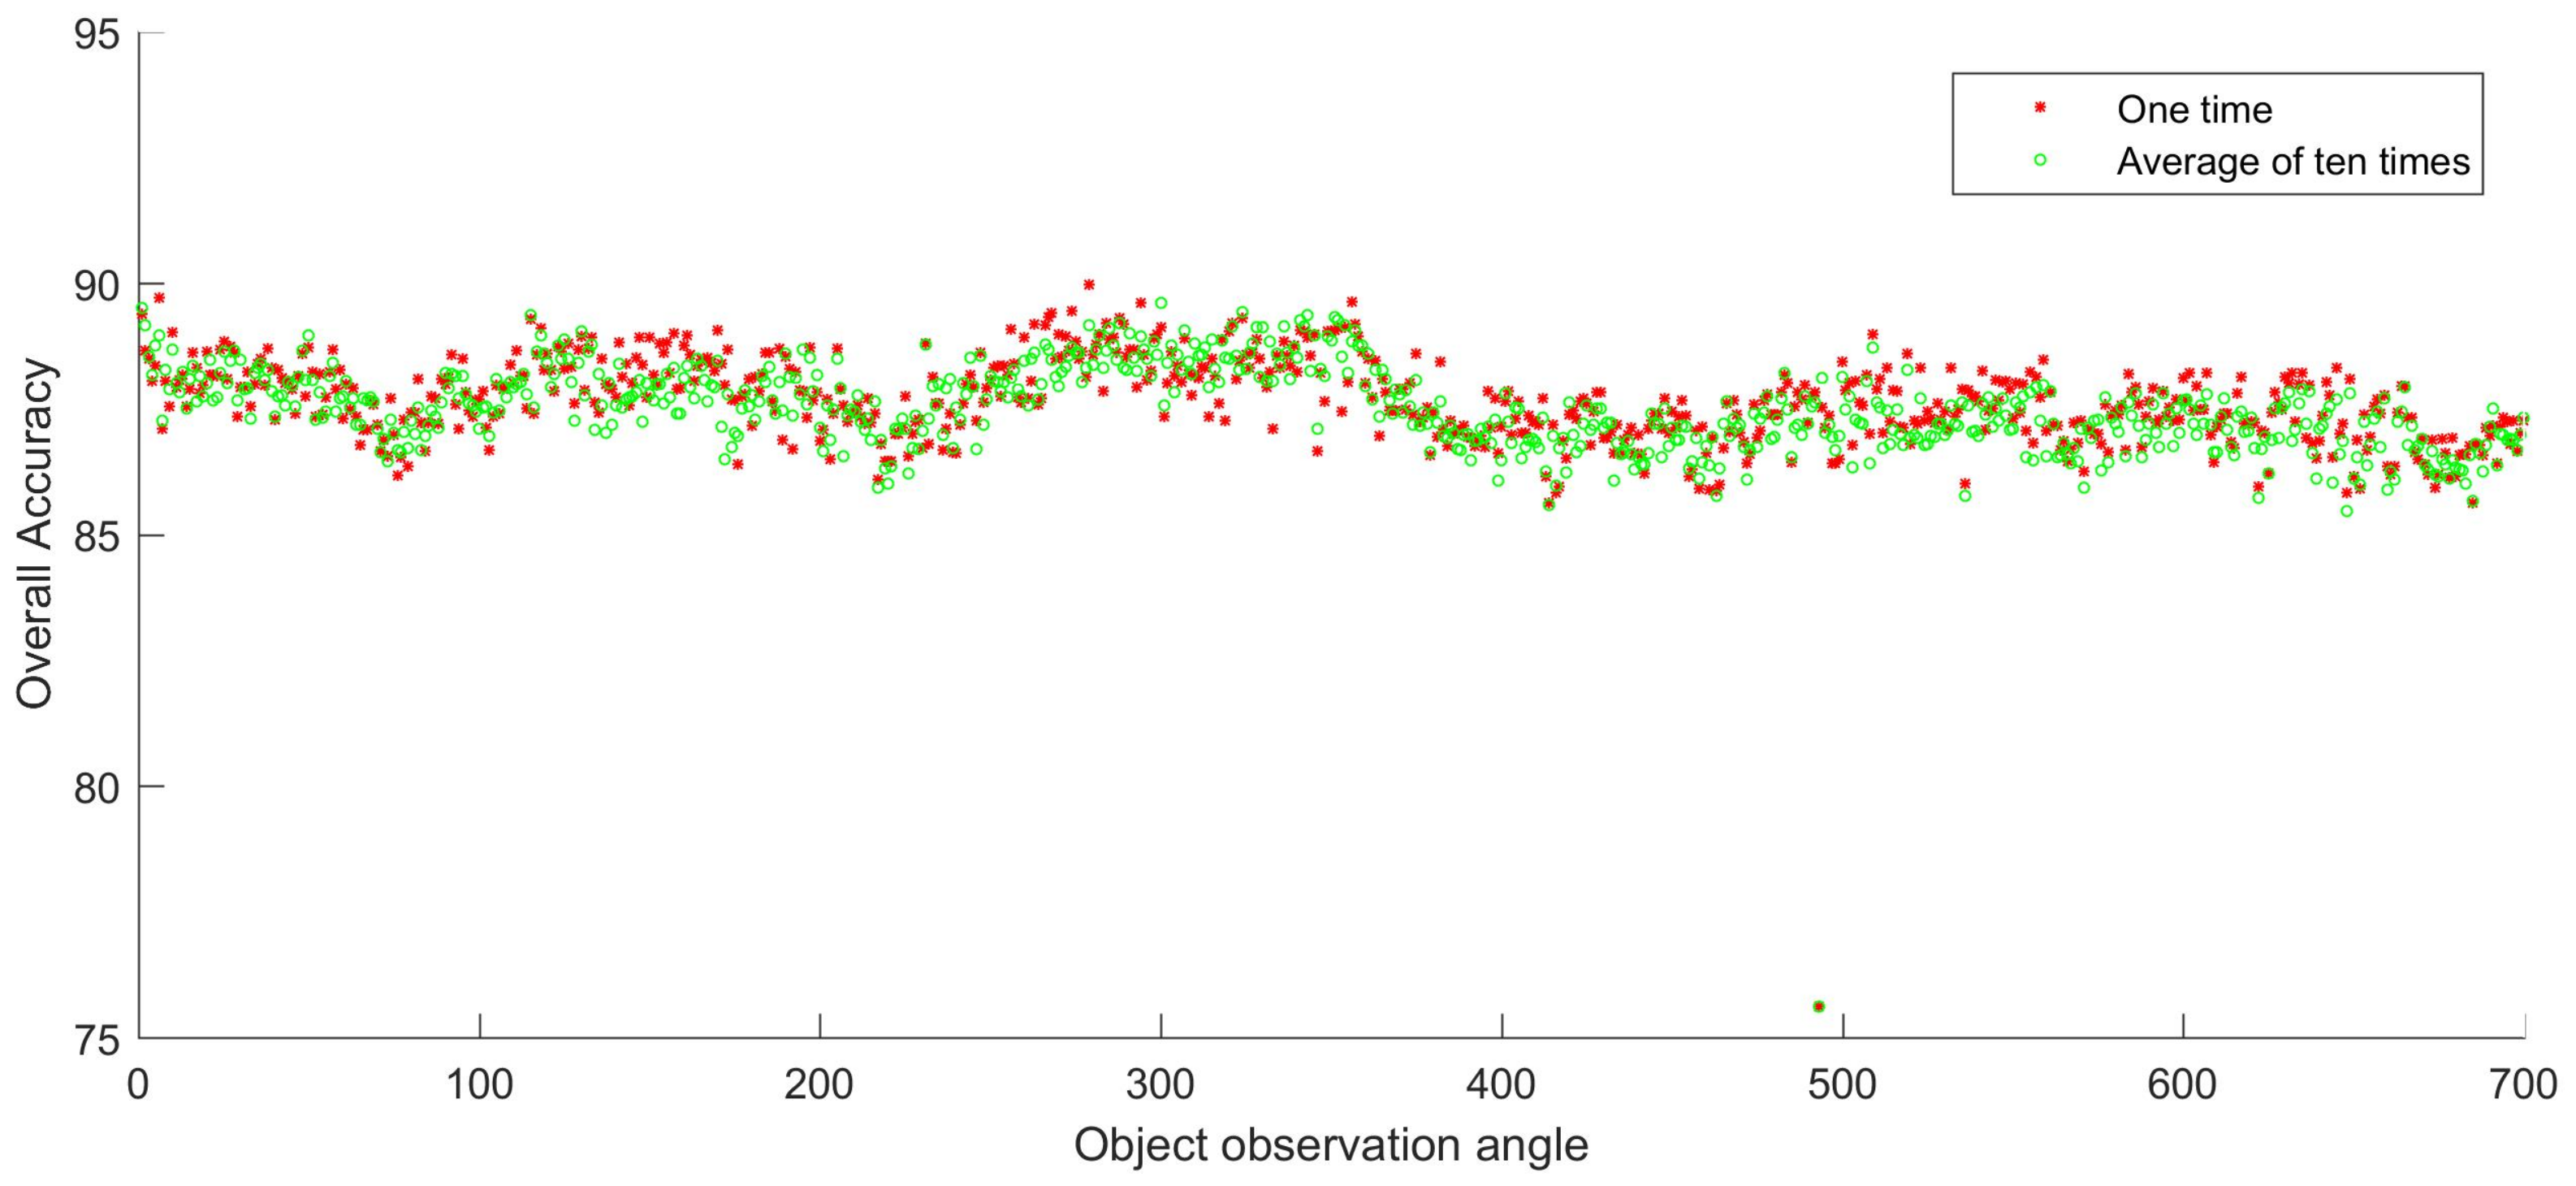
In this experiment, we evaluate classification performance of each angle using random 5% samples as the training set. The remaining 95% samples are testing set. The overall accuracy (OA) of every angle ranges from 85.82% to 89.97%, except for the 493th angle, as shown in Figure 5. The highest OA is 89.97% and it comes from the 279th angle. The OA of one time sampling and the average of ten times sampling indicates that the distribution patterns obtained from two sampling strategies are rather similar. It demonstrates that the random choosing of training set only has a little impact on the result of classification. Figure 5 also shows that there is a certain level of similarity and diversity among the images of different angles. The images of adjacent angles are more similar than those farther away. Besides the overall accuracy of classification, Table 3 displays the confusion matrix that is based on the first angle data.

3.2. Multiple-Angle Classification on Raw Data

In order to capitalize on the rich information captured at each angle and yet to minimize the plausible information redundancy among various angles, the selection of angles for classification becomes very important in order to achieve a high level of classification accuracy with low computational cost. Without prior knowledge about, and presumption of, the information conveyed by each angle, we assume that there is a certain level of redundancy among different angles. Based on the view that spectral reflectances of adjacent angles should be more similar than those of distant angles, we assume that information redundancy is higher among adjacent angles. Therefore, it might not be necessary to use all of the angles for classification. Instead of using all angles, we can select some of the angles for the classification task.
In this experiment, multiple-angle images are used for classification. In order to strike a reasonable trade-off between exhaustive investigation and computational cost, we use the doubling principle to determine the number of angles (i.e., 2, 4, 8, 16, 32, 64, 128, 256, 512, and 700 angles). Each sample of multiple-angle data can be inputed to the multiple-class SVM as a vector. For a selected number of angles, we take 100 random samples of this angle combination and then calculate the mean and standard deviation of these 100 times experiments for the evaluation of classification accuracy. 700 angles only have one combination, so there is 0 standard deviation. Different training-set ratios are also investigated. The overall classification accuracies of these series of multi-angle experiments are summarized in Table 4.

3.3. Classification with Extracted Geometric Features

It appears to be best to use the representing features of the variation of spectral reflectance across the whole array of angles for classification because it is hard to know the best angles for classification ahead of time and different combinations of angles will bring different classification accuracies. Not only can it minimize the volume of inputs, but it can also pick out critical features that represent the entire variation of the spectral signatures of each land cover for classification. It can also lower the computational cost.
Figure 4 shows that we can classify land covers from the original spectral reflectance in each band at all angles. A more effective way may be to extract key features of such a variation of spectral values along the angles for classification. Based on this idea, we attempt to extract geometric features and use their parameters to classify the land covers. In our experiment, we extract the features and associated parameters while using linear and curve fittings. These parameters reflect the spectral characteristics along the angular dimension and they can obviously reduce the data dimension and computational cost. The fitting line and curve can also alleviate the problem of noise in a certain way and show the relationship between spectral reflectance and observation angles.
For straight-line fitting, we choose a piecewise-linear-function to better capture the characteristics of the features of the land covers. We obtain the two-piece linear function that best fits the mean values of the 11 land covers, and use four points of the kinked line as parameters for classification.
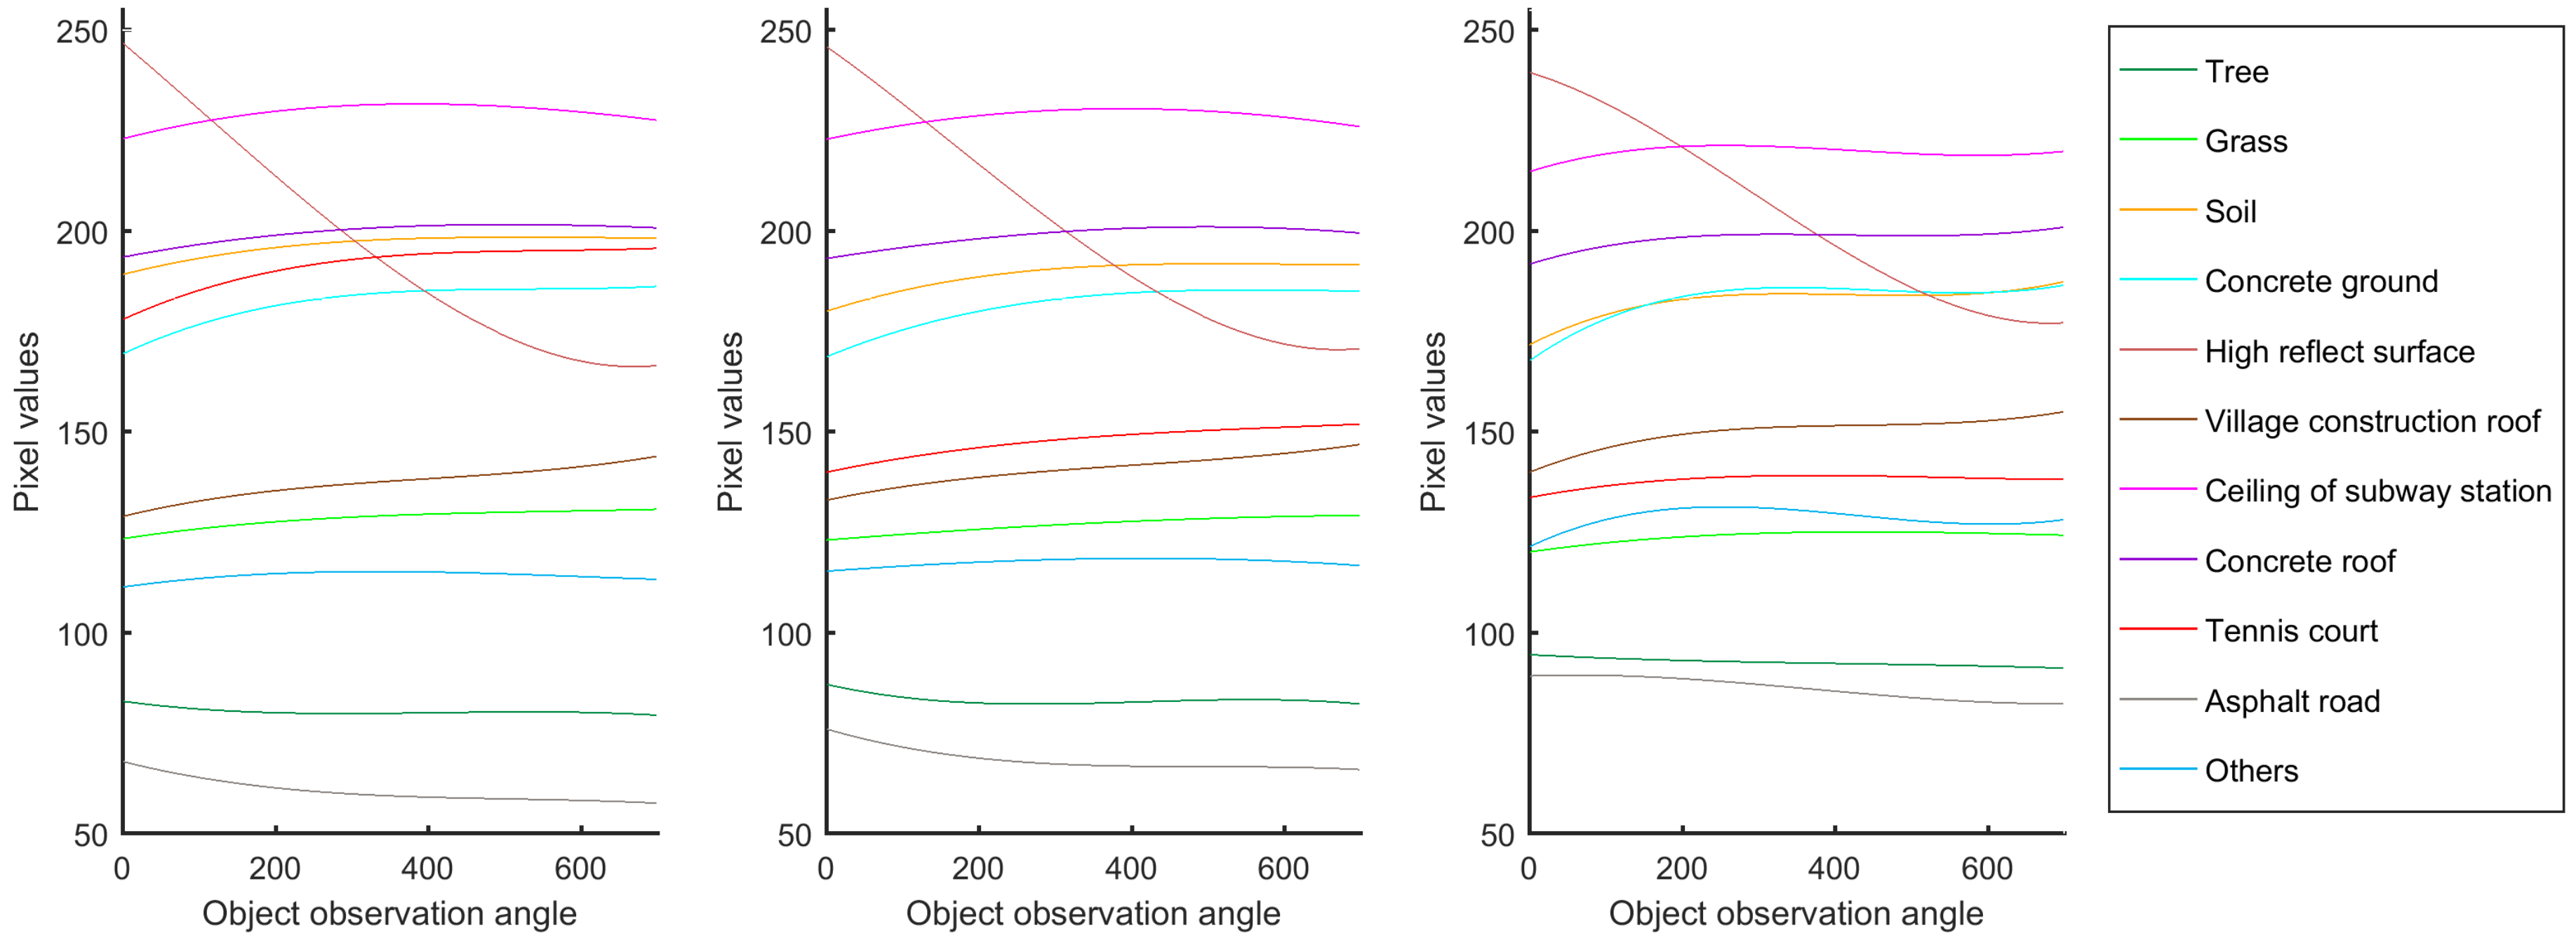
For curve fitting, we choose the cubic curve in order to extract the features from the original data. Figure 6 shows the best-fit curves to the 11 land covers in terms of the three bands along the observation angles. We use the fourr parameters representing the cubic curve for classification.
Table 5 summarizes the overall classification accuracy under the SVM classifier while using parameters of the two-piece linear function and cubic-curve function.

3.4. Classification Via PCA

In the classification with extracted geometric features, we are still using the original CMARS data. Instead of using all angles, we only use the representative ones identified through best-curve fitting. Such data reduction does not directly take the commonality in the CMARS data into account. A more direct approach is to achieve data parsimony through dimension reduction. In place of the original CMARS data, we can use the underlying dimensions of the data for classification. Principal component analysis (PCA) [34,35] is one of the most widely applied dimension reduction techniques in remote sensing image analysis [36,37], which can project the original data onto the underlying dimensions and use the first few principal components that preserve most of the total variance of the data. A certain degree of commonality and complementarity exists among the multi-angle data, based on the classification results of traditional RS data and CMARS data in Section 3. This indicates that the dimension reduction of the data is possible and beneficial for a better classification accuracy and less computational cost. Thus, we use PCA to extract the underlying dimensions of the CMARS data for classification.
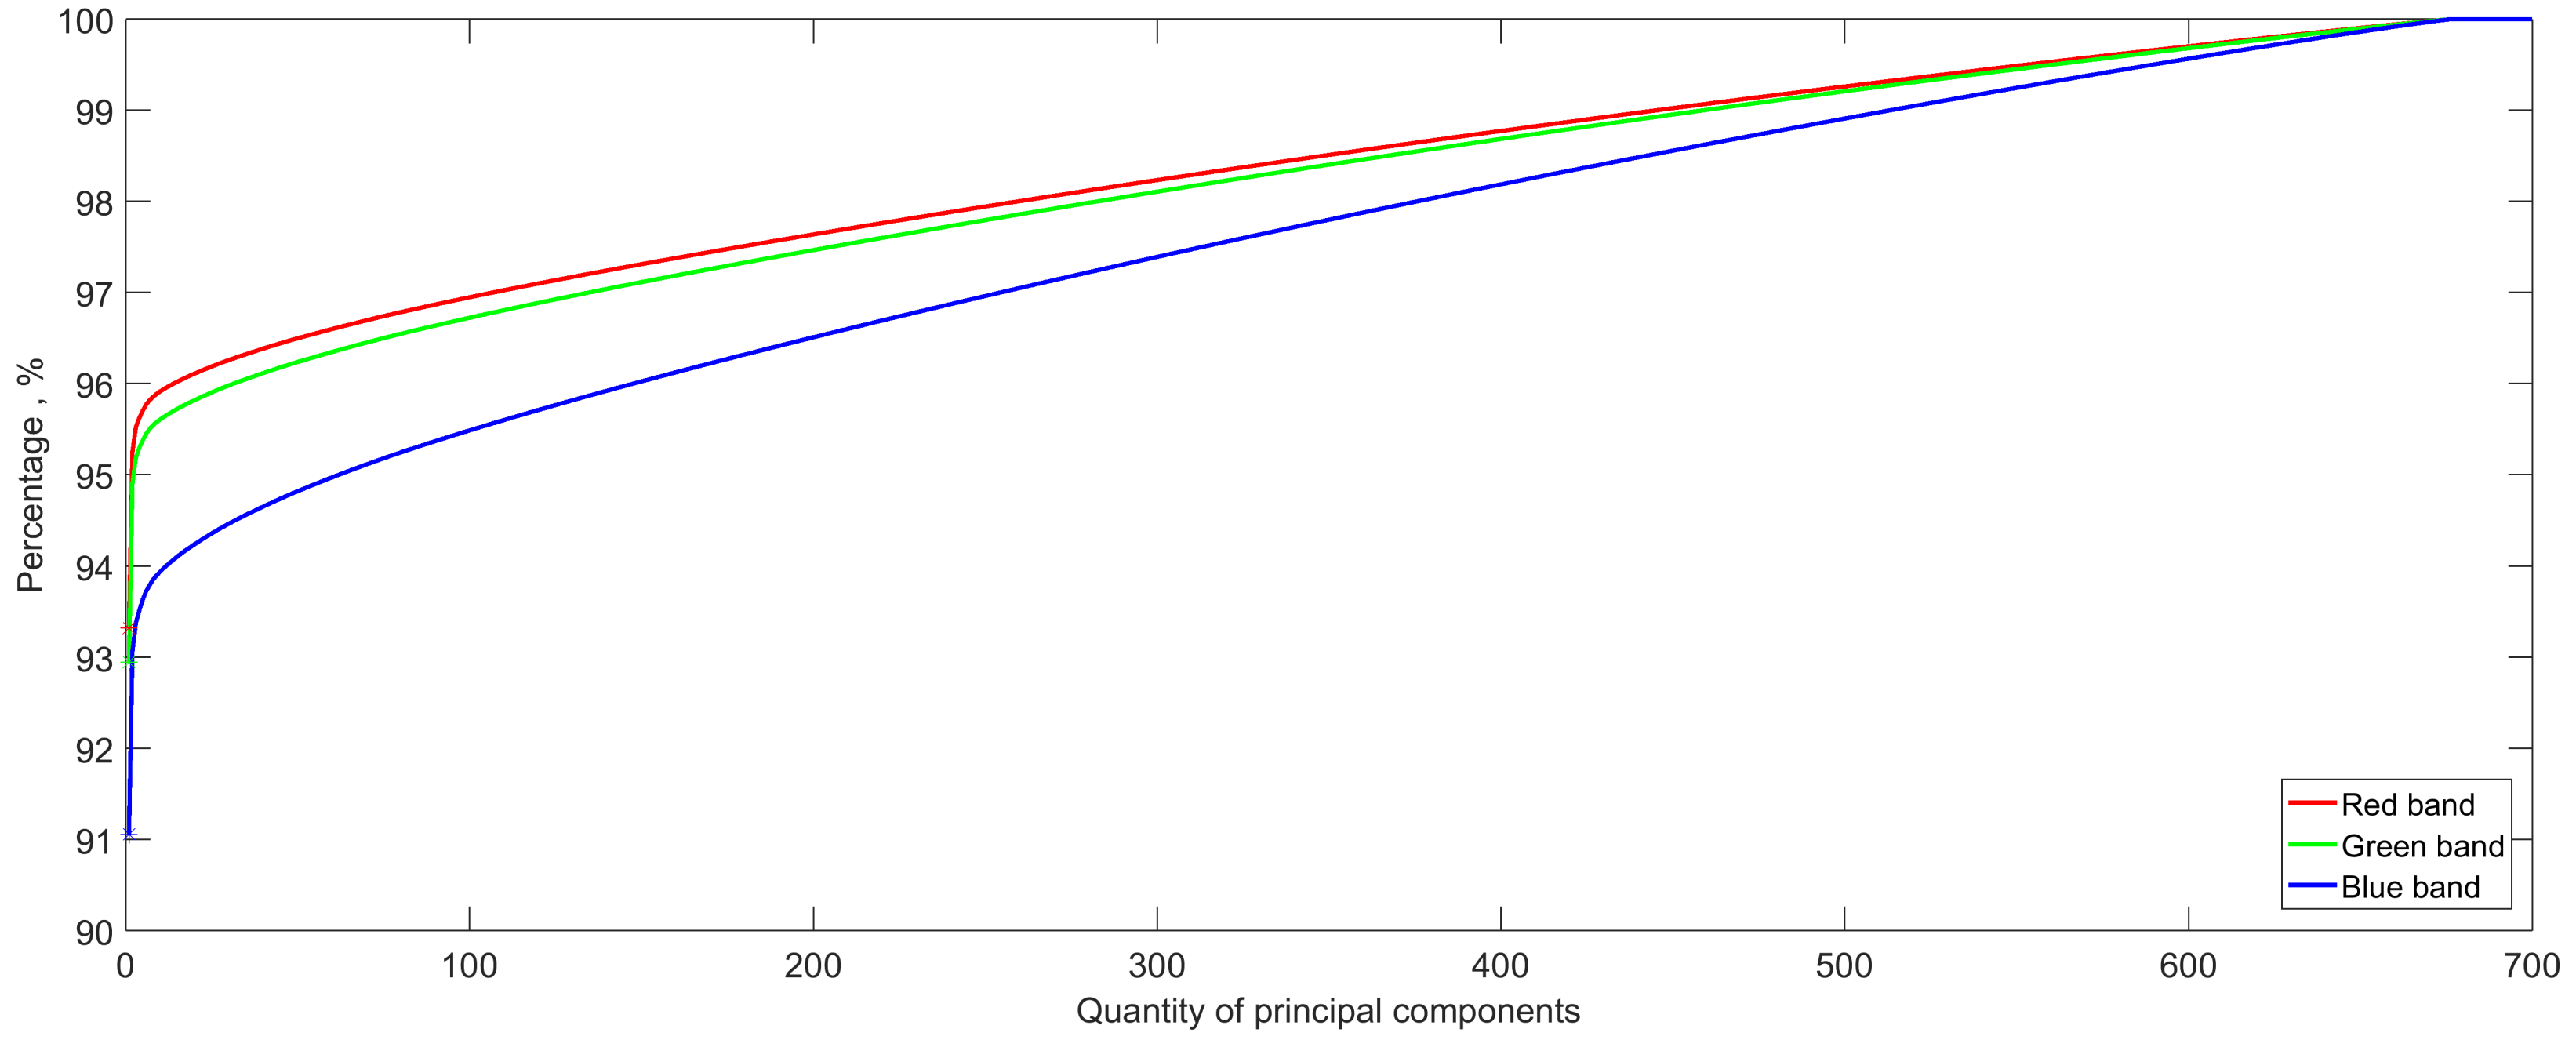
Figure 7 shows the total variance that preserved up to a certain number of components under the red, green, and blue bands after PCA. It can be observed that the first principal component accounts for 93%, 92%, and 91% of the variance of the red, green, and blue bands, respectively. There is a high degree of commonality exists among the angles. Therefore, for classification, it might be sufficient to use just the first or first several components with only a very small portion of the variance not being accounted for.
For illustration, we appy thle doubling principle and use first 1, 2, 4, 8, 16, 32, 64, 128, 256, 512, and 700 principal components as a basis for classification. Different training-set ratios (i.g., 1%, 2.5%, 5%, 10%, 20%, 40%, and 80%) are also considered in the experiment. Table 6 lists the results.

4. Discussion

In Table 3, it can be observed that some land covers (e.g., concrete ground and village construction roof) have a lower classification accuracy than others by using only one observation angle (or traditional RS data). More information from additional observation angles may be useful in achieving better discernment.
By comparing with traditional RS data presented in Section 3.2, we can clearly see that using more angles as input can generate higher classification accuracy and smaller standard deviation. The overall accuracies presented in Table 4 are higher than the highest OA (89.97%) of one angle with 5% training set except 87.74%, which is obtained by only using two angles and 1% training-set ratio. With only two angles data, OA varies from 87.74% to 93.86%. A higher training-set ratio yields higher OA. When the number of angle increases to 16, OA also increases from 94.23% to 98.12%. Thus, a 5% increase in OA is a general pattern. Further increase in the number will still be able to achieve higher OA, e.g., with 256 angles, the OA becomes 96.14% to 99.91%. The increase becomes marginal. It means that additional angles tend to bring in more complementary information for classification. However, the increase of OA levels off as increasing angles are being used for classification. This implies that there is information redundancy in the CMARS data.
In Table 5, it can be seen that, with the same input data volume, the OA of using geometric features is obviously better than that of using the original data in most situations. The two-piece linear function can extract geometric features better than cubic curve function. Our experiments show that, by using geometric parameters, a higher and more stable classification accuracy can generally be obtained, while the volume of data can be substantially reduced.
Table 6 shows the overall classification accuracy by using a certain number of principal components and a certain ratio of samples for training. The OA gets high, even if only the first principal component is used for classification. The classification result of the first principal component is much better (about 10% higher accuracy) than that of traditional RS data in Figure 5. From the mechanism of PCA, it appears that CMARS data provide extra information in angular dimension as compared to traditional RS data. Such information can highly improve the classification accuracy of urban land covers.
When compared with classification results in Table 4, the OA of the first principal component is better than that of 16 angle images, and the OA of the first two principal components is better than that of 32 angle images when the training-set ratio is bigger than 2.5%. It indicates that there is a high level of information redundancy in the CMARS data and PCA can reduce the angular dimension of them. The underlying dimensions extracted from the CMARS data can better classify urban land covers.
When compared with classification results shown in Table 5, the improvement of PCA over geometric features is impressive. With 5% samples of training data, the OA of the first four principal components, which has the same amount of data with that of the geometric features, is much higher (about 4% higher accuracy) than that of linear fitting and curving fitting. Even only use 1% training-set ratio, the OA of PCA is still better than that of the geometric features with a 5% training-set ratio. It shows that the information extracted from the underlying dimensions are more useful than geometric features for classification.
Apparently, a single top-ranked principal component can achieve an overall classification accuracy of 97.18% under SVM with 5% samples of training data. If we employ more than one principal component, then the OA only slightly increases. Therefore, two principal components are sufficient in this classification task.
With the same spirit of data dimension reduction because of commonness and a difference among different angles in the CMARS data, the PCA experiment shows that we can achieve data parsimony and high level of OA using the underlying dimensions instead of the original CMARS data for classification. In our experiments, the PCA method is obviously better than the use of geometric features and original data for classification.

5. Conclusions

In this paper, we study the use of multi-angle remote sensing data for classification. We demonstrate the advantages of using CMARS data to classify urban land covers by capitalizing on the rich and complementary information provided by various angles. Using CMARS data can achieve approximately 9% higher accuracy than using traditional RS data in the classification task. At the same time, we have also discussed information redundancy in CMARS data and ways to maximize information complementarity and minimize information excessiveness. PCA can be an efficient method for reducing the redundancy in CMARS data with a small loss of classification accuracy. It is apparent that CMARS data are better than the traditional single-angle or a limited-number-of-angle RS data for environmental monitoring and land cover classification.
It is conceivable that data that were obtained by video satellite will be very useful in various applications of earth observation. At this moment, we only focus on the pixel-based and vector-based classifications task. Object-oriented and tensor-based analysis of CMARS data will be carried out in the future. In this case, the study area is relatively flat, but with a variety of land covers for this experiment to ascertain the value of having different angles. We will further explore study areas with great height variation in order to ascertain further on the use of CMARS on height related information. Similar to the currently widely used spectral library, a continuous multi-angle spectrum library may be established and it will help us to better recognize land covers and their variabilities in the future.

Author Contributions

All authors conceived the study and discussed the basic structure of the manuscript. Y.Y., Y.L., T.F., Z.S., J.L. and D.M. designed the experiments. Y.Y. and J.L. carried out the experiments. Y.Y. finished the original version of this paper. Y.L., T.F., Y.Z. and H.Y. reviewed and edited the paper. All authors have read and agreed to the published version of the manuscript.

Funding

This paper is supported by a Hong Kong Research Grant Council General Research Fund Project (Project ID: 14611618).

Data Availability Statement

CMARS data was acquired from Chang Guang satellite technology Co., Ltd. (www.charmingglobe.com).

Acknowledgments

The authors would like to thank Chang Guang satellite technology Co., Ltd. for providing the experimental data.

Conflicts of Interest

The authors declare no conflict of interest.

References

  1. Toth, C.; Jóźków, G. Remote sensing platforms and sensors: A survey. ISPRS J. Photogramm. Remote Sens. 2016, 115, 22–36. [Google Scholar] [CrossRef]
  2. Lautenbacher, C.C. The global earth observation system of systems (GEOSS). In Proceedings of the 2005 IEEE International Symposium on Mass Storage Systems and Technology, Sardinia, Italy, 20–24 June 2005; pp. 47–50. [Google Scholar]
  3. Zhang, H.; Yang, Z.; Zhang, L.; Shen, H. Super-resolution reconstruction for multi-angle remote sensing images considering resolution differences. Remote Sens. 2014, 6, 637–657. [Google Scholar] [CrossRef] [Green Version]
  4. Huang, X.; Chen, H.; Gong, J. Angular difference feature extraction for urban scene classification using ZY-3 multi-angle high-resolution satellite imagery. ISPRS J. Photogramm. Remote Sens. 2018, 135, 127–141. [Google Scholar] [CrossRef]
  5. Molini, A.B.; Valsesia, D.; Fracastoro, G.; Magli, E. DeepSUM: Deep neural network for Super-resolution of Unregistered Multitemporal images. IEEE Trans. Geosci. Remote Sens. 2019, 58, 3644–3656. [Google Scholar] [CrossRef] [Green Version]
  6. Shao, Z.; Tang, P.; Wang, Z.; Saleem, N.; Yam, S.; Sommai, C. BRRNet: A fully convolutional neural network for automatic building extraction from high-resolution remote sensing images. Remote Sens. 2020, 12, 1050. [Google Scholar] [CrossRef] [Green Version]
  7. Shao, Z.; Zhou, Z.; Huang, X.; Zhang, Y. MRENet: Simultaneous Extraction of Road Surface and Road Centerline in Complex Urban Scenes from Very High-Resolution Images. Remote Sens. 2021, 13, 239. [Google Scholar] [CrossRef]
  8. Zhu, Z.; Woodcock, C.E.; Rogan, J.; Kellndorfer, J. Assessment of spectral, polarimetric, temporal, and spatial dimensions for urban and peri-urban land cover classification using Landsat and SAR data. Remote Sens. Environ. 2012, 117, 72–82. [Google Scholar] [CrossRef]
  9. Xu, Y.; Huang, B. Spatial and temporal classification of synthetic satellite imagery: Land cover mapping and accuracy validation. Geo-Spat. Inf. Sci. 2014, 17, 1–7. [Google Scholar] [CrossRef]
  10. Kong, F.; Li, X.; Wang, H.; Xie, D.; Li, X.; Bai, Y. Land cover classification based on fused data from GF-1 and MODIS NDVI time series. Remote Sens. 2016, 8, 741. [Google Scholar] [CrossRef] [Green Version]
  11. Xu, Y.; Ren, C.; Cai, M.; Edward, N.Y.Y.; Wu, T. Classification of local climate zones using ASTER and Landsat data for high-density cities. IEEE J. Sel. Top. Appl. Earth Obs. Remote Sens. 2017, 10, 3397–3405. [Google Scholar] [CrossRef]
  12. Chen, B.; Huang, B.; Xu, B. Multi-source remotely sensed data fusion for improving land cover classification. ISPRS J. Photogramm. Remote Sens. 2017, 124, 27–39. [Google Scholar] [CrossRef]
  13. Xu, K.; Jiang, Y.; Zhang, G.; Zhang, Q.; Wang, X. Geometric potential assessment for ZY3-02 triple linear array imagery. Remote Sens. 2017, 9, 658. [Google Scholar] [CrossRef] [Green Version]
  14. Hall, F.G.; Hilker, T.; Coops, N.C.; Lyapustin, A.; Huemmrich, K.F.; Middleton, E.; Margolis, H.; Drolet, G.; Black, T.A. Multi-angle remote sensing of forest light use efficiency by observing PRI variation with canopy shadow fraction. Remote Sens. Environ. 2018, 112, 3201–3211. [Google Scholar] [CrossRef] [Green Version]
  15. Chen, C.; Knyazikhin, Y.; Park, T.; Yan, K.; Lyapustin, A.; Wang, Y.; Yang, B.; Myneni, R.B. Prototyping of lai and fpar retrievals from modis multi-angle implementation of atmospheric correction (maiac) data. Remote Sens. 2017, 9, 370. [Google Scholar] [CrossRef] [Green Version]
  16. Li, D.; Yao, Y.; Shao, Z.; Wang, L. From digital Earth to smart Earth. Chin. Sci. Bull. 2014, 59, 722–733. [Google Scholar] [CrossRef]
  17. Shao, Z.; Cai, J.; Wang, Z. Smart monitoring cameras driven intelligent processing to big surveillance video data. IEEE Trans. Big Data 2017, 4, 105–116. [Google Scholar] [CrossRef]
  18. Zhang, G.; Li, L.T.; Jiang, Y.H.; Shi, X.T. On-orbit relative radiometric calibration of optical video satellites without uniform calibration sites. Int. J. Remote Sens. 2019, 40, 5454–5474. [Google Scholar] [CrossRef]
  19. Kopsiaftis, G.; Karantzalos, K. Vehicle detection and traffic density monitoring from very high resolution satellite video data. In Proceedings of the 2015 IEEE International Geoscience and Remote Sensing Symposium (IGARSS), Milan, Italy, 26–31 July 2015; pp. 1881–1884. [Google Scholar]
  20. Yang, T.; Wang, X.; Yao, B.; Li, J.; Zhang, Y.; He, Z.; Duan, W. Small moving vehicle detection in a satellite video of an urban area. Sensors 2016, 16, 1528. [Google Scholar] [CrossRef] [Green Version]
  21. Li, H.; Man, Y. Moving ship detection based on visual saliency for video satellite. In Proceedings of the 2016 IEEE International Geoscience and Remote Sensing Symposium (IGARSS), Beijing, China, 10–15 July 2016; pp. 1248–1250. [Google Scholar]
  22. Li, H.; Chen, L.; Li, F.; Huang, M. Ship detection and tracking method for satellite video based on multiscale saliency and surrounding contrast analysis. J. Appl. Remote Sens. 2019, 13, 026511. [Google Scholar] [CrossRef]
  23. Wu, J.; Wang, T.; Yan, J.; Zhang, G.; Jiang, X.; Wang, Y.; Bai, Q.; Yuan, C. Satellite video point-target tracking based on Hu correlation filter. Chin. Space Sci. Technol. 2019, 39, 55–63. [Google Scholar] [CrossRef]
  24. Joe, J.F. Enhanced sensitivity of motion detection in satellite videos using instant learning algorithms. In Proceedings of the IET Chennai 3rd International Conference on Sustainable Energy and Intelligent Systems (SEISCON 2012), Tiruchengode, India, 27–29 December 2012; pp. 424–429. [Google Scholar]
  25. Platias, C.; Vakalopoulou, M.; Karantzalos, K. Automatic Mrf-Based Registration of High resolution satellite video data. In Proceedings of the ISPRS Annals of the Photogrammetry Remote Sensing and Spatial Information Sciences, Prague, Czech Republic, 12–19 July 2016; pp. 121–128. [Google Scholar]
  26. Xie, Q.; Yao, G.; Liu, P. Super-resolution reconstruction of satellite video images based on interpolation method. In Proceedings of the 7th International Congress of Information and Communication Technology (ICICT), Sanya, China, 1–2 January 2017; pp. 454–459. [Google Scholar]
  27. Mou, L.; Zhu, X. Spatiotemporal scene interpretation of space videos via deep neural network and tracklet analysis. In Proceedings of the 2016 IEEE International Geoscience and Remote Sensing Symposium (IGARSS), Beijing, China, 10–15 July 2016; pp. 1823–1826. [Google Scholar]
  28. Chang Guang Satellite Technology Co., Ltd. Corporate Information. Available online: http://www.charmingglobe.com/EWeb/about_tw.aspx?id=9 (accessed on 23 January 2021).
  29. Congalton, R.G. A review of assessing the accuracy of classifications of remotely sensed data. Remote Sens. Environ. 1991, 37, 35–46. [Google Scholar] [CrossRef]
  30. Melgani, F.; Bruzzone, L. Classification of hyperspectral remote sensing images with support vector machines. IEEE Trans. Geosci. Remote Sens. 2004, 42, 1778–1790. [Google Scholar] [CrossRef] [Green Version]
  31. Cao, X.; Xu, L.; Meng, D.; Zhao, Q.; Xu, Z. Integration of 3-dimensional discrete wavelet transform and Markov random field for hyperspectral image classification. Neurocomputing 2017, 226, 90–100. [Google Scholar] [CrossRef]
  32. Du, P.; Xia, J.; Zhang, W.; Tan, K.; Liu, Y.; Liu, S. Multiple classifier system for remote sensing image classification: A review. Sensors 2012, 12, 4764–4792. [Google Scholar] [CrossRef]
  33. Chang, C.C.; Lin, C.J. LIBSVM: A library for support vector machines. ACM Trans. Intell. Syst. Technol. 2011, 2, 1–27. [Google Scholar] [CrossRef]
  34. Jolliffe, I.T. Principal component analysis and factor analysis. In Principal Component Analysis; Springer: New York, NY, USA, 1986; pp. 115–128. ISBN 978-1-4757-1906-2. [Google Scholar]
  35. Mackiewicz, A.; Ratajczak, W. Principal components analysis (PCA). Comput. Geosci. 1993, 19, 303–342. [Google Scholar] [CrossRef]
  36. Zhao, W.; Du, S. Spectral-spatial feature extraction for hyperspectral image classification: A dimension reduction and deep learning approach. IEEE Trans. Geosci. Remote Sens. 2016, 54, 4544–4554. [Google Scholar] [CrossRef]
  37. Ma, J.; Ma, Y.; Li, C. Infrared and visible image fusion methods and applications: A survey. Inf. Fusion 2019, 45, 153–178. [Google Scholar] [CrossRef]
Figure 1. Images from three different observation angles (from left to right are the 1st frame, 350th frame, and 700th frame) of the original data set, with the red-rectangle image being the enlarged view of the green-rectangle part of the original image.
Remotesensing 13 00413 g001
Figure 2. Experimental image and ground-truth data. (a) Single-angle image from the continuous multi-angle remote sensing (CMARS) data (b) Ground-truth labeled map.
Remotesensing 13 00413 g002
Figure 3. Polyline and best fitted cubic curves of the red, green and blue bands of a single pixel.
Remotesensing 13 00413 g003
Figure 4. Spectral reflectance of 11 land covers changes with observation angles. (ac) are in red, green and blue band, respectively.
Remotesensing 13 00413 g004
Figure 5. Overall accuracy of one time and the average of ten times using 5% random samples as the training set.
Remotesensing 13 00413 g005
Figure 6. Mean value of the 3 bands from the cubic-curve fitting of the 11 land covers.
Remotesensing 13 00413 g006
Figure 7. Cumulative total variance accounted for by the 700 principal components under the red, green, and blue band.
Remotesensing 13 00413 g007
Table 1. Experimental data information.
ItemDetail
Data sourceJilin-1 video satellite
Center coordinateNorth 28 41 39 , East 77 08 43 , New Delhi, India.
Size of data 600 × 950 pixels
Ground resolution1.13 m (approximate value)
Band widthBlue: 437–512 nm, Green: 489–585 nm, Red: 580–723 nm
Dynamic range8 bits (0–255)
Time of duration28 s
Number of observation angles700 angles
Table 2. Ground-truth classes and number of samples.
Class NameNumber of Samples
1Tree4394
2Grass5314
3Soil5364
4Concrete ground490
5High reflective surface538
6Village construction roof2910
7Roof of subway station1278
8Concrete roof899
9Tennis court652
10Asphalt road3521
11Others651
Table 3. Confusion matrix of support vector machine (SVM) classification based on the first angle.
ReferenceTreeGrassSoilConcrete GroundHigh Reflective SurfaceVillage Construction RoofRoof of Subway StationConcrete RoofTennis CourtAsphalt RoadOthersTotalUser’s Accuracy (%)
Result of Classification
Tree3827800003000033338430888.83
Grass108436863052020345508795.69
Soil02504762000361500516297.77
Concrete ground021634904416700047972.86
High reflective surface000045805000046398.92
Village construction roof18850300243702701336293483.06
Roof of subway station0000530117546000127492.23
Concrete roof0222210123367600076688.25
Tennis court005000006040060999.18
Asphalt road2120000000029990321193.40
Others99000189000919941547.95
Total41745048509646551127641214854619334561800
Producer’s Accuracy (%)91.6996.4399.0475.0589.6388.1796.7979.1697.5889.6632.2000
Table 4. The mean and standard deviation of the overall classification accuracy (in percentage) by SVM.
Training-Set Ratio1%2.5%5%10%20%40%80%
Number of Angles
287.74 *90.8691.9592.8193.5193.8693.83
+1.2730.79330.77840.81400.80690.63490.7723
491.2393.3194.2994.7195.5595.6895.90
0.76800.58860.54470.57160.50740.53400.4517
893.0794.7295.5296.0096.5396.8197.07
0.54820.43780.33260.42610.27850.21410.2826
1694.2395.7296.1096.7297.3197.6998.12
0.39170.31530.21270.18590.16860.16440.1925
3295.3596.3196.8397.3298.0298.4898.92
0.35600.21780.15860.15060.14000.12390.1339
6495.8496.8297.5698.0498.5999.1999.62
0.26380.15610.13600.13440.11040.08870.0799
12895.9797.1998.0398.5699.1299.6799.87
0.11920.12520.10640.09850.09010.05920.0315
25696.1497.3798.2698.8499.4599.8499.91
0.11960.06700.08750.07030.05040.02520.0257
51296.2697.5098.3999.0499.5799.8999.93
0.07210.03310.04340.03680.02660.01220.0151
70096.2397.4798.4199.1399.5899.9199.94
0000000
*: mean; +: standard deviation.
Table 5. Overall classification accuracy (in percentage) of linear and curve function parameters by SVM.
Training-Set Ratio1%2.5%5%10%20%40%80%
Parameters
Two- piece linear function94.3194.0394.7495.3496.6796.6296.85
Cubic curve function91.0193.5394.0594.3395.1795.0295.62
Table 6. Overall classification accuracy (in percentage ) of PCA by SVM.
Training-Set Ratio1%2.5%5%10%20%40%80%
Number of
Principal Components
194.3696.2097.1897.3297.4097.9298.14
294.9896.7497.9298.0698.3198.7999.23
495.2997.2998.4398.7599.1699.4299.65
895.7697.4198.4898.8799.3599.6299.73
1695.6897.6198.6398.9499.5399.6999.83
3296.1097.6898.6299.0499.6699.7899.87
6496.2197.6298.6899.1499.6799.8899.85
12896.1297.6398.6899.1599.6699.9099.87
25696.1297.5798.6499.1299.6699.9099.92
51296.2197.4898.4999.1199.6399.9099.94
70096.2397.4798.4199.1399.5899.9199.94
Publisher’s Note: MDPI stays neutral with regard to jurisdictional claims in published maps and institutional affiliations.