1. Introduction
Canada stands fifth in the list of potato (
Solanum tuberosum L.) exporters with its exports amounting to
$1.60 billion per year [
1]. Atlantic Canada contributes 37% of Canadian potato production [
2]. Typically, 20 applications of agrochemicals are uniformly applied during a growing season, without considering the spatial variability of disease infestations within a potato field. The desire of growers to increase potato production has resulted in a 150% increase in the uniform usage of agrochemicals during the past 20 years leading to an increased cost of production and environmental degradation [
3]. Efficient crop management through the precise and accurate application of agrochemicals can enhance potato quality and tuber yield while providing economic and environmental benefits [
4]. The development of smart sprayers, capable of identifying spatially variable weed and disease distributions within potato fields, can help apply agrochemicals in the infected localities only. Such
precision agriculture technologies, in their infancy stage in Canada, continue to gain popularity worldwide.
Early blight—a common potato disease, caused by
Alternaria solani Sorauer, is found throughout North America [
5]. Like other plant leaf diseases, it typically targets less productive and older foliage first, followed by steady movement upwards in the plant canopy causing leave senescence [
5]. Visible symptoms of this disease include small 1–2 mm black or brown lesions, at early stages, turning into dark pigmented concentric rings under conducive environmental conditions, at mature stages of the disease [
6]. Currently, management of early blight involves the uniform application of fungicides, ignoring its spatial distributions, which not only increases the production cost but also adversely impacts the environment. Therefore, an intelligent classification system to differentiate diseased plants from healthy plants and achieve the targeted application of fungicides can improve economic and environmental sustainability.
The identification of plant diseases is a long-researched topic [
7]. An accurate and real-time disease detection system may help in developing mitigation strategies to ensure economical crop protection on a small scale and food security on a large scale. Furthermore, an accurate disease classification through machine vision and deep learning (DL) could provide the basis to accomplish the site-specific application of agrochemicals. Abdullah et al. [
8] proposed a method of disease detection by using a neural network. Their algorithm applied principal components analysis to a set of low-resolution images followed by feeding the processed images to a neural network for plant disease detection. Sena et al. [
9] suggested a thresholding and image segmentation model for disease detection. They divided greyscale images of diseased leaves into different blocks and applied the programmed threshold levels to detect disease in each image block. Camargo and Smith [
10] presented an alternative image segmentation method for disease quantification. Their developed algorithm transformed color images to HSV (hue, saturation, value) and then in I1I2I3 color space. With this method, they were able to quantify diseases of various plant species. Boese et al. [
11] used an unsupervised color-based disease quantification technique, which divided the image into several classes followed by training of each class by a probabilistic supervised learning technique. According to Boese et al. [
11], this method had higher accuracy in comparison with previous methods. Although the above-discussed algorithms provide the basis of disease detection, most of these methods are not feasible for real-time application of agrochemicals as they require a very long inference time for image processing.
As per recent developments in the graphical processing unit (GPU)-embedded processors, the applications of artificial intelligence have gained exponential growth leading to the development of novel methodologies and models called DL [
12]. GPU-based parallel computing has supported the development and use of CNNs for various applications. Krizhevsky et al. [
13] tested large datasets of multiple image classes with high accuracy using various CNNs. More recently, CNNs have become one of the most successful DL techniques in image processing. Typically, a CNN consists of several layers such as convolutional, pooling, and fully connected layers [
12]. A convolutional layer is composed of several mathematical operations, which play key roles in CNN functions, such as convolution—a special linear operation [
14]. The convolutional layer lifts the heavy load of the computation and is a critical building block of a CNN. Pooling layers usually come in between consecutive convolutional layers. The main function performed by pooling layers is to reduce the spatial computational parameter load. The fully connected layers consist of the activation functions by which the final output, such as object classification, is extracted [
14]. The most common type of activation function is called a rectified linear unit, which replaces the negative numbers in pixels by zero values to minimize the computation time and exposes the targets for identification [
15]. A digital image stores the data in the form of two-dimensional grids; i.e., an array, and a small unit of an array called a kernel [
14]. In CNNs, training is the process to reduce the error between predicted output and ground truths by the process of convolution.
The CNNs have been successfully implemented in disease detection problems. For example, Oppenheim and Shani [
16] classified four different potato tuber diseases by using a visual geometry group. Ferentinos [
7] was able to attain a 99.5% success rate for detecting 58 diseases in 25 types of plants by training the plant disease images with different CNNs. Carranza-Rojas et al. [
17] proposed a species identification system for botanists using CNN for herbarium datasets that are comprised of multimillion images of various species. With the high accuracy of CNN, the DL technique has been suggested for semi or fully automated species identification systems. Fuentes et al. [
18] recognized nine types of disease and pests in tomato plants by comparing several CNNs. The CNN, based on faster regional CNN with Visual Geometry Group (VGG) as a feature extractor, attained the highest accuracy for disease detection. A smartphone-assisted disease detection system supported by a trained CNN was developed by Mohanty et al. [
19] to identify 14 crop species and 26 diseases with 99.4% accuracy. Recently, a new family of CNNs was developed based on a systematic design called EfficientNet, which is designed based on optimized network width, depth, and resolution. The optimized design of EfficientNet has resulted in a higher accuracy as well as a smaller number of learning parameters.
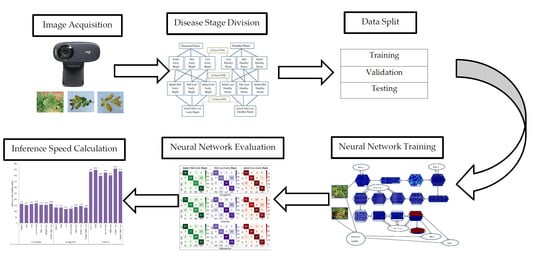
The objective of this study was to evaluate the potential of using artificial intelligence-based convolutional neural networks to identify the early blight disease in real-time for potato production systems. This research compares three ages of CNNs (GoogleNet—old, VGGNet—mid-age, and EfficientNET—new) for identification of early blight disease in its different growth stages (initial, mid, last) and their possible combinations in potato production. Furthermore, inference times for the selected CNNs were computed to assess their adequacy in developing a smart sprayer for the targeted application of fungicides on an as-needed basis. The disease identification using the integration of CNNs, machine vision, and assessing potential and feasibility to have integrated them into a smart sprayer adds novelty and innovation to this research study being reported here.
2. Materials and Methods
2.1. Study Site and Data Collection
For the present study, two fields in New Brunswick, Canada (Florenceville 46.318161 N, 67.617139 W and McCain’s Farms 47.103106 N, 67.855958 W) and two fields in Prince Edward Island, Canada (Winsloe North 46.359412 N, 63.201919 W and 225 Highway 46.255502 N, 63.201203 W) were selected. Atlantic Canadian provinces climate is considered humid, strongly influenced by the surrounding seas and oceans throughout the year. The summer season is relatively shorter with the long winter season. In Atlantic Canadian provinces, the majority of soils are sandy loam. Images of healthy and diseased potato plants (
Russet Burbank cultivar) were captured using digital cameras namely Canon Power-Shot SX540 and Logitech C270 HD Webcam. Visual symptomology of early blight was discussed and identified with a local plant pathologist. These observations coincided with Kemmit [
6] for the identification of early blight disease stages throughout the growing season. Images were captured based on visual symptoms to categorize for the initial, mid, and last stages of the disease in potato fields. Literature suggested that the visual symptoms of early blight (pale, yellow-colored leaves) start appearing in early July, i.e., 35 days after planting (DAP)—a period counted for observing the initial stage of the disease. Mid-stage of the disease occurs at 65 DAP (brown color concentric circles on potato plant leaves). The late stage of the disease evolves at 80 DAP (
Figure 1). As no curative measures exist, accurate identification of disease at an early stage using machine vision is a key to mitigate the damage. The data points in the captured frame may vary real-time as it is the function of disease intensity. The more intense disease may have more disease data points than the less intense disease plants. Furthermore, the disease appeared on potato plants in the form of patches because of disease spread.
The images were taken 140 cm above the soil surface, under natural sunlight between 9:00 a.m. and 4:00 p.m. in 2018. The collected images were resized (1280 × 720 pixels) using a custom-developed program written in the Python programming language. The pixel resolution of 1280 × 720 was selected to extend the application of this model for real-time applications. Moreover, the selected resolution was chosen to assess the feasibility of the developed CNN model to be integrated with the hardware, to develop a smart variable rate sprayer using a real-time video feeding from a webcam.
The disease stages were identified by collecting the images throughout the potato-growing season from June to October 2018. Images of each disease stage, with its symptoms, were trained with different CNNs. A dataset of 532 images was reserved for testing and for evaluation of statistical measures after the CNNs are trained (
Table 1). The remaining images were used for training (70%) and validation (30%) of the developed CNNs. The accuracy of CNNs in identifying the early blight disease stages was assessed using statistical measures including
precision, recall, and
FScore.
2.2. Multistage Disease Comparison
Plant disease progression is a function of environmental variables (temperature, humidity, wind, etc.). If the CNNs are trained for only three stages (mid, early, and late), the overlap between disease stages will compromise the accuracy of the CNNs. This will reduce the CNNs’ applicability for real-time smart sprayer applications due to low disease identification accuracy. To compensate for variating disease stages, the overlap between stages, and to clearly distinguish the disease from potato plants, CNN were divided into three separate experimental groups for accurate identification. These steps have simplified the tasks of disease detection at various stages of the disease and potato growth. The 2-Class CNN compared one disease and one healthy stage. The 4-Class CNN was used to compare two disease and two healthy plant stages. The 6-Class CNN compared three disease and three healthy plant stages simultaneously to differentiate healthy potato plants accurately and reliably from diseased plants. Healthy plant stages were defined based on leaf size on the respective phenological stages of a potato plant. The analogy behind these simulations was to expose the CNNs to all possible scenarios to avoid fungicide spraying on healthy plants. Furthermore, the agrochemical application can be optimized based on the severity of disease infestation, picked by variable-rate sprayer integrated with DL CNNs and machine vision approach solicited by this research.
The 2-, 4-, and 6-Class CNNs
The architecture of the 2-Class CNN was trained on one disease and one healthy potato plant stage, i.e., initial, mid, and last early blight (
Figure 2). All the validation images were passed through the trained model to evaluate its ability to distinguish various diseases and healthy potato plant leaves at their various growth stages. The 4-Class CNN was trained using two stages of disease symptoms and two healthy potato plants (initial + mid, mid + last, and initial + last). The performance of the 4-class CNN was evaluated by combining the two groups of images and running these images with the trained model to classify the healthy and diseased plants. The 6-Class CNN was trained on three groups of diseased and healthy plant stages (initial + mid + last). The 6-Class CNN’s performance was evaluated in terms of differentiation between healthy and diseased plants using all possible combinations. These interactions using various combinations of diseased and healthy plants in conjunction with CNNs enabled robust and comprehensive evaluation of the CNNs. These architectures, extensive training, testing, and validations evaluated the efficacy of the CNNs and machine vision in disease classification for a potato cropping system.
2.3. Deep Learning Frameworks and Convolutional Neural Networks
The rapid surge in DL and machine vision has provided easier frameworks to run CNNs. Several frameworks were developed such as Caffe, Torch, Theano, and others, which facilitate the computational process and efficiency for various applications. These frameworks have gone through many development phases to attain the desired accuracy for a particular application. The DL frameworks can build large and complex computational analyses efficiently. The DL frameworks also help in calculating the gradient losses to reduce the error between predicted and ground truth data. Due to heavy computational loads associated with CNNs, a GPU-enabled workstation saves time in training and validation of an image using DL frameworks. Furthermore, the DL frameworks enable networking in central processing unit (CPU), GPU, and memory by using DL libraries. The PyTorch framework was used for all CNNs (training, validation, and testing) to differentiate diseased and healthy potato plants because of its readily available resources and ease of use.
PyTorch, developed by the Facebook AI research lab, is a fast-maturing framework with good GPU support [
20]. PyTorch has gained popularity in the DL community because of its in-depth features such as a dynamic graph, easily available resources, and research-oriented focus. In this study, three CNNs, namely GoogleNet, VGGNet, and EfficentNet, were selected to identify early blight disease at different stages. These models were selected based on literature-reviewed accuracies, real-time performance, and applicability in production for commercial applications. Szegedy et al. [
21] suggested the use of GoogleNet for accurate predictions. GoogleNet has been successfully used in plant disease identification and plant parts identification problems [
22,
23].
The VGGNet architecture consists of 3×3 convolutional filters to improve its accuracy and reduce overfitting problems [
24]. The VGGNet is available in different depths of layers such as Vgg-11, Vgg-13, and Vgg-16. In this study, the most recent one, VGGNet-16, was tested for disease classification stages. EfficientNet is a recently developed model by Tan and Le [
25] which has been designed on a systematic approach of network depth, width, and resolution. EfficientNet is claimed to be a light as well as an accurate model based on the compound scaling approach. In this study, we used the lightest EfficientNet model B0, which is considered to be an accurate model considering image results. Overall, this study used the old (GoogleNet), mid-age (VGGNet-16), and the recent (EfficientNet) CNNs using the PyTorch framework to evaluate their potential and accuracy in the classification of early blight diseased and healthy potato leaves.
2.4. Deep Learning Workstation and Hyperparameter Tuning of CNNs
A custom-designed DL workstation was used to train the selected CNNs. The workstation consisted of Intel core CPU i9-7900X (3.3Ghz, SkylakeX 10 core), two GPUs (Nvidia GTX 1080 GeForce, 11GB), two memory sticks of Ram (Vengeance 32 GB), and 1 TB solid state drive. Ubuntu 16.04 operating system was installed with PyTorch (Version 1.12), NumPy (Version 1.18.1), Matplotlib (version 3.1.3), Pandas (1.0.1), and associated libraries. PyTorch provided several code snippets to get the reproducible results for similar configurations of CNNs and datasets. In this study, we selected the random seeds of 20 for deep learning libraries including NumPy and cuDNN. Furthermore, all data loader workers were set to zero to achieve similar results.
As DL is computationally expensive, it is important to set the optimal hyperparameters for CNN models to improve accuracy. The hyperparameters were determined with several trials of different optimizers, learning rates, and weights initialization. The GoogleNet performed better if trained from scratch in comparison with pre-trained weights and fine-tuning. The learning rate was set to 0.01 for 2-Class CNN and 0.001 for 4- and 6-Class CNNs to reduce over-fitting. Adam optimizer with step down learning rate and 0.95 momenta performed well on our image datasets. VGGNet-16 is computationally a more expensive CNN than GoogleNet because of a higher number of learning parameters, e.g., 138 million. For VGGNet-16, the batch size was set to 64 using both GPUs. Because of the large number of parameters, these CNNs were trained using ImageNet pre-trained weights to optimize the training time and accuracy. Adam optimizer performed well with weight decay, the momentum of 0.95, and a learning rate of 0.001 for 2-Class CNN and 0.0001 for 4- and 6-CNNs. The CNN’s convergence was faster with lower learning rates because of pre-trained weight initialization in these models. EfficientNet was trained using pre-trained weights of lightest model B0. The lightest model of EfficientNet was selected to assess its application for real-time image classification. This CNN worked well with a batch size of 256. Learning rates with Adam optimizers were selected from 10−4 to 10−6 for different classes of disease. Furthermore, a dropout effect of 20% was introduced in earlier layers of CNN to overcome the over-fitting issues for EfficientNet.
2.5. Statistical Analysis and Inference Time
The performance of all CNNs using the PyTorch framework was evaluated using the well-established statistical measures of
precision,
recall, and
FScore [
22]. Results were also assessed based on loss and accuracy during the training and validation phases of the CNNs. A confusion matrix provided the parameters to calculate these statistical measures. Inference time is a key to assess the applicability of the CNNs for real-time application (e.g., real-time detection of disease by smart sprayers before application of agrochemicals). The neural network must be efficient in terms of both computation time and memory during the inference [
26] to qualify for real-time applications. Adequate accuracy in conjunction with inference time is considered one of the key elements in practical applications of the recommended CNN for efficient resource allocation and power consumption. Inference time was recorded for each CNN using a Dell Latitude 5580 (8 GB ram, Core I7 7 generation processor) on GPU mode using DL framework libraries. One image was used three times to calculate the average inference time for all CNNs. A batch size of 1 was selected to calculate the inference time for real-time application with less powerful devices with no GPU for applicability and lower power consumption.
4. Discussion
Symptoms of initial stages of early blight disease in potato plants include pale-yellow chlorotic leaves of the infected plant (
Figure 1). The values of validation accuracy of CNNs in detecting initial early blight disease ranged from 0.95 to 0.97. These validation accuracy values were lower as compared to the mid and last stages of early blight disease. This may be due to the relative difficulty in detecting disease symptoms at this stage. Slightly lower
precision scores were recorded in comparison with
recall scores due to higher false positives during the initial stage (
Figure 3). The lower
precision score depicts the CNNs’ inability to correctly classify the disease images and confusion with healthy plant images. GoogleNet was found to be less accurate in detecting disease infestation as indicated by the low
precision and
recall scores when compared with other CNNs. The architecture of GoogleNet that starts with a big receptive field to reduce computation requirements [
21] might have resulted in the poor detection of small-sized disease symptoms for the initial stage of early blight disease. These results are in concurrence with the findings of Russakovsky et al. [
27] who also reported the inability of GoogleNet in detecting small features. VGGNet achieved the highest
FScore in detecting symptoms of initial early blight most likely because the architecture of VGGNet uses a small filter size of 3 × 3, which helps the CNN to identify small and complex objects [
24]. These results suggested non-significant differences between VGGNet and EfficientNet in terms of disease detection at the early stages.
The validation accuracy values for CNNs during the mid-stage of early blight disease were observed to be slightly higher (e.g., 0.99 to 1.00) when compared with the early stage where the symptoms were confused with leaves. The precision and recall scores for the chosen CNNs were non-significantly different. The FScore displayed a similar statistical pattern as precision and recall. Similar values of validation accuracy were observed for the last stage of early blight disease; however, a slightly lower FScore was achieved for the last stage of the disease. In the last stage early blight detection, a similar performance of GoogleNet was observed in detecting the initial stage of early blight due to the reasons quoted above for GoogleNet’s architecture. In the 4-Class CNN at the mid + late stage, EfficientNet optimized architecture did not perform well in comparison with VGGNet. This might be due to overlapping symptoms at both stages due to environmental factors. The convolution and max-pooling filters throughout the VGGNet architecture might have helped VGGNet to perform better in the detection of all disease stages of 2- and 4-Class CNNs.
During the detection of initial + mid stage, early blight disease symptoms, the pale-yellow color, brown concentric circles, and plant development stages were the main targets for the CNNs to pick up during DL processing. The validation accuracy of 0.92 was recorded for the three CNNs. There were non-significant differences between
precision and
recall scores for initial + mid early blight disease CNNs. The initial healthy class was problematic for initial + mid early blight CNNs as it was highly confused with the mid healthy class (
Figure 4). In the higher class CNNs, the performance of GoogleNet was lower in comparison with VGGNet and EfficientNet. EfficientNet’s architecture was able to classify the complex and difficult targets with higher accuracy as suggested by
precision,
recall,
FScore, and confusion matrices (
Table 2;
Figure 4,
Figure 5 and
Figure 6). In general, EfficientNet CNN was found to be the best performer in terms of early blight disease detection.
In the mid + last stage of early blight disease detection, the brown concentric leaves, leave senescence and plant development stages were the main targets for 4-Class CNNs using DL. The validation accuracy values for the mid + last stage CNNs ranged from 0.84 and 0.86, which were slightly lower than the values of initial + mid and initial + last stages. Mid healthy plant stages and last disease stages were problematic for these CNNs as the models were confused by the last healthy and initial disease stages (
Figure 4). A similar trend of
FScore was observed for various CNNS as shown in the initial + mid stage (
Figure 6). Non-significant differences were observed in terms of
precision and
recall scores (
Table 2).
The brown pale-yellow leaves senescence, and plant development stages were the main detection targets for 4-Class CNNS at initial + last stage early blight disease detection. In this stage, the values of validation accuracy were in the range of 0.92 and 0.94, which were the highest values of accuracy ranges among 4-Class CNNs. The detection accuracy of the 4-Class CNN at the initial + last stage of the disease evolution was supported by the highest statistical measures of
precision,
recall, and
FScore. This may be due to the clear distinction between healthy plant development stages and disease symptoms of the initial and last stage of early blight. The 6-Class CNNs performed significantly lower in terms of detection accuracy when compared with the 2- and 4-Class CNNs. The possible reason for this finding could be a higher number of similar healthy and disease classes. Moreover, overlapping of symptoms during different disease stages might have contributed to the lower accuracy. Initial + mid + last early blight validation accuracy values were in the range of 0.81 to 0.85. Mid-diseased, last-diseased, and last healthy classes were problematic in 6-Class CNN (
Figure 5). EfficientNet was the highest performing CNN for 6-Class CNN. However, there were non-significant differences about
FScore for 6-Class CNNs. The idea of training the CNNs with various combinations of healthy and diseased plants at different stages was to identify and develop robust CNN for practical applications and assess its potential to be integrated into a smart sprayer to achieve the site-specific application of fungicides within potato fields.
GoogleNet inference time was recorded to be 121–145 milliseconds on a Dell Latitude 5580 with all three CNNs. However, the values of inference time for all classes’ CNNs were in a similar range with no major effect of inference time on CNN classes. The highest inference time was observed for VGGNet 398–458 milliseconds. This was mainly due to its higher number of learning parameters in one forward pass in comparison with GoogleNet and EfficientNet. EfficientNet inference ranged from 5.95–6.53 FPS. The lowest inference time was recorded for GoogleNet when compared with other CNNs. However, the detection accuracy of the GoogleNet was lower when compared with other CNNs. VGGNet performed well in terms of disease detection accuracy as suggested by
FScore,
recall, and
precision; however, higher inference time makes it lower priority candidate for real-time applications. GoogleNet and EfficientNet can be used with a tradeoff between model accuracy and inference speed for real-time smart sprayer development. The inference times for all the CNNs were significantly different; however, the lower differences were observed between GoogleNet and EfficientNet. Bianco et al. [
28] reported similar ranges of the inference time for GoogleNet and VGGNet. Overall, the results of accuracy in combination with the statistical measure for various CNN architectures and inference time suggested that the EfficientNet can be deployed and integrated to develop a smart sprayer for targeted application of fungicides in potato fields.
5. Conclusions
Several combinations of datasets with different CNNs were tested for the identification and classification of early blight disease in the potato production system. All CNNs were able to accurately identify diseased and healthy plants for collected data with variable accuracy, precision, recall, and FScore. Results suggested that the performance accuracy of EfficientNet and VGGNet was higher in terms of disease detection at different stages when compared with GoogleNet. GoogleNet was observed to have the lowest inference time compared with EfficientNet and VGGNet. Considering the disease detection accuracy of the EfficientNet during different stages of disease evolution, as illustrated by statistical measure (recall, precision, and FScore), in conjunction with reasonably lower inference time supported the use of EfficientNet for further processing integration into a variable rate smart sprayer for targeted applications of fungicides within potato fields. Site-specific applications of fungicides using a machine vision and DL-based sprayer, only in diseased areas of the potato fields, have a significant potential to lower the agrochemicals in agricultural fields. Targeted application of fungicides can directly be translated into farm profitability and reduced unintended risk to the environment such as runoff of fungicides into water bodies and negative impacts on aquatic habitats. In the case of more than one disease, the potato plant species, and ground surface cover, the sprayer nozzle may get mixed signals of detection (of other weeds and/or diseased plants). However, in the potato field of North America, early blight is the most common potato disease and has been addressed in this study. Future research will cover more diseases and varieties of potato and other cropping systems.
Future Work
The trained EfficientNET CNN will be deployed and integrated into hardware (nozzles, solenoid valves, relays, flow meters, wiring, toggle switches, controller, etc.) using custom-developed software to develop a machine vision and DL-based smart sprayer for targeted application of fungicides in potato fields. The components of the developed sprayer will be calibrated before installation into the smart sprayer. Real-time image acquisition, processing, and delay time will be calculated to accurately synchronize the solenoid valves in the areas where early blight disease has been detected. Extensive lab and field evaluations will be performed to testify the performance accuracy of the developed smart sprayer. The development of this smart sprayer using machine vision, CNNs, and DL will be a breakthrough for the potato industry. Other herbicides and fungicides applications will be explored during the later stages of this development process.

 ,
, 


