Article

Toward a Simple and Generic Approach for Identifying Multi-Year Cotton Cropping Patterns Using Landsat and Sentinel-2 Time Series

1
School of Geography, South China Normal University, Guangzhou 510631, China
2
Key Laboratory of Natural Resources Monitoring in Tropical and Subtropical Area of South China, Ministry of Natural Resources, Guangzhou 510631, China
*
Author to whom correspondence should be addressed.
Remote Sens. 2021, 13(24), 5183; https://doi.org/10.3390/rs13245183
Submission received: 1 November 2021 / Revised: 6 December 2021 / Accepted: 13 December 2021 / Published: 20 December 2021
(This article belongs to the Special Issue Remote Sensing Applications in Agricultural Ecosystems)

Abstract

:
The sustainable development goals of the United Nations, as well as the era of pandemics have introduced serious challenges for agricultural production and management. Precise management of agricultural practices based on satellite-borne remote sensing has been considered an effective means for monitoring cropping patterns and crop-farming patterns. Therefore, we proposed a simple and generic approach to identify multi-year cotton-cropping patterns based on time series of Landsat and Sentinel-2 images, with few ground samples that covered many years, a simple classification algorithm, and had a high classification accuracy. In this approach, we extended the size of training samples using active learning, and we employed a random forest algorithm to extract multi-year cotton planting patterns based on dense time series of Landsat and Sentinel-2 data from 2014 to 2018. We created annual crop cultivation maps based on training samples with an accuracy greater than 95.69%. The accuracy of multi-year cotton cropping patterns was 96.93%. The proposed approach was effective and robust in identifying multi-year cropping patterns, and it could be applied in other regions.

1. Introduction

It is estimated that by 2050, the total global population will reach 9.8 billion [1,2], and the number of people affected by hunger will surpass 840 million by 2030 [3]. Ensuring food security plays a vital role in realizing global sustainable development goals (SDGs). In 2015, the United Nations proposed a sustainable development goal by 2030 titled “Zero Hunger” [3], which aims to establish a sustainable agricultural system to reduce the risk of hunger. Thus, improving agricultural systems and promoting sustainable agricultural development are beneficial for stabilizing the global food supply.
Cropping pattern mapping is important for precision agriculture and can provide scientific evidence for decision-makers. Achieving efficient and accurate inter/intra mapping for cropping patterns is critical to the sustainable development of agriculture [4,5,6]. Satellite remote sensing has been proven to be an effective tool to monitor changes in crop cultivation [7,8,9,10]. Thus, many scholars have studied farming modes (such as single, rotation, and intercropping) [11,12], crop-planting types [13,14], and agronomic practices (e.g., irrigation, farming methods, crop variety selection, and cultivation management) [15].
Generally, crop-planting type mapping using remote sensing has been the most reported; for example, annual crop type maps based on time series remote sensing images [16,17] or single-phase remote sensing images [18,19] have been extracted. Moreover, some studies [20,21] have proven that the classification results of crop-planting types using time series remote sensing images are relatively better than those based on single-phase remote sensing images. Therefore, multi-sensor remote sensing image fusion can obtain crop types by constricting time series observations [22], especially combining the use of Landsat-8 OLI and Sentinel-2 MSI remote sensing images [23]. Additionally, many studies have focused on analyzing crop succession (e.g., monoculture, rotation, and fallow) [15]. For example, Stern et al. (2012) [10] mapped the 10-year corn-soybean rotation dynamics using an annual remote sensing classification product. Tong et al. (2017) [24] used MODIS-NDVI seasonal metrics to separate cropped land and fallowed land. Furthermore, Bégué et al. (2018) [15] reported research on crop patterns (i.e., the yearly sequence of the spatial arrangement of crops). Due to the need for accurate phenological cycles, the definition of crop patterns depends on the use of high-temporal resolution data to capture the seasonal variability of crop growth [25]. Studies on crop patterns have mainly focused on a single year. For example, Zhang et al. (2008) [25] used MODIS data in 2004 to map double-cropping systems in northern China. Qiu et al. (2014) [26] mapped double-cropping croplands based on single-year MODIS-EVI data. Few studies have reported on multi-year crop pattern mapping, while the interannual change in the cropping patterns caused by agronomic practices (e.g., farming mode) [27] is important for precise agricultural management. Moreover, a study reported by Petitjen et al. (2012) [28] showed that crop classification based on time series remote sensing images suffered from a lack of sufficient ground truths to train supervised classification algorithms. However, the active learning method promoted by Tuia et al. (2011) [29] can efficiently expand the training sample sizes based on limited ground truth samples, which has been used and confirmed by Li et al. (2014) [30].
Thus, we propose a simple classification strategy to identify the multi-year cotton cropping mode for precise cotton field management based on the freely available Landsat and Sentinel-2 high-temporal resolution images. Specifically, we aimed to (1) map pixel-based intra-annual crop classification using random forest algorithm; (2) map the multi-year cotton-cropping pattern based on time series of Landsat and Senitinel-2 remote sensing images and the expanded training sample sizes of multi-year cotton cropping patterns using the random forest classification algorithm.

2. Materials and Methods
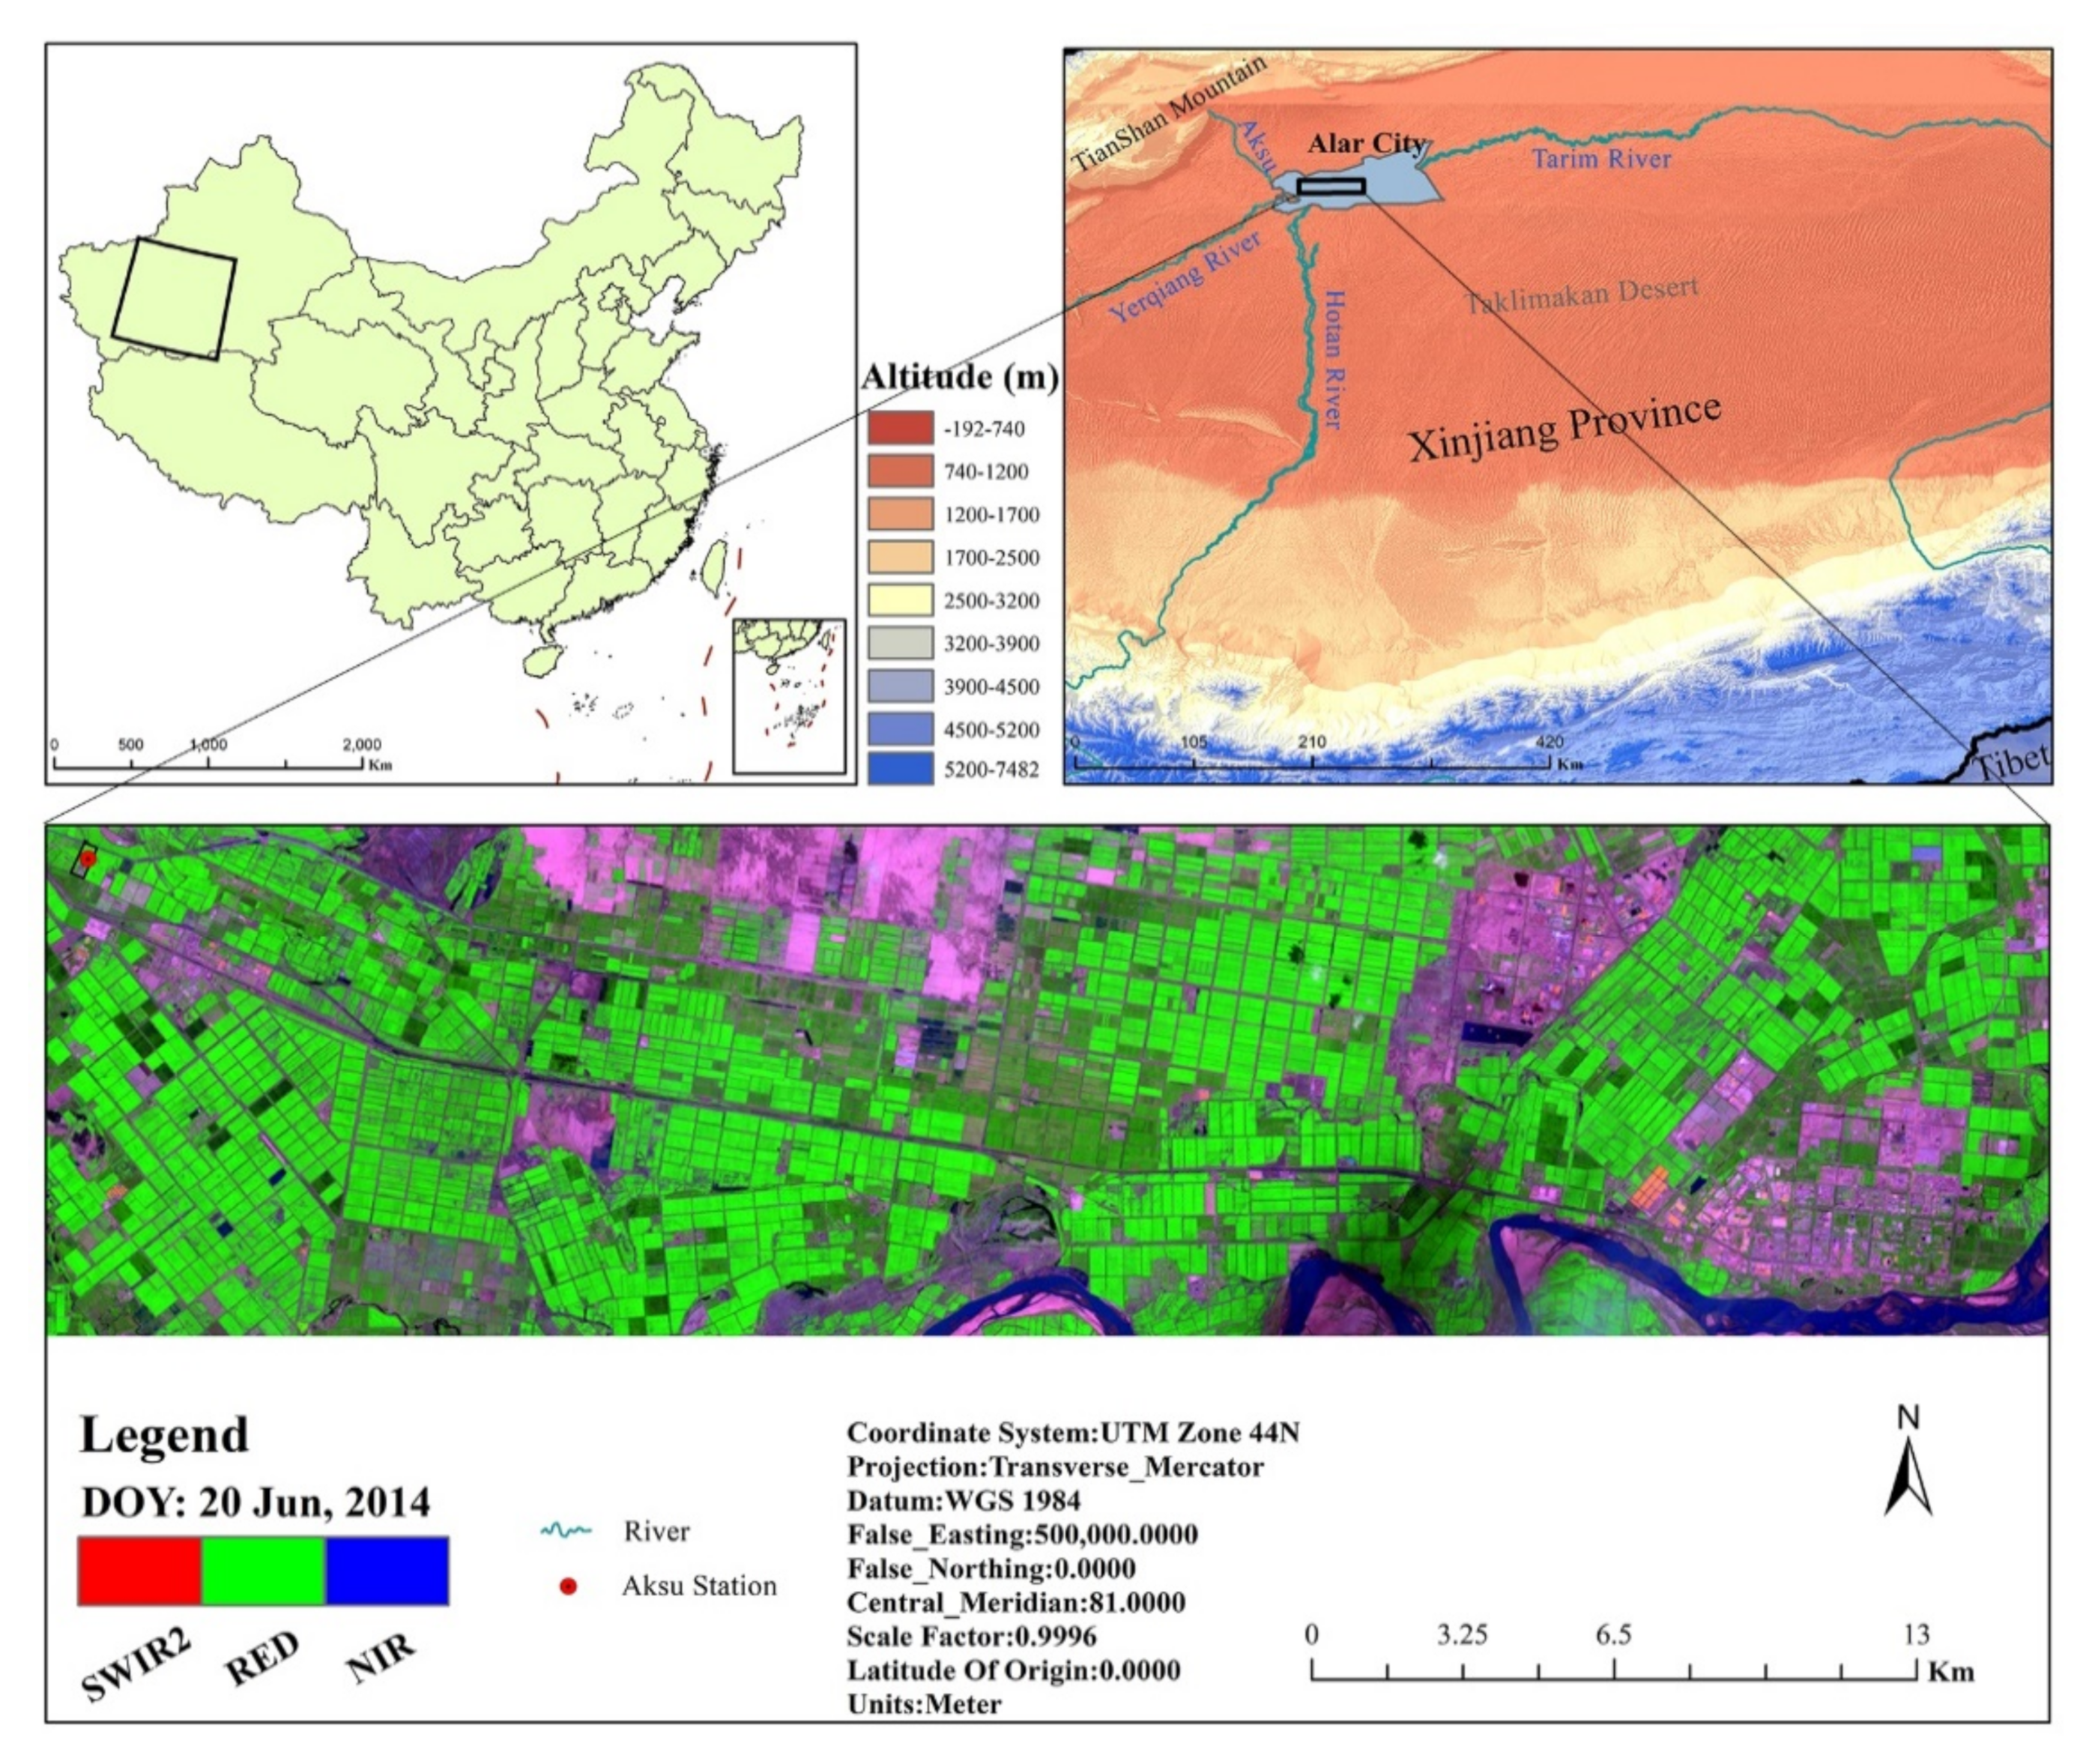
2.1. Study Area

The study area is located in Alar city, which covers 48,518 ha. Alar is a typical arid zone oasis irrigation district in northwestern China at the southern foot of the Tianshan Mountains and the northern edge of the Taklimakan Desert. Alar has a distinct temperate continental climate, with aridity and low rainfall, an average annual temperature of 3.8–19.3 °C, and an average annual rainfall of 11.9–91.9 mm with sufficient sunshine [31]. The Aksu River, Hotan River, and Yerqiang River converge in Alar City, which forms the Tarim River [32], and the regional soil is formed by the alluvial deposits of the Tarim River. The Tarim River is the main source of irrigation water in this area, and the water sources feeding the river are primarily glaciers and snow melt water [33]. Alar is in a stage of rapid development of the agricultural economy. In the past half century, cotton has been the main cash crop with a planting area exceeding 80% [31]. It has become the main agricultural, forestry, and animal husbandry irrigation area in southern Xinjiang and an important cotton, forest, and fruit industrial base (Figure 1).

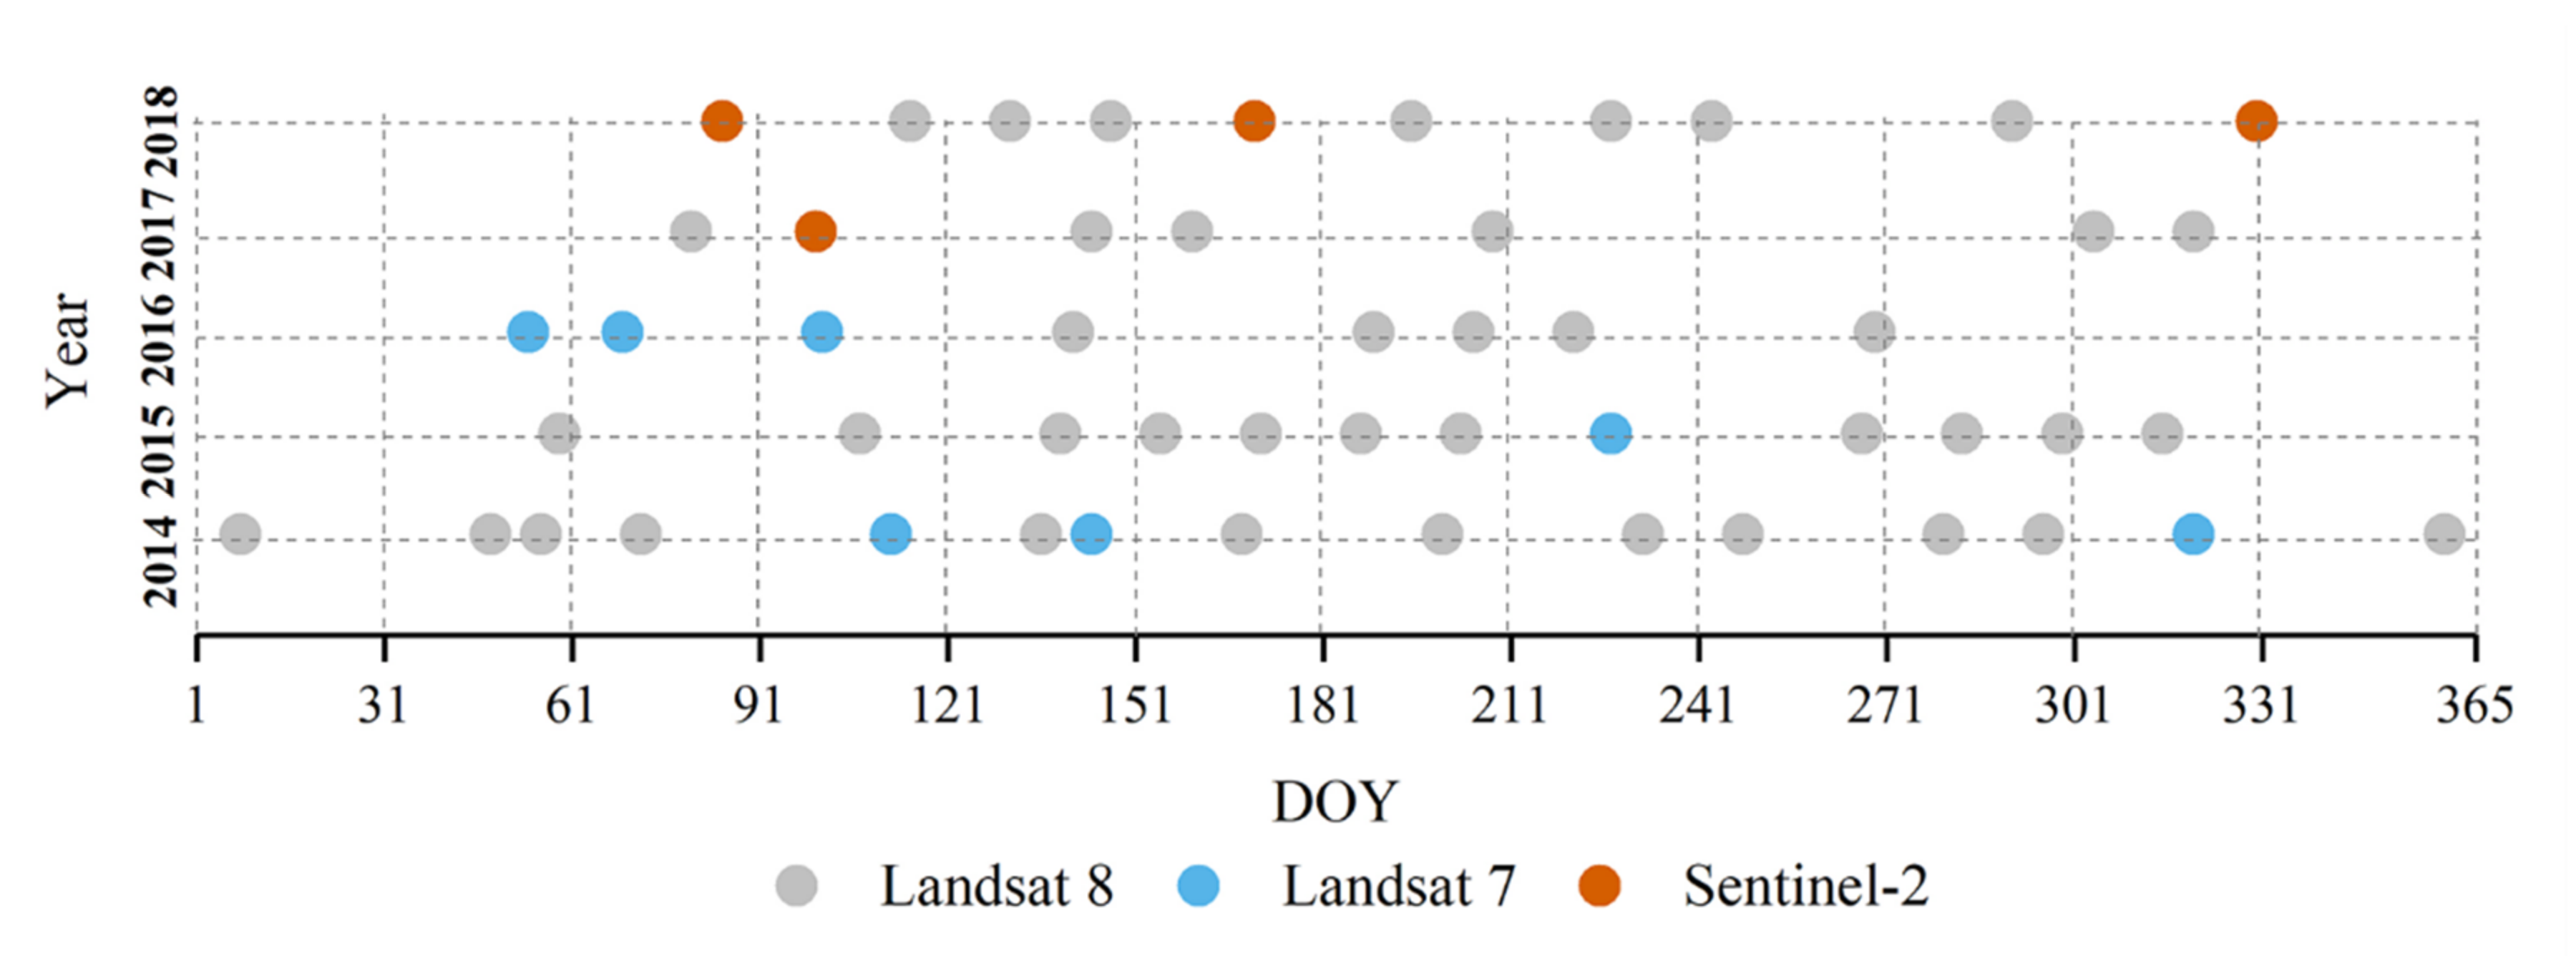
2.2. Landsat and Sentinel Image Collection and Preprocessing

We selected 60 roughly cloud-free Landsat-7 ETM+, Landsat-8 OLI, and Sentinel-2 MSI remote sensing images that covered the study area during 2014–2018 from the United States Geological Survey (USGS) and European Space Agency (ESA) (Figure 2). Only visible blue and red bands, and the near-infrared (NIR) bands of images collected were used. We further resampled the 10-m spatial resolution Sentinel-2 MSI images (visible-blue, visible-red, and NIR) to 30 m. Although the time series Landsat-8 and Sentinel-2 remote sensing images composed relatively complete crop phenological curves, the supplement of several Landsat-7 remote sensing images covering the crop non-growing season could eliminate the effects of winter wheat on the true multi-year crop growth curves (Figure 2). Landsat-7 remote sensing images covering the regions in the left of the study area had a data gap, due to the Scan Line Corrector (SLC) failure. Therefore, we filled those images gaps by using the upper and lower pixels of those strips from the same image using ENVI software [34].

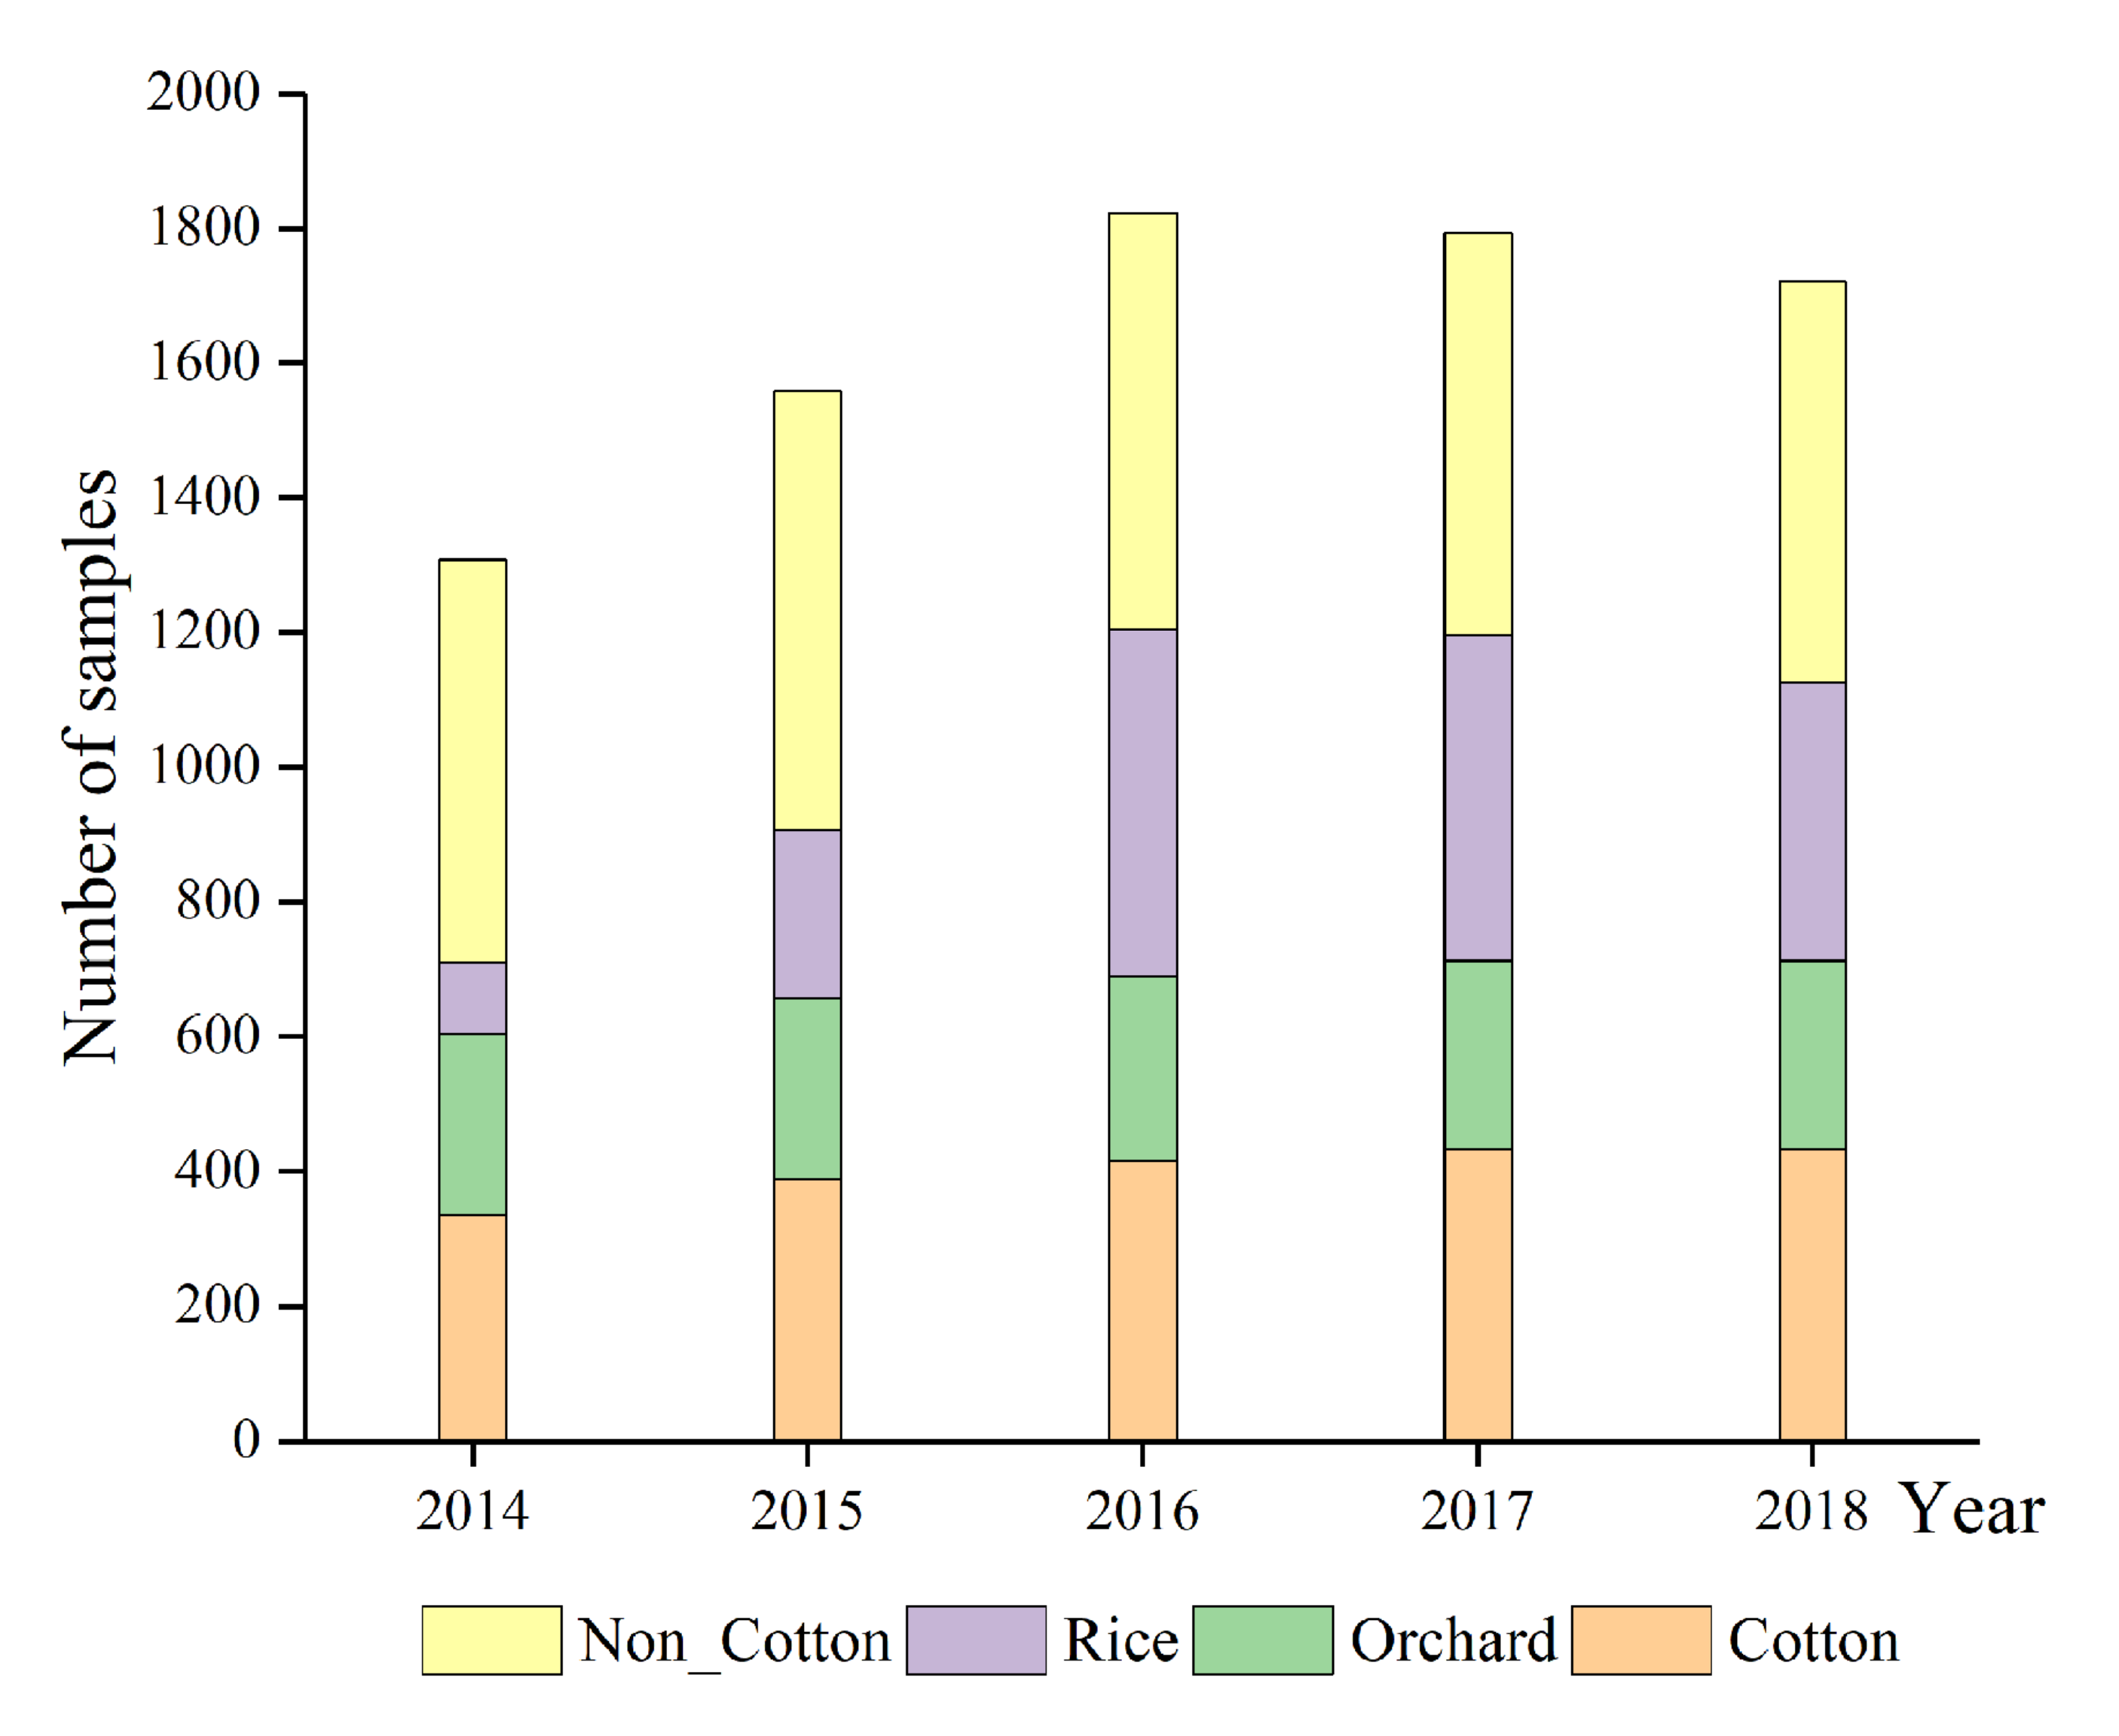
2.3. Training and Validation Samples
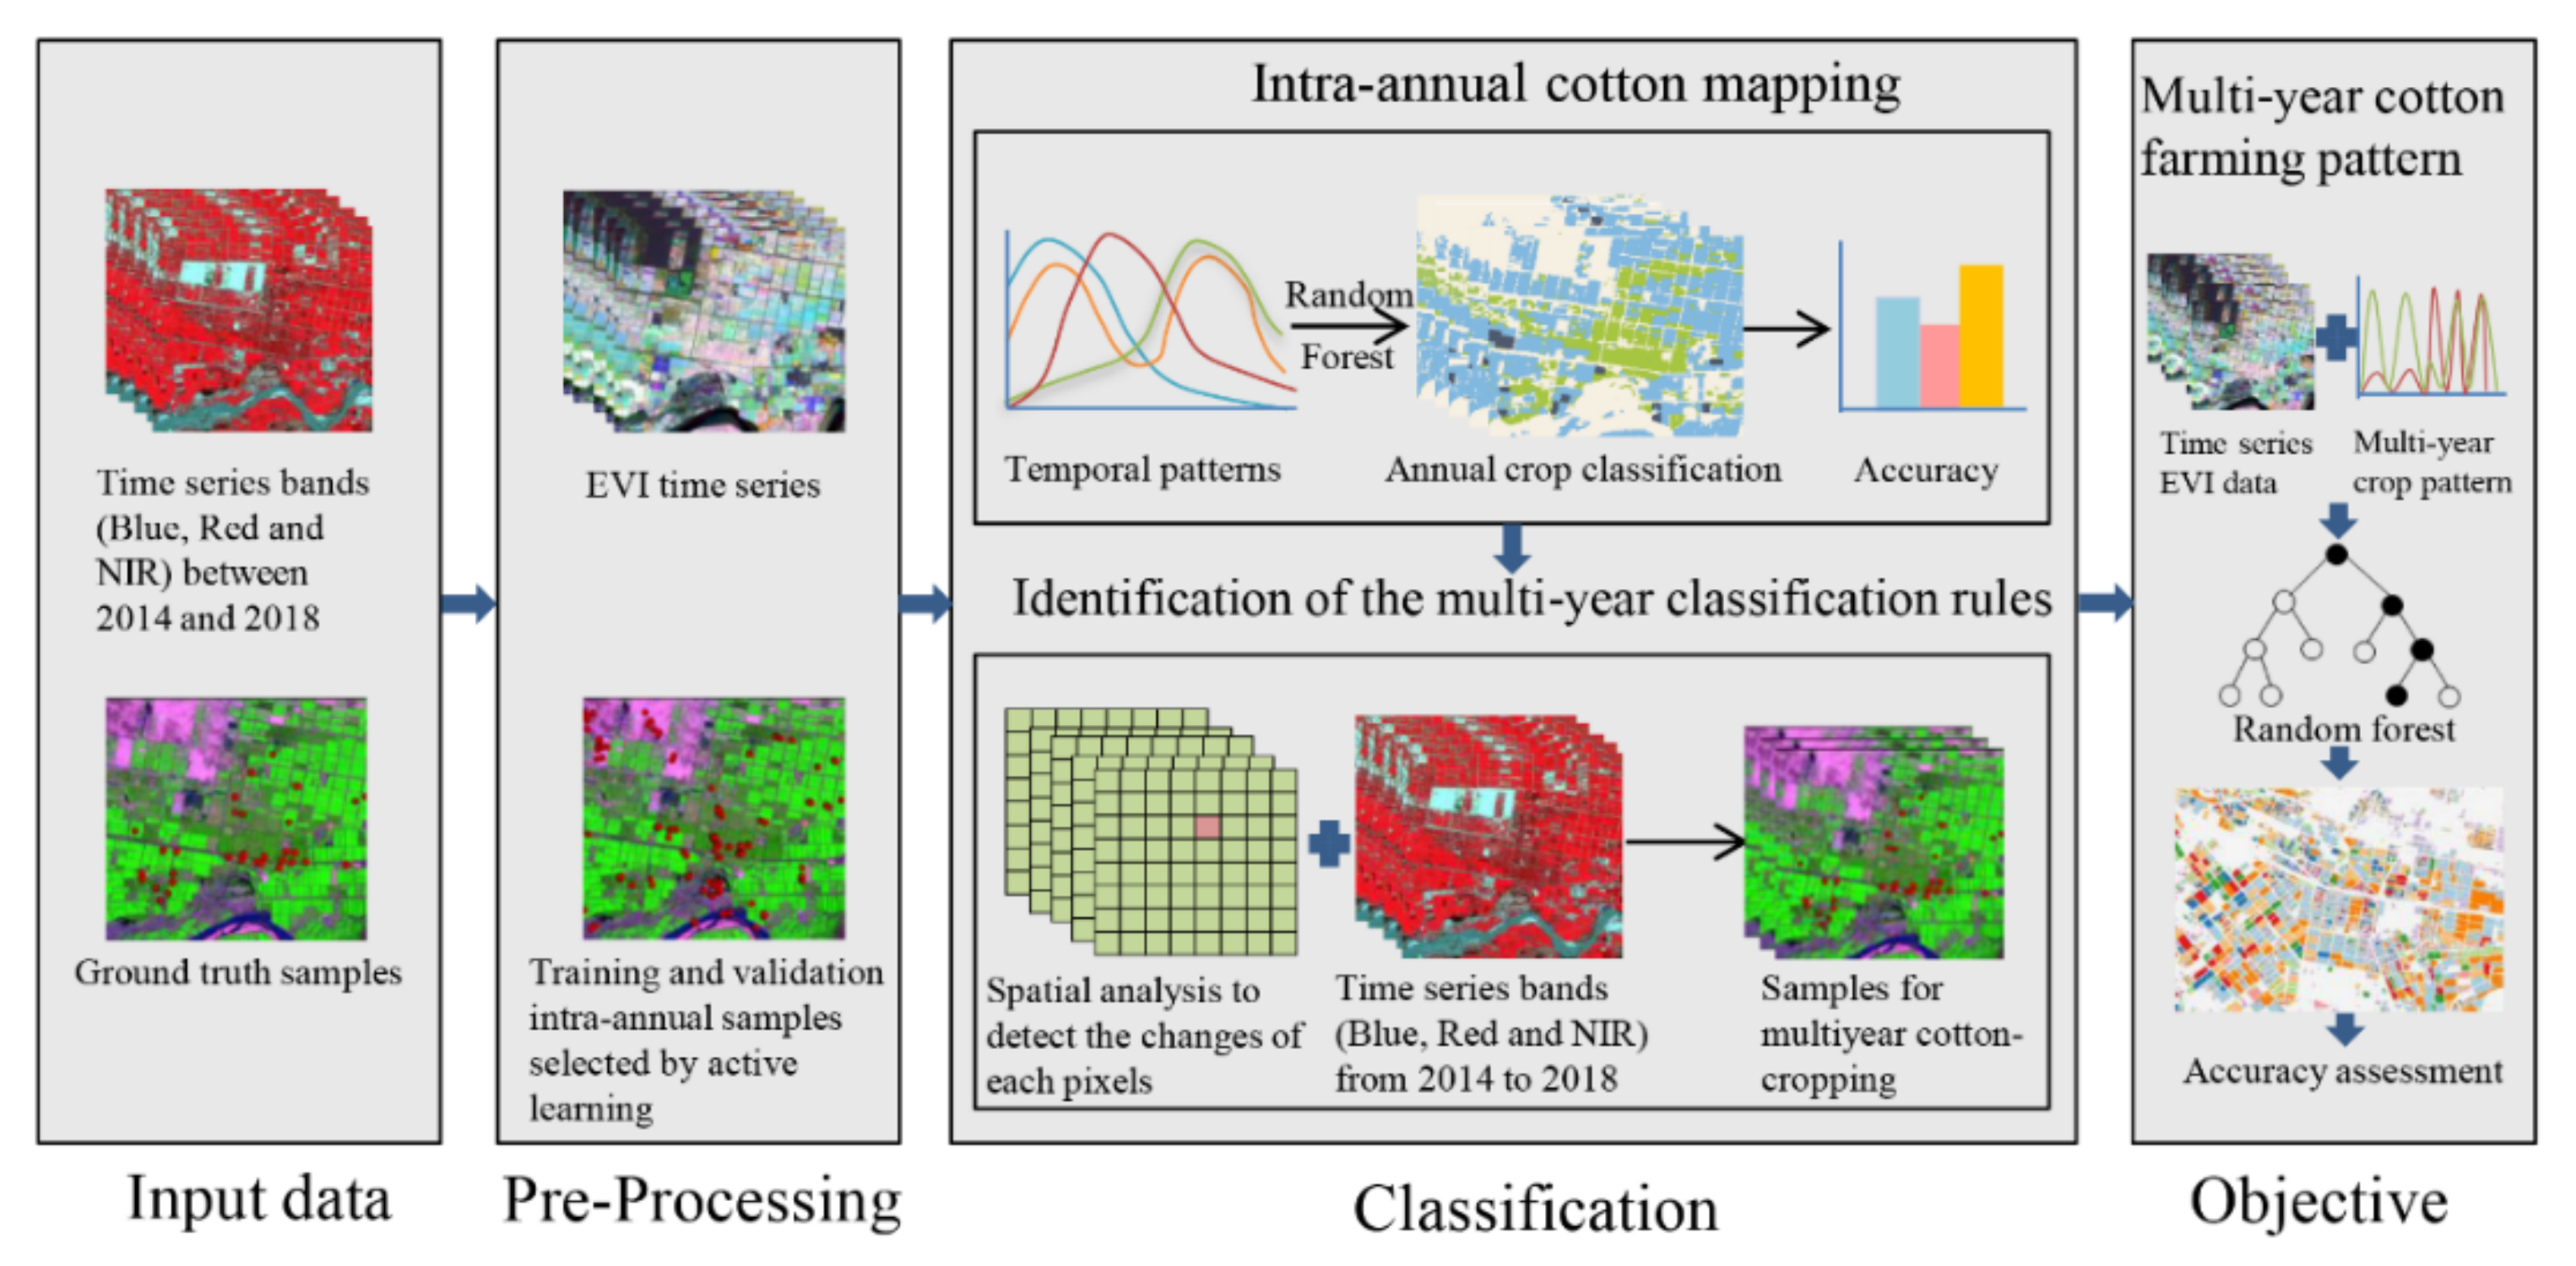
We collected ground truth samples in 2021 using handheld GPS, including 31 cotton, 64 orchard, and 12 rice samples. Meanwhile, we obtained crop type samples during 2014–2018 at Xinjiang Aksu Oasis Farmland Ecosystem National Field Scientific Observation and Research Station (hereafter, Aksu Station) where the study area was located in. We collected questionnaires about multi-year crop cultivations and their locations by interviewing the local farmers. Based on the coupled information, we obtained the detailed crop cultivation change information during 2014–2018 for each ground truth sample. Furthermore, we acquired the intra-year crop growth curves and multi-year cropping curves for the truth ground samples based on time series remote sensing derived enhanced vegetation index (EVI) curves and false color composite of Landsat and Sentinel-2 remote sensing images using the active learning. The high spatial resolution remote sensing images on Google Earth could assist in selecting samples of crop cultivation and orchard pattern. Based on the above-mentioned knowledge on annual crop cultivation and multi-year cropping mode for the ground truth samples, we expanded the sample sizes for using the active learning. Active learning had been confirmed an effective method for selecting and expanding samples [29]. We added unlabeled samples as training samples based on identical spectral-temporal features of existing ground truth samples through the above-mentioned prior knowledge [30].
The number of field samples is listed in Figure 3. “Non_Cotton” contained three categories: vegetation (veg), non_vegetation (non_veg), and water class. Next, we used an automatic method on data splitting functions in the R package to separate all samples into training and validation samples, which accounted for 30% and 70%, respectively.

2.4. Methods

The flow chart illustrated how the multi-year cotton farming pattern was extracted (Figure 4). First, we obtained the EVI from the time series Landsat and Sentinel remote sensing images. Next, we expanded the training and validation sample sizes by active learning based on ground truth samples. Second, we implemented the intra-annual cotton classification based on the annual temporal patterns using random forest classifications. Third, we labeled and expanded multi-year cotton cropping pattern samples references on intra-annual classification, multi-year crop EVI curves, and time series false color composite of Landsat and Sentinel-2 remote sensing images. Finally, we obtained the multi-year cotton cropping patterns using the random forest classification algorithm and then implemented the accuracy assessment for each classification category.

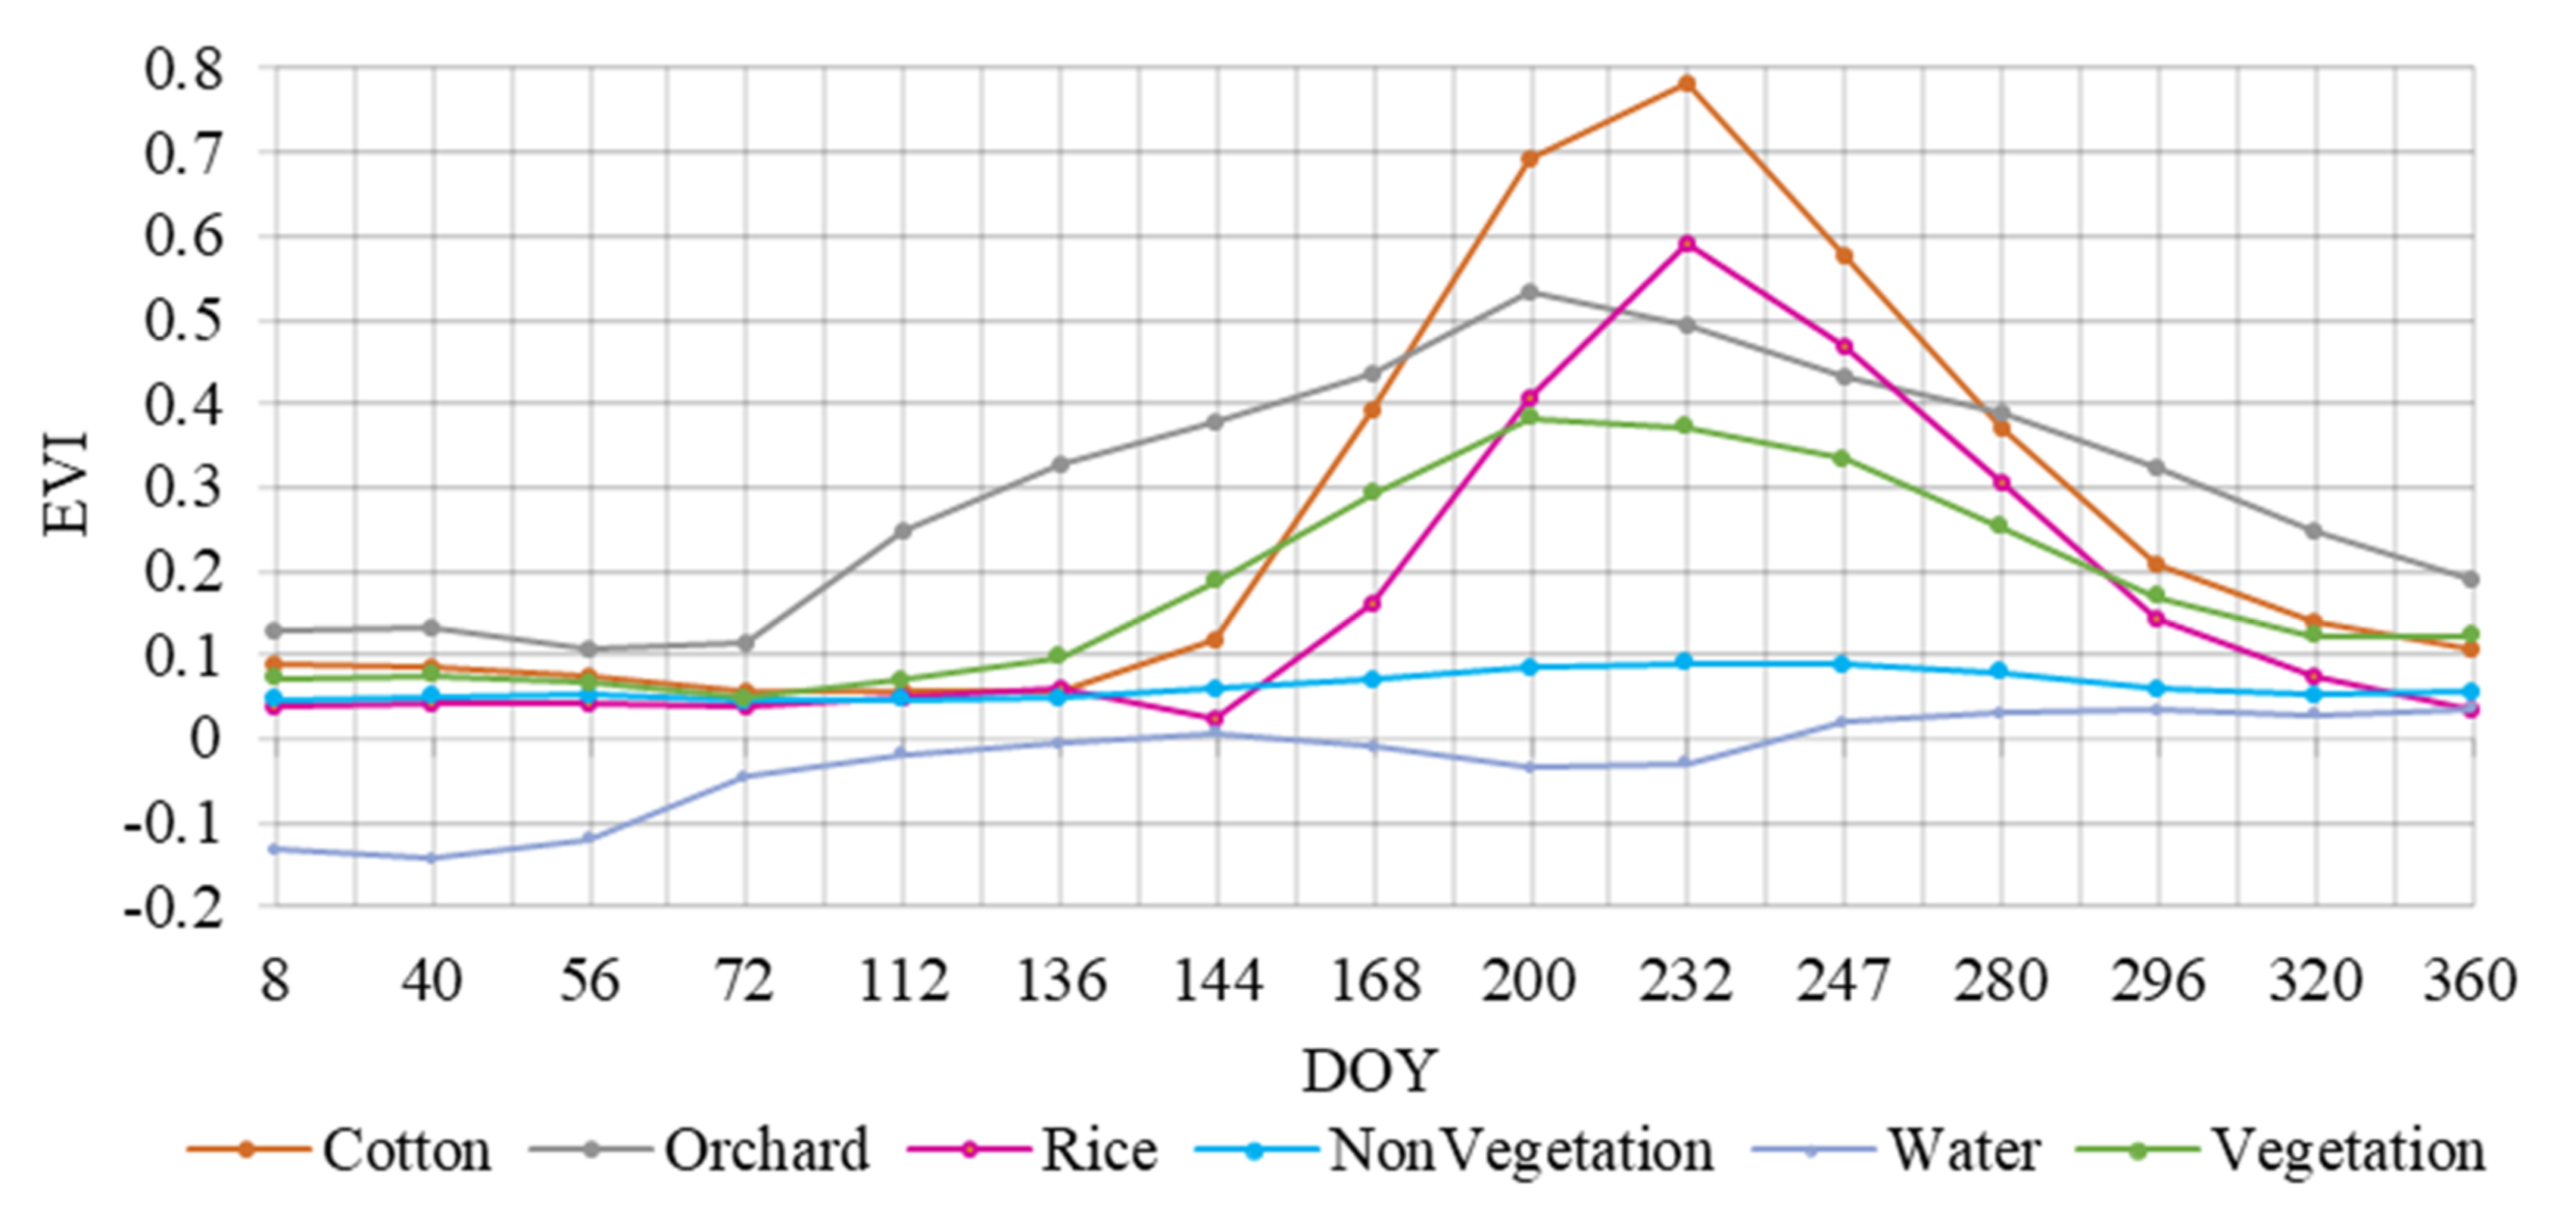
2.4.1. Annual Crop Phenological Pattern Identification

We generated EVI data derived from Landsat and Sentinel-2 remote sensing images using the ENVI software. Next, we used time series EVI data to construct the growth process of cotton and other crops, since the EVI was highly sensitive to biomass, was not easily saturated with high vegetation coverage, and reduced atmospheric and soil effects [2,35]. Finally, we used the Savitzky–Golay filter [36] in the ENVI software to smooth the EVI curve to obtain the filtered EVI time series curve (Figure 5). The formula for EVI is as follows,
E V I   =   G ρ N I R     ρ R e d ρ N I R   +   C 1 ρ R e d     C 2 ρ B l u e   +   L
where ρNIR, ρRed and ρBlue are the reflectance of the NIR, red, and blue bands after atmospheric correction, respectively; L is the soil-adjusting coefficient and equals 1; G is the gain factor and equals 2.5; C1 and C2 are the coefficients of the aerosol resistance term (C1 = 6 and C2 = 7.5, respectively).

2.4.2. Training Samples for Multi-Year Cotton-Cropping Patterns

To extract the crop succession pattern between 2014 and 2018, we defined cotton-planting succession based on the trajectory of the annual land use classification, which contained monoculture (i.e., only cotton planted for five consecutive years), cotton-rice rotation (i.e., cotton rotation with rice in any given year), reclamation (i.e., changing to cotton from other uses), abandonment (i.e., cotton was not planted for more than two years), cotton-fallow (i.e., cotton rotation with bare land in any given year for no more than one year), and other classes (i.e., veg, non_veg, orchard, and water class) (Table 1; Figure 6a,b). Next, we selected a total of 1293 training samples (30% of the total samples) and 3000 validation samples (70% of the total samples) using an automatic method on data splitting functions in the R package for identifying and assessing multi-year cotton-cropping patterns (Table 2).

2.4.3. Random Forest Classification

The random forest (RF) algorithm [37] is an automatic learning method based on the creation of different decision trees [38]. The RF algorithm has been proven to be an effective and robust method in crop type identification [39,40]. Therefore, we employed the RF algorithm in the EnMAP-Box (an open-source plug-in for QGIS). The number of trees created by randomly selecting samples from the training samples was set to 1000. Lawrence et al. (2006) [41] proved that there was no increase in the number of errors beyond the creation of 1000 classification trees. We used the EVI time series phenological pattern (Figure 5; Table 1) as input variables in the RF classification method.

2.4.4. Classification Accuracy Assessment

The accuracy of the pixel-based intra-annual crop cultivation and multi-year cotton cropping pattern classification was evaluated in terms of overall accuracy (OA), producer’s accuracy (PA), user’s accuracy (UA) metrics, and Kappa coefficient [23]. Figure 3 shows the spatial distribution of the validation samples for intra-annual crop cultivation classification, while Table 2 shows the distribution of the validation samples for multi-year cotton cropping pattern classification. Moreover, we spatially validated the multi-year cotton cropping pattern using ground truth data collected at the Aksu Station.

3. Results

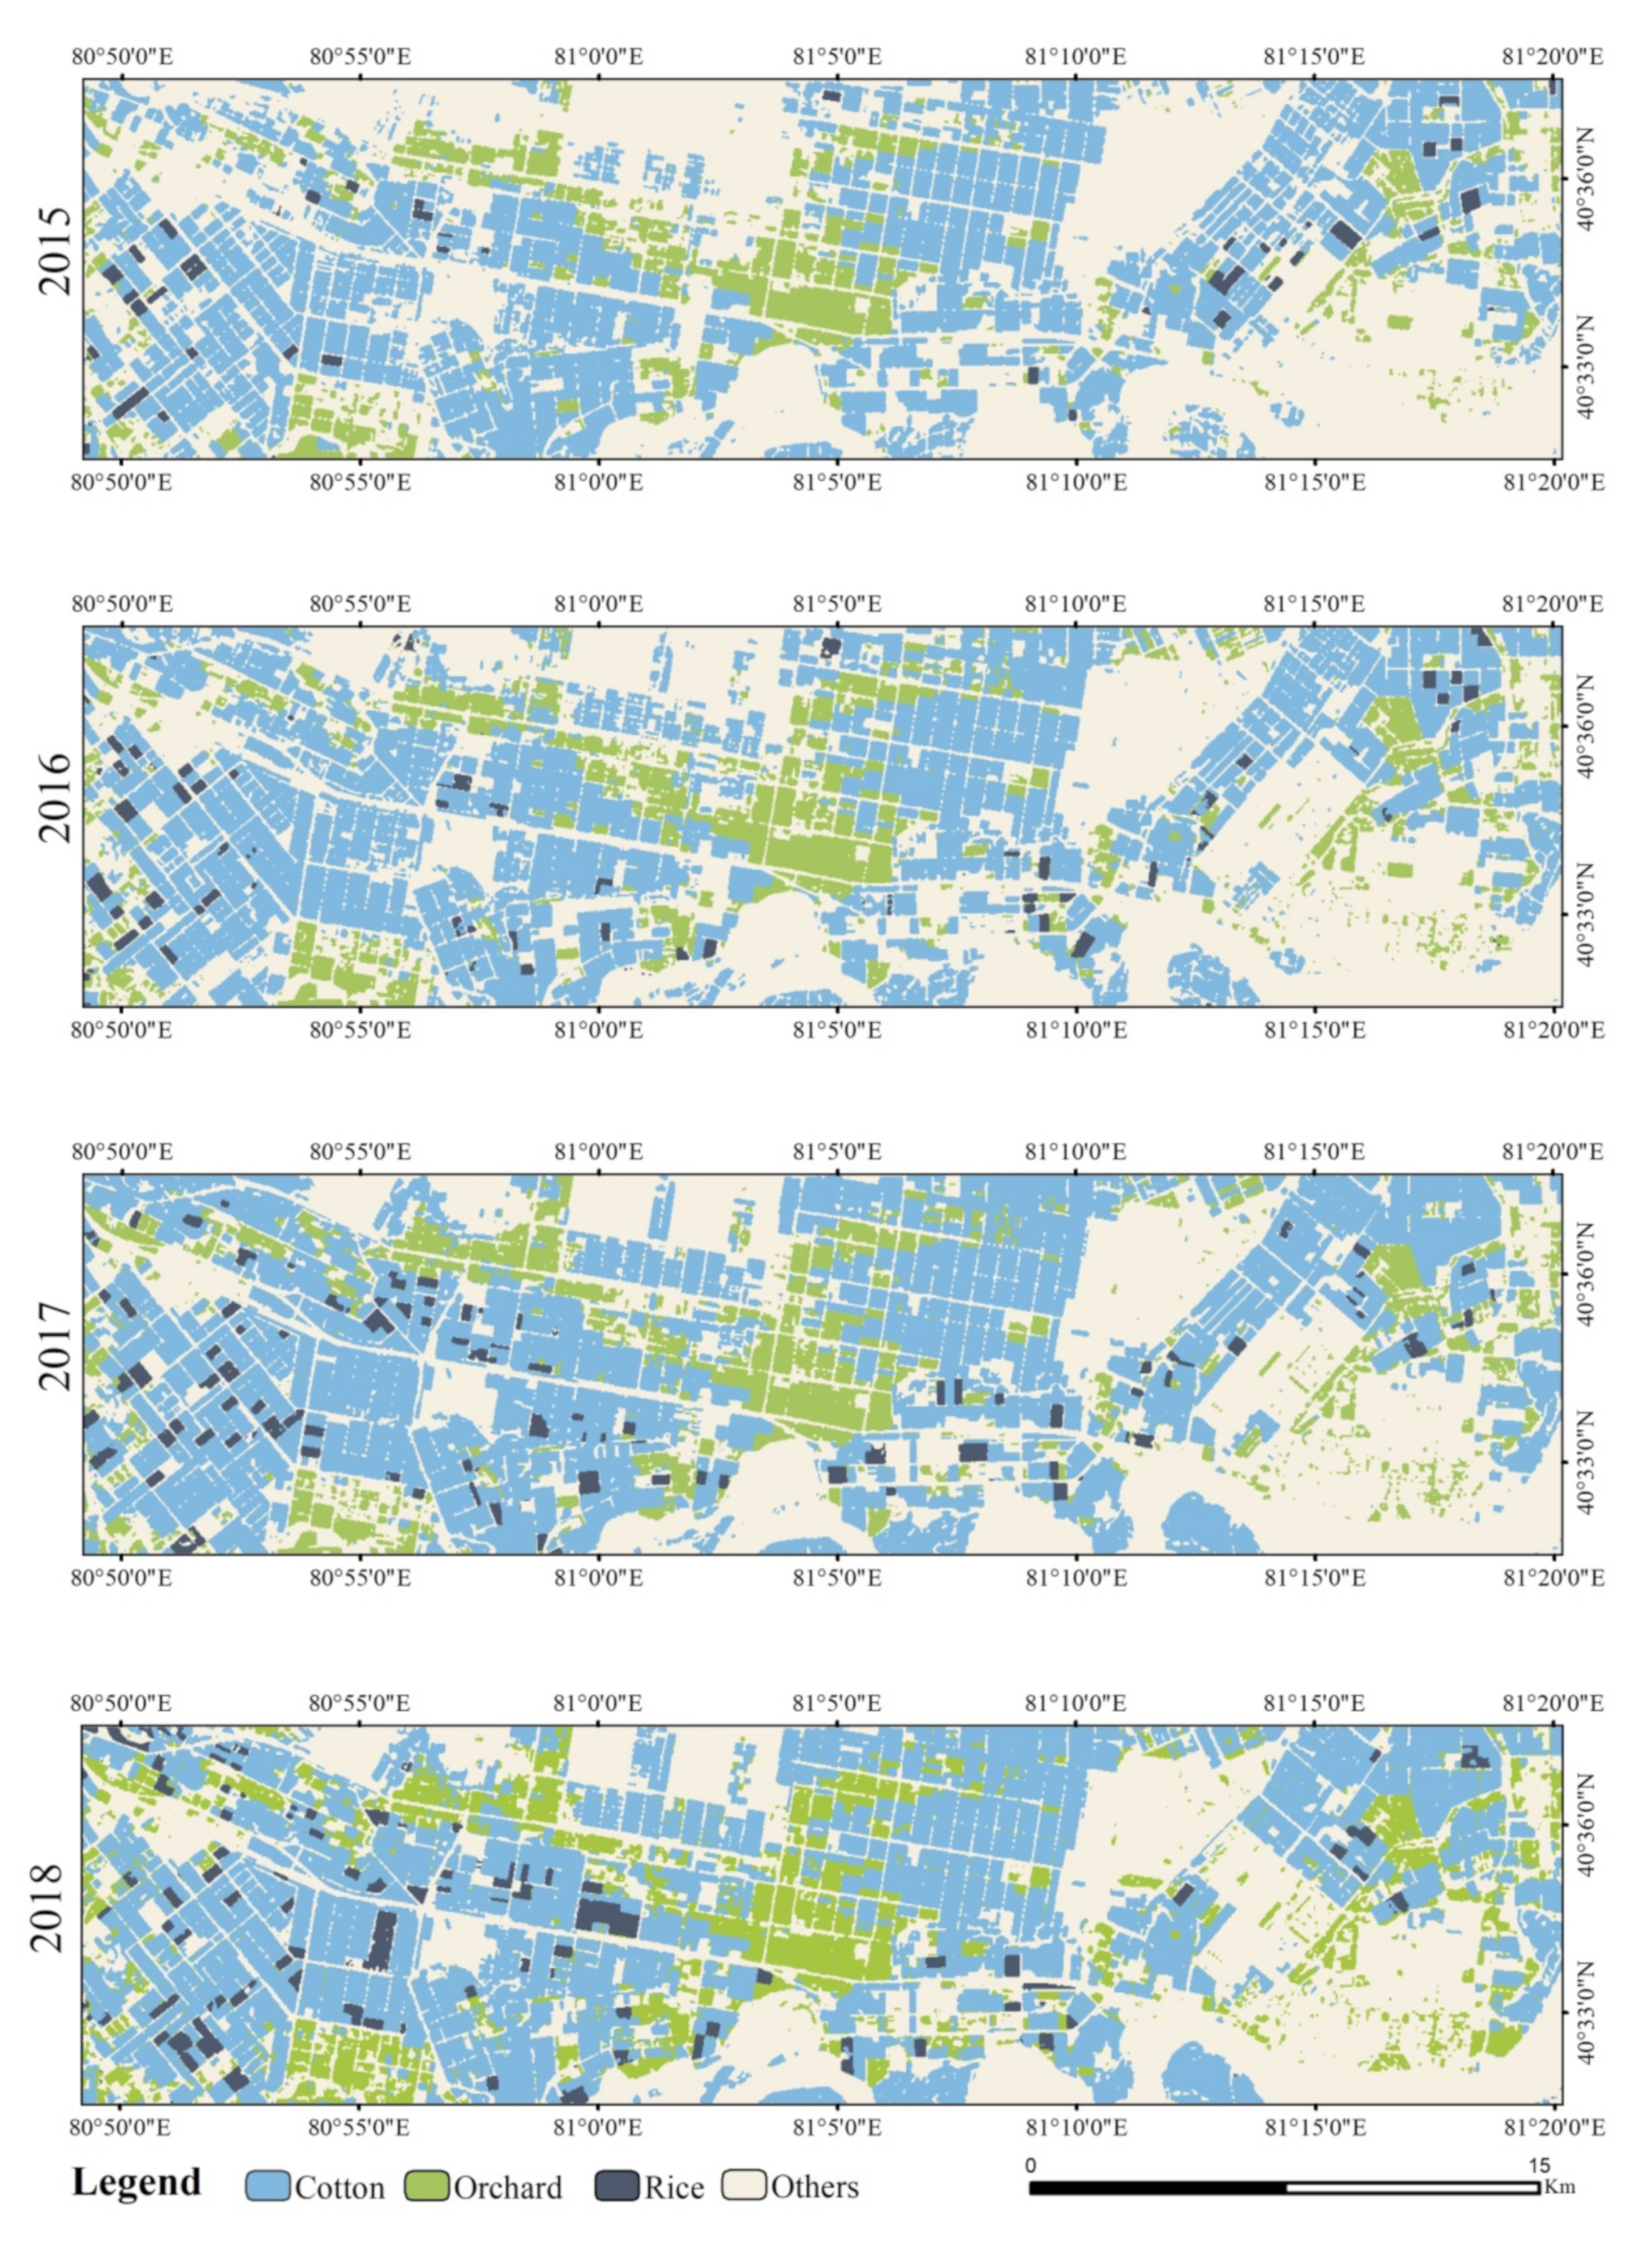
3.1. Intra-Annual Cotton Mapping Based on the RF Method

We employed a pixel-based RF classification approach to obtain annual cotton and other crop types. According to the annual classification map, cotton was the primary crop type in the study area, followed by orchards, while the tertiary crop type was rice (Figure 7). The spatial and temporal distribution of cotton and orchard crops was stable, while the rice crop distribution changed every year due to cotton-rice rotation (Figure 7).
The highest OA was obtained in 2014, at 98.58%, followed by 2015 at 98.16%. The lowest OA of the classification was in 2017, with 95.69%. In addition to the orchard classification in 2015 and 2018 and the crop classification in 2017, the difference between UA and PA was lower than 2% in terms of classification of each type (Table 3).

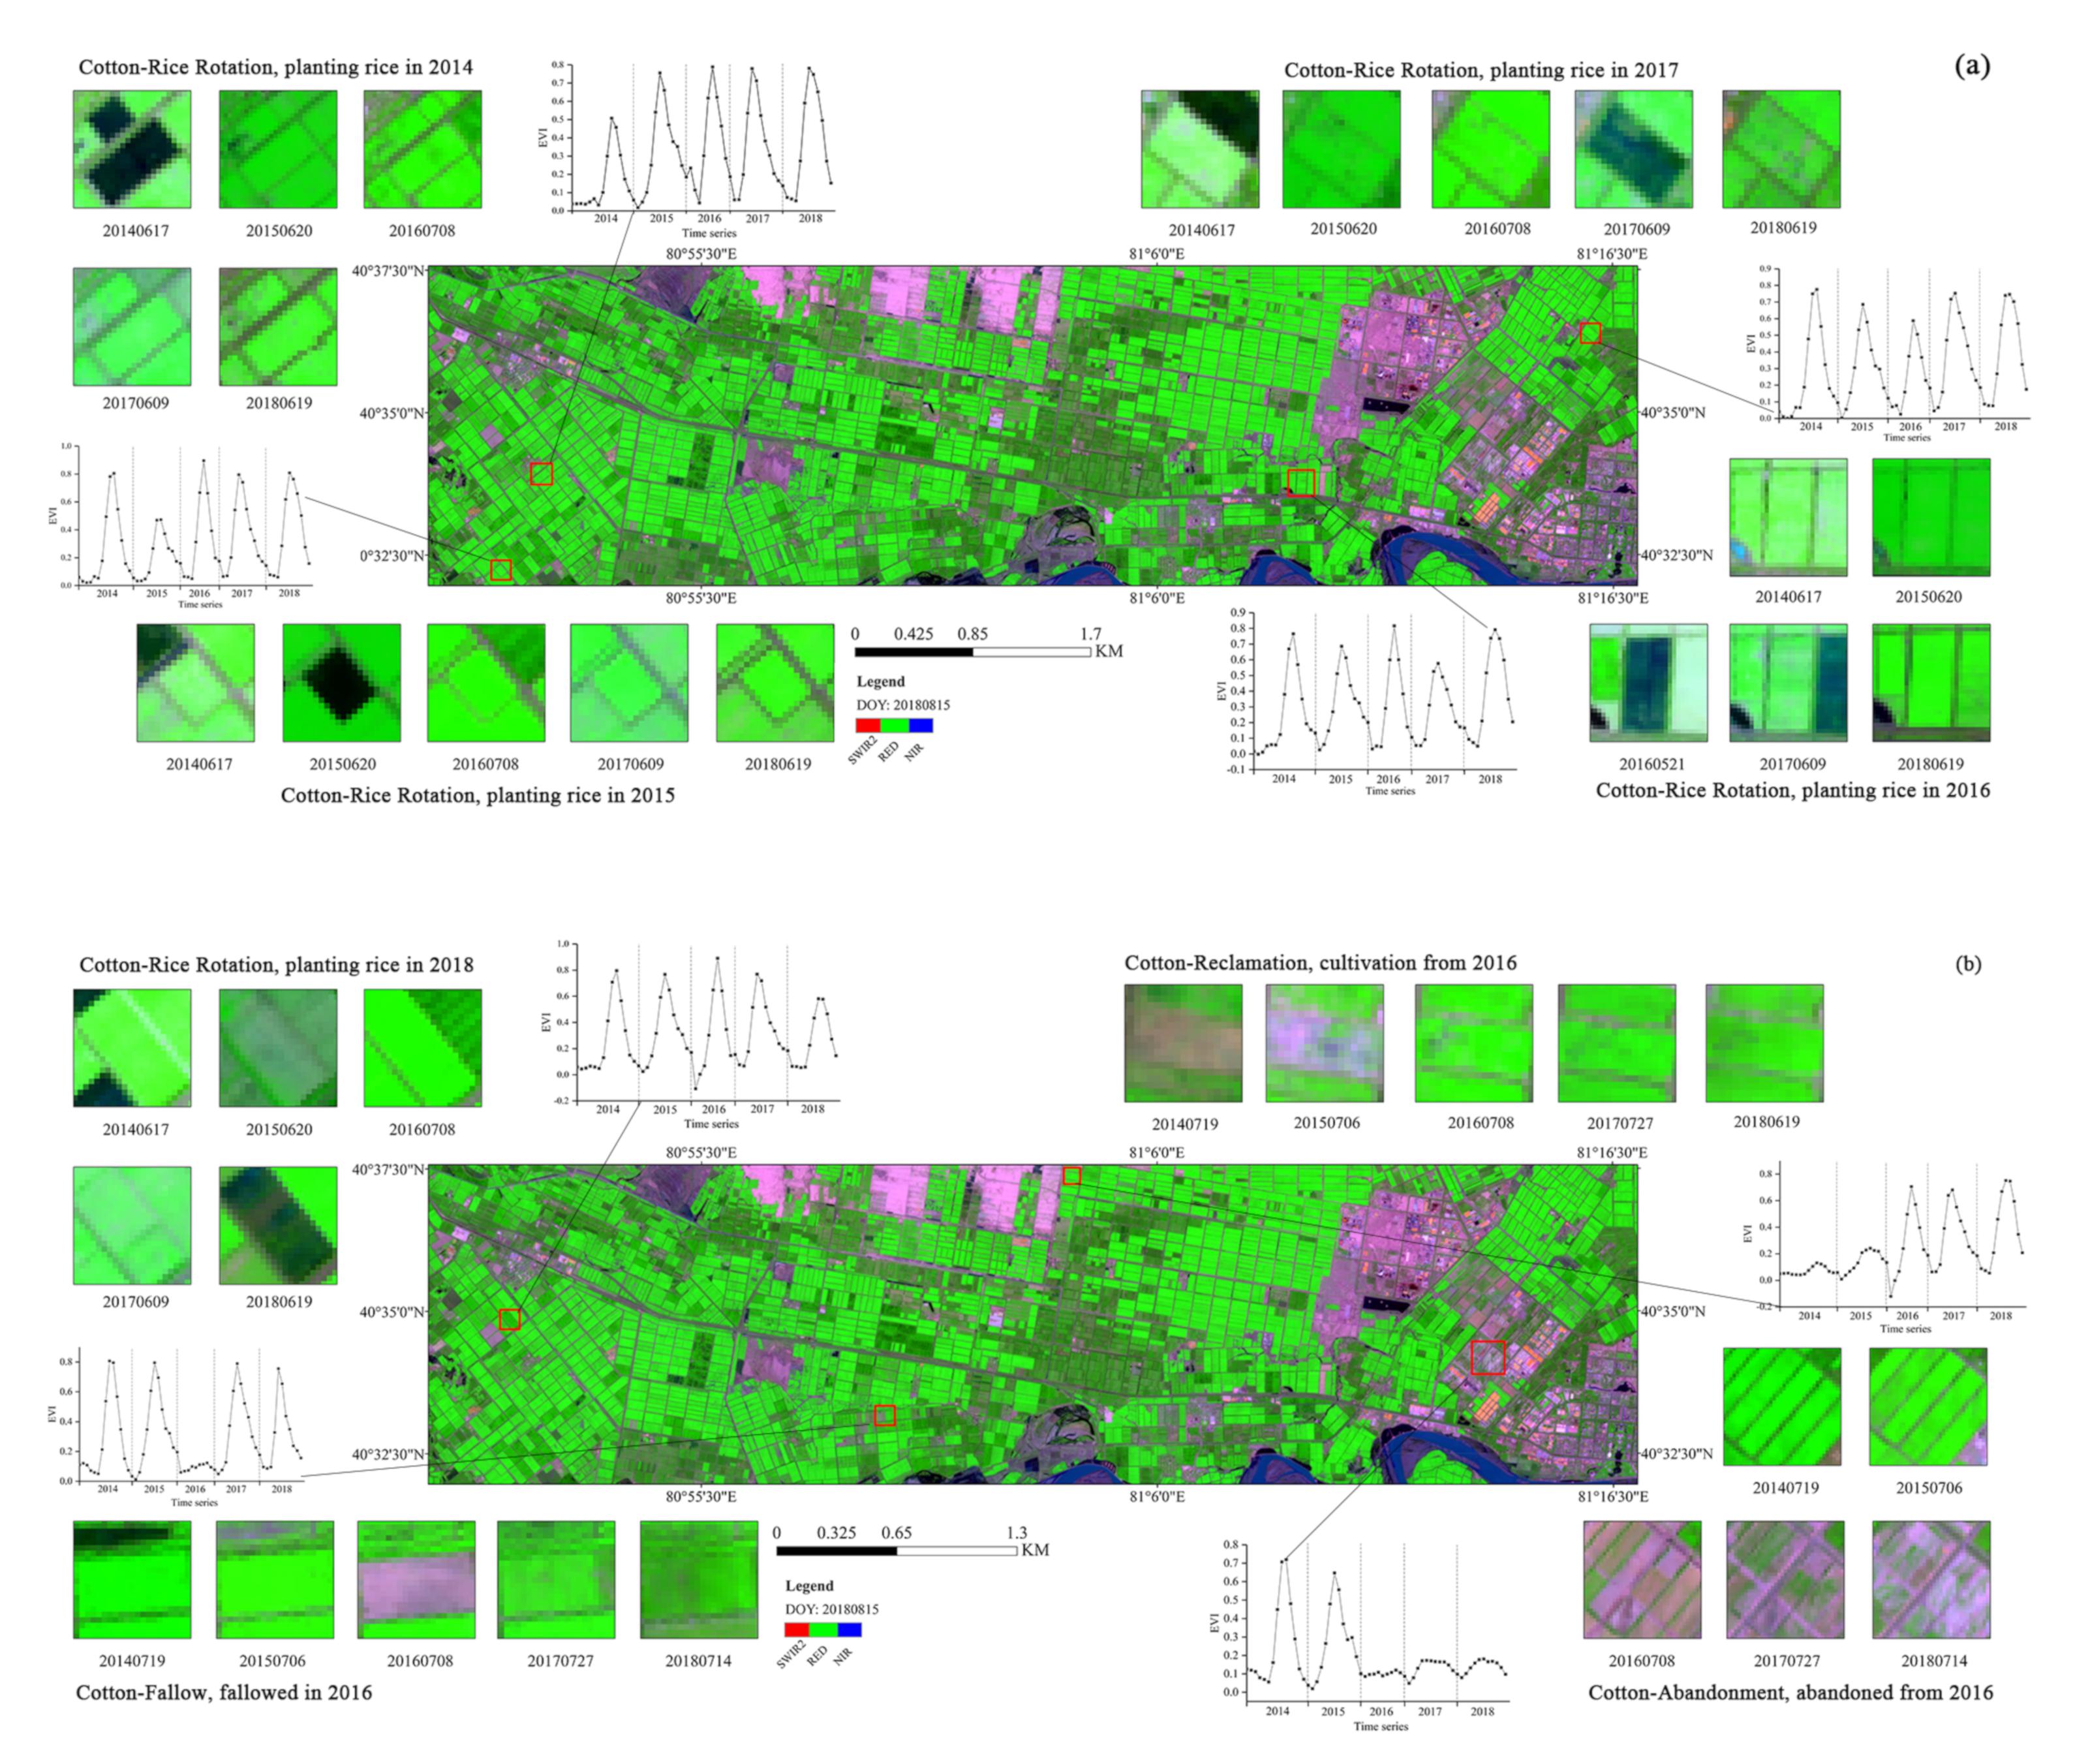
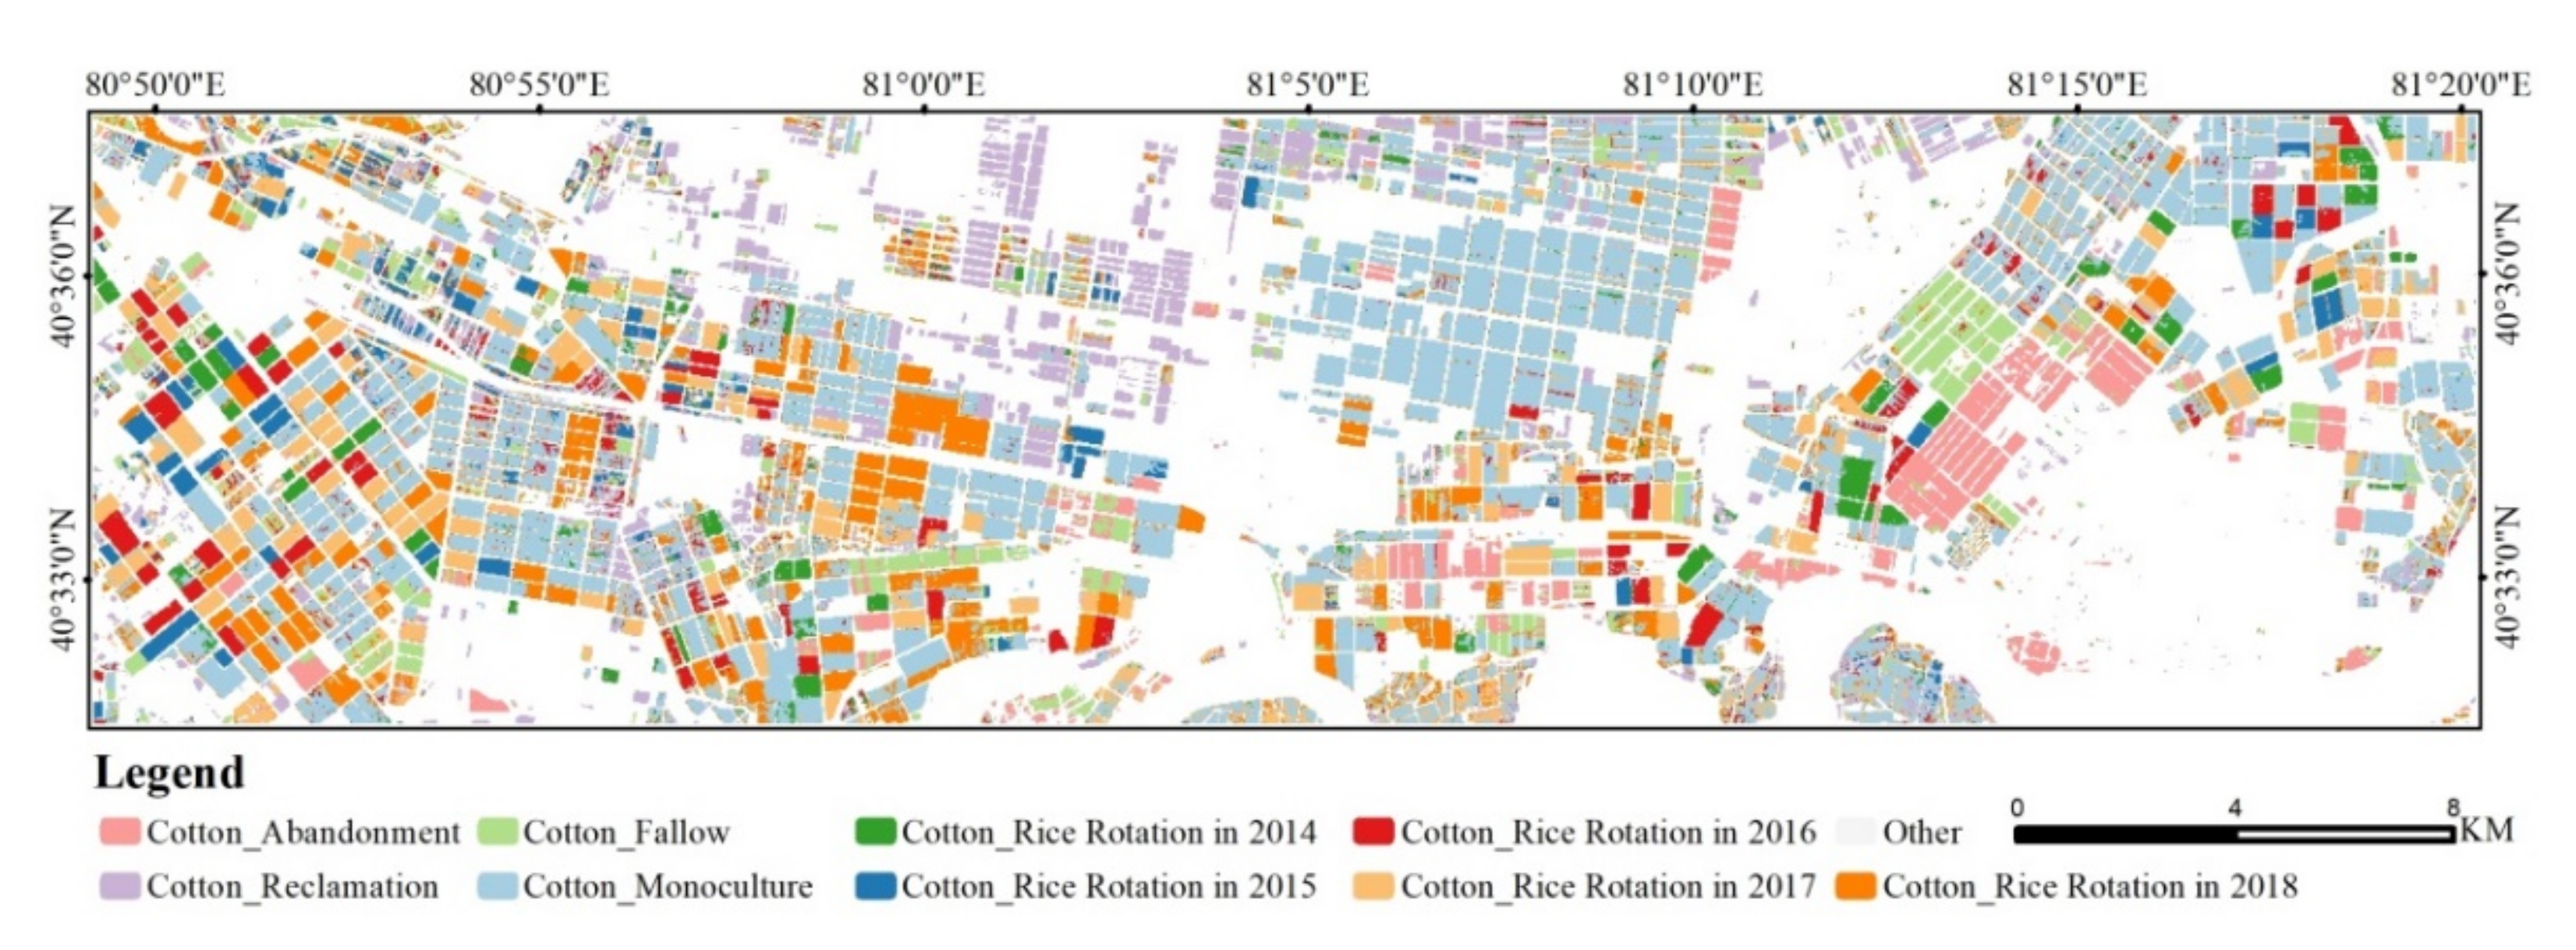
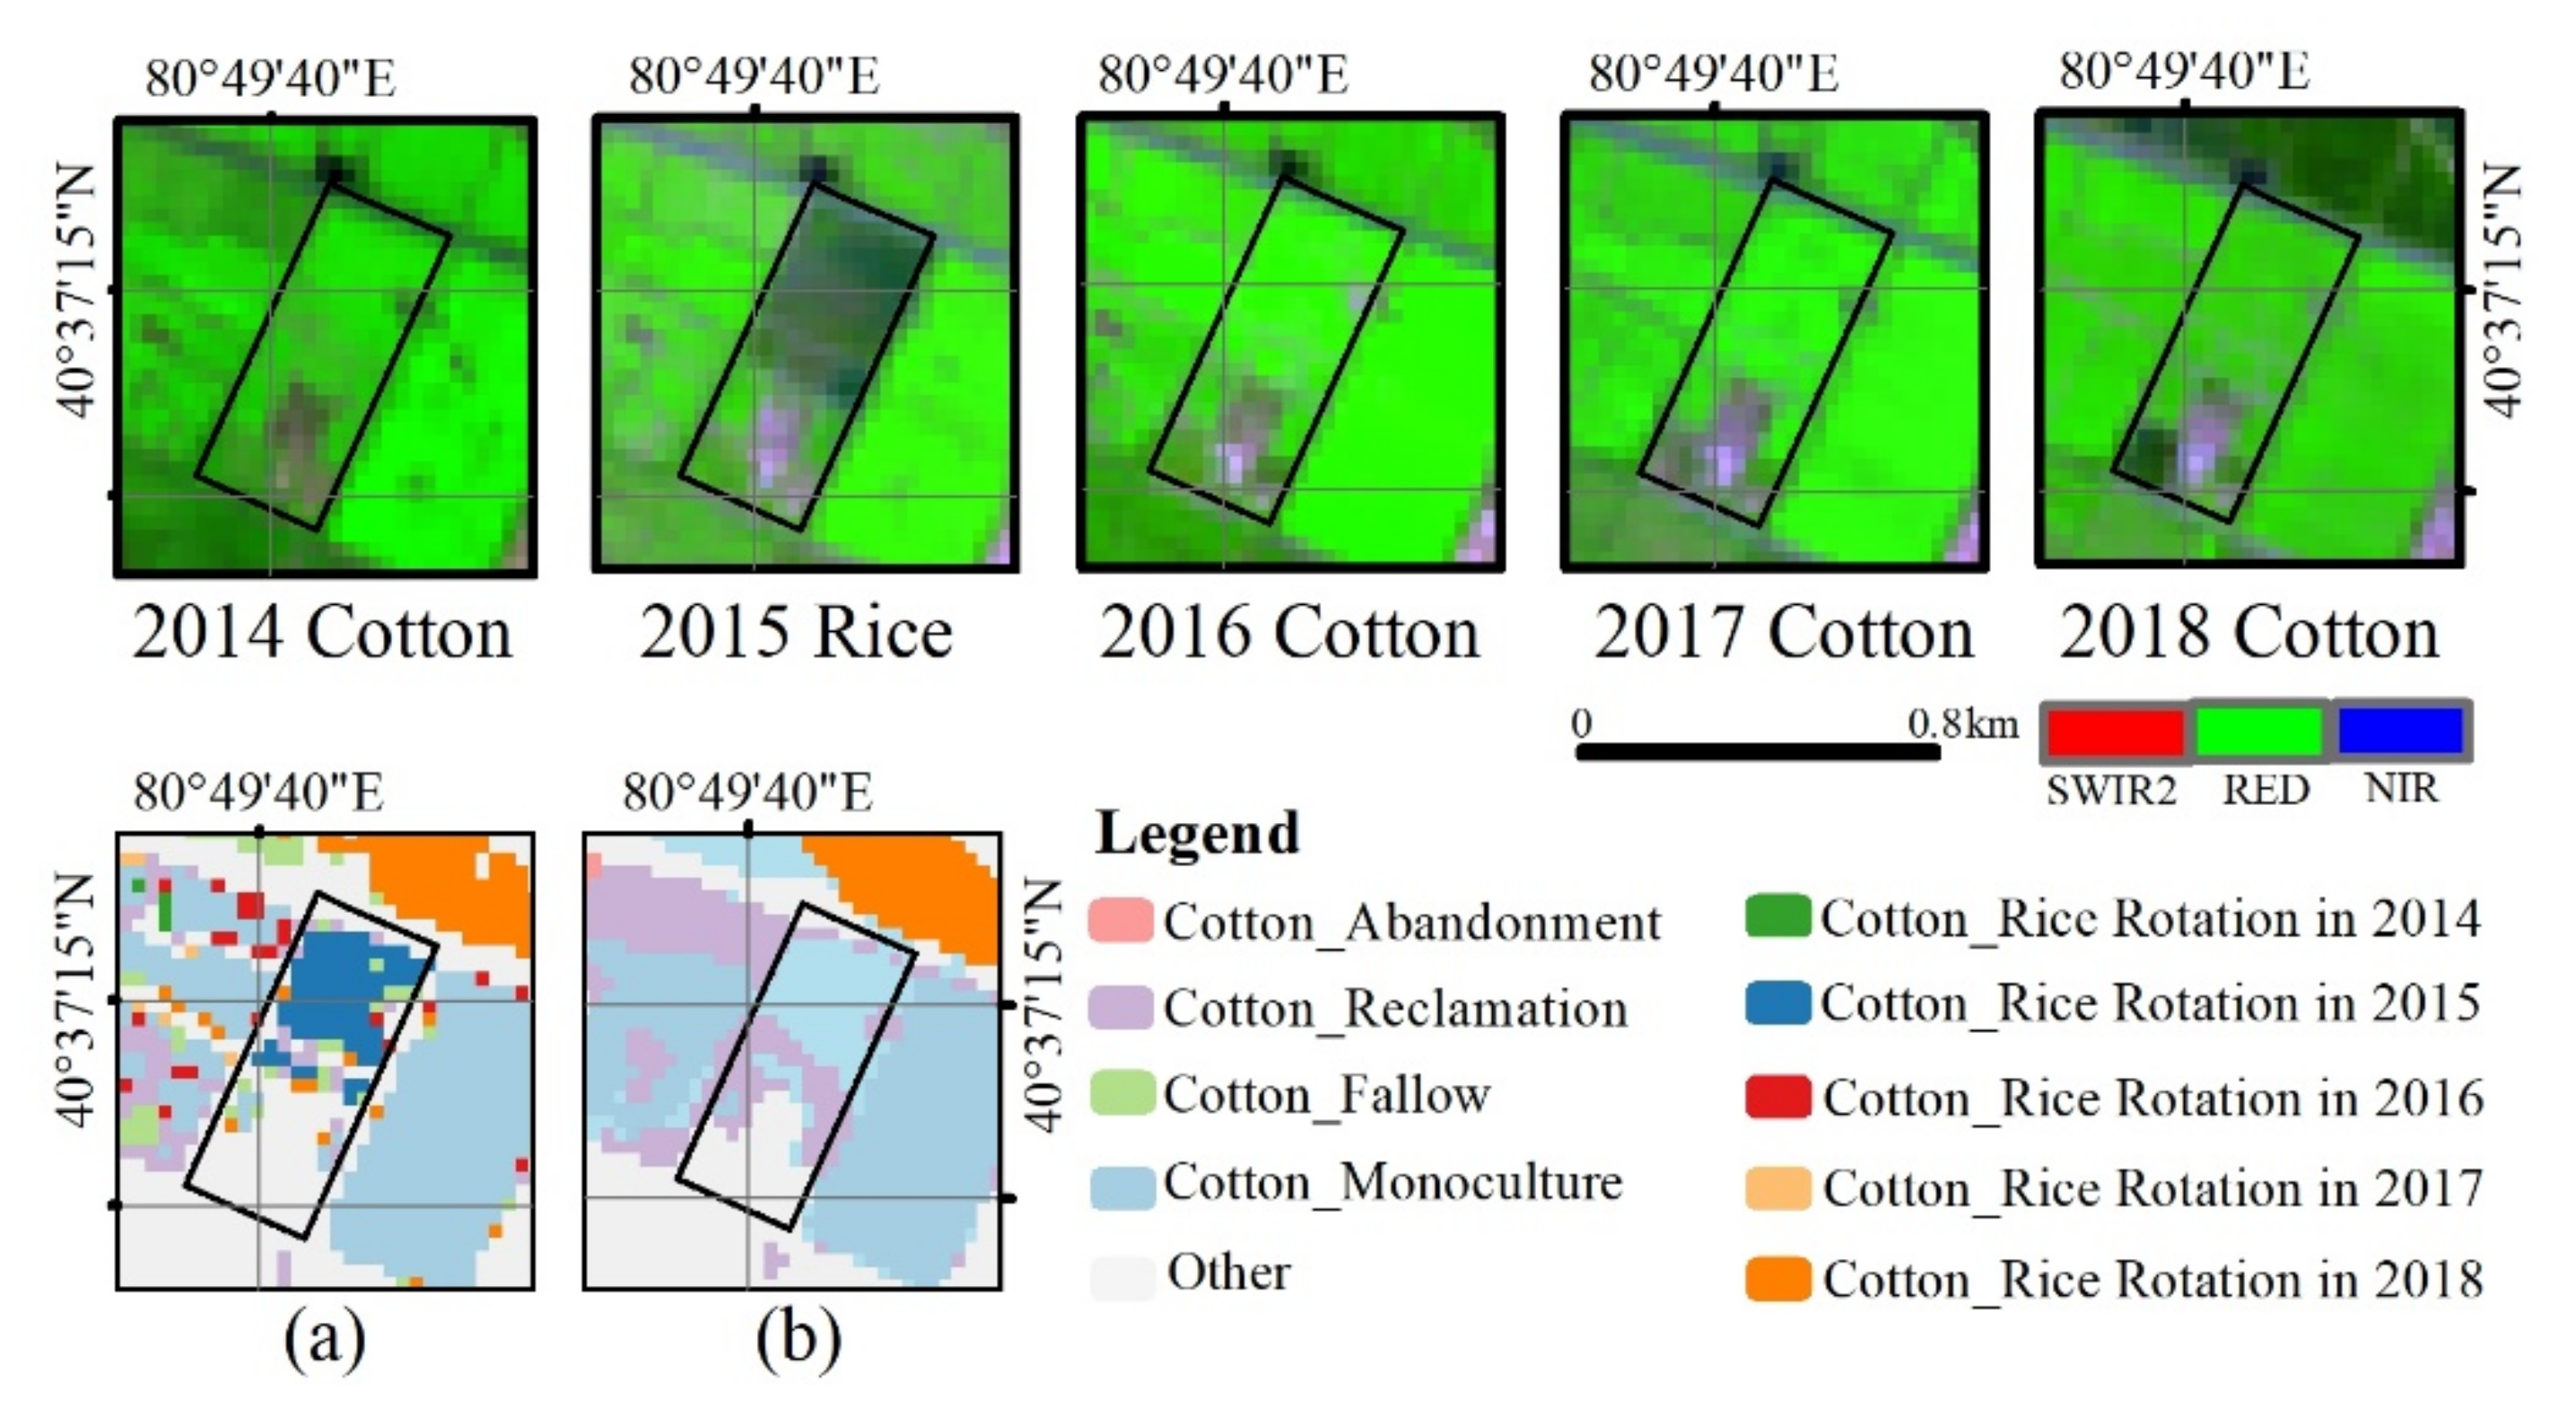
3.2. Multi-Year Cotton Cropping Pattern Identification

We obtained the pixel-based multi-year cotton cropping patterns using the RF classification method and extended training samples (Figure 8). The monoculture category was mainly distributed in the center of study area. The monoculture cotton class occupied the highest area in the nine cotton-farming pattern categories (expect the other class) with 81.83 km2 (Figure 9). The reclamation cotton field clearly had northerly development, which was previously unused land (Figure 6 and Figure 8) and increased by approximately 26.12 km2. Rotation cotton was mostly located in outside areas. The cotton-rice rotation class area continued to increase over the study period by 73.19 km2. It was noticeable that the area of cotton-rice rotation rose year by year, from 7.92 km2 to 26.92 km2 over the period shown (Figure 9). Although the study area occupied a small part of Alar city, this phenomenon showed the condition of cropland that was used tended to be better in Alar city due to rotation being an effective agronomic practice for soil fertility maintenance and for tackling pests [15]. The eastern part of the research area was the main abandonment cotton distribution area with 14.71 km2. Moreover, the overall accuracy of the multi-year cropping pattern was 96.93%, and the kappa coefficient was 0.97. In addition to the other classes and rotation in the 2015 class, the difference between UA and PA was lower than 3.5% in terms of other crop class classifications (Table 4).

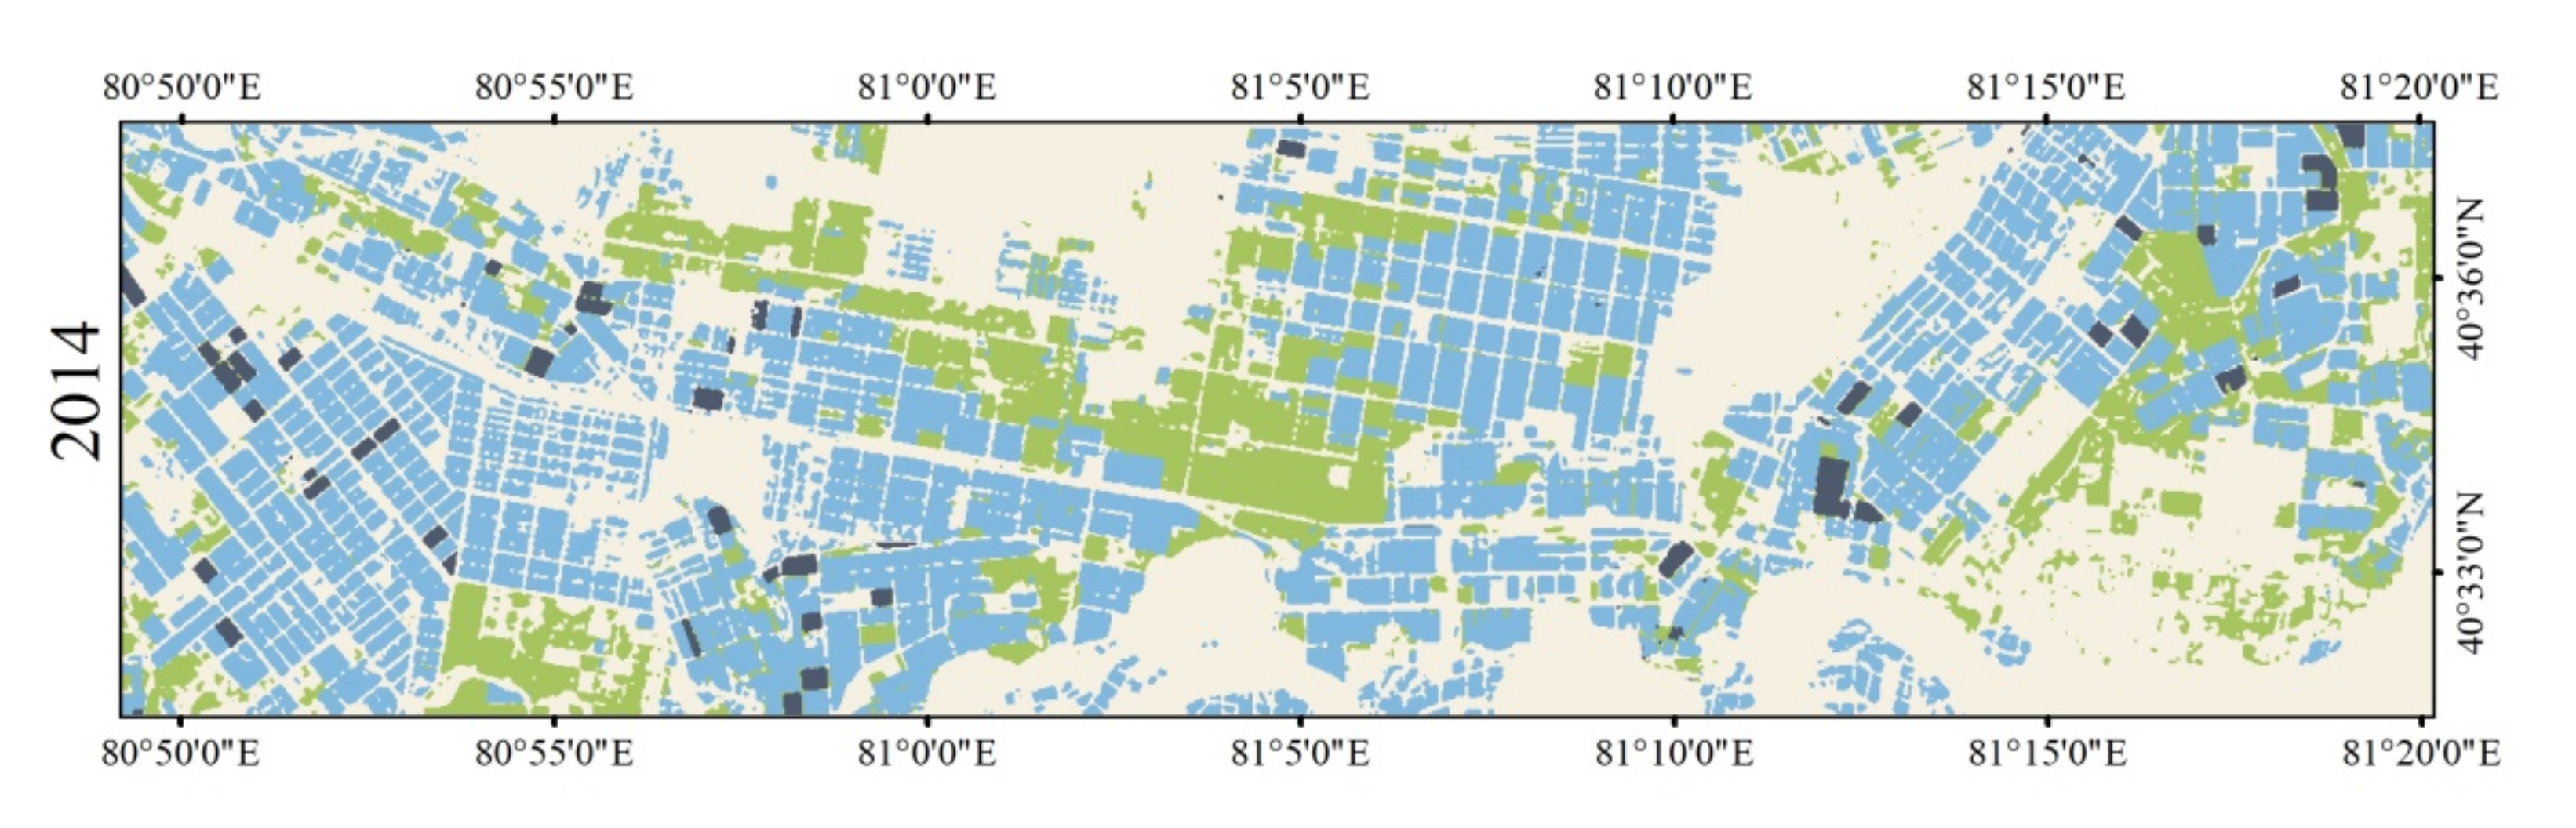
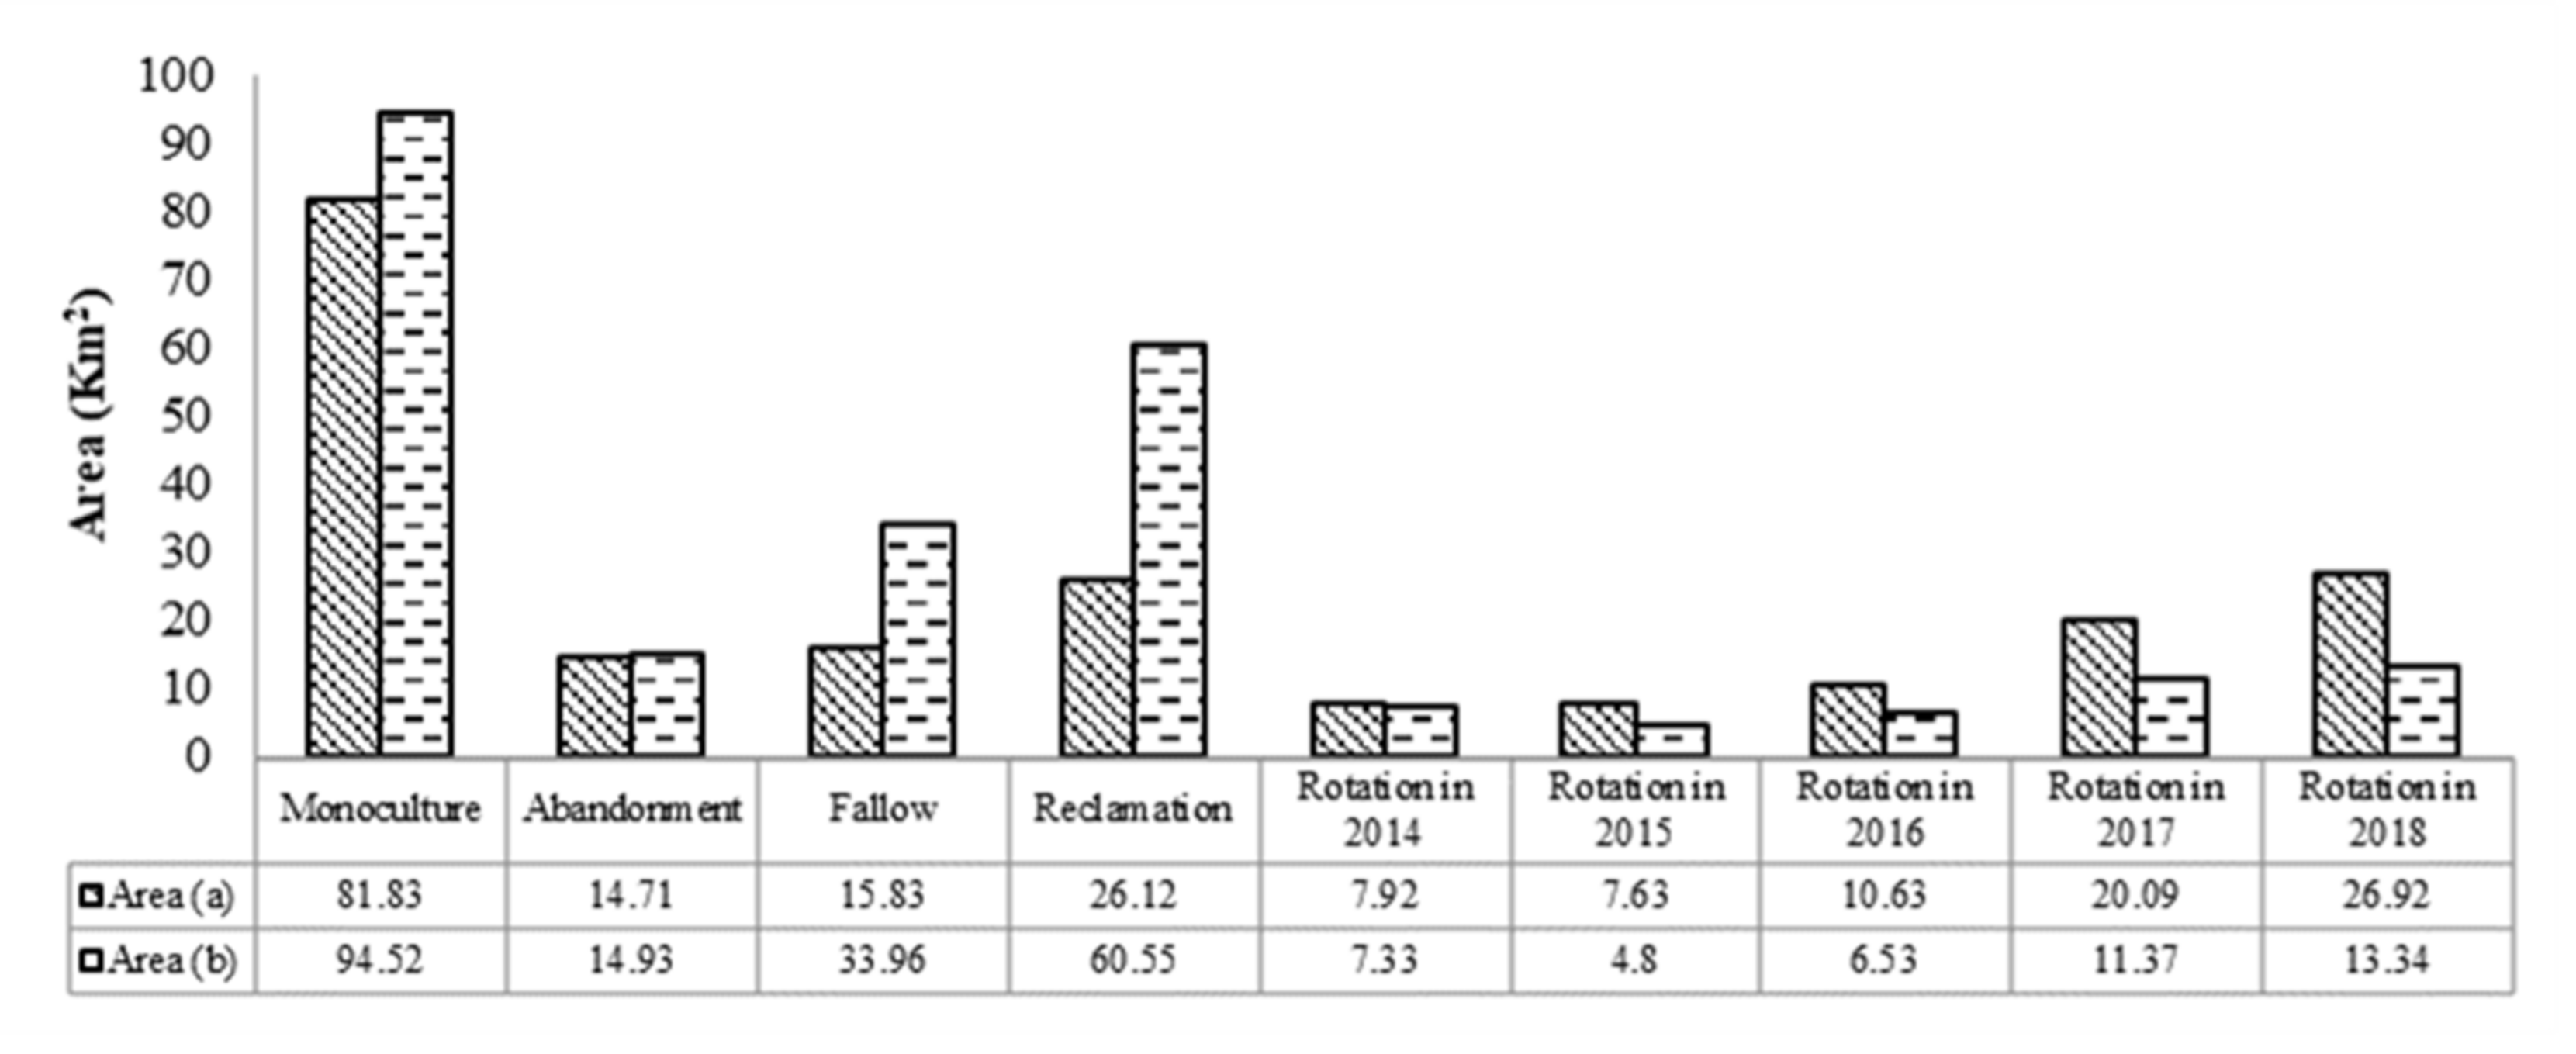
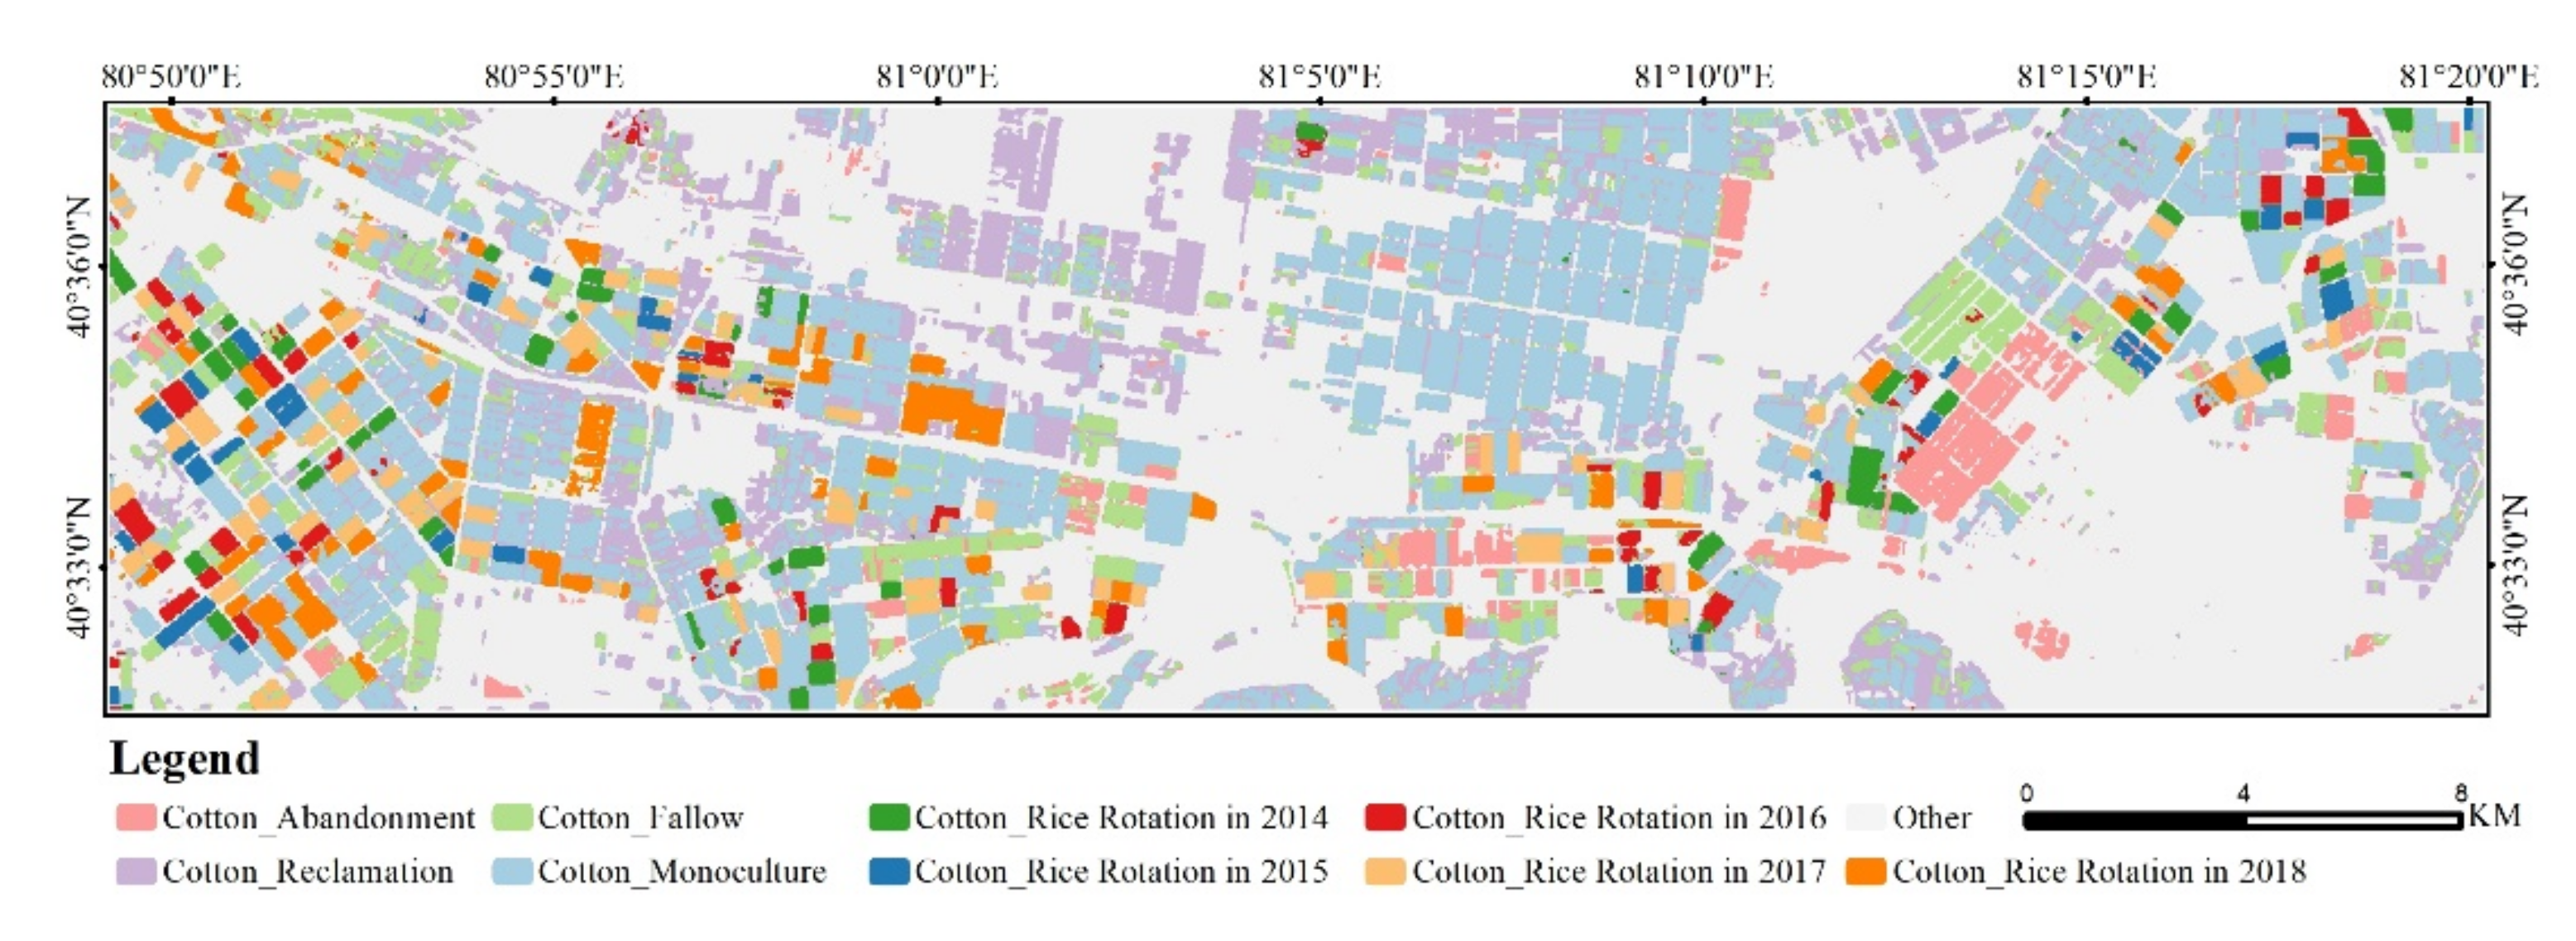
3.3. GIS-Driven Multi-Year Cotton Cropping Pattern Extraction

Meanwhile, we used the GIS overlay analysis method proposed by Martínez-Casasnovas et al. (2005) [11] to derive the spatial and temporal dynamics of cotton cultivation based on intra-annual cotton classification maps. Next, we combined the temporal trajectories of multi-year cotton cropping patterns into ten categories (Figure 10) using the same rules proposed in the Table 1. The GIS-driven spatial distribution of ten multi-year cotton cropping categories was similar to the result using the pixel-based random forest classification (Figure 8). Differently, the GIS-derived reclamation category area was larger (60.55 km2) than that using the RF classification method (Figure 9). Similarly, compared to the RF classification method, the GIS-derived follow type and monoculture type were larger, respectively. The area of GIS-driven cotton rotation types in different years increased during the period from 2014 to 2018, while the annual increase speed was lower than that using the RF classification method.
Moreover, we evaluated the accuracy of the GIS-driven multi-year cotton cropping pattern and the result showed that the OA and Kappa coefficient were 87.8% and 0.86 (Table 5), respectively. It was noticeable that the PA of the monoculture type was only 49.69%. The UA of the rotation in 2014 type and the fallow type were relatively low, with 83.15% and 85.94%, respectively.

4. Discussion

4.1. Accuracy of Cotton Cropping Pattern Identification

We found that the overall accuracy of multi-year cotton cropping pattern classification based on pixel-based RF classification (96.93%) was relatively higher than the classification based on the GIS-driven method (87.8%). The comparisons demonstrate that annual crop classification errors can accumulate to affect the accuracy of temporal trajectories of multi-year cotton cropping patterns based on GIS spatial overlay analysis method. Conversely, based on the labeled multi-year cotton cropping samples, we accurately obtained classification results using the random forest classification method and minimized the accumulation of errors from annual classifications. This accumulation of classification errors in a single year had been reported in the identification of forest change patterns [42], arable land change patterns [43], and vegetation restoration in arid zones [44]. Moreover, the multi-year cotton cropping pattern classification using these two approaches at the Aksu Station showed that our proposed approach accurately identified the following in 2015 type, which was same with the true cotton-rice rotation practice, while the GIS-driven method was incorrect (Figure 11). The above-mentioned evidence demonstrated that compared with the method proposed by Martínez-Casasnovas et al. (2005) [11], the proposed approach in this study could accurately obtain the multi-year cotton cropping patterns.
Although the random forest algorithm needed many samples to fill the demand of constructing trees [30], we expanded the sample sizes through the active learning method based on small ground truth sample sizes. Under the premise of ensuring the sample size, RF had an excellent performance in intra-annual crop classification with the high accuracy (Table 3), which was consistent with the report of Li et al. (2014) [30]. Furthermore, we found that RF classification could accurately identify the multi-year cotton cropping patterns (Table 4).
The user accuracy and producer accuracy of multi-year cotton-cropping patterns based on Landsat and Sentinel time series greater than 90% indicated that the proposed simple and generic strategy could effectively identify multi-year cotton-cropping patterns. Compared with Schneibel et al. (2017) [45], who used the LandTrendr approach, which was a time series segmentation algorithm belonging to spectral-temporal change analysis approaches, to track multi-year cultivation abandonment and reclamation, our proposed approach not only identified more categories of multi-year crop cropping patterns, but also enabled to reduce the requirement for programming ability in image interpreters, agronomists, and agricultural sectors.

4.2. Advantage and Versatility of the Proposed Simple and Generic Approach

The significance and starting point of this research was to propose a simple and generic strategy to identify multi-year cotton cropping patterns using Landsat and Sentinel-2 time series for the precise management of farmland. The accuracies confirmed that the recognized high-performance RF algorithm associated with the active learning-based training samples could obtain an accurate cotton-cropping pattern from 2014 to 2018, which could be utilized for other crops and regions.
In this study, we increased the training sample size by selecting unlabeled samples from time series satellite-observed EVI curves that were similar to the temporal EVI patterns corresponding to various multi-year cotton-cropping patterns. This active learning method based on a small number of field survey samples could effectively resolve the difficult-to-obtain dilemmas of selecting training samples from the field survey across consecutive years. Thus, the proposed simple and generic approach in this study was convenient for use in other regions to identify different cropping patterns based on time series remote sensing images, since the limitation of training samples from continuous observations over many years had been effectively resolved. More beneficially, increasingly many satellites provided freely available Earth observation data with fine spatial, temporal, and spectral resolutions; furthermore, they promoted remote sensing in the era of big data. Specifically, the available Landsat series (including Landsat-8 and new launched Landsat-9) and European Space Agency’s Sentinel series remote sensing images provided both high temporal and spatial resolution advantages for dense Earth observations. The wall-to-wall remote sensing images resolved the data quality problems caused by cloud cover noise in globally tropical and subtropical regions and constructed growth curves based on the monthly ten-day interval EVI and other vegetation index products. Thus, the proposed approach in this study can expand application prospects to extend to the global scale.

4.3. Implications for Precise Farmland Management

The proposed approach effectively and precisely extracted multi-year cotton-cropping pattern based on freely available Landsat and Sentinel-2 time series and a small size of ground truth samples. The approach was relatively robust with a high accuracy, and had less requirement for programming ability, making it possible to be easily applied in other regions. The innovation of our proposed approach aimed at the applications of multi-year cotton cropping pattern recognition based on time series remote sensing images in the agronomic practices and precise management of cotton cultivation modes across many years. The accurate multi-year cotton cropping pattern recognition using our approach could track inter-annual cotton cropping driven by annual agronomic management in real-time, which could meet requirements of precisely agronomic management from different customers.
Governments, farmers, and investors all need a wide range of real and reliable information about cotton cropping patterns across many years [46]. From the perspective of governments, increases in cotton-rice rotation areas in Alar City from 2014 to 2018 illustrated that the protection of farmland and the improvement of soil quality policies proposed by the local government [47] have been strictly enforced since the cotton-rice rotation model could reduce the negative effects of pests and diseases [48]. Meanwhile, the distribution of cotton-rice rotation provided precise spatial location information for agronomic sectors to further cotton-fields rotation. Furthermore, increases in cotton-rice rotation area proved that the Chinese government was actively responding to the SDGs put forward by the United Nations [3].
However, the continuous cotton cropping sequence in the study area was more than four consecutive years, which was different from other worldwide cotton planting regions. The United States [49] and Pakistan [50] both adopted the short-term cotton sequential planting model of one year or two consecutive years. Moreover, our results showed that almost half of the cotton-cropping fields in the study area had five consecutive years of continuous cropping practice. According to the result of pixel-based multi-year cotton cultivation classification (Figure 10), the monoculture class had 81.83 km2, while the rotation class only had 73.19 km2 over the five consecutive years. Uzbekistan’s official recommendations [51] requested the cotton cultivation sequence for 1–3 years. Therefore, our contributions could provide new clues to the cotton cultivation modes regulated by the government, which may have helped with decision-making on sustainable agricultural development.
The purpose of the proposed simple and generic approach was to effectively and precisely manage multi-year cotton-cropping modes. Thus, based on the proposed simple and generic approach and the generated results, we provided customized services for three different levels of user needs. From the perspective of agricultural sectors, accurately making agricultural policies, such as the governance of farmland abandonment, was the primary concern. Correspondingly, the cotton-abandonment pattern was accurately identified using the proposed approach, which could provide accurate geographic locations and areas (Figure 6b). Additionally, the continuous cotton cropping mode was harmful to cotton growth and yield formation, due to the increasing probability of pests and diseases [47]. The obtained rotation patterns of cotton and rice in this study confirmed that increasing the area provided spatial distribution for agricultural sectors. Moreover, the geographic locations of the continuous cotton-cropping mode could attract the focus of agricultural sectors. Our results could provide scientific evidence for policy and decision-making against market disturbance in regard to farmer options for crop cultivation over many years.
From the perspective of agricultural investment enterprises, multi-year cotton-cropping patterns and the cultivation conditions of farmlands could provide precise basic data observed over consecutive years, which could assist them in evaluating the potential future cotton yield and possible cultivation scale. From the perspective of farmers, our results could provide them with specific multi-year cotton-cropping patterns to each farmland and assist farmers in selecting the corresponding farming modes, such as fallow and rotation. Our results could provide services to promote increases in cotton yield and optimize the farmland productivity.

5. Conclusions

This study proposed a simple and generic approach to extract intra-annual cotton-mapping and multi-year cotton-farming patterns, based on limited ground truth samples and Landsat and Sentinel-2 time series. The results showed that the cotton and orchard planted areas were stable, while the cotton-rice rotation frequently changed during 2014–2018. The cotton-rice rotation area exhibited an increasing trend during 2014–2018, while continuous cropping of cotton for more than five consecutive years remained at a high percentage. Moreover, cotton reclamation expanded toward the north. The results indicated that our proposed approach could accurately extract multi-year crop-planting patterns. This research contributed to providing different levels of customized services regarding multi-year cotton cropping for agricultural sectors, companies, and farmers. Our proposed approach could be promoted to other regions due to the robust algorithm and freely available remote sensing images.

Author Contributions

Q.L.: Data curation, Methodology, Formal analysis, Validation, Writing—original draft; G.L.: Conceptualization, Funding acquisition, Methodology, Supervision, Writing—original draft, Writing—review & editing; W.C.: Formal analysis, Writing—original draft. All authors have read and agreed to the published version of the manuscript.

Funding

This work was supported by National Natural Science Foundation of China (NSFC) (Grant number. 41901349), Science and Technology Program of Guangdong Province, China (Grant number. 2021B1111610001), the Startup Foundation for Talented Scholars in South China Normal University (Grant number. 8S0472), and Foundation for Young Innovation Talents in Higher Education of Guangdong, China (Natural Science) (Grant number. 2018KQNCX054).

Institutional Review Board Statement

Not applicable.

Informed Consent Statement

Not applicable.

Data Availability Statement

The remote sensing data was obtained from USGS and ESA. The ground truth samples are available with the permission of the corresponding author.

Acknowledgments

We are grateful to USGS and ESA for providing Landsat and Sentinel remote sensing images. We are grateful to three anonymous reviewers for the constructive comments and suggestions. We are also grateful for Associate Wenfei Luo at South China Normal University providing us some suggestions on this study.

Conflicts of Interest

The authors declared no potential conflicts of interest with respect to the research, authorship, and/or publication of this article.

References

  1. United Nations. World Population Prospects: The 2017 Revision, Key Findings and Advance Tables; Working Paper No. ESA/P/WP/248; United Nations: New York, NY, USA, 2017. [Google Scholar]
  2. Karthikeyan, L.; Chawla, I.; Mishra, A.K. A review of remote sensing applications in agriculture for food security: Crop growth and yield, irrigation, and crop losses. J. Hydrol. 2020, 586, 124905. [Google Scholar] [CrossRef]
  3. United Nations. Transforming Our World, the 2030 Agenda for Sustainable Development; United Nations: New York, NY, USA, 2015; Available online: https://stg-wedocs.unep.org/bitstream/handle/20.500.11822/11125/unepswiosm1inf7sdg.pdf?sequence=1 (accessed on 11 November 2021).
  4. Bargiel, D. A new method for crop classification combining time series of radar images and crop phenology information. Remote Sens. Environ. 2017, 198, 369–383. [Google Scholar] [CrossRef]
  5. Elhassan, T.; Aljurf, M.; Al-Mohanna, F.; Shoukri, M. Classification of imbalance data using tomek link (t-link) combined with random under-sampling (RUS) as a data reduction method. Glob. J. Technol. Optim. 2017, S1, 111. [Google Scholar] [CrossRef]
  6. Matton, N.; Canto, G.S.; Waldner, F.; Valero, S.; Morin, D.; Inglada, J.; Arias, M.; Bontemps, S.; Koetz, B.; Defourny, P. An automated method for annual cropland mapping along the season for various globally-distributed agrosystems using high spatial and temporal resolution time series. Remote Sens. 2015, 7, 13208–13232. [Google Scholar] [CrossRef] [Green Version]
  7. Chen, Y.; Lu, D.; Moran, E.; Batistella, M.; Dutra, L.V.; Sanches, I.D.A.; da Silva, R.F.B.; Huang, J.; Luiz, A.J.B.; de Oliveira, M.A.F. Mapping croplands, cropping patterns, and crop types using MODIS time-series data. Int. J. Appl. Earth Obs. Geoinf. 2018, 69, 133–147. [Google Scholar] [CrossRef]
  8. Coppin, P.; Jonckheere, I.; Nackaerts, K.; Muys, B.; Lambin, E. Digital change detection methods in ecosystem monitoring: A review. Int. J. Remote Sens. 2004, 25, 1565–1596. [Google Scholar] [CrossRef]
  9. Hussain, M.; Chen, D.; Cheng, A.; Wei, H.; Stanley, D. Change detection from remotely sensed images: From pixel-based to object-based approaches. ISPRS J. Photogramm. Remote Sens. 2013, 80, 91–106. [Google Scholar] [CrossRef]
  10. Stern, A.; Doraiswamy, P.C.; Hunt, E.R., Jr. Changes of crop rotation in Iowa determined from the United States Department of Agriculture, National Agricultural Statistics Service cropland data layer product. J. Appl. Remote Sens. 2012, 6, 63590. [Google Scholar] [CrossRef]
  11. Martínez-Casasnovas, J.A.; Martín-Montero, A.; Casterad, M.A. Mapping multi-year cropping patterns in small irrigation districts from time-series analysis of Landsat TM images. Eur. J. Agron. 2005, 23, 159–169. [Google Scholar] [CrossRef]
  12. Sianturi, R.; Jetten, V.G.; Sartohadi, J. Mapping cropping patterns in irrigated rice fields in West Java: Towards mapping vulnerability to flooding using time-series MODIS imageries. Int. J. Appl. Earth Obs. Geoinf. 2018, 66, 1–13. [Google Scholar] [CrossRef]
  13. Mariotto, I.; Thenkabail, P.S.; Huete, A.; Slonecker, E.T.; Platonov, A. Hyperspectral versus multispectral crop-productivity modeling and type discrimination for the HyspIRI mission. Remote Sens. Environ. 2013, 139, 291–305. [Google Scholar] [CrossRef]
  14. Zheng, B.; Myint, S.W.; Thenkabail, P.S.; Aggarwal, R.M. A support vector machine to identify irrigated crop types using time-series Landsat NDVI data. Int. J. Appl. Earth Obs. Geoinf. 2015, 34, 103–112. [Google Scholar] [CrossRef]
  15. Bégué, A.; Arvor, D.; Bellon, B.; Betbeder, J.; De Abelleyra, D.; PD Ferraz, R.; Lebourgeois, V.; Lelong, C.; Simões, M.; Verón, S.R. Remote sensing and cropping practices: A review. Remote Sens. 2018, 10, 99. [Google Scholar] [CrossRef] [Green Version]
  16. Muhammad, S.; Zhan, Y.; Wang, L.; Hao, P.; Niu, Z. Major crops classification using time series MODIS EVI with adjacent years of ground reference data in the US State of Kansas. Optik 2016, 127, 1071–1077. [Google Scholar] [CrossRef]
  17. Zhong, L.; Hu, L.; Zhou, H. Deep learning based multi-temporal crop classification. Remote Sens. Environ. 2019, 221, 430–443. [Google Scholar] [CrossRef]
  18. Kobayashi, N.; Tani, H.; Wang, X.; Sonobe, R. Crop classification using spectral indices derived from Sentinel-2A imagery. J. Inf. Telecommun. 2020, 4, 67–90. [Google Scholar] [CrossRef]
  19. Zhang, X.; Sun, Y.; Shang, K.; Zhang, L.; Wang, S. Crop classification based on feature band set construction and object-oriented approach using hyperspectral images. IEEE J. Sel. Top. Appl. Earth Obs. Remote Sens. 2016, 9, 4117–4128. [Google Scholar] [CrossRef]
  20. Gómez, C.; White, J.C.; Wulder, M.A. Optical remotely sensed time series data for land cover classification: A review. ISPRS J. Photogramm. Remote Sens. 2016, 116, 55–72. [Google Scholar] [CrossRef] [Green Version]
  21. Long, J.A.; Lawrence, R.L.; Greenwood, M.C.; Marshall, L.; Miller, P.R. Object-oriented crop classification using multitemporal ETM+ SLC-off imagery and random forest. GIScience Remote Sens. 2013, 50, 418–436. [Google Scholar] [CrossRef]
  22. Li, Z.; Gang, Z.; Zhang, T. Interleaved group convolutions for multitemporal multisensor crop classification. Infrared Phys. Technol. 2019, 102, 103023. [Google Scholar] [CrossRef]
  23. Belgiu, M.; Csillik, O. Sentinel-2 cropland mapping using pixel-based and object-based time-weighted dynamic time warping analysis. Remote Sens. Environ. 2018, 204, 509–523. [Google Scholar] [CrossRef]
  24. Tong, X.; Brandt, M.; Hiernaux, P.; Herrmann, S.M.; Tian, F.; Prishchepov, A.V.; Fensholt, R. Revisiting the coupling between NDVI trends and cropland changes in the Sahel drylands: A case study in western Niger. Remote Sens. Environ. 2017, 191, 286–296. [Google Scholar] [CrossRef] [Green Version]
  25. Zhang, M.; Zhou, Q.; Chen, Z.; Liu, J.; Zhou, Y.; Cai, C. Crop discrimination in Northern China with double cropping systems using Fourier analysis of time-series MODIS data. Int. J. Appl. Earth Obs. Geoinf. 2008, 10, 476–485. [Google Scholar] [CrossRef]
  26. Qiu, B.; Zhong, M.; Tang, Z.; Wang, C. A new methodology to map double-cropping croplands based on continuous wavelet transform. Int. J. Appl. Earth Obs. Geoinf. 2014, 26, 97–104. [Google Scholar] [CrossRef]
  27. Liu, Z.; Gao, J.; Gao, F.; Dong, S.; Liu, P.; Zhao, B.; Zhang, J. Integrated agronomic practices management improve yield and nitrogen balance in double cropping of winter wheat-summer maize. Field Crop. Res. 2018, 221, 196–206. [Google Scholar] [CrossRef]
  28. Petitjean, F.; Inglada, J.; Gançarski, P. Satellite image time series analysis under time warping. IEEE Trans. Geosci. Remote Sens. 2012, 50, 3081–3095. [Google Scholar] [CrossRef]
  29. Tuia, D.; Volpi, M.; Copa, L.; Kanevski, M.; Munoz-Mari, J. A survey of active learning algorithms for supervised remote sensing image classification. IEEE J. Sel. Top. Signal Process. 2011, 5, 606–617. [Google Scholar] [CrossRef]
  30. Li, C.; Wang, J.; Wang, L.; Hu, L.; Gong, P. Comparison of classification algorithms and training sample sizes in urban land classification with Landsat thematic mapper imagery. Remote Sens. 2014, 6, 964–983. [Google Scholar] [CrossRef] [Green Version]
  31. Gong, L.; He, G.; Liu, W. Long-term cropping effects on agricultural sustainability in Alar oasis of Xinjiang, China. Sustainability 2016, 8, 61. [Google Scholar] [CrossRef] [Green Version]
  32. Fan, Y.; Chen, Y.; Liu, Y.; Li, W. Variation of baseflows in the headstreams of the Tarim River Basin during 1960–2007. J. Hydrol. 2013, 487, 98–108. [Google Scholar] [CrossRef]
  33. Zhao, R.; Chen, Y.; Shi, P.; Zhang, L.; Pan, J.; Zhao, H. Land use and land cover change and driving mechanism in the arid inland river basin: A case study of Tarim River, Xinjiang, China. Environ. Earth Sci. 2013, 68, 591–604. [Google Scholar] [CrossRef]
  34. Nhu, V.-H.; Mohammadi, A.; Shahabi, H.; Shirzadi, A.; Al-Ansari, N.; Ahmad, B.B.; Chen, W.; Khodadadi, M.; Ahmadi, M.; Khosravi, K.; et al. Monitoring and Assessment of Water Level Fluctuations of the Lake Urmia and Its Environmental Consequences Using Multitemporal Landsat 7 ETM+ Images. Int. J. Environ. Res. Public Health 2020, 17, 4210. [Google Scholar] [CrossRef]
  35. Liu, H.Q.; Huete, A. A feedback based modification of the NDVI to minimize canopy background and atmospheric noise. IEEE Trans. Geosci. Remote Sens. 1995, 33, 457–465. [Google Scholar] [CrossRef]
  36. Savitzky, A.; Golay, M.J. Smoothing and differentiation of data by simplified least squares procedures. Anal. Chem. 1964, 36, 1627–1639. [Google Scholar] [CrossRef]
  37. Breiman, L. Random forests. Mach. Learn. 2001, 45, 5–32. [Google Scholar] [CrossRef] [Green Version]
  38. Karasiak, N.; Perbet, P. Remote sensing of distinctive vegetation in Guiana amazonian park. QGIS Appl. Agric. For. 2018, 2, 215–245. [Google Scholar]
  39. Debats, S.R.; Luo, D.; Estes, L.D.; Fuchs, T.J.; Caylor, K.K. A generalized computer vision approach to mapping crop fields in heterogeneous agricultural landscapes. Remote Sens. Environ. 2016, 179, 210–221. [Google Scholar] [CrossRef] [Green Version]
  40. Ghimire, B.; Rogan, J.; Miller, J. Contextual land-cover classification: Incorporating spatial dependence in land-cover classification models using random forests and the Getis statistic. Remote Sens. Lett. 2010, 1, 45–54. [Google Scholar] [CrossRef] [Green Version]
  41. Lawrence, R.L.; Wood, S.D.; Sheley, R.L. Mapping invasive plants using hyperspectral imagery and Breiman Cutler classifications (RandomForest). Remote Sens. Environ. 2006, 100, 356–362. [Google Scholar] [CrossRef]
  42. Xian, Y.; Lu, Y.; Musyimi, Z.; Liu, G. Tracking the Role of Policies and Economic Factors in Driving the Forest Change Trajectories within the Guangdong-Hongkong-Macao Region of China: A Remote Sensing Perspective. Land 2021, 10, 87. [Google Scholar] [CrossRef]
  43. Liu, G.; Zhang, L.; You, H. Spatiotemporal dynamics of arable land in the Nanjing metropolitan region, China. Environ. Earth Sci. 2015, 73, 7183–7191. [Google Scholar] [CrossRef]
  44. Liu, G.; Kurban, A.; Halik, U.; Duan, H.; Gartner, P.; Kleinschmit, B.; Ablekim, A.; Niu, T. Analysis of vegetation landscape pattern dynamics based on trajectory change detection: A case study of ecological water transportation in the lower reaches of Tarim River. J. Desert Res. 2012, 32, 1472–1478. [Google Scholar]
  45. Schneibel, A.; Stellmes, M.; Röder, A.; Frantz, D.; Kowalski, B.; Haß, E.; Hill, J. Assessment of spatio-temporal changes of smallholder cultivation patterns in the Angolan Miombo belt using segmentation of Landsat time series. Remote Sens. Environ. 2017, 195, 118–129. [Google Scholar] [CrossRef] [Green Version]
  46. Conrad, C.; Lamers, J.P.A.; Ibragimov, N.; Löw, F.; Martius, C. Analysing irrigated crop rotation patterns in arid Uzbekistan by the means of remote sensing: A case study on post-Soviet agricultural land use. J. Arid. Environ. 2016, 124, 150–159. [Google Scholar] [CrossRef]
  47. Ju, X.; Liu, X.; Zhang, F.; Roelcke, M. Nitrogen fertilization, soil nitrate accumulation, and policy recommendations in several agricultural regions of China. AMBIO A J. Hum. Environ. 2004, 33, 300–305. [Google Scholar] [CrossRef]
  48. Dias, T.; Dukes, A.; Antunes, P.M. Accounting for soil biotic effects on soil health and crop productivity in the design of crop rotations. J. Sci. Food Agric. 2015, 95, 447–454. [Google Scholar] [CrossRef]
  49. Wright, D.L.; Marois, J.J.; Wiatrak, P.J.; Katsvairo, T.W. Sodbased rotations for cotton/peanut in the southeast US. In Proceedings of the 2005 Beltwide Cotton Conferences, New Orleans, LA, USA, 4–7 January 2005. [Google Scholar]
  50. Kahlown, M.A.; Raza, Z.I.; Hanif, M. Crop Rotations to Reclaim Abandoned Soils. Pak. J. Water Resour. 2003, 7, 65. [Google Scholar]
  51. Kienzler, K.M. Improving the nitrogen use efficiency and crop quality in the Khorezm region, Uzbekistan. Ph.D. Thesis, Rheinische Friedrich-Wilhelms-Universität Bonn, Bonn, Germany, 2010. [Google Scholar]
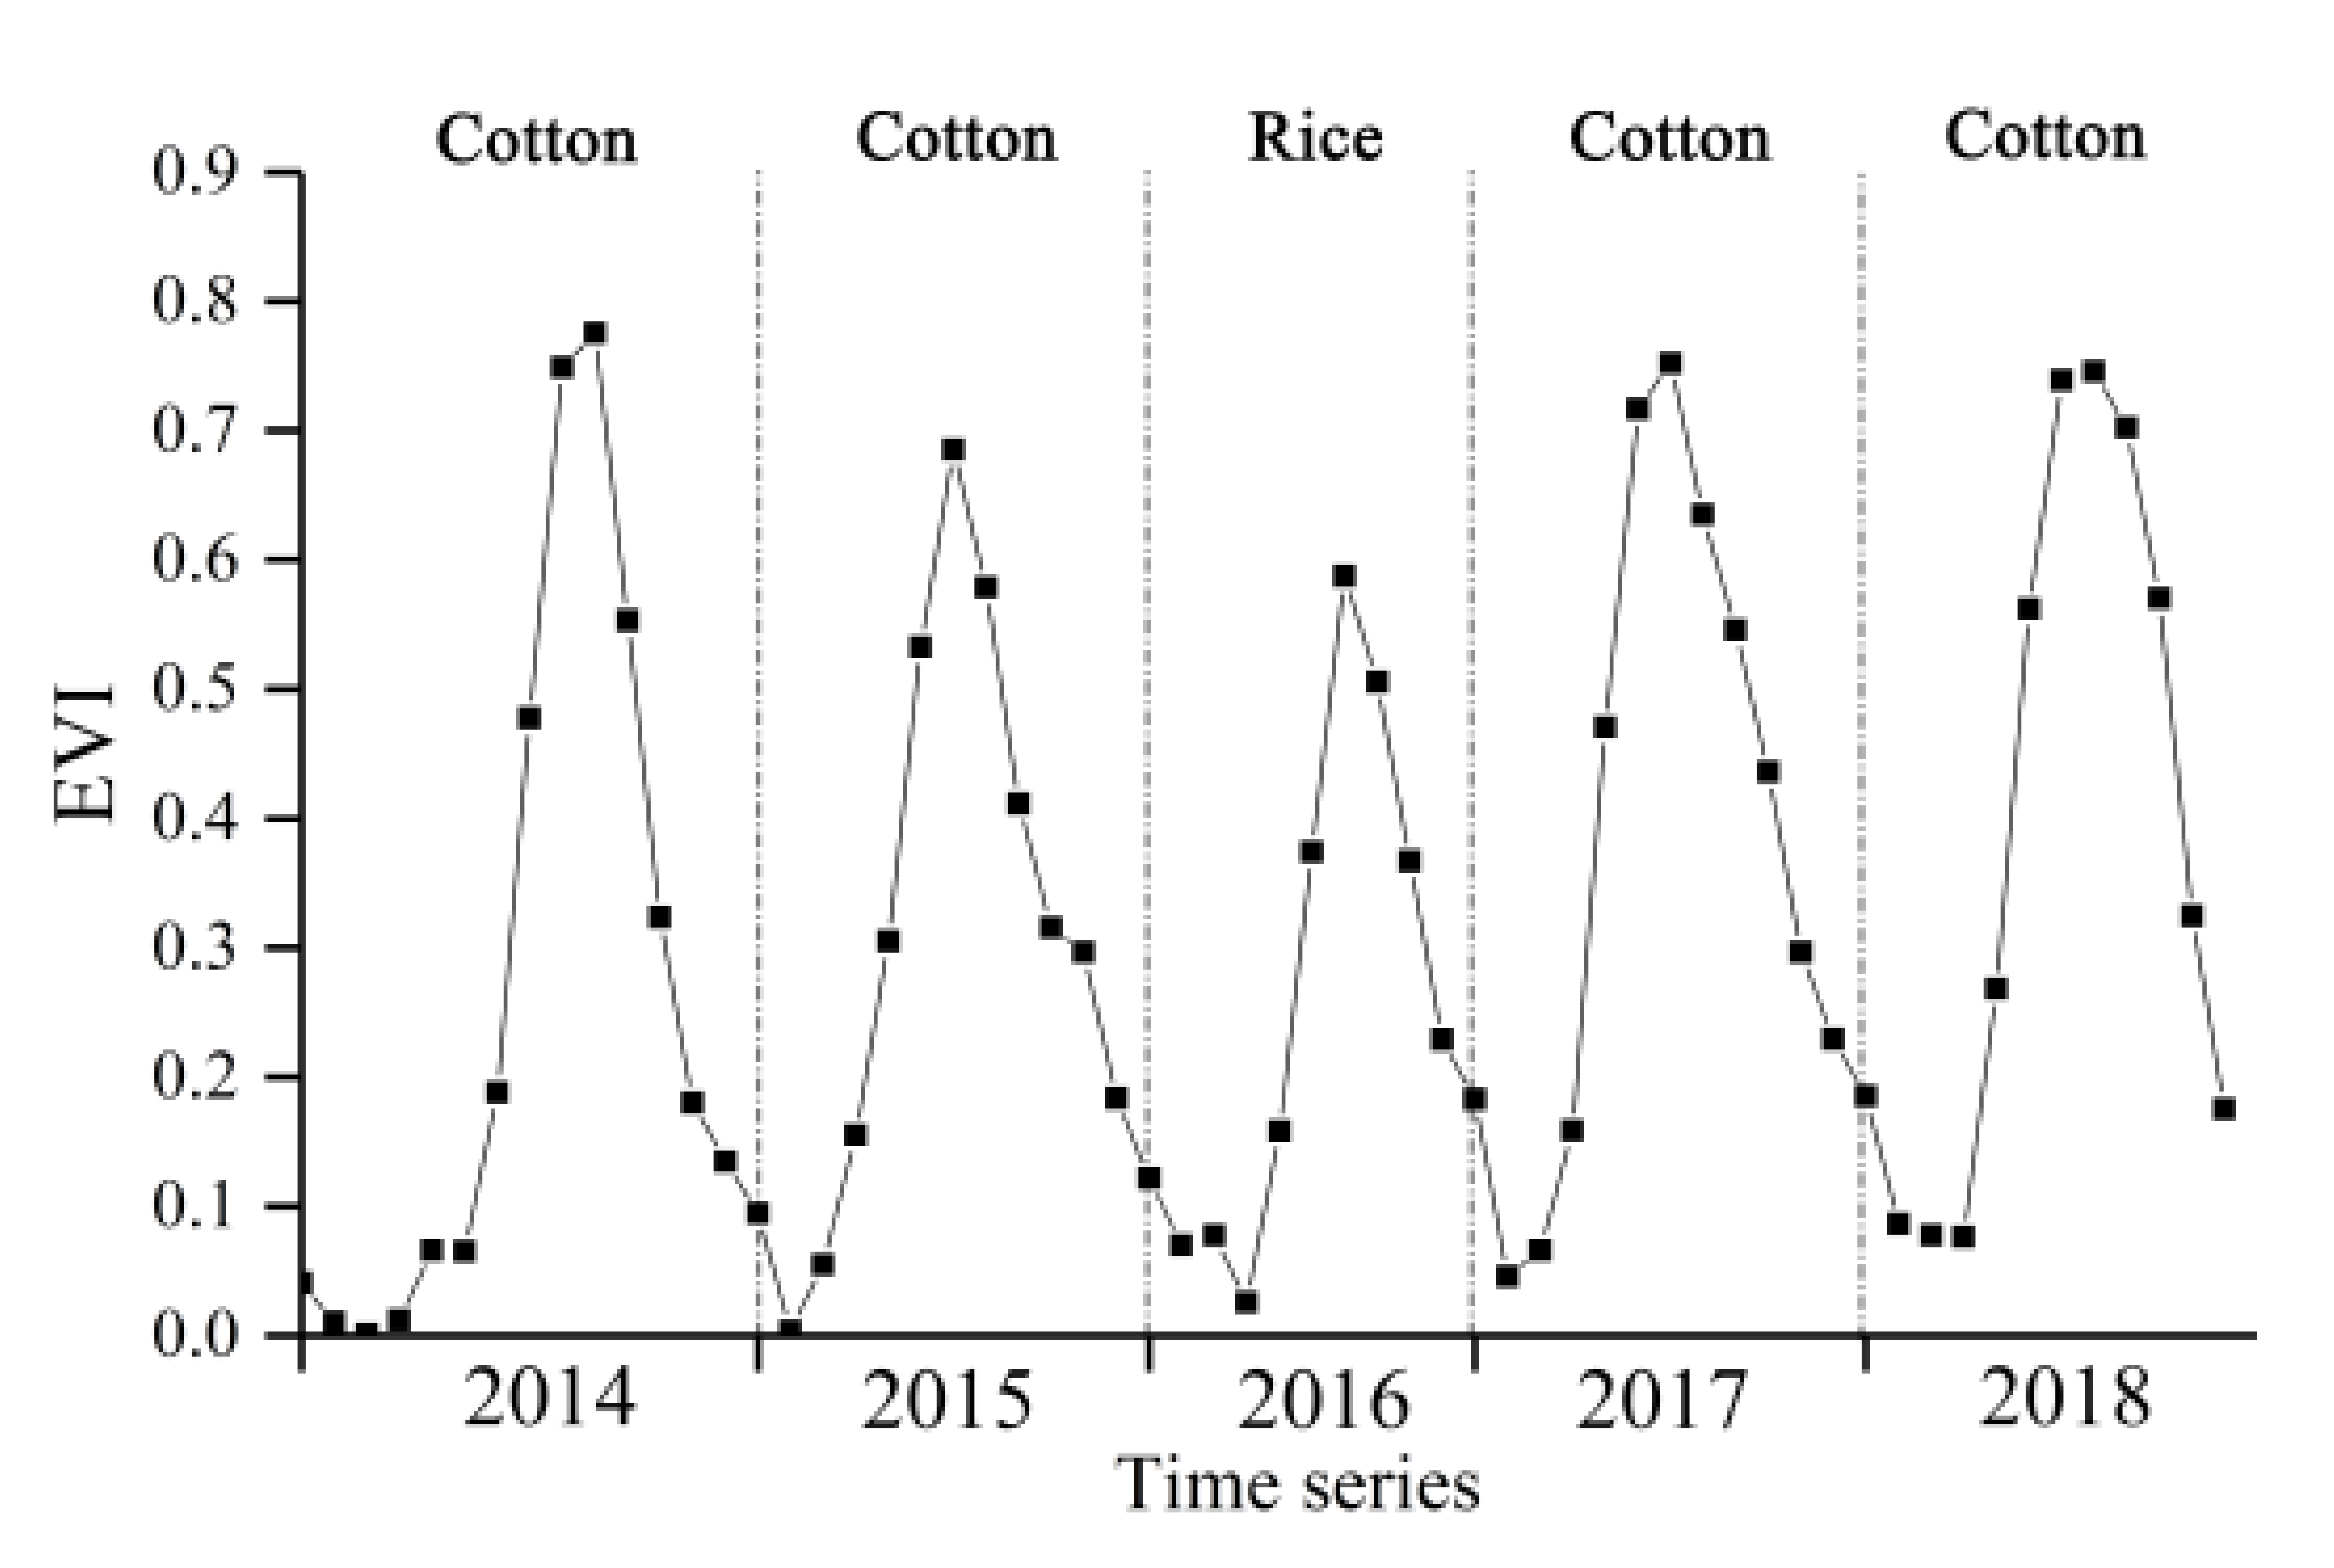
Figure 1. Location of the study area in China.
Remotesensing 13 05183 g001
Figure 2. Available Landsat and Sentinel-2 time series that covered the study area from 2014 to 2018.
Remotesensing 13 05183 g002
Figure 3. Number of samples for each annual year, in which 30% are training samples and 70% are verification samples.
Remotesensing 13 05183 g003
Figure 4. Flow chart of this study.
Remotesensing 13 05183 g004
Figure 5. Temporal EVI of different land cover types in 2014.
Remotesensing 13 05183 g005
Figure 6. (a) Five-year temporal EVI of cotton-rice rotation. (b) Five-year temporal EVI of cotton succession (rotation, reclamation, fallow, and abandonment).
Remotesensing 13 05183 g006
Figure 7. Annual cotton classification maps over the 5-year period from 2014 to 2018.
Remotesensing 13 05183 g007aRemotesensing 13 05183 g007b
Figure 8. Multi-year cotton-cropping pattern between 2014 and 2018.
Remotesensing 13 05183 g008
Figure 9. Area of multi-year cotton-cropping patterns from 2014 to 2018; (a) pixel-based multi-year cotton cropping pattern, (b) GIS-driven multi-year cotton cropping pattern.
Remotesensing 13 05183 g009
Figure 10. GIS-driven multi-year cotton-planting pattern from 2014 to 2018.
Remotesensing 13 05183 g010
Figure 11. Cotton cultivation patterns at the Aksu Station; all remote sensing images are in July of each year; (a) multi-year cotton cropping pattern using RF method, (b) GIS-driven multi-year cotton cropping pattern.
Remotesensing 13 05183 g011
Table 1. Rules of multi-year cotton-farming pattern identification.
Multi-Year Cotton-Farming PatternsDefinition of RulesTemporal Phenological Patterns
MonocultureCotton was planted over five consecutive years in a particular field. This process was referred to as continuous cotton cropping. Remotesensing 13 05183 i001
AbandonmentFarmers stop growing cotton and other crops for more than two consecutive years.
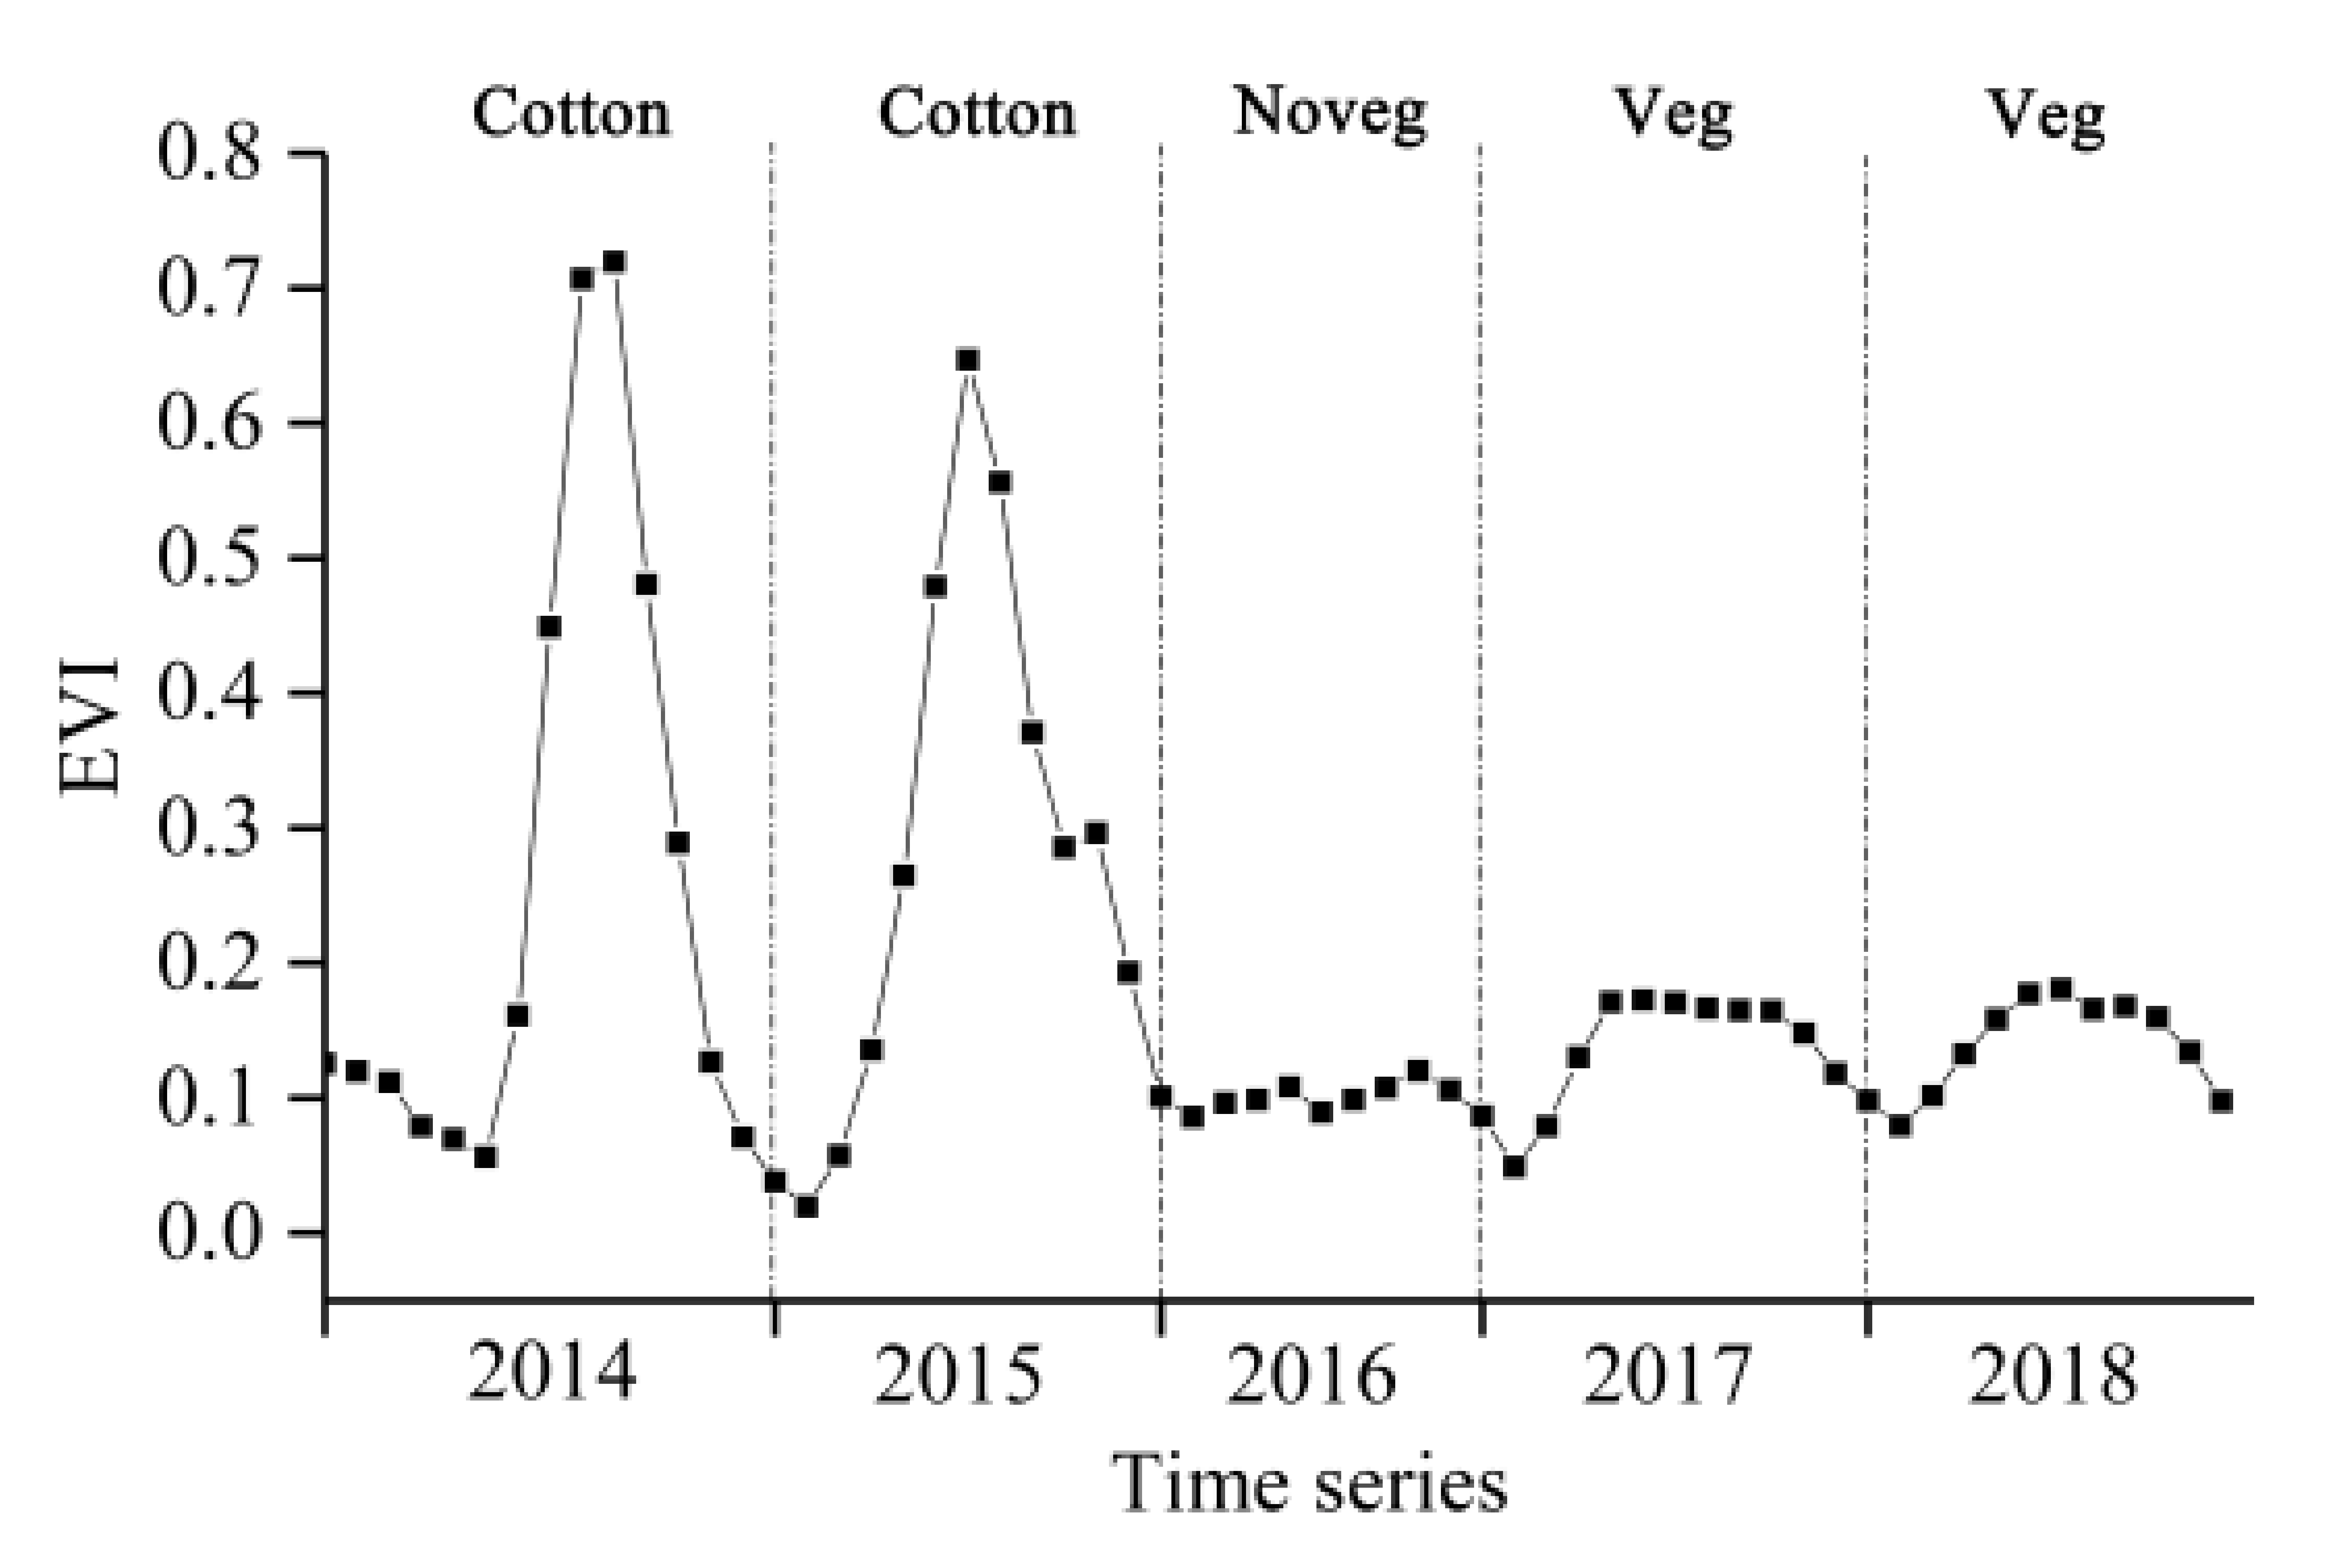
 Remotesensing 13 05183 i002
FallowCotton-farmed area rotation with bare land in a given year for no more than one year.
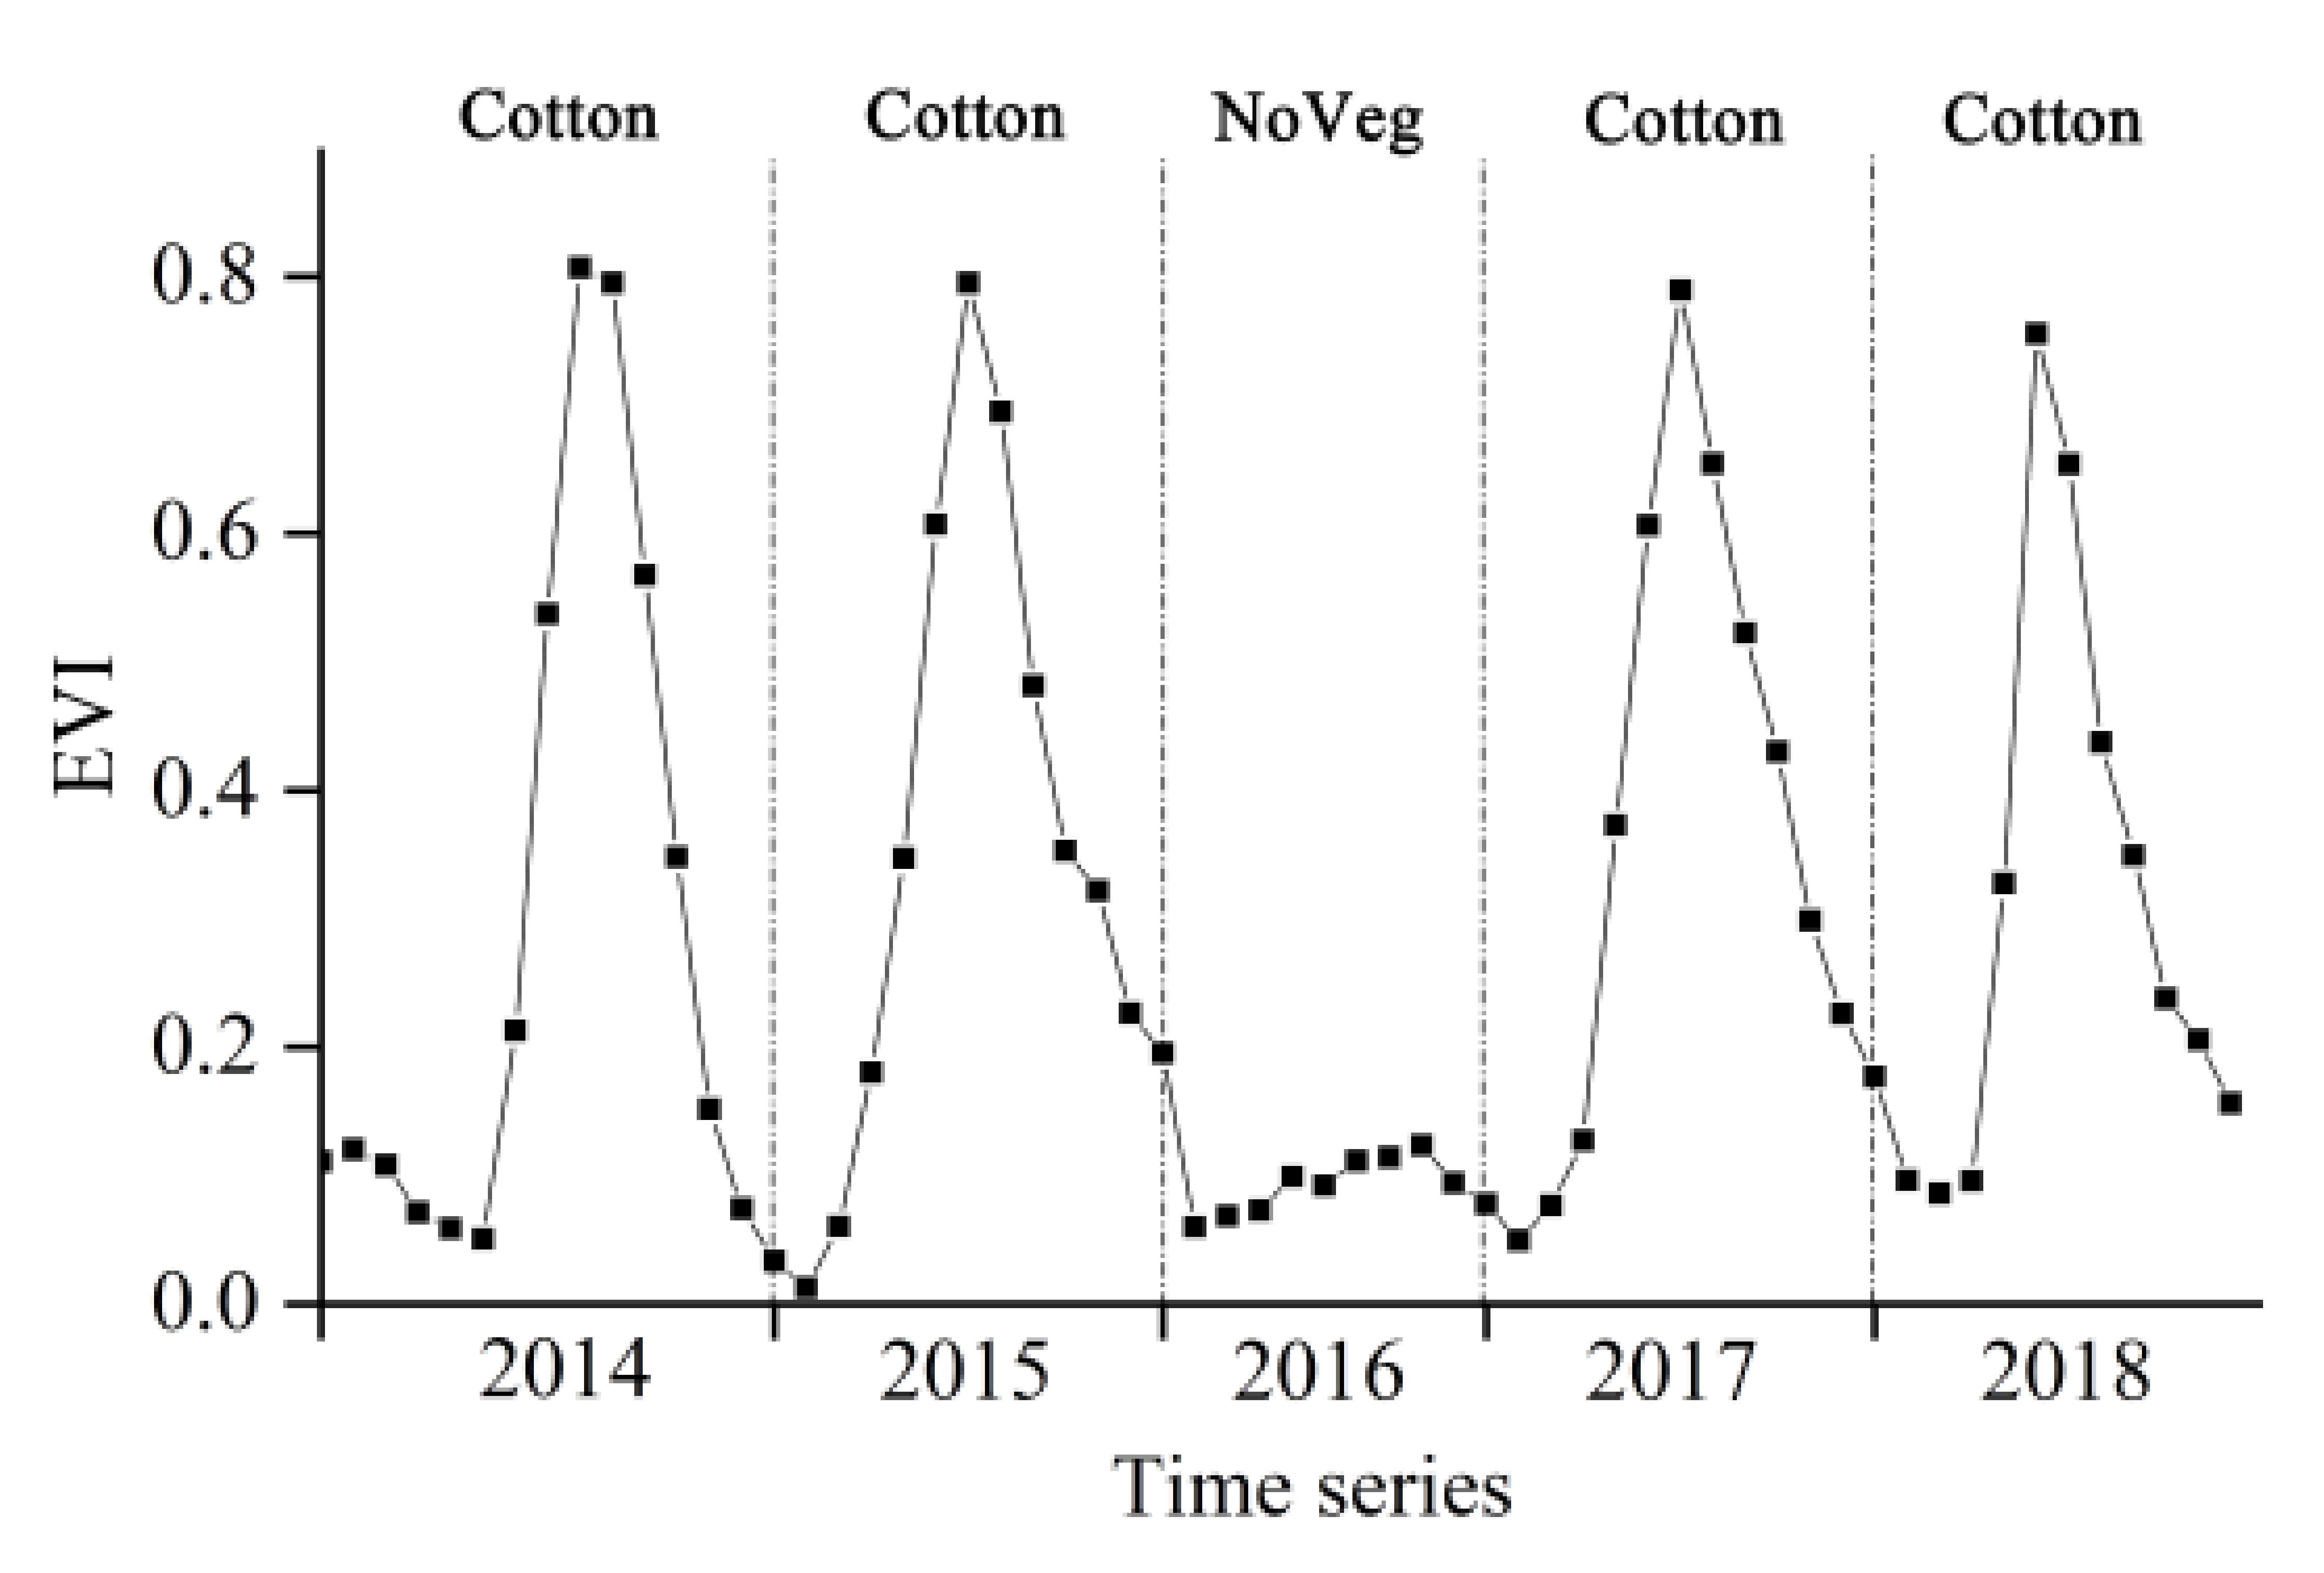
 Remotesensing 13 05183 i003
ReclamationCertain crop fields were changed from other land-use classes to cotton.
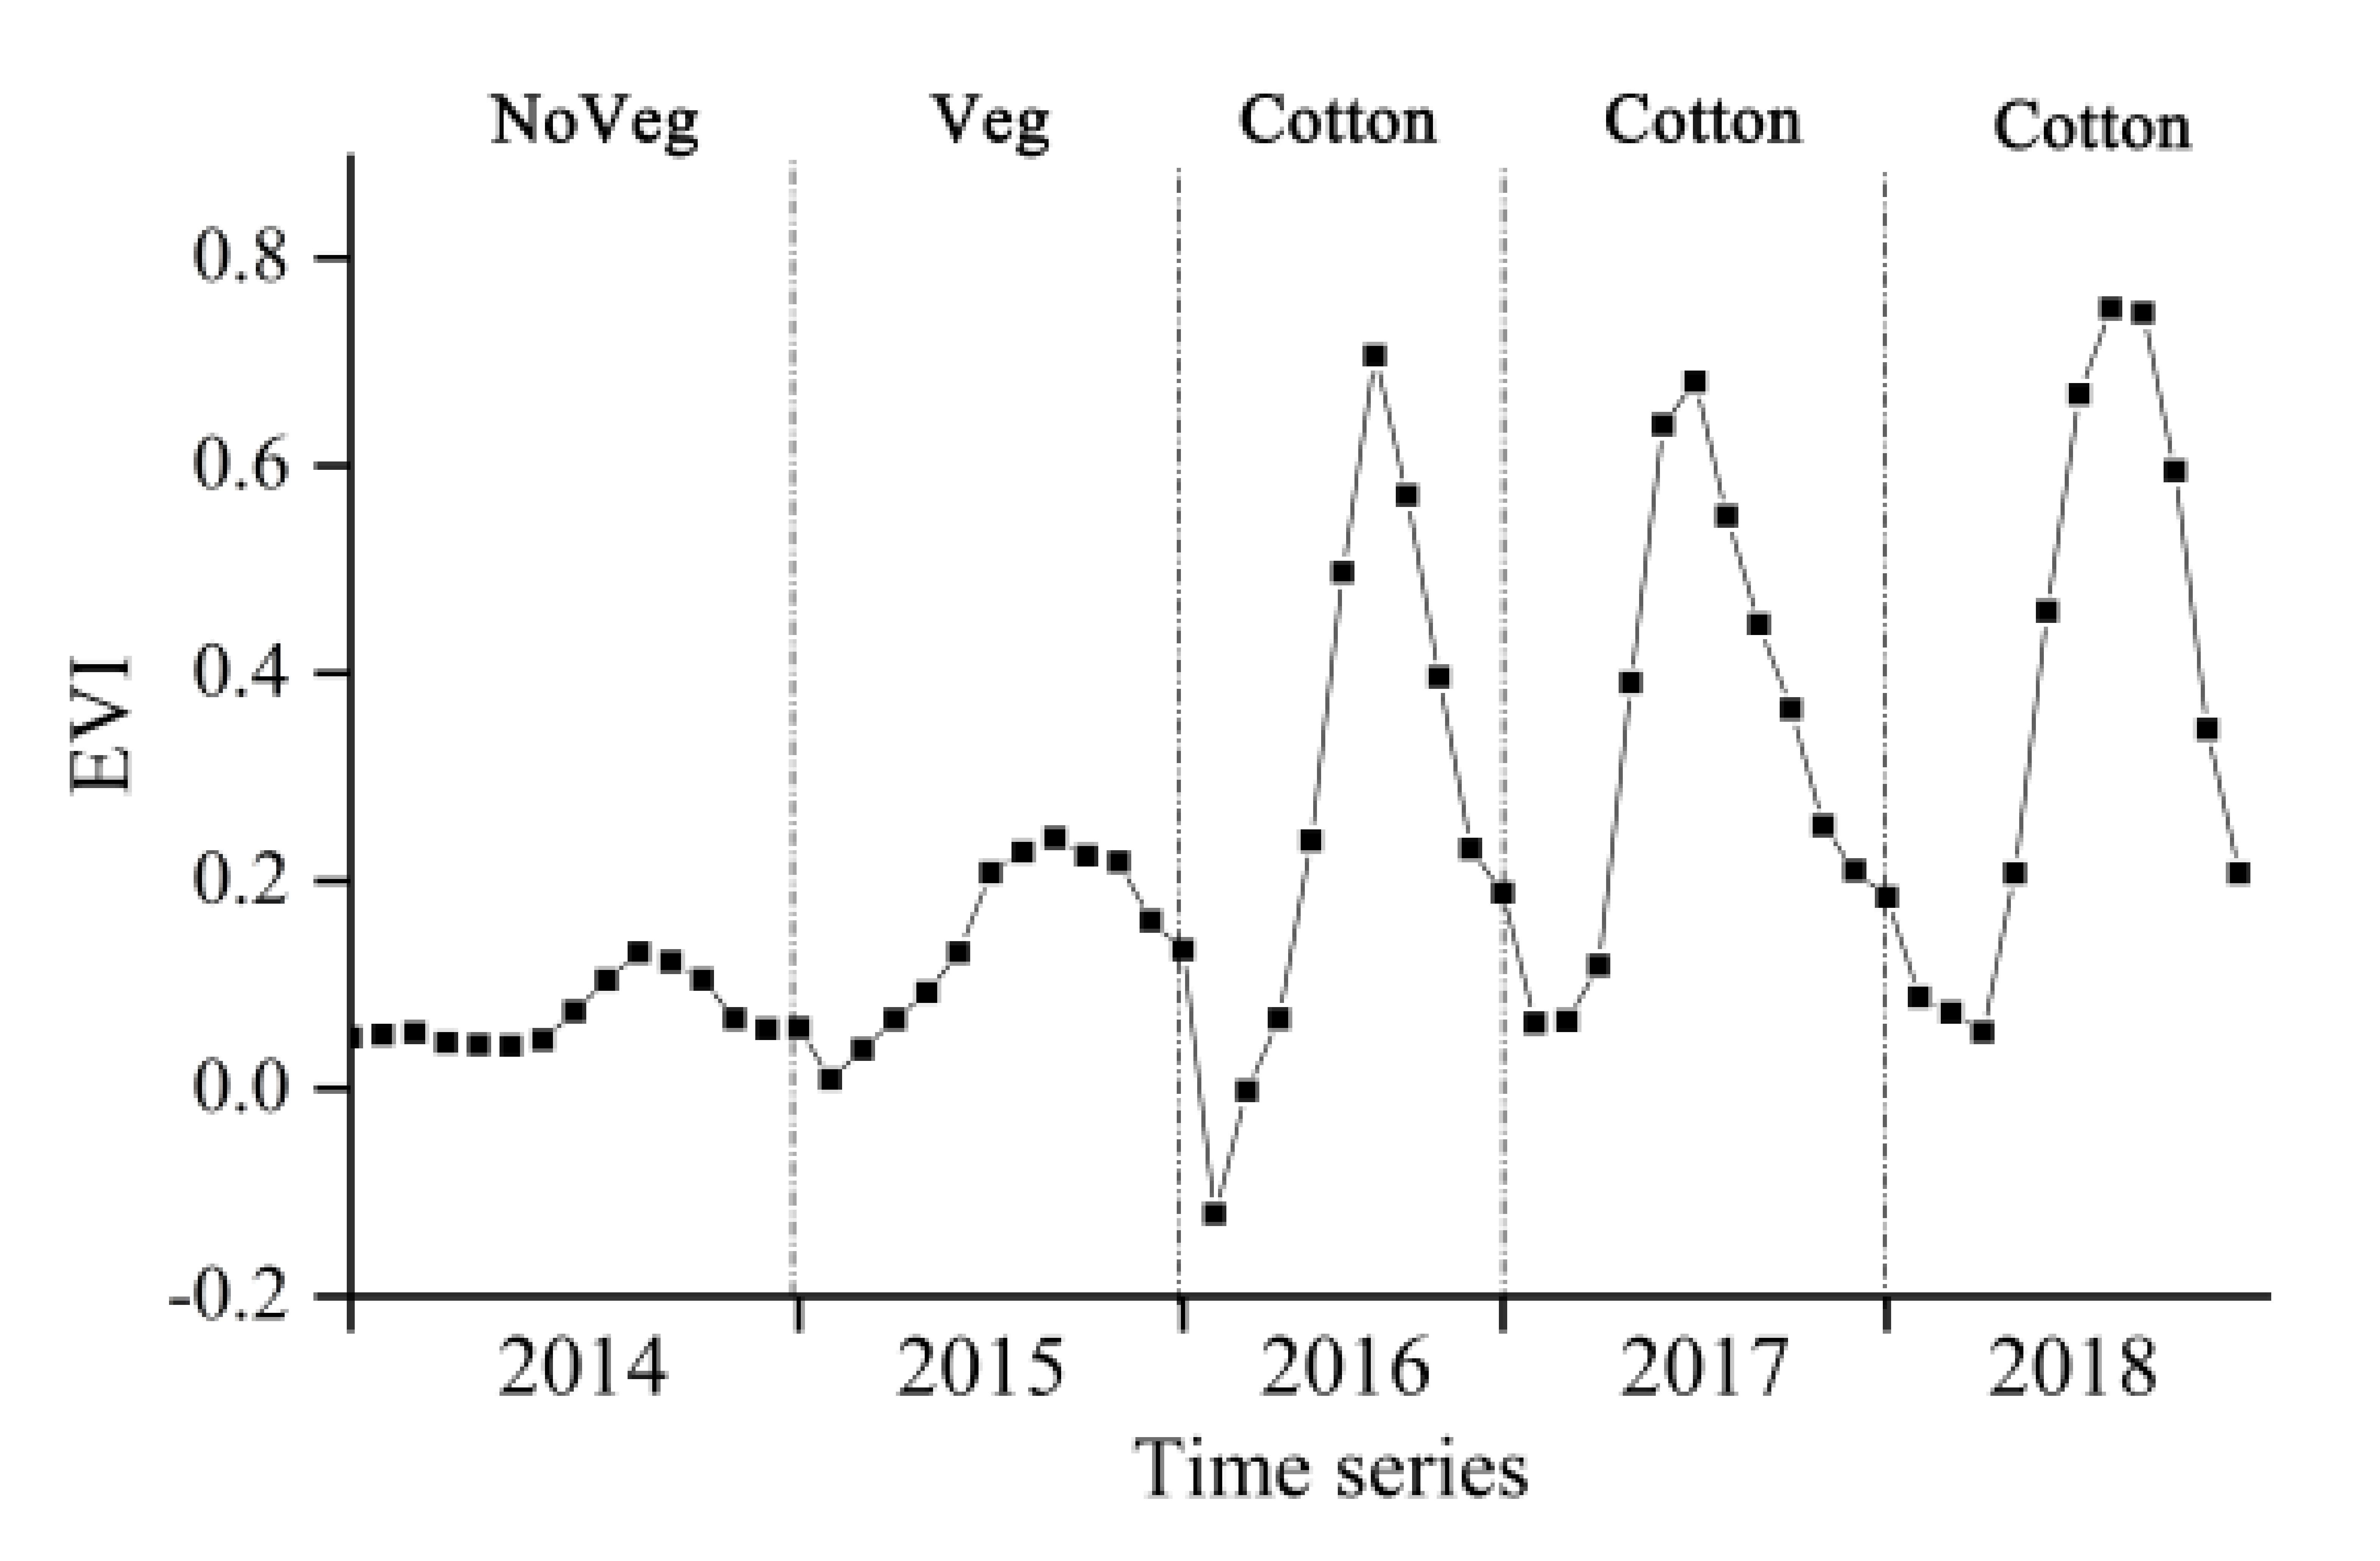
 Remotesensing 13 05183 i004
Cotton-rice rotationRotating cotton with rice in a given year with the aim to enable regeneration of soil fertility. Remotesensing 13 05183 i005
Remotesensing 13 05183 i006
Remotesensing 13 05183 i007
Remotesensing 13 05183 i008
Table 2. Training and validation samples for multi-year cotton-cropping patterns.
CategoriesTraining SamplesValidation Samples
Abandonment157365
Reclamation130301
Monoculture138320
Fallow95220
Rotation in 20143374
Rotation in 201576175
Rotation in 2016155360
Rotation in 2017146339
Rotation in 2018124289
Others239557
Total12933000
Table 3. Accuracy of the intra-annual crop mapping based on the RF classification method.
UA/PA (%)OA (%)Kappa
CottonRiceOrchardOthers
201498.32/99.57100.00/98.6597.37/99.5799.03/97.8498.580.98
201598.53/98.9096.43/98.9099.44/94.6596.98/98.9098.160.97
201698.95/97.2598.63/99.7296.79/94.7696.80/97.9297.80.97
201797.57/92.7494.38/99.1296.74/91.2895.07/97.1295.690.94
201895.13/96.7097.25/97.9298.41/95.3897.12/96.8896.840.96
Table 4. Accuracy assessment of the multi-year cotton-cropping pattern classification.
ClassUA/PA (%)ClassUA/PA (%)
Abandonment100.00/97.53Rotation in 201493.33/94.59
Fallow100.00/98.64Rotation in 2015100.00/94.86
Monoculture98.38/95.00Rotation in 201699.44/98.89
Reclamation97.95/95.02Rotation in 201799.09/96.17
Other90.41/99.82Rotation in 201895.76/93.77
OA (%)96.93
Kappa0.97
Table 5. Accuracy assessment of GIS-driven cotton cropping pattern.
ClassUA/PA (%)ClassUA/PA (%)
Abandonment99.72/98.08Rotation in 201483.15/100.00
Fallow85.94/100.00Rotation in 2015100.00/99.43
Monoculture98.44/49.69Rotation in 2016100.00/94.44
Reclamation96.78/100.00Rotation in 2017100.00/94.10
Other97.01/98.57Rotation in 2018100.00/90.07
OA (%)87.8
Kappa0.86
Publisher’s Note: MDPI stays neutral with regard to jurisdictional claims in published maps and institutional affiliations.

