
Glacier Area and Snow Cover Changes in the Range System Surrounding Tarim from 2000 to 2020 Using Google Earth Engine


Abstract
:1. Introduction
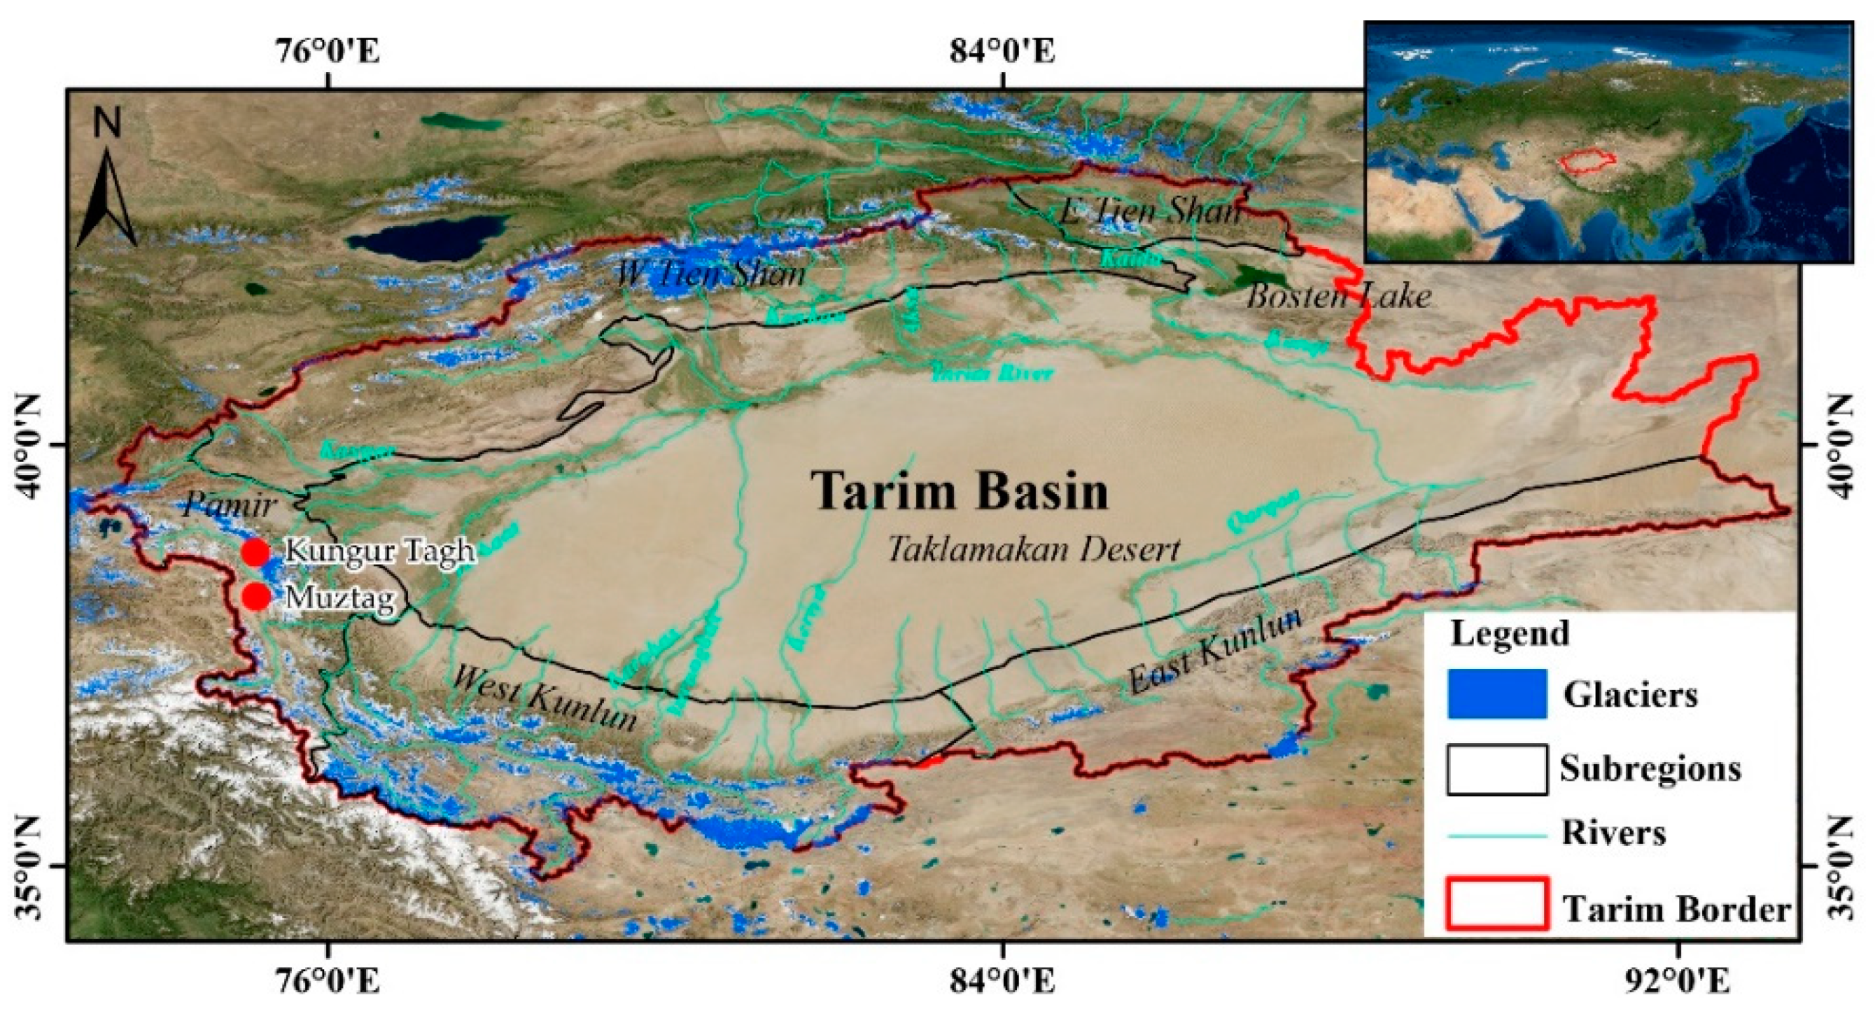
2. Study Area
3. Data and Method
3.1. Data
3.1.1. MODIS 8-Day Surface Reflectance Product (MOD09A1)
3.1.2. Landsat Satellite Data
3.1.3. Boundary of the Tarim Basin
3.1.4. Glacier Inventory
3.1.5. SRTM DEM
3.1.6. Meteorological Data
3.2. Method
3.2.1. Extracting Glacier Area
3.2.2. Extracting Snow Cover
4. Results
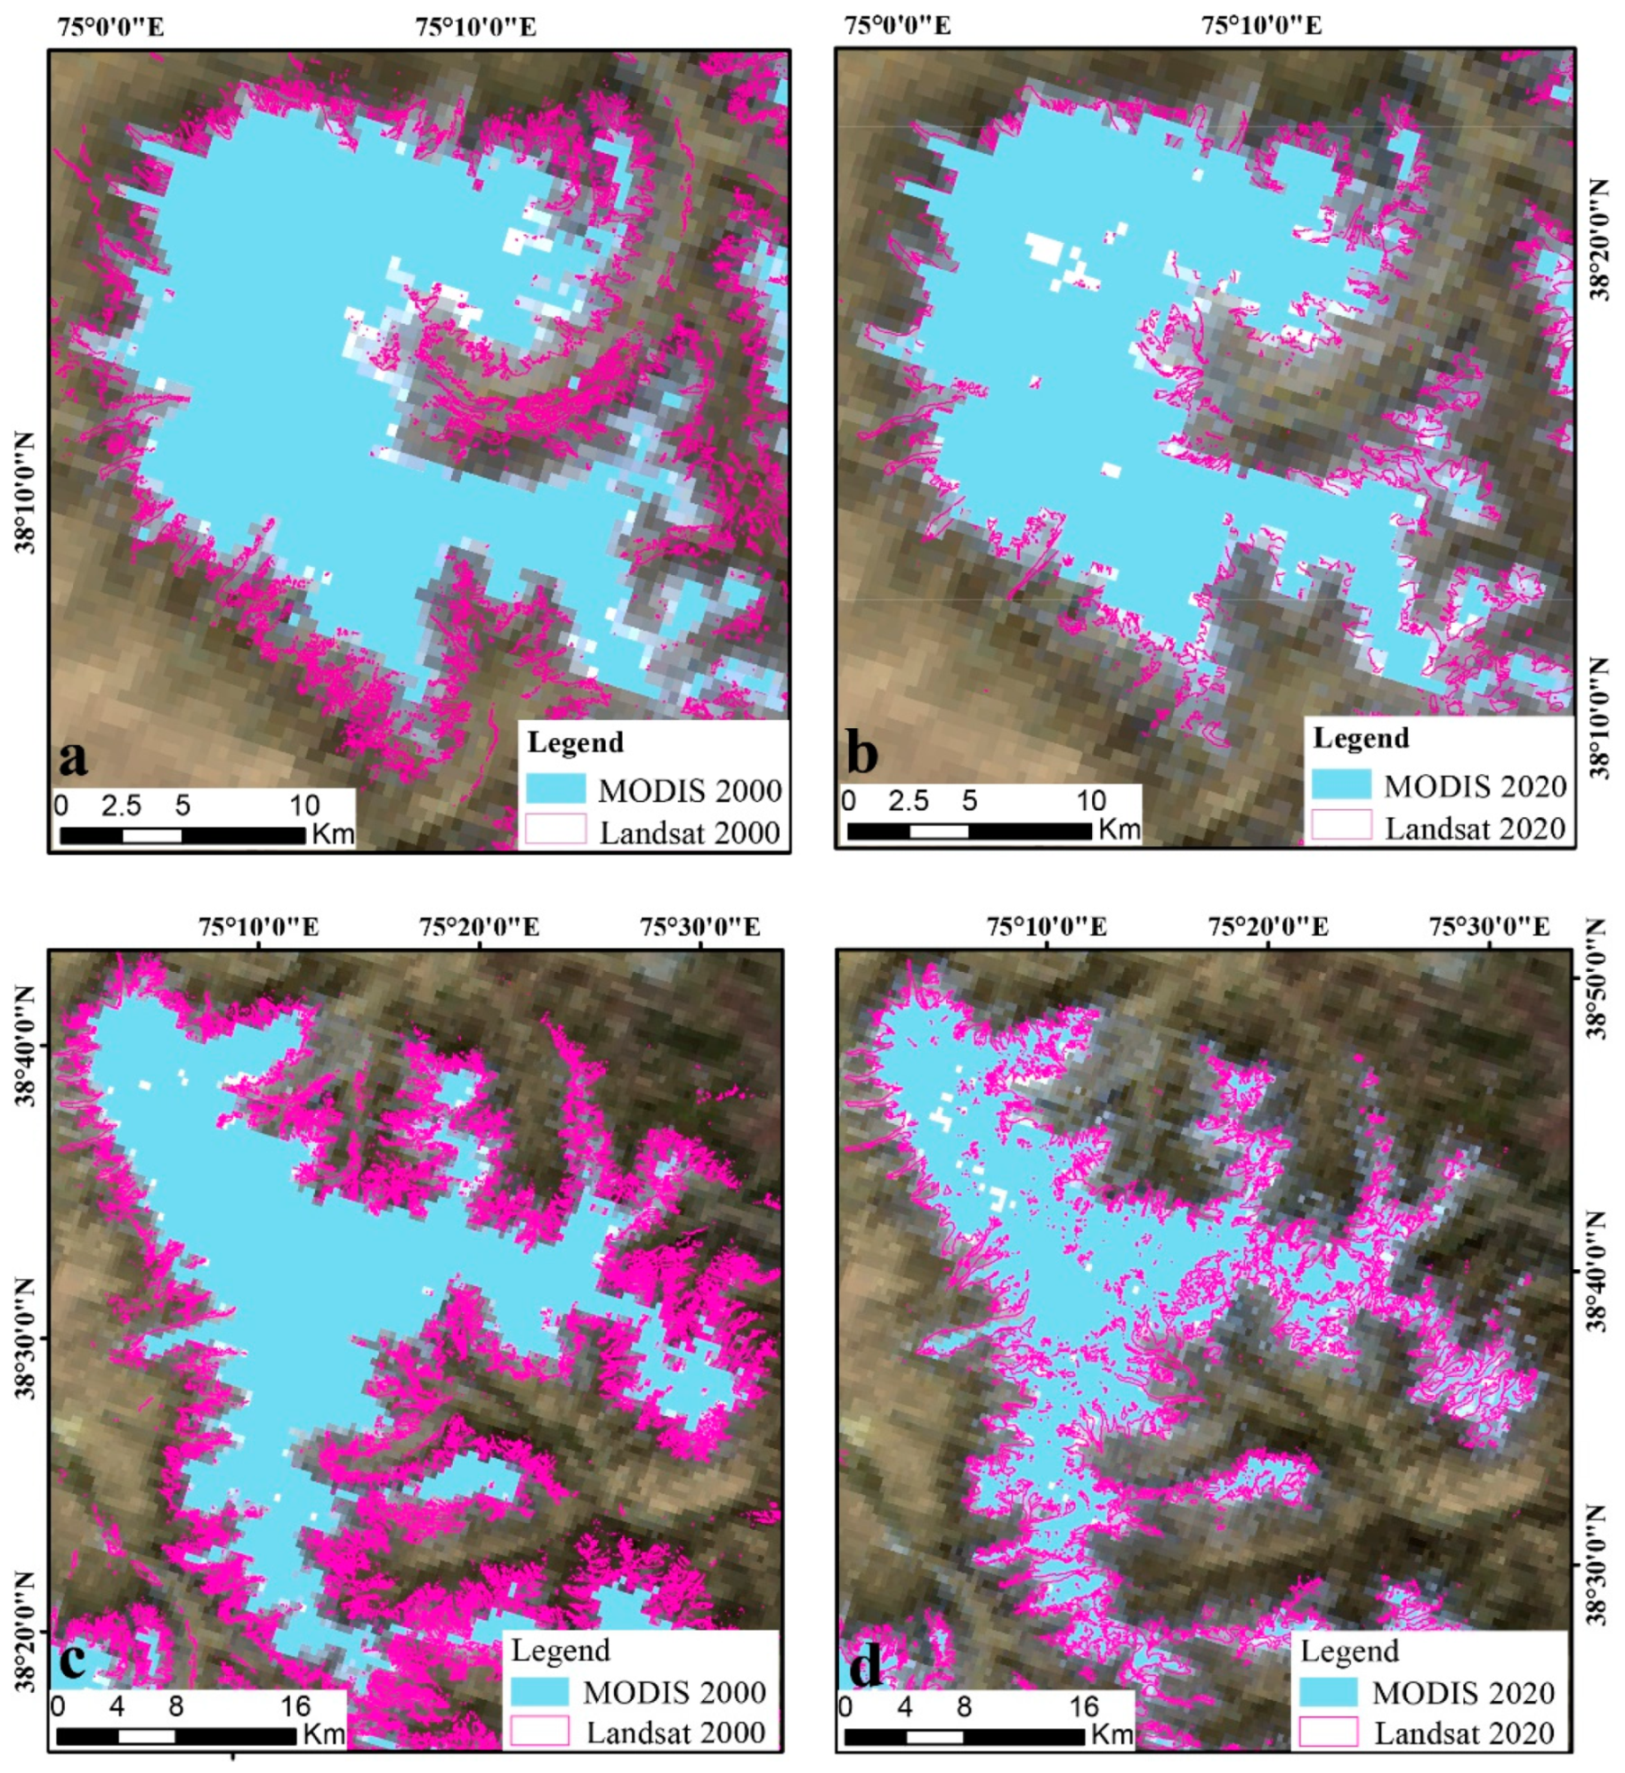
4.1. Accuracy Assessment
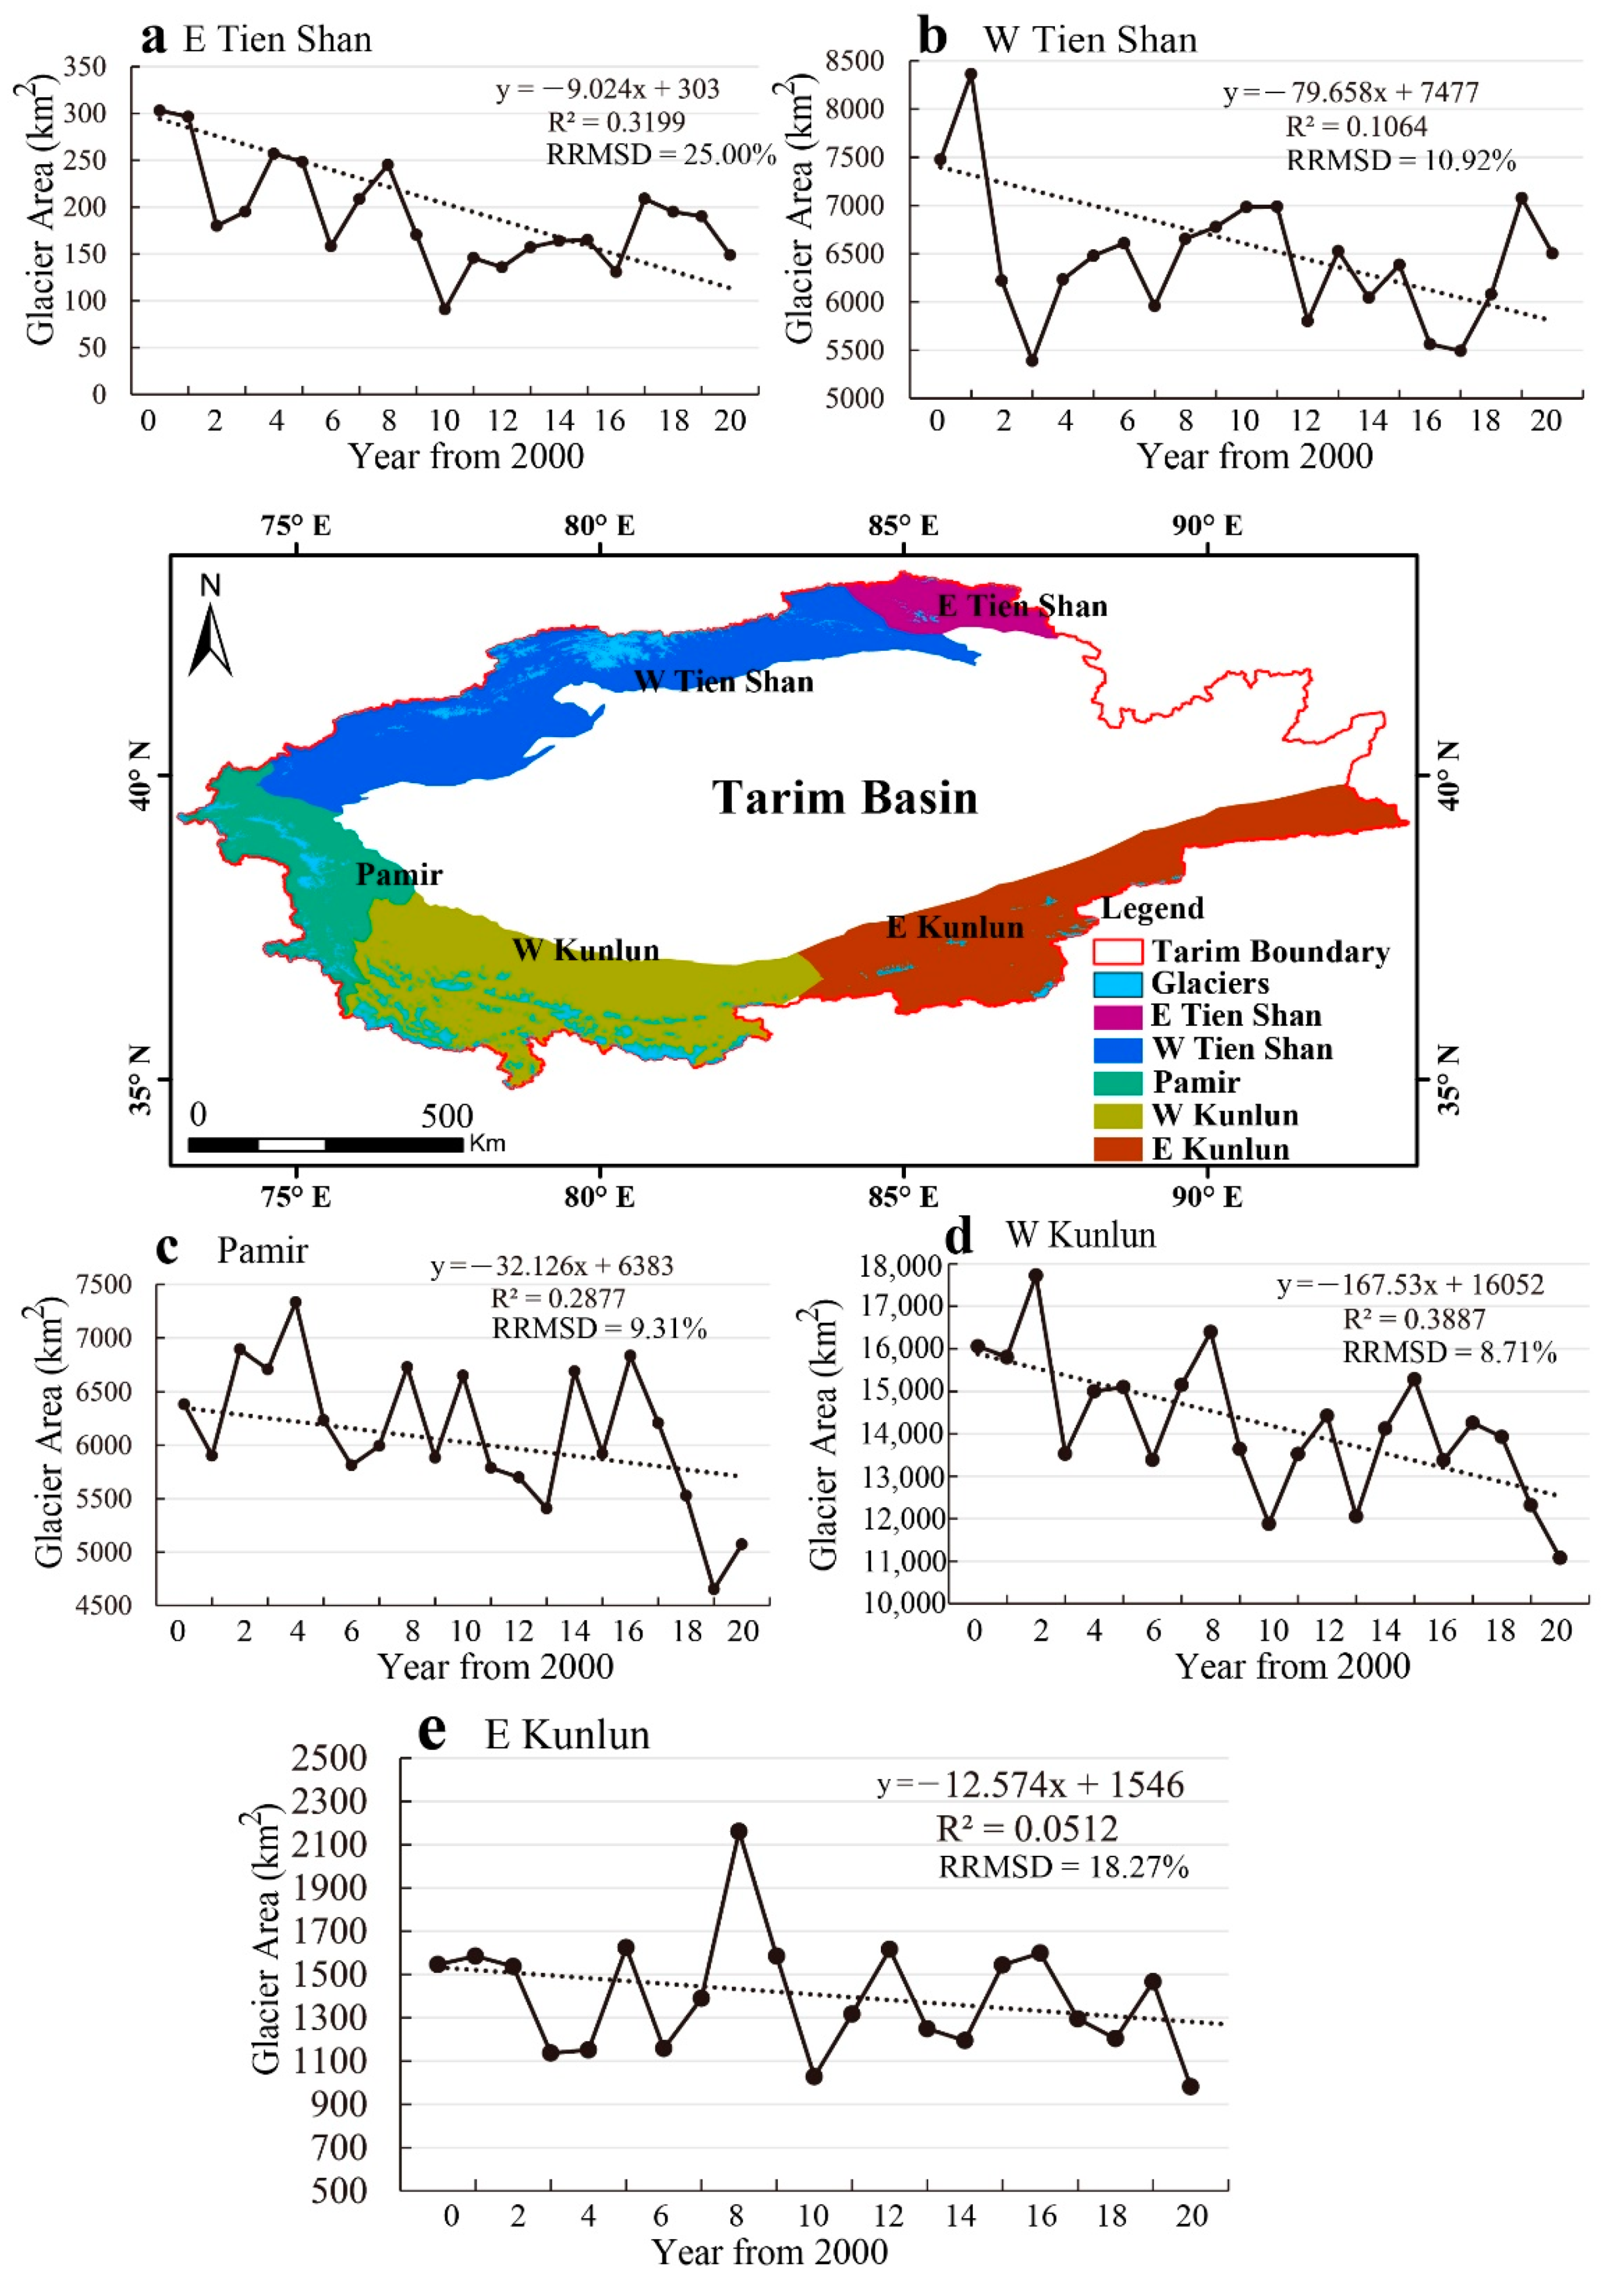
4.2. Variability of Glacier Area in the Tarim Basin
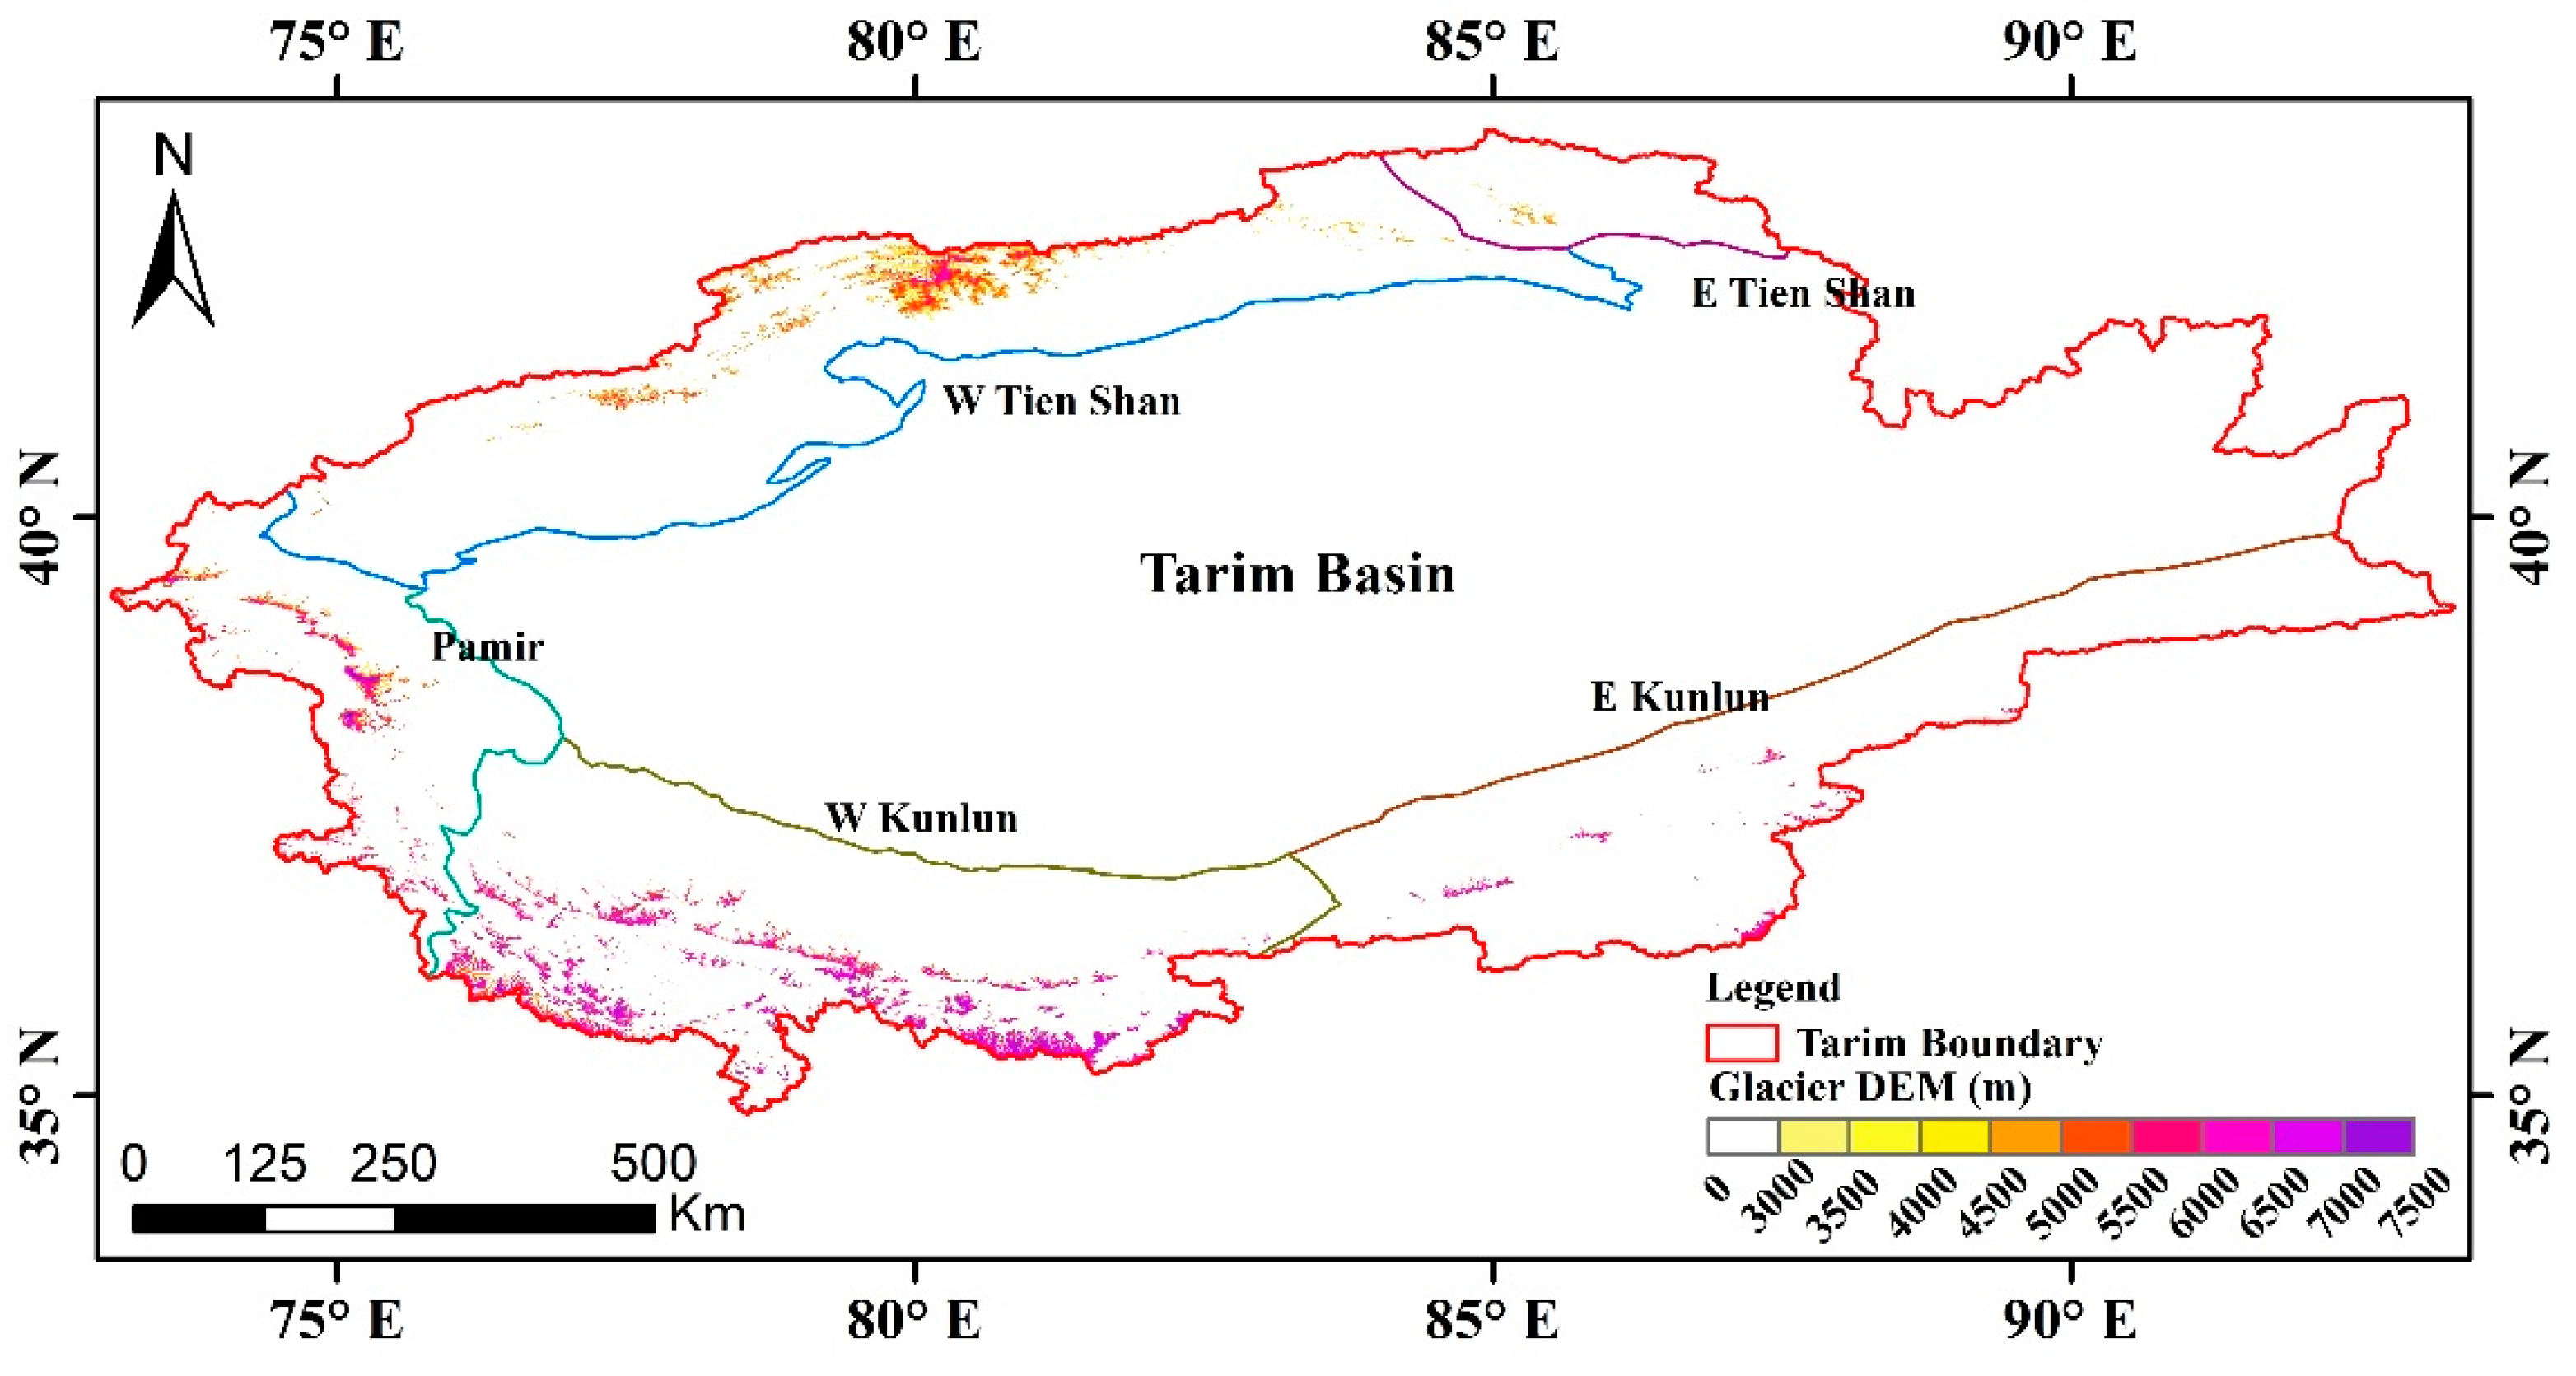
4.3. Changes in Glacier Area at Different Elevations
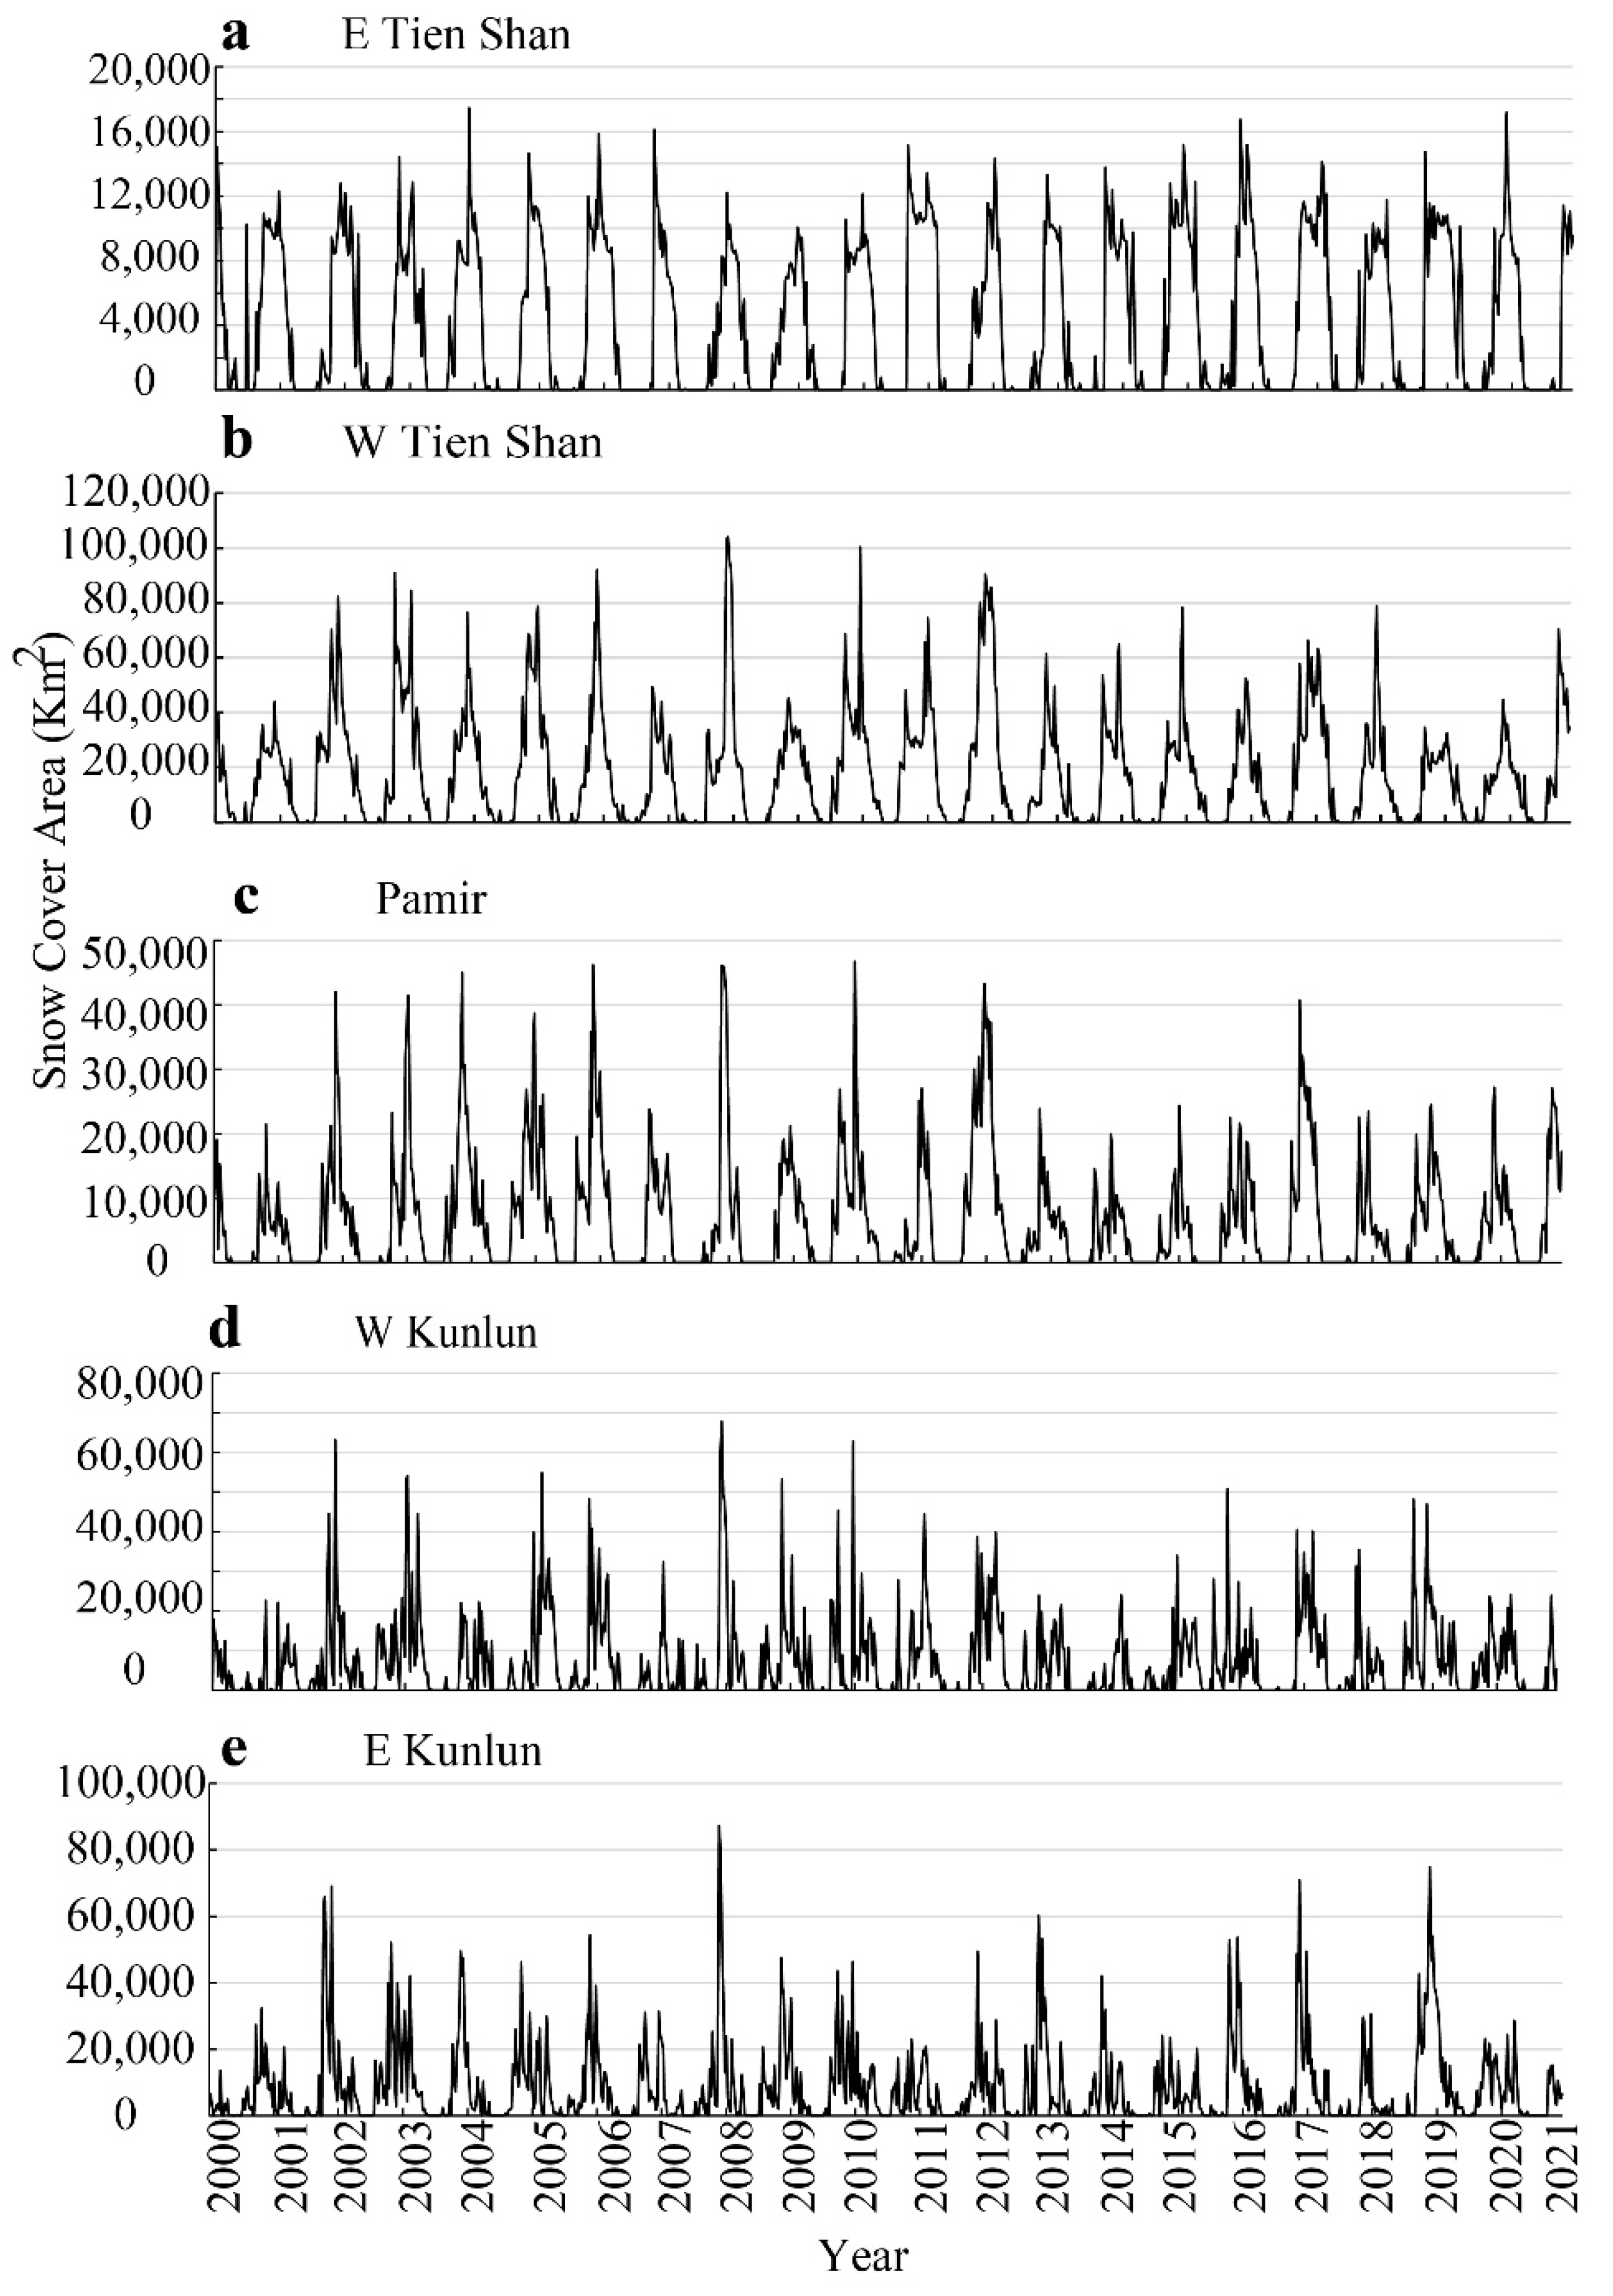
4.4. Snow Cover Area in Sub-Basins
5. Discussion
5.1. Comparison with Previous Studies
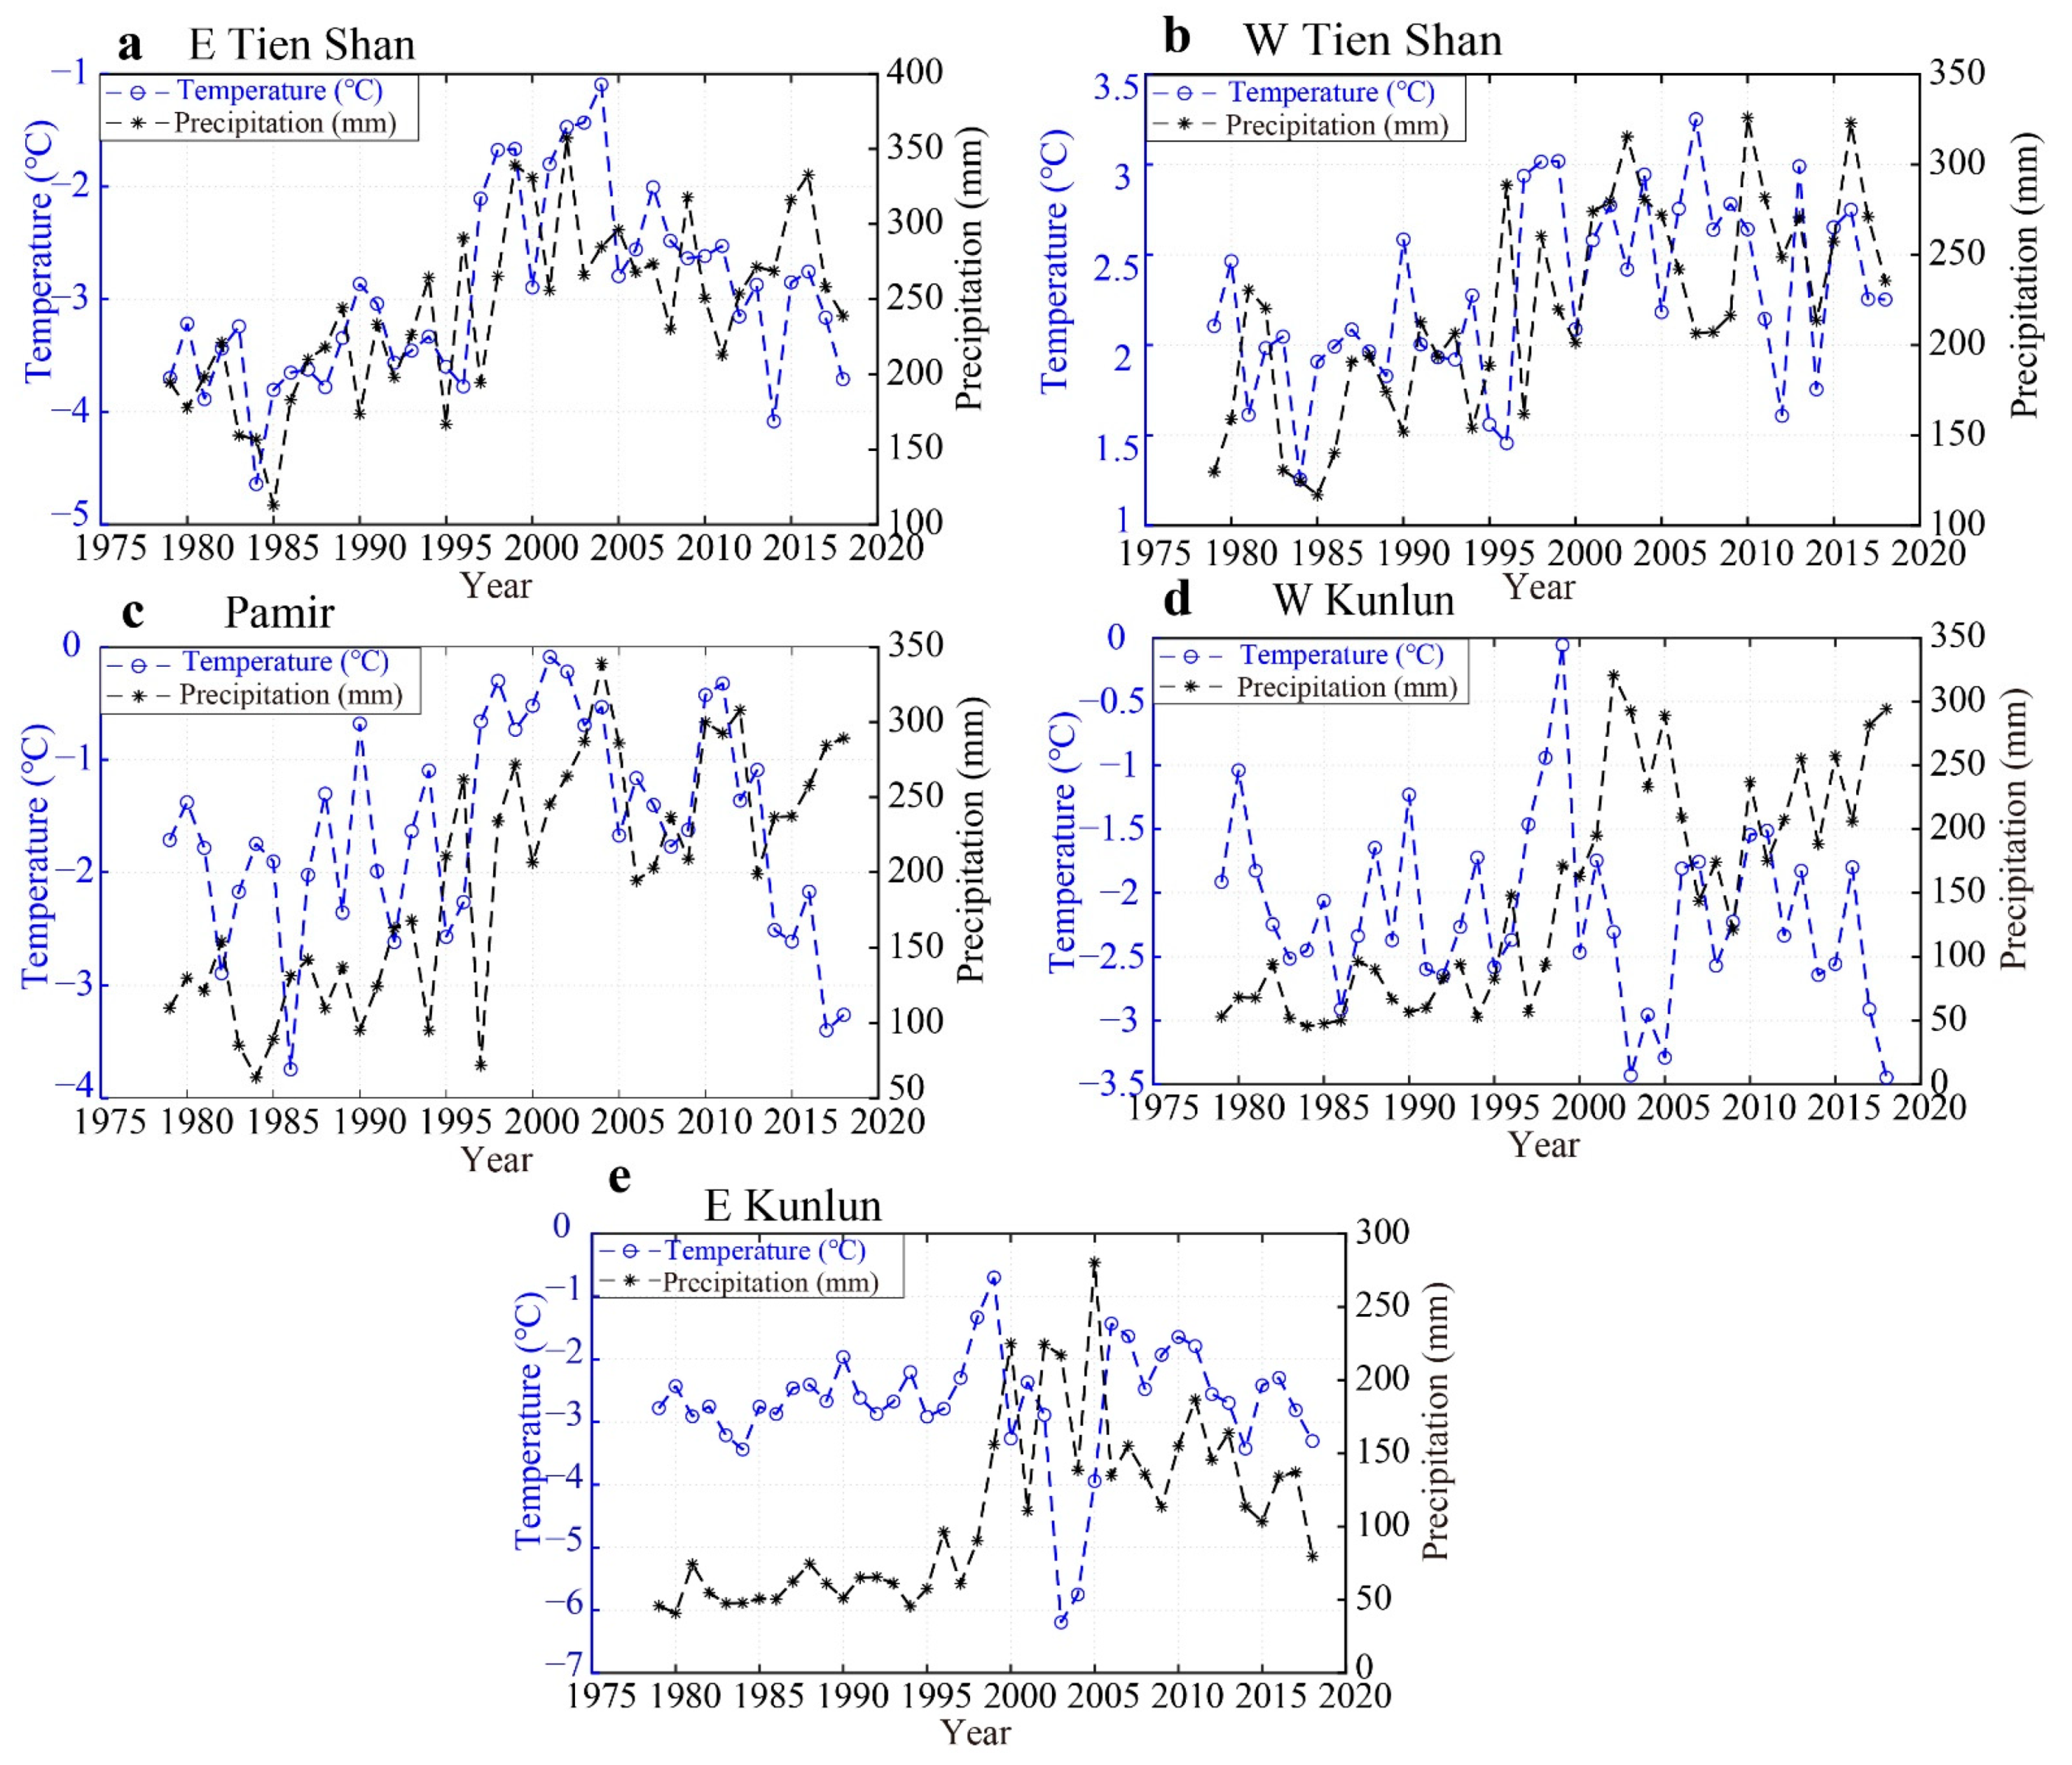
5.2. Glacier Area Variation in Response to Climate Forcing and Snow Cover
5.3. Limitations and Advantages of the Method
6. Conclusions
Supplementary Materials
Author Contributions
Funding
Acknowledgments
Conflicts of Interest
References
- Rumbaur, C.; Thevs, N.; Disse, M.; Ahlheim, M.; Brieden, A.; Cyffka, B.; Duethmann, D.; Feike, T.; Frör, O.; Gärtner, P.; et al. Sustainable management of river oases along the Tarim River (SuMaRiO) in Northwest China under conditions of climate change. Earth Syst. Dyn. 2015, 6, 83–107. [Google Scholar] [CrossRef] [Green Version]
- Shi, Y.; Liu, C.; Kang, E. The Glacier Inventory of China. Ann. Glaciol. 2009, 50, 1–4. [Google Scholar] [CrossRef] [Green Version]
- Duethmann, D.; Menz, C.; Jiang, T.; Vorogushyn, S. Projections for headwater catchments of the Tarim River reveal glacier retreat and decreasing surface water availability but uncertainties are large. Environ. Res. Lett. 2016, 11, 054024, Erratum in 2019, 11, 049501. [Google Scholar] [CrossRef] [Green Version]
- Hagg, W.; Mayer, C.; Lambrecht, A.; Kriegel, D.; Azizov, E. Glacier changes in the Big Naryn basin, Central Tian Shan. Global Planet. Change 2013, 110, 40–50. [Google Scholar] [CrossRef]
- Kaser, G.; Grosshauser, M.; Marzeion, B. Contribution potential of glaciers to water availability in different climate regimes. Proc. Natl. Acad. Sci. USA 2010, 107, 20223–20227. [Google Scholar] [CrossRef] [PubMed] [Green Version]
- Pieczonka, T.; Bolch, T.; Junfeng, W.; Shiyin, L. Heterogeneous mass loss of glaciers in the Aksu-Tarim Catchment (Central Tien Shan) revealed by 1976 KH-9 Hexagon and 2009 SPOT-5 stereo imagery. Remote Sens. Environ. 2013, 130, 233–244. [Google Scholar] [CrossRef] [Green Version]
- Chen, Y.; Li, W.; Fang, G.; Li, Z. Review article: Hydrological modeling in glacierized catchments of central Asia—Status and challenges. Hydrol. Earth Syst. Sci. 2017, 21, 669–684. [Google Scholar] [CrossRef] [Green Version]
- Yongping, S. Response of Glacier Flash Flood to Global Warming in Tarim River Basin. Clim. Chang. Res. 2006, 2, 32–35. [Google Scholar]
- Bazai, N.A.; Cui, P.; Carling, P.A.; Wang, H.; Hassan, J.; Liu, D.; Zhang, G.; Jin, W. Increasing glacial lake outburst flood hazard in response to surge glaciers in the Karakoram. Earth-Sci. Rev. 2021, 212, 103432. [Google Scholar] [CrossRef]
- Lv, M.; Guo, H.; Yan, J.; Wu, K.; Liu, G.; Lu, X.; Ruan, Z.; Yan, S. Distinguishing Glaciers between Surging and Advancing by Remote Sensing: A Case Study in the Eastern Karakoram. Remote Sens. 2020, 12, 2297. [Google Scholar] [CrossRef]
- Lv, M.; Guo, H.; Lu, X.; Liu, G.; Yan, S.; Ruan, Z.; Ding, Y.; Quincey, D.J. Characterizing the behaviour of surge- and non-surge-type glaciers in the Kingata Mountains, eastern Pamir, from 1999 to 2016. Cryosphere 2019, 13, 219–236. [Google Scholar] [CrossRef] [Green Version]
- Bolch, T.; Shea, J.M.; Liu, S.; Azam, M.F.; Gao, Y.; Gruber, S.; Immerzeel, W.W.; Kulkarni, A.; Li, H.; Tahir, A.A.; et al. Status and Change of the Cryosphere in the Extended Hindu Kush Himalaya Region. In The Hindu Kush Himalaya Assessment; Springer: Cham, Switzerland, 2019; pp. 209–255. [Google Scholar] [CrossRef] [Green Version]
- Rabatel, A.; Dedieu, J.-P.; Vincent, C. Using remote-sensing data to determine equilibrium-line altitude and mass-balance time series: Validation on three French glaciers, 1994–2002. J. Glaciol. 2005, 51, 539–546. [Google Scholar] [CrossRef] [Green Version]
- Rabatel, A.; Letréguilly, A.; Dedieu, J.-P.; Eckert, N. Changes in glacier equilibrium-line altitude in the western Alps from 1984 to 2010: Evaluation by remote sensing and modeling of the morpho-topographic and climate controls. Cryosphere 2013, 7, 1455–1471. [Google Scholar] [CrossRef] [Green Version]
- Wang, X.; Chen, H.; Chen, Y. Topography-Related Glacier Area Changes in Central Tianshan from 1989 to 2015 Derived from Landsat Images and ASTER GDEM Data. Water 2018, 10, 555. [Google Scholar] [CrossRef] [Green Version]
- Wang, Y.; Hou, S.; Huai, B.; An, W.; Pang, H.; Liu, Y. Glacier anomaly over the western Kunlun Mountains, Northwestern Tibetan Plateau, since the 1970s. J. Glaciol. 2018, 64, 624–636. [Google Scholar] [CrossRef] [Green Version]
- Shangguan, D.; Liu, S.; Ding, Y.; Ding, L.; Xu, J.; Jing, L. Glacier changes during the last forty years in the Tarim Interior River basin, northwest China. Prog. Nat. Sci. 2009, 19, 727–732. [Google Scholar] [CrossRef]
- Liu, S.; Ding, Y.; Shangguan, D.; Zhang, Y.; Li, J.; Han, H.; Wang, J.; Xie, C. Glacier retreat as a result of climate warming and increased precipitation in the Tarim river basin, northwest China. Ann. Glaciol. 2006, 43, 91–96. [Google Scholar] [CrossRef] [Green Version]
- Zhang, Q.; Chen, Y.; Li, Z.; Li, Y.; Xiang, Y.; Bian, W. Glacier changes from 1975 to 2016 in the Aksu River Basin, Central Tianshan Mountains. J. Geogr. Sci. 2019, 29, 984–1000. [Google Scholar] [CrossRef] [Green Version]
- Kääb, A.; Berthier, E.; Nuth, C.; Gardelle, J.; Arnaud, Y. Contrasting patterns of early twenty-first-century glacier mass change in the Himalayas. Nat. Cell Biol. 2012, 488, 495–498. [Google Scholar] [CrossRef] [PubMed]
- Seong, Y.B.; Owen, L.A.; Caffee, M.W.; Kamp, U.; Bishop, M.P.; Bush, A.; Copland, L.; Shroder, J.F. Rates of basin-wide rockwall retreat in the K2 region of the Central Karakoram defined by terrestrial cosmogenic nuclide Be-10. Geomorphology 2009, 107, 254–262. [Google Scholar] [CrossRef]
- Bocchiola, D.; Diolaiuti, G. Recent (1980–2009) evidence of climate change in the upper Karakoram, Pakistan. Theor. Appl. Climatol. 2013, 113, 611–641. [Google Scholar] [CrossRef]
- Forsythe, N.; Fowler, H.; Li, X.-F.; Blenkinsop, S.; Pritchard, D. Karakoram temperature and glacial melt driven by regional atmospheric circulation variability. Nat. Clim. Chang. 2017, 7, 664–670. [Google Scholar] [CrossRef]
- Hasson, S.U.; Böhner, J.; Lucarini, V. Prevailing climatic trends and runoff response from Hindukush–Karakoram–Himalaya, upper Indus Basin. Earth Syst. Dyn. 2017, 8, 337–355. [Google Scholar] [CrossRef] [Green Version]
- Cannon, F.; Carvalho, L.M.V.; Jones, C.; Bookhagen, B. Multi-annual variations in winter westerly disturbance activity affecting the Himalaya. Clim. Dyn. 2015, 44, 441–455. [Google Scholar] [CrossRef] [Green Version]
- Norris, J.; Carvalho, L.M.V.; Jones, C.; Cannon, F. Deciphering the contrasting climatic trends between the central Himalaya and Karakoram with 36 years of WRF simulations. Clim. Dyn. 2019, 52, 159–180. [Google Scholar] [CrossRef]
- Norris, J.; Carvalho, L.M.V.; Jones, C.; Cannon, F. WRF simulations of two extreme snowfall events associated with contrasting extratropical cyclones over the western and central Himalaya. J. Geophys. Res. Atmos. 2015, 120, 3114–3138. [Google Scholar] [CrossRef] [Green Version]
- De Kok, R.J.; Tuinenburg, O.A.; Bonekamp, P.N.J.; Immerzeel, W.W. Irrigation as a Potential Driver for Anomalous Glacier Behavior in High Mountain Asia. Geophys. Res. Lett. 2018, 45, 2047–2054. [Google Scholar] [CrossRef] [PubMed] [Green Version]
- Kapnick, S.; Delworth, T.; Ashfaq, M.; Malyshev, S.; Milly, P.C.D. Snowfall less sensitive to warming in Karakoram than in Himalayas due to a unique seasonal cycle. Nat. Geosci. 2014, 7, 834–840. [Google Scholar] [CrossRef]
- Kääb, A.; Treichler, D.; Nuth, C.; Berthier, E. Brief Communication: Contending estimates of 2003–2008 glacier mass balance over the Pamir–Karakoram–Himalaya. Cryosphere 2015, 9, 557–564. [Google Scholar] [CrossRef] [Green Version]
- Yao, T.; Thompson, L.; Yang, W.; Yu, W.; Gao, Y.; Guo, X.; Yang, X.; Duan, K.; Zhao, H.; Xu, B.; et al. Different glacier status with atmospheric circulations in Tibetan Plateau and surroundings. Nat. Clim. Chang. 2012, 2, 663–667. [Google Scholar] [CrossRef]
- Paul, F.; Bolch, T.; Kääb, A.; Nagler, T.; Nuth, C.; Scharrer, K.; Shepherd, A.; Strozzi, T.; Ticconi, F.; Bhambri, R.; et al. The glaciers climate change initiative: Methods for creating glacier area, elevation change and velocity products. Remote Sens. Environ. 2015, 162, 408–426. [Google Scholar] [CrossRef] [Green Version]
- Hall, D.K.; Ormsby, J.P.; Bindschadler, R.A.; Siddalingaiah, H. Characterization of snow and ice reflectance zones on glaciers using Landsat TM data. Ann. Glaciol. 1987, 9, 104–108. [Google Scholar] [CrossRef] [Green Version]
- Paul, F.; Kääb, A. Perspectives on the production of a glacier inventory from multispectral satellite data in Arctic Canada: Cumberland Peninsula, Baffin Island. Ann. Glaciol. 2005, 42, 59–66. [Google Scholar] [CrossRef] [Green Version]
- Dozier, J. Spectral signature of alpine snow cover from the landsat thematic mapper. Remote Sens. Environ. 1989, 28, 9–22. [Google Scholar] [CrossRef]
- Tang, B.-H.; Shrestha, B.; Li, Z.-L.; Liu, G.; Ouyang, H.; Gurung, D.R.; Giriraj, A.; Aung, K.S. Determination of snow cover from MODIS data for the Tibetan Plateau region. Int. J. Appl. Earth Obs. Geoinf. 2013, 21, 356–365. [Google Scholar] [CrossRef]
- Hall, D.K.; Riggs, G.A.; Salomonson, V.V. Development of methods for mapping global snow cover using moderate resolution imaging spectroradiometer data. Remote Sens. Environ. 1995, 54, 127–140. [Google Scholar] [CrossRef]
- Rabatel, A.; Bermejo, A.; Loarte, E.; Soruco, A.; Gomez, J.; Leonardini, G.; Vincent, C.; Sicart, J.E. Can the snowline be used as an indicator of the equilibrium line and mass balance for glaciers in the outer tropics? J. Glaciol. 2012, 58, 1027–1036. [Google Scholar] [CrossRef] [Green Version]
- Brun, F.; Dumont, M.; Wagnon, P.; Berthier, E.; Azam, M.F.; Shea, J.M.; Sirguey, P.; Rabatel, A.; Ramanathan, A. Seasonal changes in surface albedo of Himalayan glaciers from MODIS data and links with the annual mass balance. Cryosphere 2015, 9, 341–355. [Google Scholar] [CrossRef] [Green Version]
- Raup, B.; Kääb, A.; Kargel, J.S.; Bishop, M.P.; Hamilton, G.; Lee, E.; Paul, F.; Rau, F.; Soltesz, D.; Khalsa, S.J.; et al. Remote sensing and GIS technology in the Global Land Ice Measurements from Space (GLIMS) Project. Comput. Geosci. 2007, 33, 104–125. [Google Scholar] [CrossRef]
- Huang, L.; Li, Z.; Tian, B.-S.; Zhou, J.-M.; Chen, Q. Recognition of supraglacial debris in the Tianshan Mountains on polarimetric SAR images. Remote Sens. Environ. 2014, 145, 47–54. [Google Scholar] [CrossRef]
- Scherler, D.; Wulf, H.; Gorelick, N. Global Assessment of Supraglacial Debris-Cover Extents. Geophys. Res. Lett. 2018, 45, 11798–11805. [Google Scholar] [CrossRef] [Green Version]
- Anderson, L.S.; Anderson, R.S. Debris thickness patterns on debris-covered glaciers. Geomorphology 2018, 311, 1–12. [Google Scholar] [CrossRef]
- Riggs, G.A.; Hall, D.K.; Román, M.O. Overview of NASA’s MODIS and Visible Infrared Imaging Radiometer Suite (VIIRS) snow-cover Earth System Data Records. Earth Syst. Sci. Data 2017, 9, 765–777. [Google Scholar] [CrossRef] [Green Version]
- National Snow & Ice Data Center. Available online: https://nsidc.org/ (accessed on 1 March 2021).
- Justice, C.; Townshend, J.; Vermote, E.; Masuoka, E.; Wolfe, R.; Saleous, N.; Roy, D.; Morisette, J. An overview of MODIS Land data processing and product status. Remote Sens. Environ. 2002, 83, 3–15. [Google Scholar] [CrossRef]
- Jin, S.; Sader, S.A. MODIS time-series imagery for forest disturbance detection and quantification of patch size effects. Remote Sens. Environ. 2005, 99, 462–470. [Google Scholar] [CrossRef]
- Hall, D.K.; Riggs, G.A.; Salomonson, V.V.; DiGirolamo, N.E.; Bayr, K.J. MODIS snow-cover products. Remote Sens. Environ. 2002, 83, 181–194. [Google Scholar] [CrossRef] [Green Version]
- Huang, L.; Li, Z.; Zhou, J.M.; Zhang, P. An automatic method for clean glacier and nonseasonal snow area change estimation in High Mountain Asia from 1990 to 2018. Remote Sens. Environ. 2021, 258, 112376. [Google Scholar] [CrossRef]
- Mishra, V.D.; Negi, H.S.; Rawat, A.K.; Chaturvedi, A.; Singh, R.P. Retrieval of sub-pixel snow cover information in the Himalayan region using medium and coarse resolution remote sensing data. Int. J. Remote. Sens. 2009, 30, 4707–4731. [Google Scholar] [CrossRef]
- Zhang, H.; Zhang, F.; Zhang, G.; Che, T.; Yan, W.; Ye, M.; Ma, N. Ground-based evaluation of MODIS snow cover product V6 across China: Implications for the selection of NDSI threshold. Sci. Total Environ. 2019, 651, 2712–2726. [Google Scholar] [CrossRef] [PubMed]
- Gorelick, N.; Hancher, M.; Dixon, M.; Ilyushchenko, S.; Thau, D.; Moore, R. Google Earth Engine: Planetary-scale geospatial analysis for everyone. Remote Sens. Environ. 2017, 202, 18–27. [Google Scholar] [CrossRef]
- Pandey, P. Inventory of rock glaciers in Himachal Himalaya, India using high-resolution Google Earth imagery. Geomorphology 2019, 340, 103–115. [Google Scholar] [CrossRef]
- Yang, X.; Chen, Y.; Wang, J. Combined use of Sentinel-2 and Landsat 8 to monitor water surface area dynamics using Google Earth Engine. Remote Sens. Lett. 2020, 11, 687–696. [Google Scholar] [CrossRef]
- Fang, G.; Yang, J.; Chen, Y.; Li, Z.; Ji, H.; De Maeyer, P. How Hydrologic Processes Differ Spatially in a Large Basin: Multisite and Multiobjective Modeling in the Tarim River Basin. J. Geophys. Res. Atmos. 2018, 123, 7098–7113. [Google Scholar] [CrossRef]
- Xu, Z.; Liu, Z.; Fu, G.; Chen, Y. Trends of major hydroclimatic variables in the Tarim River basin during the past 50 years. J. Arid. Environ. 2010, 74, 256–267. [Google Scholar] [CrossRef]
- Keilholz, P.; Disse, M.; Halik, Ü. Effects of Land Use and Climate Change on Groundwater and Ecosystems at the Middle Reaches of the Tarim River Using the MIKE SHE Integrated Hydrological Model. Water 2015, 7, 3040–3056. [Google Scholar] [CrossRef] [Green Version]
- Tao, H.; Gemmer, M.; Bai, Y.; Su, B.; Mao, W. Trends of streamflow in the Tarim River Basin during the past 50years: Human impact or climate change? J. Hydrol. 2011, 400, 1–9. [Google Scholar] [CrossRef]
- Vermote, E. MOD09A1 MODIS/Terra Surface Reflectance 8-Day L3 Global 500m SIN Grid V006. 2015, Distributed by NASA EOSDIS Land Processes DAAC. Available online: https://doi.org/10.5067/MODIS/MOD09A1.006 (accessed on 3 March 2021).
- Lehner, B.; Grill, G. Global river hydrography and network routing: Baseline data and new approaches to study the world’s large river systems. Hydrol. Process. 2013, 27, 2171–2186. [Google Scholar] [CrossRef]
- Phan, V.H.; Lindenbergh, R.C.; Menenti, M. Geometric dependency of Tibetan lakes on glacial runoff. Hydrol. Earth Syst. Sci. 2013, 17, 4061–4077. [Google Scholar] [CrossRef] [Green Version]
- RGI Consortium. Randolph Glacier Inventory—A Dataset of Global Glacier Outlines: Version 6.0: Technical Report; Digital Media; US National Snow and Ice Data Center: Boulder, CO, USA, 2017. [Google Scholar] [CrossRef]
- Guo, W.; Liu, S.; Xu, J.; Wu, L.; Shangguan, D.; Yao, X.; Wei, J.; Bao, W.; Yu, P.; Liu, Q.; et al. The second Chinese glacier inventory: Data, methods and results. J. Glaciol. 2015, 61, 357–372. [Google Scholar] [CrossRef] [Green Version]
- Falorni, G.; Teles, V.; Vivoni, E.; Bras, R.L.; Amaratunga, K.S. Analysis and characterization of the vertical accuracy of digital elevation models from the Shuttle Radar Topography Mission. J. Geophys. Res. Space Phys. 2005, 110, F2. [Google Scholar] [CrossRef]
- Zhang, J.; Jia, L.; Menenti, M.; Hu, G. Glacier Facies Mapping Using a Machine-Learning Algorithm: The Parlung Zangbo Basin Case Study. Remote Sens. 2019, 11, 452. [Google Scholar] [CrossRef] [Green Version]
- Liu, J.; Yao, X.; Liu, S.; Guo, W.; Xu, J. Glacial changes in the Gangdisê Mountains from 1970 to 2016. J. Geogr. Sci. 2020, 30, 131–144. [Google Scholar] [CrossRef] [Green Version]
- He, J.; Yang, K.; Tang, W.; Lu, H.; Qin, J.; Chen, Y.; Li, X. The first high-resolution meteorological forcing dataset for land process studies over China. Sci. Data 2020, 7, 25. [Google Scholar] [CrossRef] [PubMed] [Green Version]
- Yang, K.; He, J.; Tang, W.; Qin, J.; Cheng, C.C. On downward shortwave and longwave radiations over high altitude regions: Observation and modeling in the Tibetan Plateau. Agric. For. Meteorol. 2010, 150, 38–46. [Google Scholar] [CrossRef]
- Zhu, Z.; Woodcock, C.E. Object-based cloud and cloud shadow detection in Landsat imagery. Remote Sens. Environ. 2012, 118, 83–94. [Google Scholar] [CrossRef]
- Salomonson, V.; Appel, I. Development of the Aqua MODIS NDSI fractional snow cover algorithm and validation results. IEEE Trans. Geosci. Remote Sens. 2006, 44, 1747–1756. [Google Scholar] [CrossRef]
- Klein, A.G.; Hall, D.K.; Riggs, G.A. Improving snow cover mapping in forests through the use of a canopy reflectance model. Hydrol. Process. 1998, 12, 1723–1744. [Google Scholar] [CrossRef]
- McFeeters, S.K. The use of the Normalized Difference Water Index (NDWI) in the delineation of open water features. Int. J. Remote Sens. 1996, 17, 1425–1432. [Google Scholar] [CrossRef]
- Sorg, A.; Bolch, T.; Stoffel, M.; Solomina, O.; Beniston, M. Climate change impacts on glaciers and runoff in Tien Shan (Central Asia). Nat. Clim. Chang. 2012, 2, 725–731. [Google Scholar] [CrossRef]
- Pan, B.T.; Zhang, G.L.; Wang, J.; Cao, B.; Geng, H.P.; Zhang, C.; Ji, Y.P. Glacier changes from 1966–2009 in the Gongga Mountains, on the south-eastern margin of the Qinghai-Tibetan Plateau and their climatic forcing. Cryosphere 2012, 6, 1087–1101. [Google Scholar] [CrossRef] [Green Version]
- Paul, F.; Barrand, N.; Baumann, S.; Berthier, E.; Bolch, T.; Casey, K.; Frey, H.; Joshi, S.; Konovalov, V.; Le Bris, R.; et al. On the accuracy of glacier outlines derived from remote-sensing data. Ann. Glaciol. 2013, 54, 171–182. [Google Scholar] [CrossRef] [Green Version]
- Hanshaw, M.N.; Bookhagen, B. Glacial areas, lake areas, and snow lines from 1975 to 2012: Status of the Cordillera Vilcanota, including the Quelccaya Ice Cap, northern central Andes, Peru. Cryosphere 2014, 8, 359–376. [Google Scholar] [CrossRef] [Green Version]
- Kumar, P.; Saharwardi, S.; Banerjee, A.; Azam, M.F.; Dubey, A.K.; Murtugudde, R. Snowfall Variability Dictates Glacier Mass Balance Variability in Himalaya-Karakoram. Sci. Rep. 2019, 9, 18192. [Google Scholar] [CrossRef] [PubMed] [Green Version]
- Osmonov, A.; Bolch, T.; Xi, C.; Kurban, A.; Guo, W. Glacier characteristics and changes in the Sary-Jaz River Basin (Central Tien Shan, Kyrgyzstan)—1990–2010. Remote Sens. Lett. 2013, 4, 725–734. [Google Scholar] [CrossRef] [Green Version]
- Narama, C.; Kääb, A.; Duishonakunov, M.; Abdrakhmatov, K. Spatial variability of recent glacier area changes in the Tien Shan Mountains, Central Asia, using Corona (~1970), Landsat (~2000), and ALOS (~2007) satellite data. Glob. Planet. Chang. 2010, 71, 42–54. [Google Scholar] [CrossRef]
- Zhang, Z.; Xu, J.L.; Liu, S.Y.; Guo, W.Q.; Wei, J.F.; Feng, T. Glacier changes since the early 1960s, eastern Pamir, China. J. Mt. Sci. 2016, 13, 276–291. [Google Scholar] [CrossRef]
- Zeng, L.; Yang, T.; Tian, H. Response of glacier variations in the eastern Pamirs plateau to climate change, during the last 40 years. J. Arid. Land Resour. Environ. 2013, 27, 144–150. [Google Scholar]
- Feng, T.; Liu, S.Y.; Xu, J.L.; Guo, W.; Wei, J.; Zhang, Z. Glacier changes of the Yarkant River Basin from 1968 to 2009 derived from the First and Second Glacier Inventories of China. J. Glaciol. Geocryol. 2015, 37, 1–13. (In Chinese) [Google Scholar]
- Li, B.; Zhu, A.-X.; Zhang, Y.; Pei, T.; Qin, C.-Z.; Zhou, C. Glacier change over the past four decades in the middle Chinese Tien Shan. J. Glaciol. 2006, 52, 425–432. [Google Scholar] [CrossRef] [Green Version]
- Bao, W.-J.; Liu, S.-Y.; Wei, J.-F.; Guo, W.-Q. Glacier changes during the past 40 years in the West Kunlun Shan. J. Mt. Sci. 2015, 12, 344–357. [Google Scholar] [CrossRef]
- Li, C.X.; Yang, T.B.; Tian, H.Z. Variation of West Kunlun Mountains glacier during 1990–2011. Prog. Geogr. 2013, 32, 548–559. [Google Scholar] [CrossRef]
- Shangguan, D.; Liu, S.; Ding, Y.; Li, J.; Zhang, Y.; Ding, L.; Wang, X.; Xie, C.; Li, G. Glacier changes in the west Kunlun Shan from 1970 to 2001 derived from Landsat TM/ETM+ and Chinese glacier inventory data. Ann. Glaciol. 2007, 46, 204–208. [Google Scholar] [CrossRef] [Green Version]
- Shi, Y.; Shen, Y.; Kang, E.; Li, D.; Ding, Y.; Zhang, G.; Hu, R. Recent and Future Climate Change in Northwest China. Clim. Chang. 2006, 80, 379–393. [Google Scholar] [CrossRef]
- Gao, J.; Williams, M.W.; Fu, X.; Wang, G.; Gong, T. Spatiotemporal distribution of snow in eastern Tibet and the response to climate change. Remote Sens. Environ. 2012, 121, 1–9. [Google Scholar] [CrossRef]
- Krysanova, V.; Wortmann, M.; Bolch, T.; Merz, B.; Duethmann, D.; Walter, J.; Huang, S.; Tong, J.; Buda, S.; Kundzewicz, Z. Analysis of current trends in climate parameters, river discharge and glaciers in the Aksu River basin (Central Asia). Hydrol. Sci. J. 2015, 60, 566–590. [Google Scholar] [CrossRef] [Green Version]
- Shen, S.S.P.; Yao, R.; Ngo, J.; Basist, A.M.; Thomas, N.; Yao, T. Characteristics of the Tibetan Plateau snow cover variations based on daily data during 1997–2011. Theor. Appl. Clim. 2015, 120, 445–453. [Google Scholar] [CrossRef]
- Tahir, A.A.; Adamowski, J.F.; Chevallier, P.; Haq, A.U.; Terzago, S. Comparative assessment of spatiotemporal snow cover changes and hydrological behavior of the Gilgit, Astore and Hunza River basins (Hindukush–Karakoram–Himalaya region, Pakistan). Theor. Appl. Clim. 2016, 128, 793–811. [Google Scholar] [CrossRef]
- Fan, Y.; Chen, Y.; Li, W. Increasing precipitation and baseflow in Aksu River since the 1950s. Quat. Int. 2014, 336, 26–34. [Google Scholar] [CrossRef]
- Wang, X.; Yang, T.; Xu, C.-Y.; Yong, B.; Shi, P. Understanding the discharge regime of a glacierized alpine catchment in the Tianshan Mountains using an improved HBV-D hydrological model. Glob. Planet. Chang. 2019, 172, 211–222. [Google Scholar] [CrossRef]
- Xu, M.; Wu, H.; Kang, S. Impacts of climate change on the discharge and glacier mass balance of the different glacierized watersheds in the Tianshan Mountains, Central Asia. Hydrol. Process. 2018, 32, 126–145. [Google Scholar] [CrossRef]
- Gao, X.; Ye, B.; Zhang, S.; Qiao, C.; Zhang, X. Glacier runoff variation and its influence on river runoff during 1961–2006 in the Tarim River Basin, China. Sci. China Earth Sci. 2010, 53, 880–891. [Google Scholar] [CrossRef]
- Wang, P.; Li, Z.; Li, H.; Zhang, Z.; Xu, L.; Yue, X. Glaciers in Xinjiang, China: Past Changes and Current Status. Water 2020, 12, 2367. [Google Scholar] [CrossRef]
- Farinotti, D.; Longuevergne, L.; Moholdt, G.; Duethmann, D.; Mölg, T.; Bolch, T.; Vorogushyn, S.; Güntner, A. Substantial glacier mass loss in the Tien Shan over the past 50 years. Nat. Geosci. 2015, 8, 716–722. [Google Scholar] [CrossRef]
- Yi, S.; Sun, W. Evaluation of glacier changes in high-mountain Asia based on 10 year GRACE RL05 models. J. Geophys. Res. Solid Earth 2014, 119, 2504–2517. [Google Scholar] [CrossRef]
- Cogley, J.G.; Hock, R.; Rasmussen, L.A.; Arendt, A.A.; Bauder, A.; Braithwaite, R.J.; Jansson, P.; Kaser, G.; Möller, M.; Nicholson, L.; et al. Glossary of Glacier Mass Balance and Related Terms, IHP-VII Technical Documents in Hydrology No. 86; International Hydrological Programme: Paris, France, 2011. [Google Scholar]


| Products | Band Information (Only Used Bands Listed) | |||
|---|---|---|---|---|
| Name | Spatial Resolution (m) | Wavelength (nm) | Spectral Domain | |
| MOD09A1.006 Terra Surface Reflectance 8-Day Global 500 m | sur_refl_b02 | 500 | 841–876 | near-IR (NIR) |
| sur_refl_b04 | 500 | 545–565 | Green | |
| sur_refl_b06 | 500 | 1628–1652 | SWIR2 | |
| USGS Landsat 5 TM Surface Reflectance Tier 1 | B2 | 30 | 520–600 | Green |
| B4 | 30 | 760–900 | near-IR (NIR) | |
| B5 | 30 | 1550–1750 | SWIR1 | |
| USGS Landsat 8 OLI Surface Reflectance Tier 1 | B3 | 30 | 533–590 | Gree |
| B5 | 30 | 851–879 | near-IR (NIR) | |
| B6 | 30 | 1566–1651 | SWIR1 | |
| Name | L5-TM 2000 (km2) | MODIS-2000 (km2) | Relative Error of Estimate (%) | L8-OLI-2020 (km2) | MODIS-2020 (km2) | Relative Error of Estimate (%) |
|---|---|---|---|---|---|---|
| East Tien Shan | 254.00 | 303.04 | 19.31 | 179.00 | 148.91 | −16.81 |
| West Tien Shan | 6577.00 | 7477.16 | 13.69 | 6673.54 | 6503.41 | −2.55 |
| Pamir | 6846.21 | 6383.51 | −6.76 | 6403.00 | 5073.40 | −20.77 |
| West Kunlun | 17,436.76 | 16,052.64 | −7.94 | 12,631.38 | 11,079.11 | −12.29 |
| East Kunlun | 1935.02 | 1546.00 | −20.10 | 1046.66 | 981.83 | −6.19 |
| Subregion | Glacier Area Change | |||
|---|---|---|---|---|
| Period | Specific Region | Rate(%/a) | Reference | |
| East Tien Shan | 1990–2000 | −0.8 | [49] | |
| 2000–2020 | −2.98 | This study | ||
| West Tien Shan | 1970–2000 | Pskem region | −0.63 | [79] |
| 2000–2007 | −0.71 | [79] | ||
| 1975–2008 | Aksu Catchment | −0.11 | [6] | |
| 1956–2007 | Borkoldoy | −0.57 | [4] | |
| 1956–2007 | Naryntau | −1.00 | [4] | |
| 1975–2016 | Aksu River Basin | −0.63 | [19] | |
| 1986–2000 | Kaidu River Basin | −0.35 | [83] | |
| 1990–2010 | Sary-Jaz River Basin | −3.7 | [78] | |
| 2000–2010 | −0.51 | [79] | ||
| 2000–2010 | −0.22 | [49] | ||
| 2000–2010 | −0.73 | This study | ||
| 1990–2018 | −0.44 | [49] | ||
| 2000–2020 | −1.07 | This study | ||
| Pamir | 2000–2011s | East Pamirs | −0.05 | [81] |
| 1963–2009 | Pamirs in China | −0.24 | [80] | |
| 1968–2009 | Yarkant River Basin | −0.36 | [82] | |
| 2000–2010 | −0.39 | [49] | ||
| 2000–2010 | −0.46 | This study | ||
| 1990–2018 | −0.59 | [49] | ||
| 2000–2020 | −0.50 | This study | ||
| West Kunlun | 1970–2010 | −0.09 | [84] | |
| 1999–2011 | −0.07 | [85] | ||
| 2000–2010 | −2.8 | This study | ||
| 1990–2000 | 0.12 | [49] | ||
| 1990–2000 | 0.01 | [86] | ||
| 2000–2020 | −1.04 | This study | ||
| East Kunlun | 1990–2018 | −0.23 | [49] | |
| 2000–2020 | −0.81 | This study | ||
Publisher’s Note: MDPI stays neutral with regard to jurisdictional claims in published maps and institutional affiliations. |
© 2021 by the authors. Licensee MDPI, Basel, Switzerland. This article is an open access article distributed under the terms and conditions of the Creative Commons Attribution (CC BY) license (https://creativecommons.org/licenses/by/4.0/).
Share and Cite
Zhang, J.; Jia, L.; Menenti, M.; Zhou, J.; Ren, S. Glacier Area and Snow Cover Changes in the Range System Surrounding Tarim from 2000 to 2020 Using Google Earth Engine. Remote Sens. 2021, 13, 5117. https://doi.org/10.3390/rs13245117
Zhang J, Jia L, Menenti M, Zhou J, Ren S. Glacier Area and Snow Cover Changes in the Range System Surrounding Tarim from 2000 to 2020 Using Google Earth Engine. Remote Sensing. 2021; 13(24):5117. https://doi.org/10.3390/rs13245117
Chicago/Turabian StyleZhang, Jing, Li Jia, Massimo Menenti, Jie Zhou, and Shaoting Ren. 2021. "Glacier Area and Snow Cover Changes in the Range System Surrounding Tarim from 2000 to 2020 Using Google Earth Engine" Remote Sensing 13, no. 24: 5117. https://doi.org/10.3390/rs13245117
APA StyleZhang, J., Jia, L., Menenti, M., Zhou, J., & Ren, S. (2021). Glacier Area and Snow Cover Changes in the Range System Surrounding Tarim from 2000 to 2020 Using Google Earth Engine. Remote Sensing, 13(24), 5117. https://doi.org/10.3390/rs13245117