1. Introduction
Originating from synthetic aperture radar (SAR) [
1,
2,
3,
4,
5,
6,
7,
8,
9,
10], synthetic aperture sonar (SAS) [
11,
12,
13,
14,
15,
16] attracts investigators’ interests due to its high resolution in the underwater field. Nowadays, it is widely applied to underwater mapping [
14,
15,
17,
18], target recognition [
19,
20,
21,
22], and so on. Considering the traditional monostatic SAS system, the maximum imaged swath is determined by the pulse repetition frequency (PRF), and the low PRF allows for a wide swath. At the same time, the sampling of the along-track signal is conducted by this PRF. According to the sampling theorem, the PRF should be greater or equal to the Doppler bandwidth. When a too low PRF is exploited, there would be ambiguous targets in the SAS image as the along-track sampling with this low PFR does not satisfy the Nyquist-Shannon theorem [
23]. Generally speaking, the SAS system parameters are subject to a trade-off, as the along-track resolution is only improved at the cost of a decreased swath or vice versa. The inherent limitation of monostatic SAS between along-track resolution and cross-track swath demands the new SAS systems. One of the promising systems is the multi-receiver SAS, which employs a single transmitting element and a receiver array. This system can successfully overcome the limitations of the monostatic SAS system. With the multi-receiver SAS system, the echo signal can be sampled by multiple receiver elements [
24,
25,
26]. Consequently, the effective sampling rate of the along-track signal is increased while the transmitting PRF remains unaltered.
The high-resolution imagery introduced by the multi-receiver SAS system is obtained at the cost of increased complexity with respect to the processing of the multi-receiver SAS raw data. With monostatic SAS, the point target reference spectrum (PTRS) can be easily obtained based on the method of the stationary phase [
27]. However, the multi-receiver SAS system has many bistatic SAS systems [
28,
29]. Considering each bistatic SAS, the transmitter and receiver individually contribute to the two-way slant range. That is to say, the two-way slant range has double square rooted terms [
30]. Due to this reason, the point of the stationary phase (PSP) and PTRS cannot be analytically deduced based on the method of the stationary phase. To solve this problem, the phase center approximation (PCA) method [
31,
32,
33,
34,
35,
36] is used. With this method, a virtual element located midway between the transmitter and receiver transmits and receives the signal, and the two-way slant range with double square rooted terms can be coerced into a slant range with a single square rooted term. In [
31], the two-way slant range is directly approximated by the round-trip range between the virtual element and target. This operation neglects the PCA error introduced by the accurate two-way slant range and approximate range. When the distance between the transmitter and receiver is large, this operation leads to large errors. In [
32], the PCA error is considered. Furthermore, they also consider the stop-and-hop error [
37]. However, the stop-and-hop error is compensated for using the reference range from the transmitter to scene center. That is to say, the targets at the edge of the mapping swath would suffer from a large stop-and-hop error. Furthermore, the PCA error and stop-and-hop error are separately considered, and the coupling between both errors is neglected. In [
33], the PCA error is analytically deduced based on the imaging geometry. Unfortunately, the stop-and-hop error is not compensated. The distributed target would be distorted when the SAS system works with a wide swath. In [
34], the PCA idea is used two times. One is to obtain the phase center between transmitter and receiver under the case of the stop-and-hop assumption, and the other is to get the phase center between transmitter and receiver without the stop-and-hop assumption. After deducing the approximation error between the accurate range and approximated one, the PCA error and stop-and-hop error are deduced with a complicated expression. Bellettinis’ PCA error is directly used in [
35], where Pailhas et al. discuss the impact of temporal Doppler on SAS imagery. With their work, the temporal Doppler effect introduced by the sonar motion during signal transmission and reception is further discussed. However, the spatial Doppler introduced by sonar motion during signal transmission and reception is not considered. In this paper, the PCA method is still used. Compared to the method in [
33], the stop-and-hop error, together with the coupling between PCA error and stop-and-hop error, is considered in this paper. Compared to the method in [
34], we simplify the deduction of PCA error and stop-and-hop error based on second-order Taylor expansion and inverse Taylor expansion. Moreover, the presented model in this paper has a much better understanding. Compared to the method in [
35], we mainly consider the spatial Doppler introduced by stop-and-hop error and neglect the temporal Doppler effect, as it is not a dominant factor influencing the SAS imaging performance based on the experiment results in [
35]. For clarity, the PCA error is called the signal model error [
36] in this paper.
With the analytical PTRS, the range-Doppler (R-D) algorithm [
27,
38] cannot be directly developed yet. Based on the analytical PTRS, Taylor expansion should be further exploited. For traditional R-D algorithms, the PTRS should be individually expanded up to the first-order term [
39] and the second-order term [
40,
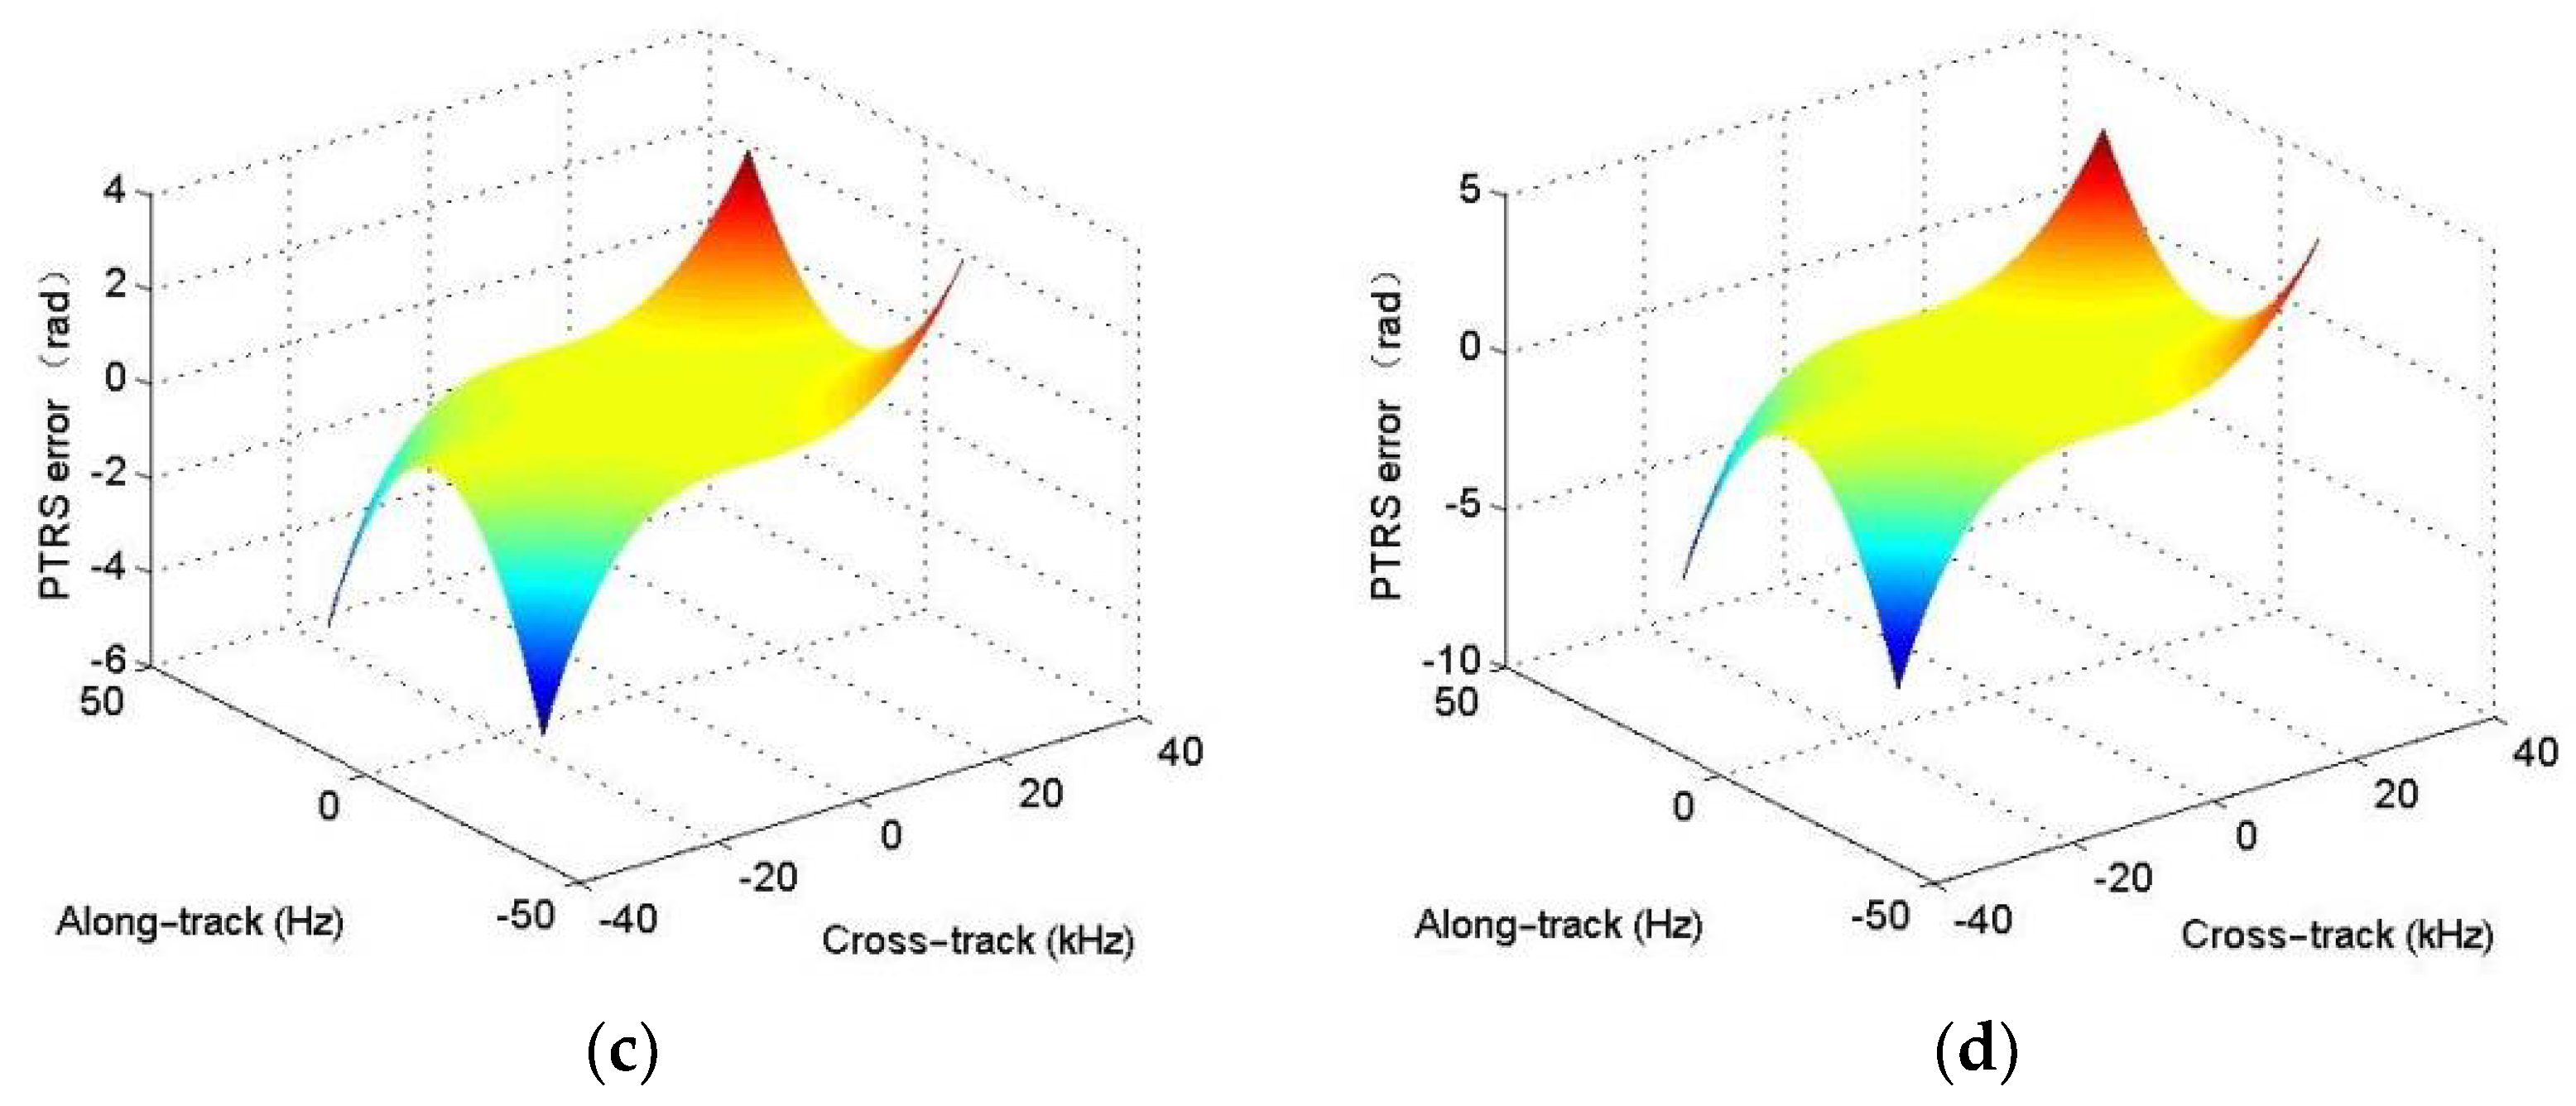
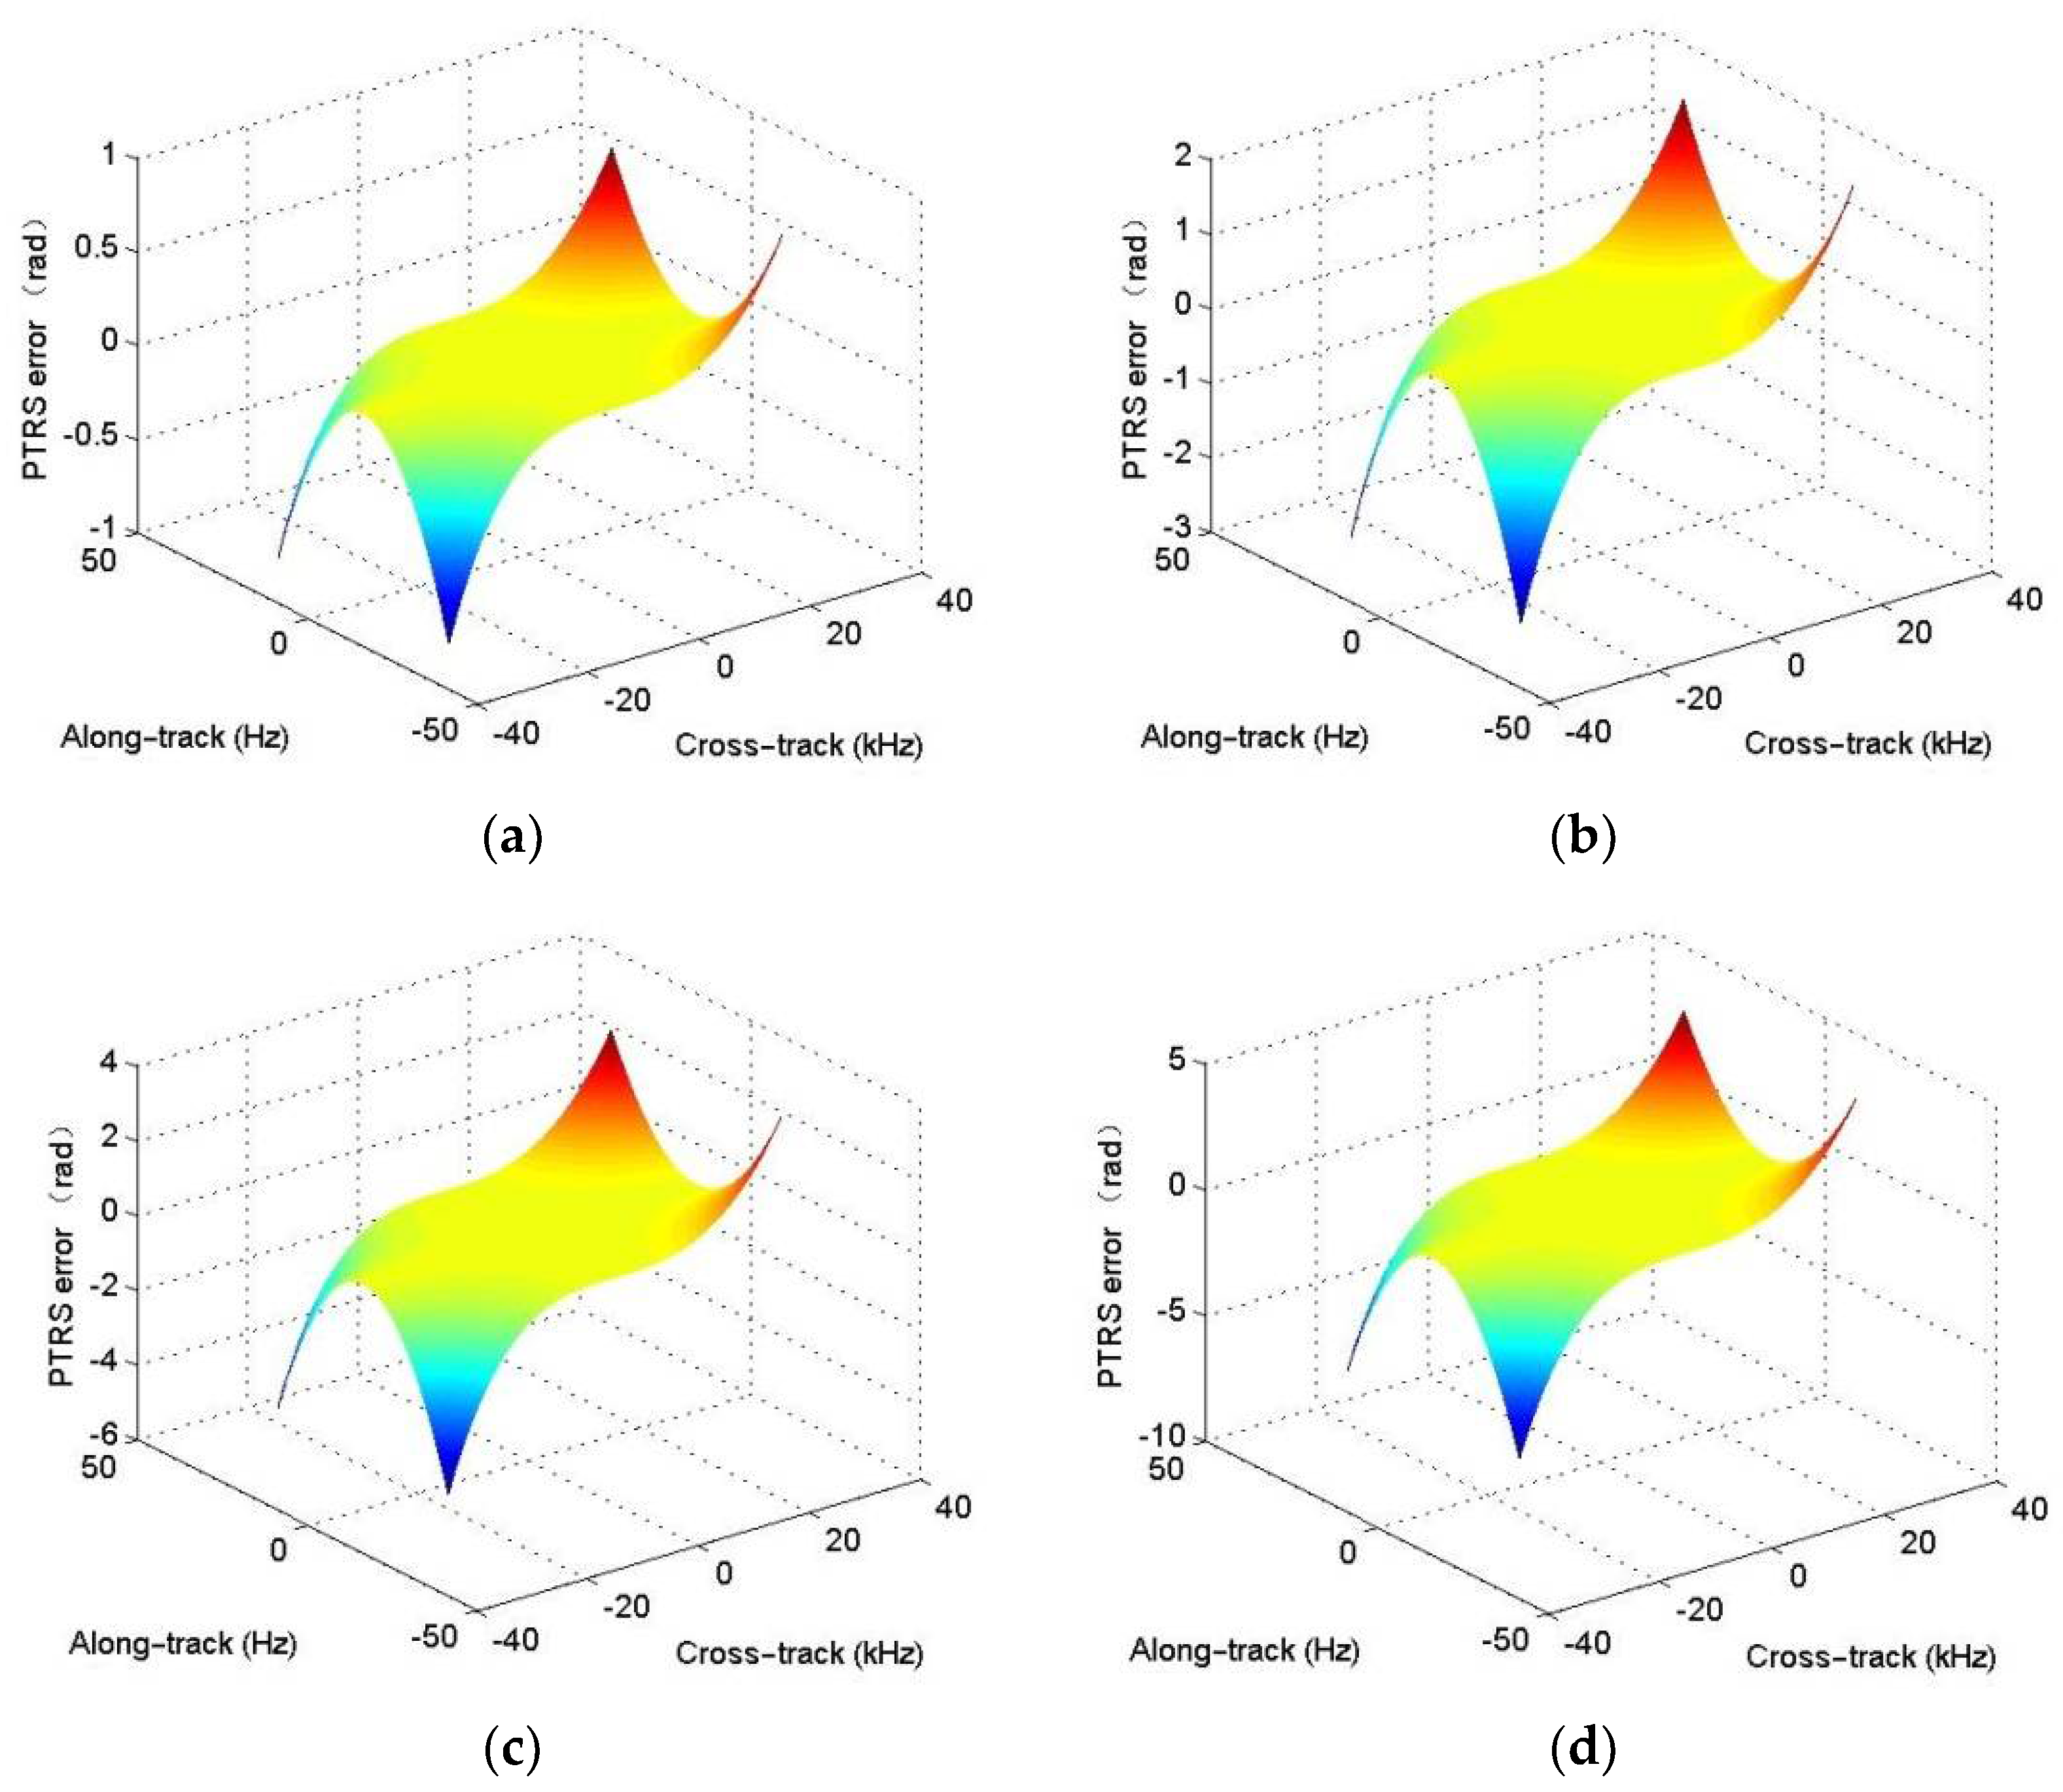
41] with respect to the instantaneous frequency. We find that the Taylor expansion of PTRS would also result in error, as the higher-order terms are all neglected. For clarity, we call it the PTRS error. The first-order term denotes the range cell migration (RCM) or the linear coupling between cross-track and along-track dimensions [
27]. The interpolator is often exploited to perform the RCM correction (RCMC). The second-order term denotes the quadratic coupling between cross-track and along-track dimensions [
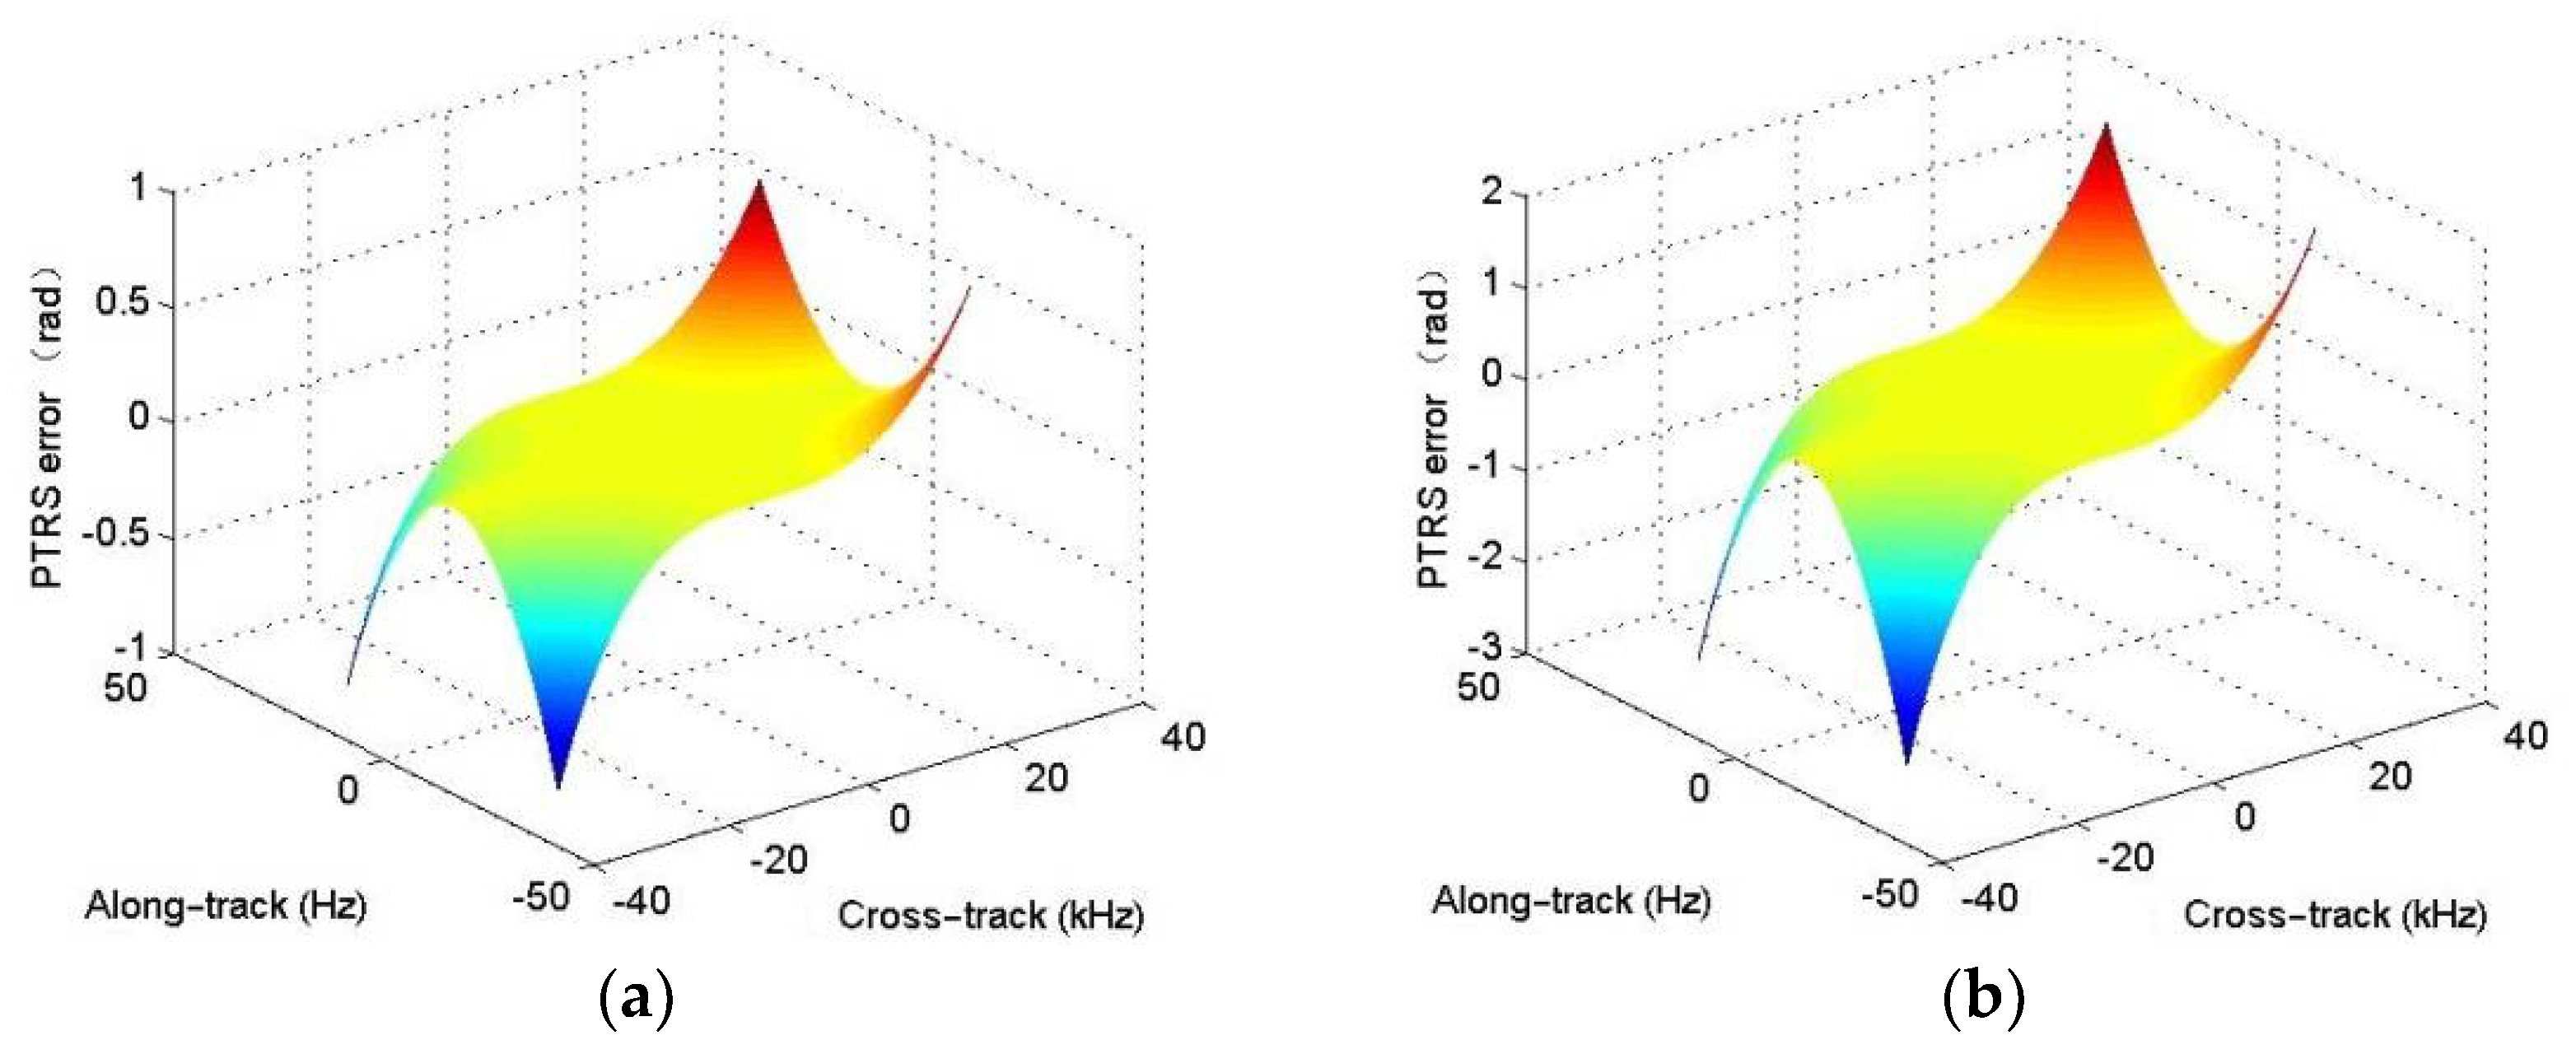
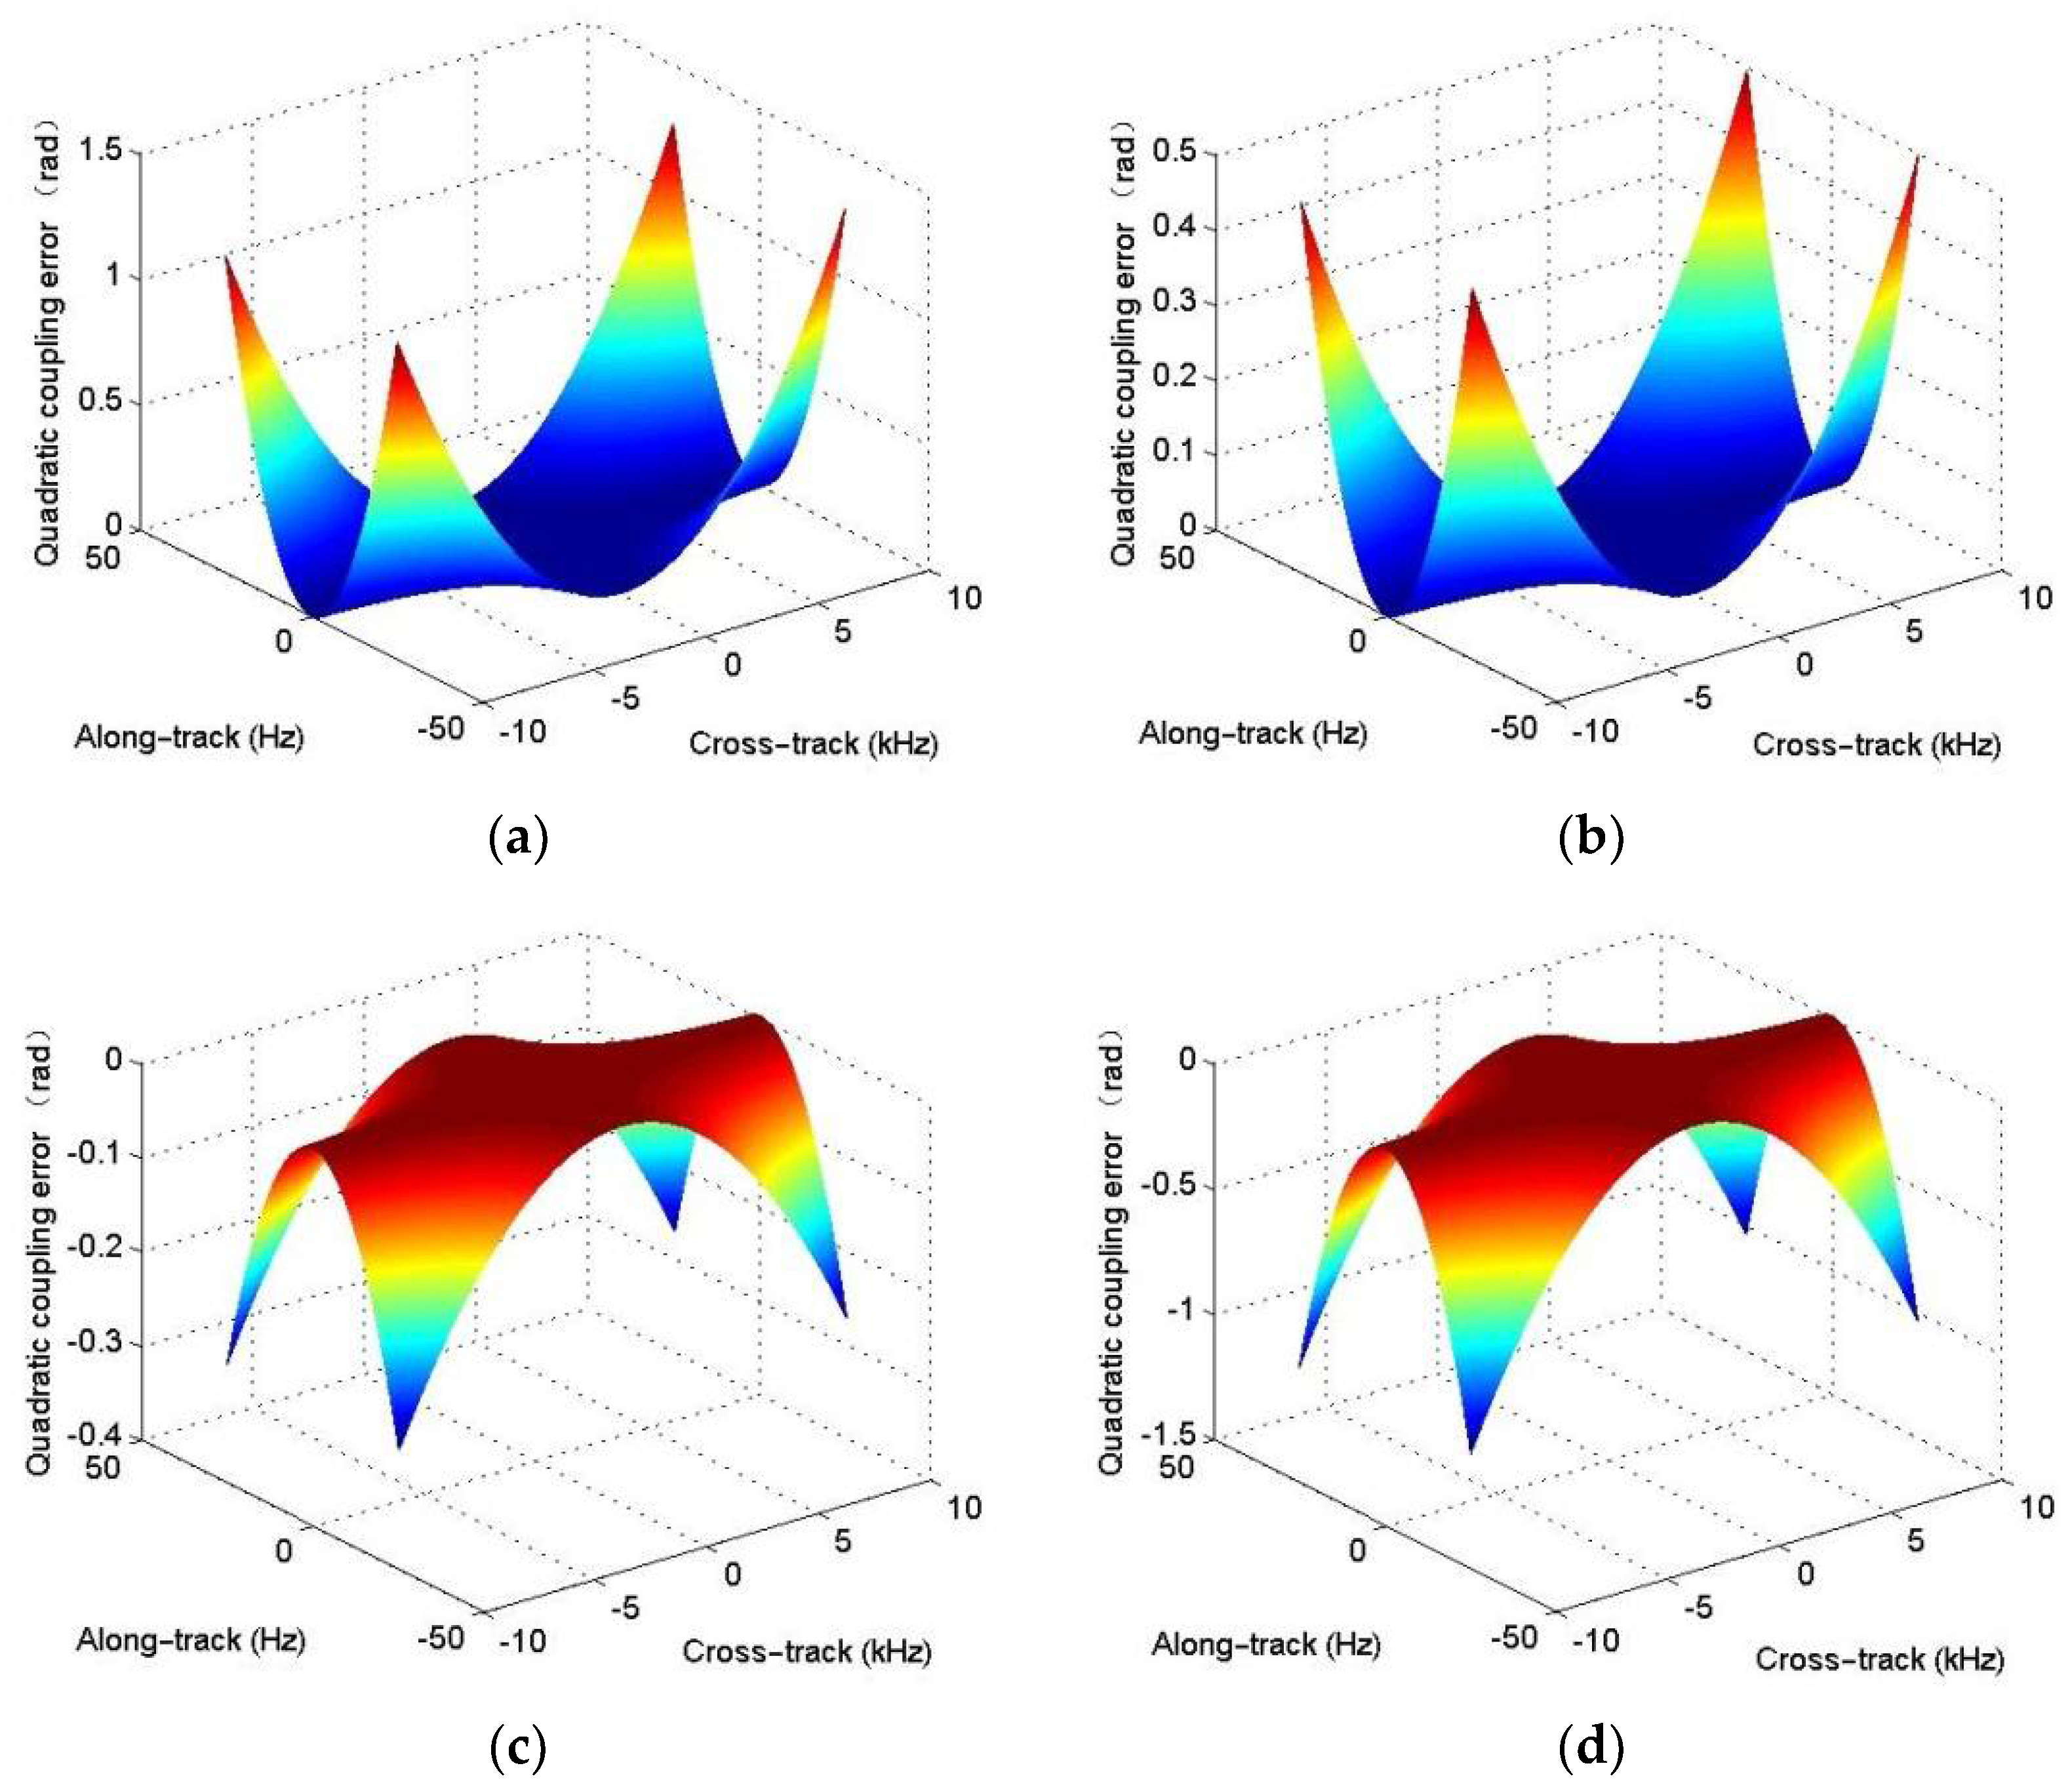
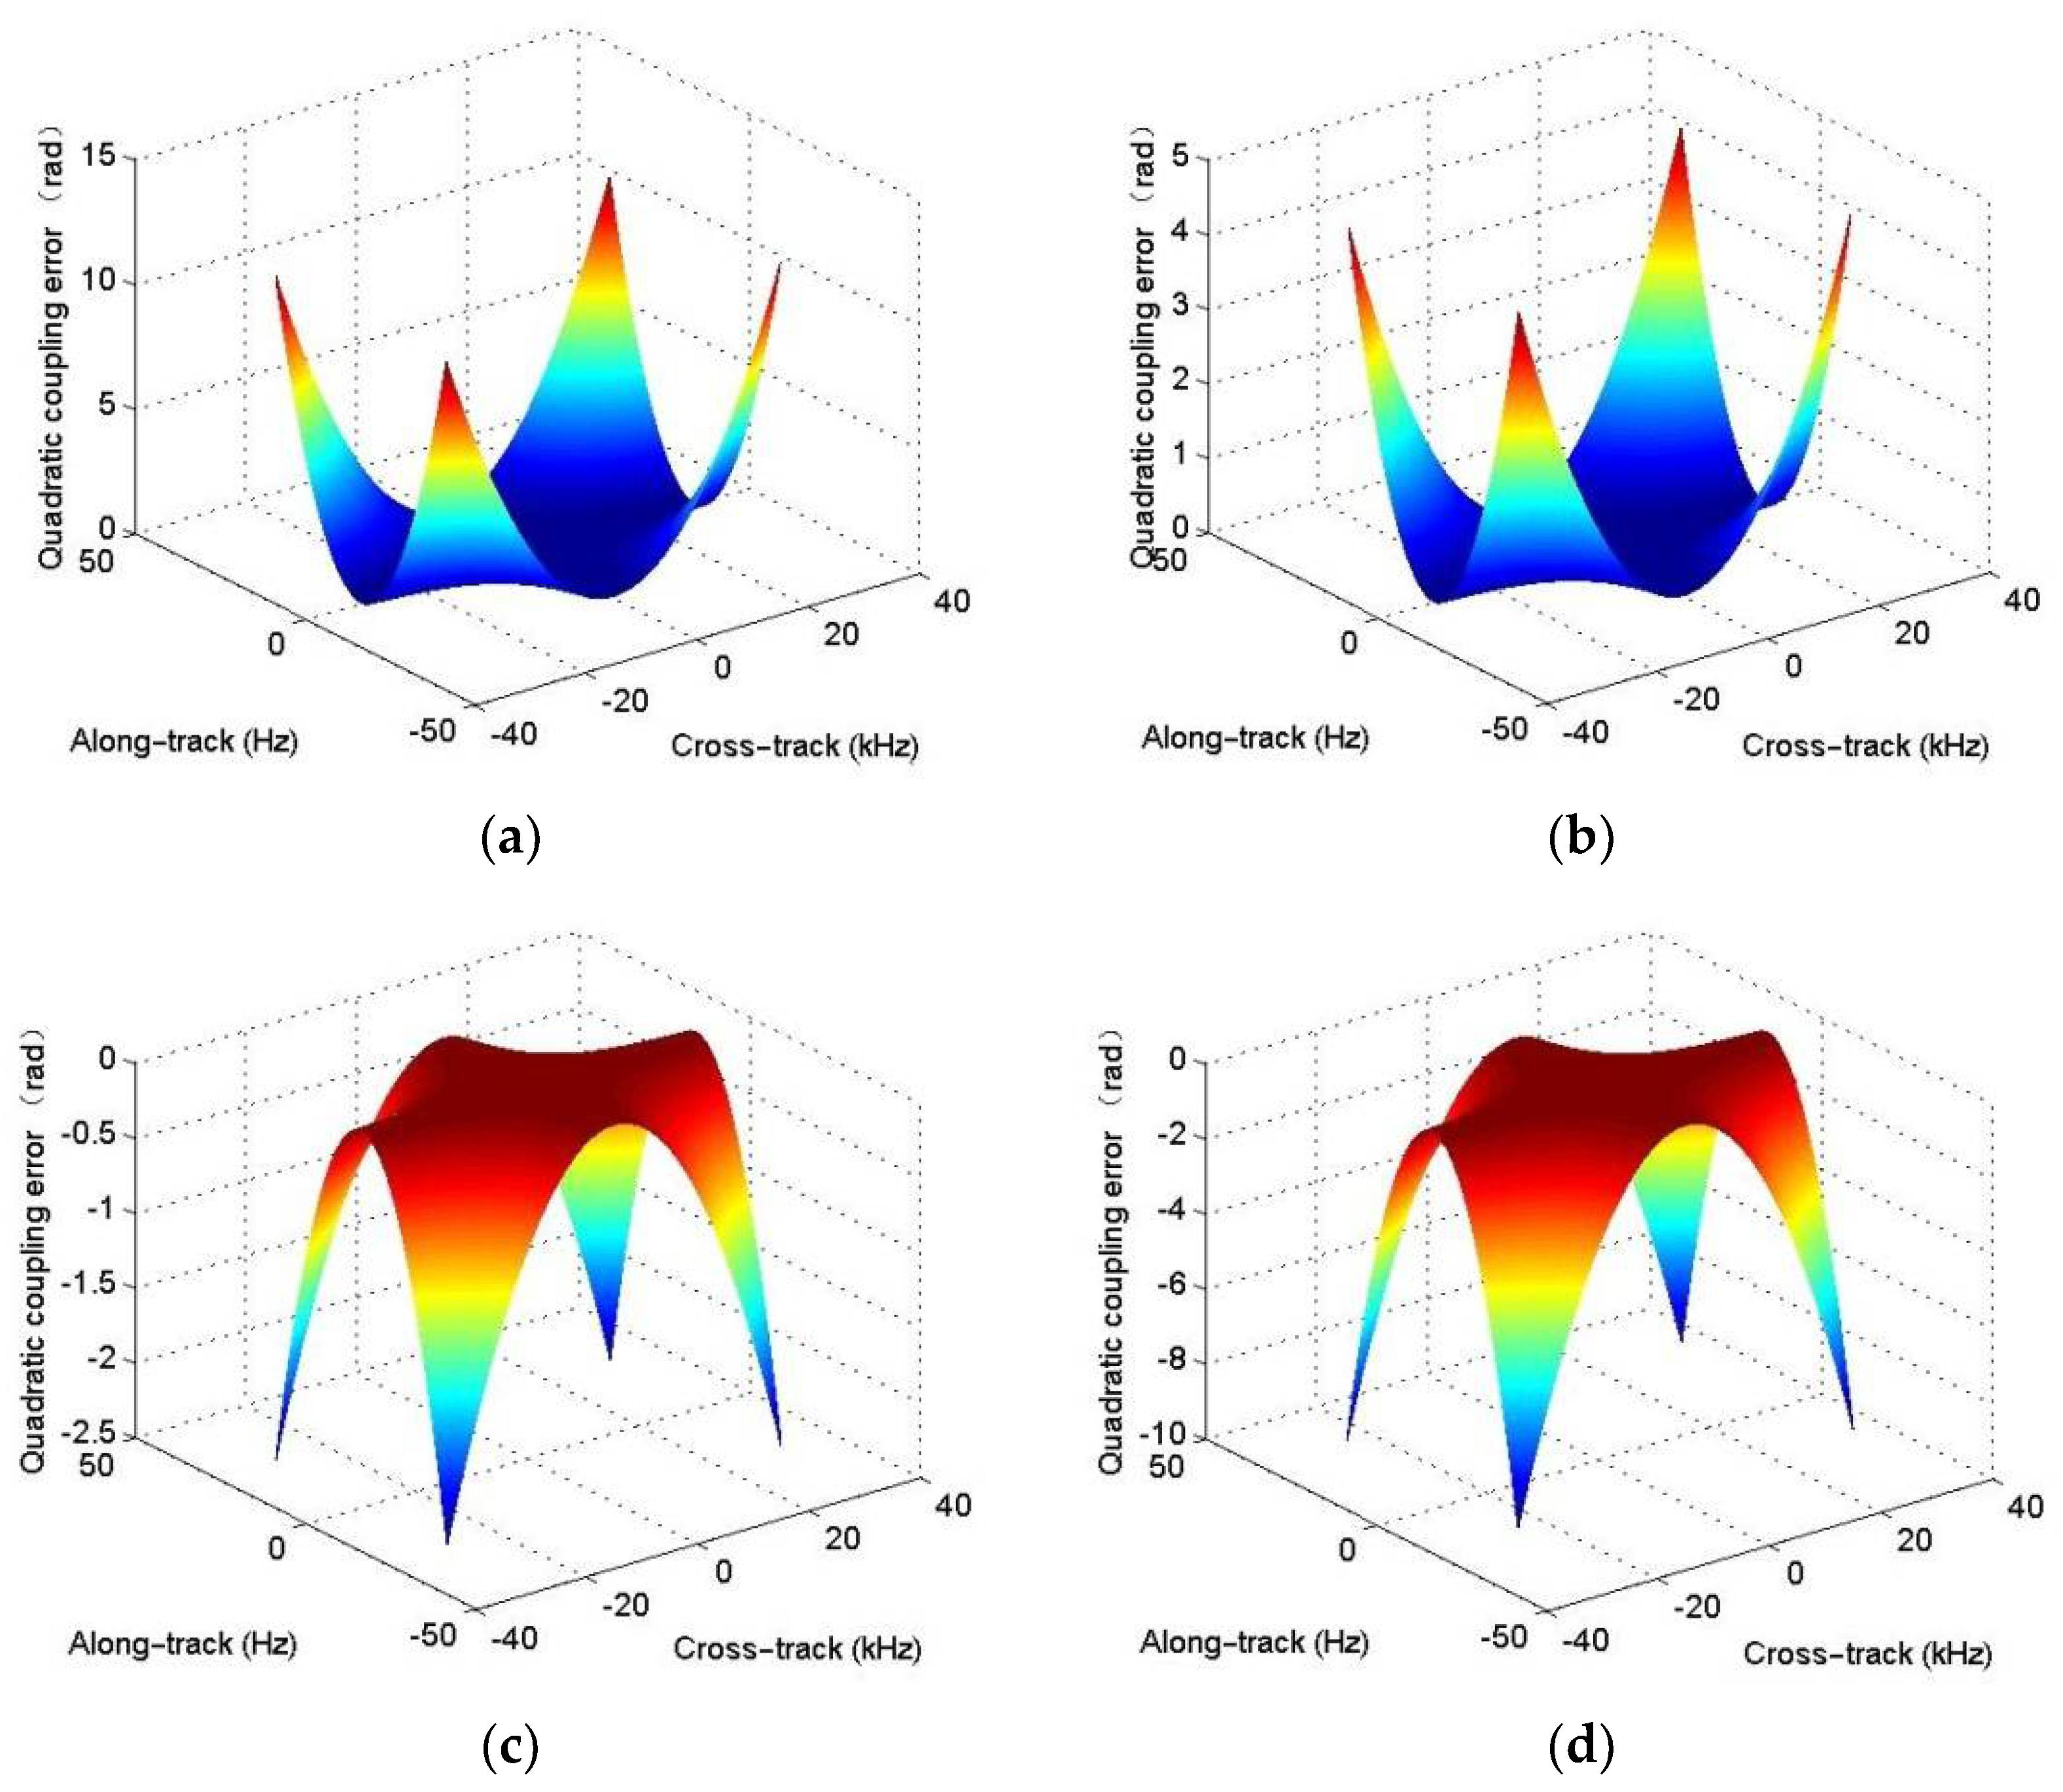
27]. It is equivalent to a chirp modulation in the cross-track dimension. However, the equivalent chirp rate highly depends on the range, instantaneous frequency, and Doppler frequency. That is to say, the equivalent chirp rate is a cross-track variant, and the cross-track variance is hard to compensate in the two-dimensional (2-D) frequency domain. For simplicity, the equivalent chirp rate at the reference range is often exploited when users conduct the R-D algorithm. With this operation, it is easily concluded that the targets not located at the reference range would suffer from residual quadratic coupling error, which would further affect the SAS focusing performance.
In general, the multi-receiver SAS R-D algorithm [
38] would suffer from three approximation errors, i.e., signal model error, PTRS error, and residual quadratic coupling error. The traditional R-D algorithm [
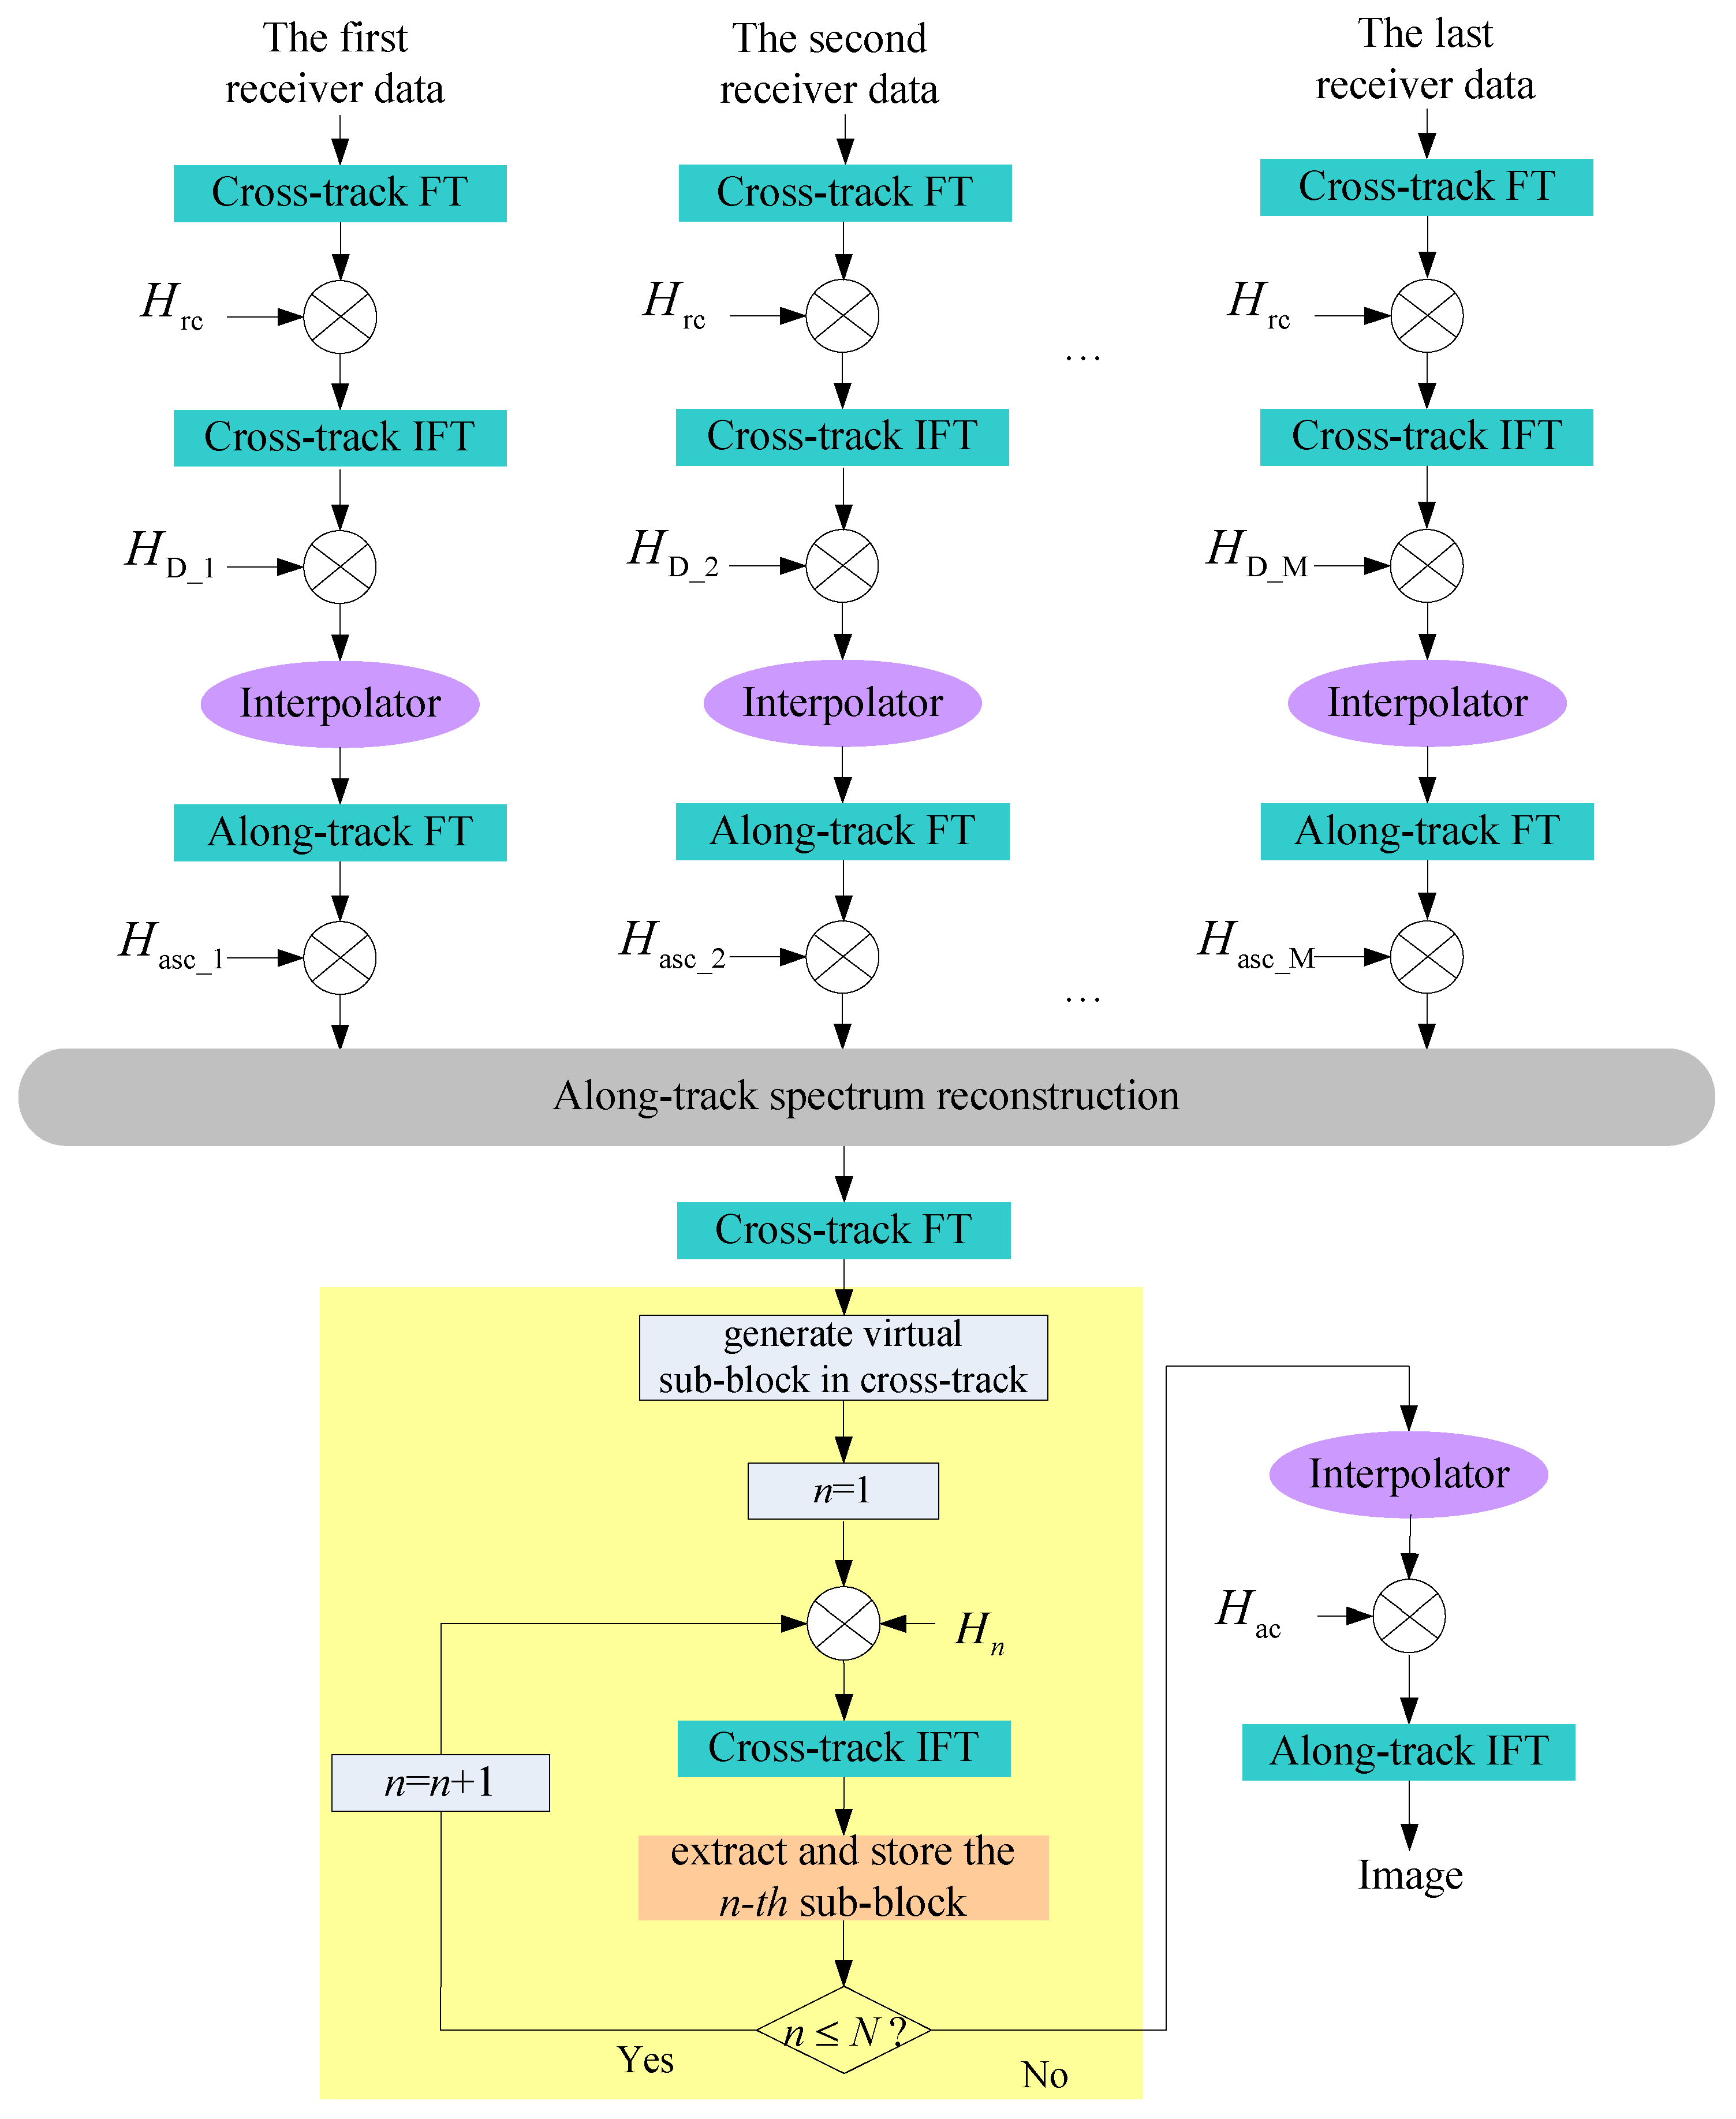
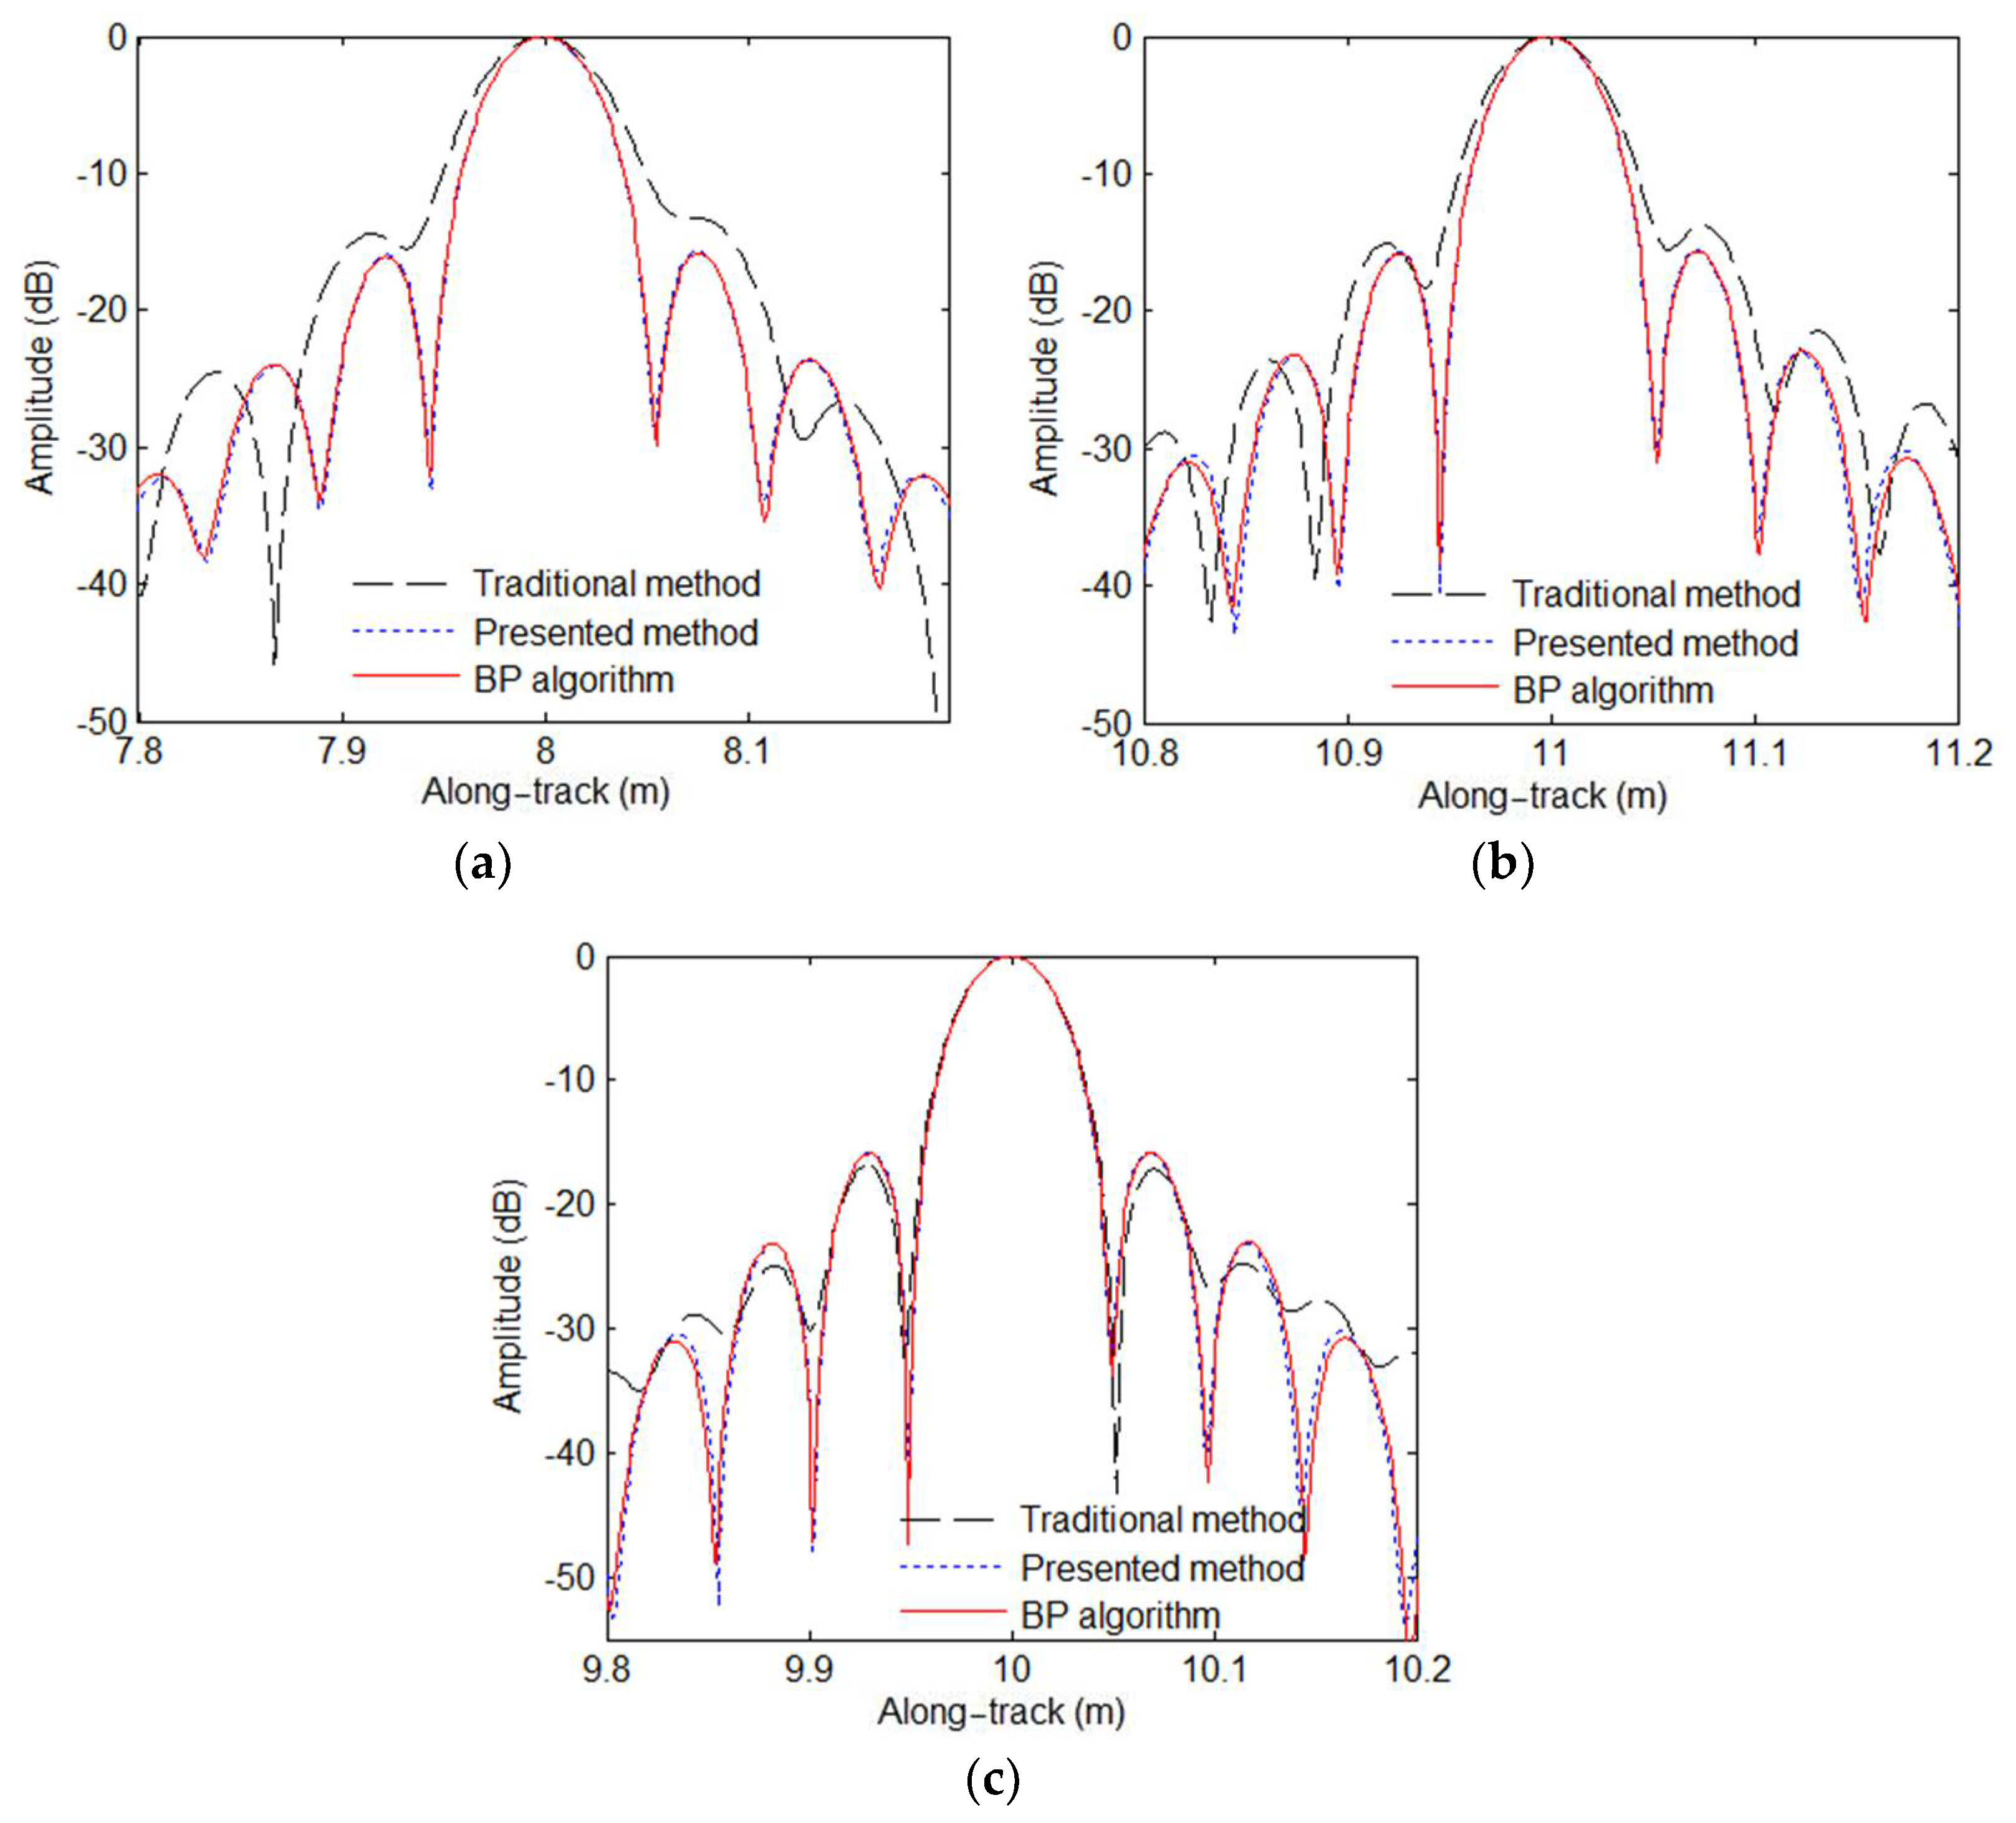
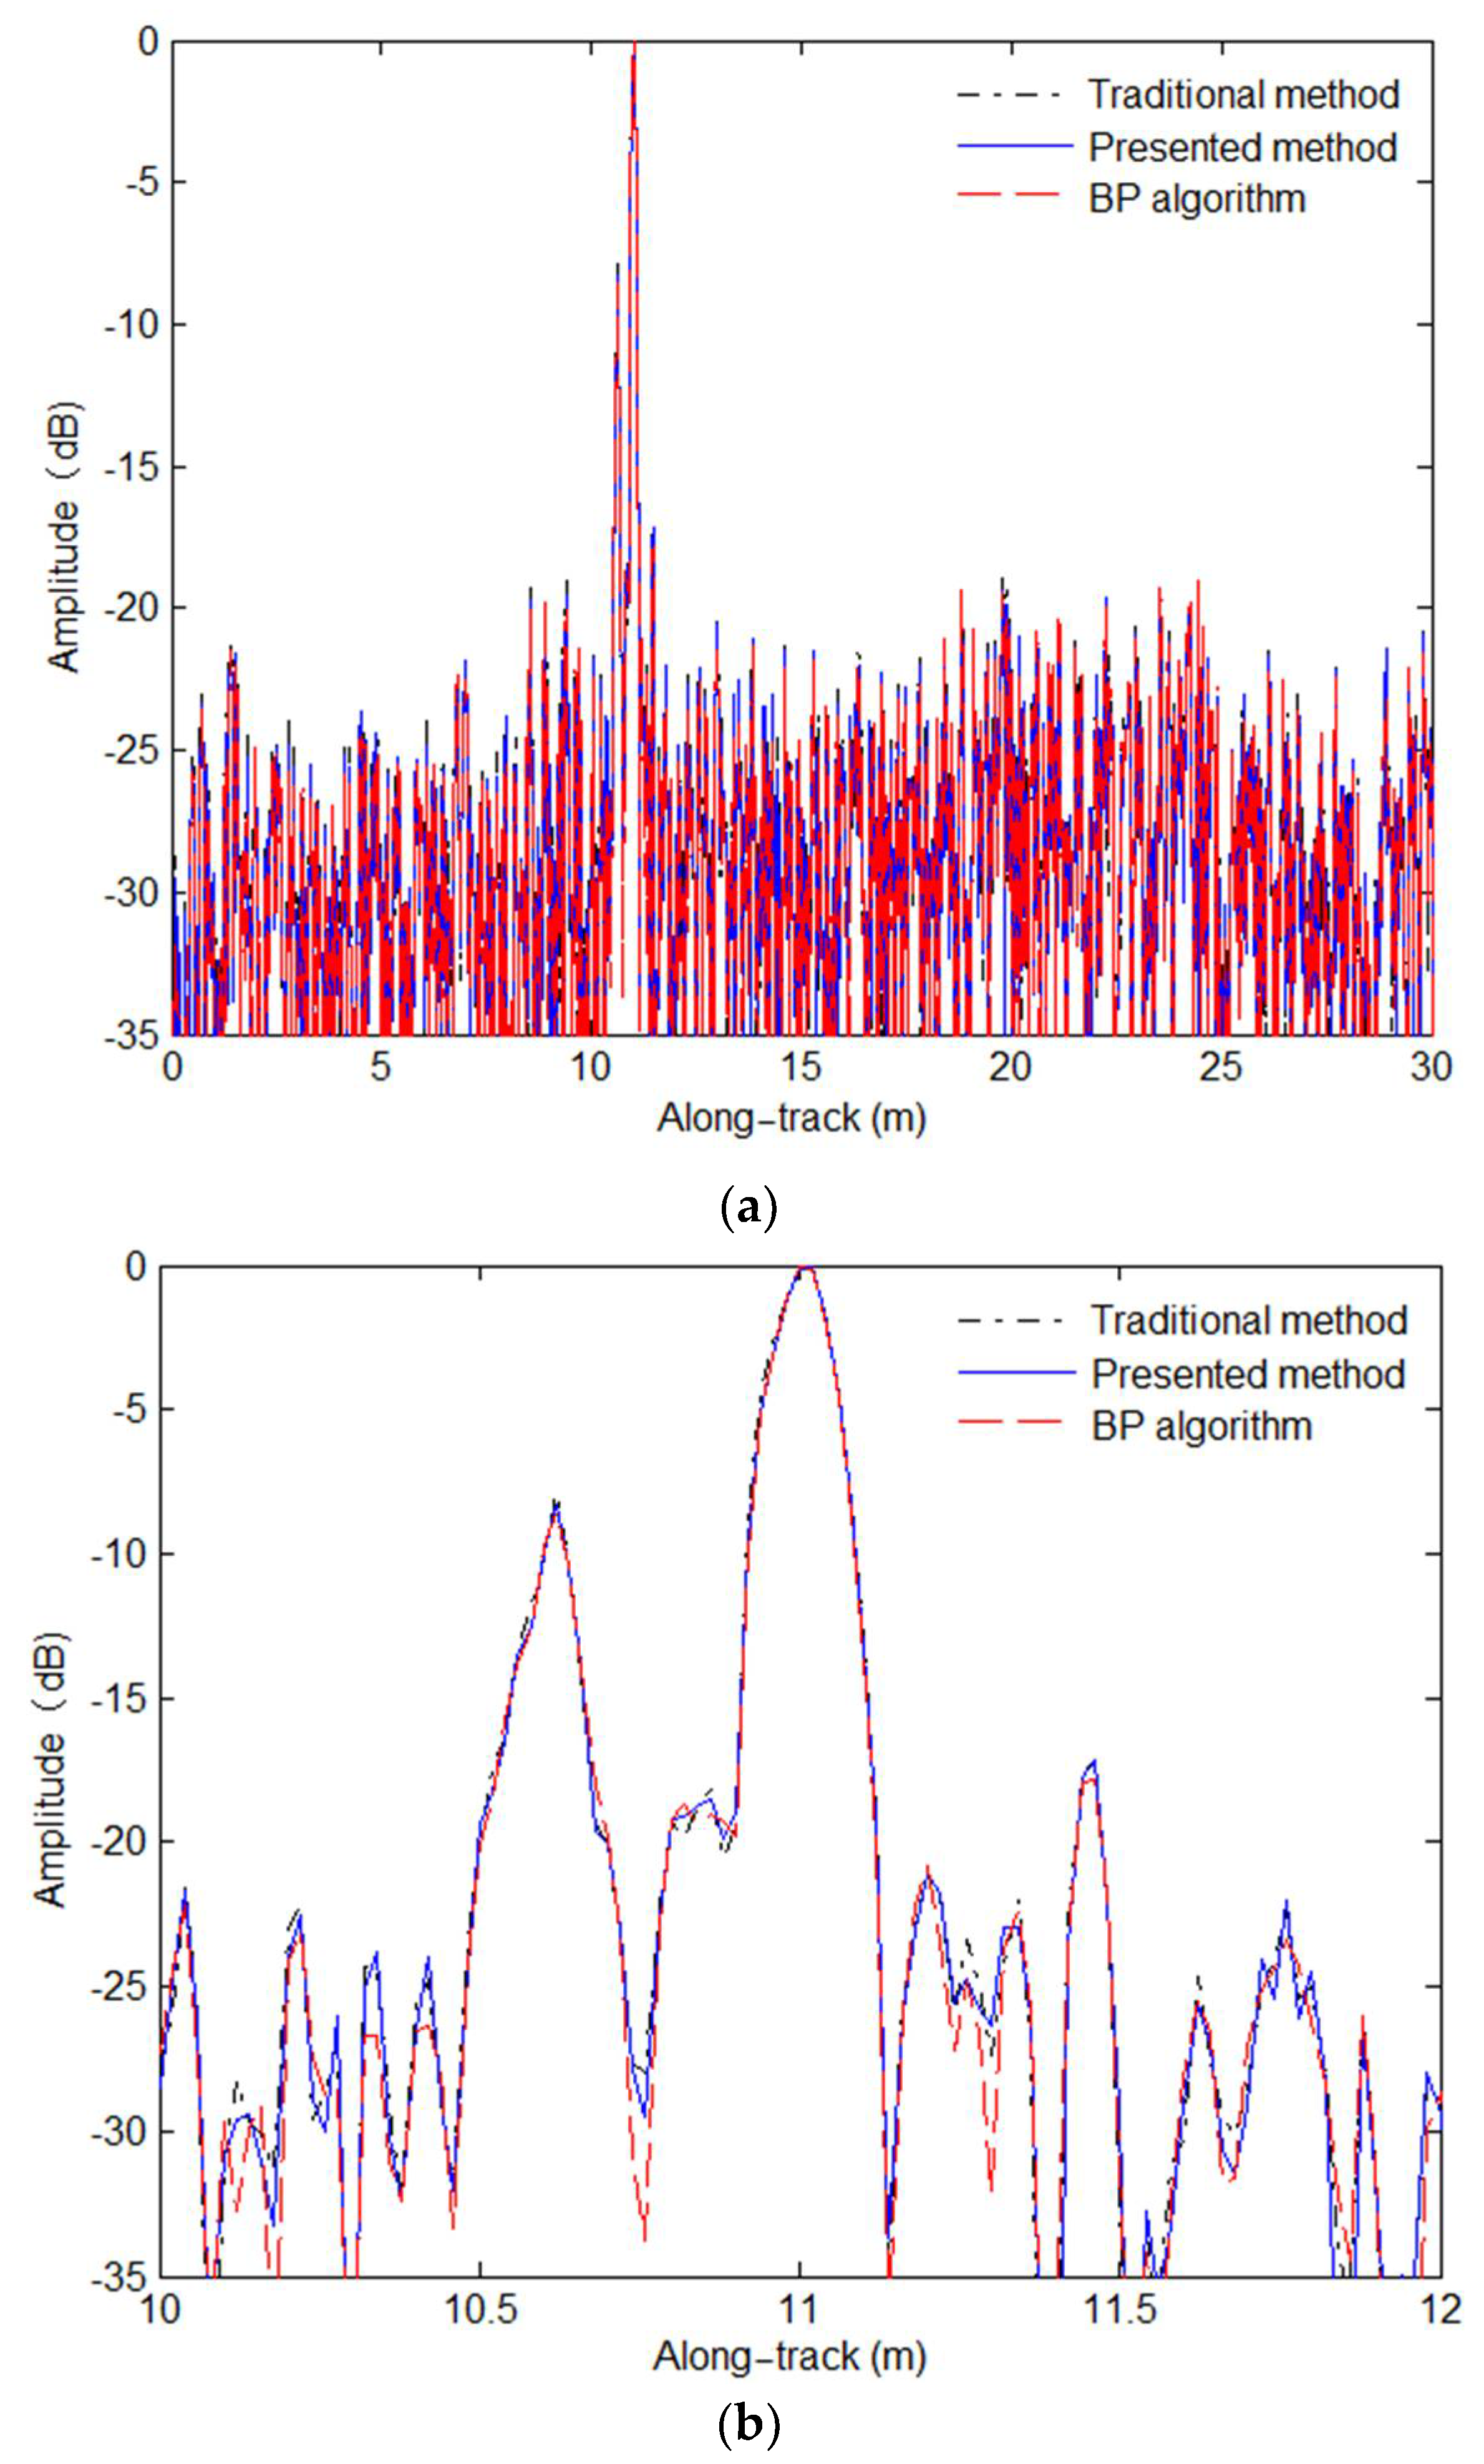
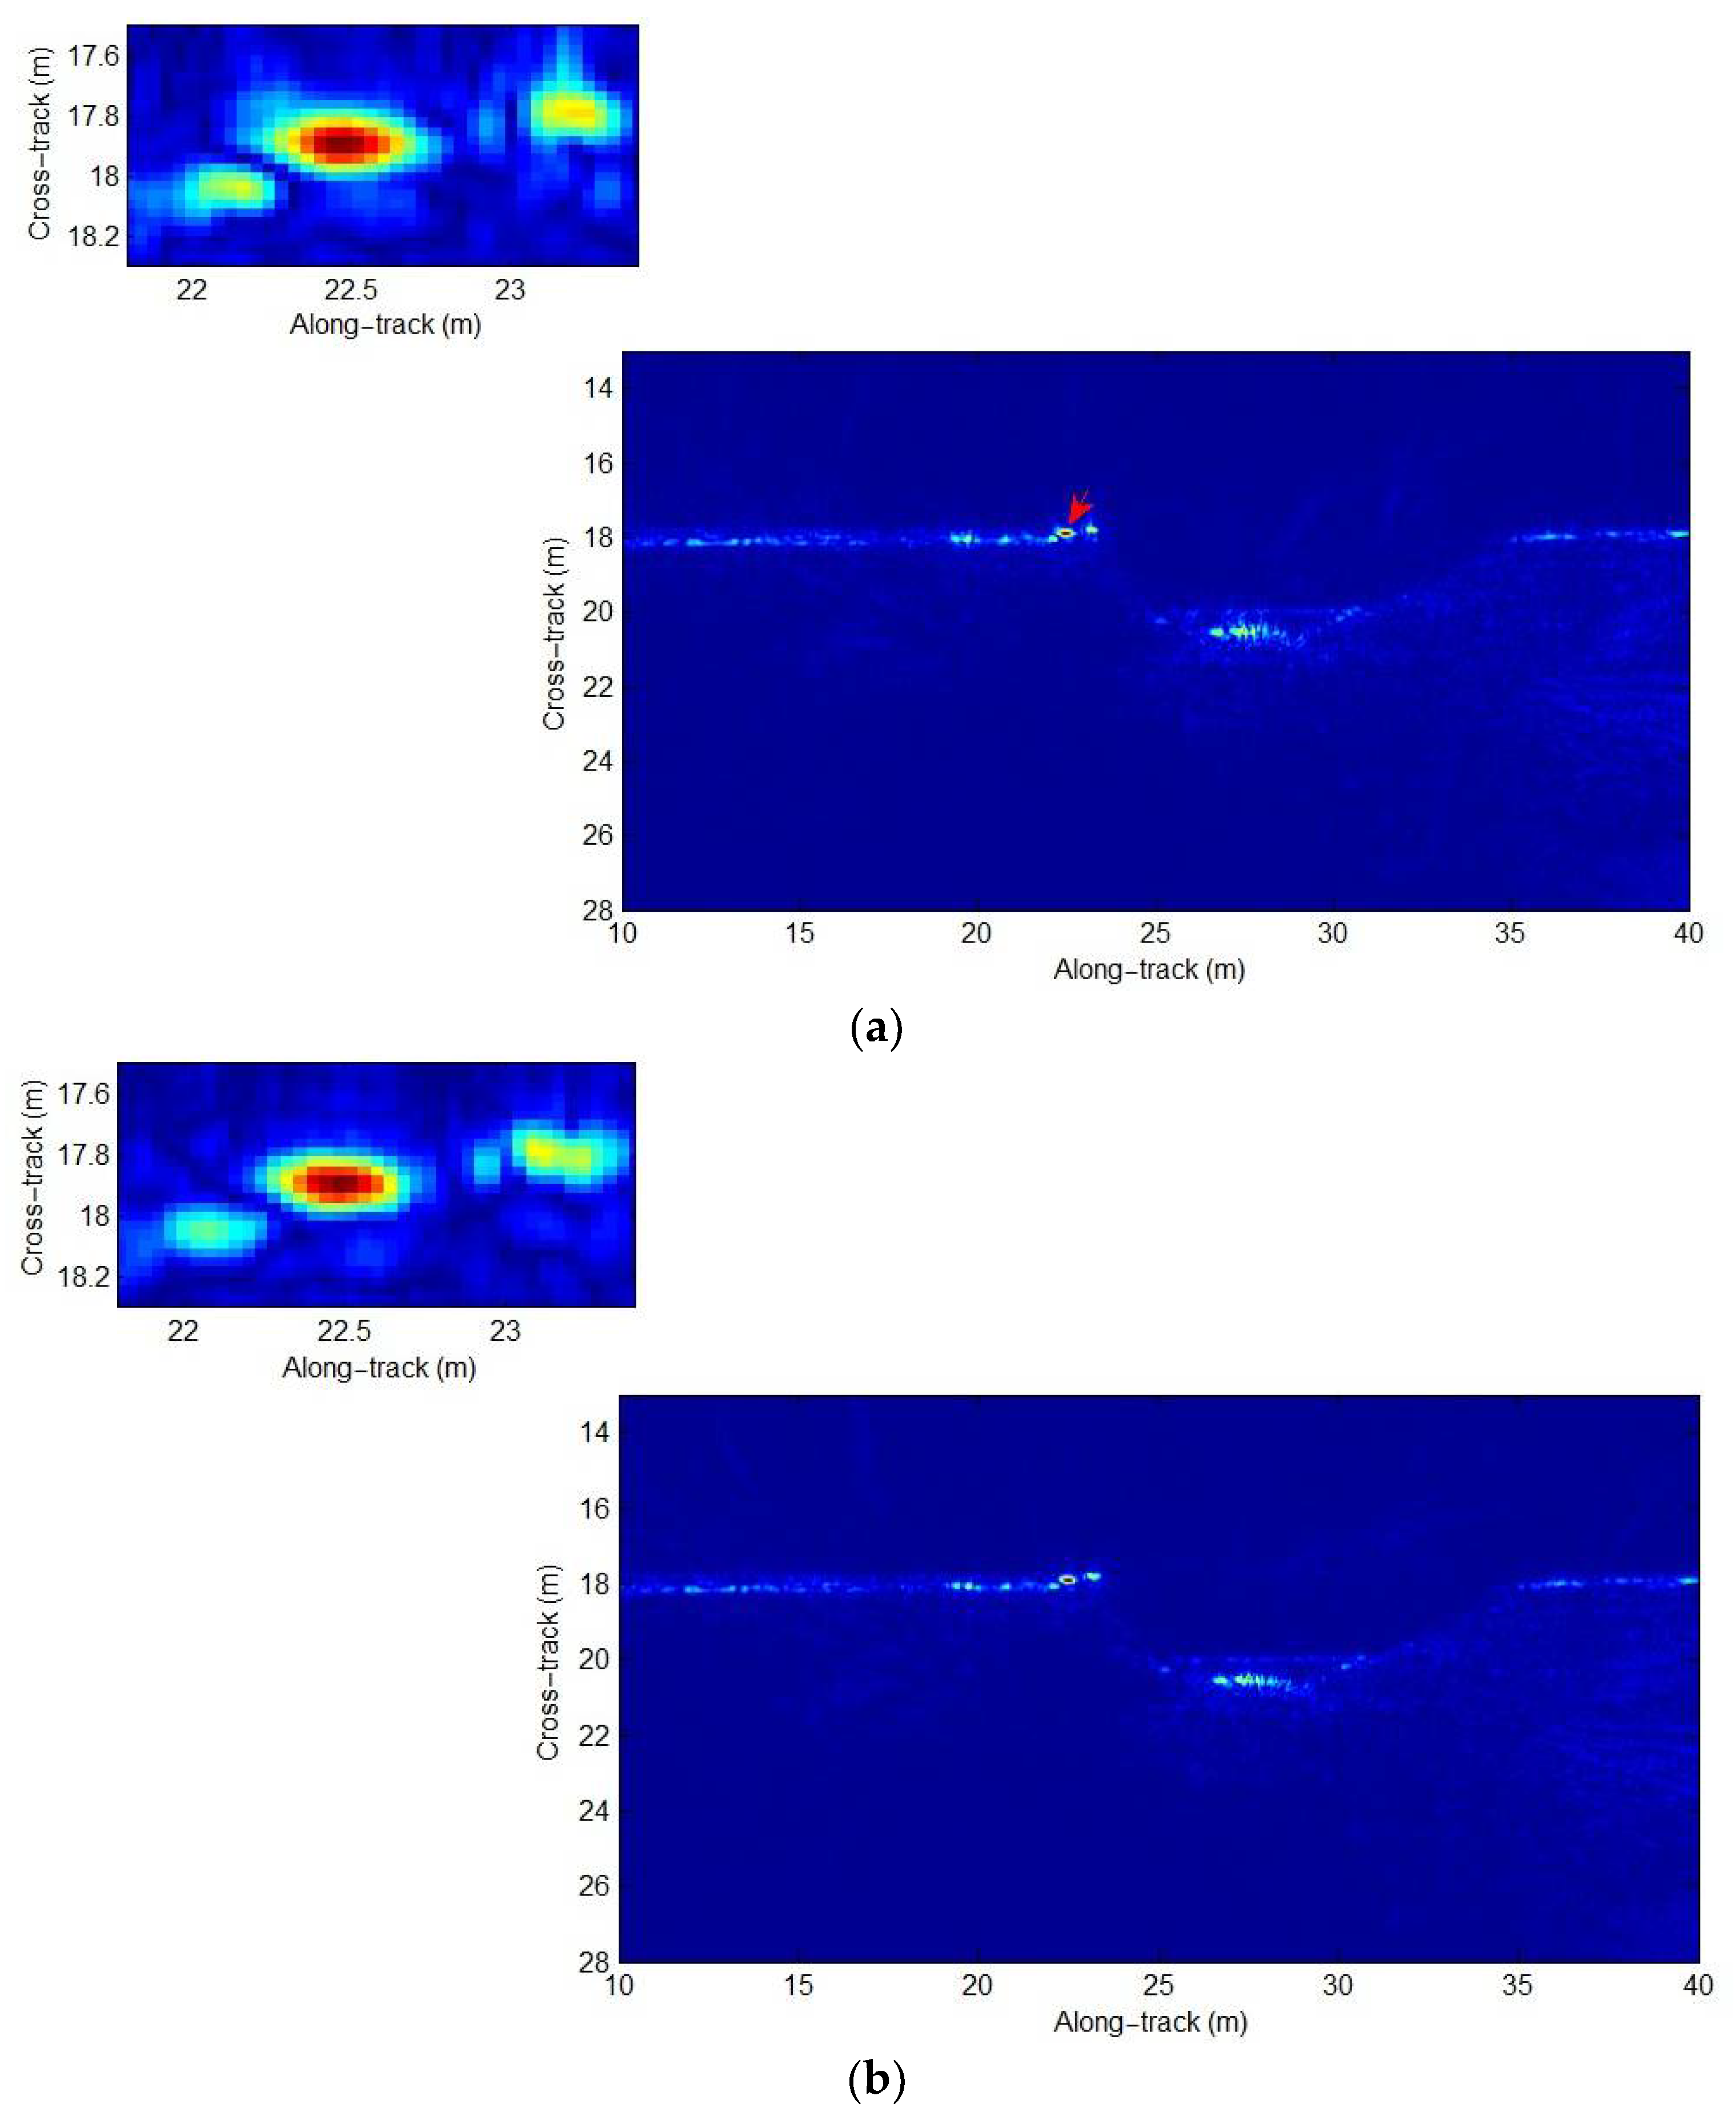
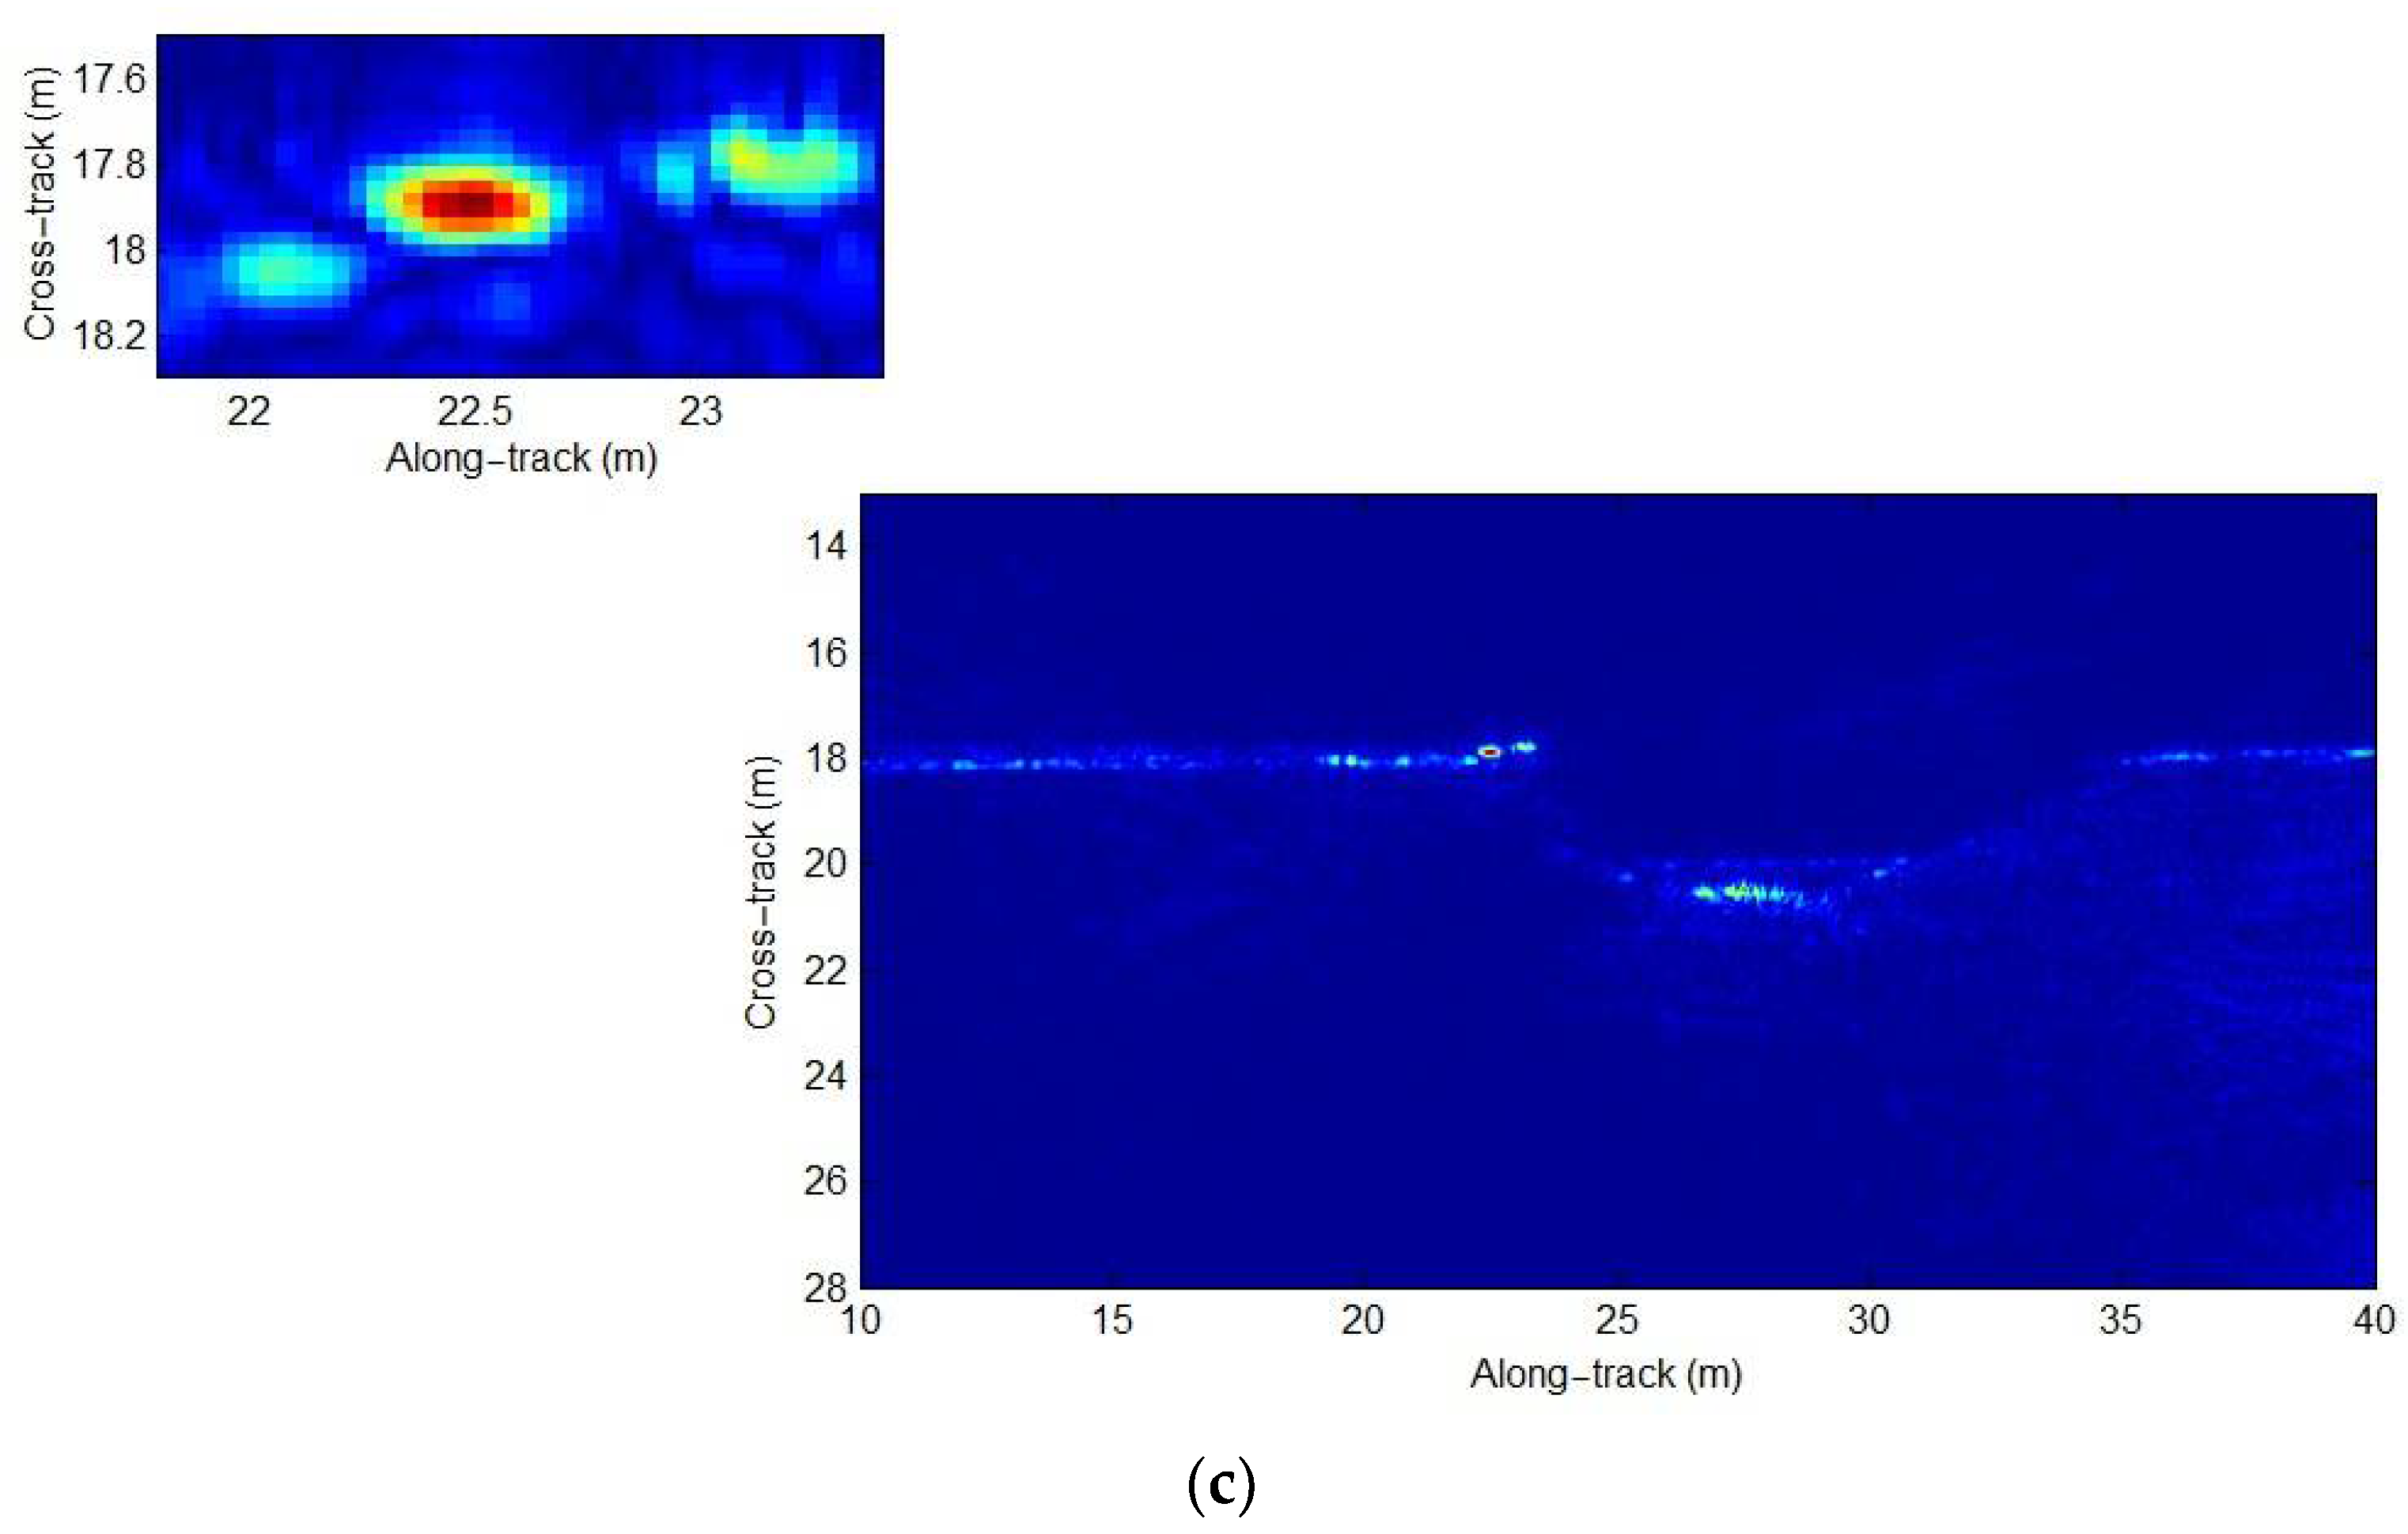
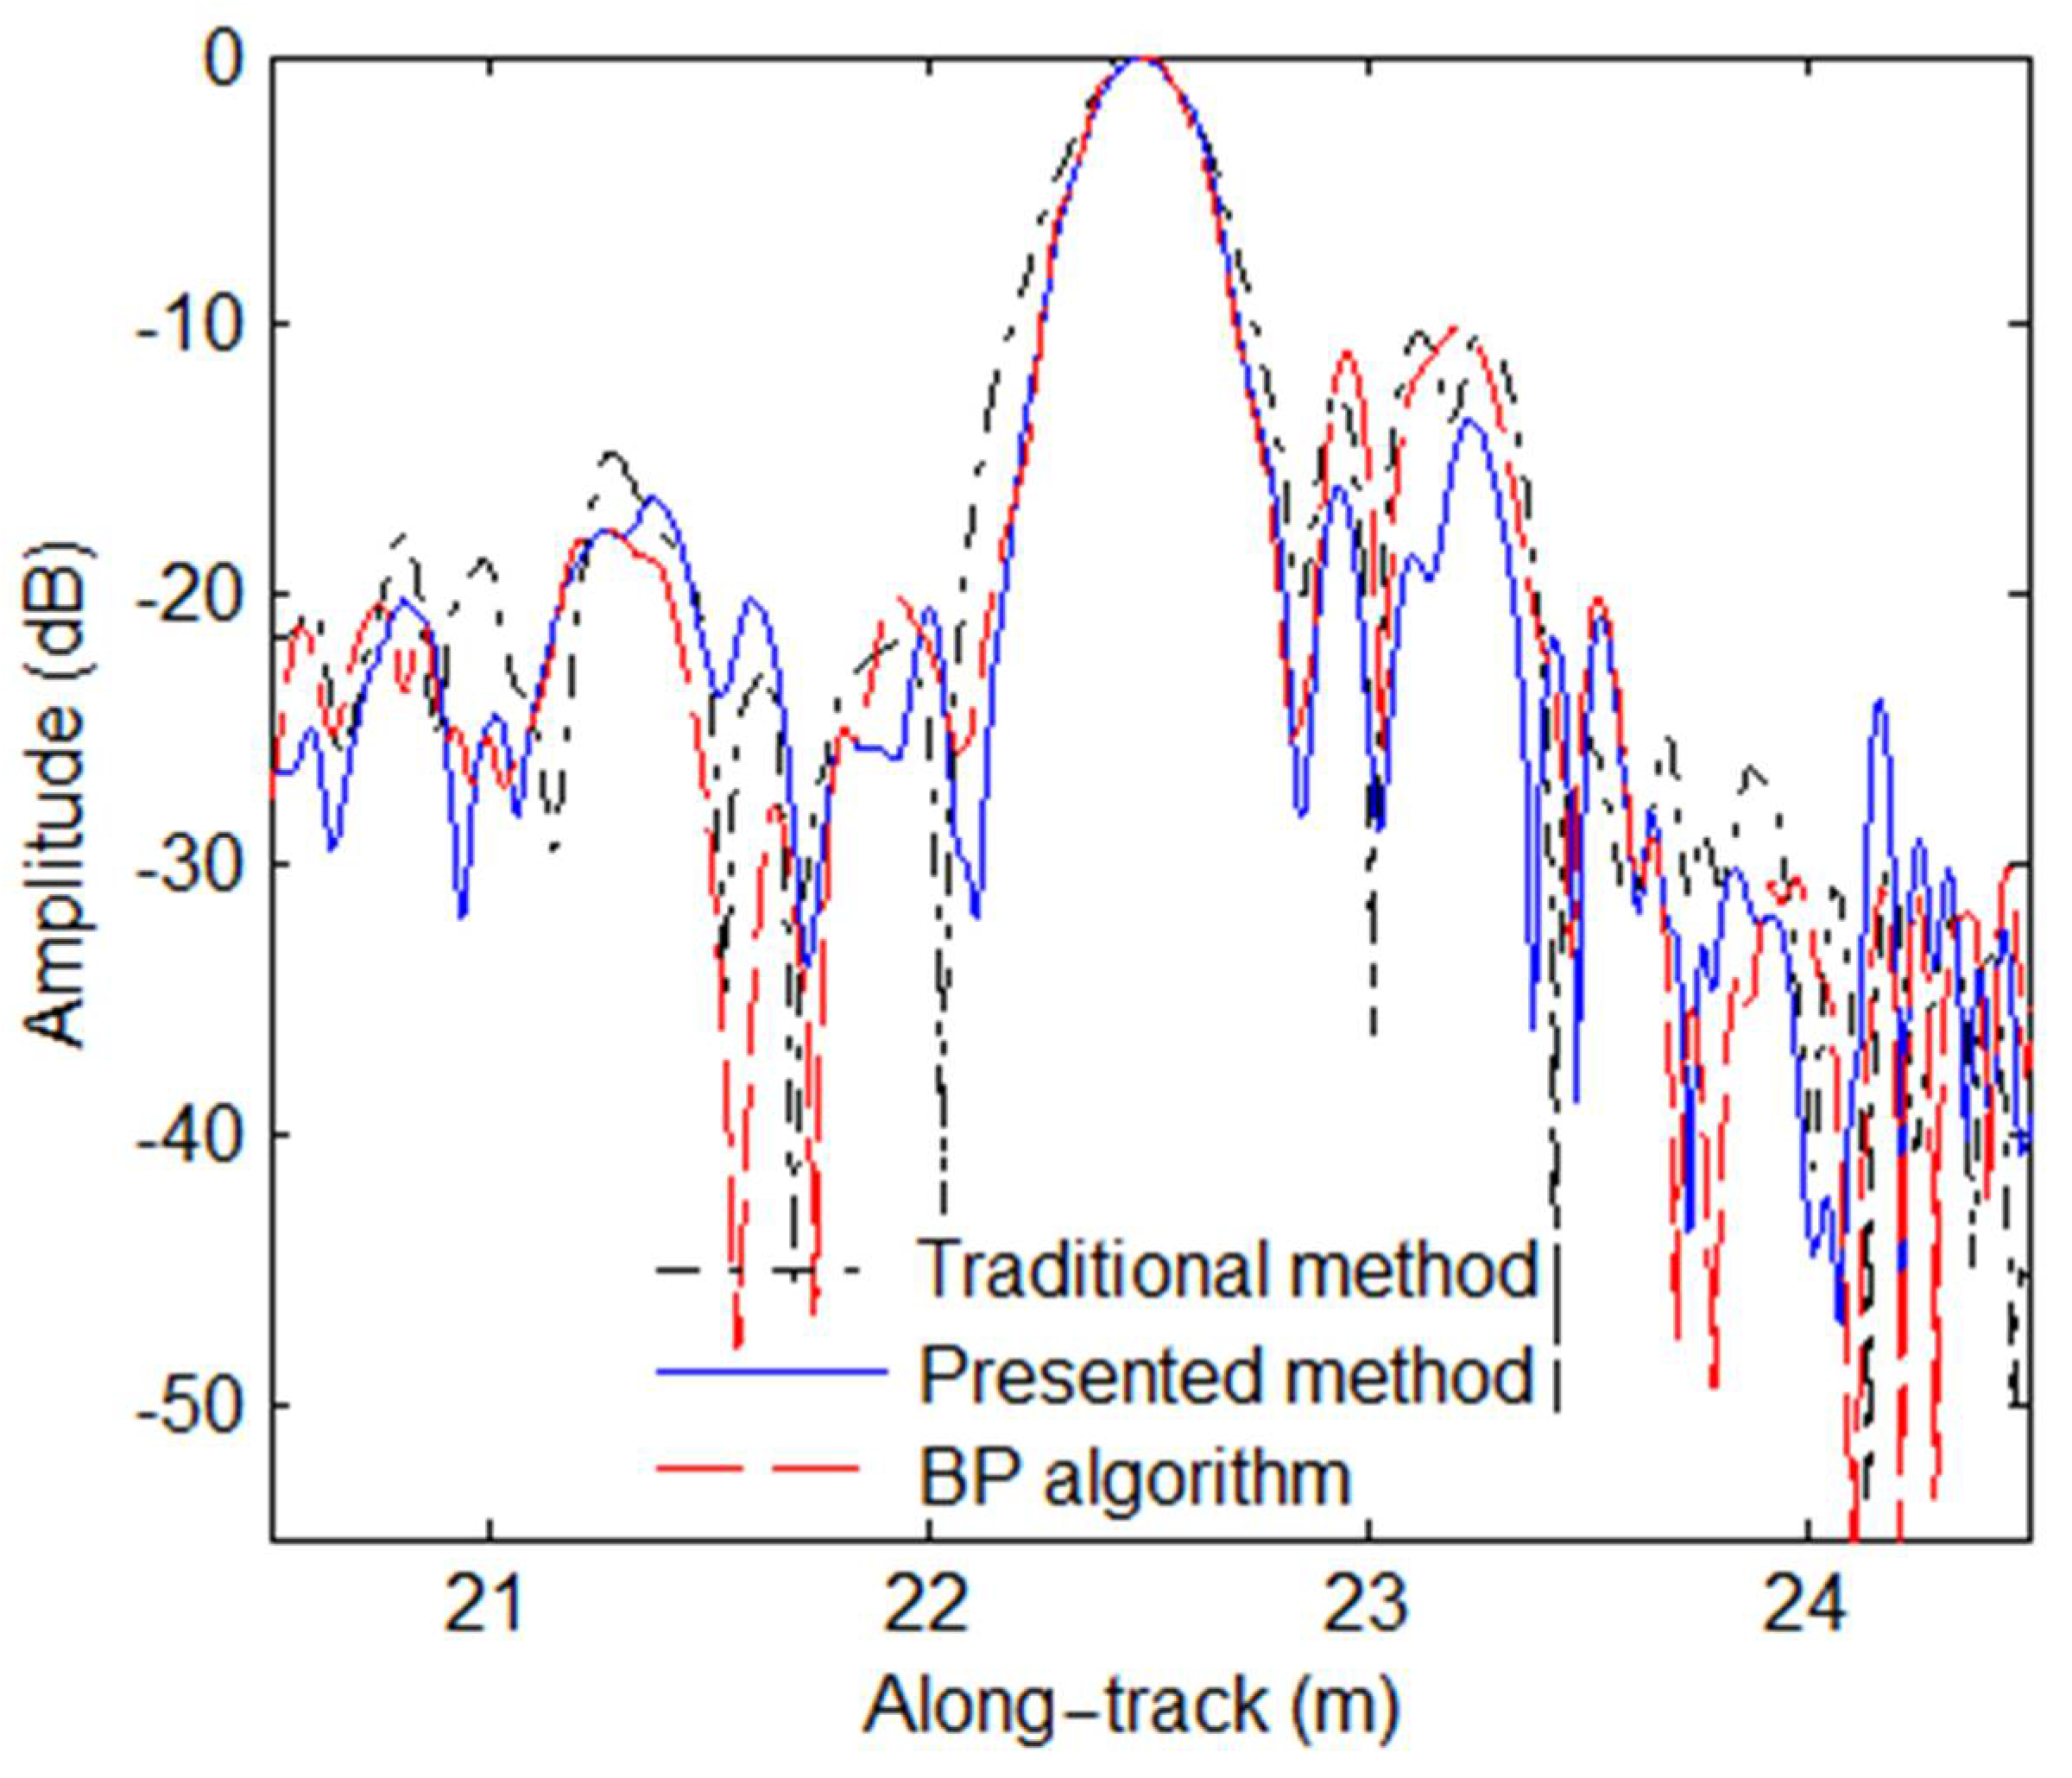
38] just pays attention to the signal model error. In other words, the other two approximation errors are not focused on by users. They would seriously affect the SAS imaging performance in the case of wide-bandwidth and wide swath SAS systems. In this paper, we quantitatively discuss these three errors. Then, an improved R-D algorithm considering the compensation of PTRS error and residual quadratic coupling error is presented based on the sub-block processing method. With the presented method, the higher-order phase errors can be well compensated. Consequently, the high-performance results, which are close to the imaging performance of the back projection (BP) algorithm [
42,
43,
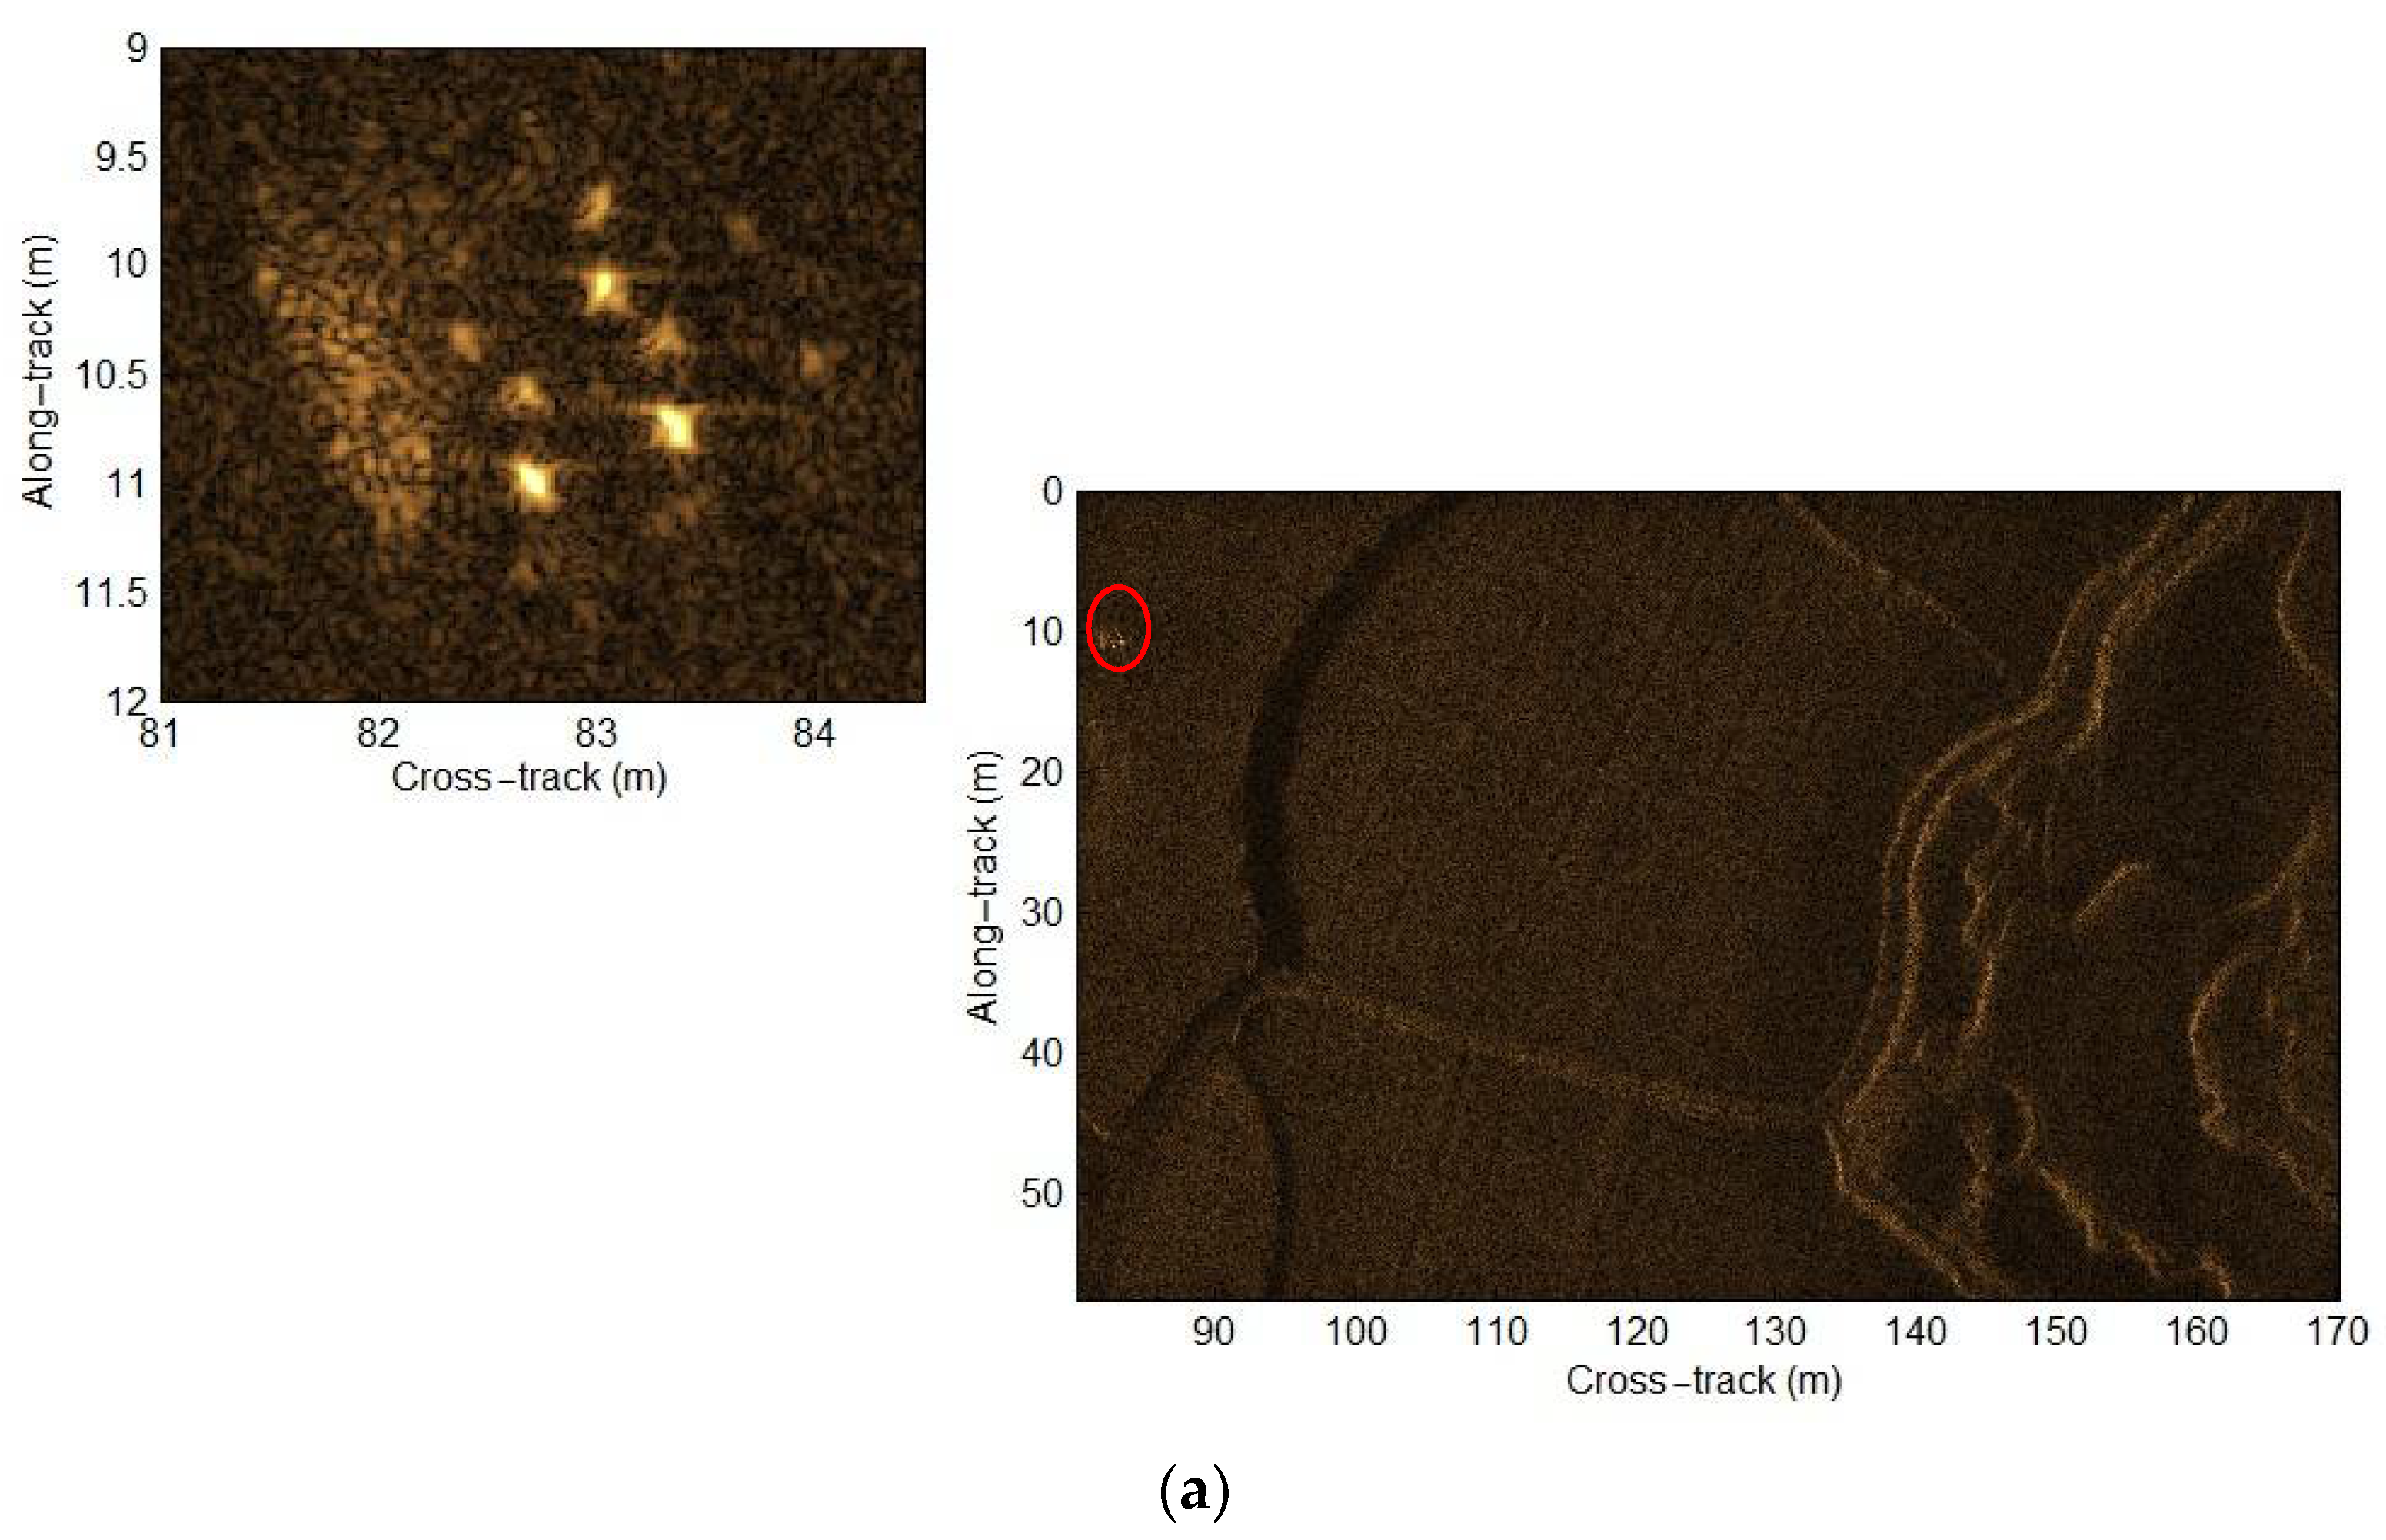
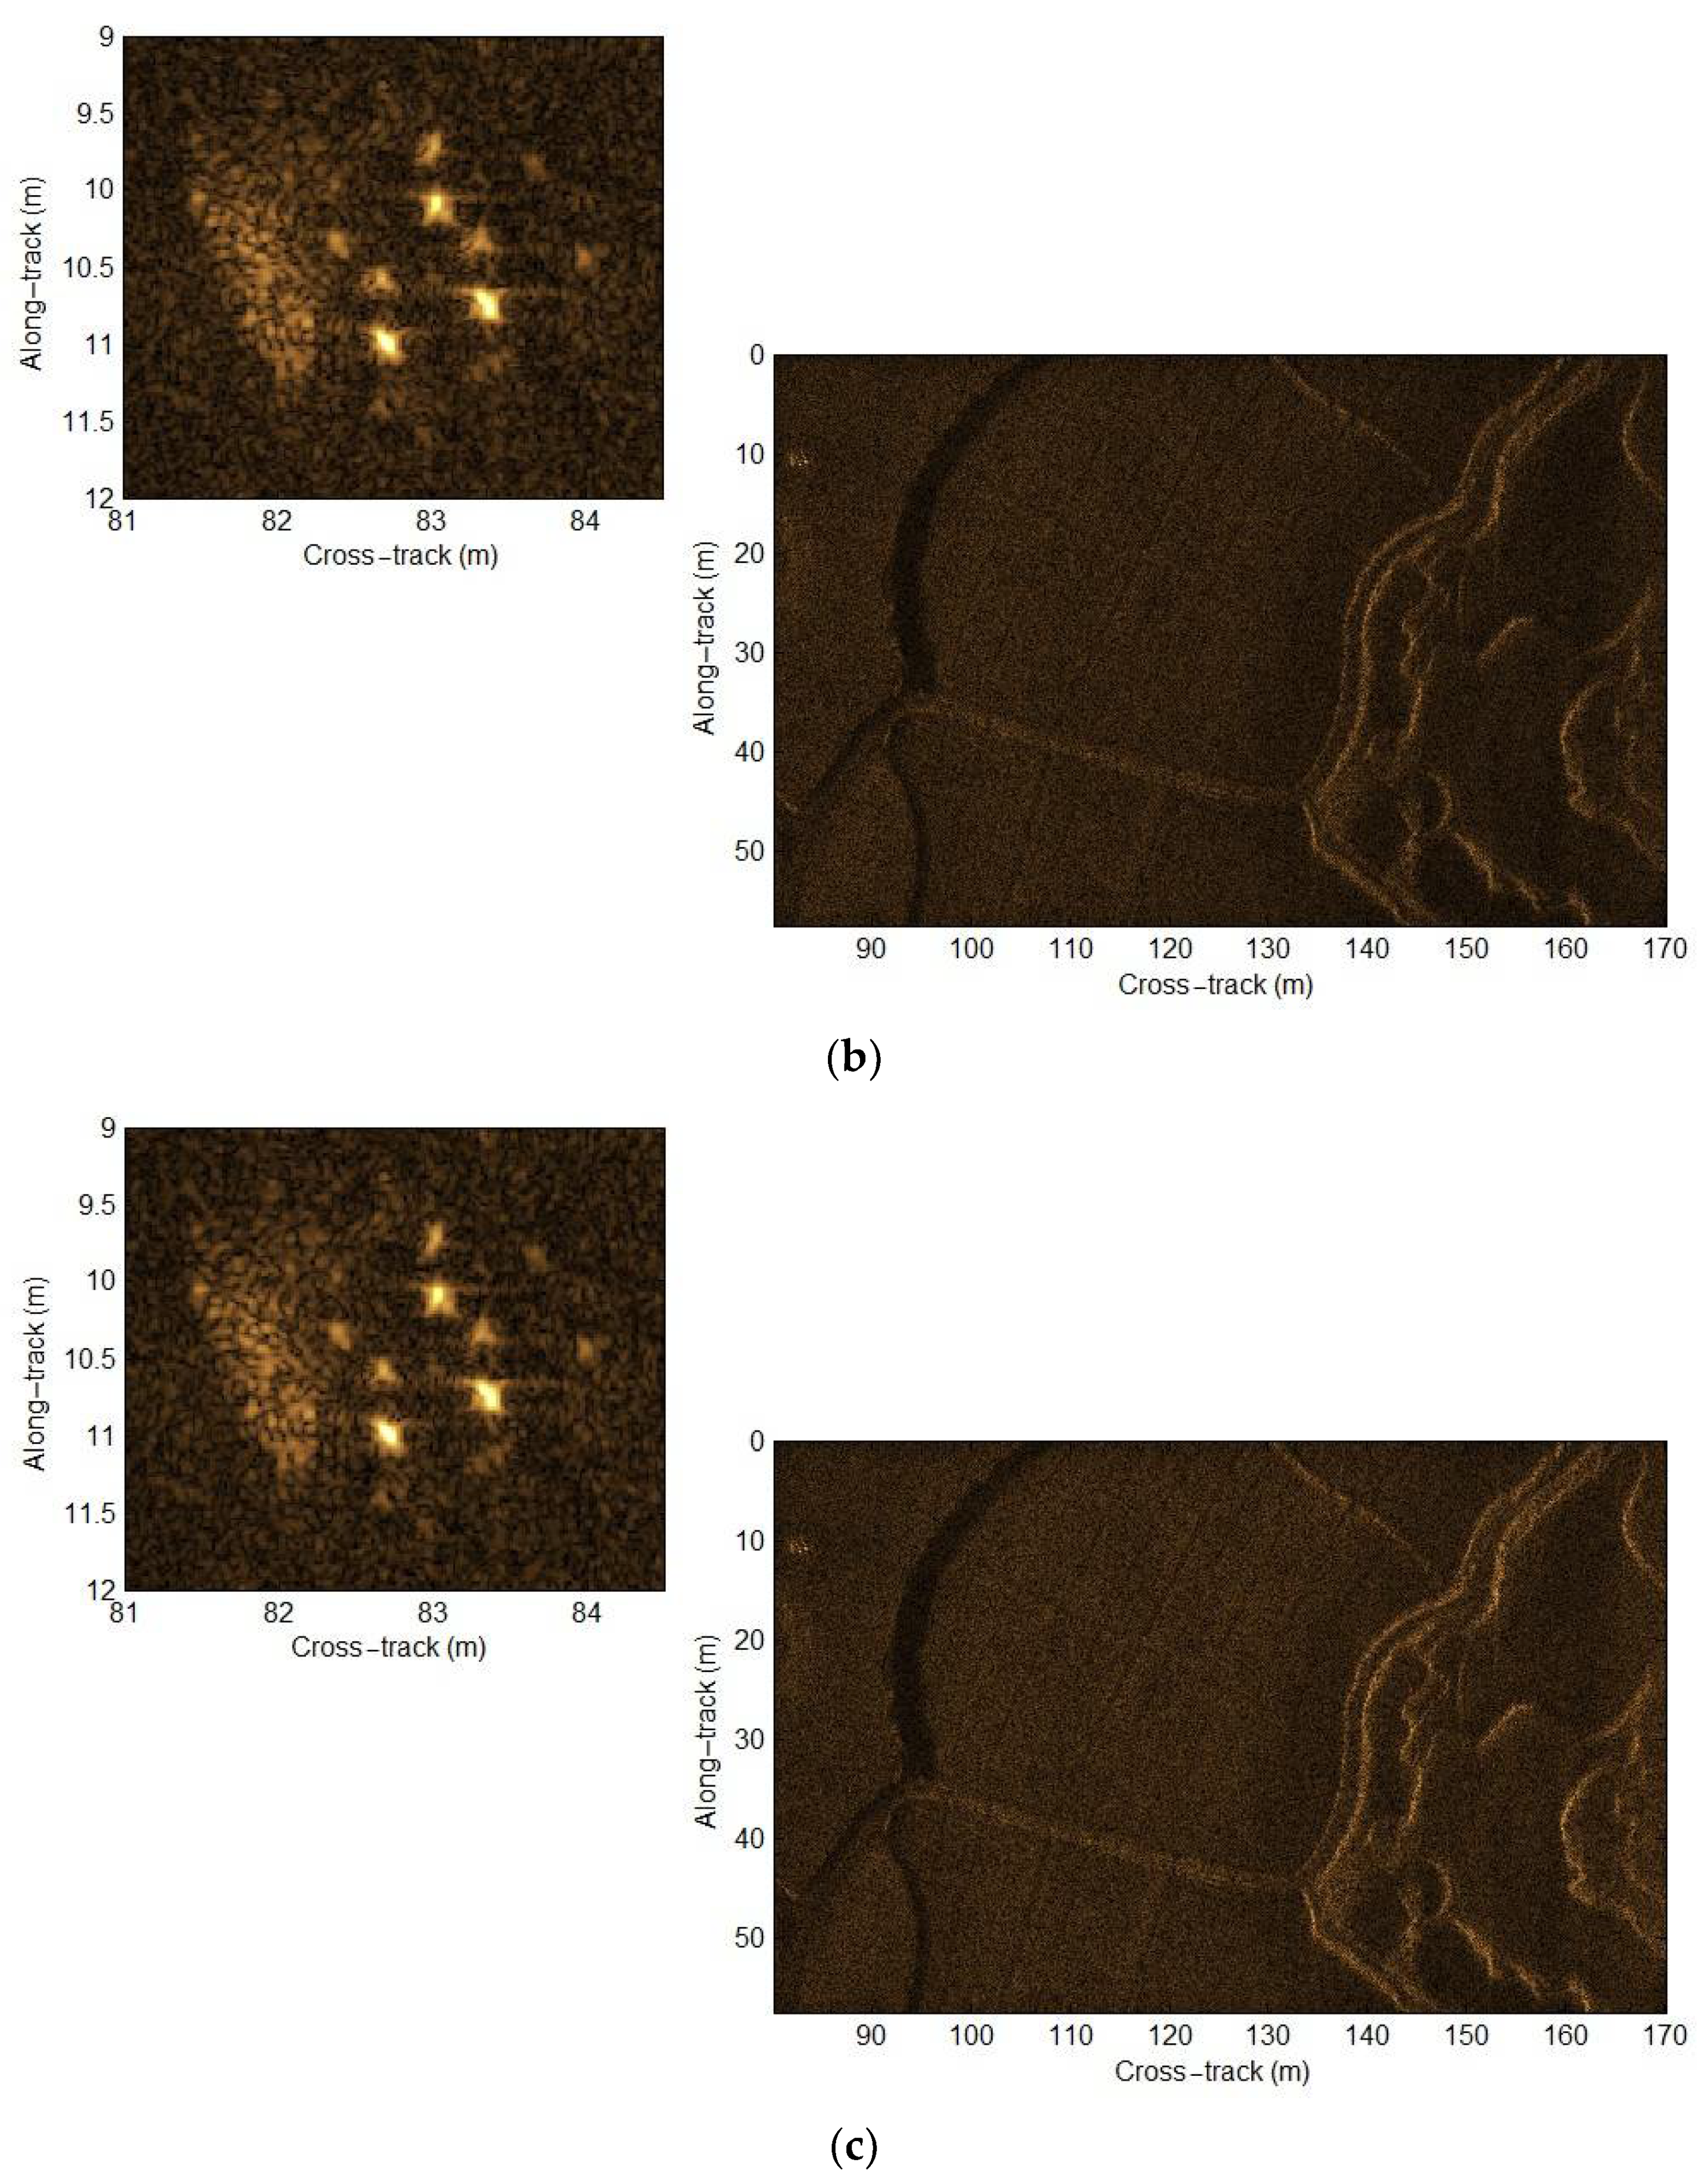
44], can be generated. The simulations and real data processing further validate our method.
This paper is organized as follows.
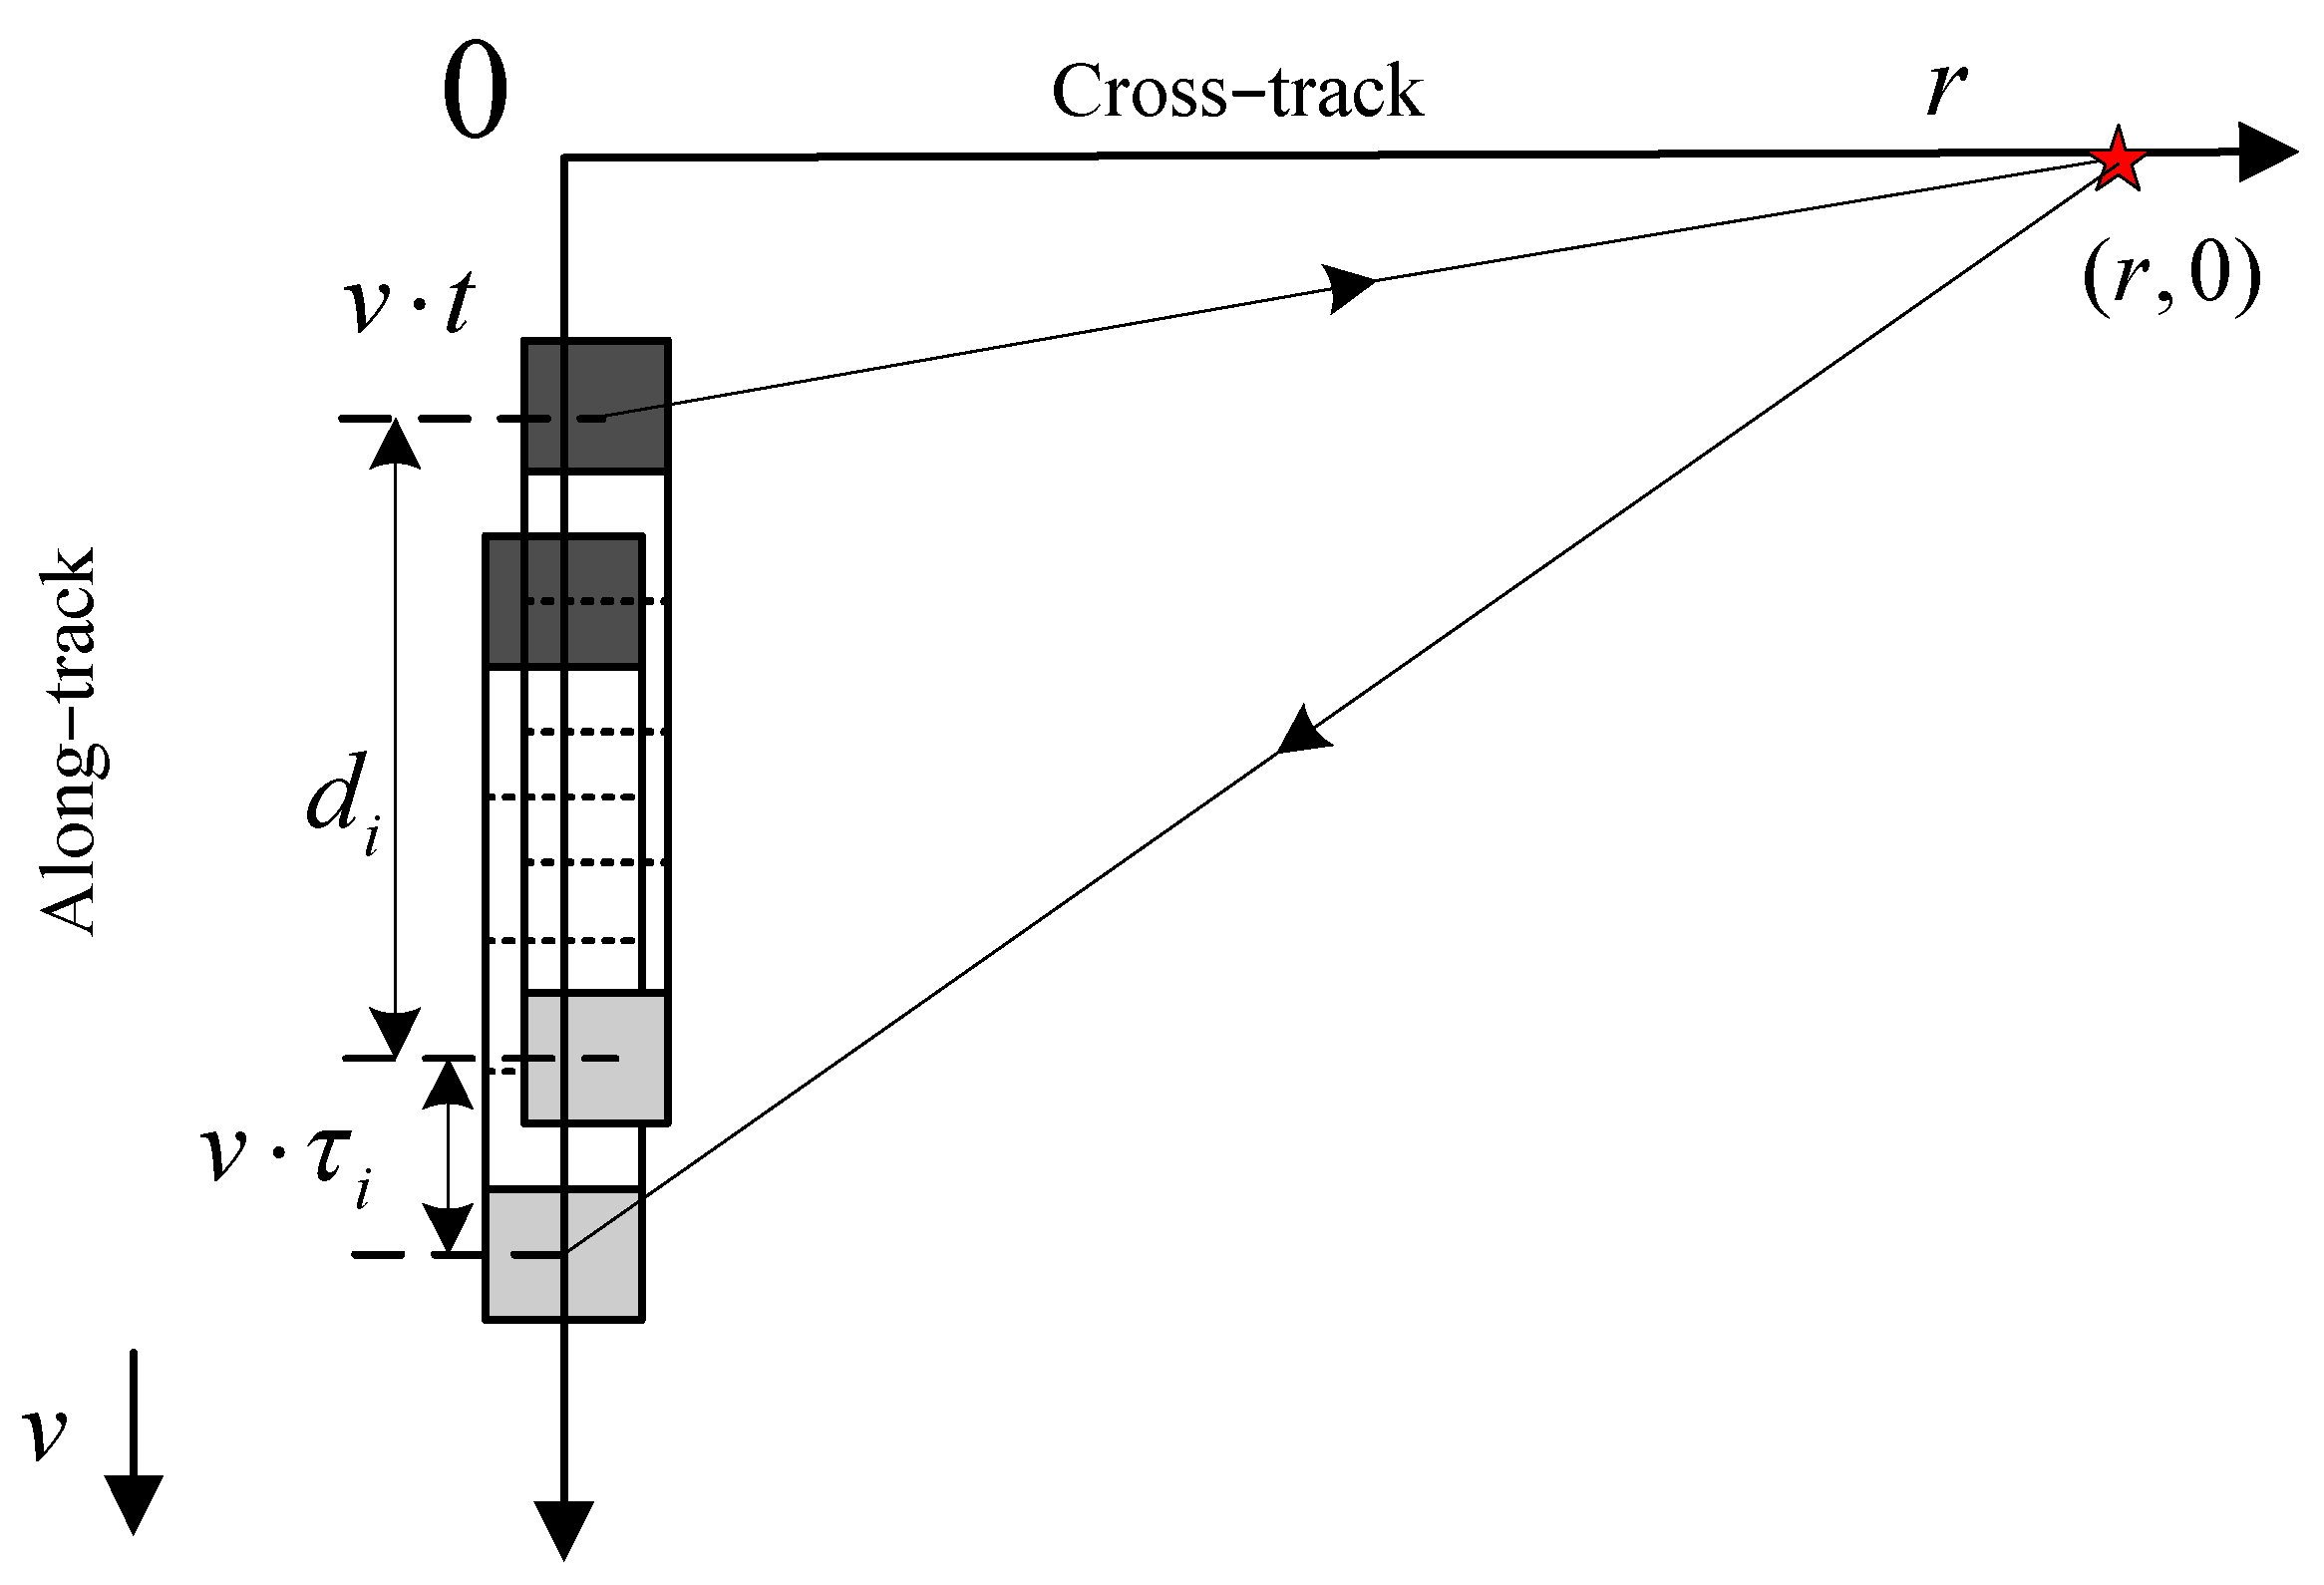
Section 2 introduces the multi-receiver imaging geometry and PTRS. In
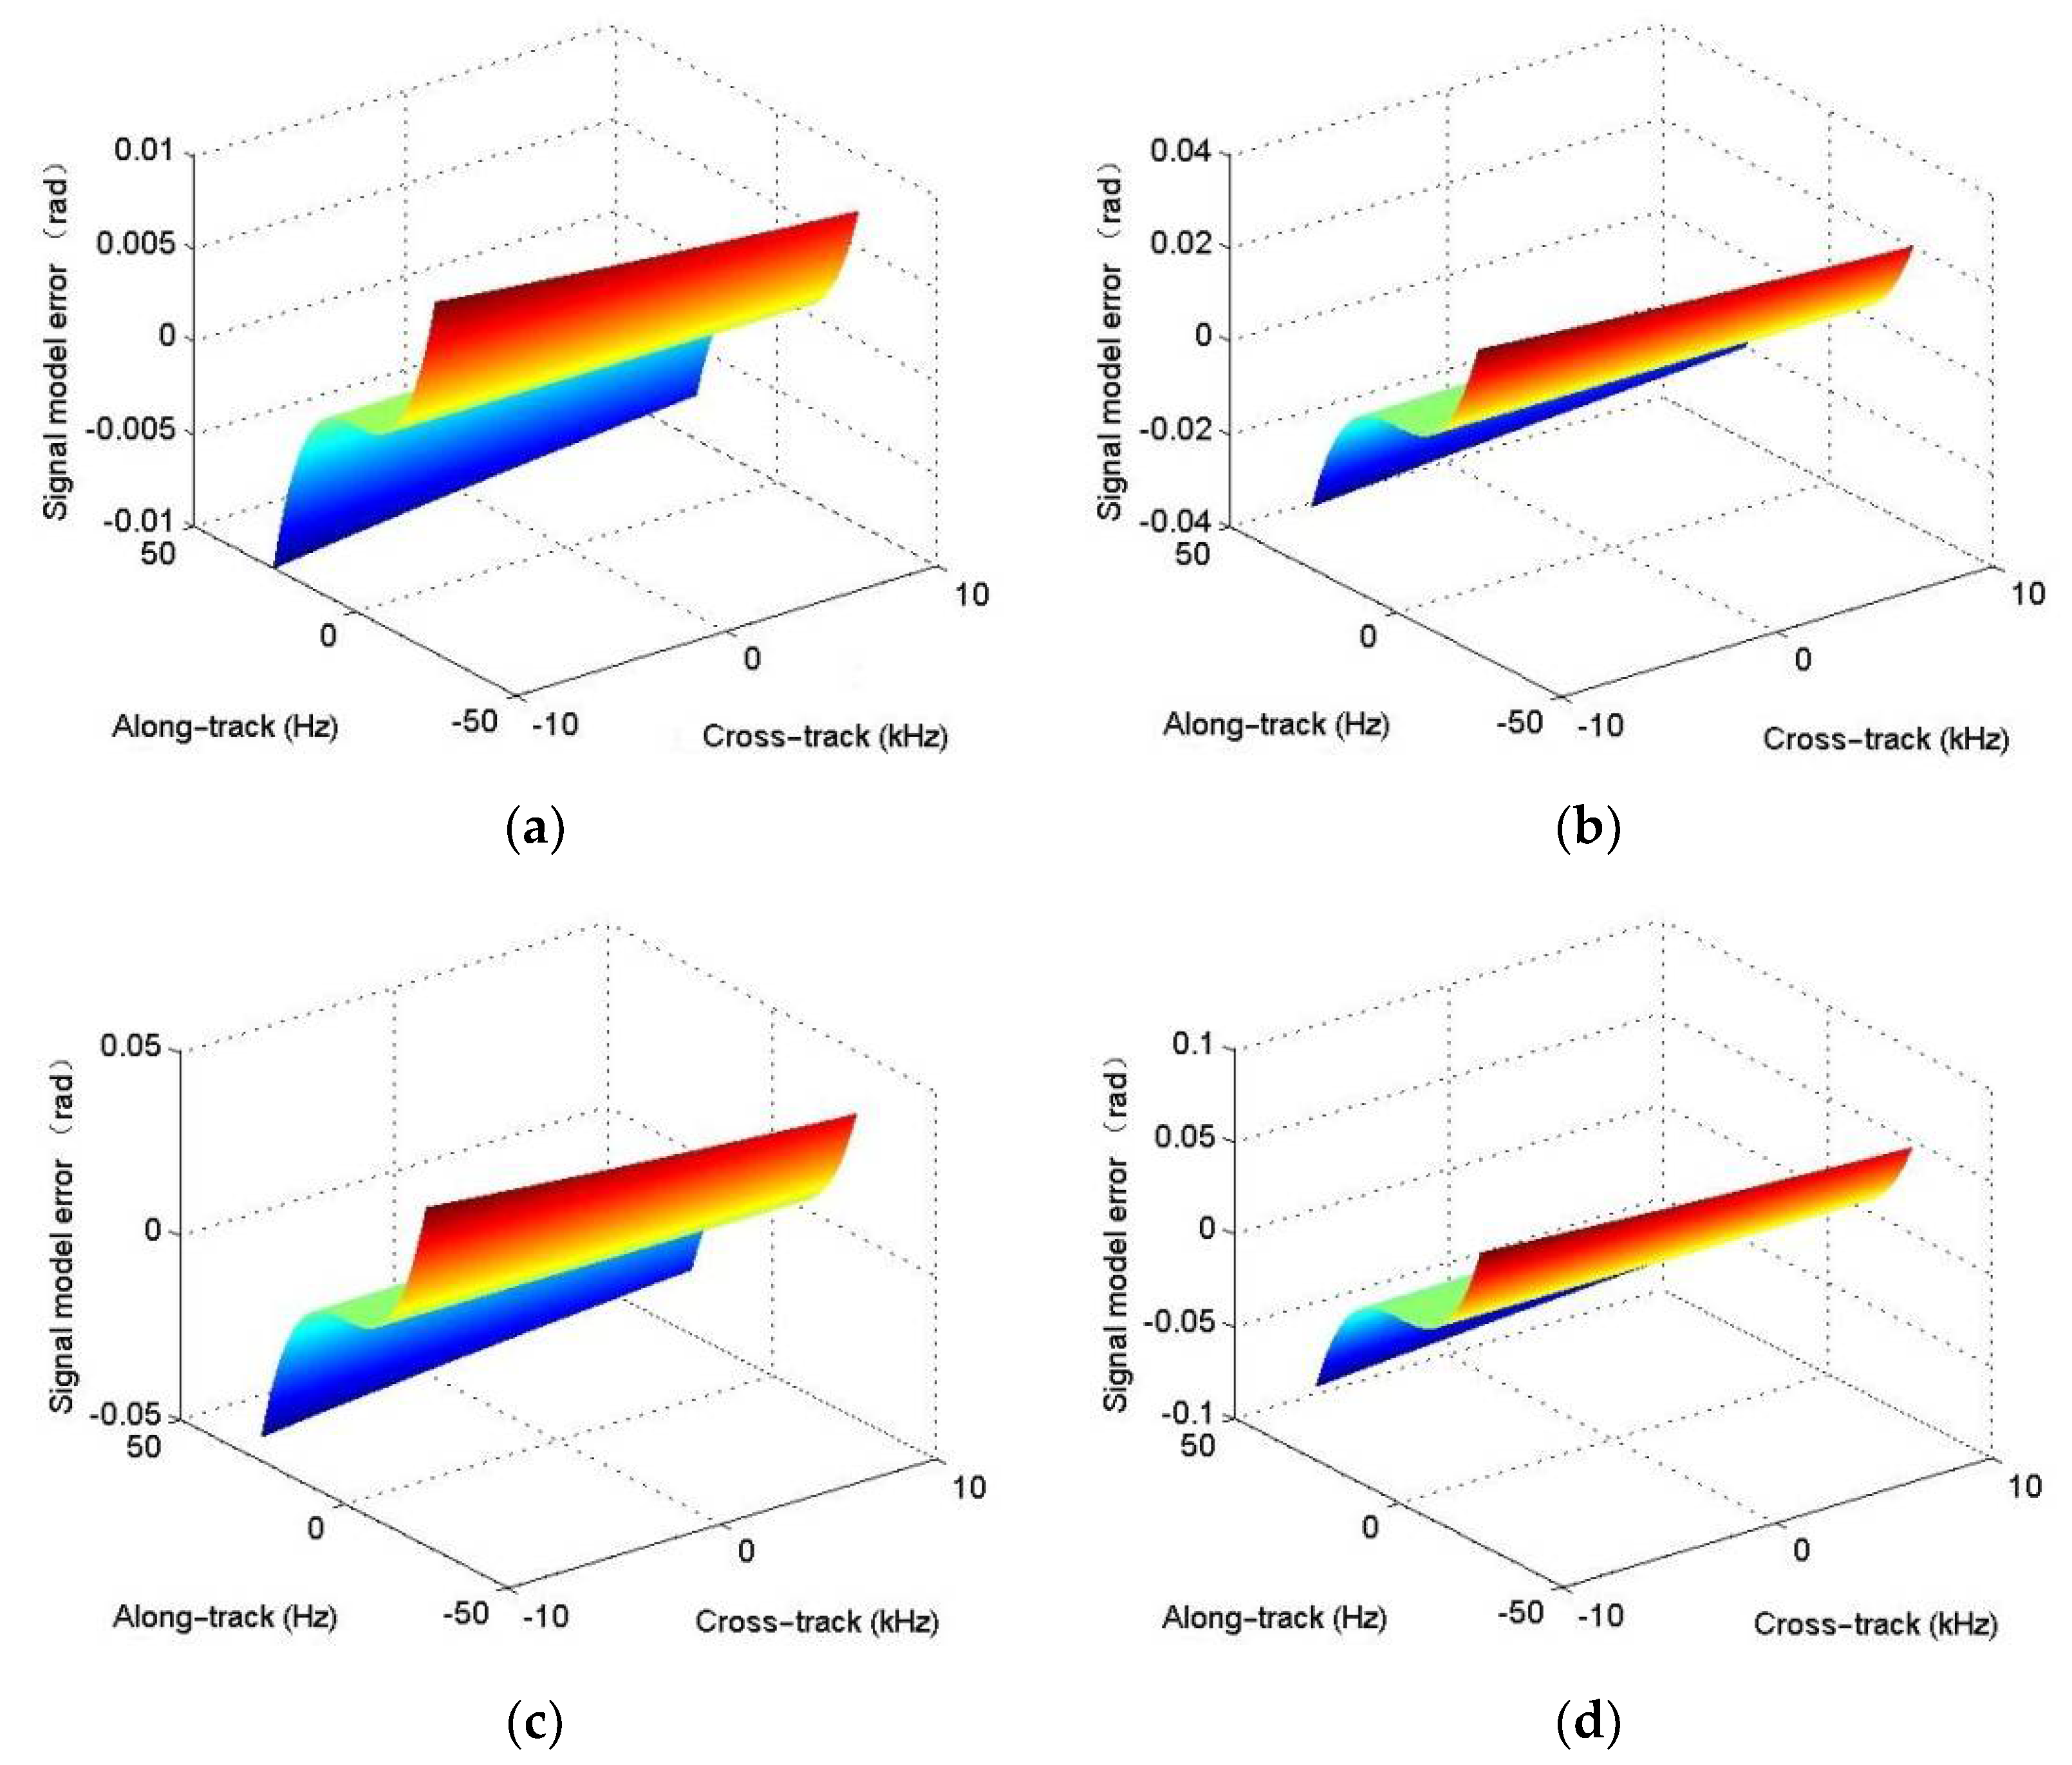
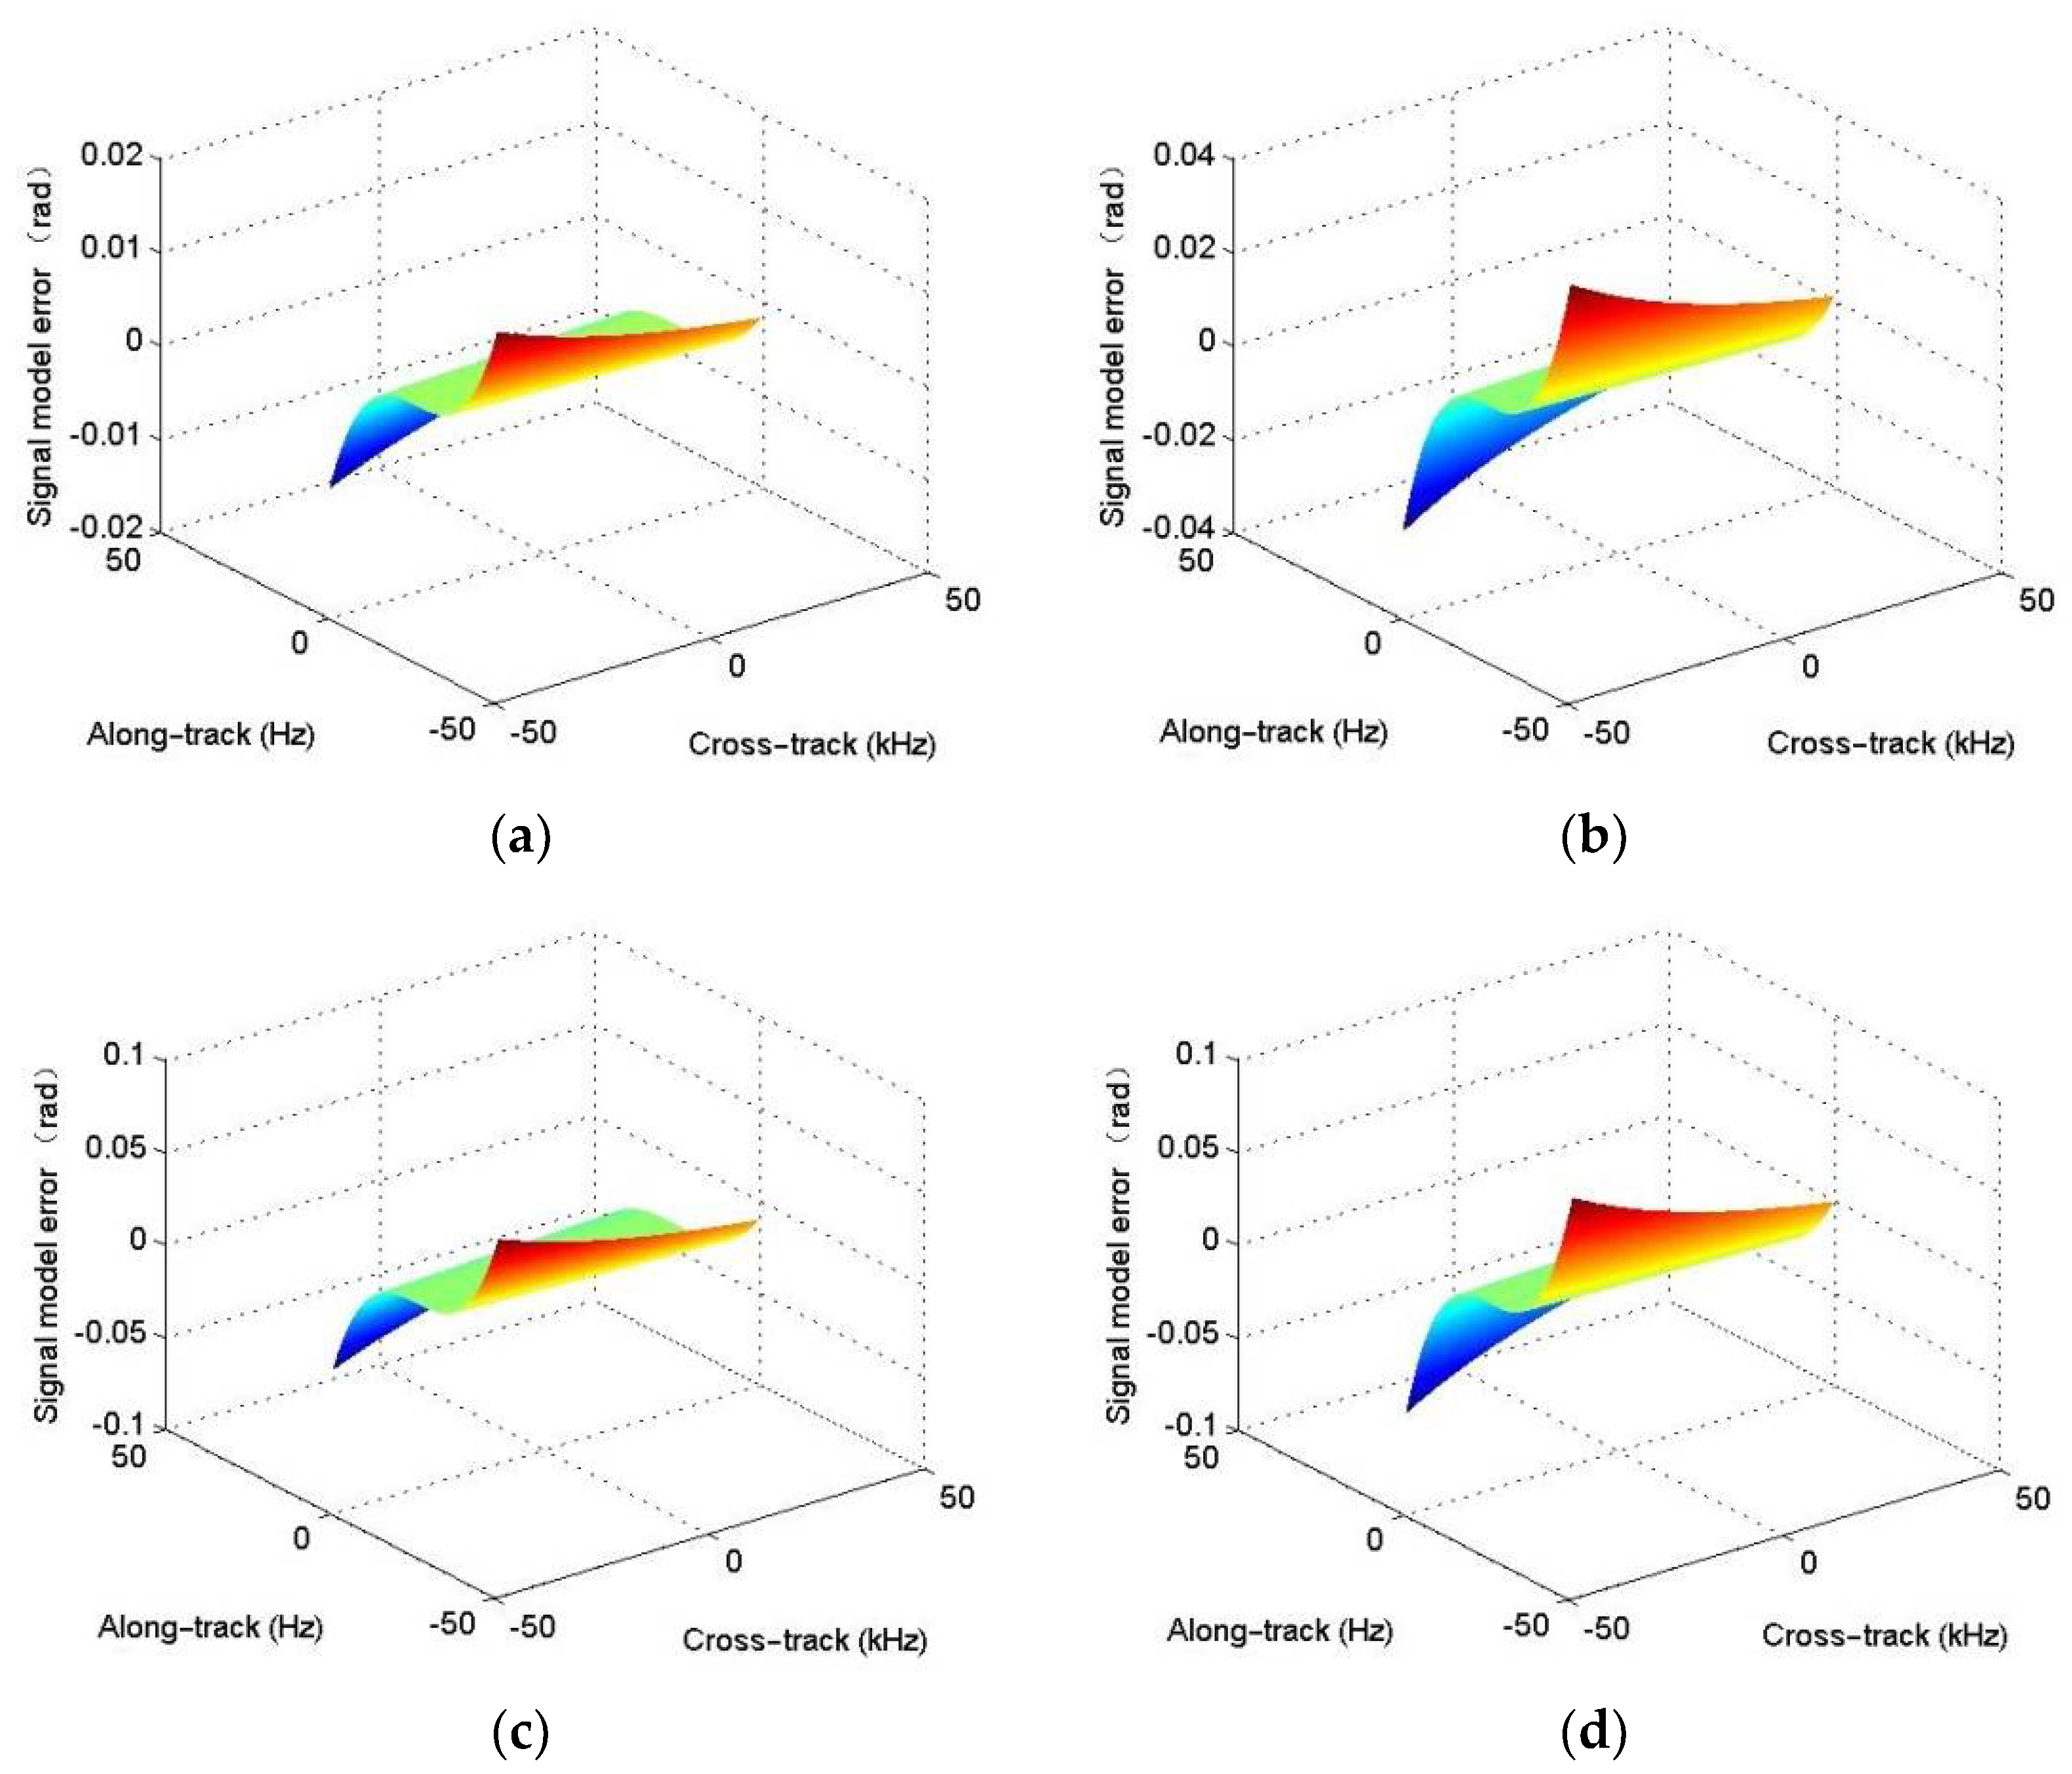
Section 3, the signal model error, PTRS error, and residual quadratic coupling error are quantitatively discussed in detail.
Section 4 discusses an improved R-D algorithm that can be applied to a wide-bandwidth signal-based multi-receiver SAS system. In
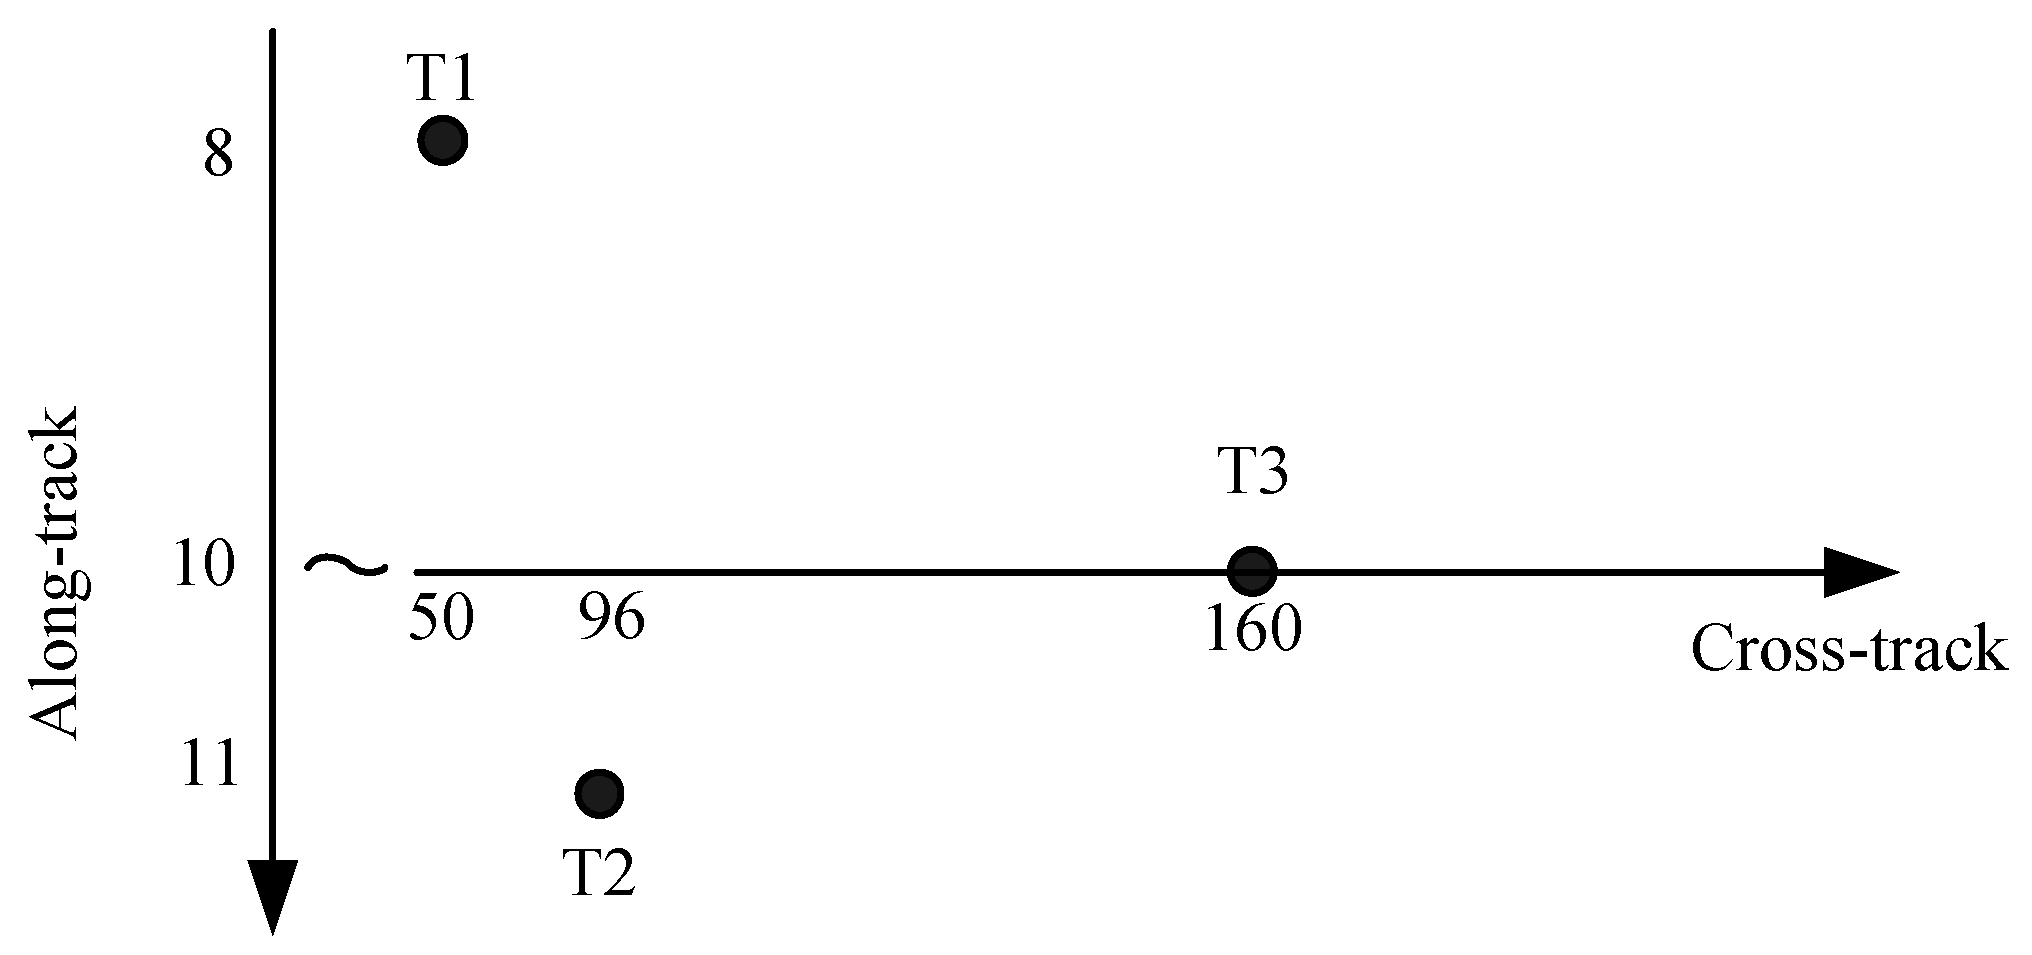
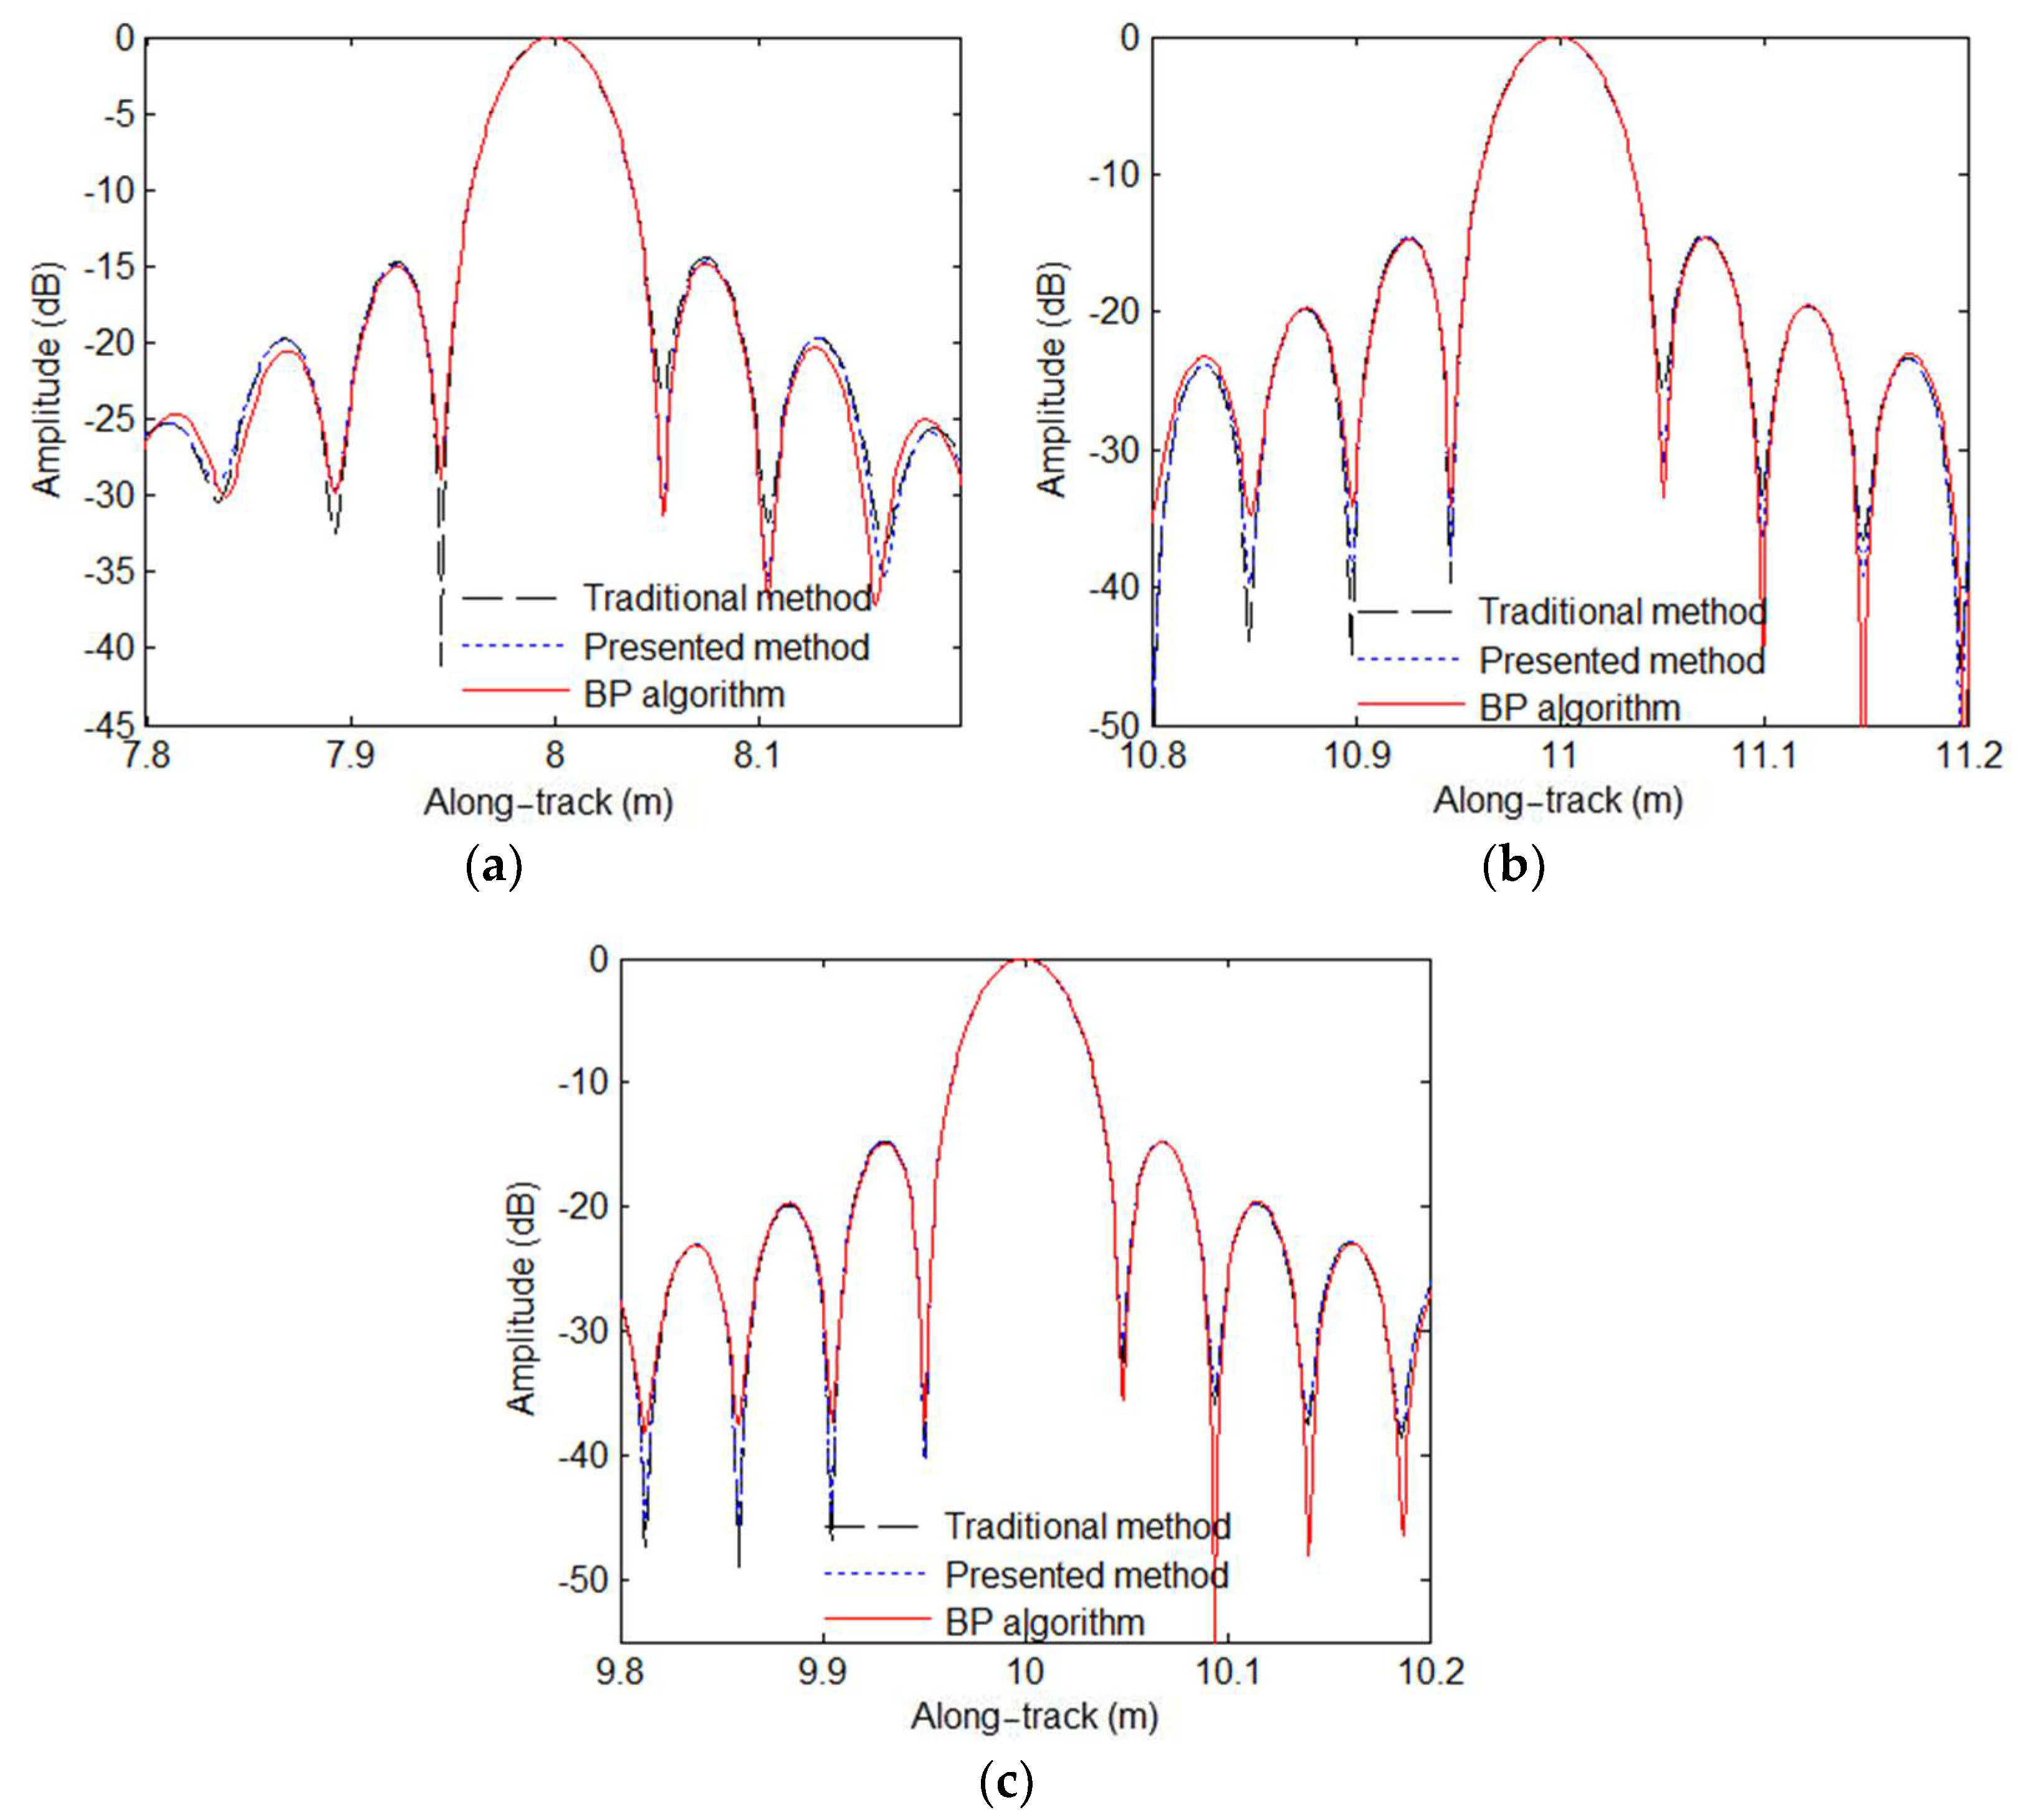
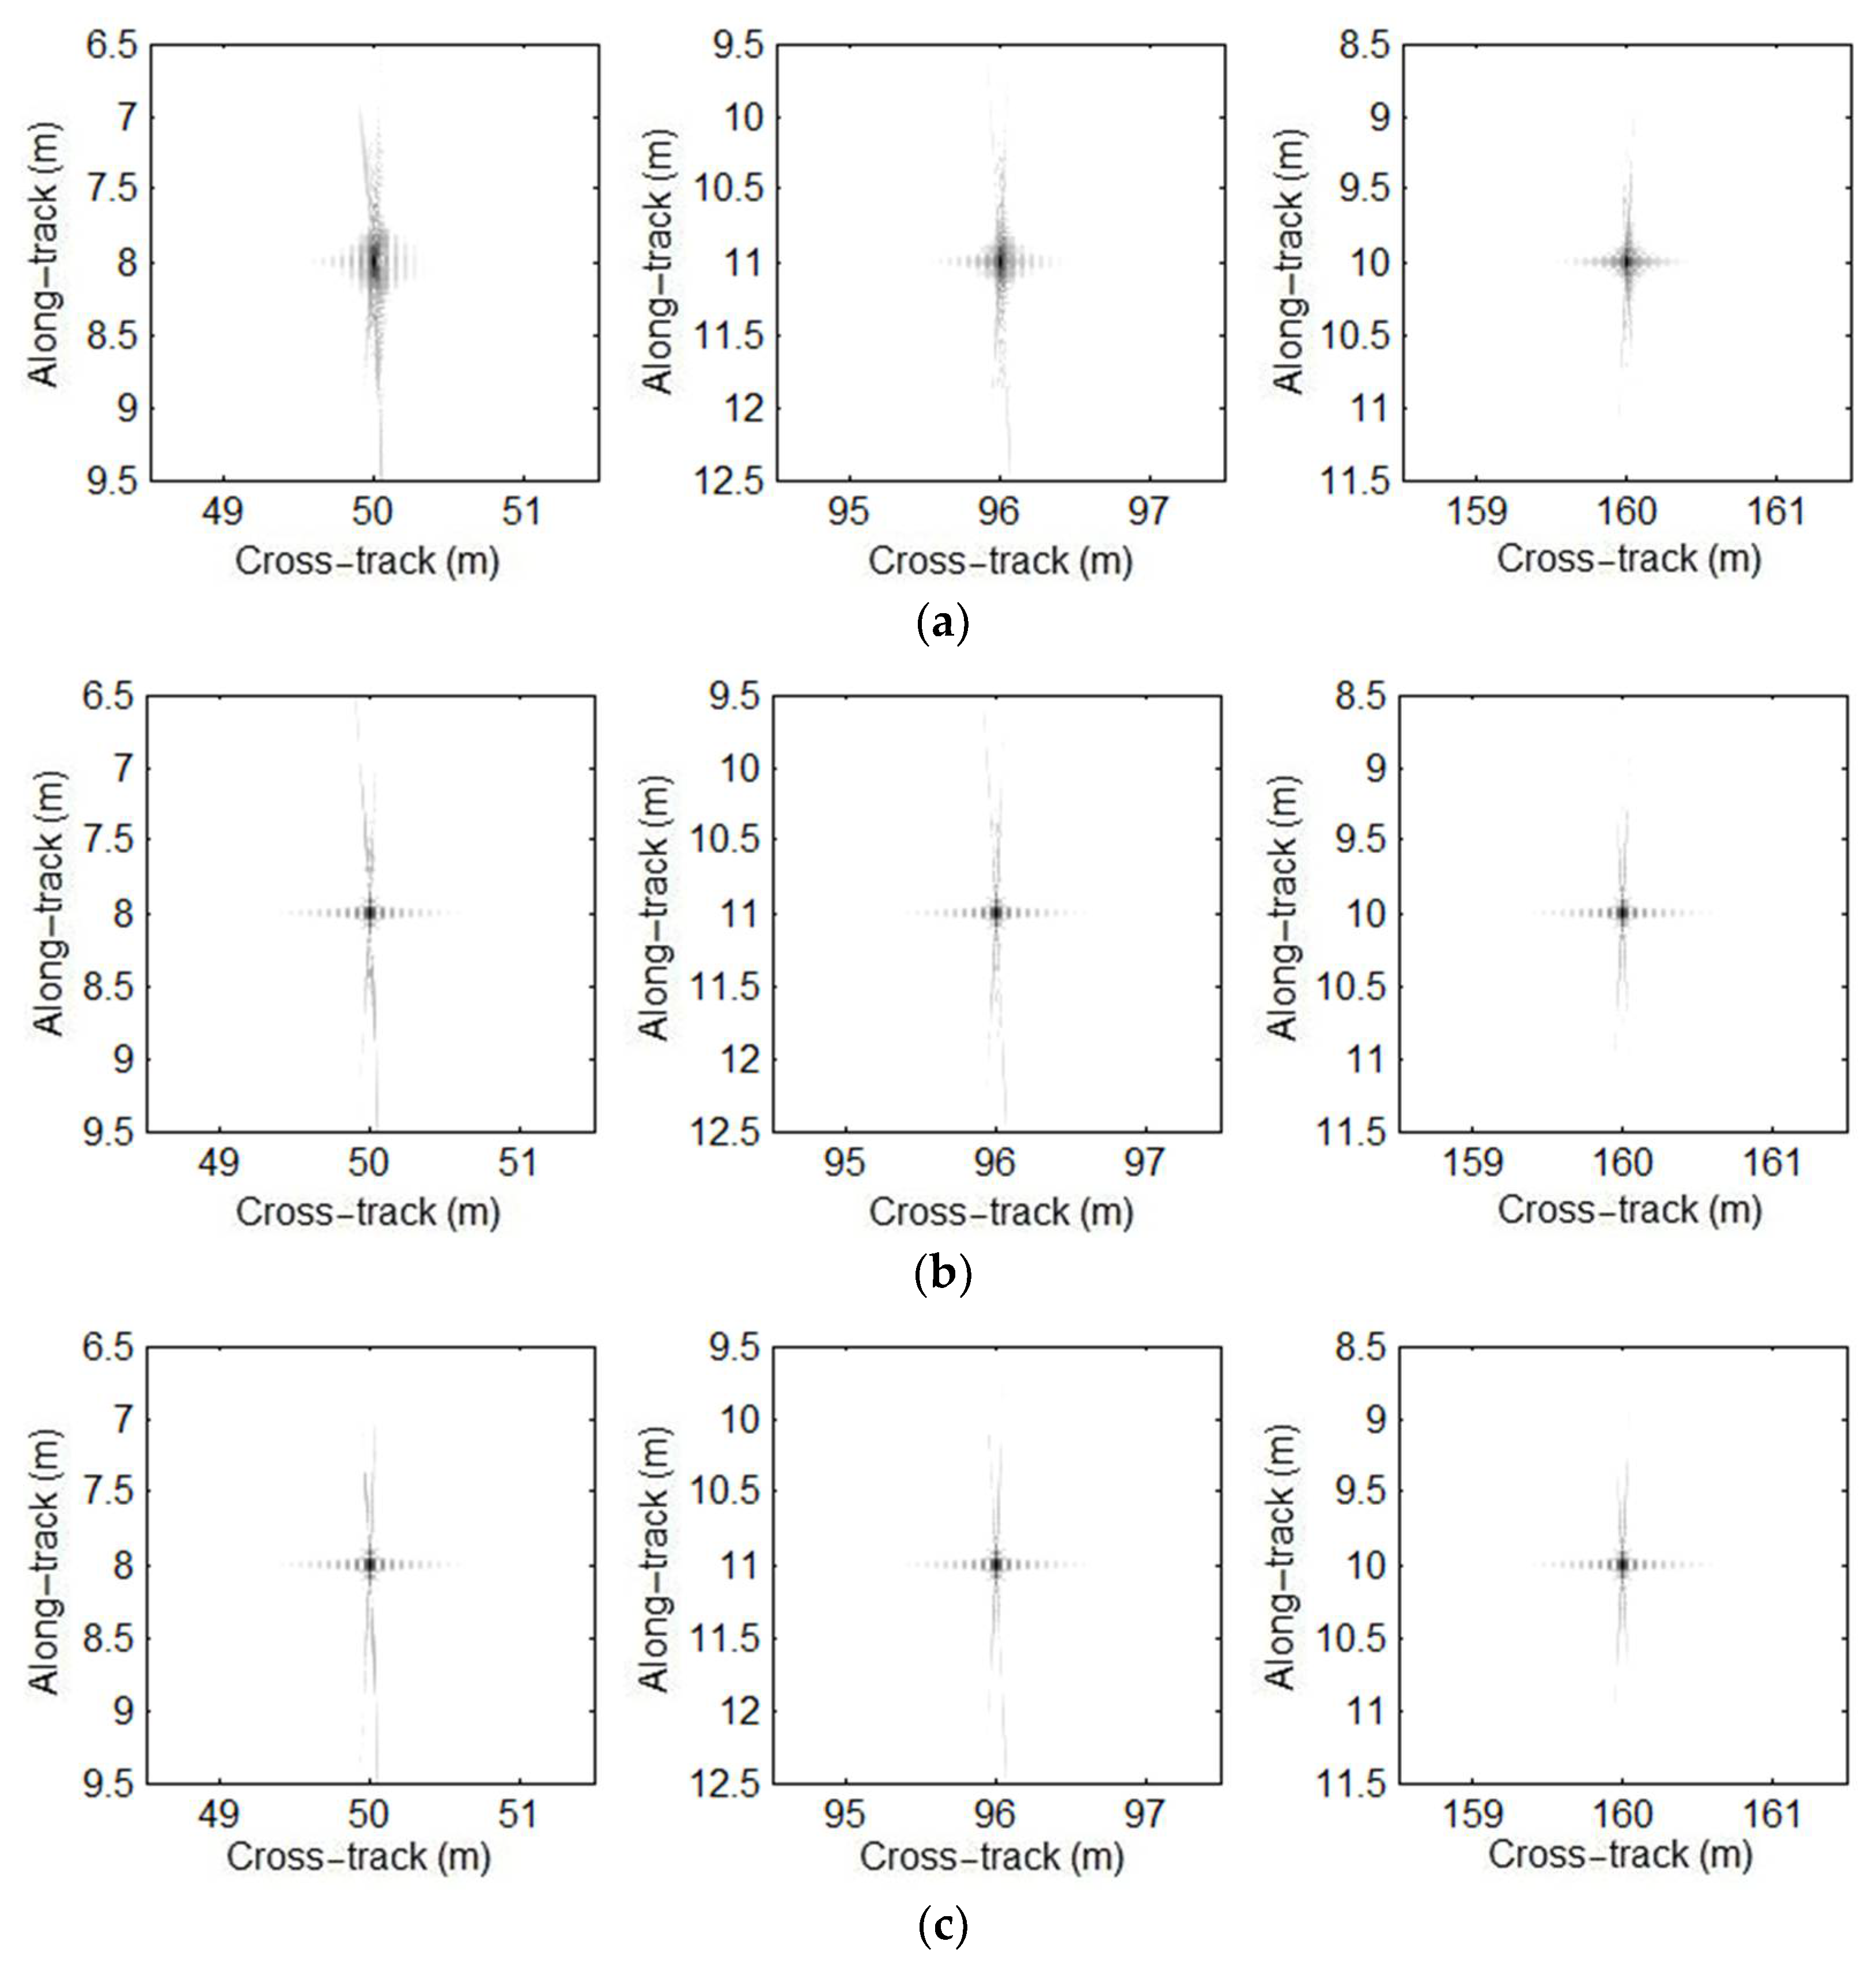
Section 5, simulated and real datasets are used to validate the presented method. The last section summarizes this paper.
6. Discussion
In general, the narrowband signal and wideband signal are relative terms. To simplify the processing, the narrowband signal model is often used. The center frequency
is large compared to the signal bandwidth
, and this signal can be considered to be the narrowband signal. With a mathematical expression, the signal would be a narrowband signal when an inequality
is satisfied. In engineering applications, the signal can be considered to be the narrow bandwidth signal if the inequality
holds. Considering this condition, many SAS systems are characterized by a wideband, which is also drawn by Pailhas in [
35]. Therefore, traditional imaging methods cannot be directly applied to these SAS systems, and traditional imaging methods should be extended.
In this paper, we mainly focus on the extension of the traditional R-D algorithm. The approximation errors of the multi-receiver SAS R-D algorithm are first analyzed. With our analysis, the approximation errors can be negligible when the narrow-bandwidth signal is used by an SAS system. That is to say, the imaging performance is nearly unaffected by the approximation errors. Unfortunately, the approximation errors are large when the SAS system works with a wide-bandwidth signal. In other words, the residual phase error would seriously distort the imaging performance in the wide-bandwidth case. Based on simulations and real data processing results, the traditional R-D algorithm can only obtain high-resolution images in the narrow-bandwidth case. When it comes to the SAS imagery with a wide-bandwidth signal, the results based on the traditional R-D algorithm are seriously distorted. These conclusions are completely consistent with conclusions drawn from the analysis of approximation errors. With the presented method in this paper, the data in the case of a narrow-bandwidth signal can be well processed. In general, there is a slight difference in processing performance between the traditional method and presented method when the narrow-bandwidth signal is used. Since the imaging performance of the presented method is still similar to that of the BP algorithm, the major difference in imaging performance between the traditional method and presented method is caused in the case of a wide-bandwidth signal. Summarily, the approximation errors neglected by traditional imaging algorithms are compensated by the presented method based on the sub-block processing method in the cross-track dimension. At this point, the targets across the whole swath can be well focused.
