
Mapping Flood Extent and Frequency from Sentinel-1 Imagery during the Extremely Warm Winter of 2020 in Boreal Floodplains and Forests


Abstract
:1. Introduction
- Set up an optimal automatic workflow for open-water and flooded forest mapping from S1 data.
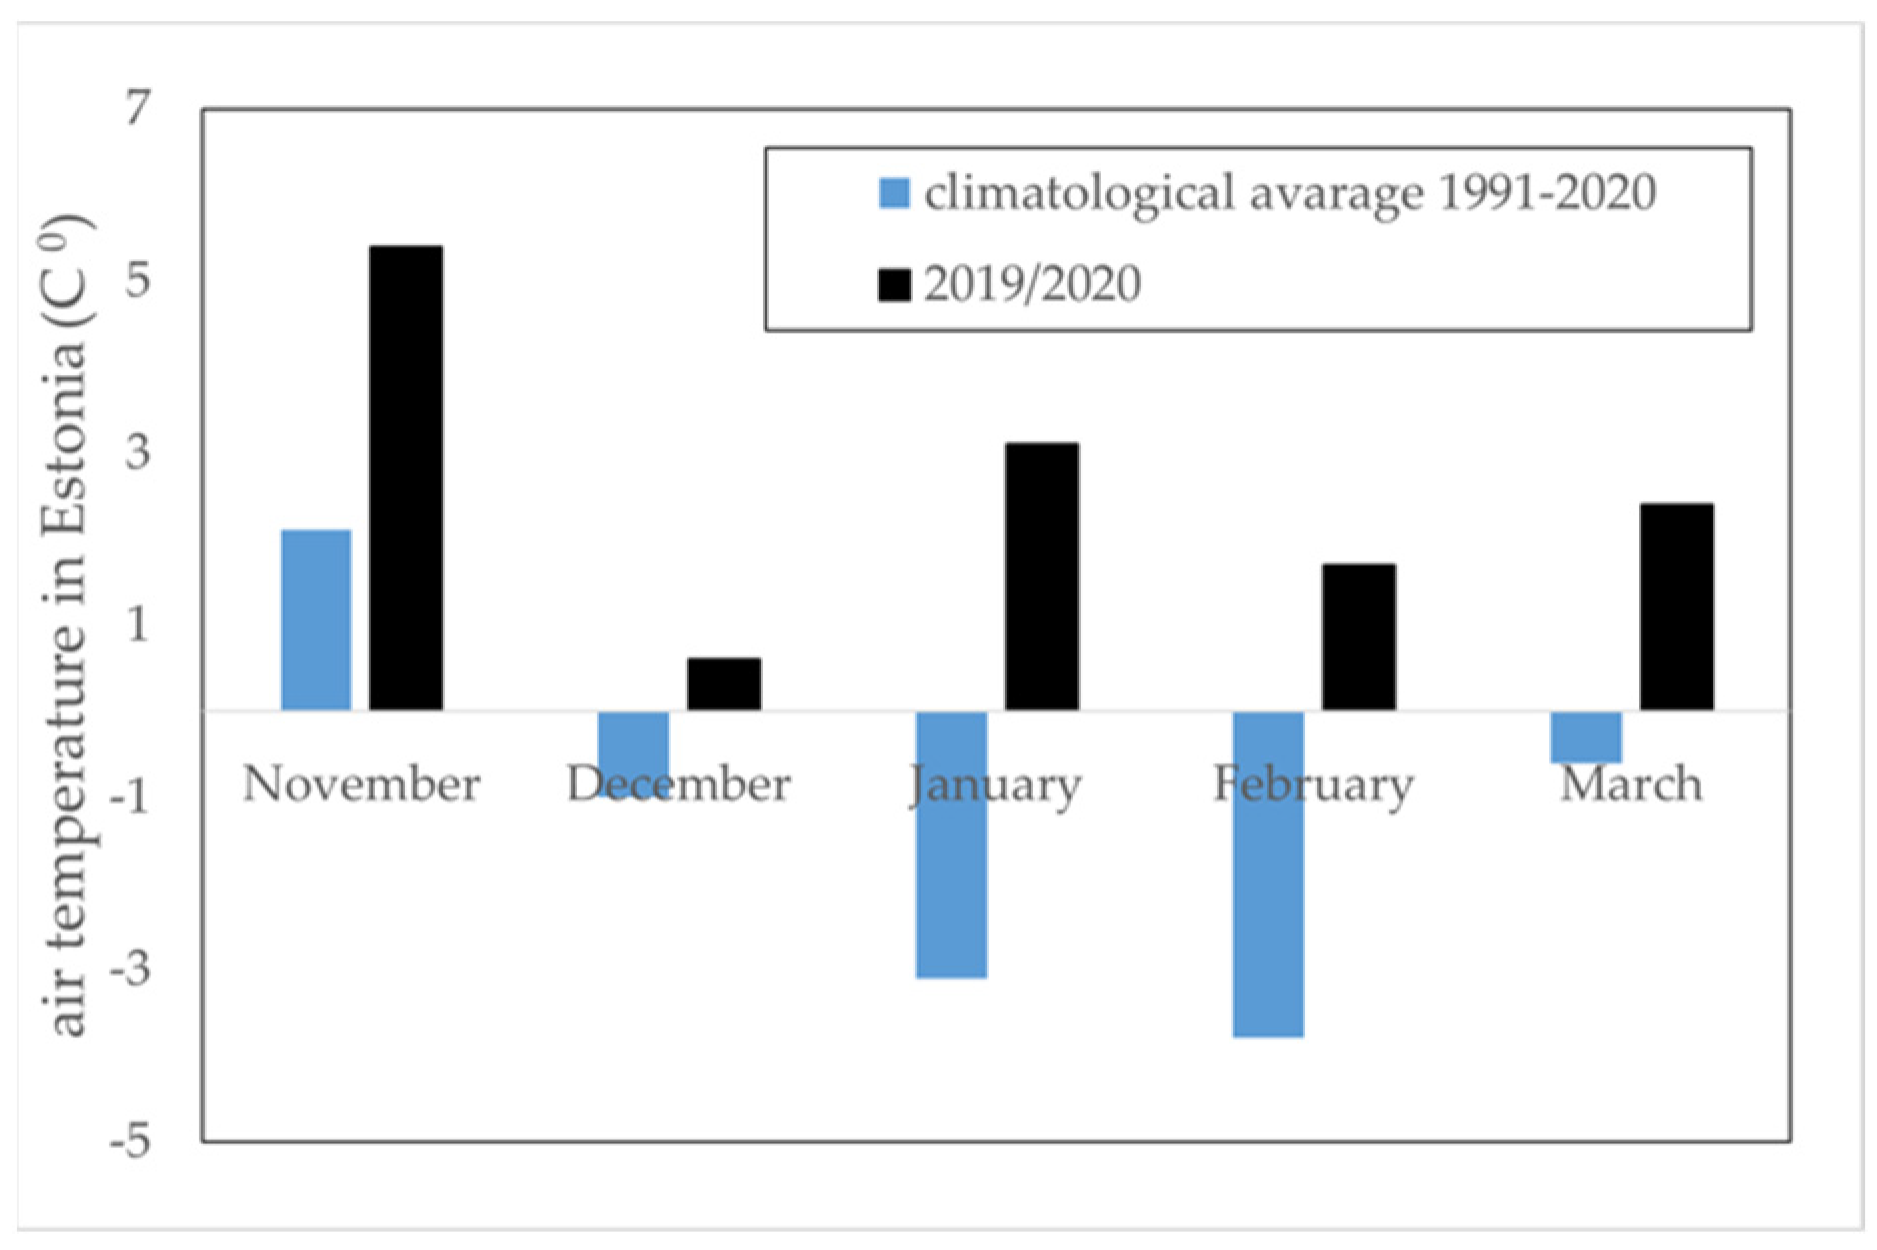
- Apply the workflow for the mapping of flood duration and extent on three of the largest floodplains in Estonia during an extremely mild winter (1 November 2019–31 March 2020).
- Analyze the correlation between flood extent and the water level measured in the closest hydrological station. Define the water level that indicates the occurrence of flooding (river coastline excess) on floodplains.
2. Study Sites and Data
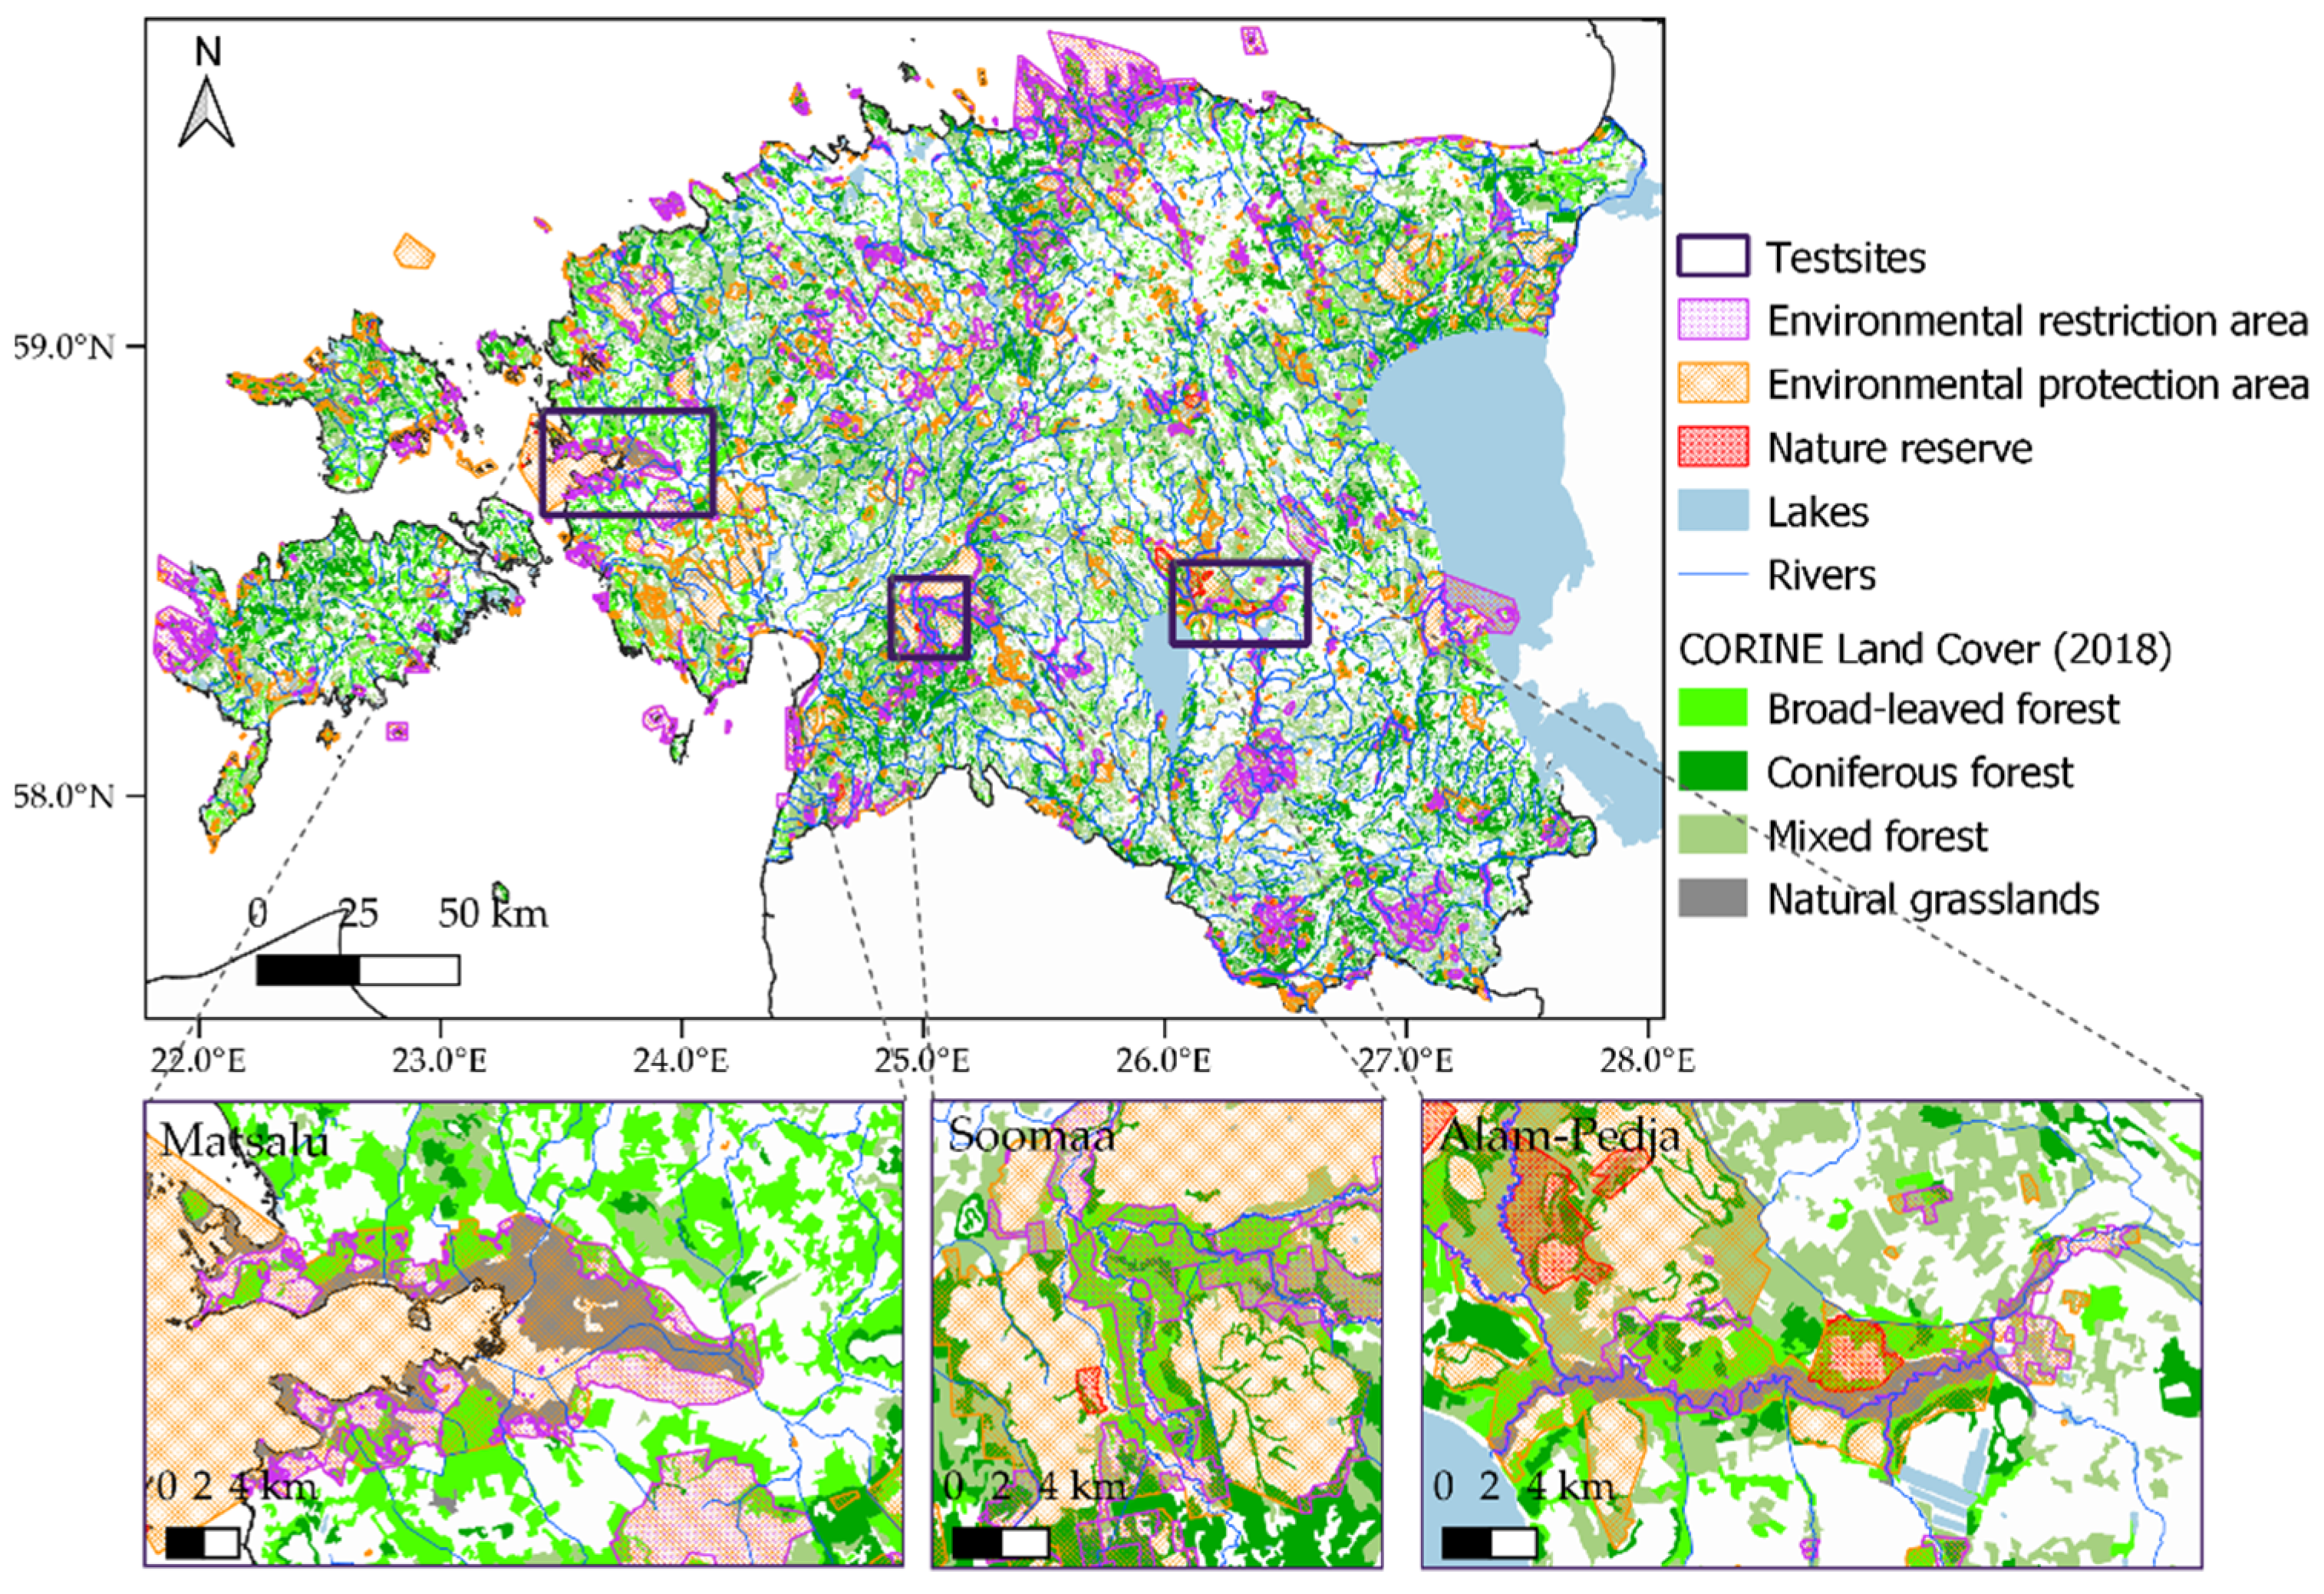
2.1. Study Sites
2.2. Satellite Data
2.3. Auxiliary Data
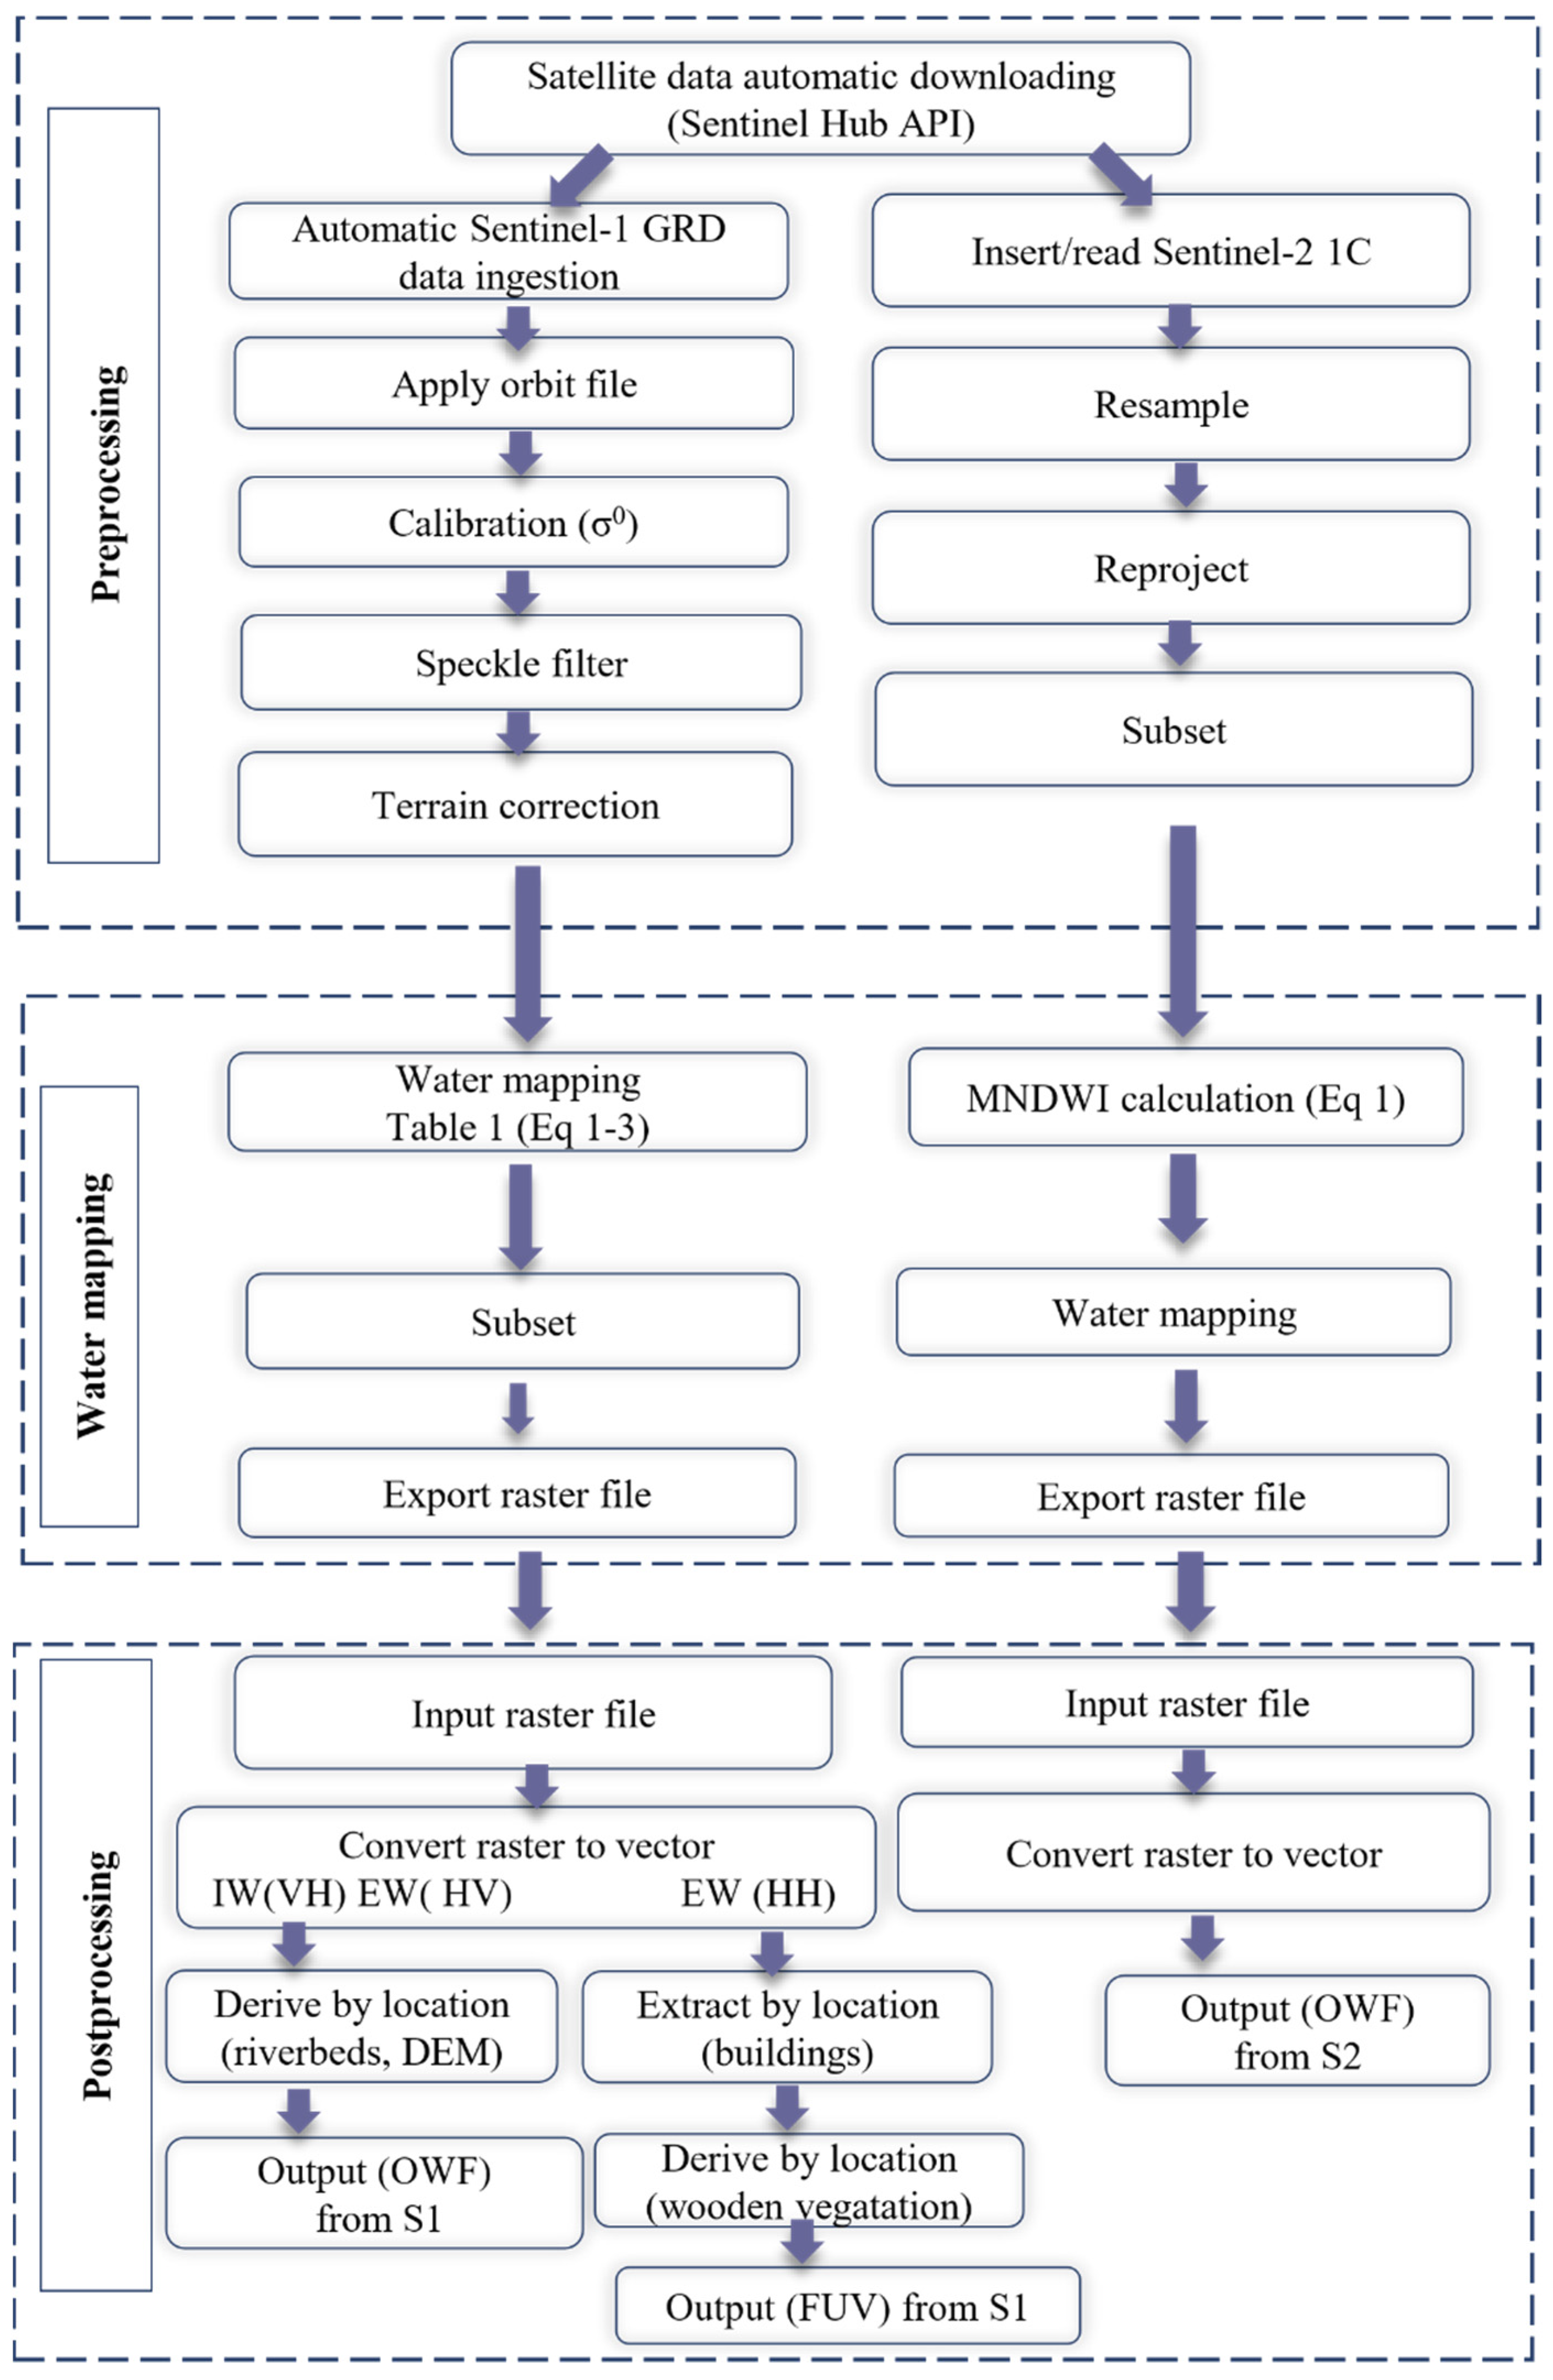
3. Methodology
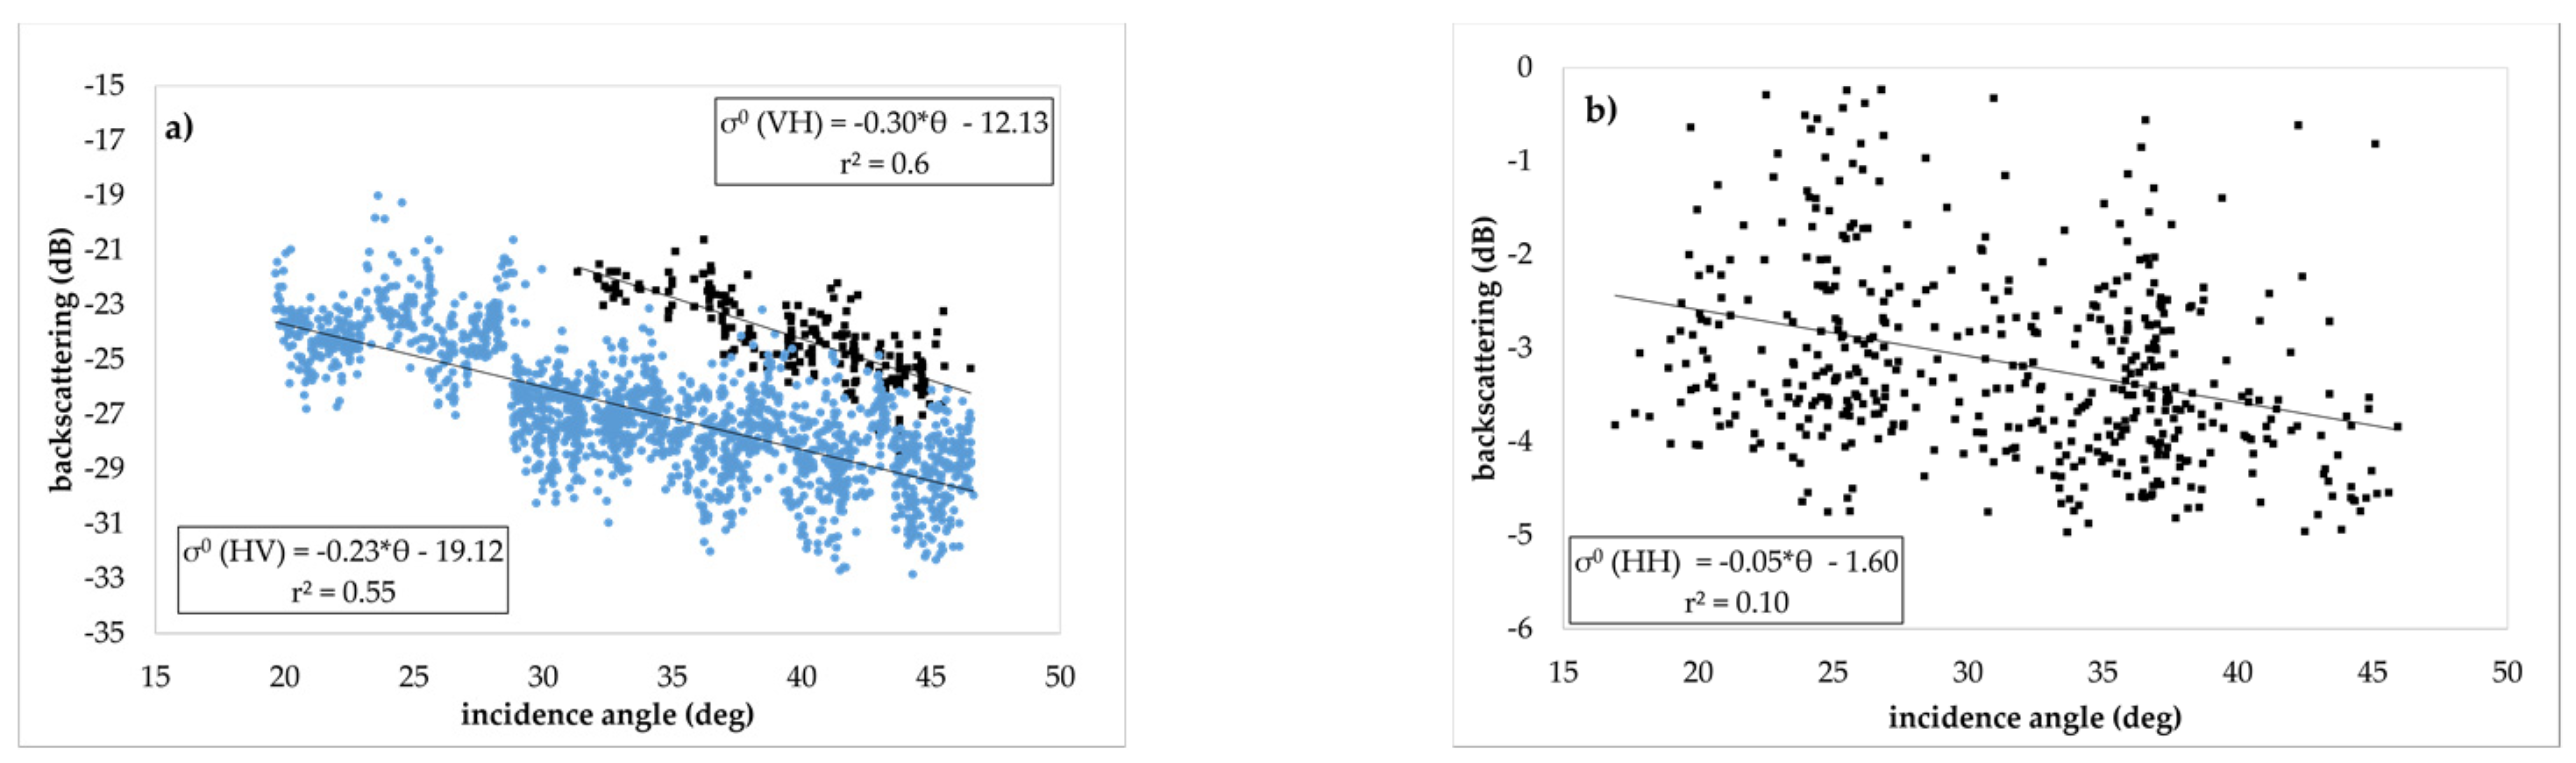
3.1. Sentinel-1 Data Processing
3.2. Sentinel-2 Data Processing
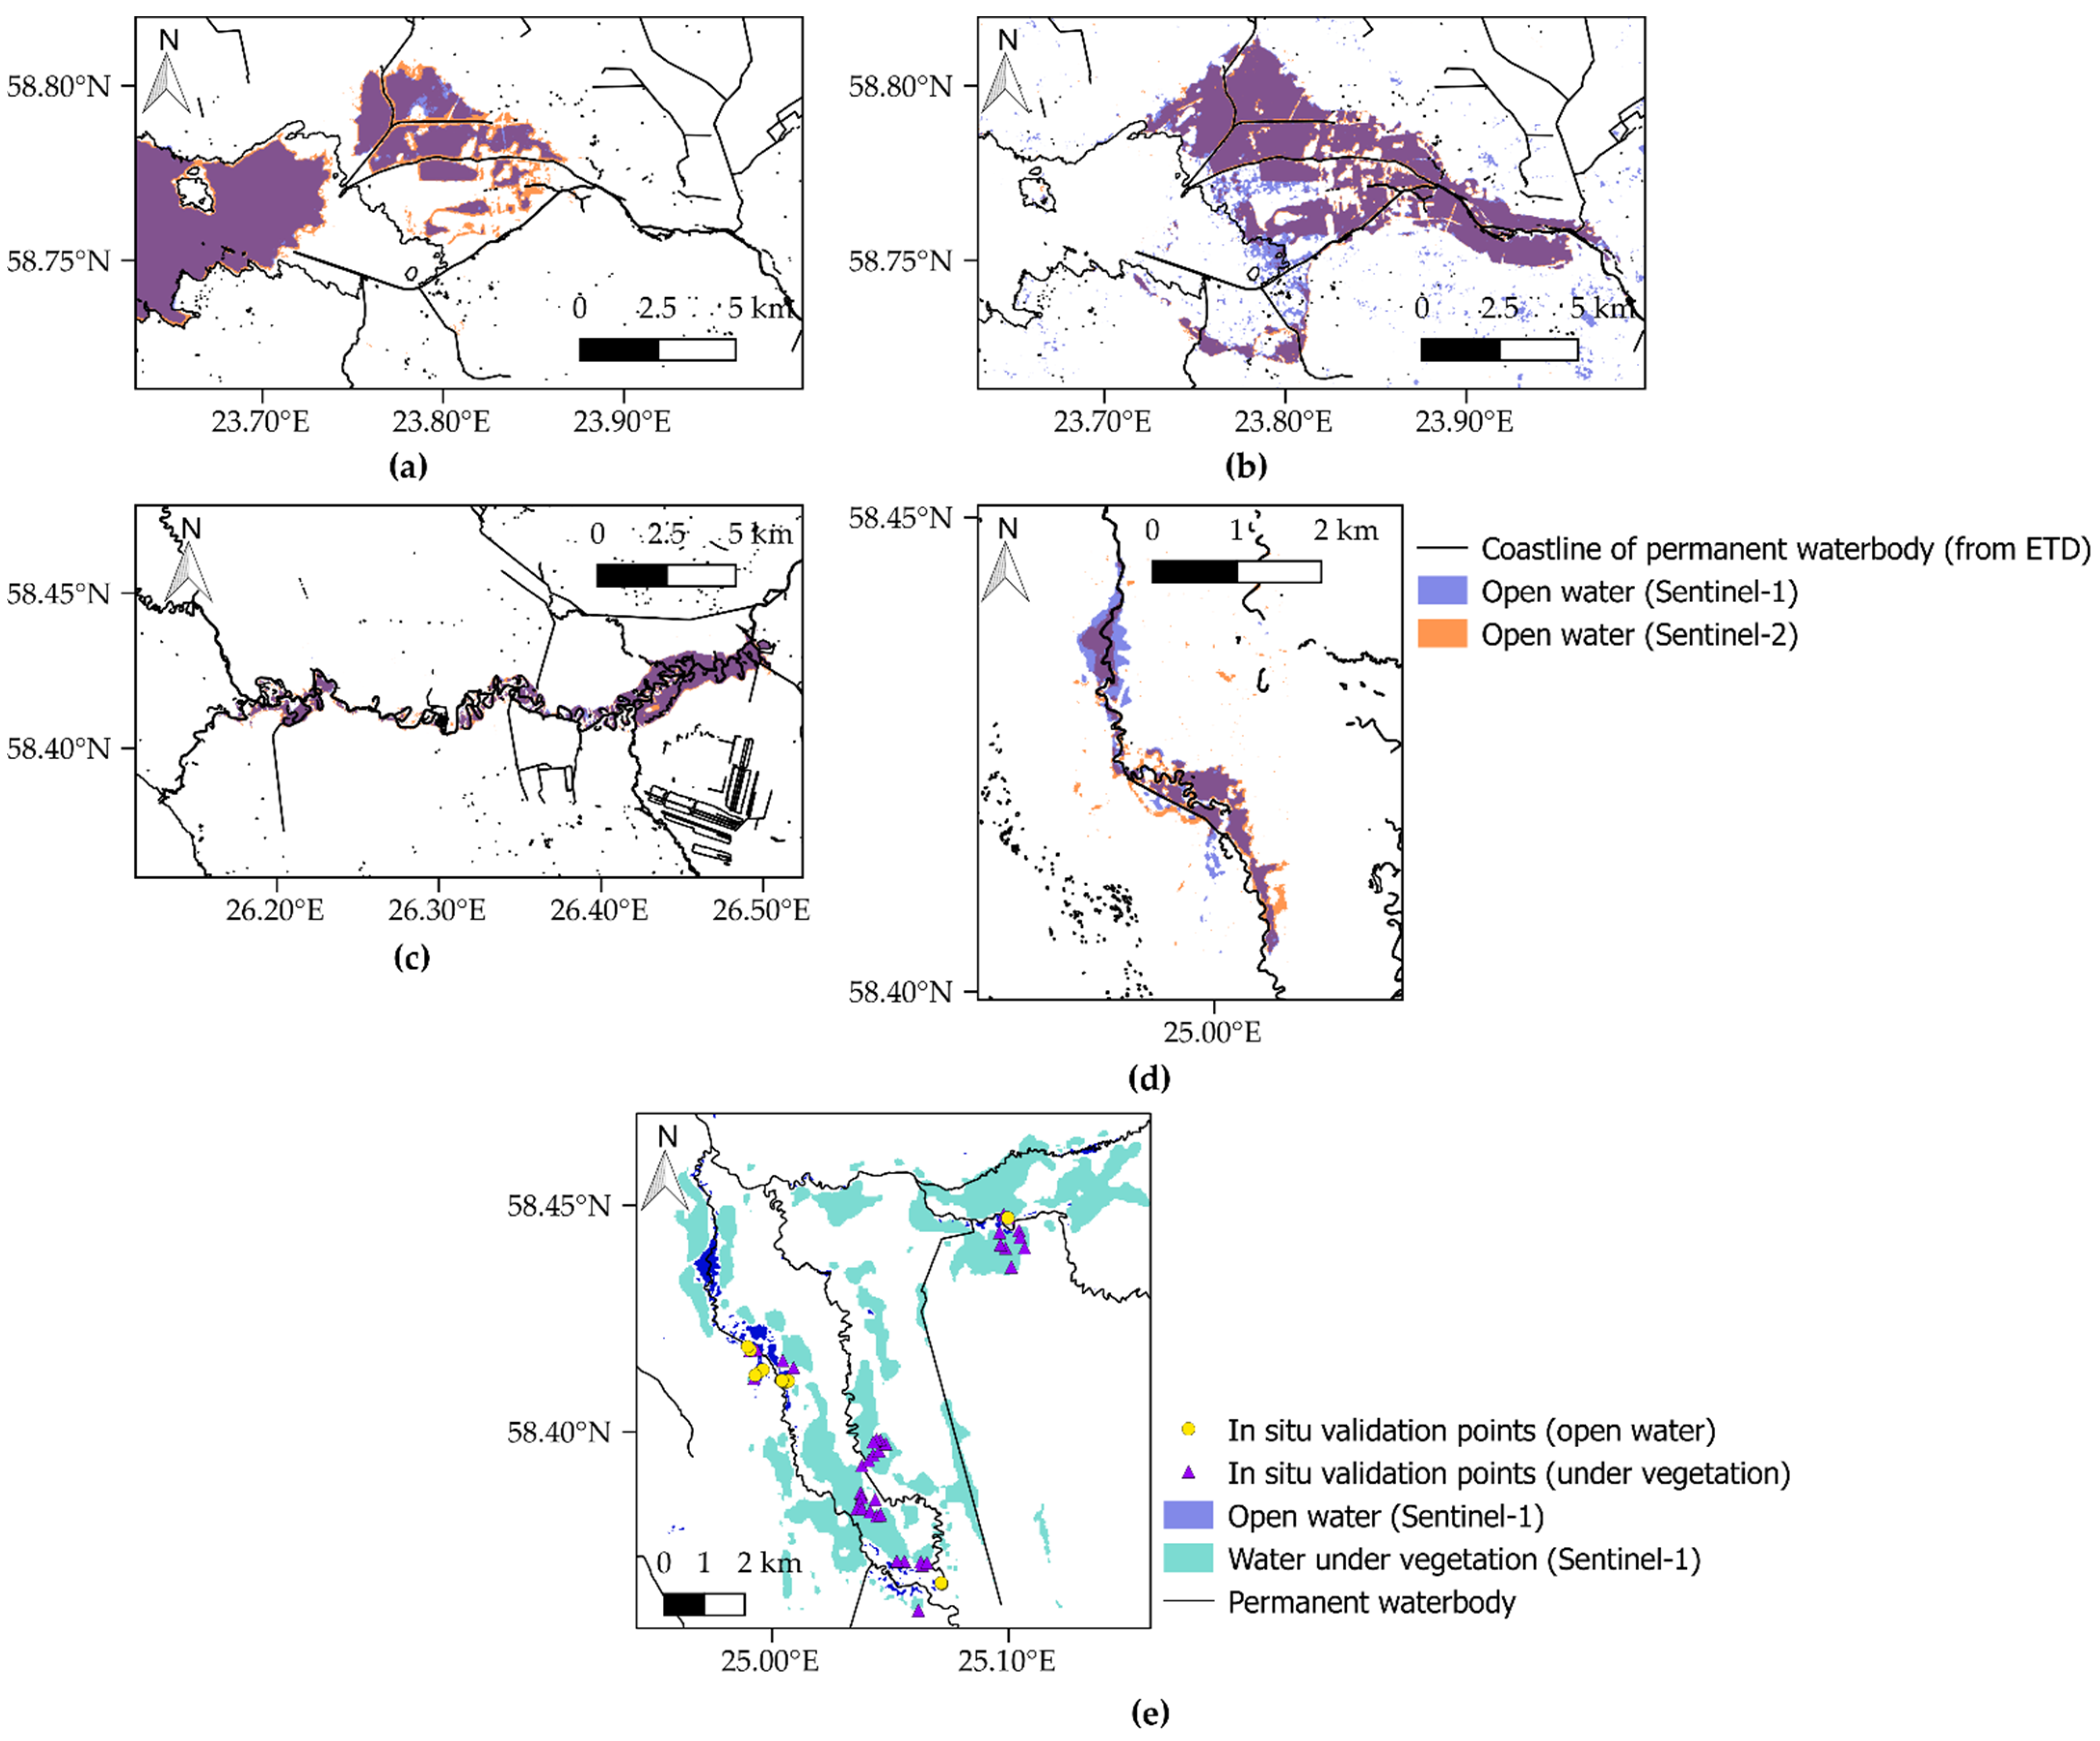
3.3. Accuracy Evaluation
4. Results
4.1. Mapping Accuracy
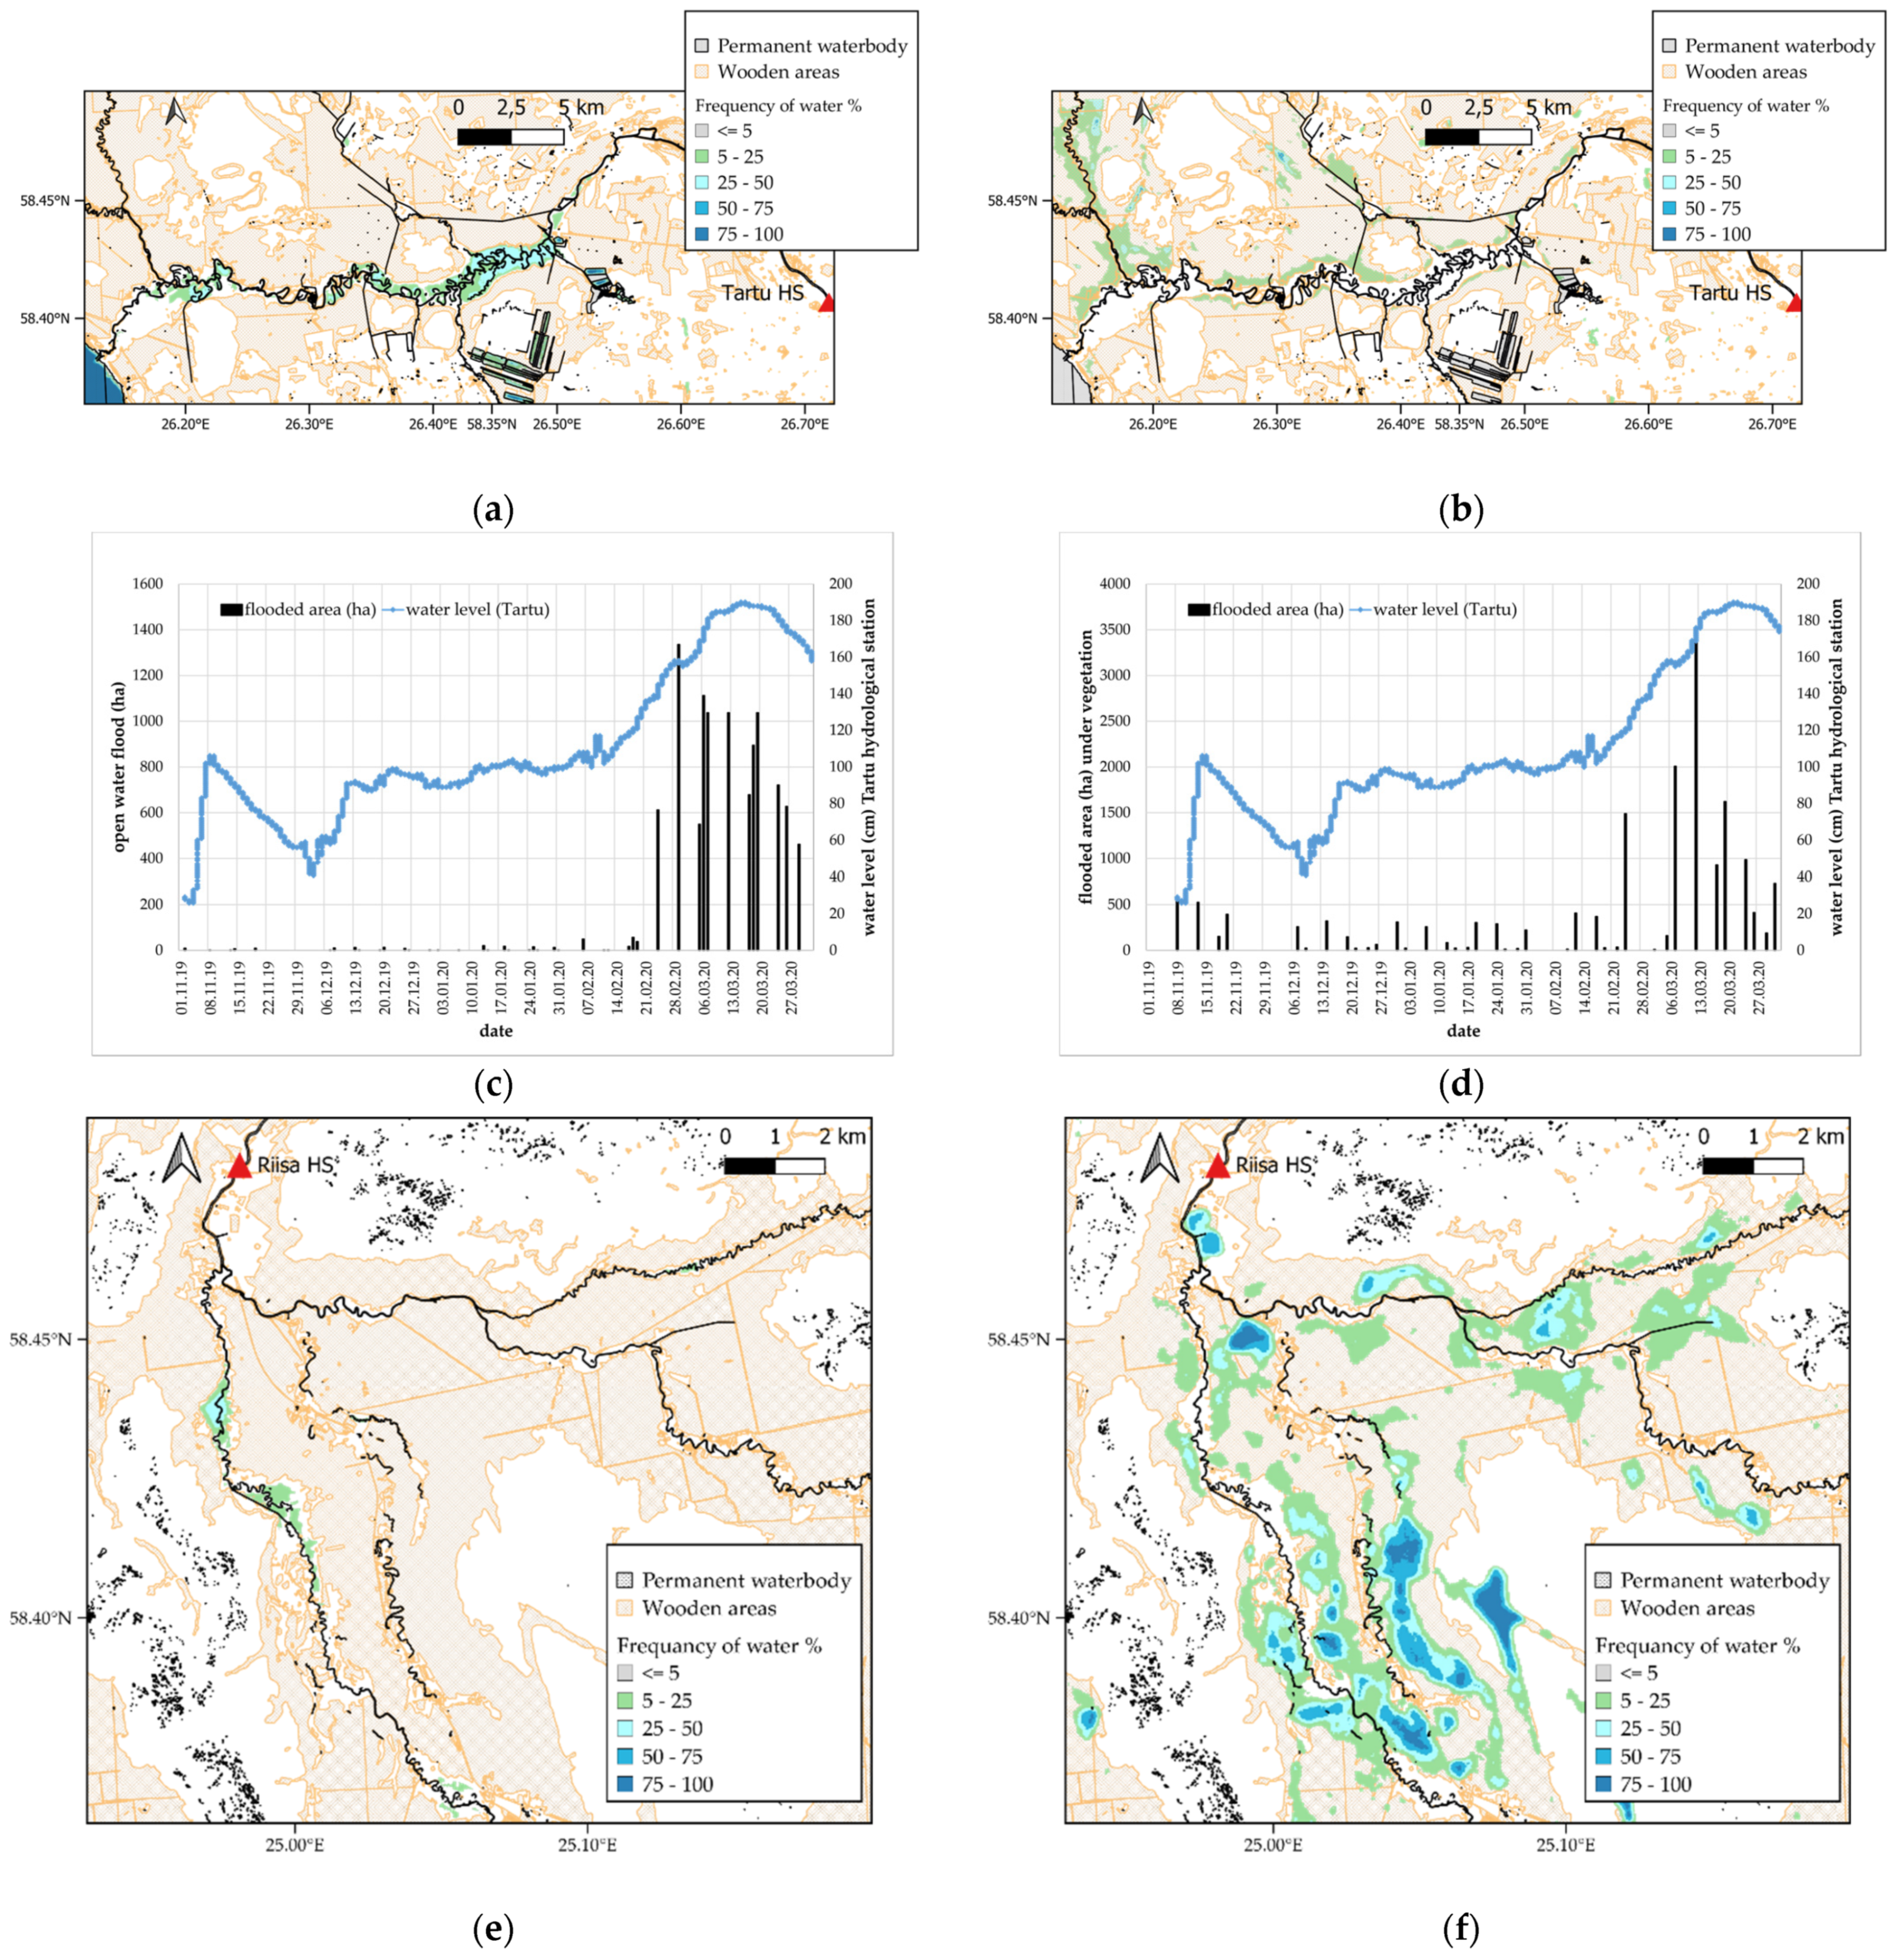
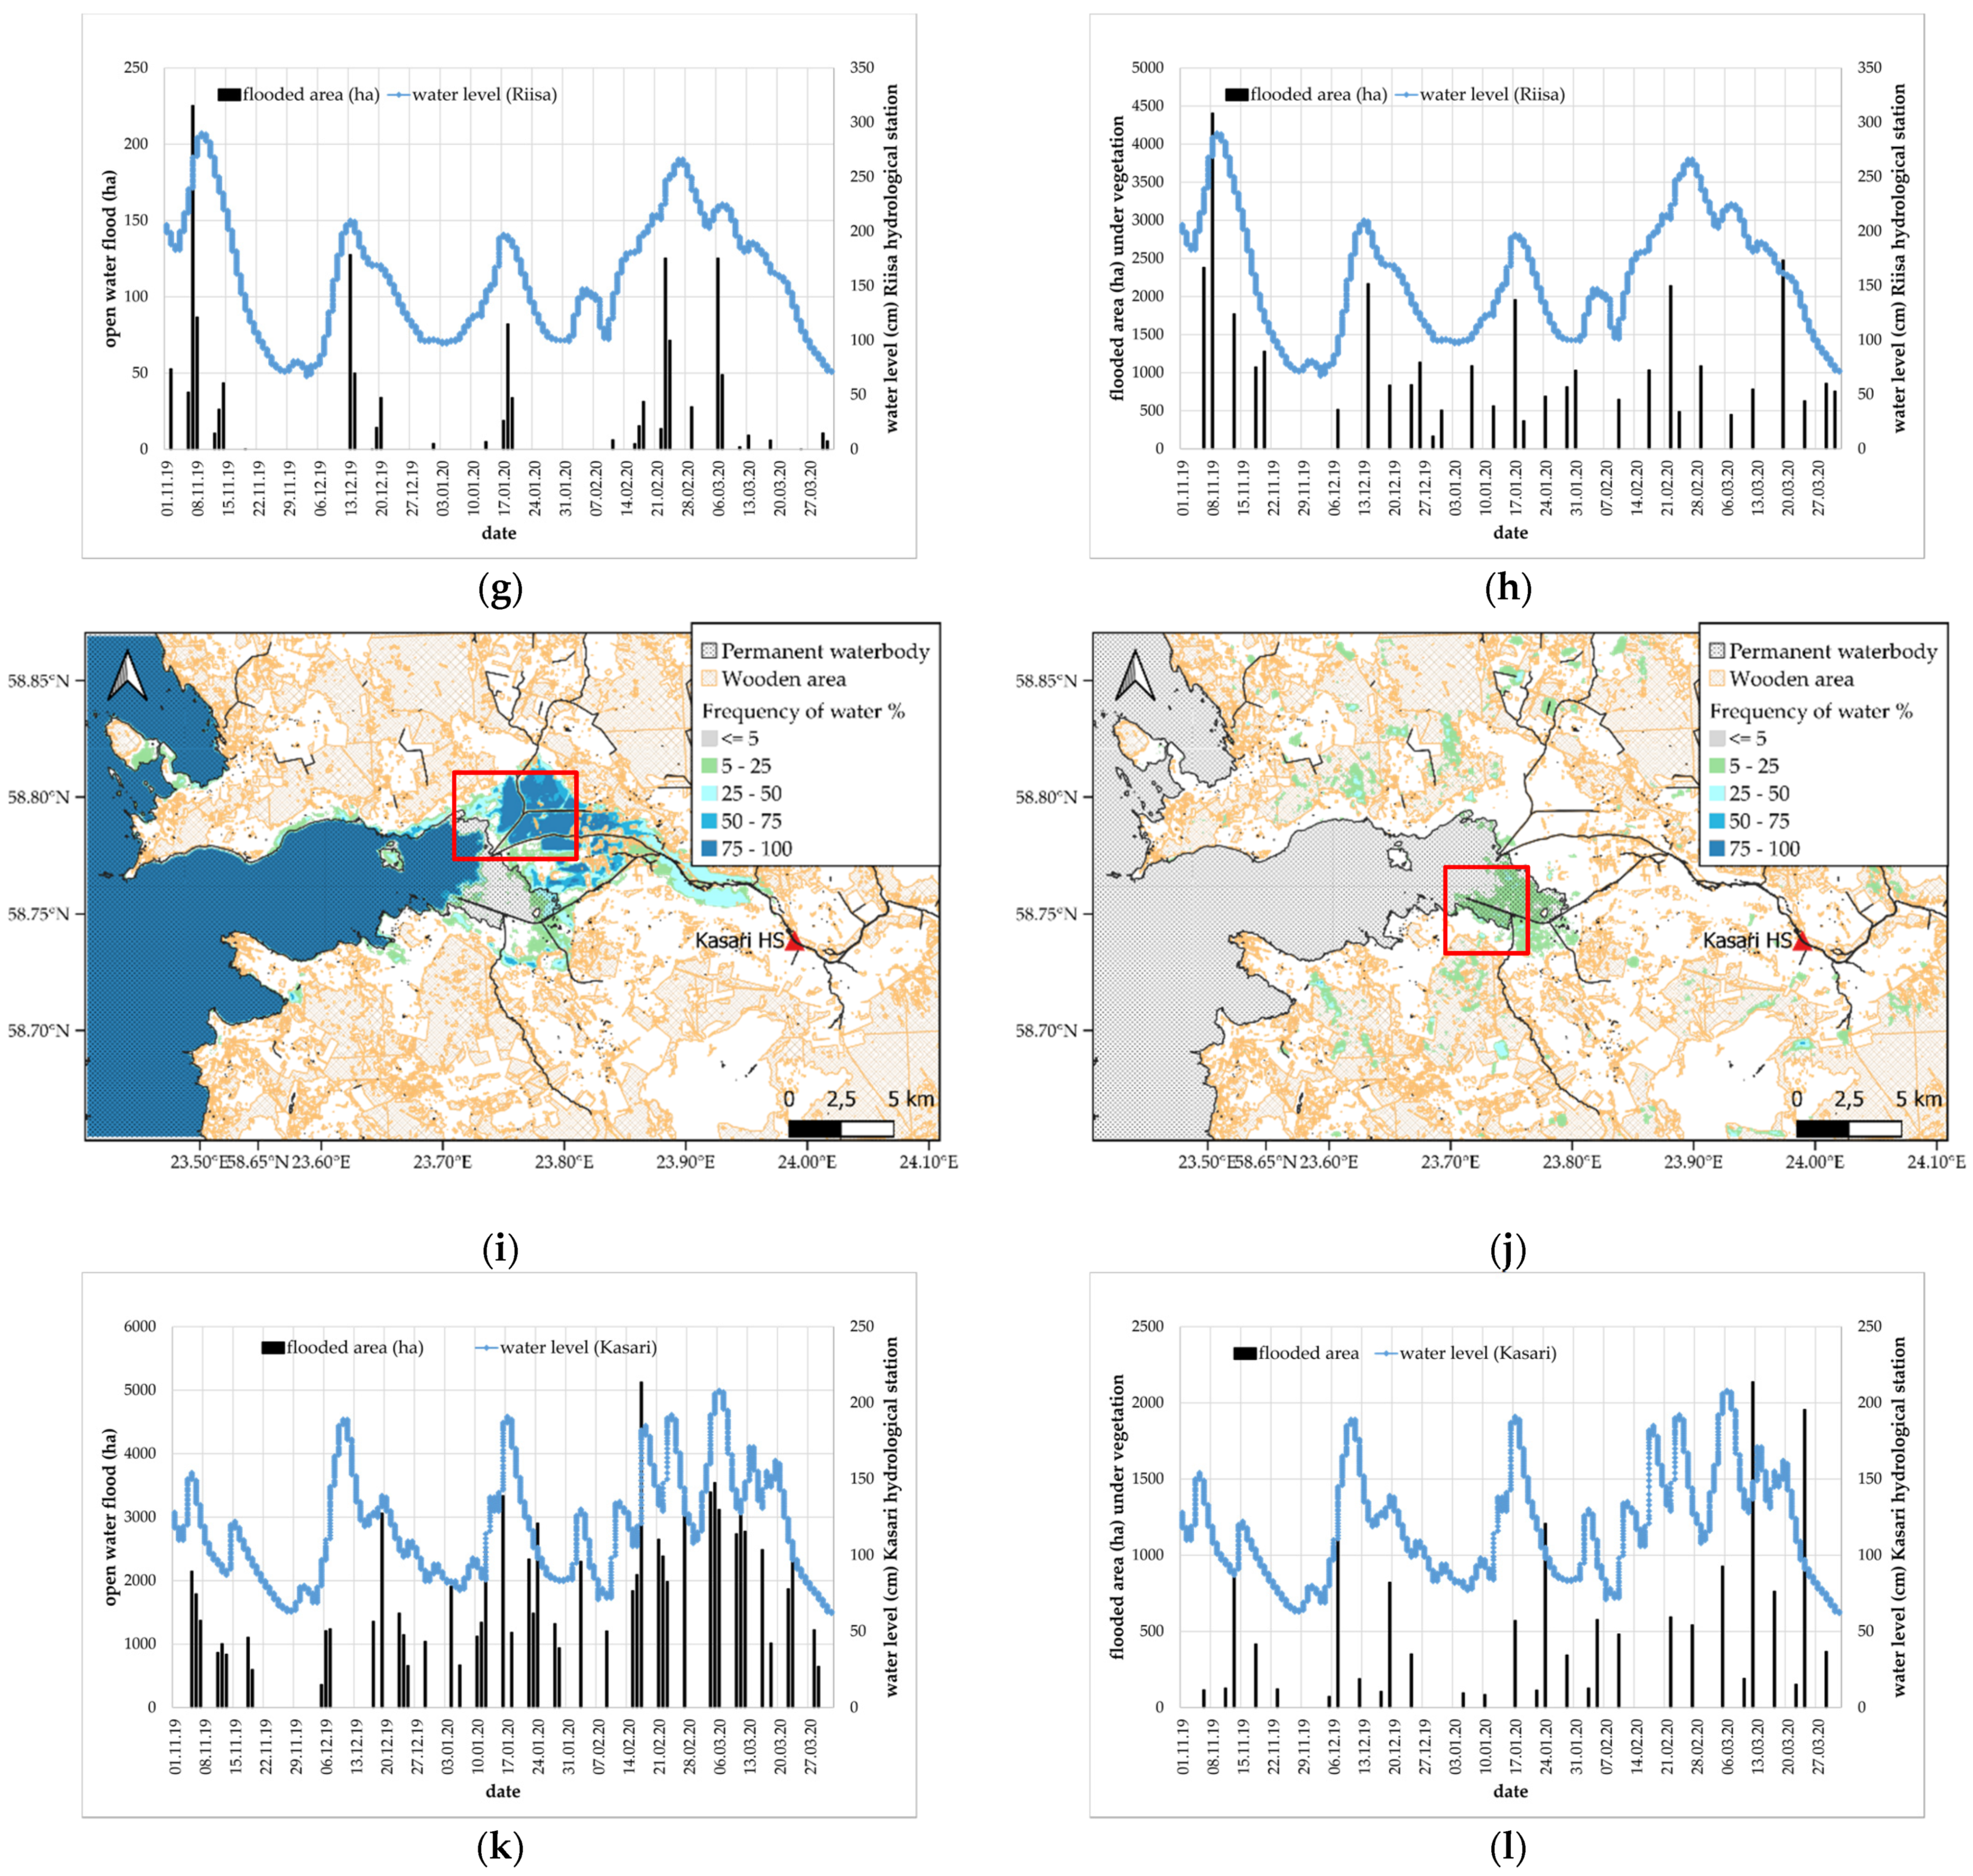
4.2. Flood Extent and Frequency for Winter 2019/2020 in Estonian Floodplains
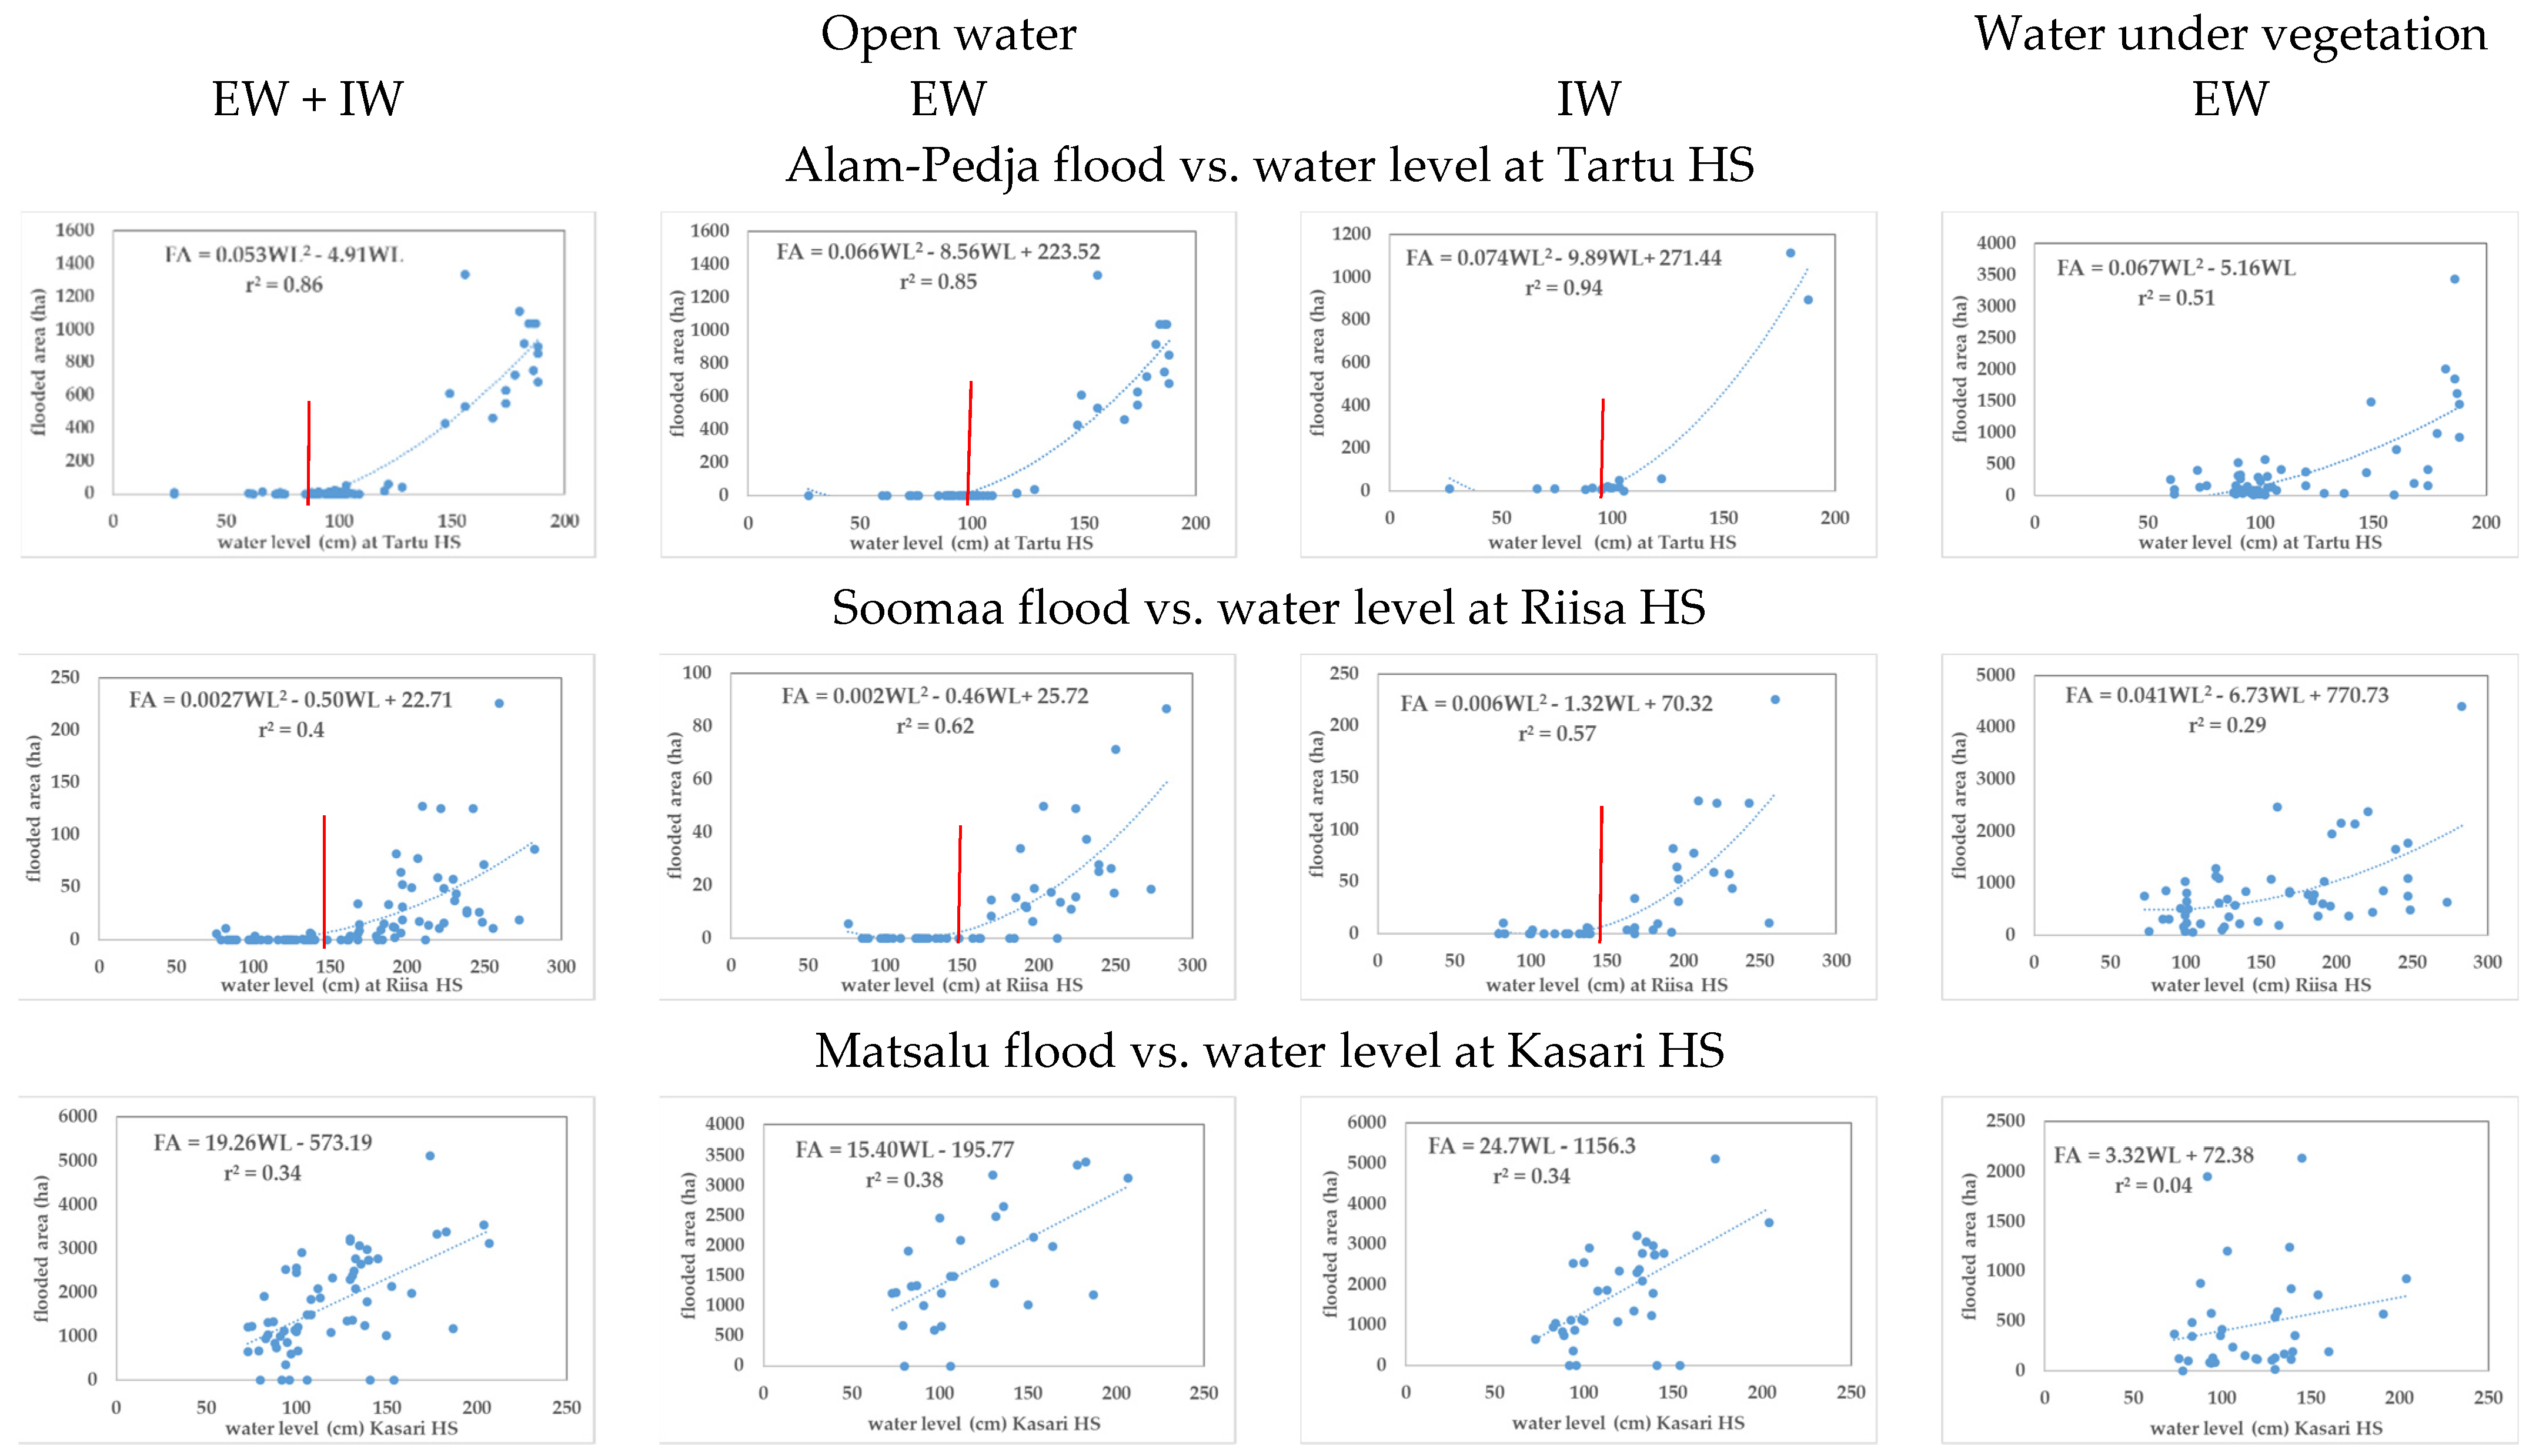
4.3. Causation Analysis between Flood Extent and Water Level Measured at Hydrological Stations
5. Discussion
6. Conclusions
Author Contributions
Funding
Institutional Review Board Statement
Informed Consent Statement
Data Availability Statement
Acknowledgments
Conflicts of Interest
References
- Ulaby, F.; Moore, R.; Fung, A. Microwave Remote Sensing. Active and Passive; Artech House: Norwood, MA, USA, 1986; Volume 3. [Google Scholar]
- Boni, G.; Ferraris, L.; Pulvirenti, L.; Squicciarino, G.; Pierdicca, N.; Candela, L.; Pisani, A.R.; Zoffoli, S.; Onori, R.; Proietti, C.; et al. A Prototype System for Flood Monitoring Based on Flood Forecast Combined with COSMO-SkyMed and Sentinel-1 Data. IEEE J. Sel. Top. Appl. Earth Obs. Remote Sens. 2016, 9, 2794–2805. [Google Scholar] [CrossRef]
- Chen, Y.; Fan, R.; Yang, X.; Wang, J.; Latif, A. Extraction of Urban Water Bodies from High-Resolution Remote-Sensing Imagery Using Deep Learning. Water 2018, 10, 585. [Google Scholar] [CrossRef] [Green Version]
- Martinis, S.; Twele, A.; Strobl, C.; Kersten, J.; Stein, E. A multi-scale flood monitoring system based on fully automatic MODIS and terraSAR-X processing chains. Remote Sens. 2013, 5, 5598. [Google Scholar] [CrossRef] [Green Version]
- Pulvirenti, L.; Pierdicca, N.; Chini, M.; Guerriero, L. An algorithm for operational flood mapping from Synthetic Aperture Radar (SAR) data using fuzzy logic. Nat. Hazards Earth Syst. Sci. 2011, 11, 529–540. [Google Scholar] [CrossRef] [Green Version]
- Pulvirenti, L.; Pierdicca, N.; Chini, M.; Guerriero, L. Monitoring flood evolution in vegetated areas using cosmo-skymed data: The tuscany 2009 case study. IEEE J. Sel. Top. Appl. Earth Obs. Remote Sens. 2013, 6, 1807–1816. [Google Scholar] [CrossRef]
- Uddin, K.; Matin, M.A.; Meyer, F.J. Operational flood mapping using multi-temporal Sentinel-1 SAR images: A case study from Bangladesh. Remote Sens. 2019, 11, 1581. [Google Scholar] [CrossRef] [Green Version]
- Liang, J.; Liu, D. A local thresholding approach to flood water delineation using Sentinel-1 SAR imagery. ISPRS J. Photogramm. Remote Sens. 2020, 159, 53–62. [Google Scholar] [CrossRef]
- Schlaffer, S.; Matgen, P.; Hollaus, M.; Wagner, W. Flood detection from multi-temporal SAR data using harmonic analysis and change detection. Int. J. Appl. Earth Obs. Geoinf. 2015, 38, 15–24. [Google Scholar] [CrossRef]
- Wendleder, A.; Wessel, B.; Roth, A.; Breunig, M.; Martin, K.; Wagenbrenner, S. TanDEM-X water indication mask: Generation and first evaluation results. IEEE J. Sel. Top. Appl. Earth Obs. Remote Sens. 2013, 6, 171–179. [Google Scholar] [CrossRef] [Green Version]
- Chini, M.; Pulvirenti, L.; Pierdicca, N.; Guerriero, L. Multi-temporal segmentation of Cosmo-SkyMed SAR data for flood monitoring. In Proceedings of the 2011 Joint Urban Remote Sensing Event—JURSE 2011, Munich, Germany, 11–13 April 2011. [Google Scholar]
- Chini, M.; Hostache, R.; Giustarini, L.; Matgen, P. A hierarchical split-based approach for parametric thresholding of SAR images: Flood inundation as a test case. IEEE Trans. Geosci. Remote Sens. 2017, 55, 6975–6988. [Google Scholar] [CrossRef]
- Giustarini, L.; Hostache, R.; Matgen, P.; Schumann, G.J.P.; Bates, P.D.; Mason, D.C. A change detection approach to flood mapping in Urban areas using TerraSAR-X. IEEE Trans. Geosci. Remote Sens. 2013, 51, 2417–2430. [Google Scholar] [CrossRef] [Green Version]
- Giustarini, L.; Hostache, R.; Kavetski, D.; Chini, M.; Corato, G.; Schlaffer, S.; Matgen, P. Probabilistic Flood Mapping Using Synthetic Aperture Radar Data. IEEE Trans. Geosci. Remote Sens. 2016, 54, 6958–6969. [Google Scholar] [CrossRef]
- Greifeneder, F.; Wagner, W.; Sabel, D.; Naeimi, V. Suitability of SAR imagery for automatic flood mapping in the Lower Mekong Basin. Int. J. Remote Sens. 2014, 35, 2857–2874. [Google Scholar] [CrossRef]
- Manjusree, P.; Prasanna Kumar, L.; Bhatt, C.M.; Rao, G.S.; Bhanumurthy, V. Optimization of threshold ranges for rapid flood inundation mapping by evaluating backscatter profiles of high incidence angle SAR images. Int. J. Disaster Risk Sci. 2012, 3, 113–122. [Google Scholar] [CrossRef] [Green Version]
- Marti-Cardona, B.; Dolz-Ripolles, J.; Lopez-Martinez, C. Wetland inundation monitoring by the synergistic use of ENVISAT/ASAR imagery and ancilliary spatial data. Remote Sens. Environ. 2013, 139, 171–184. [Google Scholar] [CrossRef]
- Martinis, S.; Kersten, J.; Twele, A. A fully automated TerraSAR-X based flood service. ISPRS J. Photogramm. Remote Sens. 2015, 104, 203–212. [Google Scholar] [CrossRef]
- Long, S.; Fatoyinbo, T.E.; Policelli, F. Flood extent mapping for Namibia using change detection and thresholding with SAR. Environ. Res. Lett. 2014, 9, 035002. [Google Scholar] [CrossRef]
- Clement, M.A.; Kilsby, C.G.; Moore, P. Multi-temporal synthetic aperture radar flood mapping using change detection. J. Flood Risk Manag. 2018, 11, 152–168. [Google Scholar] [CrossRef]
- Chini, M.; Pelich, R.; Pulvirenti, L.; Pierdicca, N.; Hostache, R.; Matgen, P. Sentinel-1 InSAR coherence to detect floodwater in urban areas: Houston and hurricane harvey as a test case. Remote Sens. 2019, 11, 107. [Google Scholar] [CrossRef] [Green Version]
- Pierdicca, N.; Chini, M.; Pulvirenti, L.; Macina, F. Integrating physical and topographic information into a fuzzy scheme to map flooded area by SAR. Sensors 2008, 8, 4151. [Google Scholar] [CrossRef] [Green Version]
- Twele, A.; Cao, W.; Plank, S.; Martinis, S. Sentinel-1-based flood mapping: A fully automated processing chain. Int. J. Remote Sens. 2016, 37, 2990–3004. [Google Scholar] [CrossRef]
- Grimaldi, S.; Xu, J.; Li, Y.; Pauwels, V.R.N.; Walker, J.P. Flood mapping under vegetation using single SAR acquisitions. Remote Sens. Environ. 2020, 237, 111582. [Google Scholar] [CrossRef]
- Tsyganskaya, V.; Martinis, S.; Marzahn, P. Flood monitoring in vegetated areas using multitemporal Sentinel-1 data: Impact of time series features. Water 2019, 11, 1938. [Google Scholar] [CrossRef] [Green Version]
- Henderson, F.M.; Lewis, A.J. Radar detection of wetland ecosystems: A review. Int. J. Remote Sens. 2008, 29, 5809–5835. [Google Scholar] [CrossRef]
- Hess, L.L.; Melack, J.M.; Simonett, D.S. Radar detection of flooding beneath the forest canopy: A review. Int. J. Remote Sens. 1990, 11, 1313–1325. [Google Scholar] [CrossRef]
- Richards, J.A.; Sun, G.Q.; Simonett, D.S. L-Band Radar Backscatter Modeling of Forest Stands. IEEE Trans. Geosci. Remote Sens. 1987, GE-25, 487–498. [Google Scholar] [CrossRef]
- Cohen, J.; Riihimäki, H.; Pulliainen, J.; Lemmetyinen, J.; Heilimo, J. Implications of boreal forest stand characteristics for X-band SAR flood mapping accuracy. Remote Sens. Environ. 2016, 186, 47–63. [Google Scholar] [CrossRef]
- Voormansik, K.; Praks, J.; Antropov, O.; Jagomagi, J.; Zalite, K. Flood mapping with terraSAR-X in forested regions in estonia. IEEE J. Sel. Top. Appl. Earth Obs. Remote Sens. 2014, 7, 562–577. [Google Scholar] [CrossRef]
- Pierdicca, N.; Pulvirenti, L.; Chini, M.; Guerriero, L.; Candela, L. Observing floods from space: Experience gained from COSMO-SkyMed observations. Acta Astronaut. 2013, 84, 122–133. [Google Scholar] [CrossRef]
- Townsend, P.A. Relationships between forest structure and the detection of flood inundation in forested wetlands using C-band SAR. Int. J. Remote Sens. 2002, 23, 443–460. [Google Scholar] [CrossRef]
- Brisco, B.; Schmitt, A.; Murnaghan, K.; Kaya, S.; Roth, A. SAR polarimetric change detection for flooded vegetation. Int. J. Digit. Earth 2011, 6, 103–114. [Google Scholar] [CrossRef]
- Republic of Estonia, Ministry of the Environment. Climate Change Adaptation Development Plan until 2030; Republic of Estonia, Ministry of the Environment: Tallinn, Estonia, 2017.
- Thenkabail, P.S. Remote Sensing Handbook: Remote Sensing of Water Resources, Disasters, and Urban Studies; Taylor & Francis: Boca Raton, FL, USA, 2015; Volume 3, ISBN 9781482217926. [Google Scholar]
- Gauthier, S.; Bernier, P.; Kuuluvainen, T.; Shvidenko, A.Z.; Schepaschenko, D.G. Boreal forest health and global change. Science 2015, 349, 819–822. [Google Scholar] [CrossRef]
- Hari, P.; Kulmala, L. Boreal Forest and Climate Change; Springer: Dordrecht, The Netherlands, 2008; Volume 34, ISBN 978140208. [Google Scholar]
- Dutta, D.; Herath, S.; Musiake, K. A mathematical model for flood loss estimation. J. Hydrol. 2003, 277, 24–49. [Google Scholar] [CrossRef]
- Koks, E.E.; Thissen, M.; Alfieri, L.; De Moel, H.; Feyen, L.; Jongman, B.; Aerts, J.C.J.H. The macroeconomic impacts of future river flooding in Europe. Environ. Res. Lett. 2019, 14, 084042. [Google Scholar] [CrossRef]
- Molinari, D.; Scorzini, A.R.; Gallazzi, A.; Ballio, F. AGRIDE-c, a conceptual model for the estimation of flood damage to crops: Development and implementation. Nat. Hazards Earth Syst. Sci. Discuss. 2019, 19, 2565–2582. [Google Scholar] [CrossRef] [Green Version]
- Estonian Public Broadcasting. Warm Winter Impeding Logging Work. Available online: https://news.err.ee/1021923/warm-winter-impeding-logging-work (accessed on 12 March 2021).
- Copernicus Emergency Management Service. Available online: https://emergency.copernicus.eu/mapping/ems/service-overview (accessed on 10 March 2021).
- Copernicus Land Monitoring Service. Available online: https://land.copernicus.eu/pan-european/high-resolution-layers/water-wetness (accessed on 10 March 2021).
- ESA Sentinel Online. Sentinel-1. Available online: https://sentinel.esa.int/web/sentinel/missions/sentinel-1 (accessed on 12 March 2021).
- ESA Sentinel Online. Sentinel-2. Available online: https://sentinel.esa.int/web/sentinel/missions/sentinel-2 (accessed on 12 March 2021).
- Zoka, M.; Psomiadis, E.; Dercas, N. The Complementary Use of Optical and SAR Data in Monitoring Flood Events and Their Effects. Proceedings 2018, 2, 644. [Google Scholar] [CrossRef] [Green Version]
- Copernicus Open Access Hub. Available online: https://scihub.copernicus.eu/ (accessed on 12 March 2021).
- Estonian Land Board. Estonian Topographic Database. Available online: https://geoportaal.maaamet.ee/eng/Spatial-Data/Estonian-Topographic-Database-p305.html (accessed on 12 March 2021).
- Estonian Environment Agency. Environmental Restriction Areas. Available online: https://gsavalik.envir.ee/geoserver/eelis/ows? (accessed on 12 March 2021).
- Estonian Land Board. Digital Elevation Model. Available online: https://geoportaal.maaamet.ee/est/Ruumiandmed/Korgusandmed/Korgusmudelid-p508.html (accessed on 12 March 2021).
- Estonian Environment Agency. Hydrometeorological Data. Available online: http://www.ilmateenistus.ee/teenused/meteoroloogiline-info/ (accessed on 12 March 2021).
- Sipelgas, L.; Aavaste, A.; Uiboupin, R.; Rikka, S. Methodology for Mapping Flood Extent on Estonian Floodplains. In Proceedings of the IGARSS 2020—2020 IEEE International Geoscience and Remote Sensing Symposium, Waikoloa, HI, USA, 26 September–2 October 2020; pp. 4750–4753. [Google Scholar]
- Sipelgas, L.; Aavaste, A.; Uiboupin, R. Mapping recurrent flooding zone along estonian inland waters from Sentinel-1 and-2. In International Archives of the Photogrammetry, Remote Sensing and Spatial Information Sciences—ISPRS Archives; Copernicus GmbH: Gottingen, Germany, 2020; Volume 43, pp. 627–632. [Google Scholar]
- O’Grady, D.; Leblanc, M.; Bass, A. The use of radar satellite data from multiple incidence angles improves surface water mapping. Remote Sens. Environ. 2014, 140, 652–664. [Google Scholar] [CrossRef]
- Lang, M.W.; Townsend, P.A.; Kasischke, E.S. Influence of incidence angle on detecting flooded forests using C-HH synthetic aperture radar data. Remote Sens. Environ. 2008, 112, 3898–3907. [Google Scholar] [CrossRef]
- Congedo, L. Semi-Automatic Classification Plugin Documentation. 2016. Available online: https://semiautomaticclassificationmanual-v5.readthedocs.io/en/latest/ (accessed on 15 October 2021). [CrossRef]
- Brandt, S.A. Modeling and visualizing uncertainties of flood boundary delineation: Algorithm for slope and DEM resolution dependencies of 1D hydraulic models. Stoch. Environ. Res. Risk Assess. 2016, 30, 1677–1690. [Google Scholar] [CrossRef] [Green Version]
- Wood, M.; de Jong, S.M.; Straatsma, M.W. Locating flood embankments using SAR time series: A proof of concept. Int. J. Appl. Earth Obs. Geoinf. 2018, 70, 72–83. [Google Scholar] [CrossRef]
- European Parliament Council of the European Union. Directive 2007/60/EC of the European Parliament and of the Council of 23 October 2007 on the assessment and management of flood risks. Off. J. Eur. Union 2007, 50, 27–34. [Google Scholar]


| Test Site | Total Size (km2) | Broad-Leaved Forest Area (%) | Coniferous Forest Area (%) | Mixed Forest Area (%) | Natural Grasslands Area (%) |
|---|---|---|---|---|---|
| Alam-Pedja | 546 | 11.5 | 9.3 | 20.9 | 5.5 |
| Soomaa | 1068 | 2.0 | 4.4 | 3.8 | 7.8 |
| Matsalu | 255 | 17.2 | 11.1 | 11.3 | 0.8 |
| Purpose of Data | S1 IW | S1 EW | S2 | UAV |
|---|---|---|---|---|
| Algorithm development (sensitivity) | 1 | 1 | ||
| Algorithm development OWF (incidence angle backscattering dependence) | 7 | 12 | ||
| Algorithm development FUV (incidence angle backscattering dependence) | 3 | |||
| Validation | 2 | 2 | 4 | 44 |
| Test Site | Nov 2019 OWF/FUV | Dec 2019 OWF/FUV | Jan 2020 OWF/FUV | Feb 2020 OWF/FUV | March 2020 OWF/FUV |
|---|---|---|---|---|---|
| Alam-Pedja | 13/7 | 18/11 | 19/14 | 14/9 | 19/13 |
| Soomaa | 18/10 | 19/13 | 20/12 | 15/9 | 21/11 |
| Matsalu | 10/8 | 12/8 | 14/6 | 10/8 | 18/9 |
| S1 Mode | Polarization | Water/Dry Land Difference (dB) | Flooded Forest/Unflooded Forest Difference (dB) | Range of Incidence Angle |
|---|---|---|---|---|
| IW | VH | 10.6 | 0.17 | 39.5–47 |
| IW | VV | 10.2 | 1.32 | 39.5–47 |
| EW | HH | 7.7 | 4.5 | 37.5–46 |
| EW | HV | 9.6 | 0.6 | 37.5–46 |
| S1 Mode | Polarization | Threshold for Water Mapping | SD | No |
|---|---|---|---|---|
| IW | VH | 1.43 | 1 | |
| EW | HV | 2.26 | 2 | |
| EW | HH | 1.06 | 3 |
| Location | Date | Imaging Mode/Polarization | Accuracy (%) | |
|---|---|---|---|---|
| Matsalu | 24 September 2019 | IW/VH | 95.90 | 0.86 |
| Matsalu | 3–4 April 2019 | EW/HV | 97.80 | 0.94 |
| Alam-Pedja | 5 April 2019 | IW/VH | 96.70 | 0.84 |
| Soomaa | 16 November 2017 | IW/VH | 93.60 | 0.62 |
Publisher’s Note: MDPI stays neutral with regard to jurisdictional claims in published maps and institutional affiliations. |
© 2021 by the authors. Licensee MDPI, Basel, Switzerland. This article is an open access article distributed under the terms and conditions of the Creative Commons Attribution (CC BY) license (https://creativecommons.org/licenses/by/4.0/).
Share and Cite
Sipelgas, L.; Aavaste, A.; Uiboupin, R. Mapping Flood Extent and Frequency from Sentinel-1 Imagery during the Extremely Warm Winter of 2020 in Boreal Floodplains and Forests. Remote Sens. 2021, 13, 4949. https://doi.org/10.3390/rs13234949
Sipelgas L, Aavaste A, Uiboupin R. Mapping Flood Extent and Frequency from Sentinel-1 Imagery during the Extremely Warm Winter of 2020 in Boreal Floodplains and Forests. Remote Sensing. 2021; 13(23):4949. https://doi.org/10.3390/rs13234949
Chicago/Turabian StyleSipelgas, Liis, Age Aavaste, and Rivo Uiboupin. 2021. "Mapping Flood Extent and Frequency from Sentinel-1 Imagery during the Extremely Warm Winter of 2020 in Boreal Floodplains and Forests" Remote Sensing 13, no. 23: 4949. https://doi.org/10.3390/rs13234949
APA StyleSipelgas, L., Aavaste, A., & Uiboupin, R. (2021). Mapping Flood Extent and Frequency from Sentinel-1 Imagery during the Extremely Warm Winter of 2020 in Boreal Floodplains and Forests. Remote Sensing, 13(23), 4949. https://doi.org/10.3390/rs13234949