Article

Investigating the Correlation between Multisource Remote Sensing Data for Predicting Potential Spread of Ips typographus L. Spots in Healthy Trees

by
Azadeh Abdollahnejad
*,
Dimitrios Panagiotidis
,
Peter Surový
and
Roman Modlinger
Faculty of Forestry and Wood Sciences, Czech University of Life Sciences (CZU Prague), Kamýcká 129, 165 21 Prague, Czech Republic
*
Author to whom correspondence should be addressed.
Remote Sens. 2021, 13(23), 4953; https://doi.org/10.3390/rs13234953
Submission received: 14 November 2021 / Revised: 29 November 2021 / Accepted: 3 December 2021 / Published: 6 December 2021
(This article belongs to the Section Forest Remote Sensing)

Abstract

:
In the last decade, thousands of hectares of forests have been lost in the Czech Republic, primarily related to European spruce bark beetle (Ips typographus L.), while more than 50% of the remaining Czech forests are in great danger, thus posing severe threats to the resilience, stability, and functionality of those forests. The role of remote sensing in monitoring dynamic structural changes caused by pests is essential to understand and sustainably manage these forests. This study hypothesized a possible correlation between tree health status and multisource time series remote sensing data using different processed layers to predict the potential spread of attack by European spruce bark beetle in healthy trees. For this purpose, we used WorldView-2, Pléiades 1B, and SPOT-6 images for the period of April to September from 2018 to 2020; unmanned aerial vehicle (UAV) imagery data were also collected for use as a reference data source. Our results revealed that spectral resolution is crucial for the early detection of infestation. We observed a significant difference in the reflectance of different health statuses, which can lead to the early detection of infestation as much as two years in advance. More specifically, several bands from two different satellites in 2018 perfectly predicted the health status classes from 2020. This method could be used to evaluate health status classes in the early stage of infestation over large forested areas, which would provide a better understanding of the current situation and information for decision making and planning for the future.

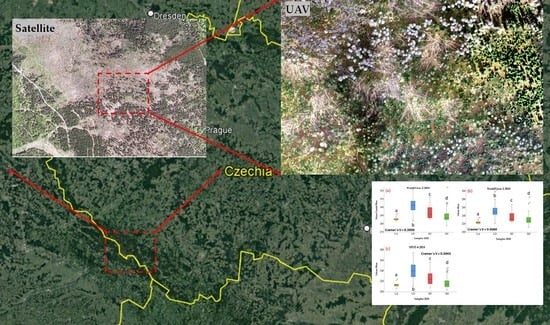
Graphical Abstract

1. Introduction

During the past decade, rising mean annual temperatures have caused drought prolongation and shifts in growing seasons, which have led to an increased frequency of forest insect attacks and mass propagation of the European spruce bark beetle (Ips typographus L.) in the temperate forests of Central Europe [1,2]. For example, spruce (Picea spp.) and pine (Pinus spp.) stands currently account for 49.2% and 15.9% of forests, respectively, in the Czech Republic [3], and usually grow in homogenous forest stands affected by deer damage and root or stem diseases. Such forest stands are more vulnerable to abiotic factors, particularly strong winds [4]. European spruce bark beetles are capable of eruptive population growth, which usually leads to widespread tree mortality, particularly for Norway spruce (Picea abies (L.) Karst.) stands [5]. Several studies have also observed a connection between European spruce bark beetle outbreaks and other forms of forest disturbances, such as snow damage and windthrows [6,7,8,9]. However, the recent unprecedented bark beetle outbreak in Czechia indicates a shift to more drought-driven dynamics [10]. Unfortunately, the situation continues to escalate, thus posing serious threats for the health and future of forests in central Europe [11]. Despite the abundance of literature and research about the European spruce bark beetle, the driving forces behind such eruptive population dynamics are not fully understood. From a management perspective, attacked spruce forests are difficult to control. Forest managers require thorough knowledge of the: (i) impacted forest area, (ii) bark beetle spatial spread patterns, and (iii) factors influencing the risk of abiotic disturbances on forest stand structures (e.g., windthrow) [12].
In forest monitoring and mapping, extensive scale coverage of damaged forests by field observations is practically impossible [13]. However, remote sensing approaches can quantify the expansion and frequency of European spruce bark beetle outbreaks by monitoring and mapping the spatiotemporal changes over time [14,15]. In addition, drought stress affects the biochemical and biophysical properties of trees, and creates spectral signature variations that can be inferred from moisture content decreases and chlorophyll fluorescence changes [16,17]. Different satellite sensors have been used to identify disturbed forest areas because they offer data collection ability over broad geographic regions at multiple resolutions [18,19]. In addition, very-high-resolution satellites, such as Pléiades 1A/1B (PHRB) and WorldView-2 (WV2), can be utilized to detect disturbed areas (e.g., harvested areas), and estimate and extrapolate individual tree parameters with significant accuracy [20,21,22].
Most studies of the detection of disturbed trees by pests are based on optical remote sensing sensors. One of the main advantages of optical satellite sensors is the increased number of spectral bands; the spectral properties of each band can be effectively used for forest pest disturbance monitoring and mapping. The red edge and green regions of the electromagnetic spectrum (400 to 700 nm) have proven to be very sensitive to changes in chlorophyll content [22]. Furthermore, WorldView-2 has a red edge band with superior sensitivity for early detection of damaged trees by bark beetles [23,24]. Immitzer and Atzberger [25] used satellite images acquired by WorldView-2 for early-stage detection of European spruce bark beetle attacks, with an overall accuracy of 70% for distinguishing green-attacked trees from healthy trees. Mullen [26] also used WorldView-2 for early-stage tree damage detection by montane pine beetles, with an overall accuracy of 75% to distinguish between green-attacked trees and nonattacked trees. In another study, Flichev [27] used WorldView-2 images to assess the damage caused by European spruce bark beetles in the Bistrishko Branishte UNESCO Man and Biosphere (MAB) reserve using several vegetation indices (VIs). His results showed that the plant stress index CSc (λ = 605/760 nm) performed better in detecting stressed trees than the anthocyanin reflectance index (ARI). Finally, Huo et al. [28] used Sentinel-1 and Sentinel-2 images (with Pléiades images as reference data) to detect forest areas attacked by bark beetles. To obtain the precise locations of the attack, they conducted visual interpretations from bitemporal data. Based on images from 2018, the attacked-tree crowns were visible as gray in R-G-B (red-blue-green) and as green in IR-R-B (infrared-red-blue).
Within the Czech Republic, there has been an effort to conduct a systematic forest health assessment. Since 2016, Sentinel-2 cloudless images have been used to produce leaf area index (LAI) maps based on annual intervals. Forest health status is then assessed based on LAI changes during the selected time interval [29,30]. To our knowledge, there have been no previous studies that used UAV images as reference data together with a variety of very-high-resolution satellite platforms and time series data for the detection of European spruce bark beetle dispersal patterns. Additionally, this is the first study that used tasseled cap transformation for the Pléiades 1B satellite platform. The main objectives of this study were to test:
(1)
The correlation between tree health status (standing and lying trees) and time series remote sensing data using different processed layers;
(2)
The best correlated layers between healthy and nonhealthy trees to investigate all those significant differences in, for example, the amount of brightness, greenness, and wetness, among other indicators that could lead to early detection of European spruce bark beetle in healthy trees.
This study aimed to create a blueprint for predicting potential dispersal patterns of European spruce bark beetle from the unhealthy (attacked) to healthy trees, hoping that it could lead to more efficient forest management strategies that provide increased protection for the healthy trees.

2. Materials and Methods

2.1. Study Area

The study was conducted on the Czech side of the Smrčina Mountain; the nature conservation area is located in the eastern portion of Šumava National Park (Figure 1a). The park is part of the Natura 2000 network, which aims to protect the most endangered species and habitats in the European Union. The peak of Smrčina Mountain (1333 a.s.l.) and the saddle to Hraničník Mountain are populated by natural spruce forests that are almost 250 years old, including Calamagrostio villosae-Piceetum and Athyrio alpestris-Piceetum [31], which, at the time of study, were part of a nonintervention regime. The broader area of Smrčina was subject to salvage logging after a serious bark beetle outbreak that ended approximately 10 years ago. During the Herwart windstorm (28–29 October 2017), the forest stands in the Smrčina territory were heavily damaged, and the result was several large windthrow areas. The downed spruce trees were quickly occupied by bark beetles (dominantly Ips typographus L.), allowing the European spruce bark beetle to increase its population density, which resulted in an outbreak. Due to the disturbance event, large, patched mosaics of standing dead trees, lying dead trees, and snags remain in the area (Figure 1b,c).

2.2. UAV Data Acquisition—Preprocessing and Sampling

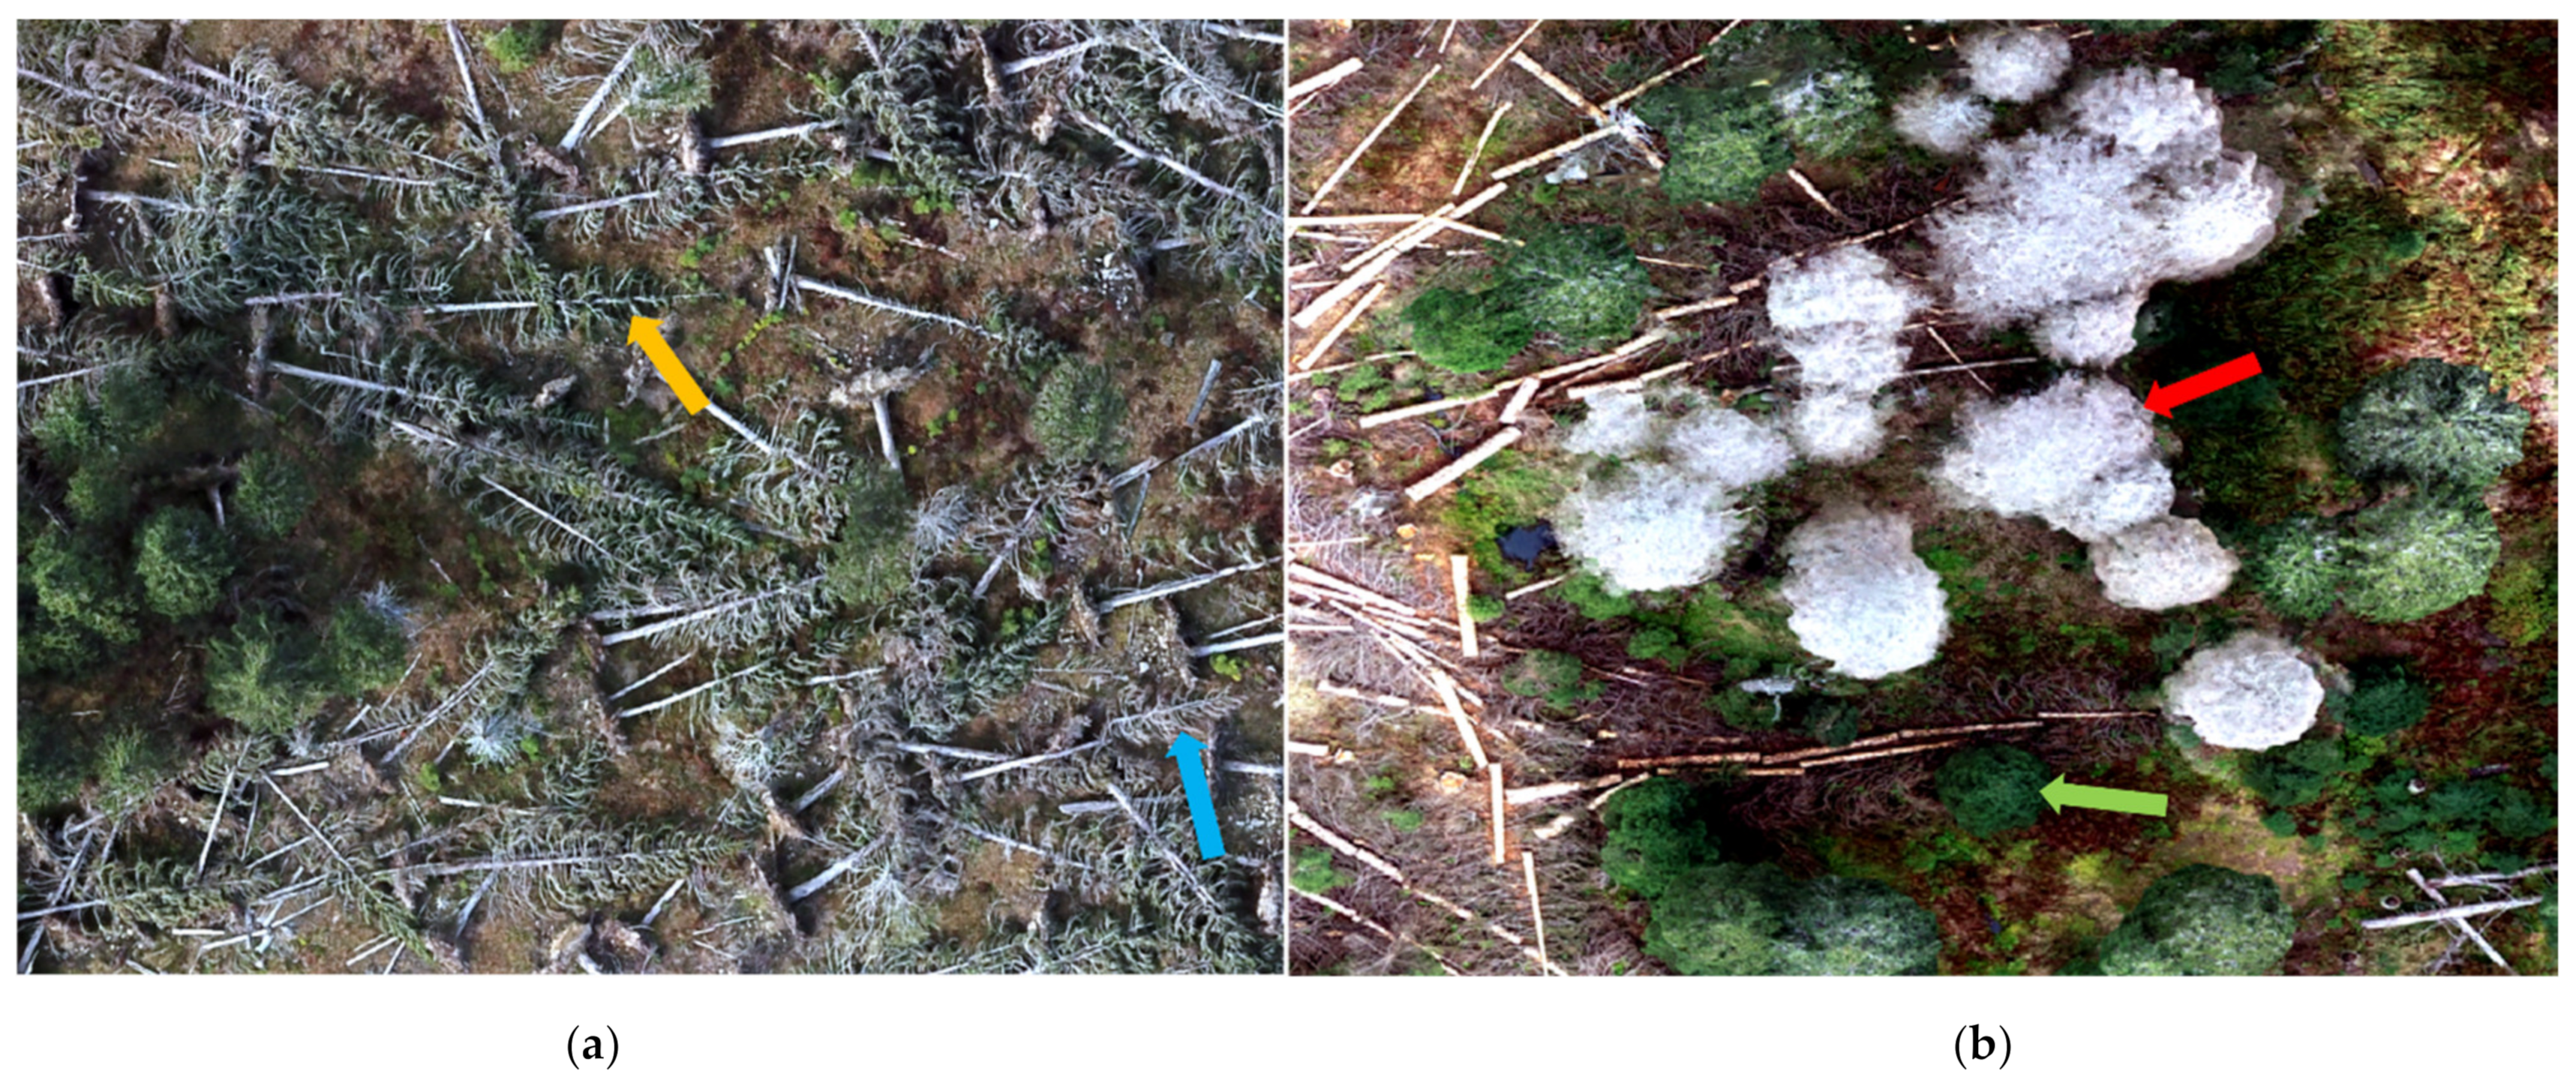
We used the DJI Phantom 4 Pro quadcopter (Dá-Jiāng Innovations Science and Technology Co. Ltd., Shenzhen, China), which was equipped with an integrated R-G-B sensor of 20 Mpix resolution, a sensor size of 1 inch, aperture f/2.8–f/11, mechanical shutter, and maximum ISO 12,800. For this study, Phantom 4 Pro offered two main advantages; first, the mechanical shutter does not cause geometric distortions, and, second it provides image acquisition with less noise and greater details. Both were significant advantages because the UAV data, apart from being interpreted visually to provide reference data (Figure 2a,b), also georeferenced the available satellite images (see details in Section 2.3).
UAV image acquisition was conducted during the period of 2018 to 2020, and included 12 flights in total, with 4 flights per year at a height of 100 m above the ground with 80% frontal overlap and 70% side overlap. The UAV data were acquired from May to mid-June for 2018, and in June of 2019 and 2020. The following properties was used in preprocessing of UAV data: alignment: high, 40,000 key points, 4000 tie points, medium-quality dense cloud. The first alignment was refined using the optimize cameras method. The spatial resolution for all UAV images was 3 cm. R-G-B aerial images from all years were photogrammetrically processed using structure-from-motion (SfM) in Metashape (Agisoft LLC: St. Petersburg, Russia). To optimize the final 3D models and before the alignment process, we set the accuracy to high. The georeferencing of the point cloud was done exclusively by the onboard global positioning system (GPS) sensor, which geotagged each raster; the GPS signal had high accuracy given the mountaintop location of the study area.
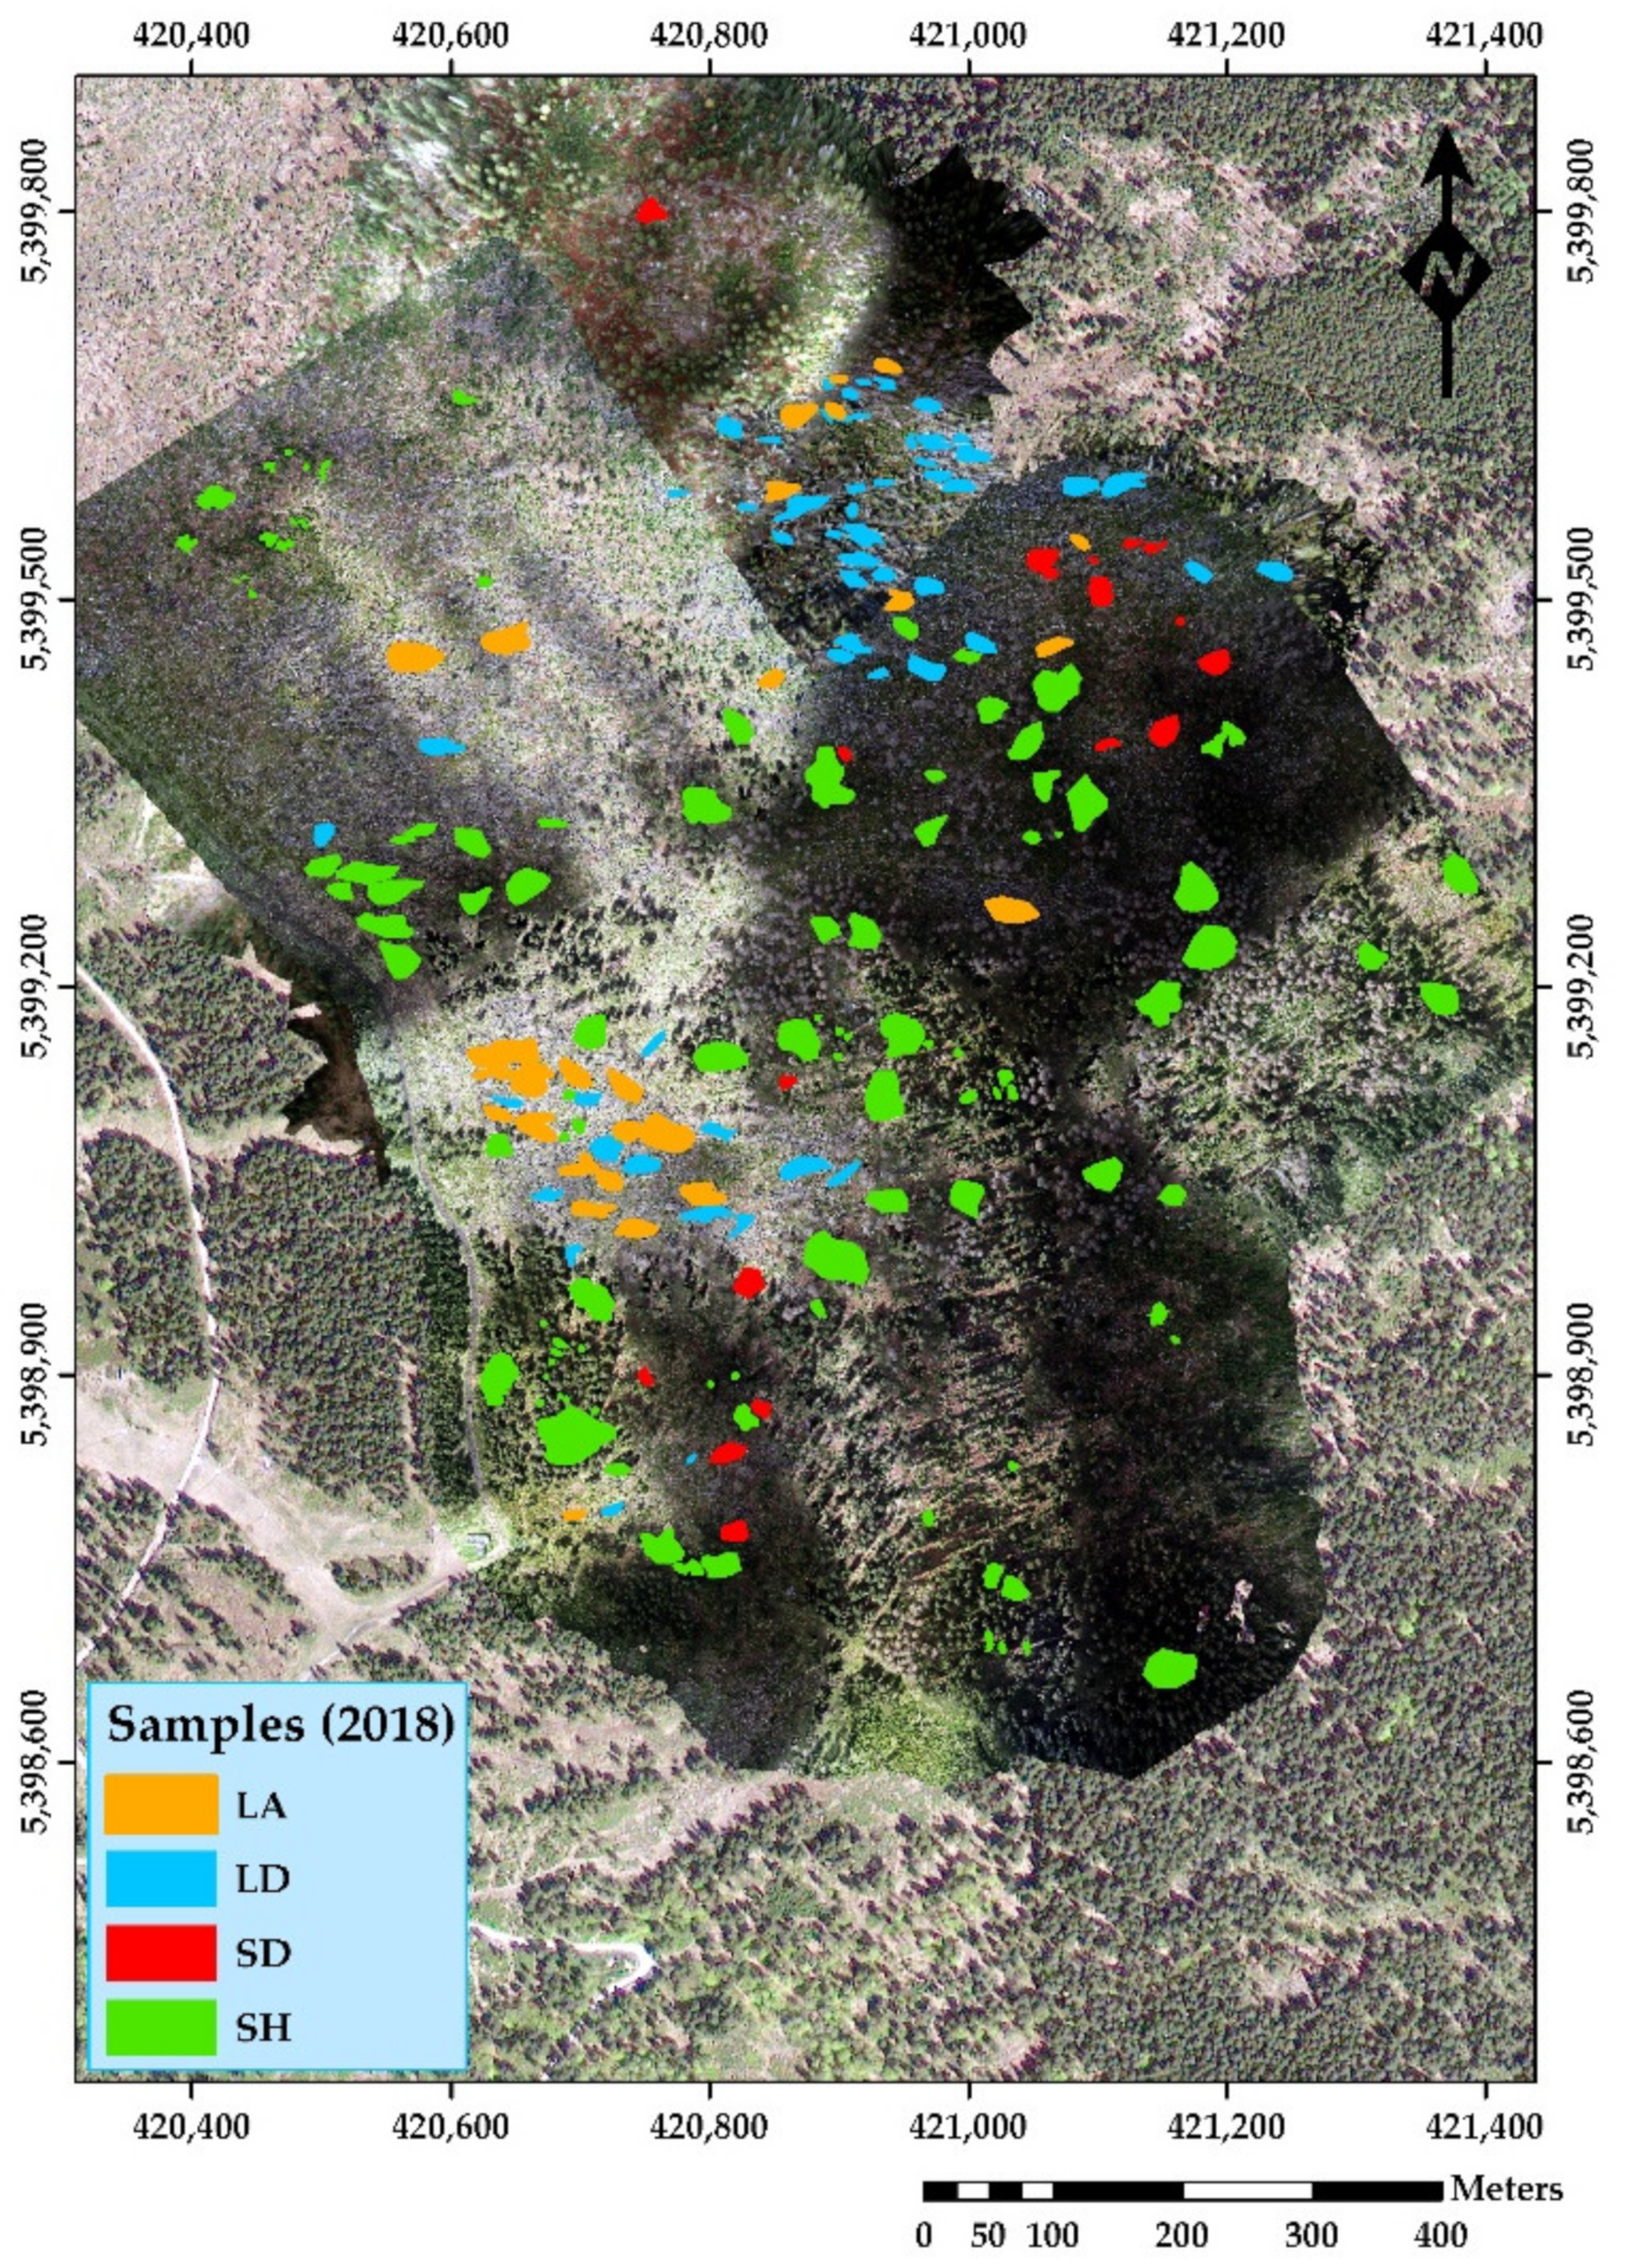
The UAV orthomosaic images were used as reference data to create samples for the years 2018, 2019, and 2020. The samples were selected based on visual interpretation, and they were divided into four different feature classes including standing healthy, standing dead, lying attractive, and lying dead (Figure 3). The primary reason for using visual interpretation was that remotely sensed data are less costly and time consuming than traditional methods. All samples were non-fixed-size polygons (Figure 3). Although samples were randomly selected, we distributed them to cover the entire study area, and the number of selected samples in each class was not fixed (see details in Table 1). After the sample selection, we used the zonal statistics as table tool of ArcGIS Pro V2.7.2 (ESRI Inc., Redlands, CA, USA) to extract the spectral information in each class to evaluate the relationship between the spectral data and sample classes for each year.

2.3. Acquisition and Preprocessing of Satellite Imagery

We used seven satellite images, two by Pléiades 1B (April 2019 and September 2020), three by SPOT-6 (September 2018, July 2019, and July 2020), and two by WorldView-2 (August 2018 and September 2019); see Table 2 for a detailed description of the characteristics of each satellite platform. Unfortunately, no data were found for the study area in 2018 for Pléiades 1B and for 2020 from WorldView-2. To achieve accurate georeferencing for all the satellite images, we used the mosaicked georeferenced image provided by the UAV with an accuracy of 1 cm. In addition, an additional pan-sharpened frame of TripleSat from the year 2018 was used, with an error of less than 25 cm. For georeferencing of Pléiades 1B and WorldView-2, the total error was less than 1 m, while for SPOT-6 it was less than 3 m. Radiometric evaluation for all satellite images was performed visually using a histogram of values for each band. The entire process of satellite image preprocessing was conducted in ArcGIS Pro V2.7.2 (ESRI Inc. Redlands, CA, USA).

2.4. Processing of Spectral Satellite Data

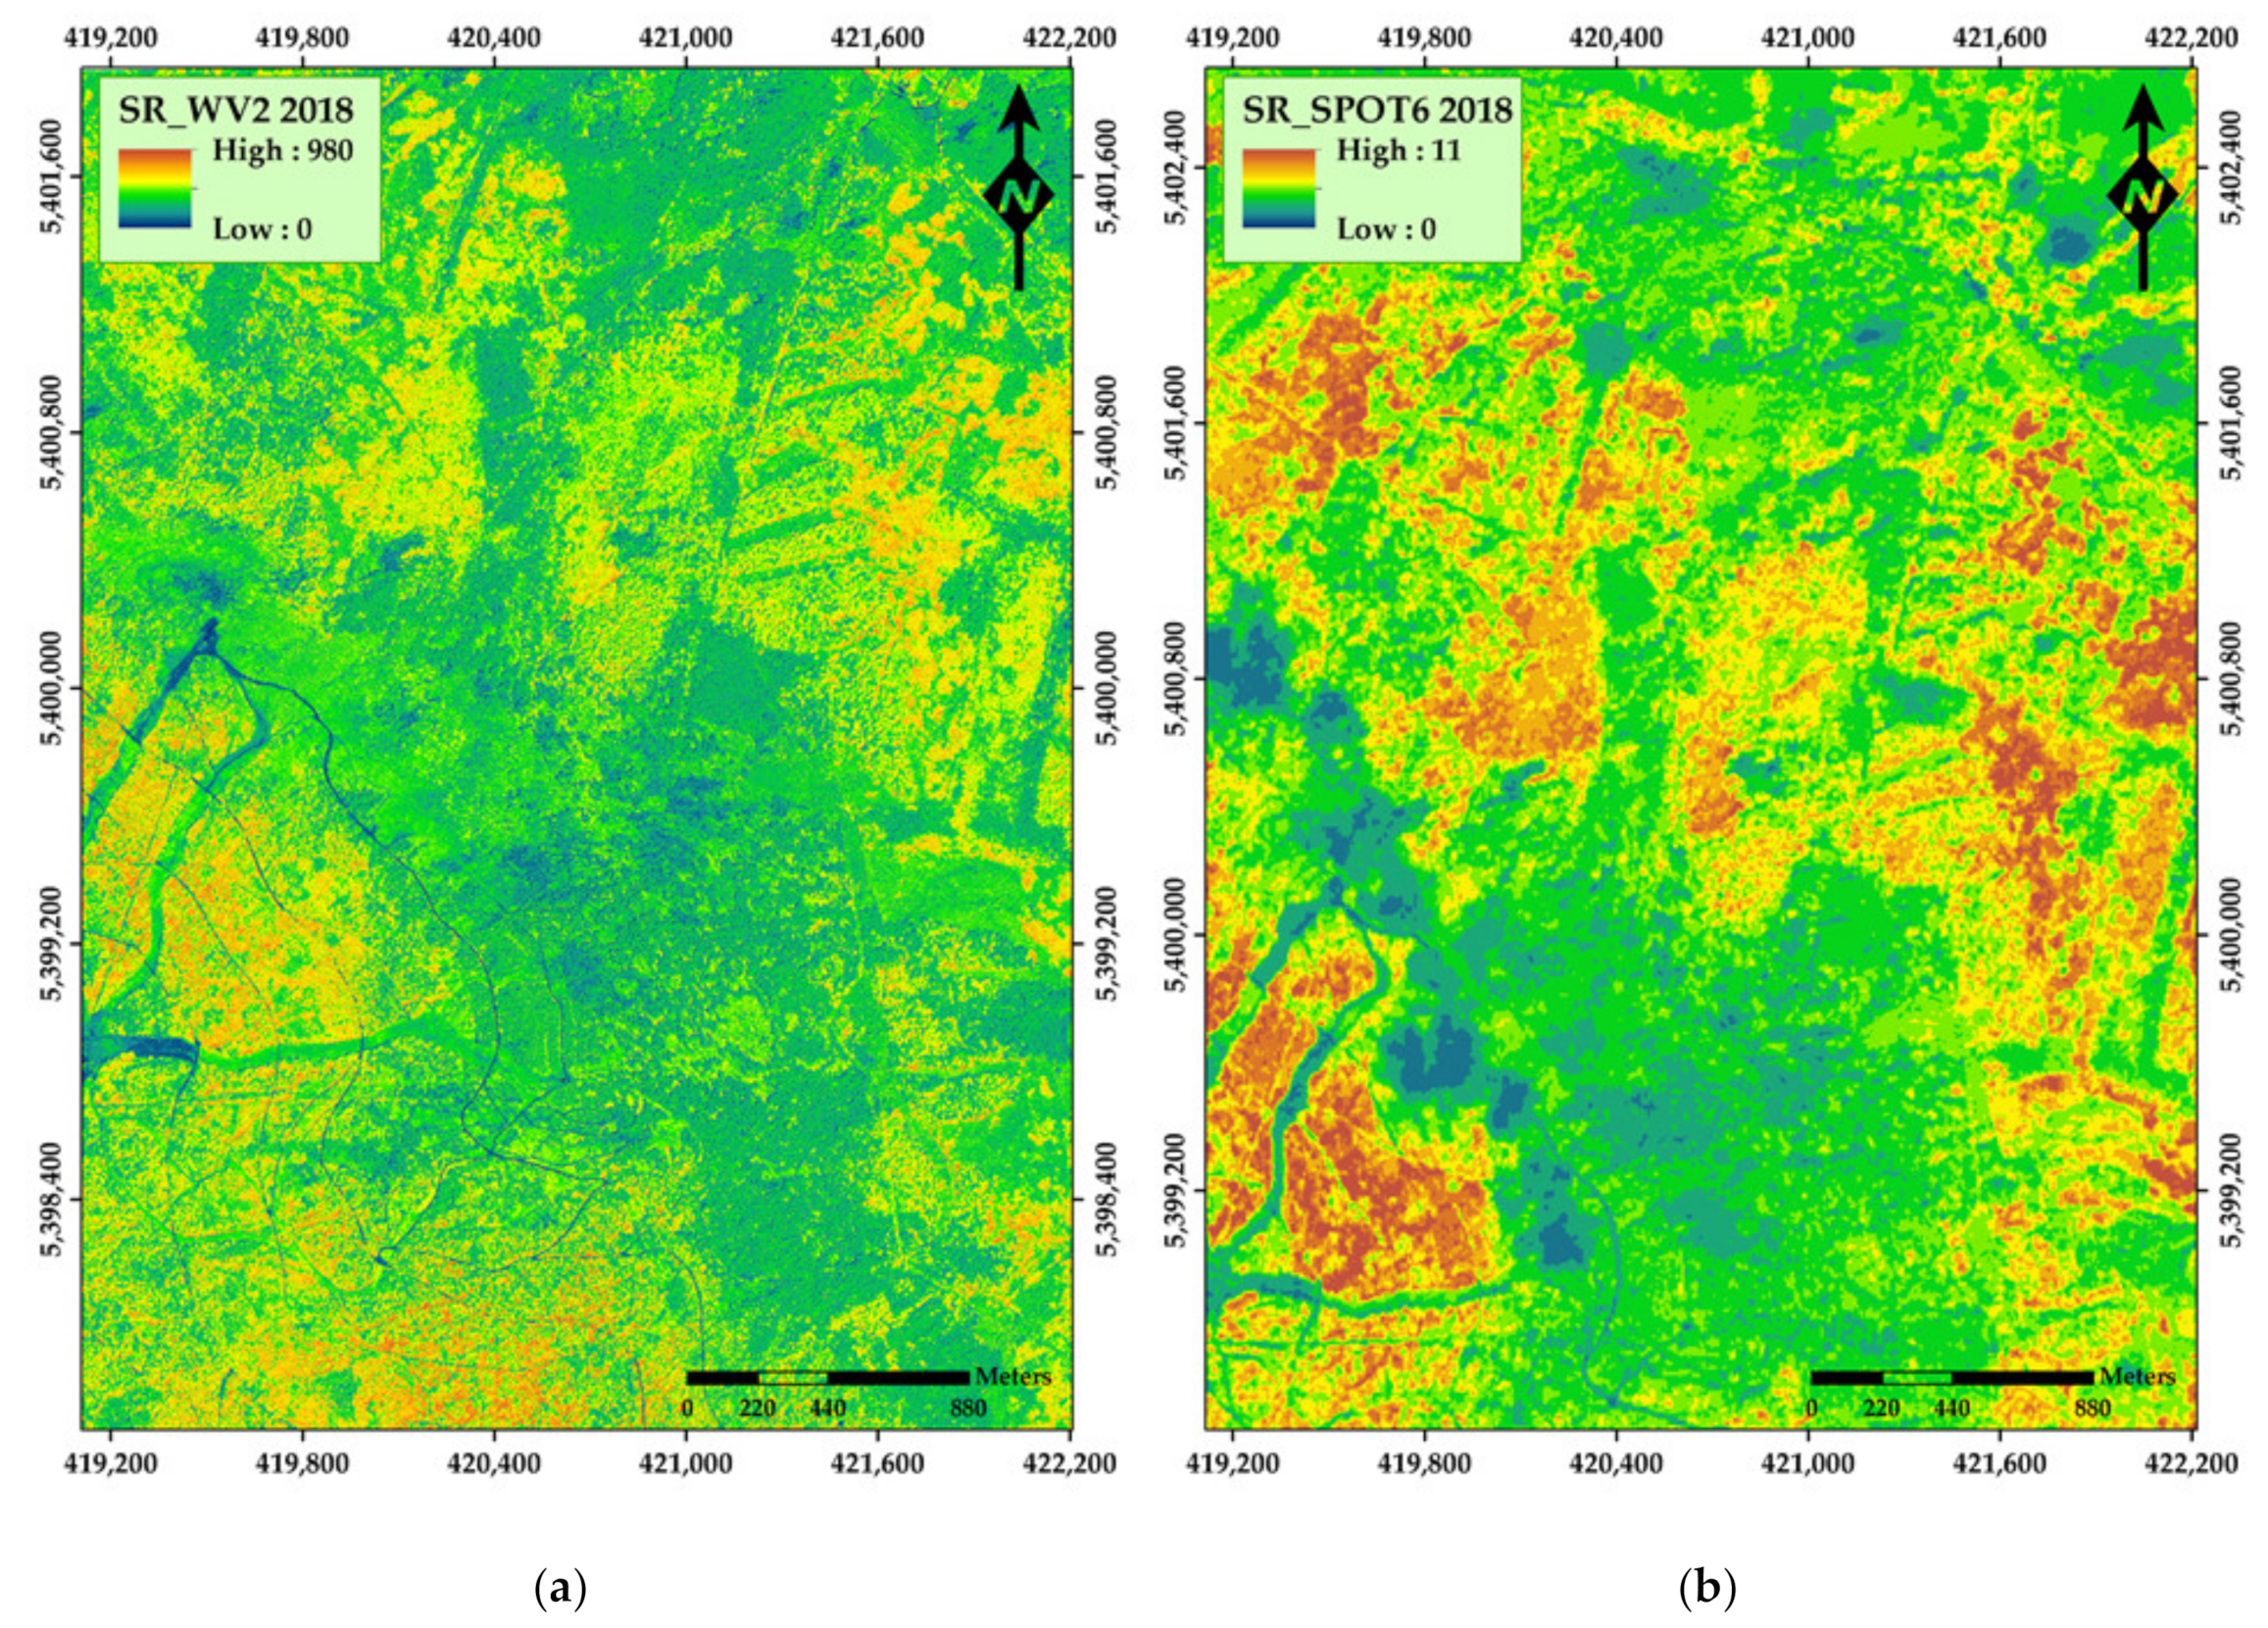
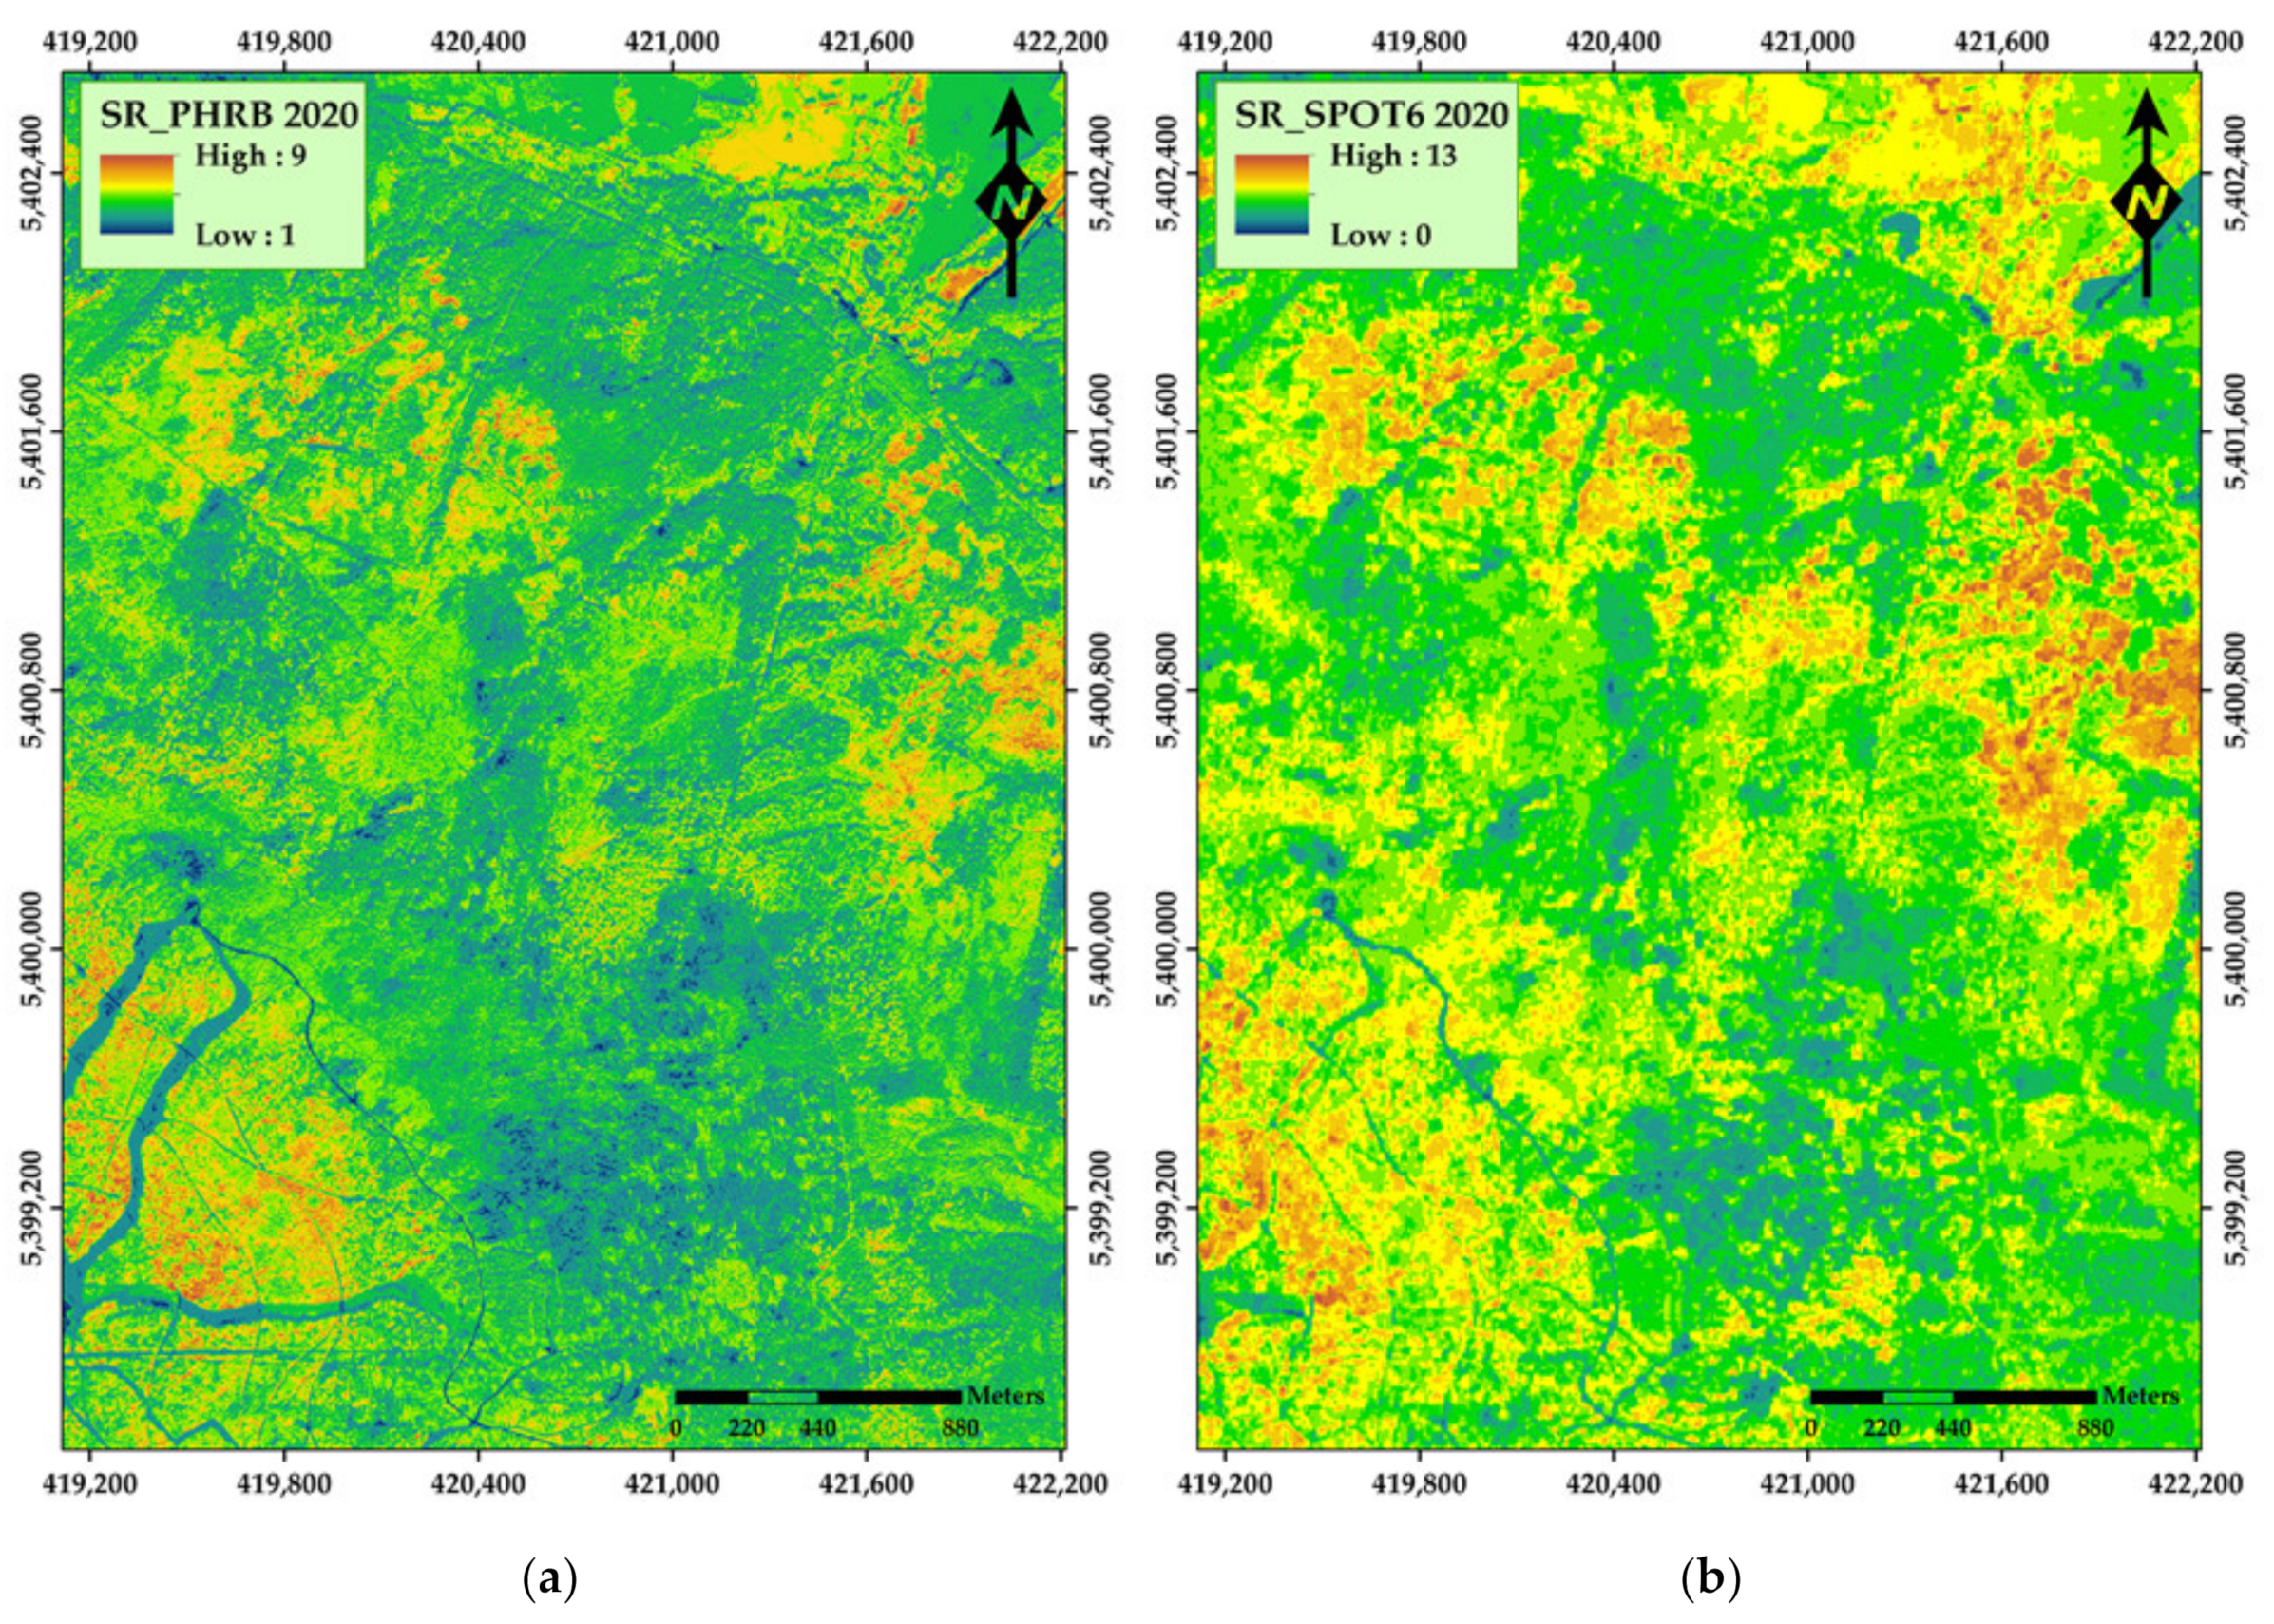
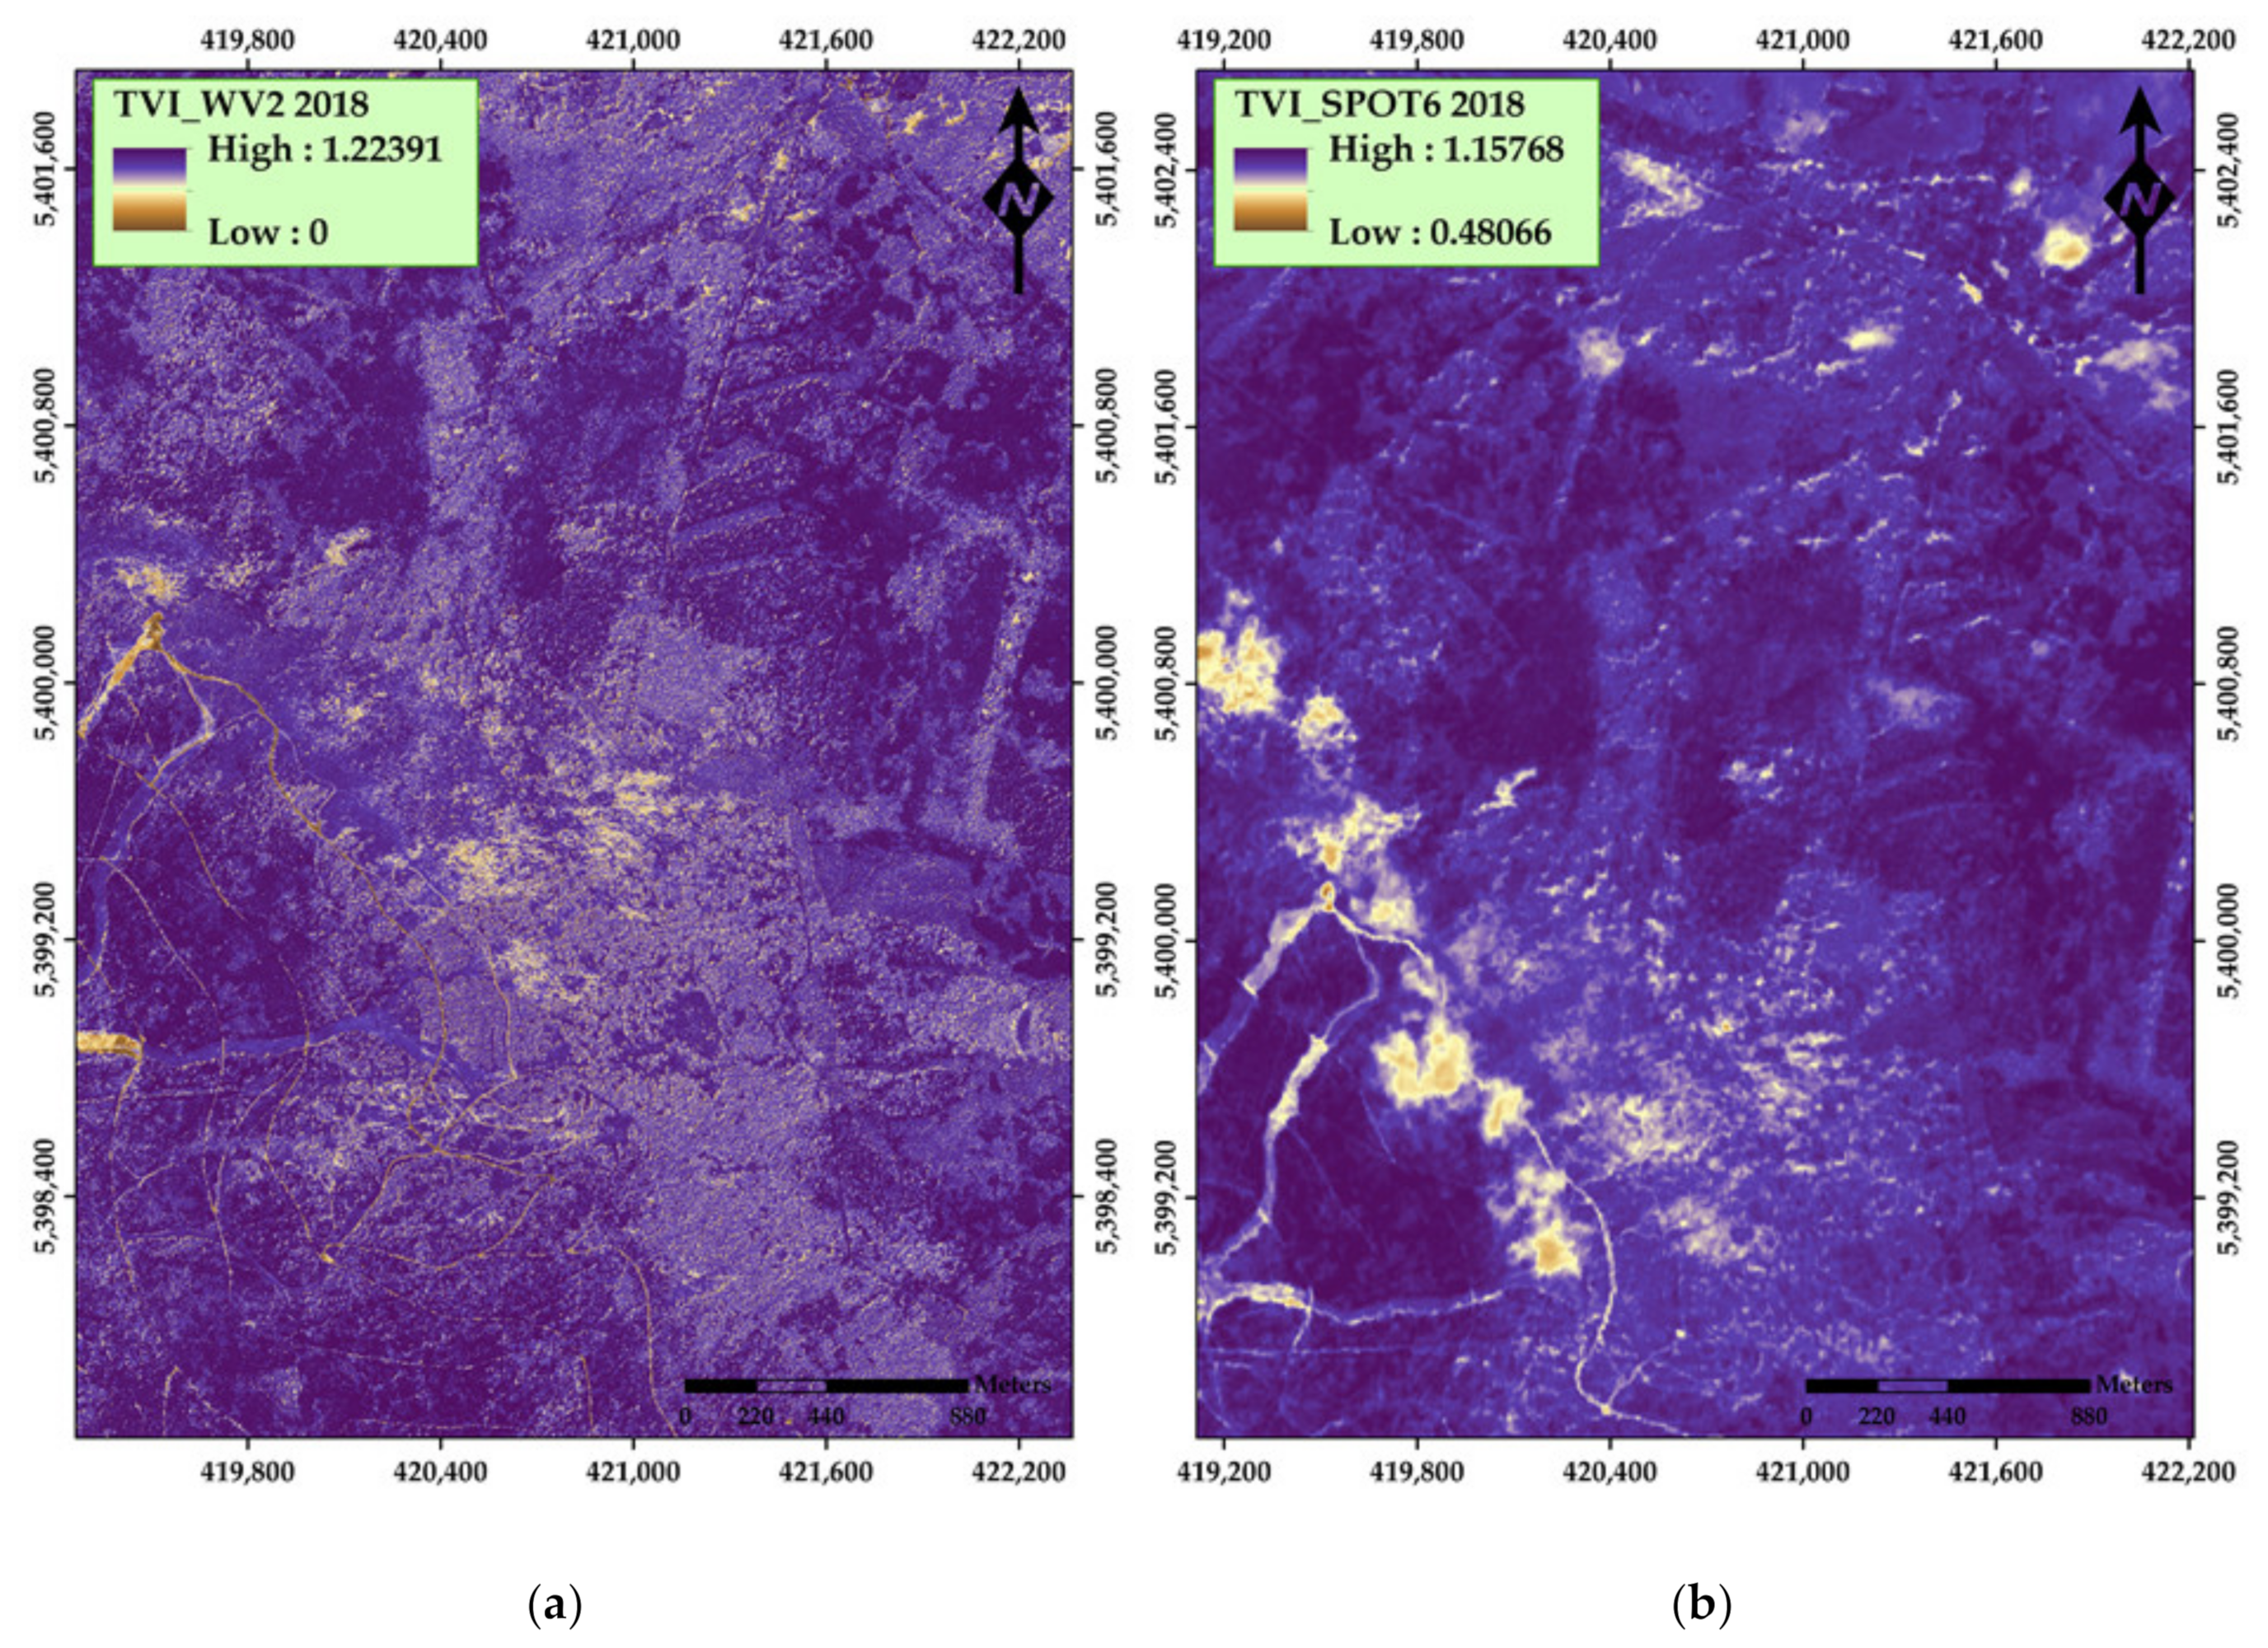
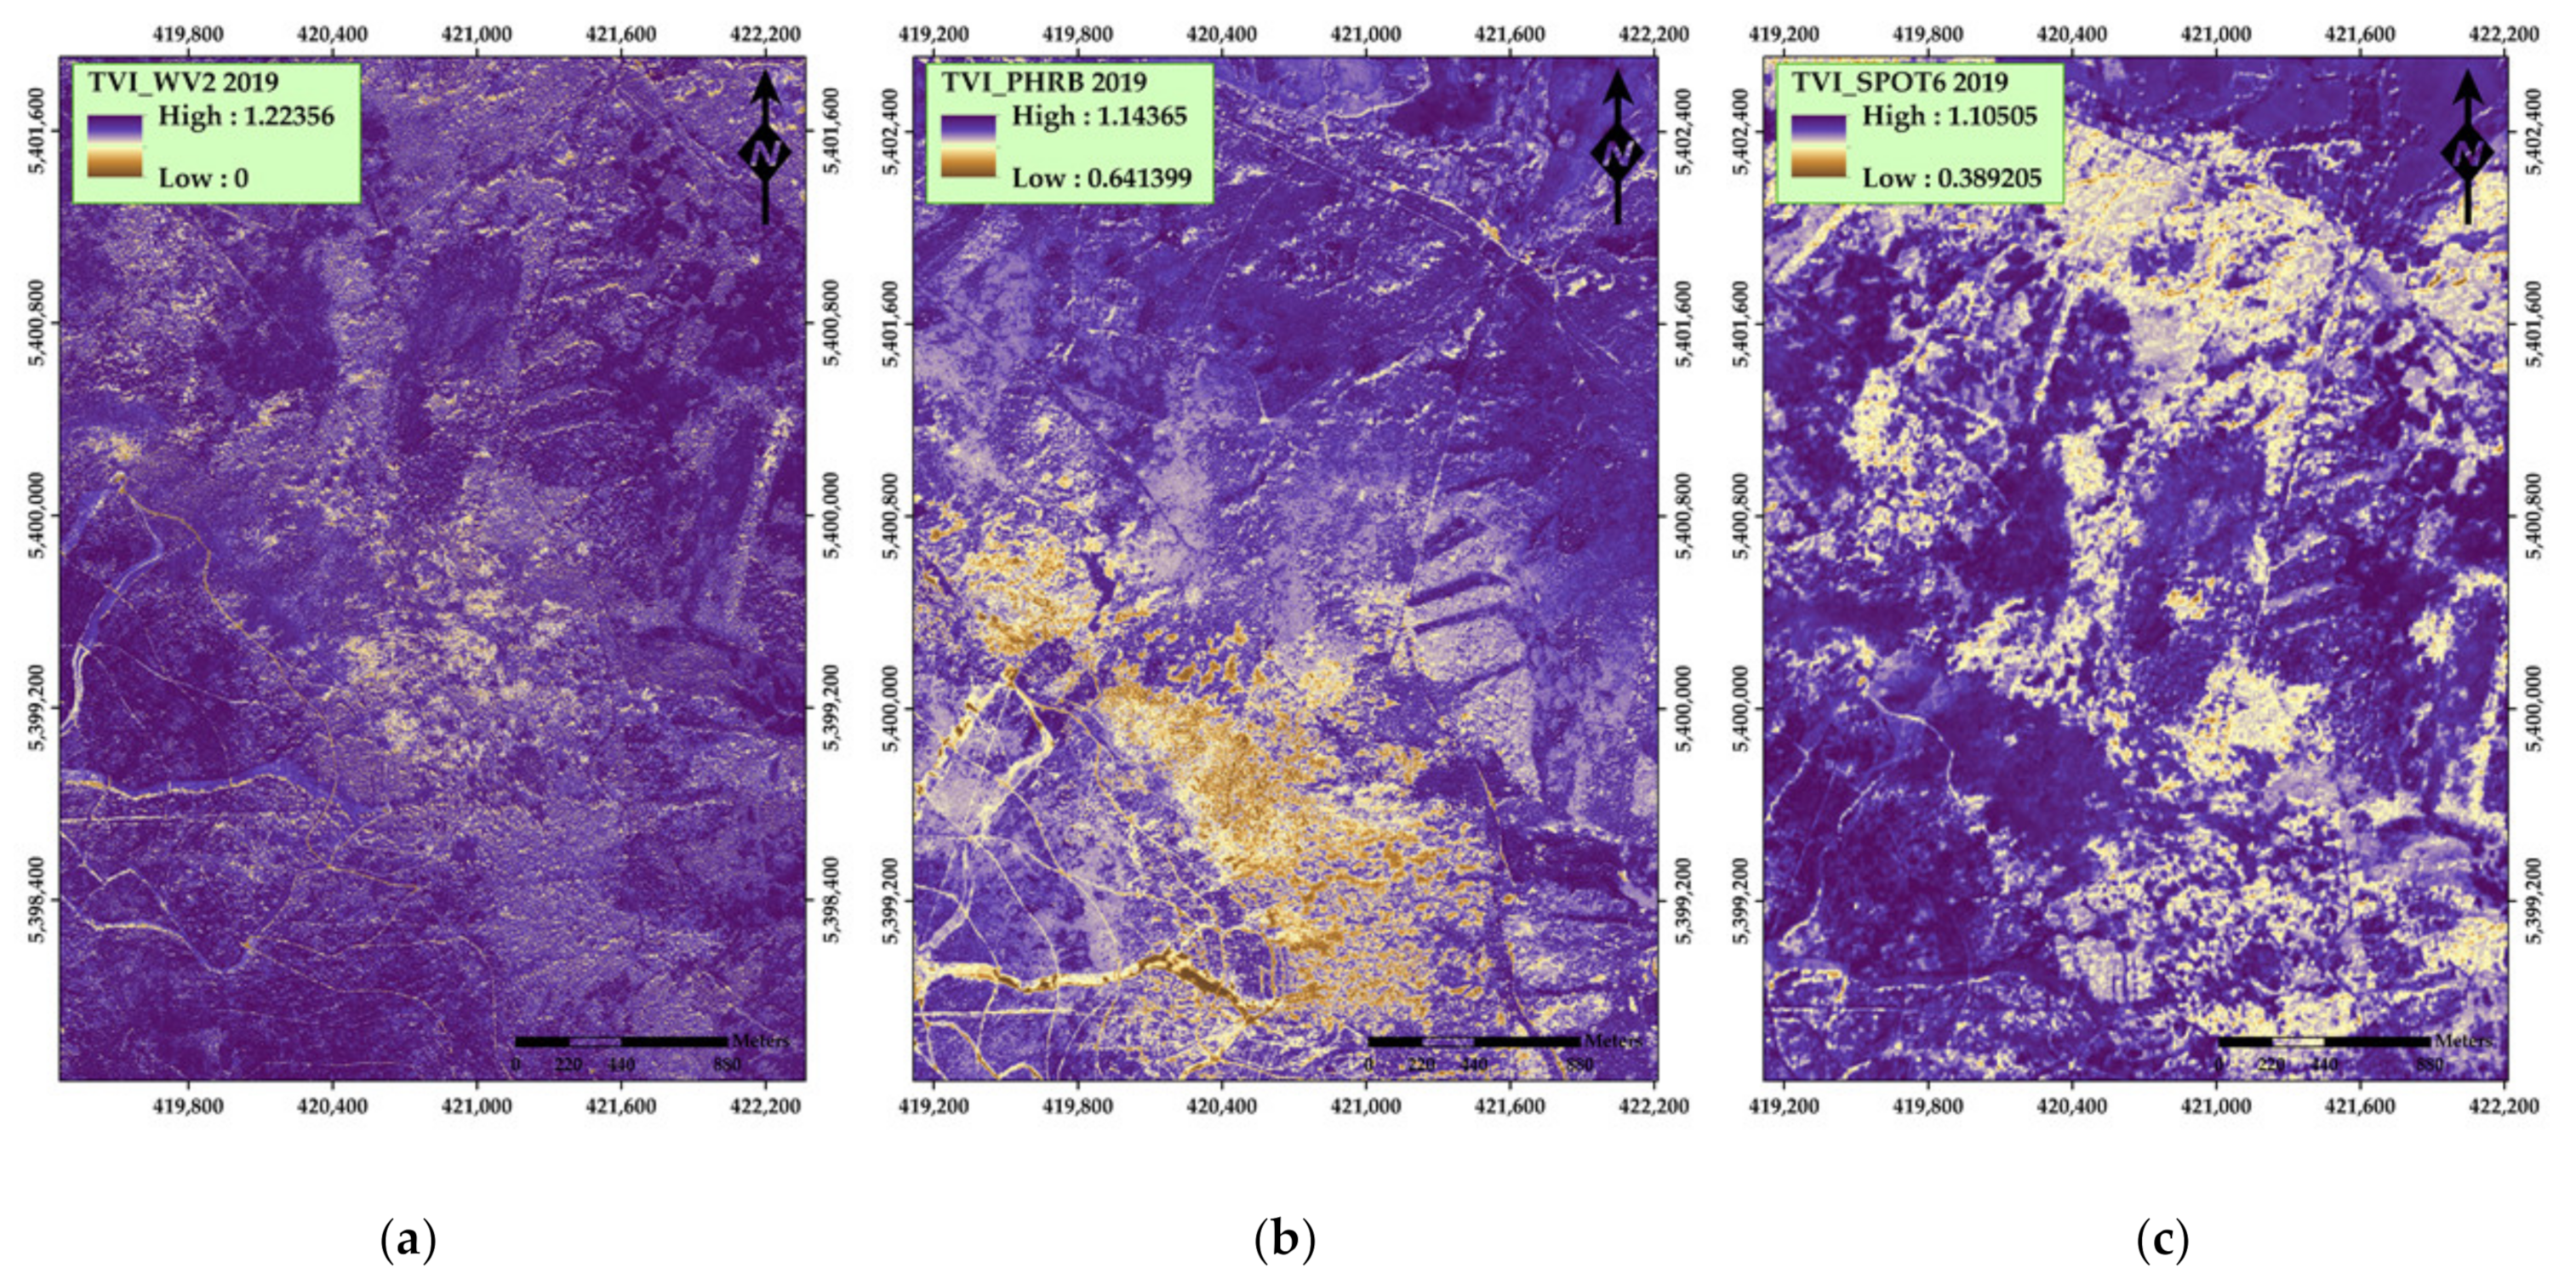
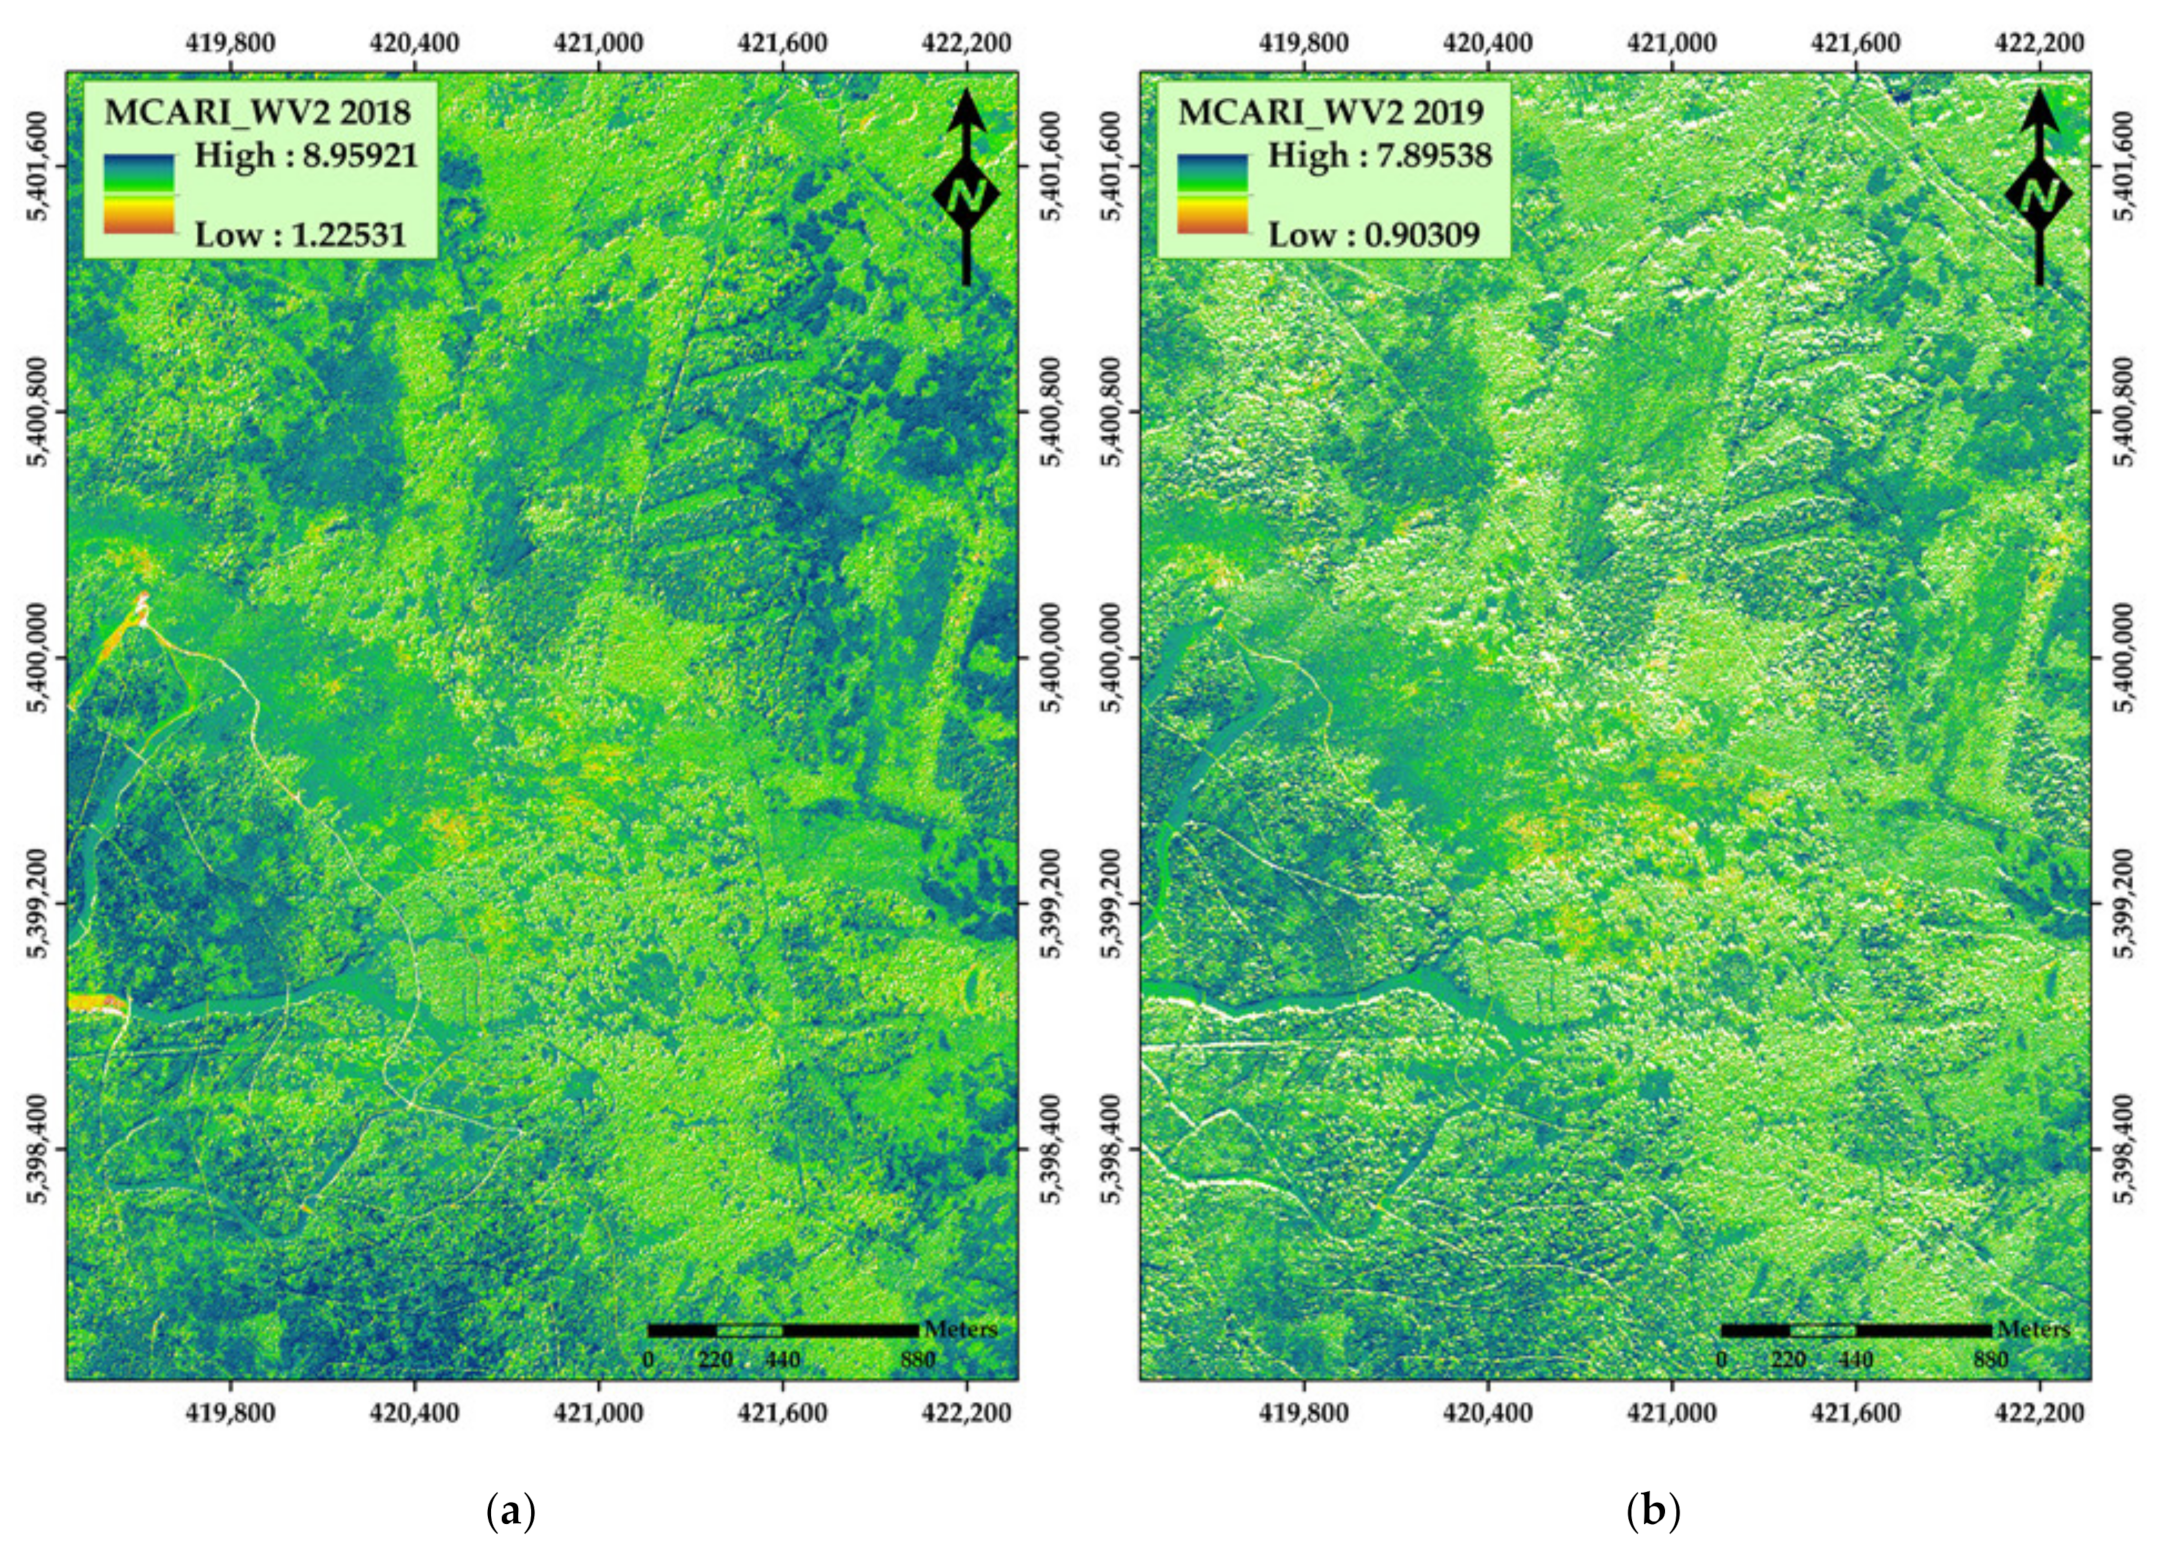
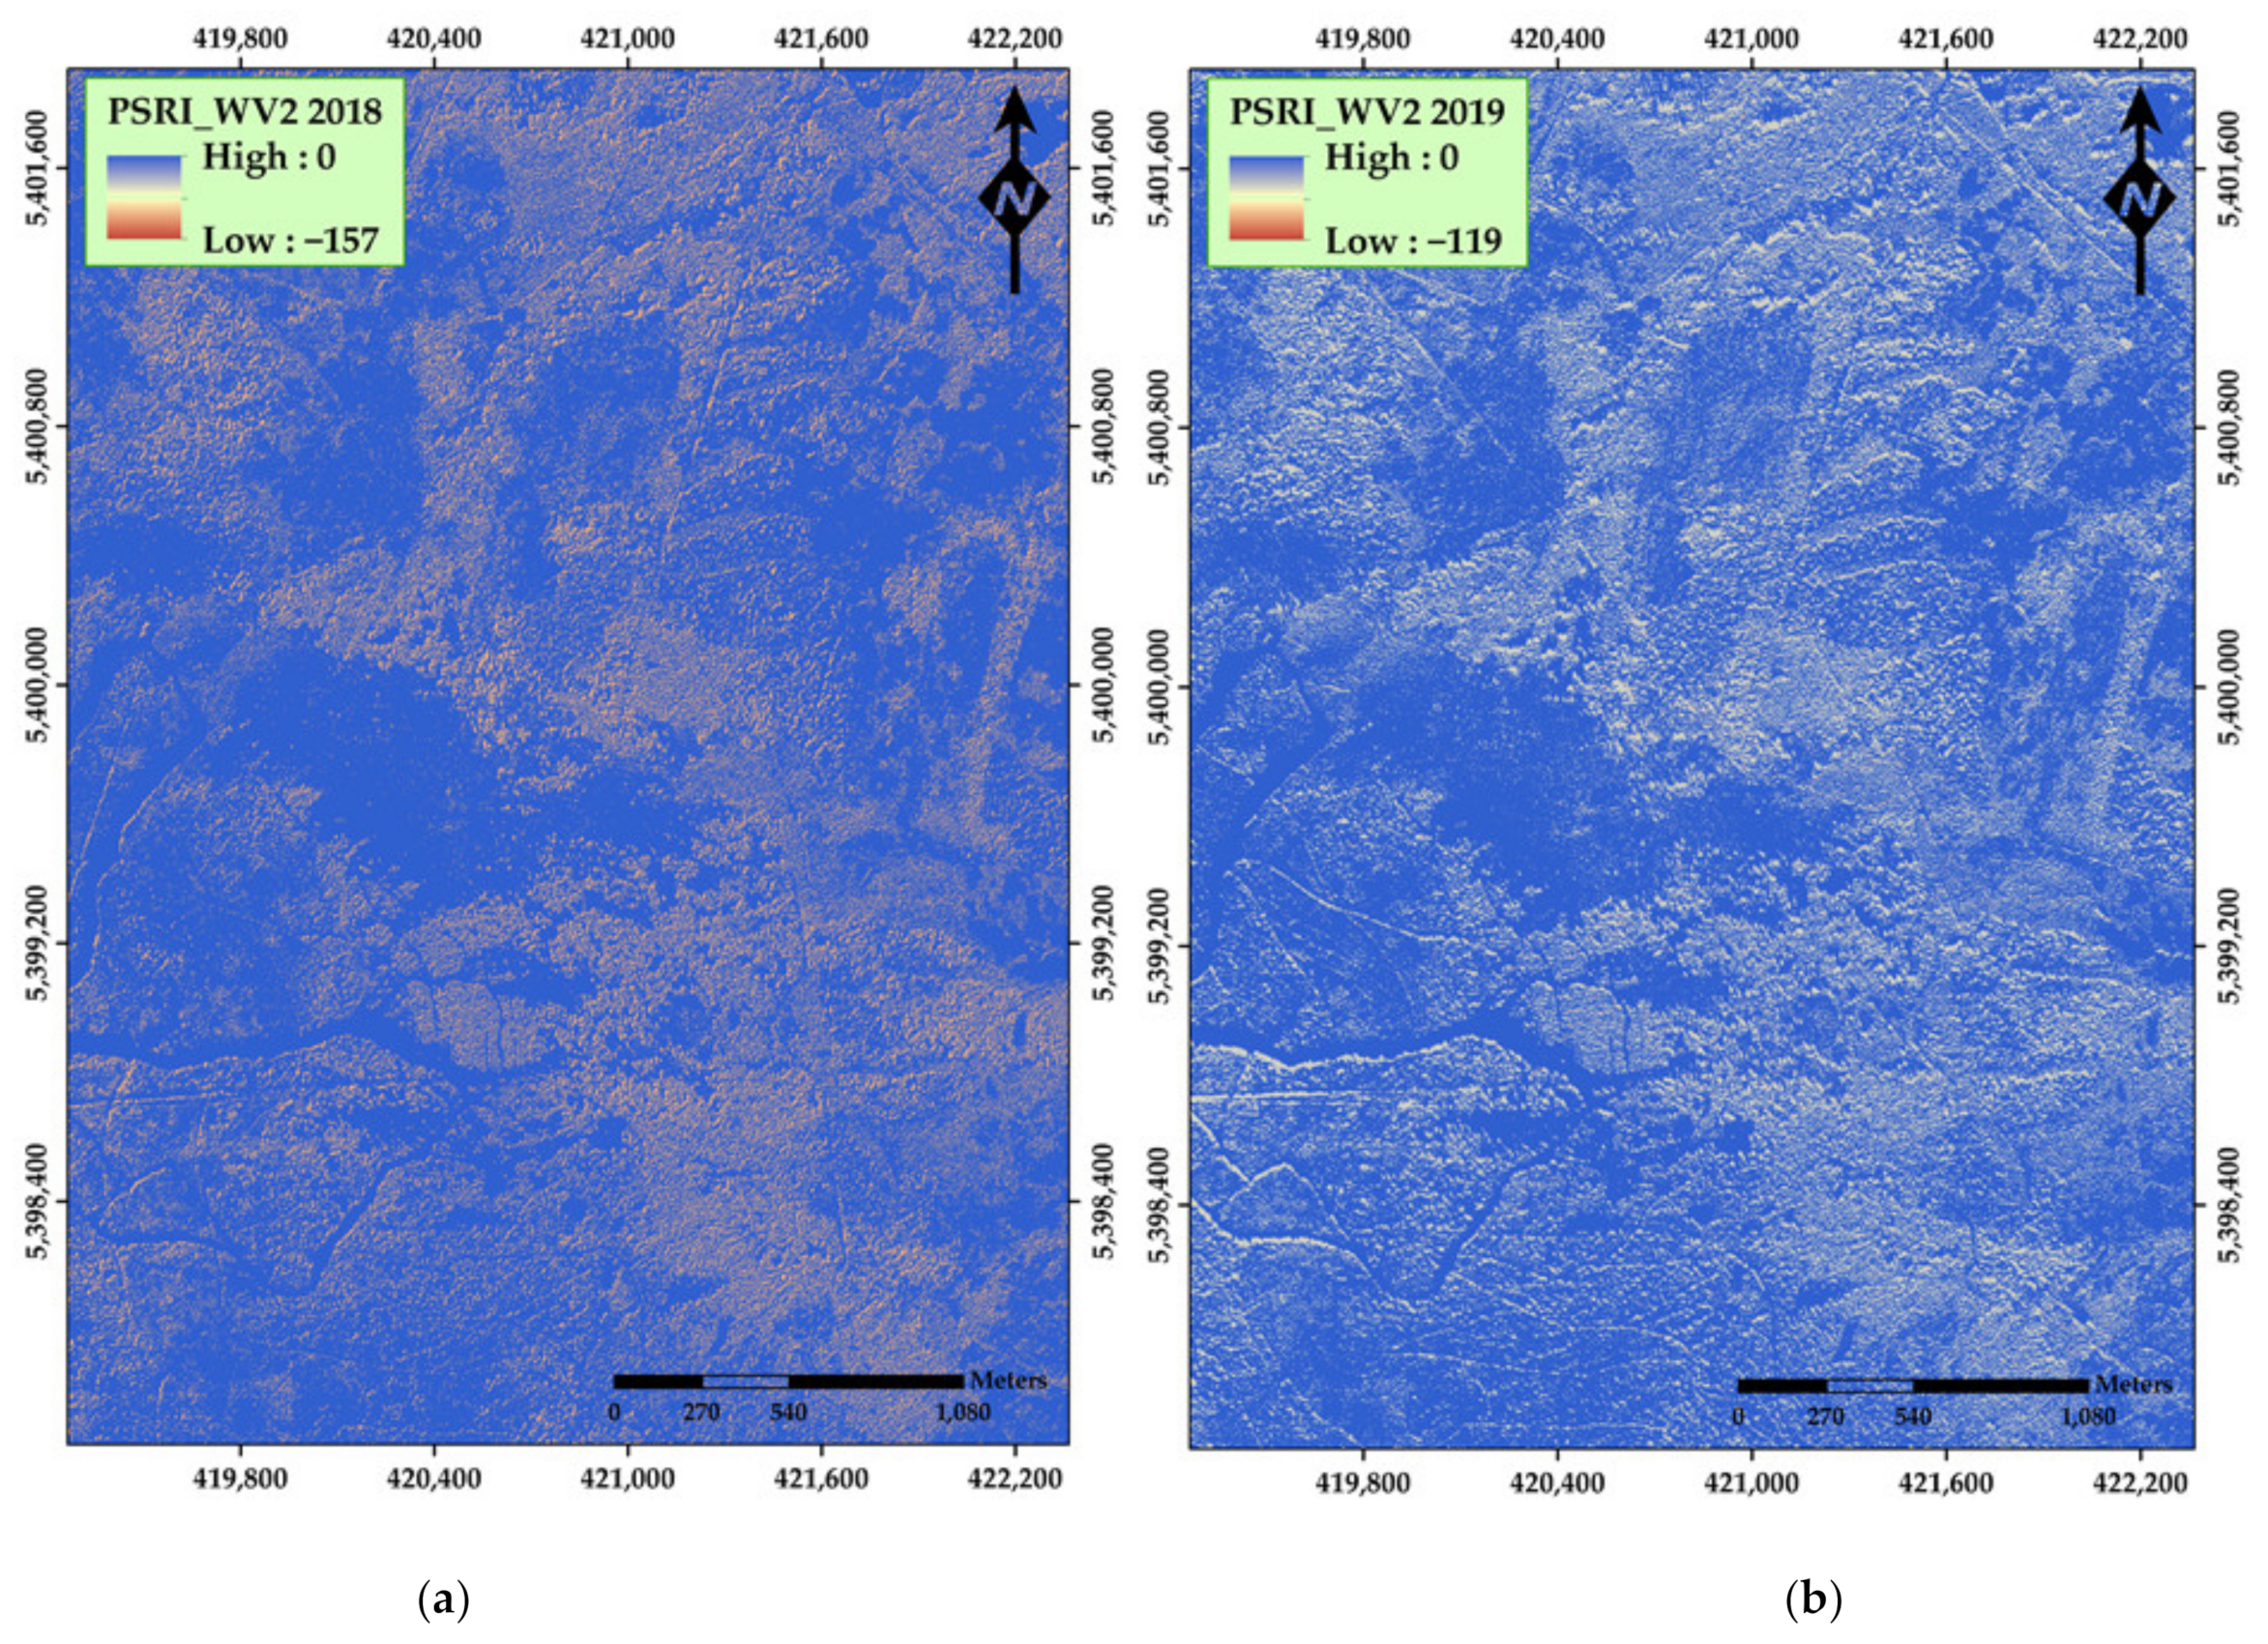
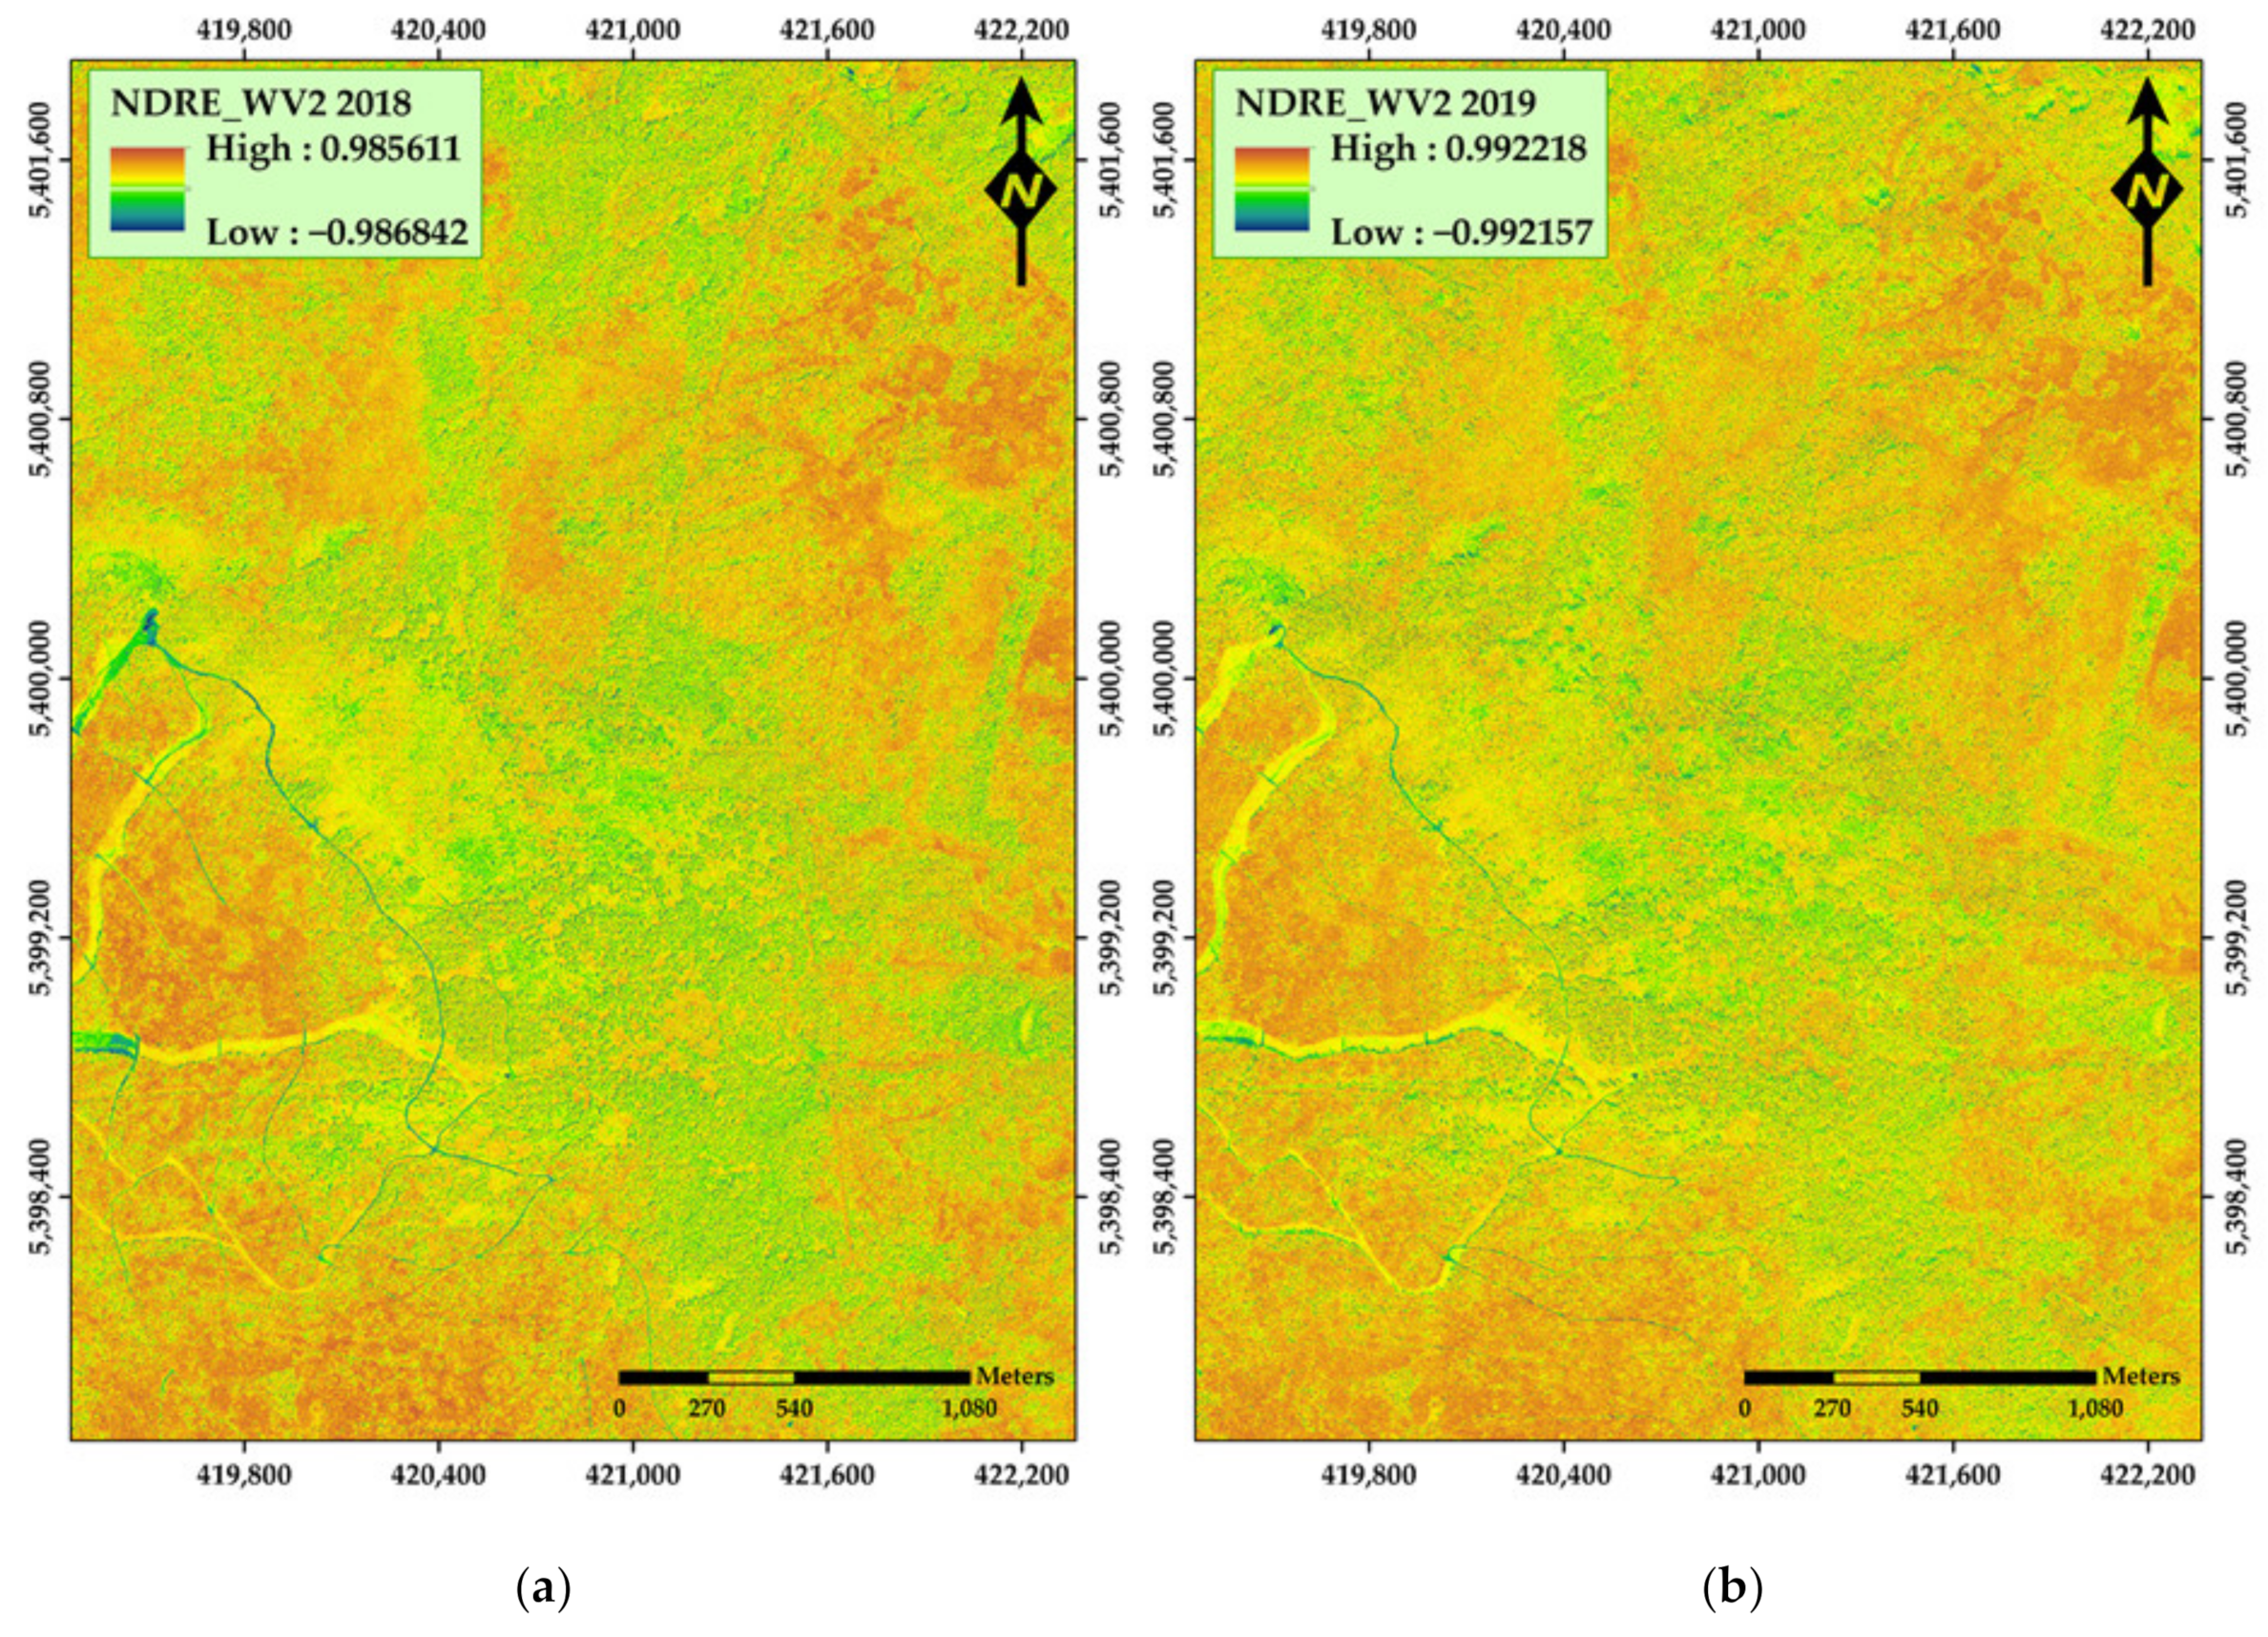
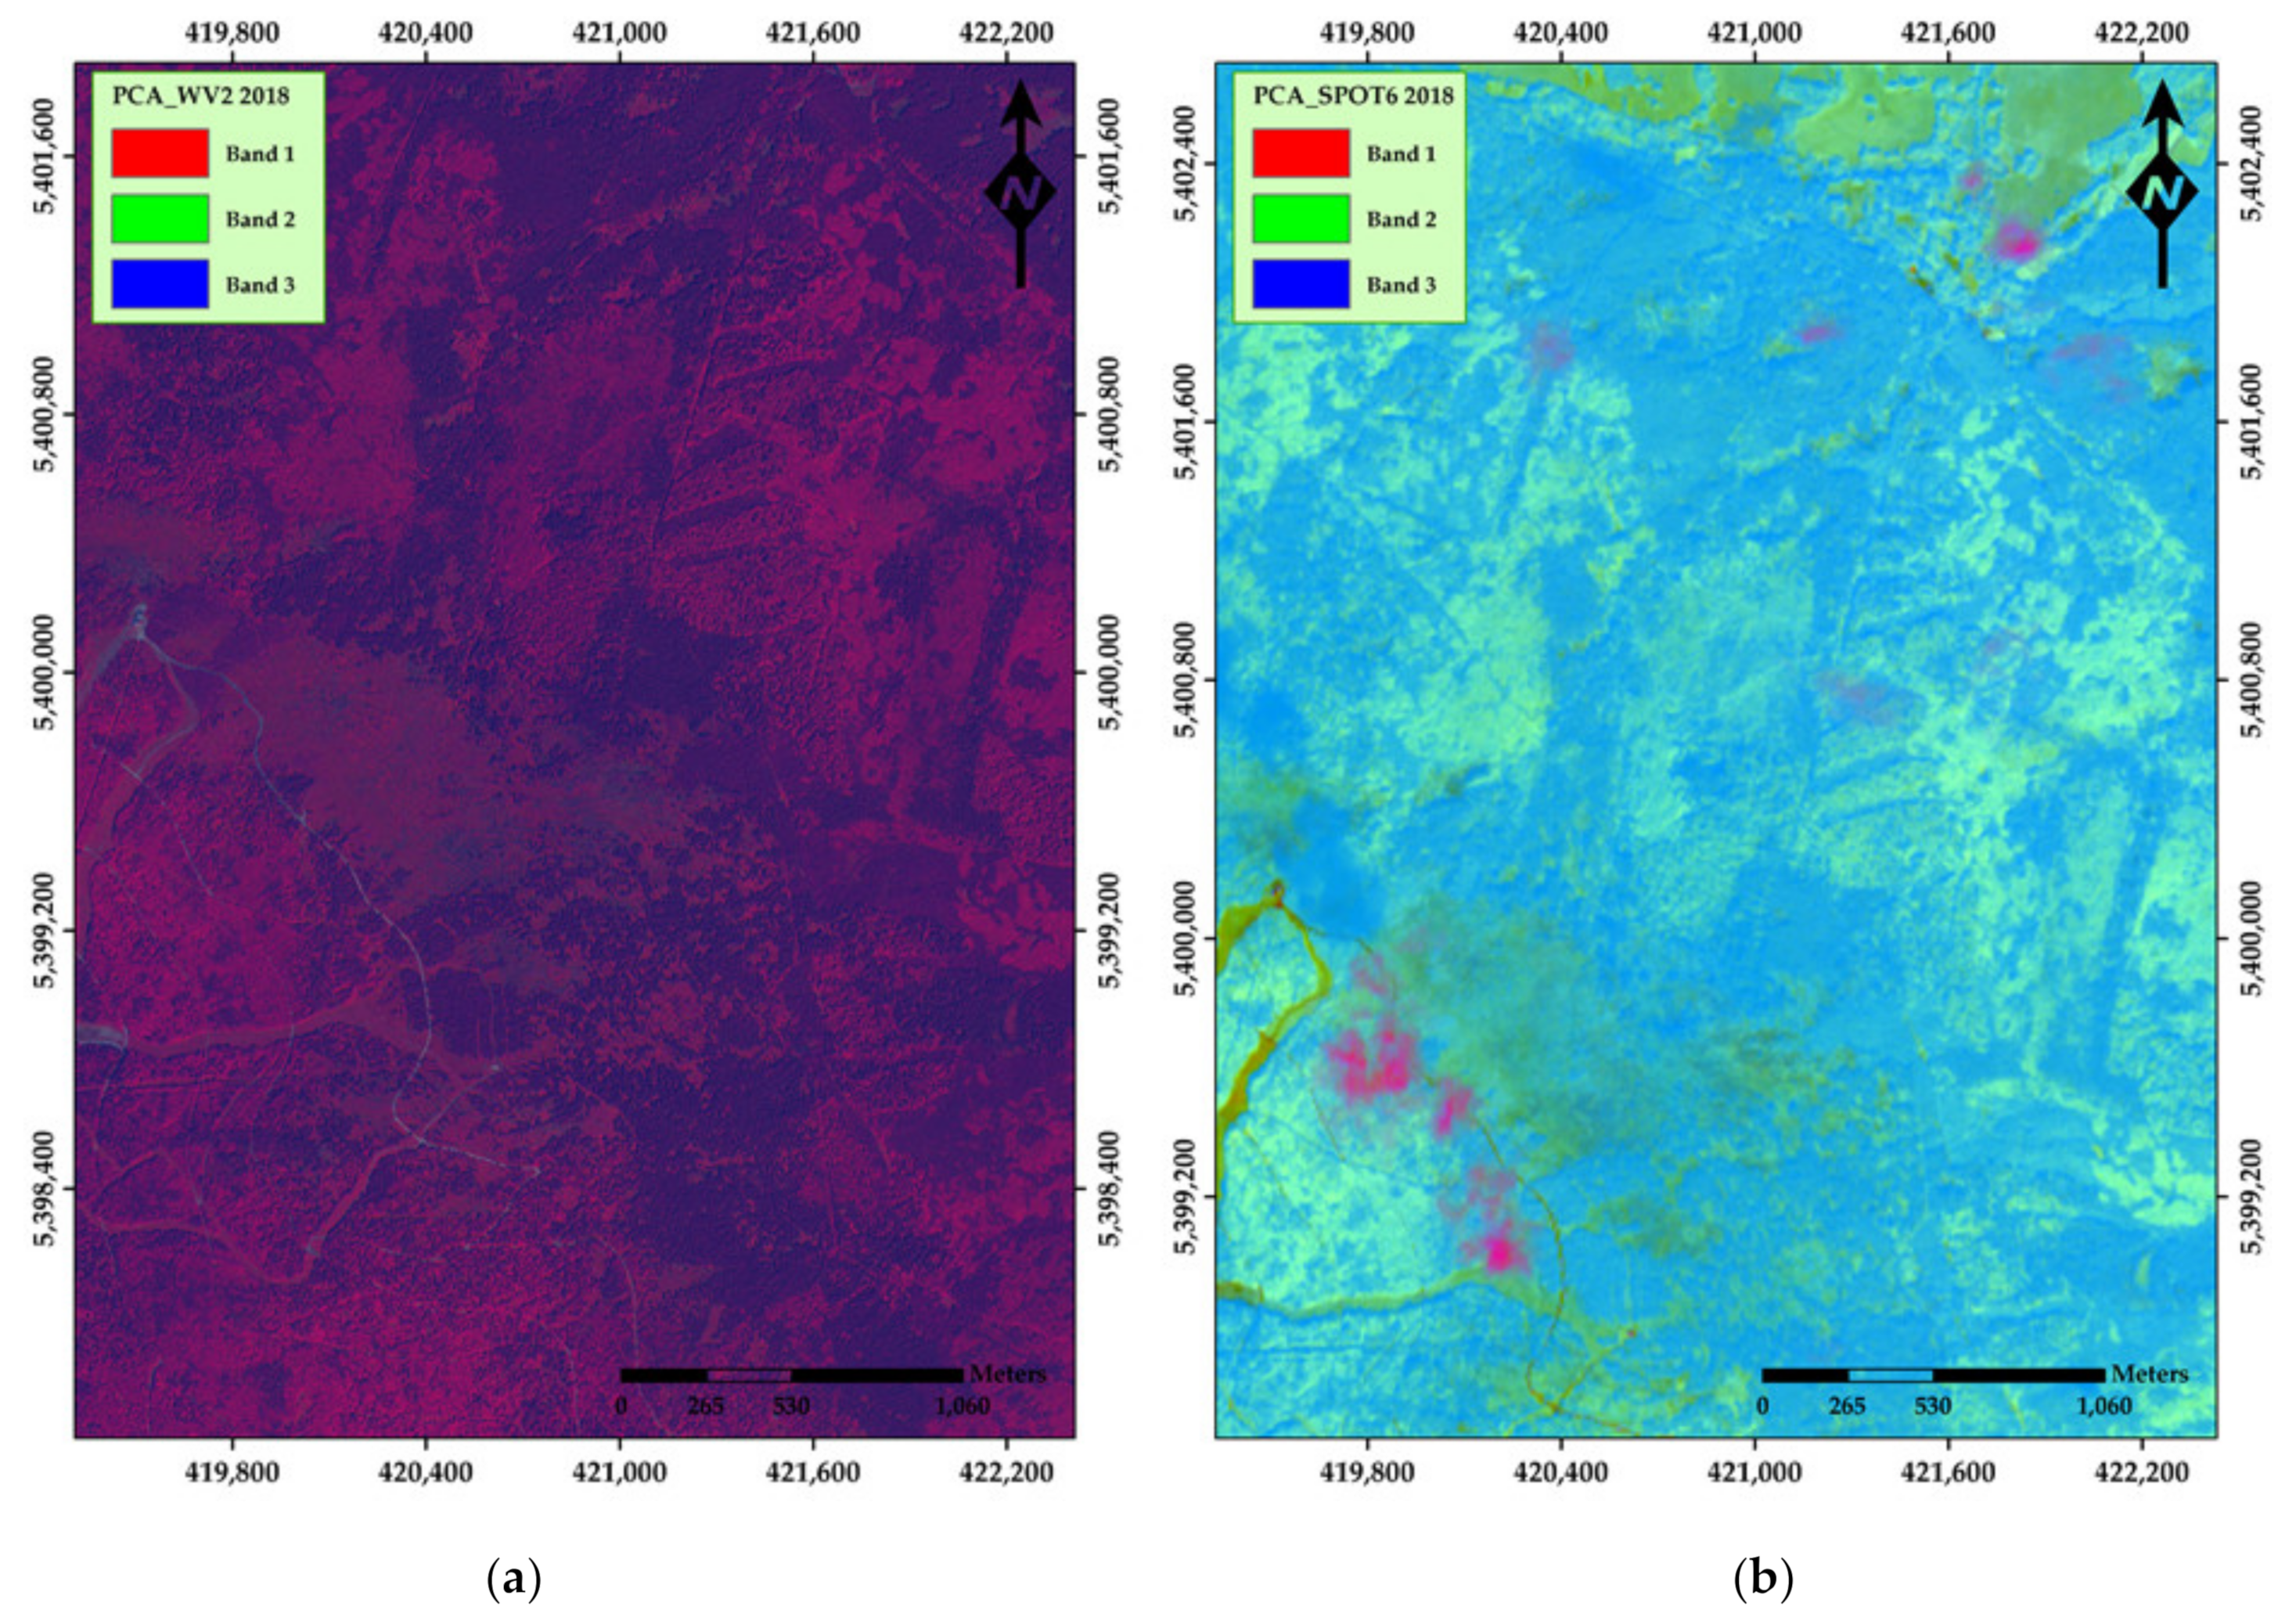
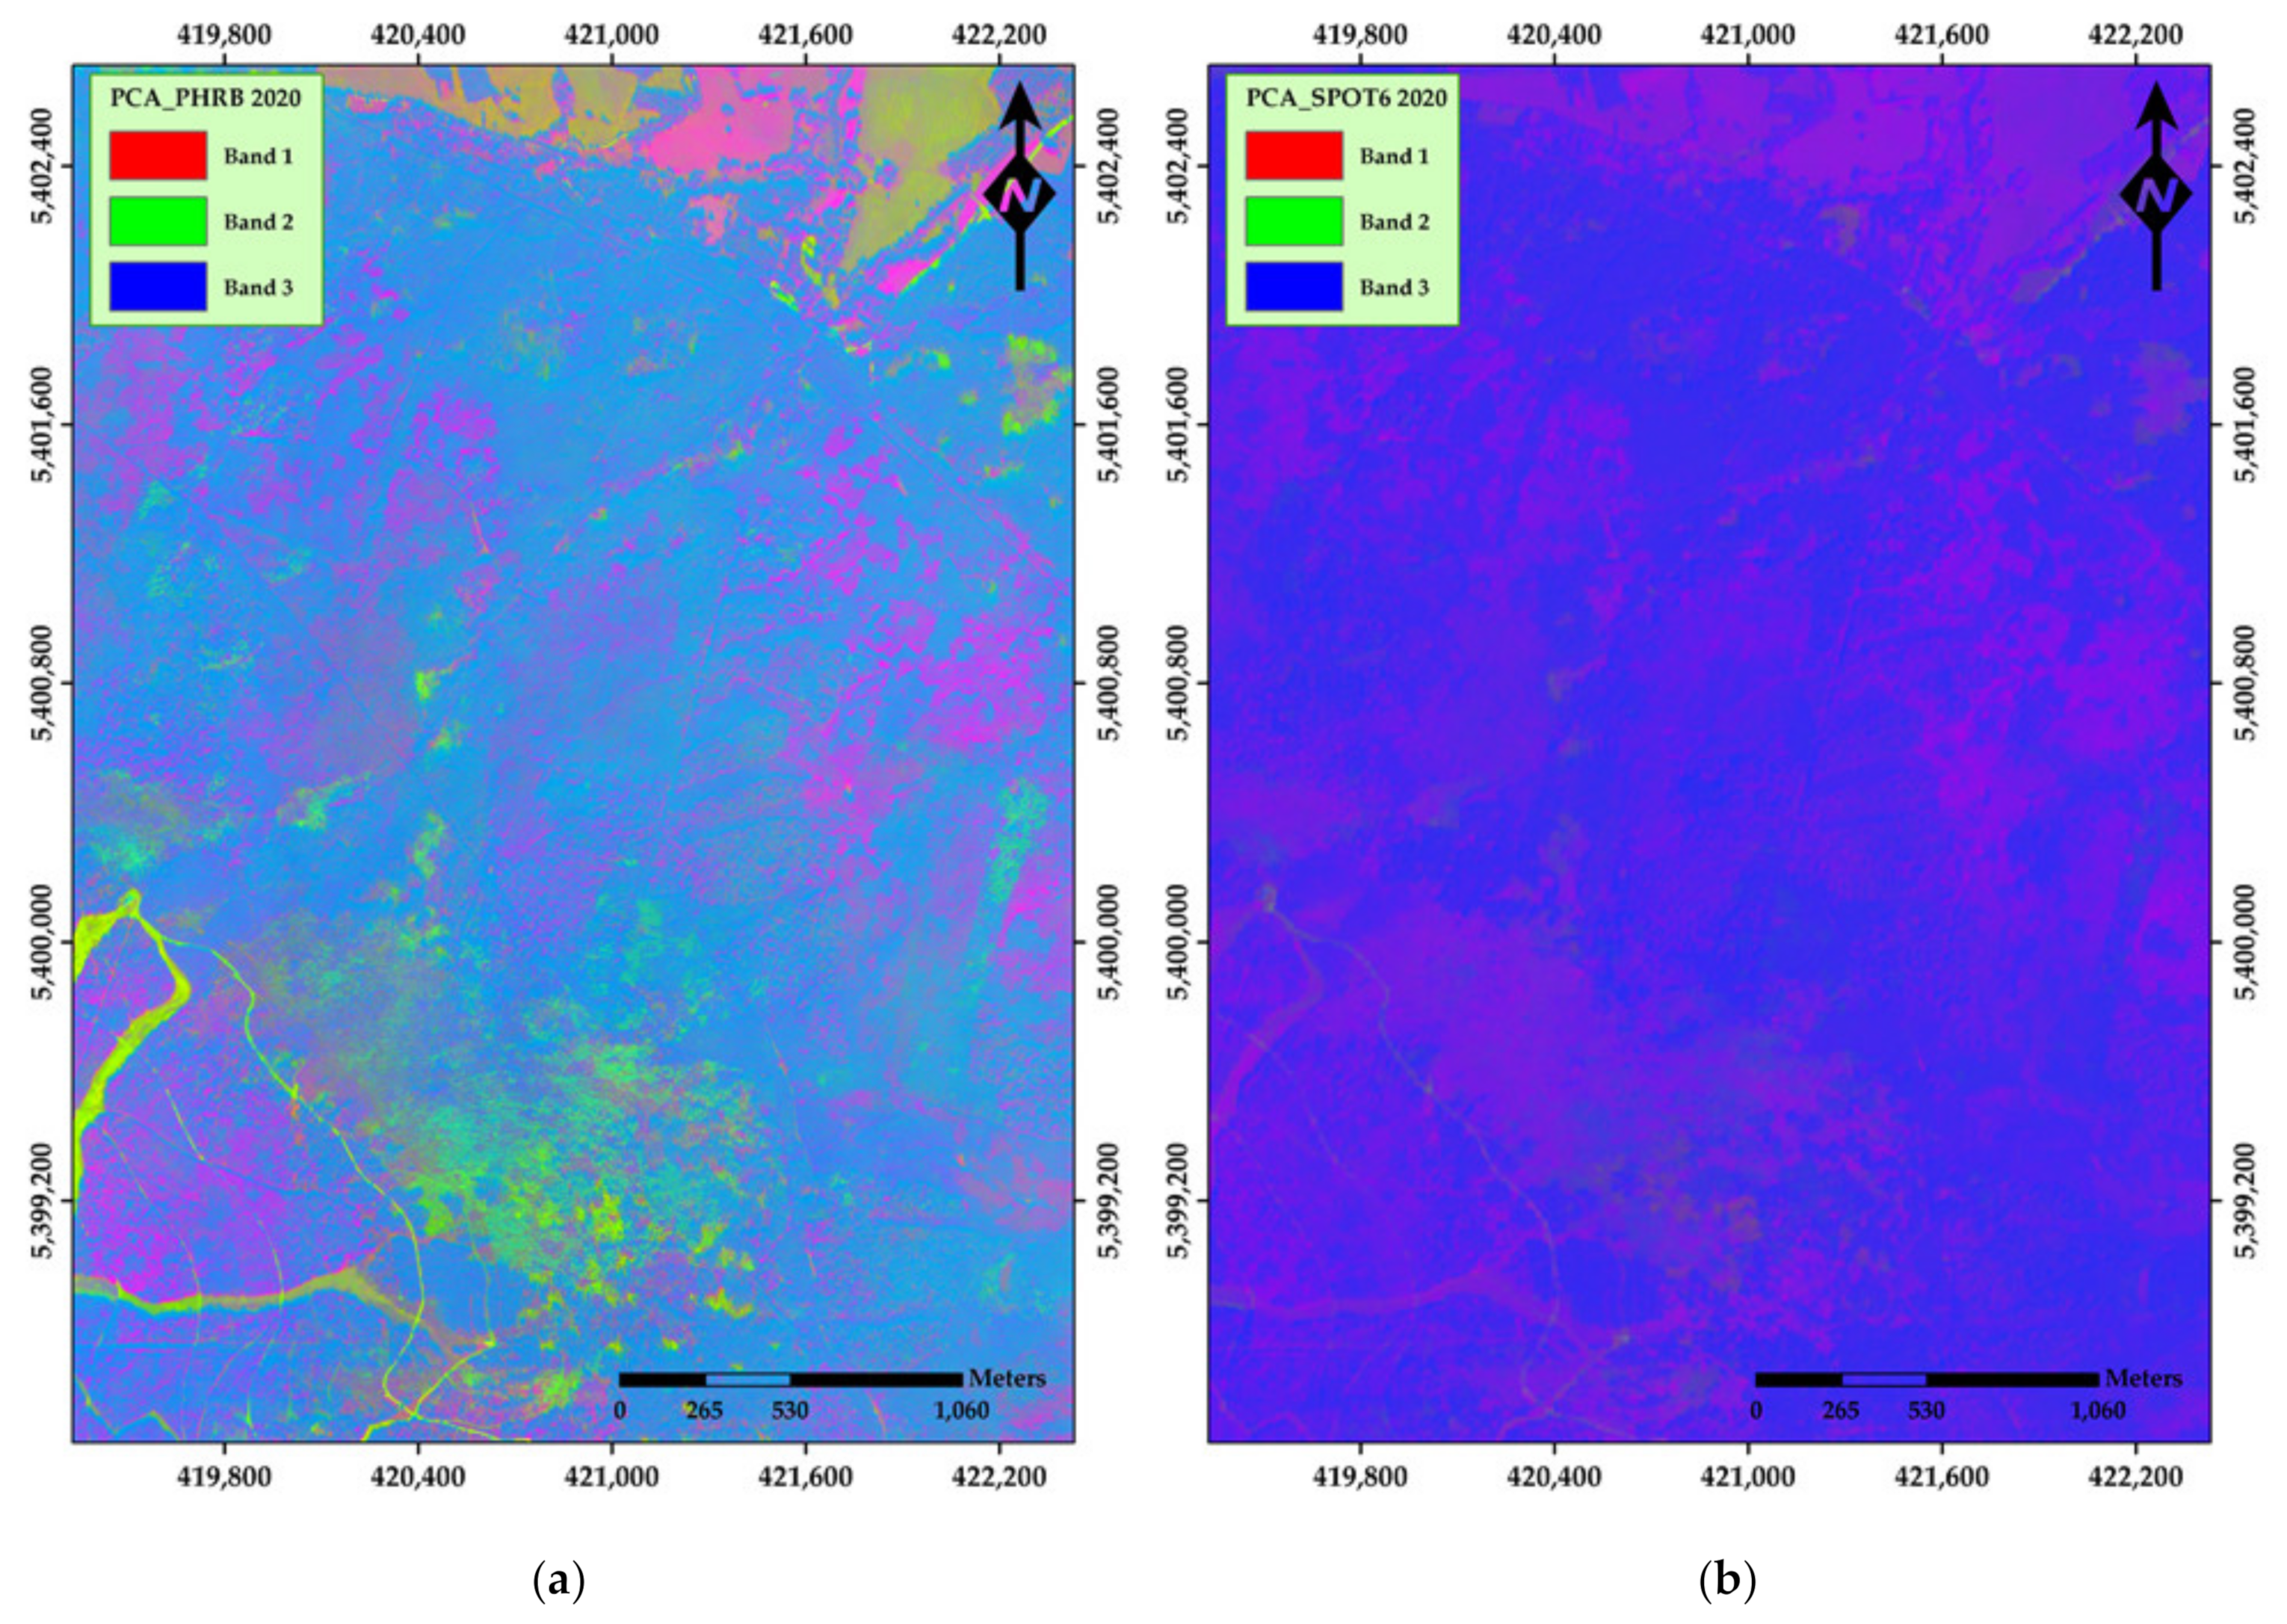
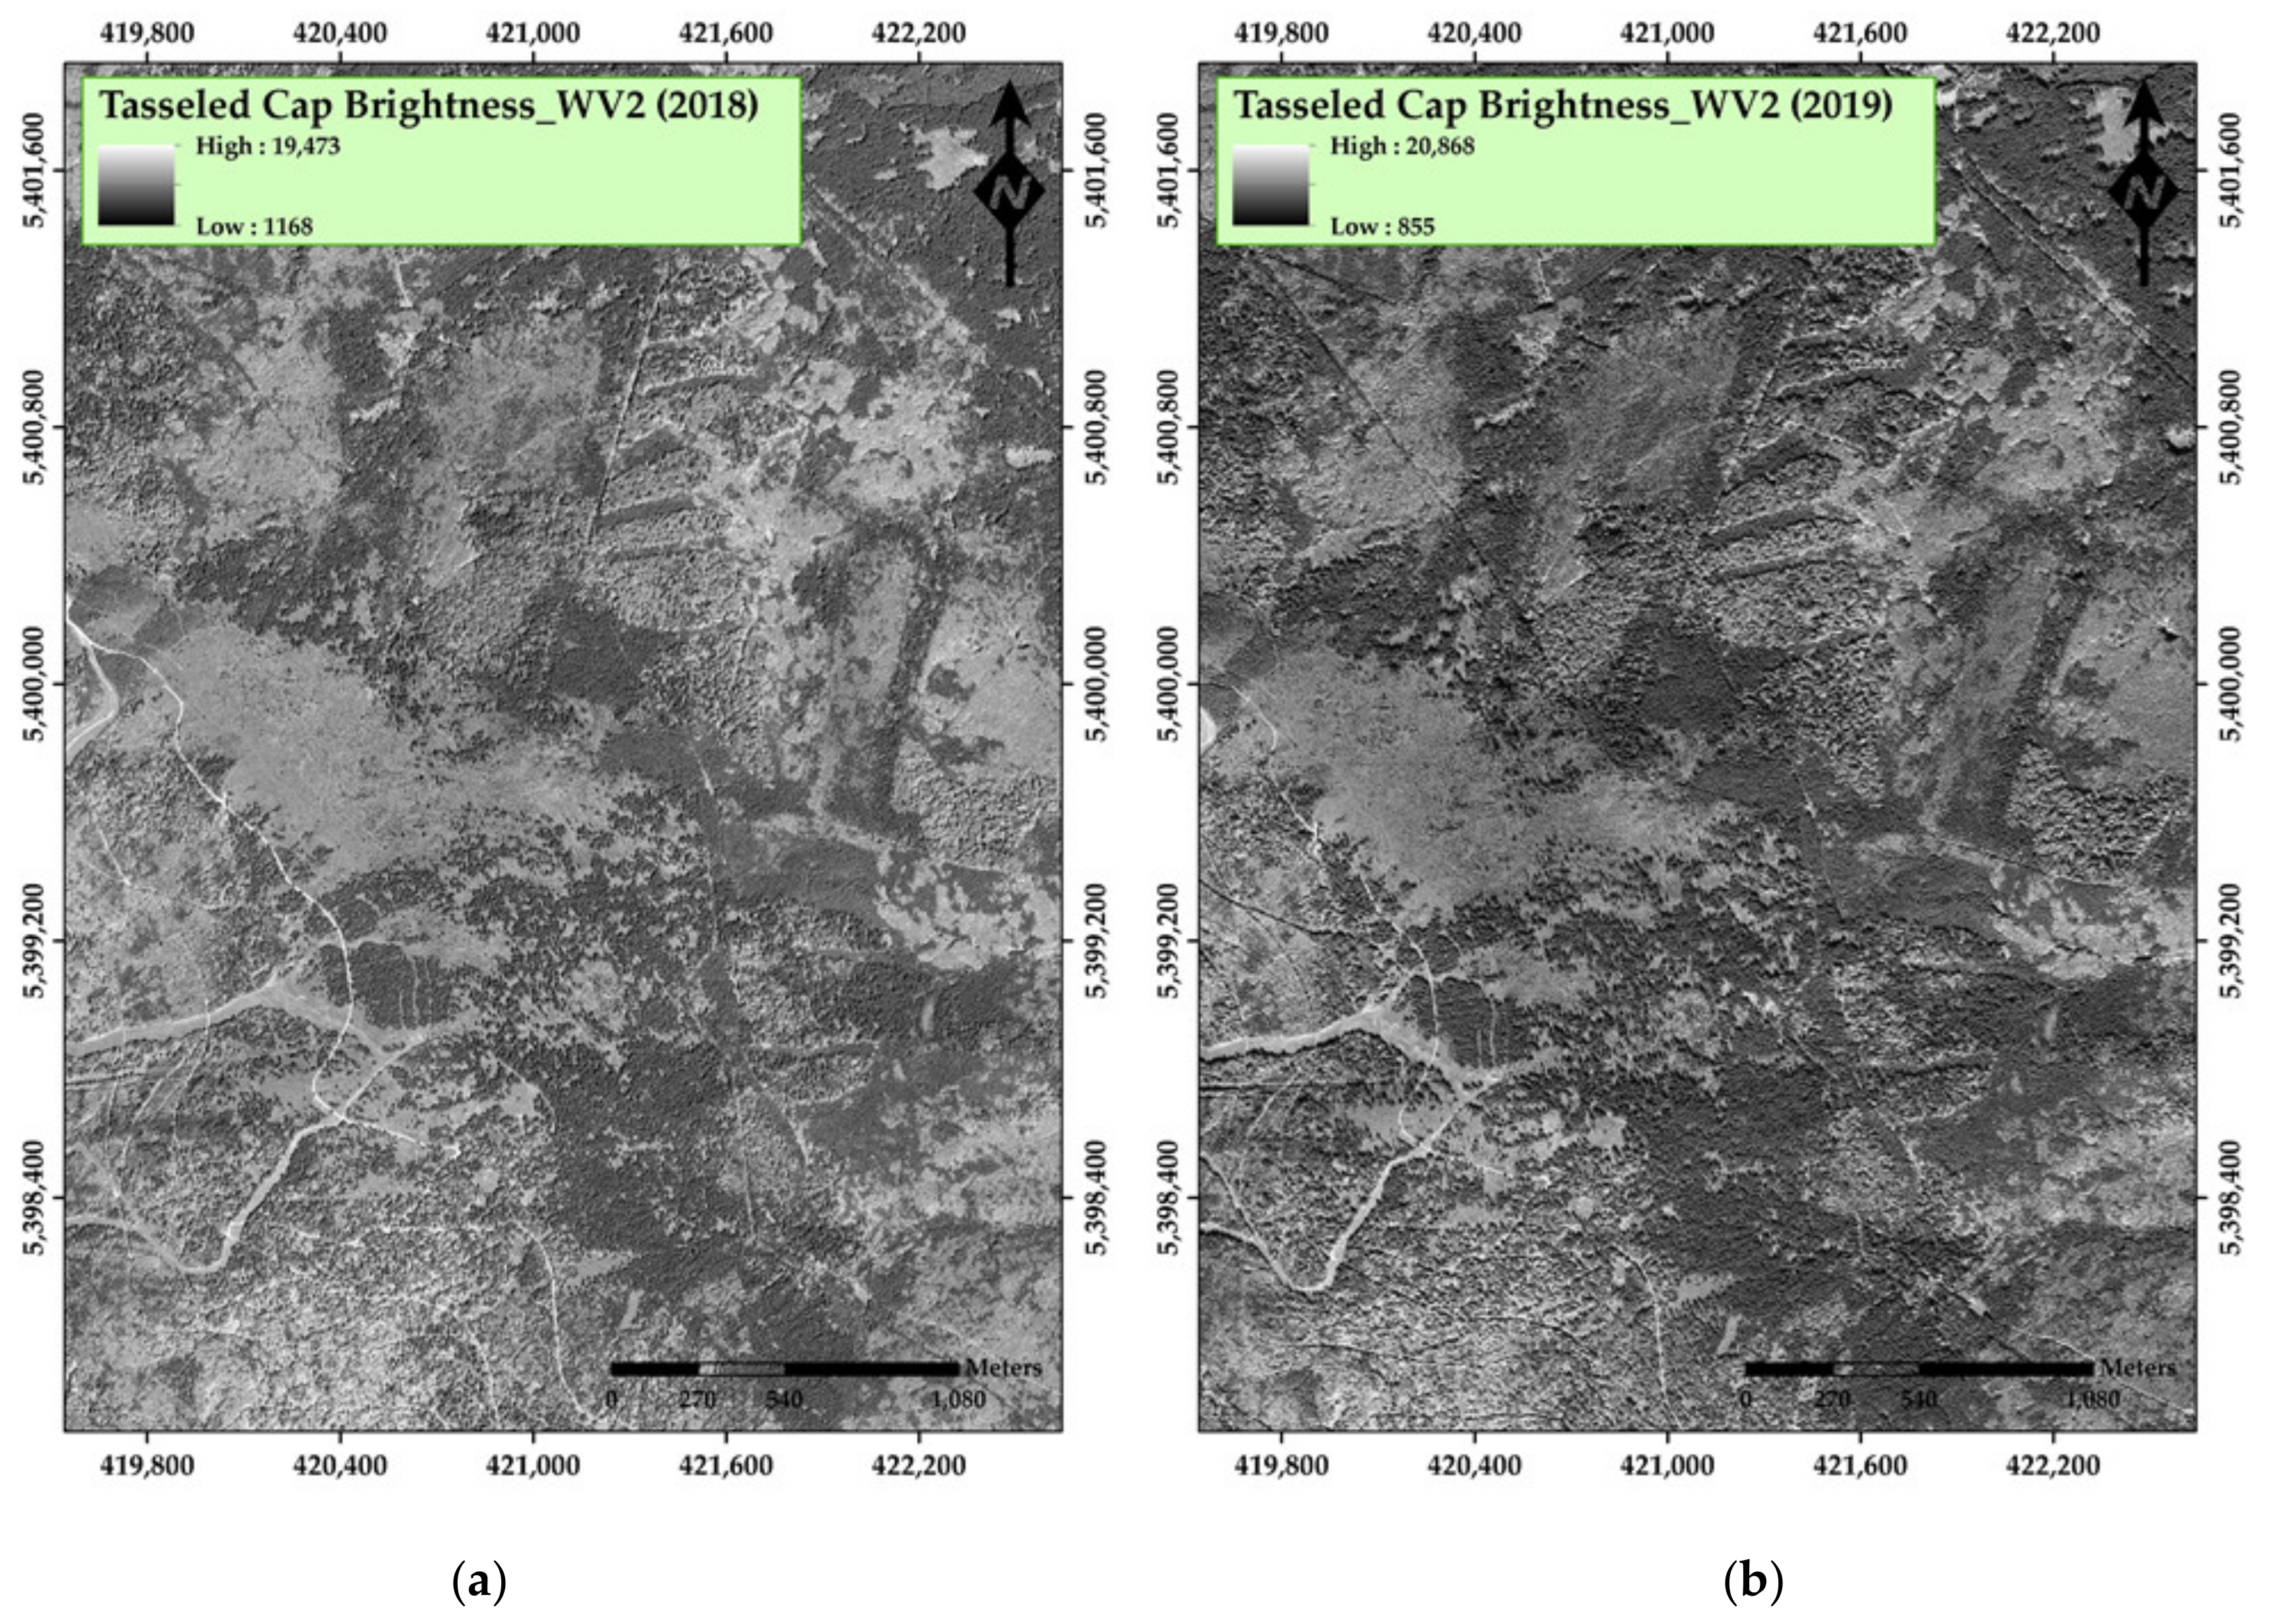
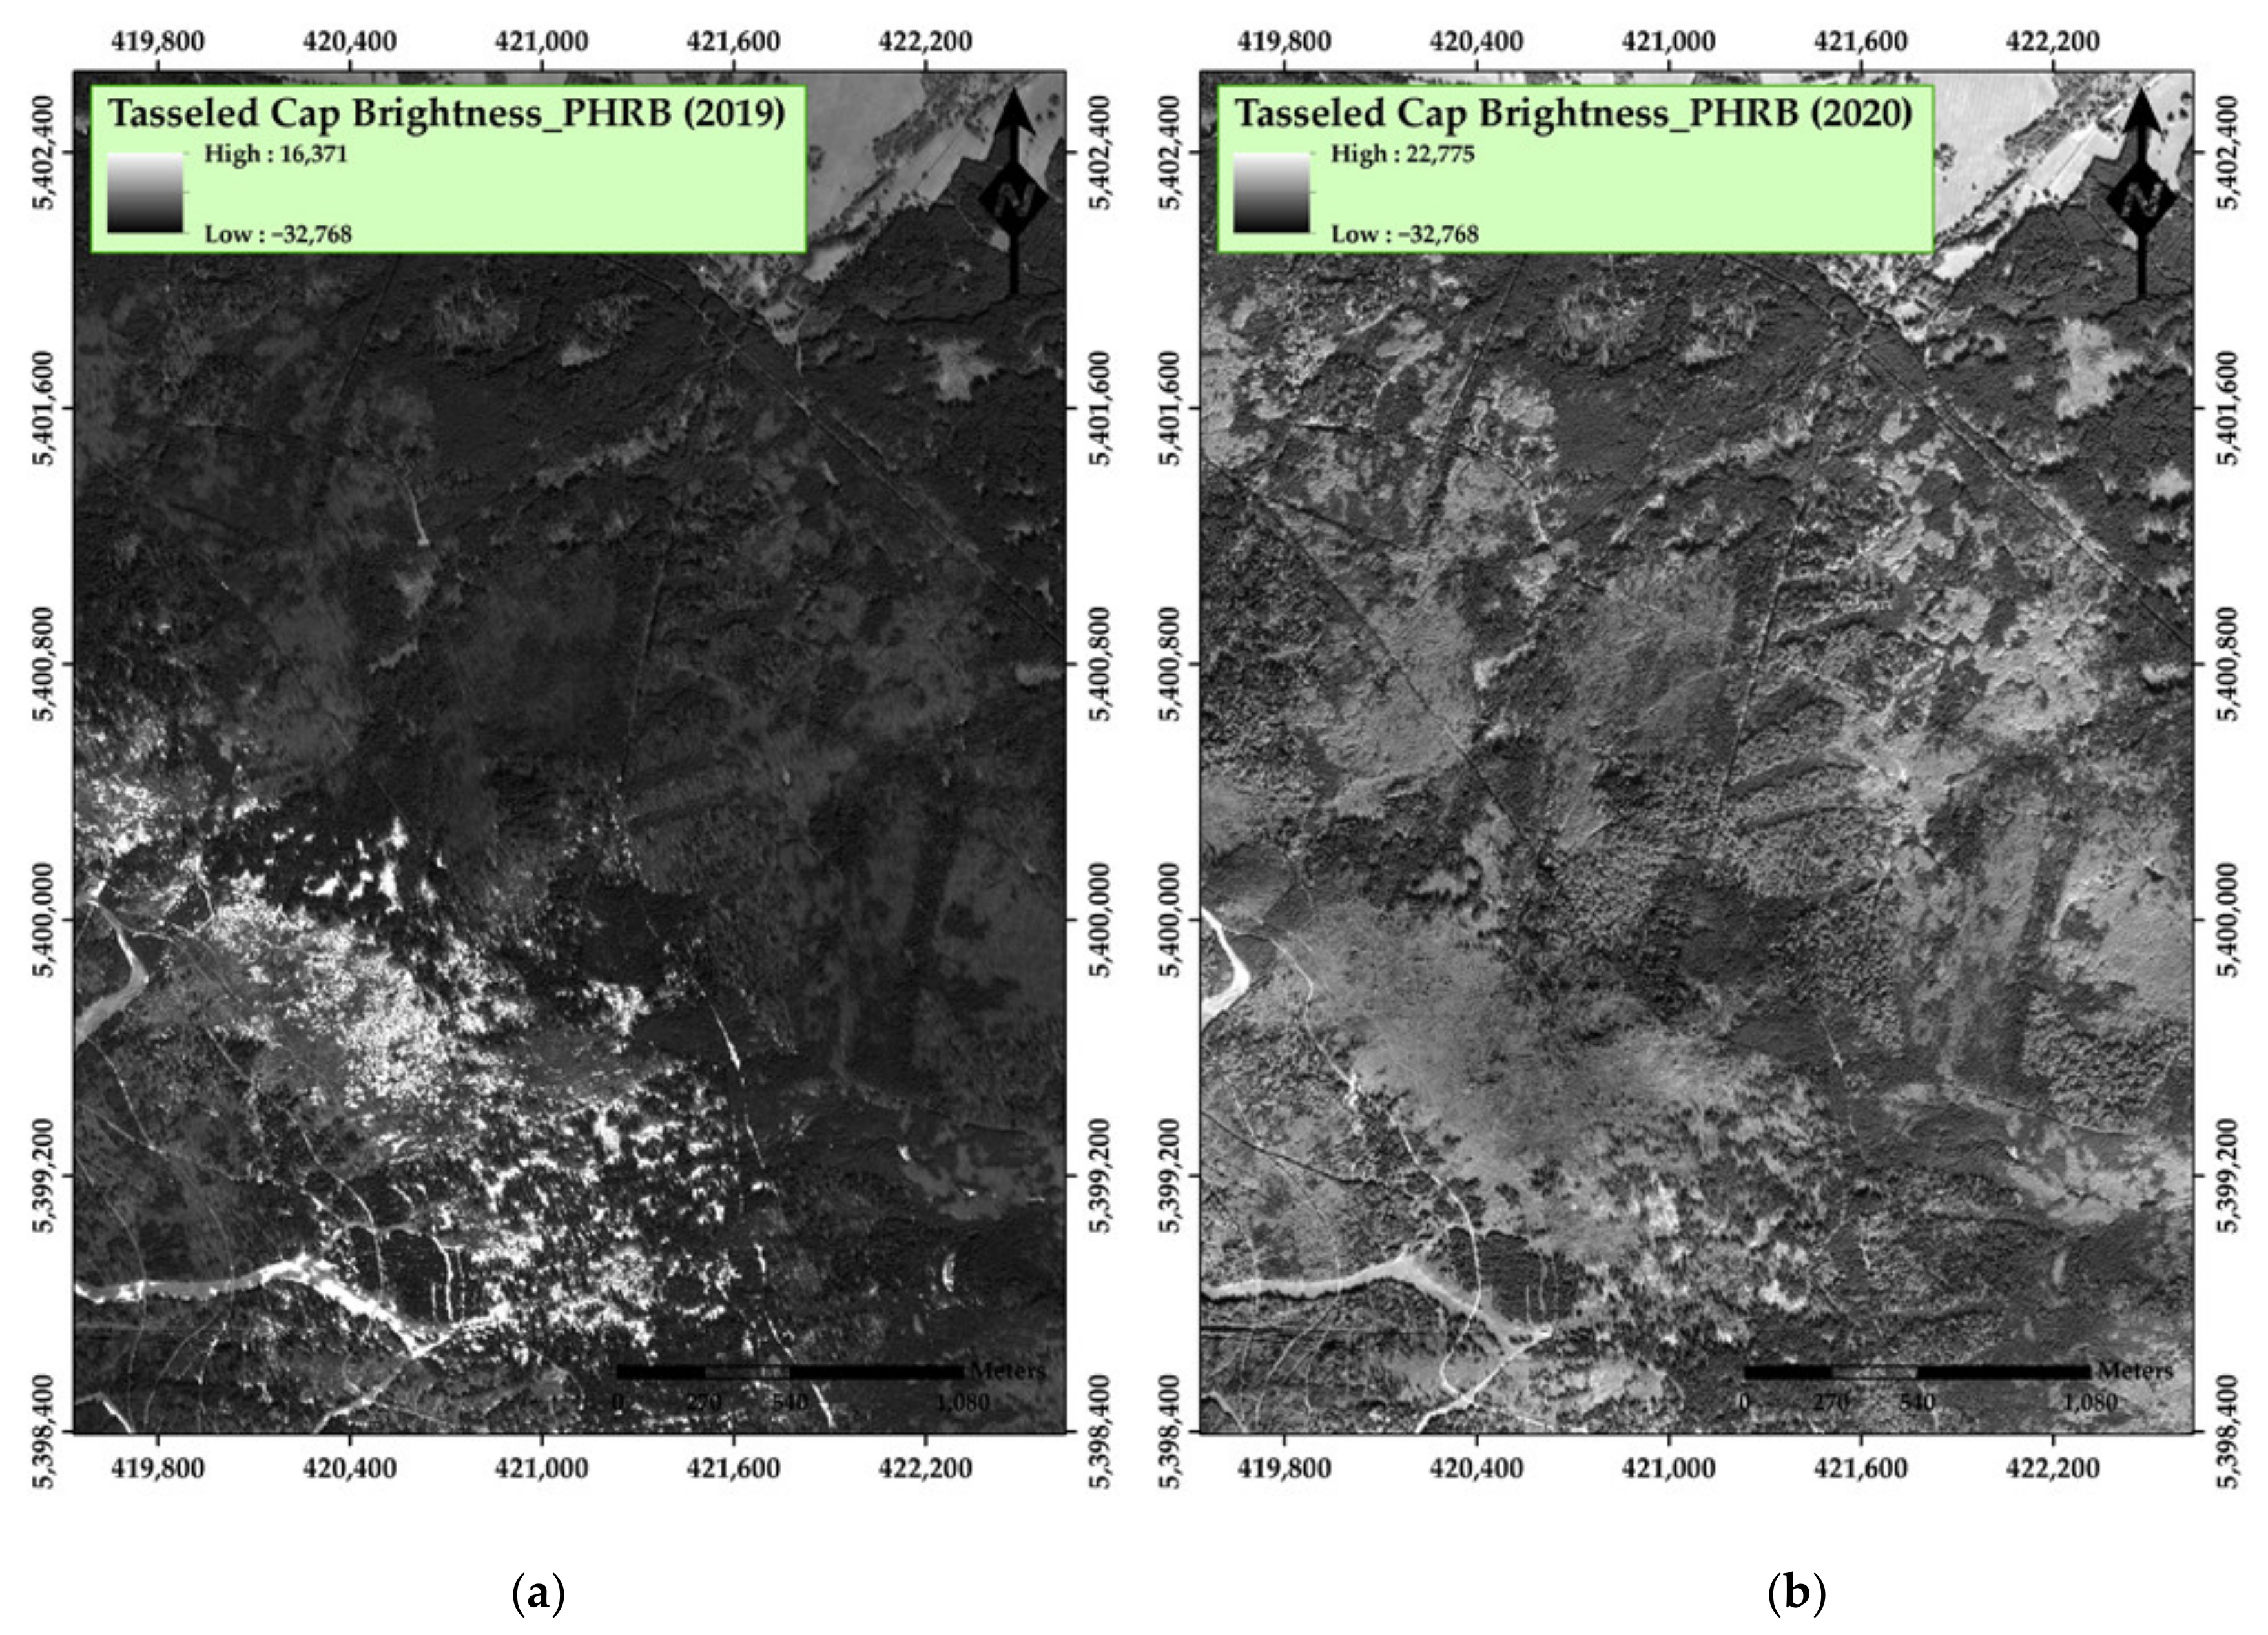
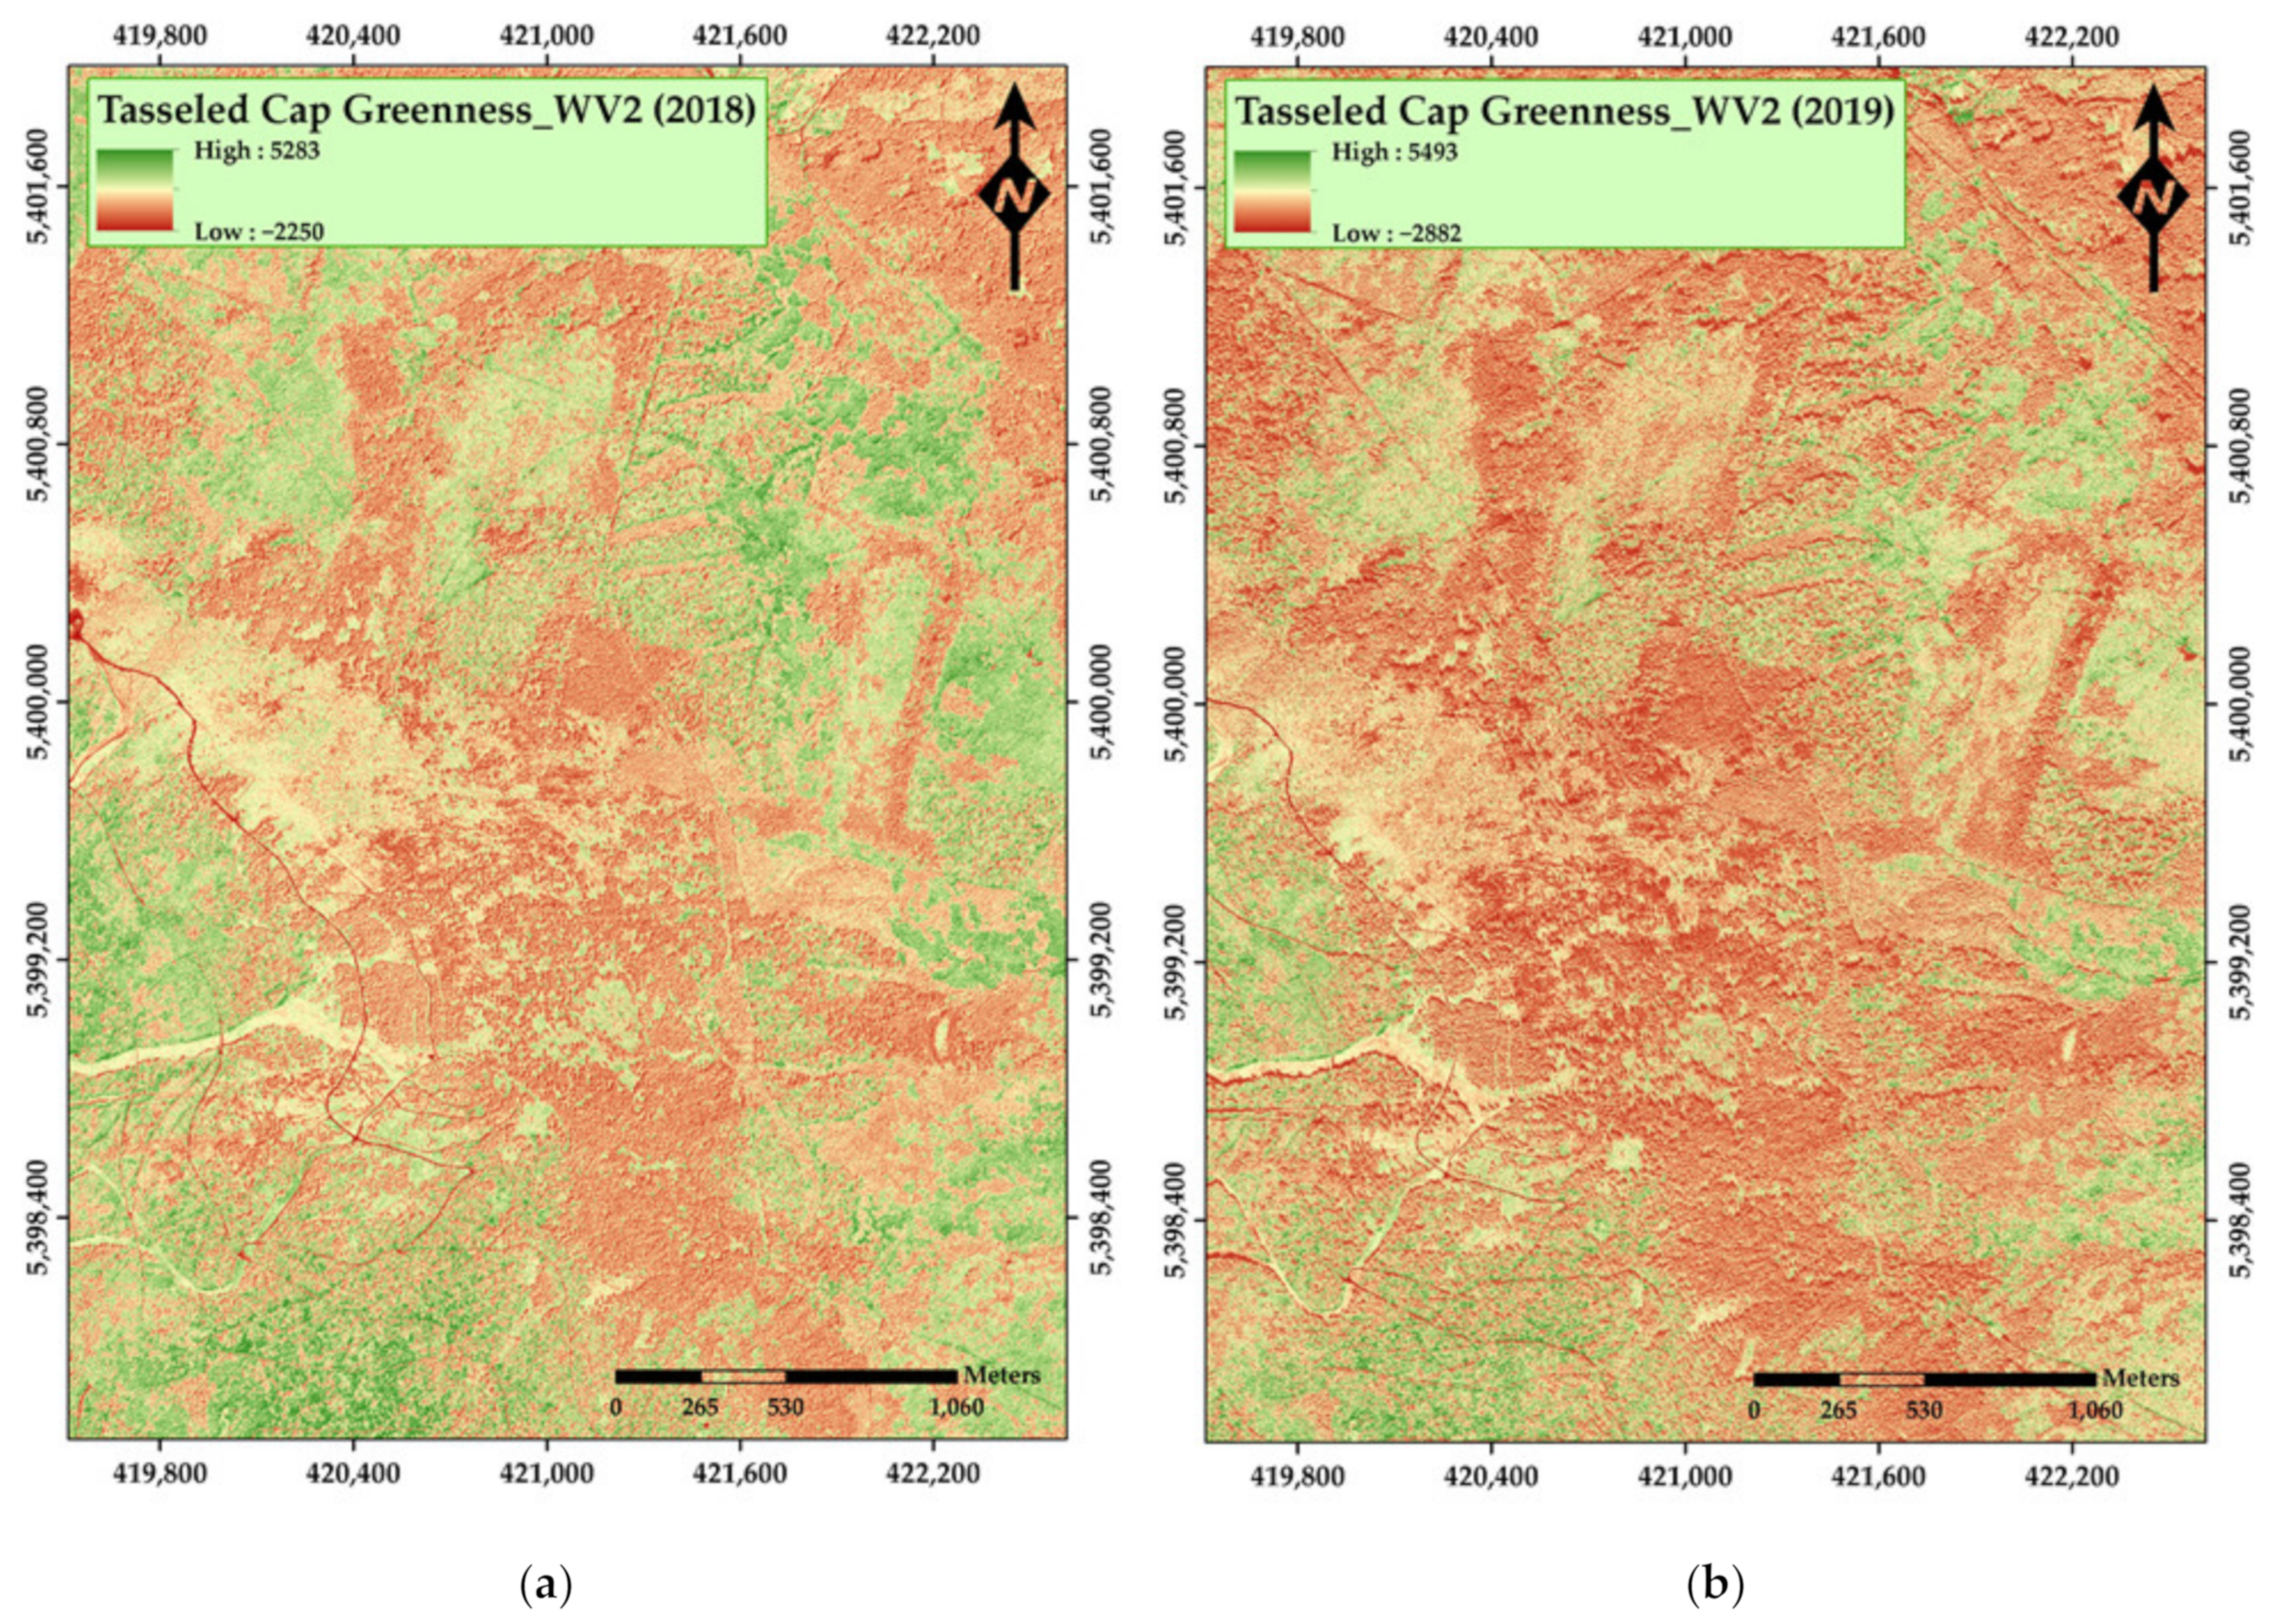
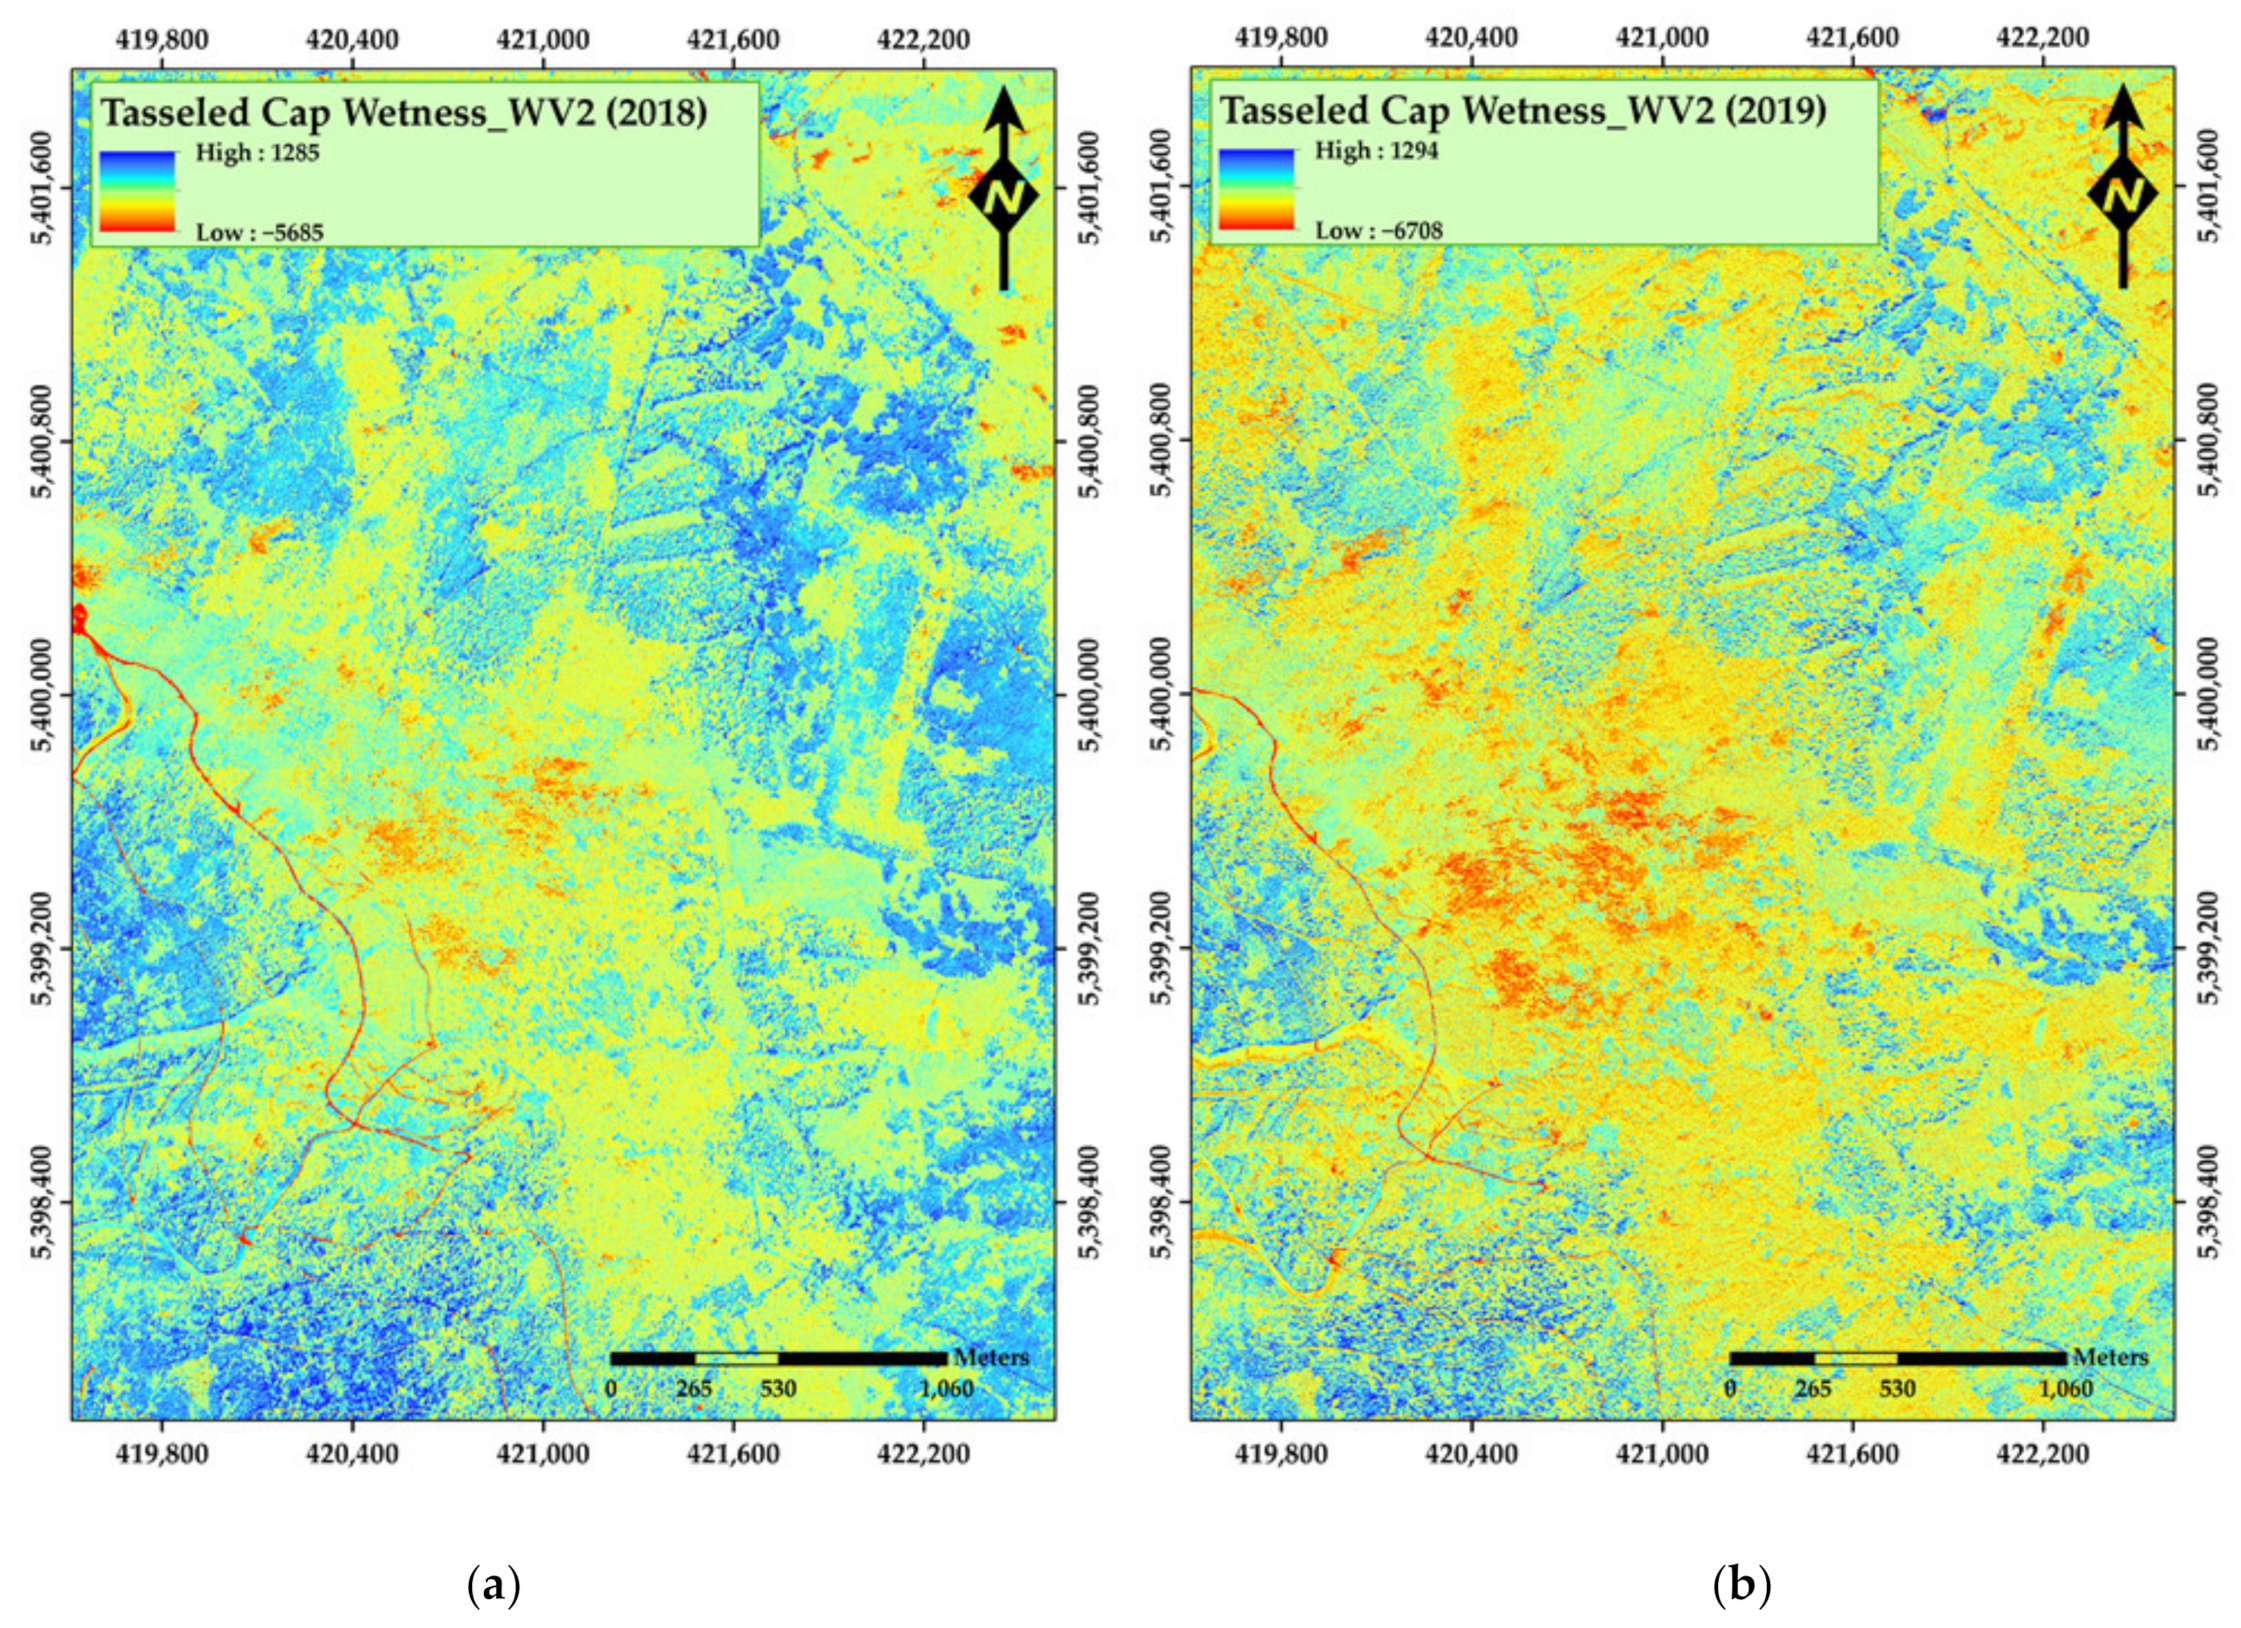
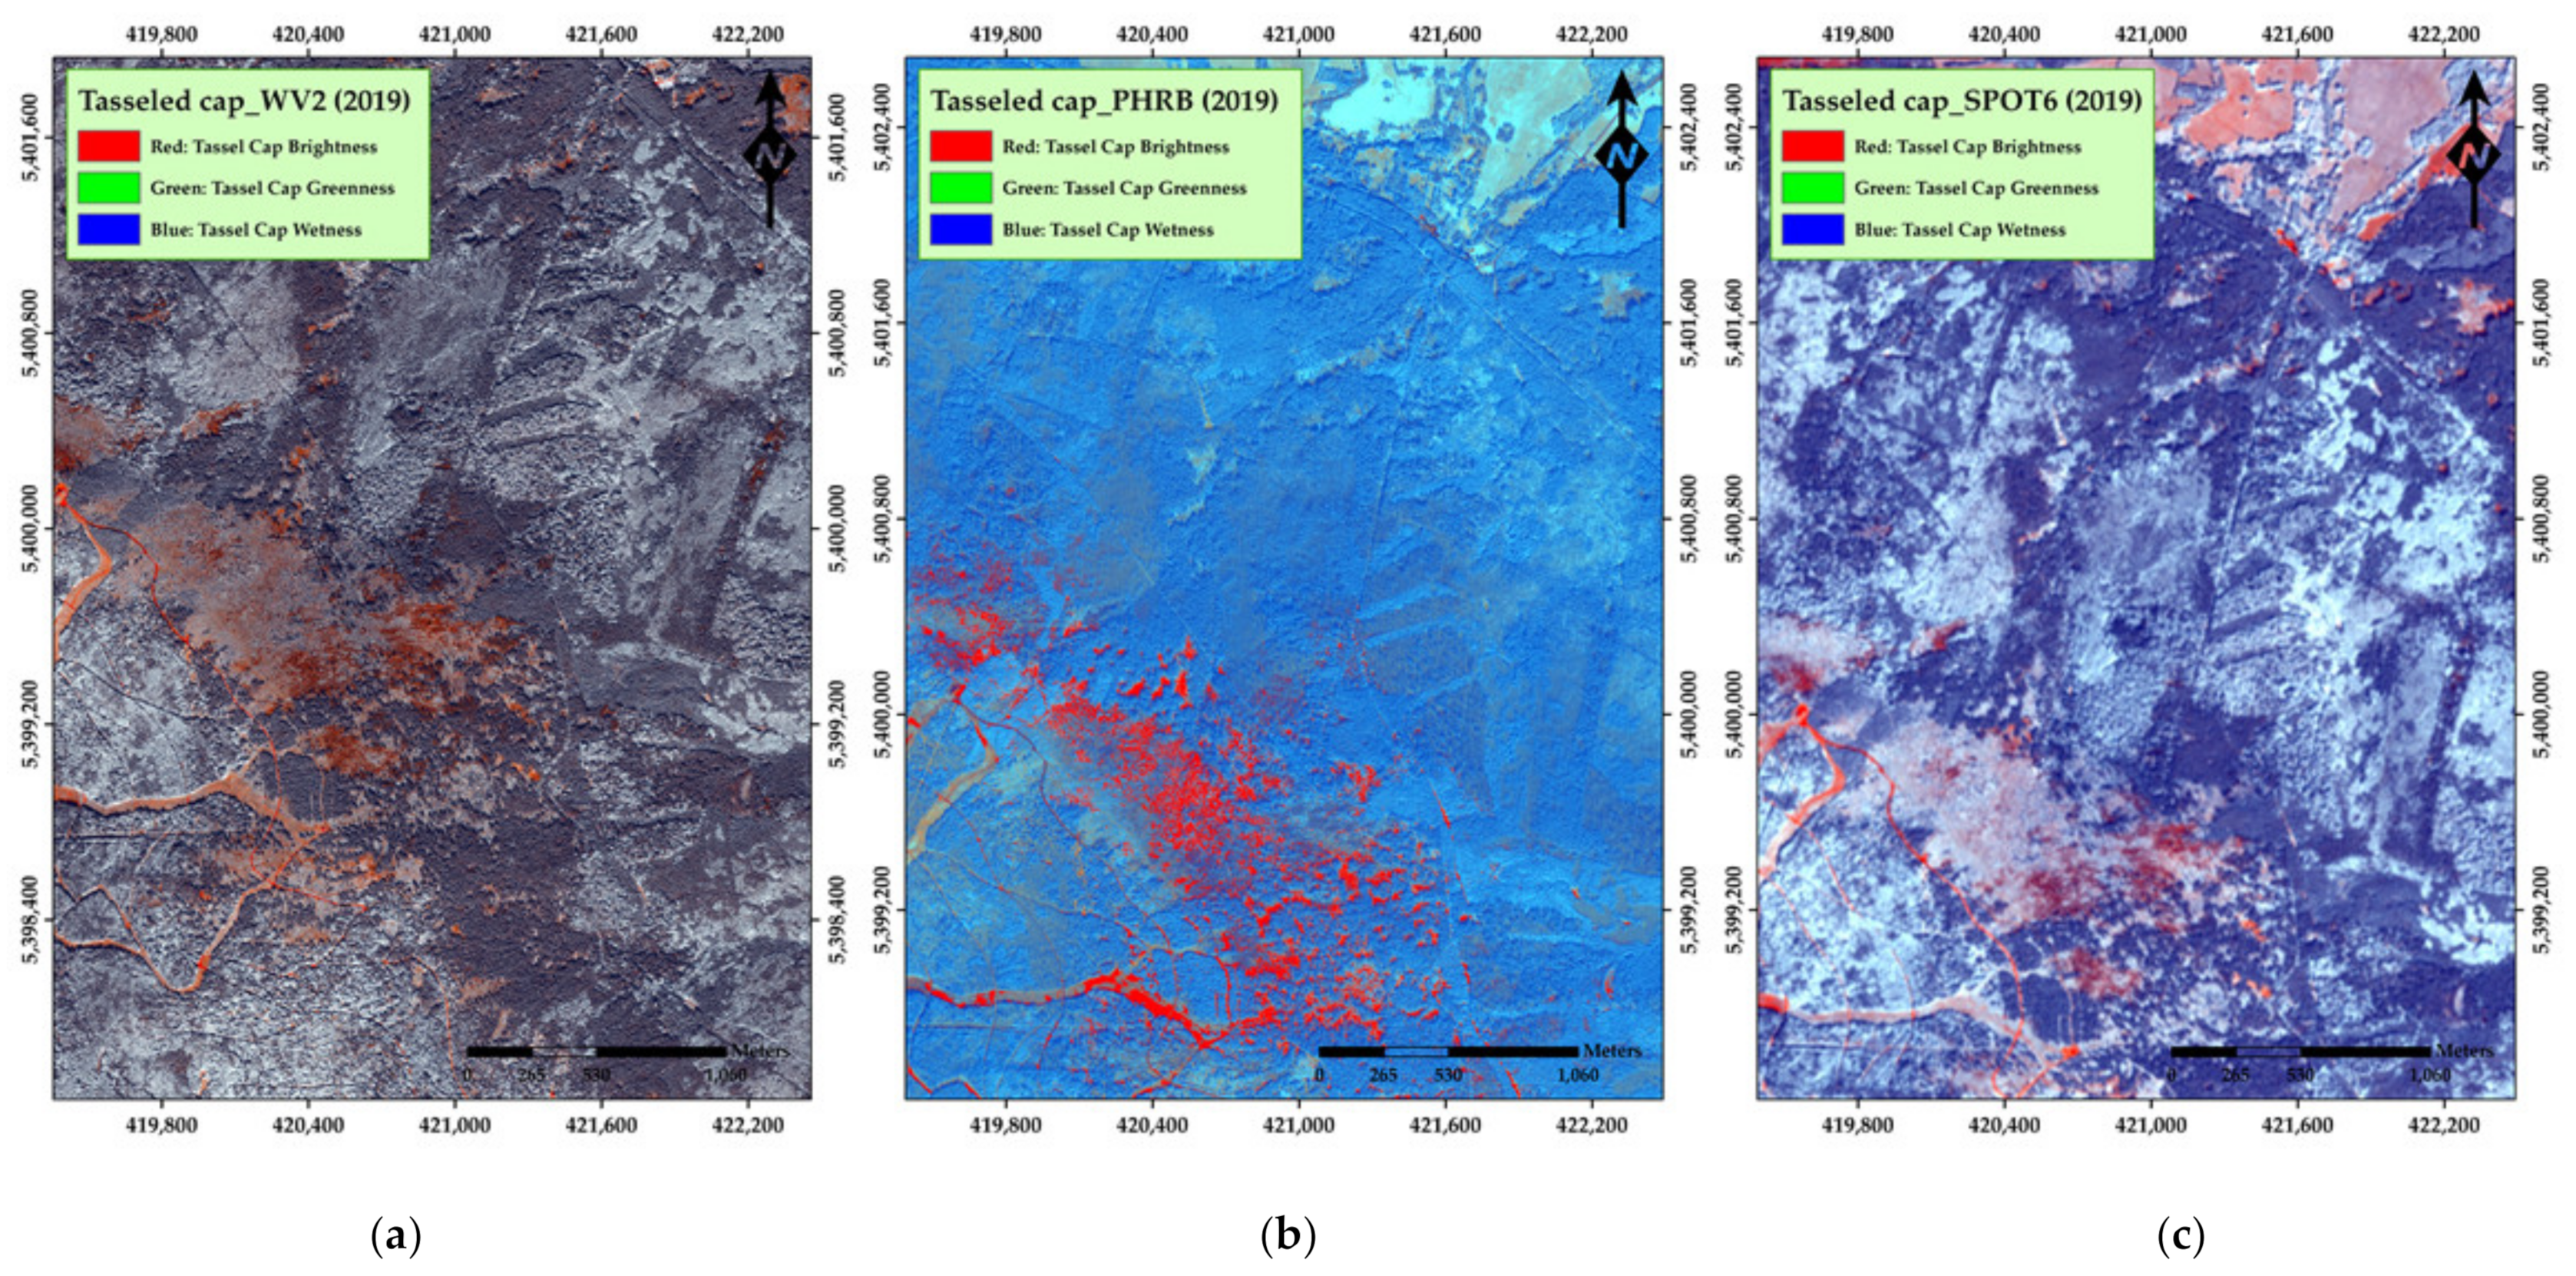
To develop a deeper understanding of the spatiotemporal patterns related to the European spruce bark beetle, several VIs (Table 3, see Appendix A), including various wavelength bands (Table 2), were applied to evaluate the status of the vegetation cover between the years 2018 and 2020. WorldView-2 contains a red-edge band; thus, we additionally applied the following vegetation indices (MCARI, NDRE, and PSRI; see details in Table 3, see also Appendix B). Moreover, we used principal component analysis (PCA; see Appendix C) [32] and tasseled cap transformation (Figure 4, Figure 5, Figure 6, Figure 7 and Figure 8; see Appendix D) [33,34,35,36,37] to convert image bands into secondary channels and enhance the spectral differences between trees’ health statuses. For more efficient classification, tasseled cap was used to reduce the multiband dataset to three channels (brightness, greenness, and wetness). Tasseled cap transformation was conducted using Catalyst (PCI Geomatics, Markham, ON, Canada) for all the images.

2.5. Accuracy Assessment

SPSS Statistics V.24 (IBM Corporation, Armonk, NY, U.S.A), Statistica V.12 (Dell Inc., Round Rock, TX, USA), and MATLAB® R2017b professional edition (MathWorks, MA, USA) were used for the statistical analyses and visualization of the collected data. Based on Kolmogorov–Smirnov test results, our data were not normally distributed, thus Levene’s test was used to assess the equality of variances for all the tested statistical variables for each processed layer. The following descriptive statistics were calculated for each layer within each sample polygon area: minimum and maximum values, range, mean, standard deviation, sum, median, and variance.
To determine the strength of the association between the categorical (independent) and numerical (dependent) variables, the Eta (η) coefficient was used (Equation (1)). Eta-squared (η2) was calculated to measure the coefficient of determination (Equation (2)):
Eta   η = S S e f f e c t S S t o t a l
Eta   η 2 = S S e f f e c t S S t o t a l
where   S S e f f e c t   is the sum-of-squares between the groups and S S t o t a l   is the total sum-of-squares.
Dunnett’s T3 test was used to compare the means between the variables (Equation (3)). Dunnett’s T3 test does not assume any equality of variance for analyzing the differences between the groups. A significance level of 0.05 was used to determine whether the above test was statistically significant.
D D u n n e t t = t D u n n e t t   2 M S S / A n
where t D u n n e t t refers to the critical value in the Dunnett critical value table, 2 M S S / A   is mean square within groups, and n is the sample size.
The feature selection tool was used in Statistica to calculate Cramer’s V, which was used to understand the strength of the relationships between the tested variables. Cramer’s V was calculated as:
V = φ 2 min k 1 ,   r 1 = x 2 / n min k 1 ,   r 1
where φ is the phi coefficient, x 2   is derived from Pearson’s chi-squared test, n is the total observations, k is the number of columns, and r is the number of rows.

3. Results

Spectral Analysis
(1). Eta-Squared (η2)
The results of Eta-squared (η2) showed that for the Pléiades images, although there was a medium-size effect for the blue and red bands in 2020, in general, there was a low-size effect for the Pléiades main bands (more details in Table S1). Our results showed a moderate effect for the tasseled cap transformations derived from Pléiades in 2019 and a low effect for Pléiades in 2020. In addition, a significant size effect (~30%) was detected for VIs, including NDVI, SAVI, SR, and TVI, derived from Pléiades in 2019. Based on Eta-squared (η2) results, SR in 2019 was the most important layer to predict the health status classes for 2018, 2019, and 2020, with size effects of 38%, 38%, and 34%, respectively. In general, Pléiades in 2019 performed better in predicting the health classes compared with the data from 2020 (Table 4).
Regarding WorldView-2, coastal blue, blue, green, and red bands had a very high impact (>50%) in detection of health classes. The bands derived from WorldView-2 in 2019 had slightly better performance than in the 2018 image. Greenness derived from the tasseled cap had a low impact on the health status, but contrary brightness (~26–38%) and wetness (32–51%) showed high-size effects for all years (2018–2020). VIs, such as NDVI, SR, TVI, and PSRI, had a moderate (WorldView-2 for 2018) and high (WorldView-2 for 2019) impact on predicting the health status classes for all years (2018–2020; more details in Table 5 and Table S1).
A low association impact was detected for PCA in all years (2018–2020) for Pléiades and WorldView-2 images, and for SPOT-6 in 2020. For SPOT-6 (2018 and 2019), the PCA results showed a moderate impact. In addition, R-G-B bands derived from SPOT-6 (2018 and 2019) had a significant impact on health status prediction, with an impact ranging between 34 and 56%. A moderate impact was detected in the case of NIR bands. In addition, the results showed that tasseled cap channels (from SPOT-6 in 2018 and 2019), such as brightness and wetness, had significant importance in detecting health classes (more details in Table S1).
For SPOT-6 (2018 and 2019), Vis, such as NDVI, SAVI, TVI, and SR, mainly had a moderate to high importance in detecting health status, while for SPOT-6 2020, there was no significant importance for these indices. However, there was a moderate impact for R-G-B bands and the brightness channel derived from SPOT-6 in 2020. In general, SPOT-6 for 2018 and 2019 had much better performance in distinguishing the health classes than 2020 (see Table 6 and Table S1).
The R-G-B bands and most satellites were highly significant in the prediction of health classes, most likely because the associated wavelengths were highly correlated with photosynthetic activities. In addition, coastal blue derived from the WorldView-2 images was crucial for health status assessment because it is absorbed by chlorophyll-a in healthy plants, thus it is very effective when conducting vegetative analyses.
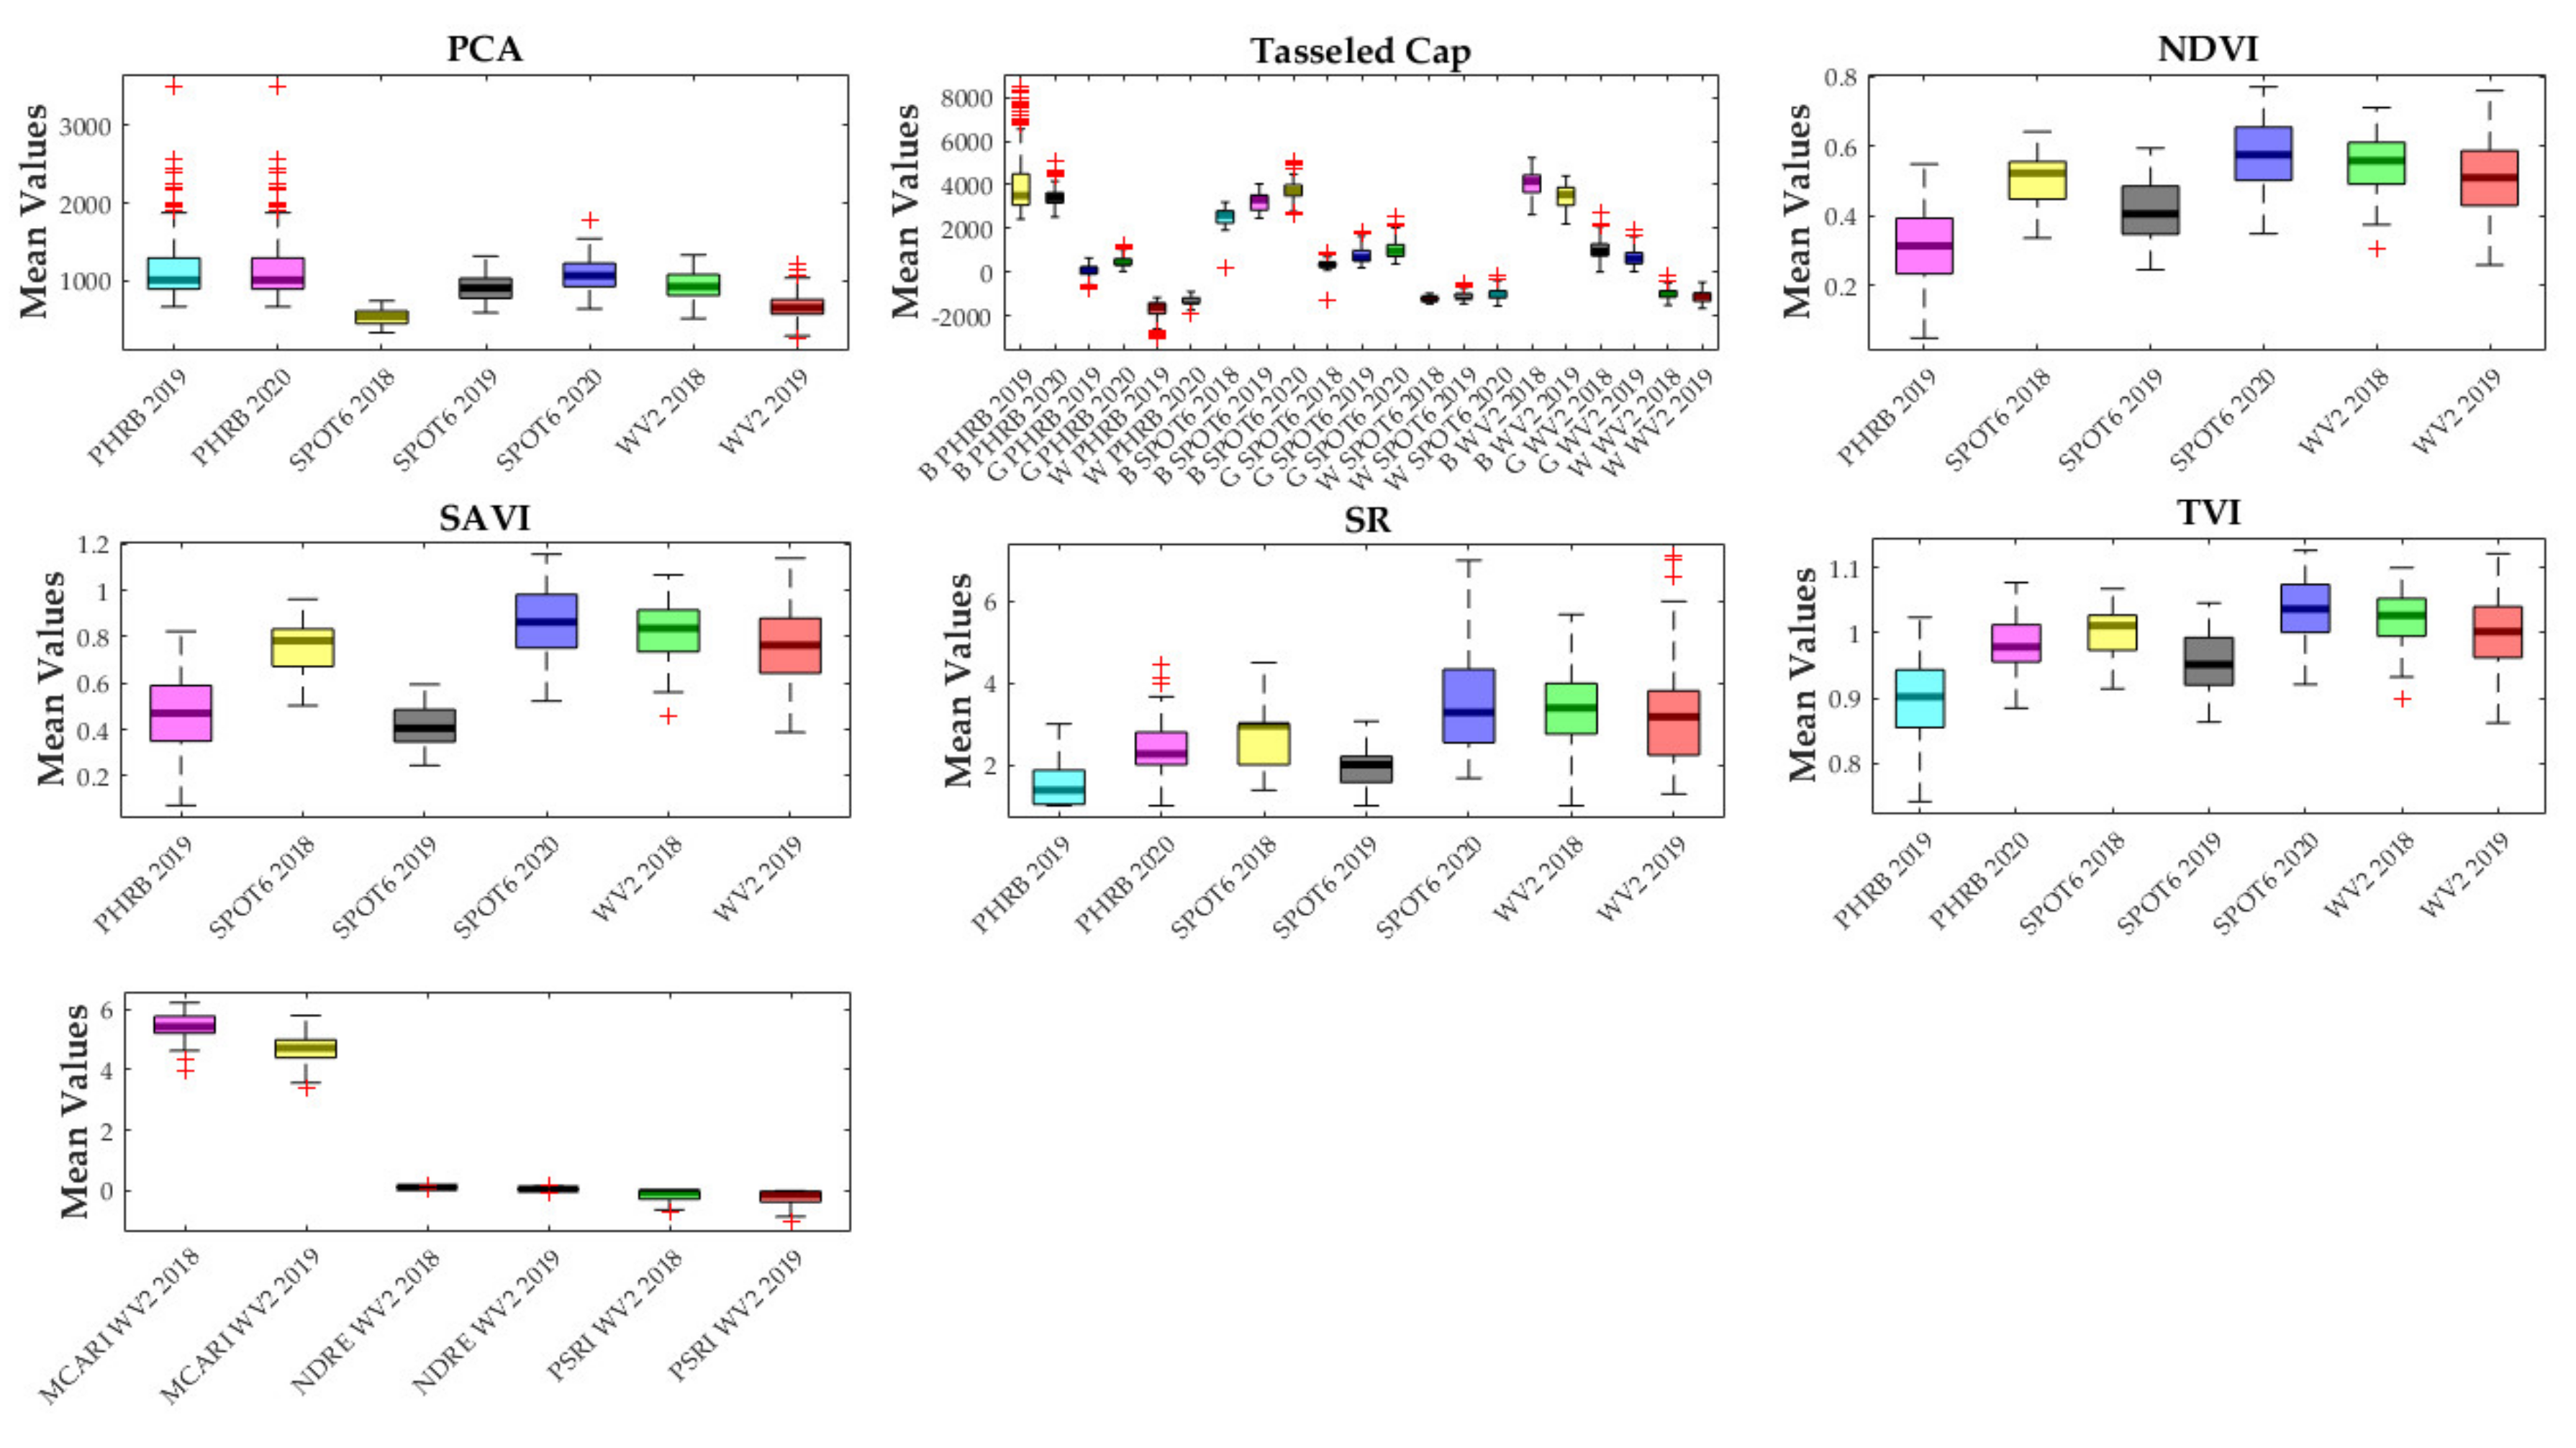
Between all the calculated descriptive statistics (mean, max, min, STD, etc.), mean values were determined to be more promising in the prediction of classes (further details in Table S1). Therefore, for further analyses, we only focused on the mean values. Figure 9 shows the differences in mean values for the calculated transformations and VIs from all satellites.
(2). Feature Selection
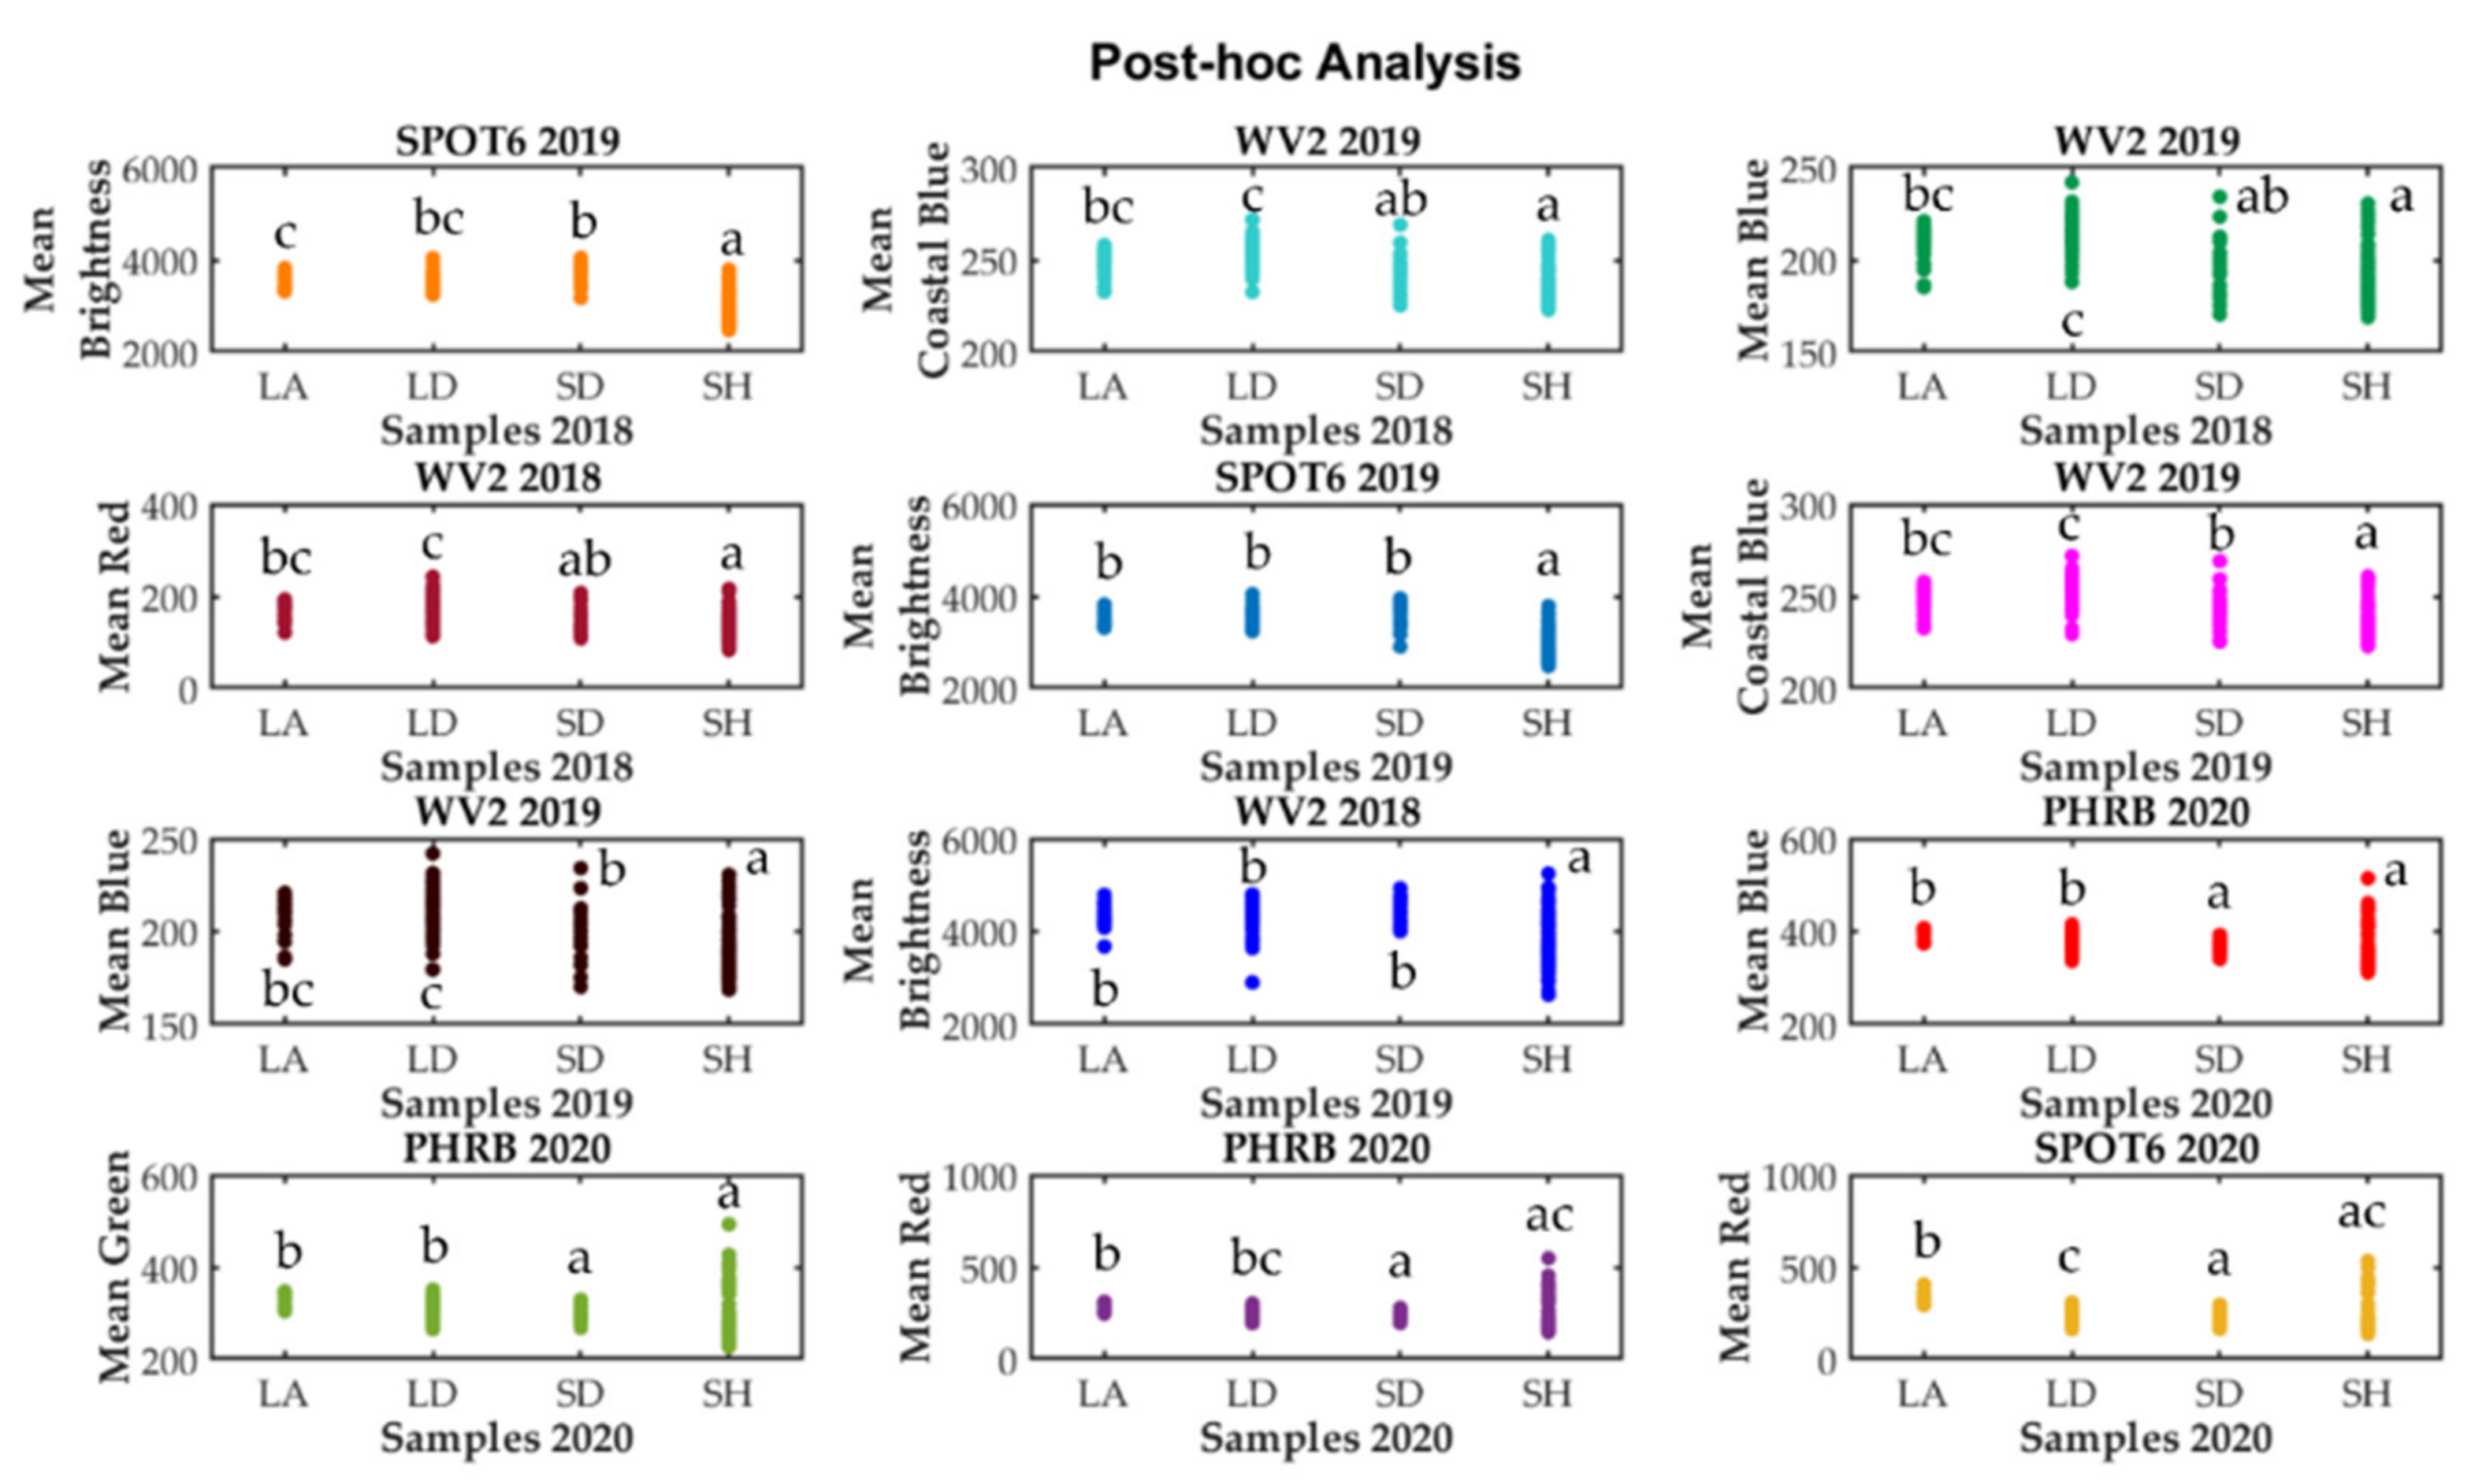
A feature selection algorithm was used to identify the most important layers in the modeling process for each dependent variable separately (Table S2). The feature selection approach was in agreement with the Eta-squared (η2) results. Some of the main influential layers for the classes in 2018 included: brightness SPOT-6 2019 (Cramer’s V = 0.5453), coastal blue WorldView-2 2019 (Cramer’s V = 0.4962), blue WorldView-2 2019 (Cramer’s V = 0.4855), red WorldView-2 2018 (Cramer’s V = 0.4665), green WorldView-2 2019 (Cramer’s V = 0.4531), and red WordView-2 2019 (Cramer’s V = 0.4522). For the classes in 2019: brightness SPOT-6 2019 (Cramer’s V = 0.5166), coastal blue WorldView-2 2019 (Cramer’s V = 0.4814), blue WorldView-2 2019 (Cramer’s V = 0.4709), brightness WorldView-2 2018 (Cramer’s V = 0.4522), and red WorldView-2 2019 (Cramer’s V = 0.4515). For the classes in 2020: red PHRB 2020 (Cramer’s V = 0.5655), red SPOT-6 2020 (Cramer’s V = 0.5524), blue PHRB 2020 (Cramer’s V = 0.5379), green PHRB 2020 (Cramer’s V = 0.5368), and coastal blue WorldView-2 2019 (Cramer’s V = 0.5063; further details in Table S2).
In general, WorldView-2 had better performance than the other two satellites for predicting the health status classes in 2018 and 2019. For 2020, there was not a significant difference between the satellites. The main bands (R-G-B and coastal blue) and tasseled cap channels (brightness and wetness) had the highest significance and were the most important layers in identifying the health status classes (see Table S2 for further details).
(3). Post Hoc Analysis
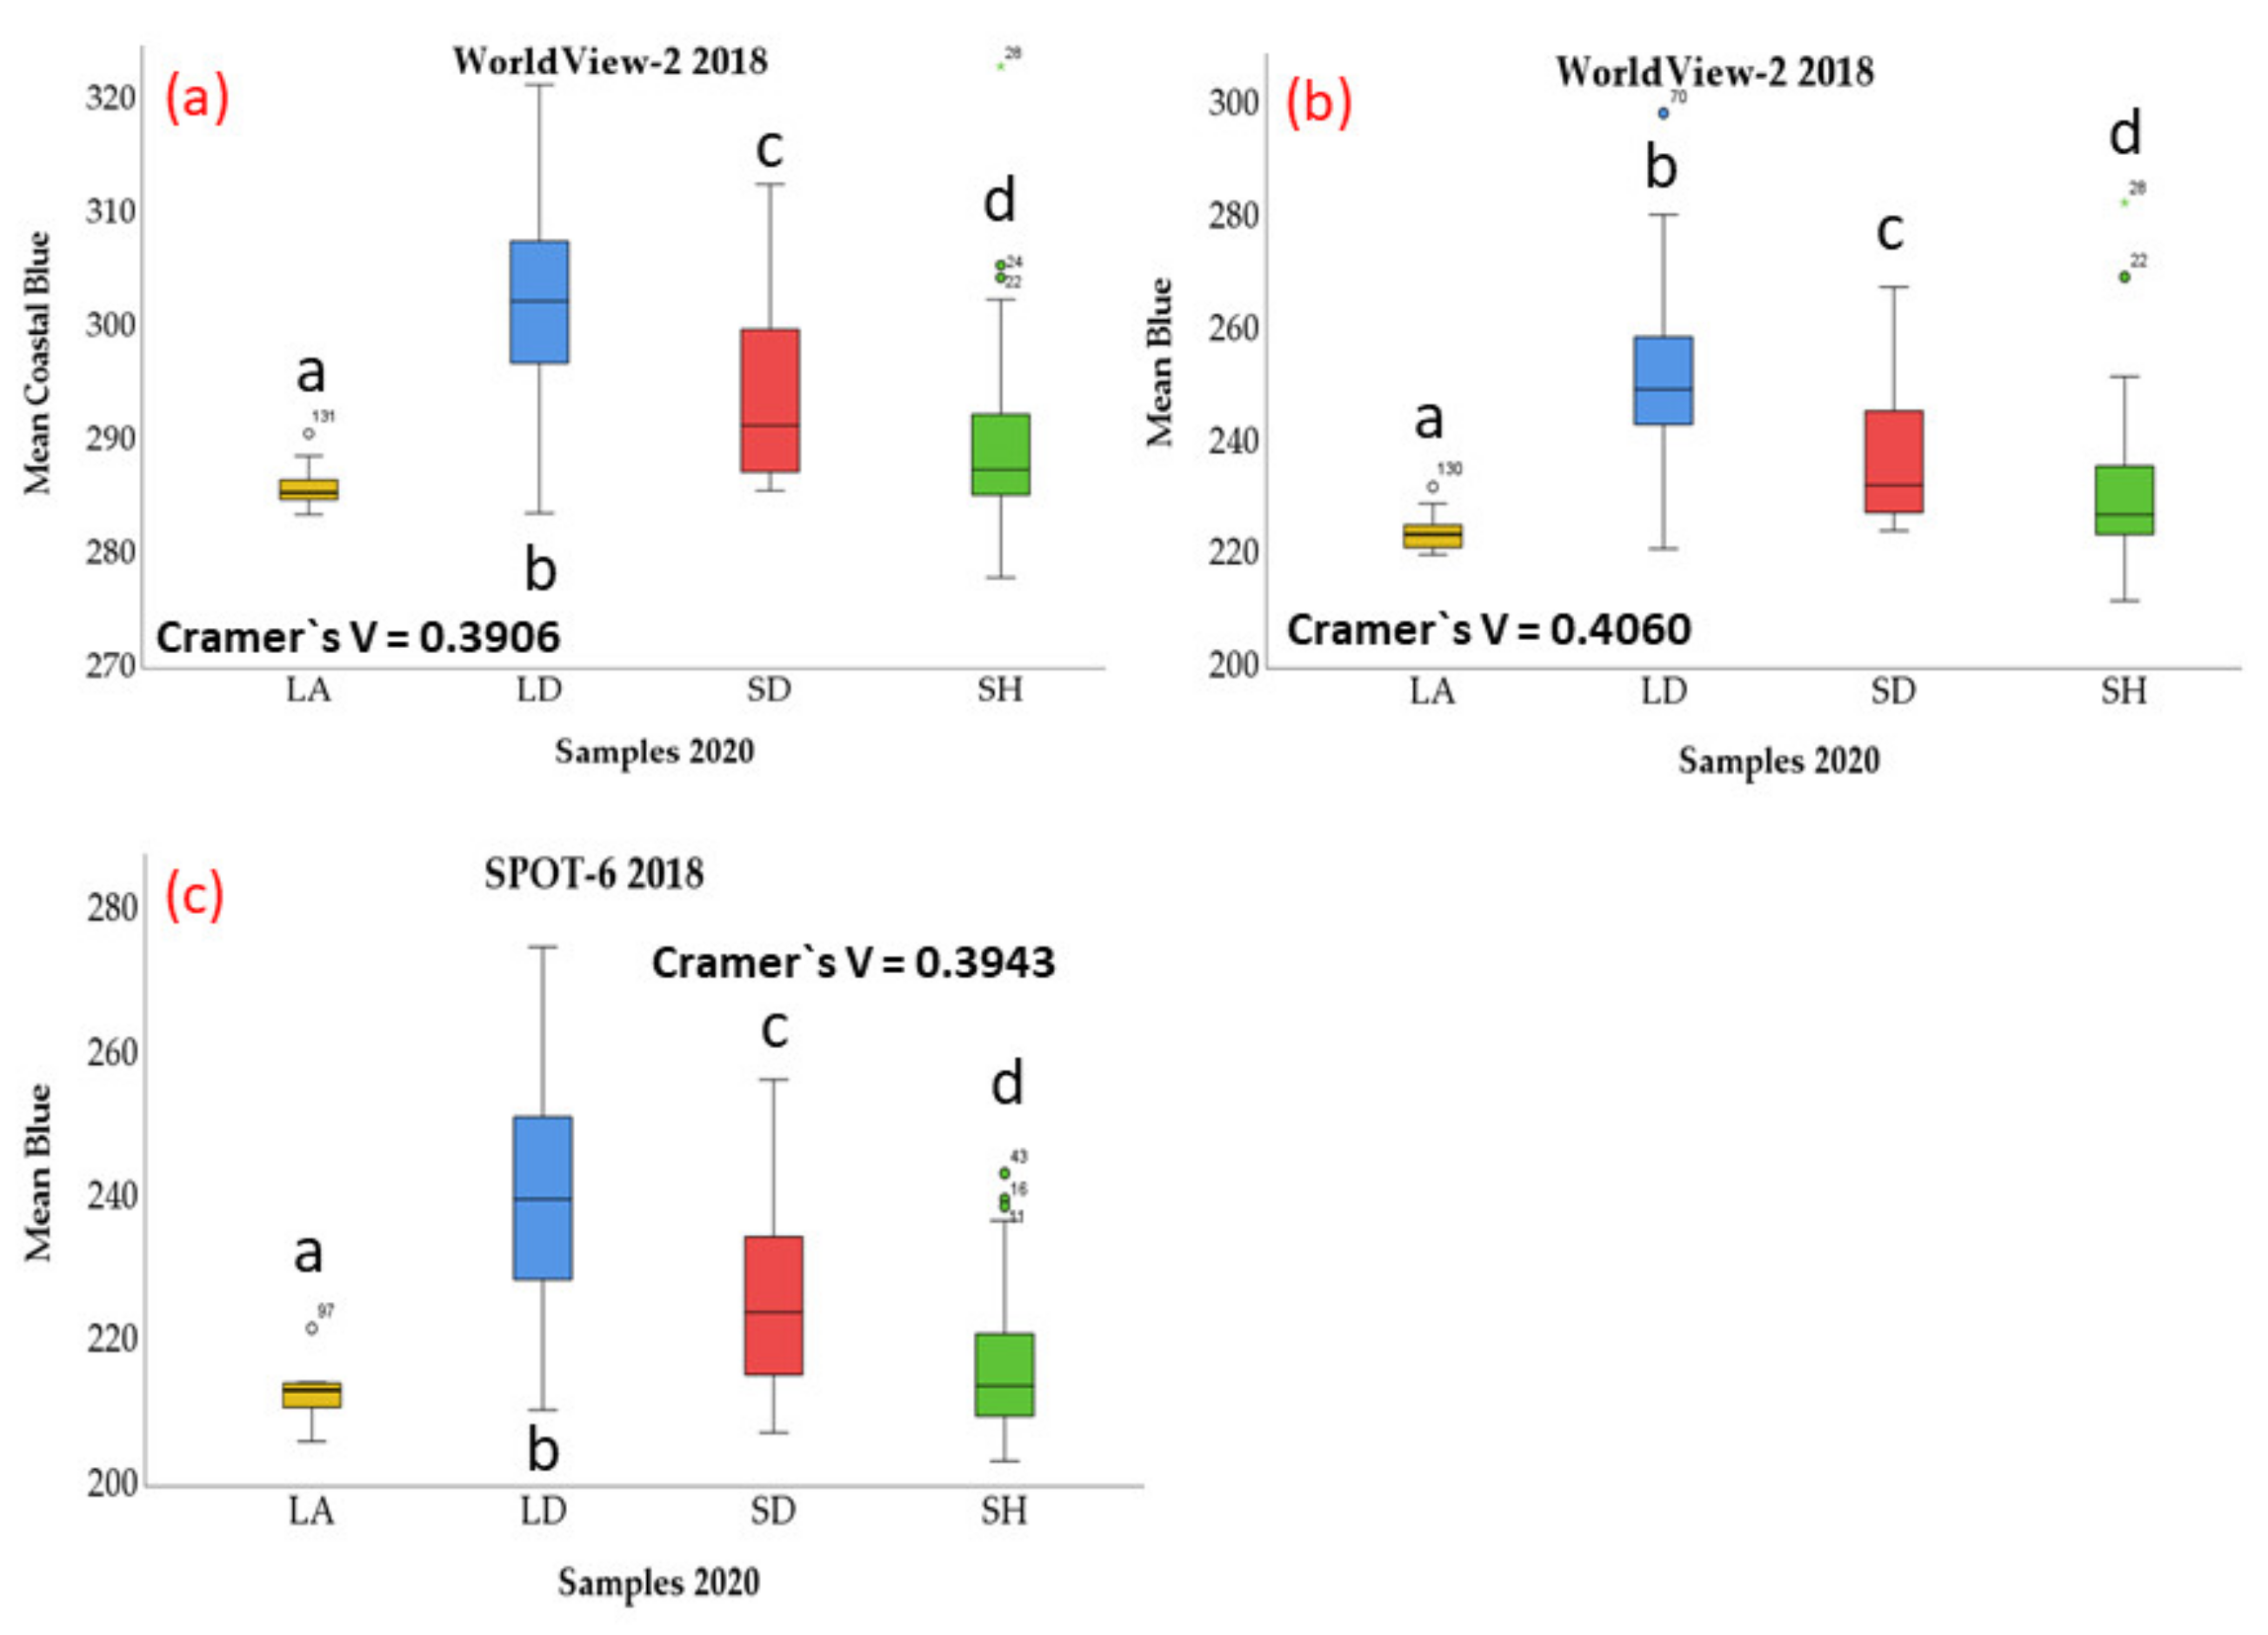
In most cases, the results of the multiple comparisons for all years showed that there was a significant difference in the mean values between the health status classes. In Figure 10, the results of Dunnett’s T3 are presented for some of the most important layers according to the feature selection algorithm (Table S3), while Figure 11 shows the bands that were helpful to differentiate all the classes from each other. Our results demonstrated that it was generally easier to distinguish the healthy standing class from the other classes; however, in some cases, it was difficult to distinguish the lying attractive (LA) from standing healthy (SH). For example, the yellow band from WorldView-2 in 2018 could distinguish all the classes except the standing healthy (SH) and lying attractive (LA). Similar to this were the red band from WorldView-2 in 2018, and the coastal blue, blue, green, yellow, red, brightness from WorldView-2 in 2019. In addition, in Figure 10, it is evident there were some challenges to identifying lying attractive (LA) from lying dead (LD) trees. We attributed this to the nature of sample collection that caused a mixture of values from the soil and leaves. Although prediction of all classes was not fulfilled in many of the bands, several bands could separate the classes successfully (Figure 11).

4. Discussion

Currently, there is a severe lack of knowledge about the role of the European spruce bark beetle and its population dynamics via remote sensing, which is proving increasingly useful for predicting forest health issues. This study evaluated the use of multisource time series (2018–2020) remote sensing data; using different processed layers to predict the potential spread of European spruce bark beetle in healthy trees, we investigated spectral correlations between healthy and nonhealthy trees. The location of the study area was ideal for such a study due to the continuous and severe disturbances caused by abiotic and biotic factors during the period of interest of the study.
Notably, the date of image acquisition could significantly affect the image information content for the investigation and analyses of spectral correlations between different datasets. For example, in the image captured by Pléiades (acquired 25 April 2019), due to partial presence of snow on the forest floor, which has different reflectance properties, Eta (η) and Eta-squared (η2) had weaker association with the health classes compared to WorldView-2 (acquired 4 September 2019), which, in terms of spatial resolution, is very similar to Pléiades. In addition, unbalanced sample sizes resulted in insufficient information for some classes (e.g., lying attractive (LA) trees), leading to poorer classification performance; this result was in accordance with other similar studies [45,46].
Differences in the wavelengths of the same bands between different sensors (e.g., Pléiades blue band: 430–550 nm, WorldView-2 blue band: 450–510 nm, and SPOT-6: blue band: 450–520 nm) may also help explain the weaker spectral correlations found between the datasets. However, WorldView-2 has higher spectral resolution and provides an additional band (coastal blue: 400–450 nm), which provided better overall performance. More specifically, the coastal blue band was found to be crucial for tree health status assessment because it is absorbed by chlorophyll-a in healthy plants and aids in conducting effective vegetative analysis. As displayed in Figure 11, a higher amount of chlorophyll-a,b in healthy trees resulted in a lower amount of reflectance in coastal blue and blue bands (higher absorption meant lower reflectance). As the density of chlorophyll decreased, the reflectance of these bands increased proportionally. Essentially, changes in the amount of chlorophyll result in changes in the amount of absorption of coastal blue, as well as other bands in the visible spectrum [47].
The results revealed that spectral resolution was crucial for the early detection of infestation. For example, Figure 11 presents three bands from two different satellites in 2018 that perfectly predicted the health status classes from 2020. During the early stages of infestation, the density of leaf pigments changed; thus, it was more likely to detect the health status using the wavelength absorbed by the chlorophyll-a,b and carotenoids. Therefore, coastal blue and blue bands had much higher performance in tree health status prediction. After the infestation, the cell structure of leaves changed; thus, health status was detected using the wavelengths interacting with these properties (cell structure) [48,49]. NIR absorption/reflectance changed based on the cell structure of the vegetation. Therefore, this band was helpful in distinguishing current health classes.
We determined that spatial resolution was not as crucial as spectral resolution. In this study, SPOT-6 performed as well as Pléiades and WorldView-2. One reason for this finding may be the nature of the sampling method. In this study, each sample polygon covered several pixels, which led to mixed spectral values for each polygon. It can be assumed that if the sample size were smaller and representative of just one pixel (e.g., 2 × 2 m), the results may have been significantly different. Hypothetically speaking, in that case, SPOT-6 would not perform as well as the rest of the satellites due to the lower spatial resolution.
Issues differentiating between the lying attractive (LA) and standing healthy (SH) may be attributable to the high amount of chlorophyll-a,b in the lying attractive (LA) trees. Those trees were the result of windthrow, which meant that they were still alive and potential candidates for future bark beetle attacks. Although the VIs were significant for predicting health classes, and most of the VIs could distinguish healthy or green from the dead trees, distinguishing between standing healthy (SH) and lying attractive (LA) trees was challenging. This was likely due to the similar chlorophyll-a,b absorption and reflectance properties of the cellular structure of the leaves, especially in the NIR band. Our results were consistent with the results of several other studies that emphasized the importance of VIs in predicting health status classes [27,45,46,50,51,52,53].
In this study, the difficulties in separating the lying dead (LD) and lying attractive (LA) trees were attributed. Mixed values of soil, branches, and leaves caused this uncertainty in the samples, which resulted in the model being unable to distinguish between these two classes. Based on the visual interpretation of the 2018 UAV images, a large part of the study area was covered by lying attractive (LA) trees related to the recent windthrow, which were then defenseless against the European spruce bark beetle and were potentially a very good food resource and habitat for their propagation. In 2019, the potential food resources decreased, but it seems that they were still sufficient for the European spruce bark beetle regeneration. That is why approximately only 3% of the standing healthy (SH) trees turned to standing dead (SD).
After two years of exponential procreation (each beetle: 253; meaning that one bark beetle could procreate at least 15,000 beetles per year), the number of beetles in this area increased to some millions, and, because the available food resources were insufficient as food supply, this meant most of the lying attractive (LA) trees had transitioned to lying dead (LD) trees in 2019; thus, by 2020, the beetles infested the healthy trees. In 2020, approximately 28% of the standing healthy (SH) trees turned to standing dead (SD; Table 1). It can be assumed that the number of the attacked trees was higher, but ~28% could not resist the massive outbreak, which may have occurred due to the health condition of these trees. The results showed a significant difference between these trees (~28%) and the remaining standing healthy (SH) trees, even two years before the European bark beetle attack. To summarize, we surmised that these trees had some health status issues that could not survive the bark beetle attack; the findings of WorldView-2 coastal blue and blue bands from 2018, and the SPOT-6 blue band in 2018 (Figure 11), detected photosynthetic differences between the standing healthy (SH) and standing dead (SD) trees in 2020. It should also be noted that both classes were standing healthy (SH) in 2018. Alternatively, another possible scenario is that these trees in the study area were already under attack (the ~28%) and could be seen in the reflectance, but not phenotypically (after two years, they dried out).
Furthermore, this study showed that a single spectral band could distinguish among some or all of the health status classes. Conclusively, a single band (coastal blue, brightness, wetness, etc.) can be used to successfully detect early European spruce bark beetle spreading. In a study by Liu and Liu [54], multidate images were used to detect dead Robinia pseudoacacia L. plantations using the tasseled cap transformation algorithm. Their results, which correspond with our results, showed that tasseled cap can be efficiently used to monitor forest health status. The findings of this paper also were in line with another study conducted by Erener [55], who also highlighted the importance of tasseled cap for monitoring and health status assessment in a case study of the Seyitömer Lignite Enterprise in Kütahya, Turkey.
We expect that soon, most forest managers will be able to operate all types of UAV platforms that will allow for rapid data collection and real-time data streaming over large forested areas. Such qualitative data could be then used in combination with advanced satellite data to support innovative methods for early detection of European spruce bark beetle spreads into healthy trees.

5. Conclusions

Early detection of bark beetle spreading in healthy trees is of great importance for the effectiveness of forest management strategies and policies. Our study showed that annual index changes from very high and high spatial and spectral image resolutions can effectively be used to detect European spruce bark beetle spreading trends to healthy trees in advance. This new information is of practical value for monitoring purposes, because it can predict a priori European spruce bark beetle outbreaks in healthy trees over large forest areas. A single spectral band can distinguish some or all of the health status classes from each other. Conclusively, a single band can be used successfully for the early detection of European spruce bark beetle spreads. We determined that spectral resolution was more important than spatial resolution for detecting health status classes. Therefore, identifying physiological stress in earlier stages or detecting smaller spectral differences could be more feasible, with higher reliability and accuracy, using hyperspectral sensors in wavelengths that multispectral sensors cannot cover. Different stages of an infestation can change the absorption/reflectance in different wavelengths. Changes in chlorophyll activities result in different absorption/reflectance between the range of 400 to 700 nm. In addition, for trees that are dehydrated or afflicted with a disease, spongy layers within the leaf surface become deteriorated; thus, those trees absorb more NIR than healthy trees do.
Unfortunately, the cloudiness of the Šumava region due to its specific microclimate, made it difficult to obtain clear images over short time intervals. Satellite images with higher temporal resolution (e.g., Sentinels) can potentially increase image capturing during cloud-free days. However, the main disadvantage of these satellites is the lower spatial resolution that would not be suitable for our study due to the size of our samples. Limitations in sampling from certain classes with multispectral sensors (e.g., lying attractive (LA) from 2019 and 2020 and standing dead (SD) from 2018 and 2019) accounted for some of the uncertainties associated with our proposed approach. We believe that thermal sensors could improve the classification of different tree health statuses. Finally, we assume that the composition of several bands using parametric or nonparametric algorithms can lead to early detection of tree health status with high accuracy.

Supplementary Materials

The following are available online at https://www.mdpi.com/article/10.3390/rs13234953/s1, Tables S1/S2/S3: Table S1: Eta values. Table S2: Feature selection. Table S3: Post hoc analysis.

Author Contributions

Conceptualization, A.A.; methodology, A.A.; software, A.A.; validation, A.A. and D.P.; formal analysis, A.A.; investigation, A.A.; resources, A.A., P.S. and R.M.; data curation, A.A.; writing—original draft preparation, A.A. and D.P.; writing—review and editing, A.A. and D.P.; visualization, A.A. and D.P.; supervision, A.A., D.P. and P.S.; project administration, R.M.; funding acquisition, R.M. All authors have read and agreed to the published version of the manuscript.

Funding

This research was funded by NAZV under the project “Objectivization of the method for detection of the occurrence and dynamics of forest damaging agents by modern remote sensing tools as a decision support mean for the state forest administrative” (grant number QK1920458), as provided by the Ministry of Agriculture of the Czech Republic.

Institutional Review Board Statement

Not applicable.

Informed Consent Statement

Not applicable.

Data Availability Statement

Data sharing is not applicable.

Acknowledgments

We acknowledge that this study was financially supported by NAZV under the project “Objectivization of the method for detection of the occurrence and dynamics of forest damaging agents by modern remote sensing tools as a decision support mean for the state forest administrative” (grant number QK1920458) of the Faculty of Forestry and Wood Sciences (FFWS); Czech University of Life Sciences (CULS) in Prague.

Conflicts of Interest

The authors declare no conflict of interest.

Appendix A

Figure A1. Application of the SAVI vegetation index (VI) in: (a) WorldView-2 2018; (b) SPOT-6 2018.
Remotesensing 13 04953 g0a1
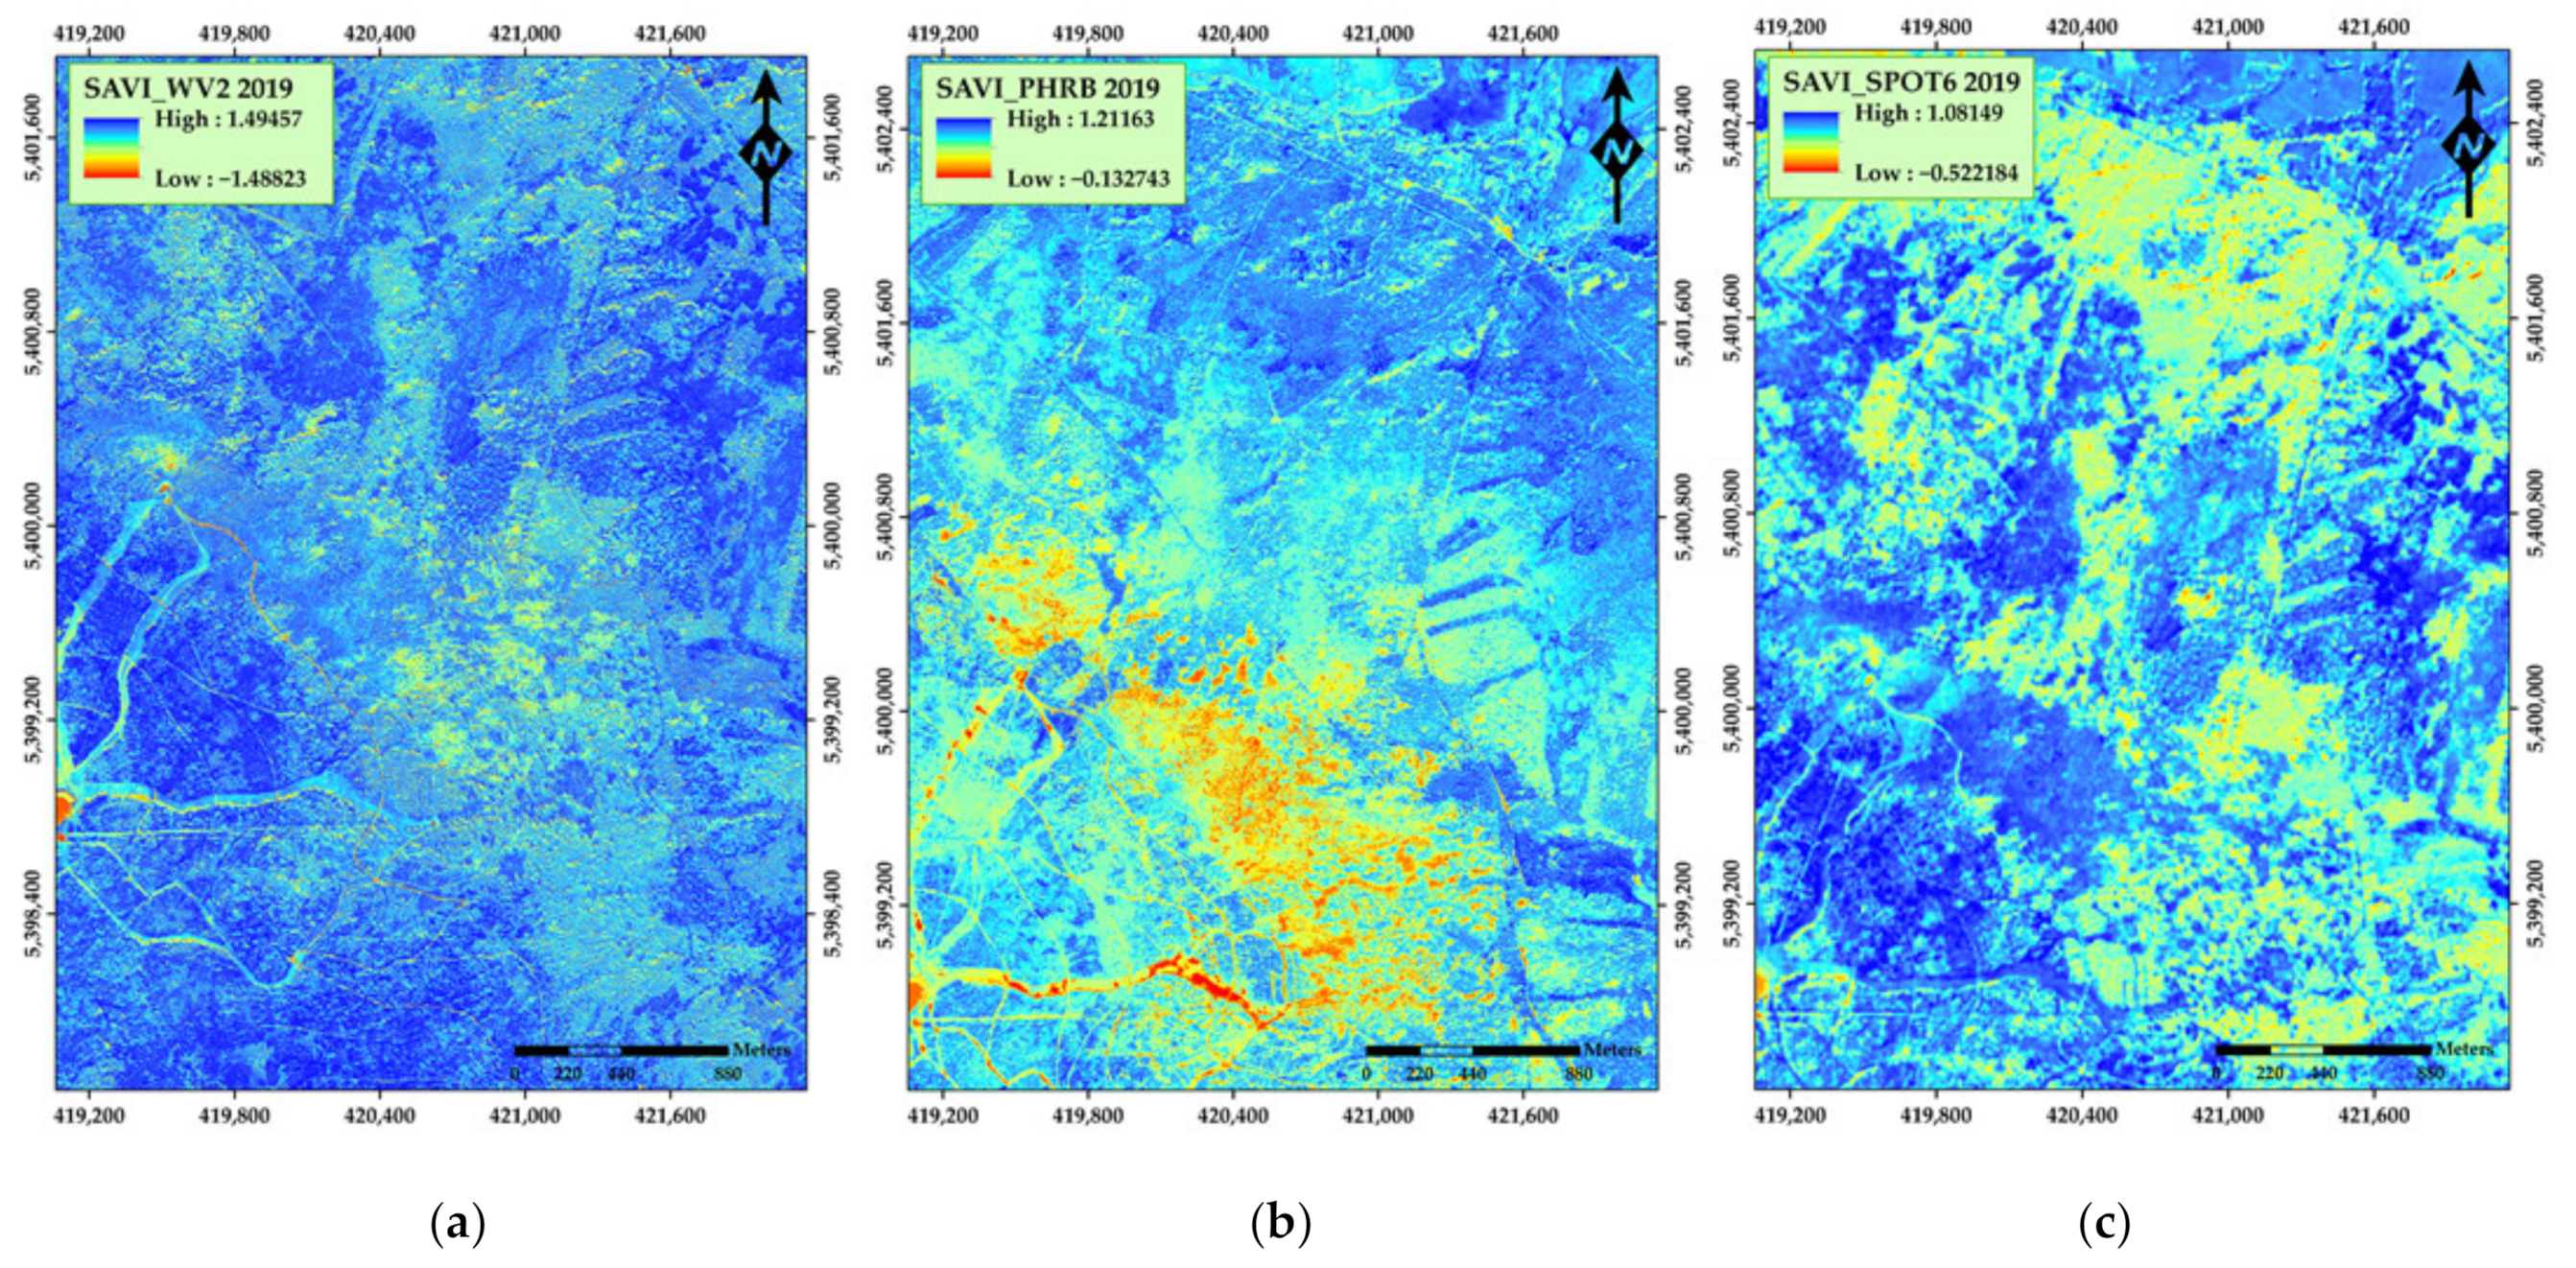
Figure A2. Application of the SAVI vegetation index (VI) in: (a) WorldView-2 2019; (b) Pléiades 1B 2019; (c) SPOT-6 2019.
Remotesensing 13 04953 g0a2
Figure A3. Application of the SAVI vegetation index (VI) in: (a) Pléiades 1B 2020; (b) SPOT-6 2020.
Remotesensing 13 04953 g0a3
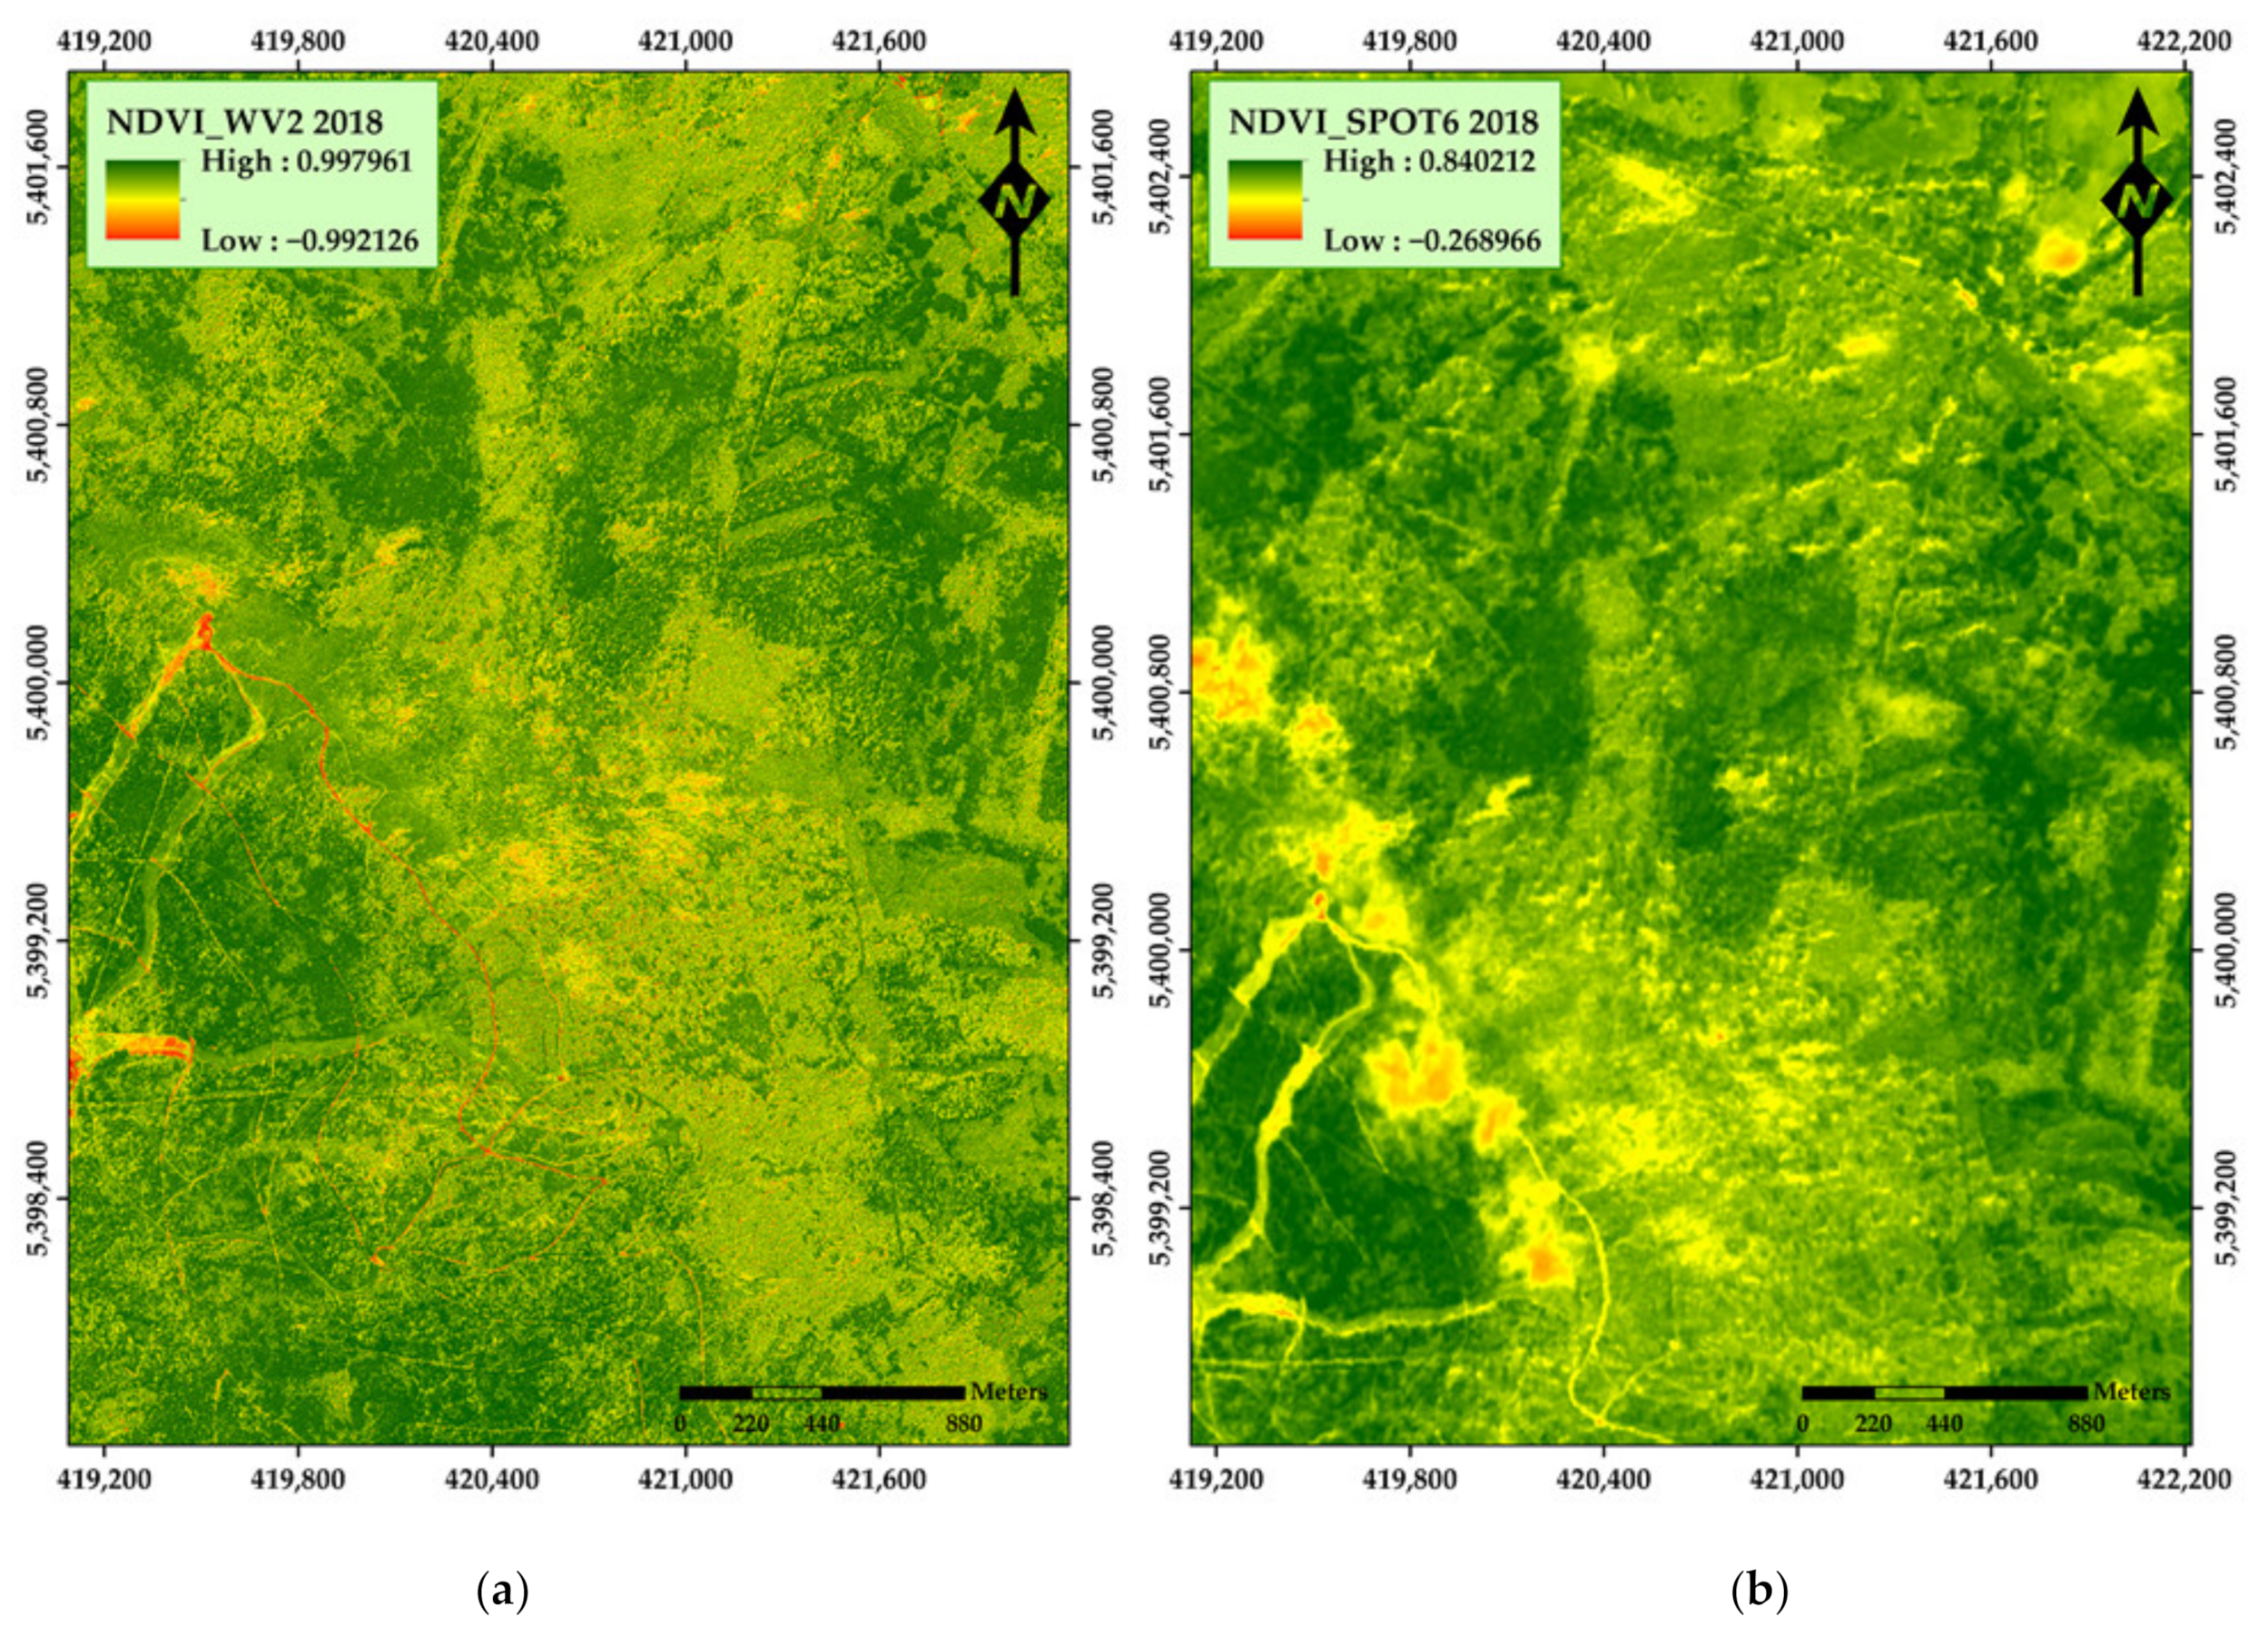
Figure A4. Application of the NDVI vegetation index (VI) in: (a) WorldView-2 2018; (b) SPOT-6 2018.
Remotesensing 13 04953 g0a4
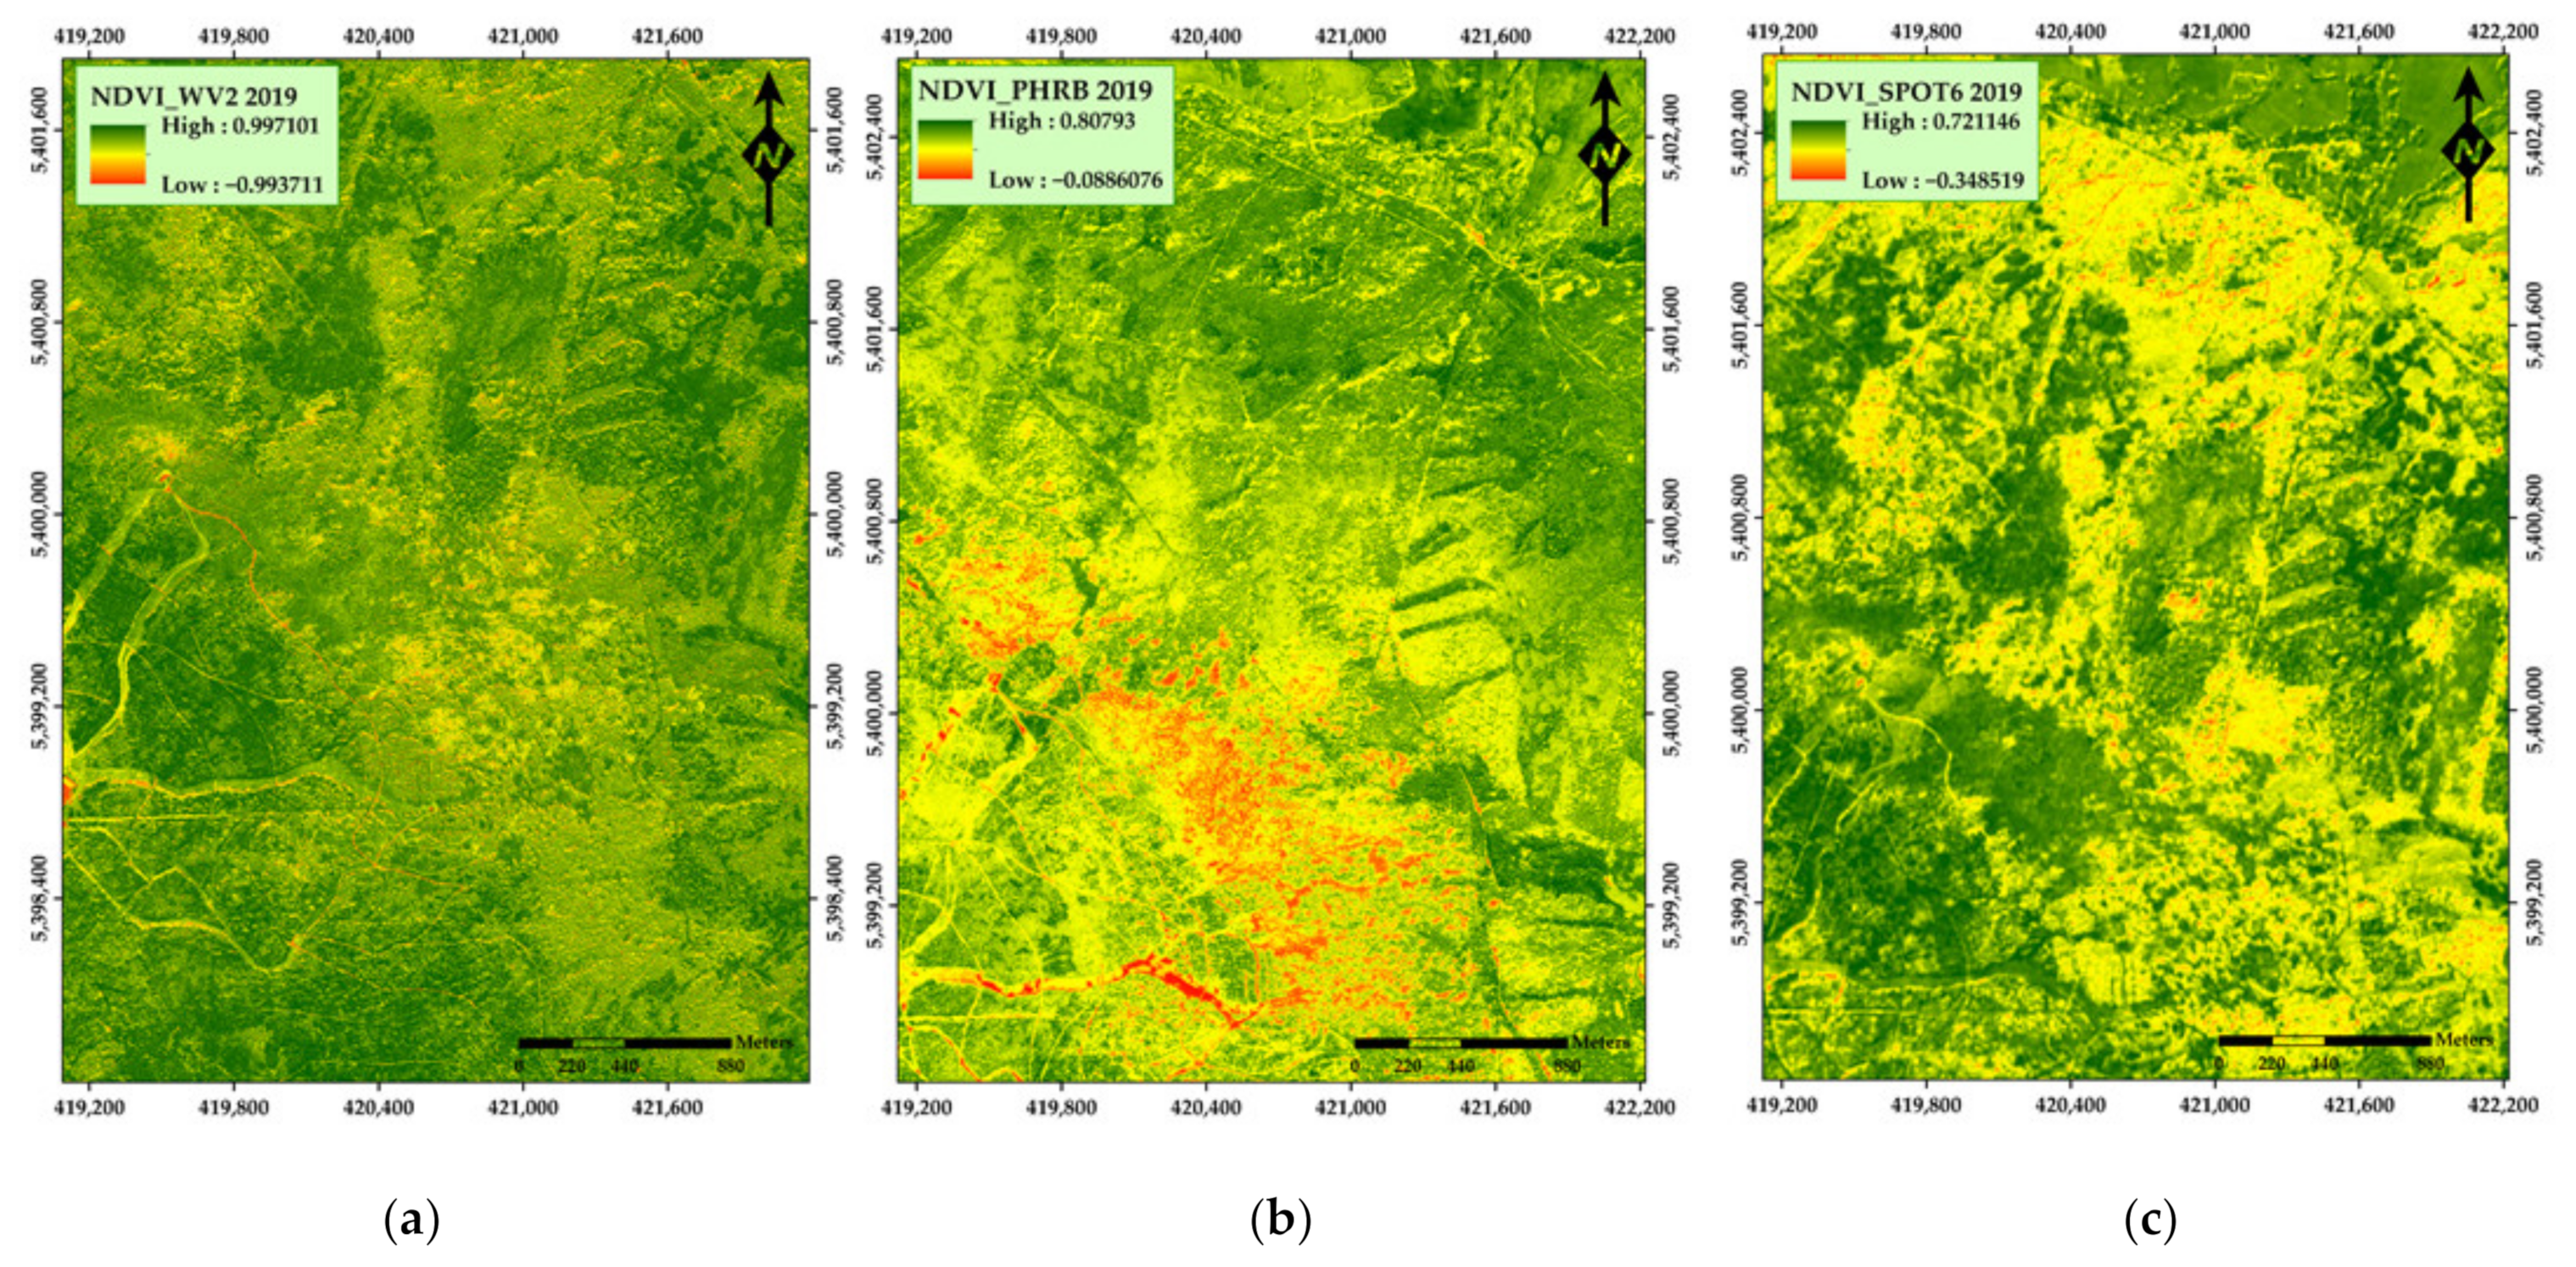
Figure A5. Application of the NDVI vegetation index (VI) in: (a) WorldView-2 2019; (b) Pléiades 1B 2019; (c) SPOT-6 2019.
Remotesensing 13 04953 g0a5
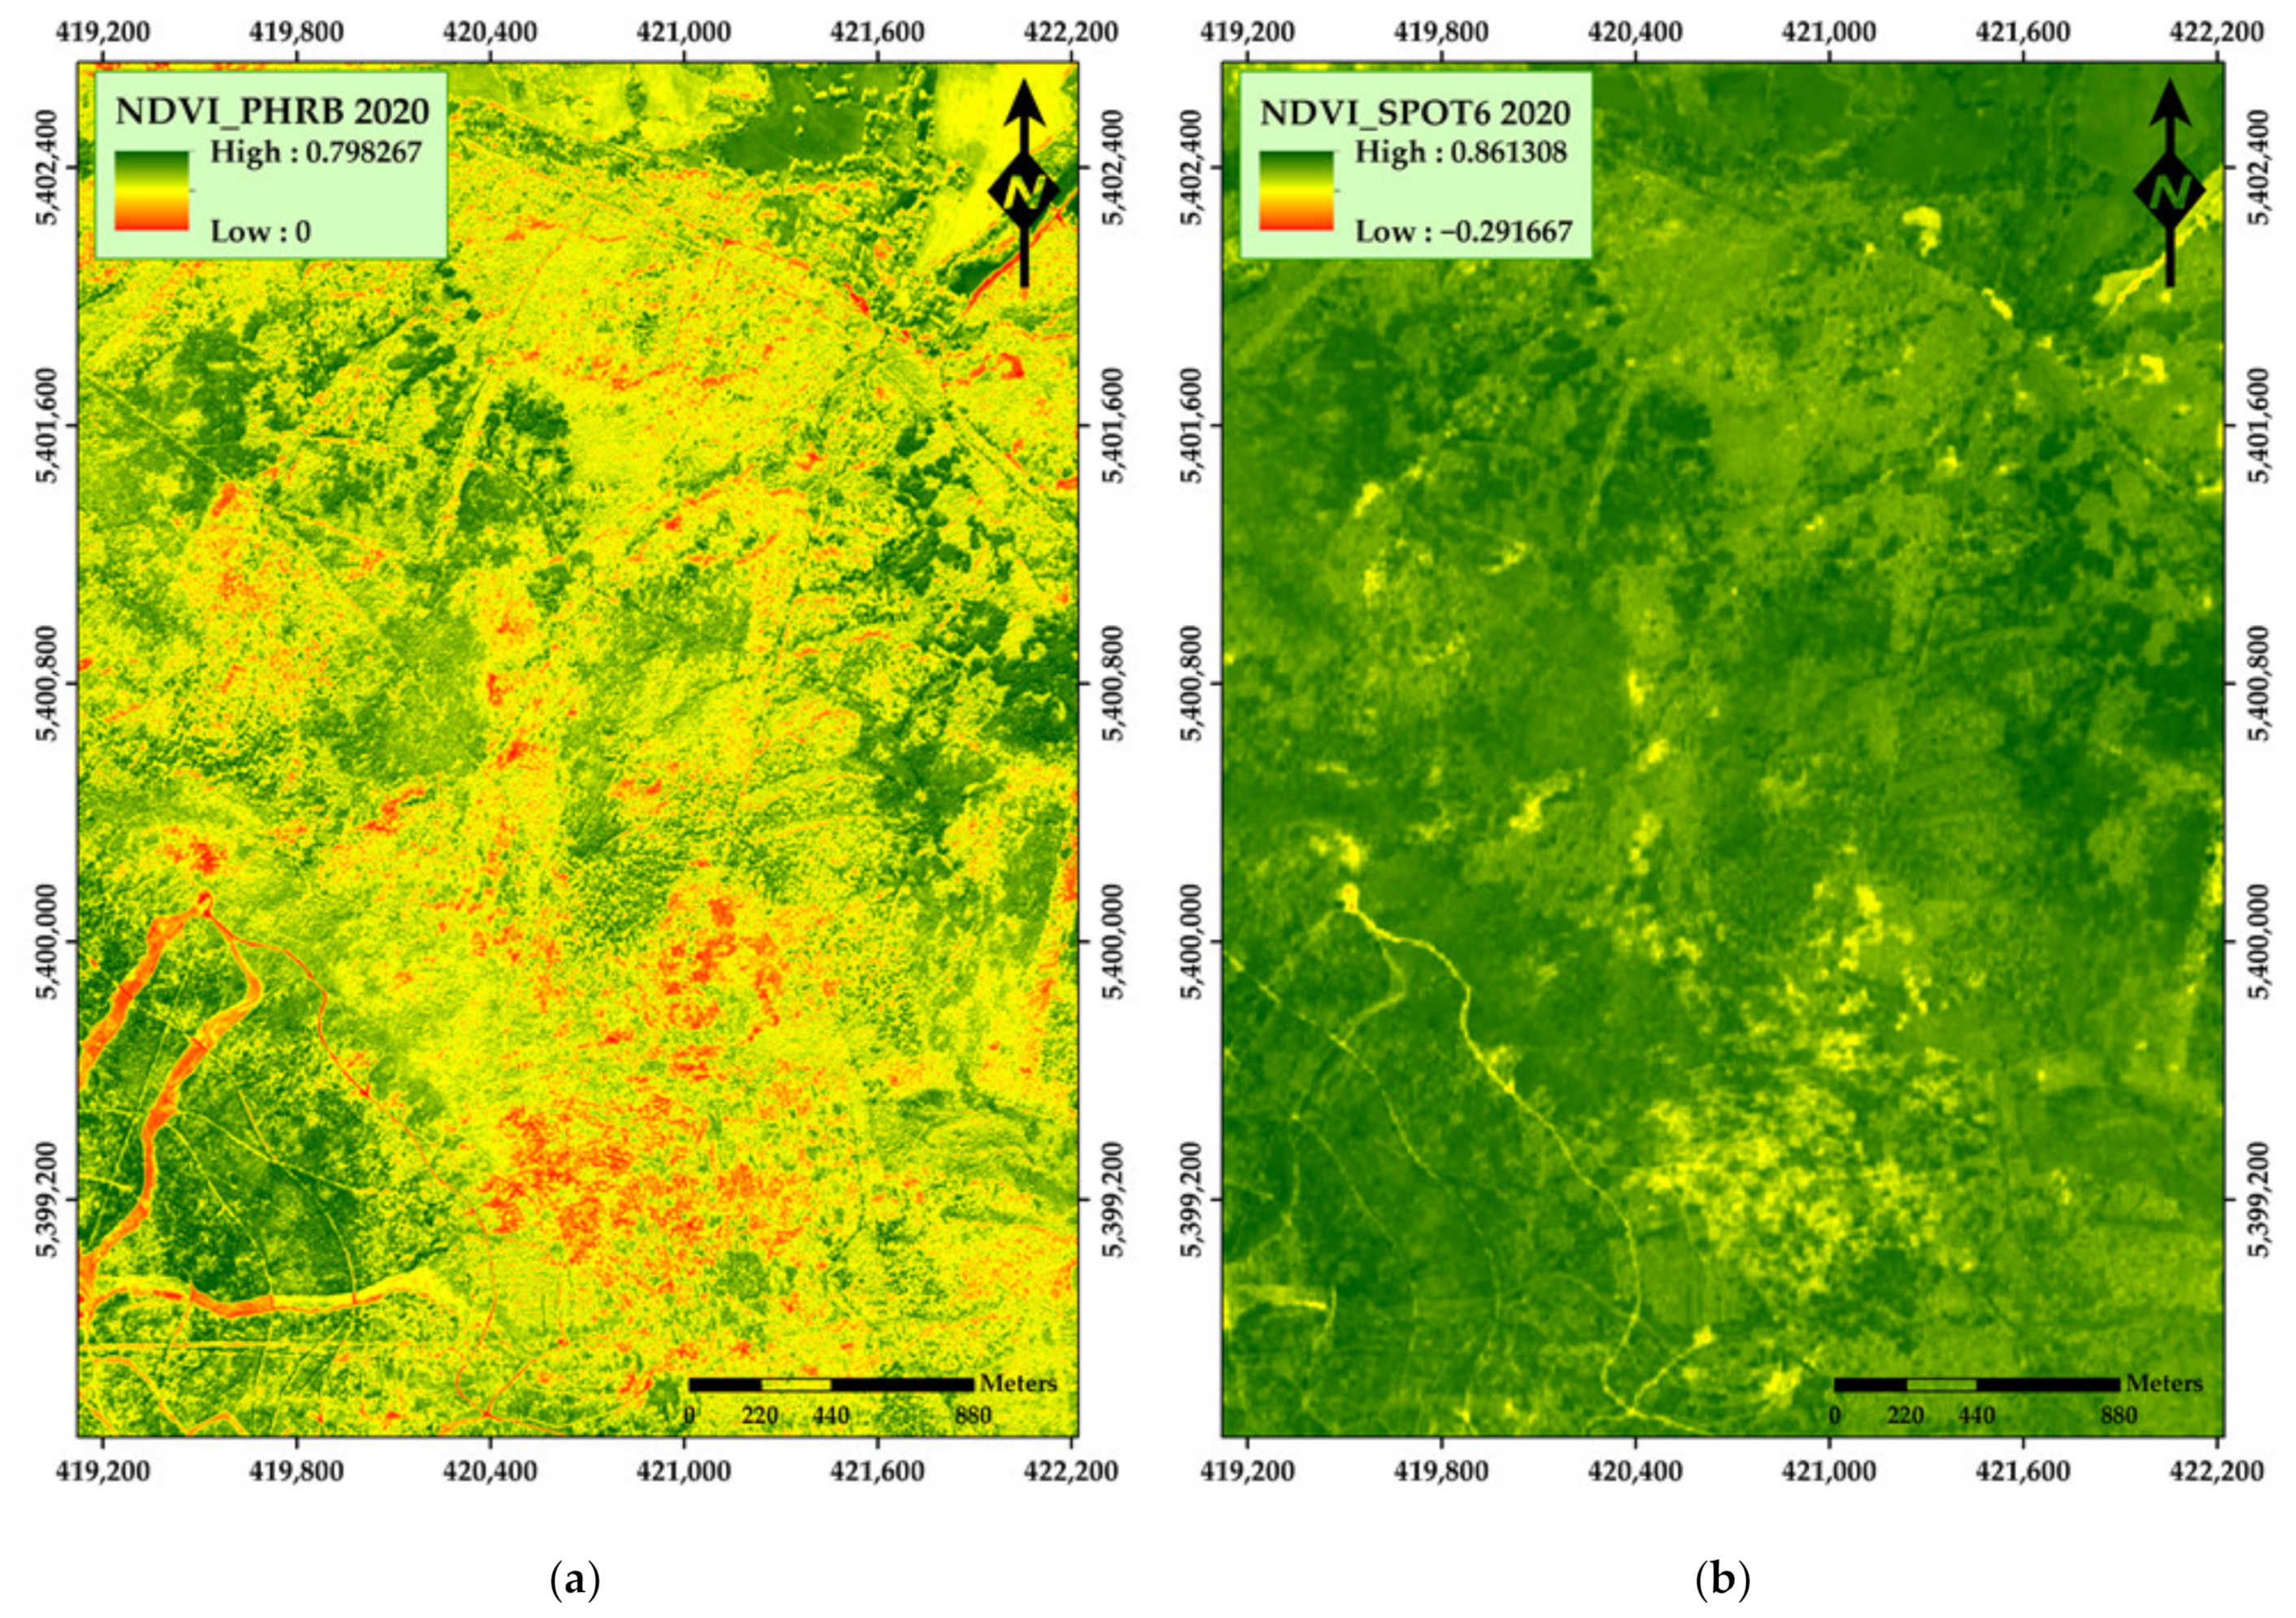
Figure A6. Application of the NDVI vegetation index (VI) in: (a) Pléiades 1B 2020; (b) SPOT-6 2020.
Remotesensing 13 04953 g0a6
Figure A7. Application of the SR vegetation index (VI) in: (a) WorldView-2 2018; (b) SPOT-6 2018.
Remotesensing 13 04953 g0a7
Figure A8. Application of the SR vegetation index (VI) in: (a) WorldView-2 2019; (b) Pléiades 1B 2019; (c) SPOT-6 2019.
Remotesensing 13 04953 g0a8
Figure A9. Application of the SR vegetation index (VI) in: (a) Pléiades 1B 2020; (b) SPOT-6 2020.
Remotesensing 13 04953 g0a9
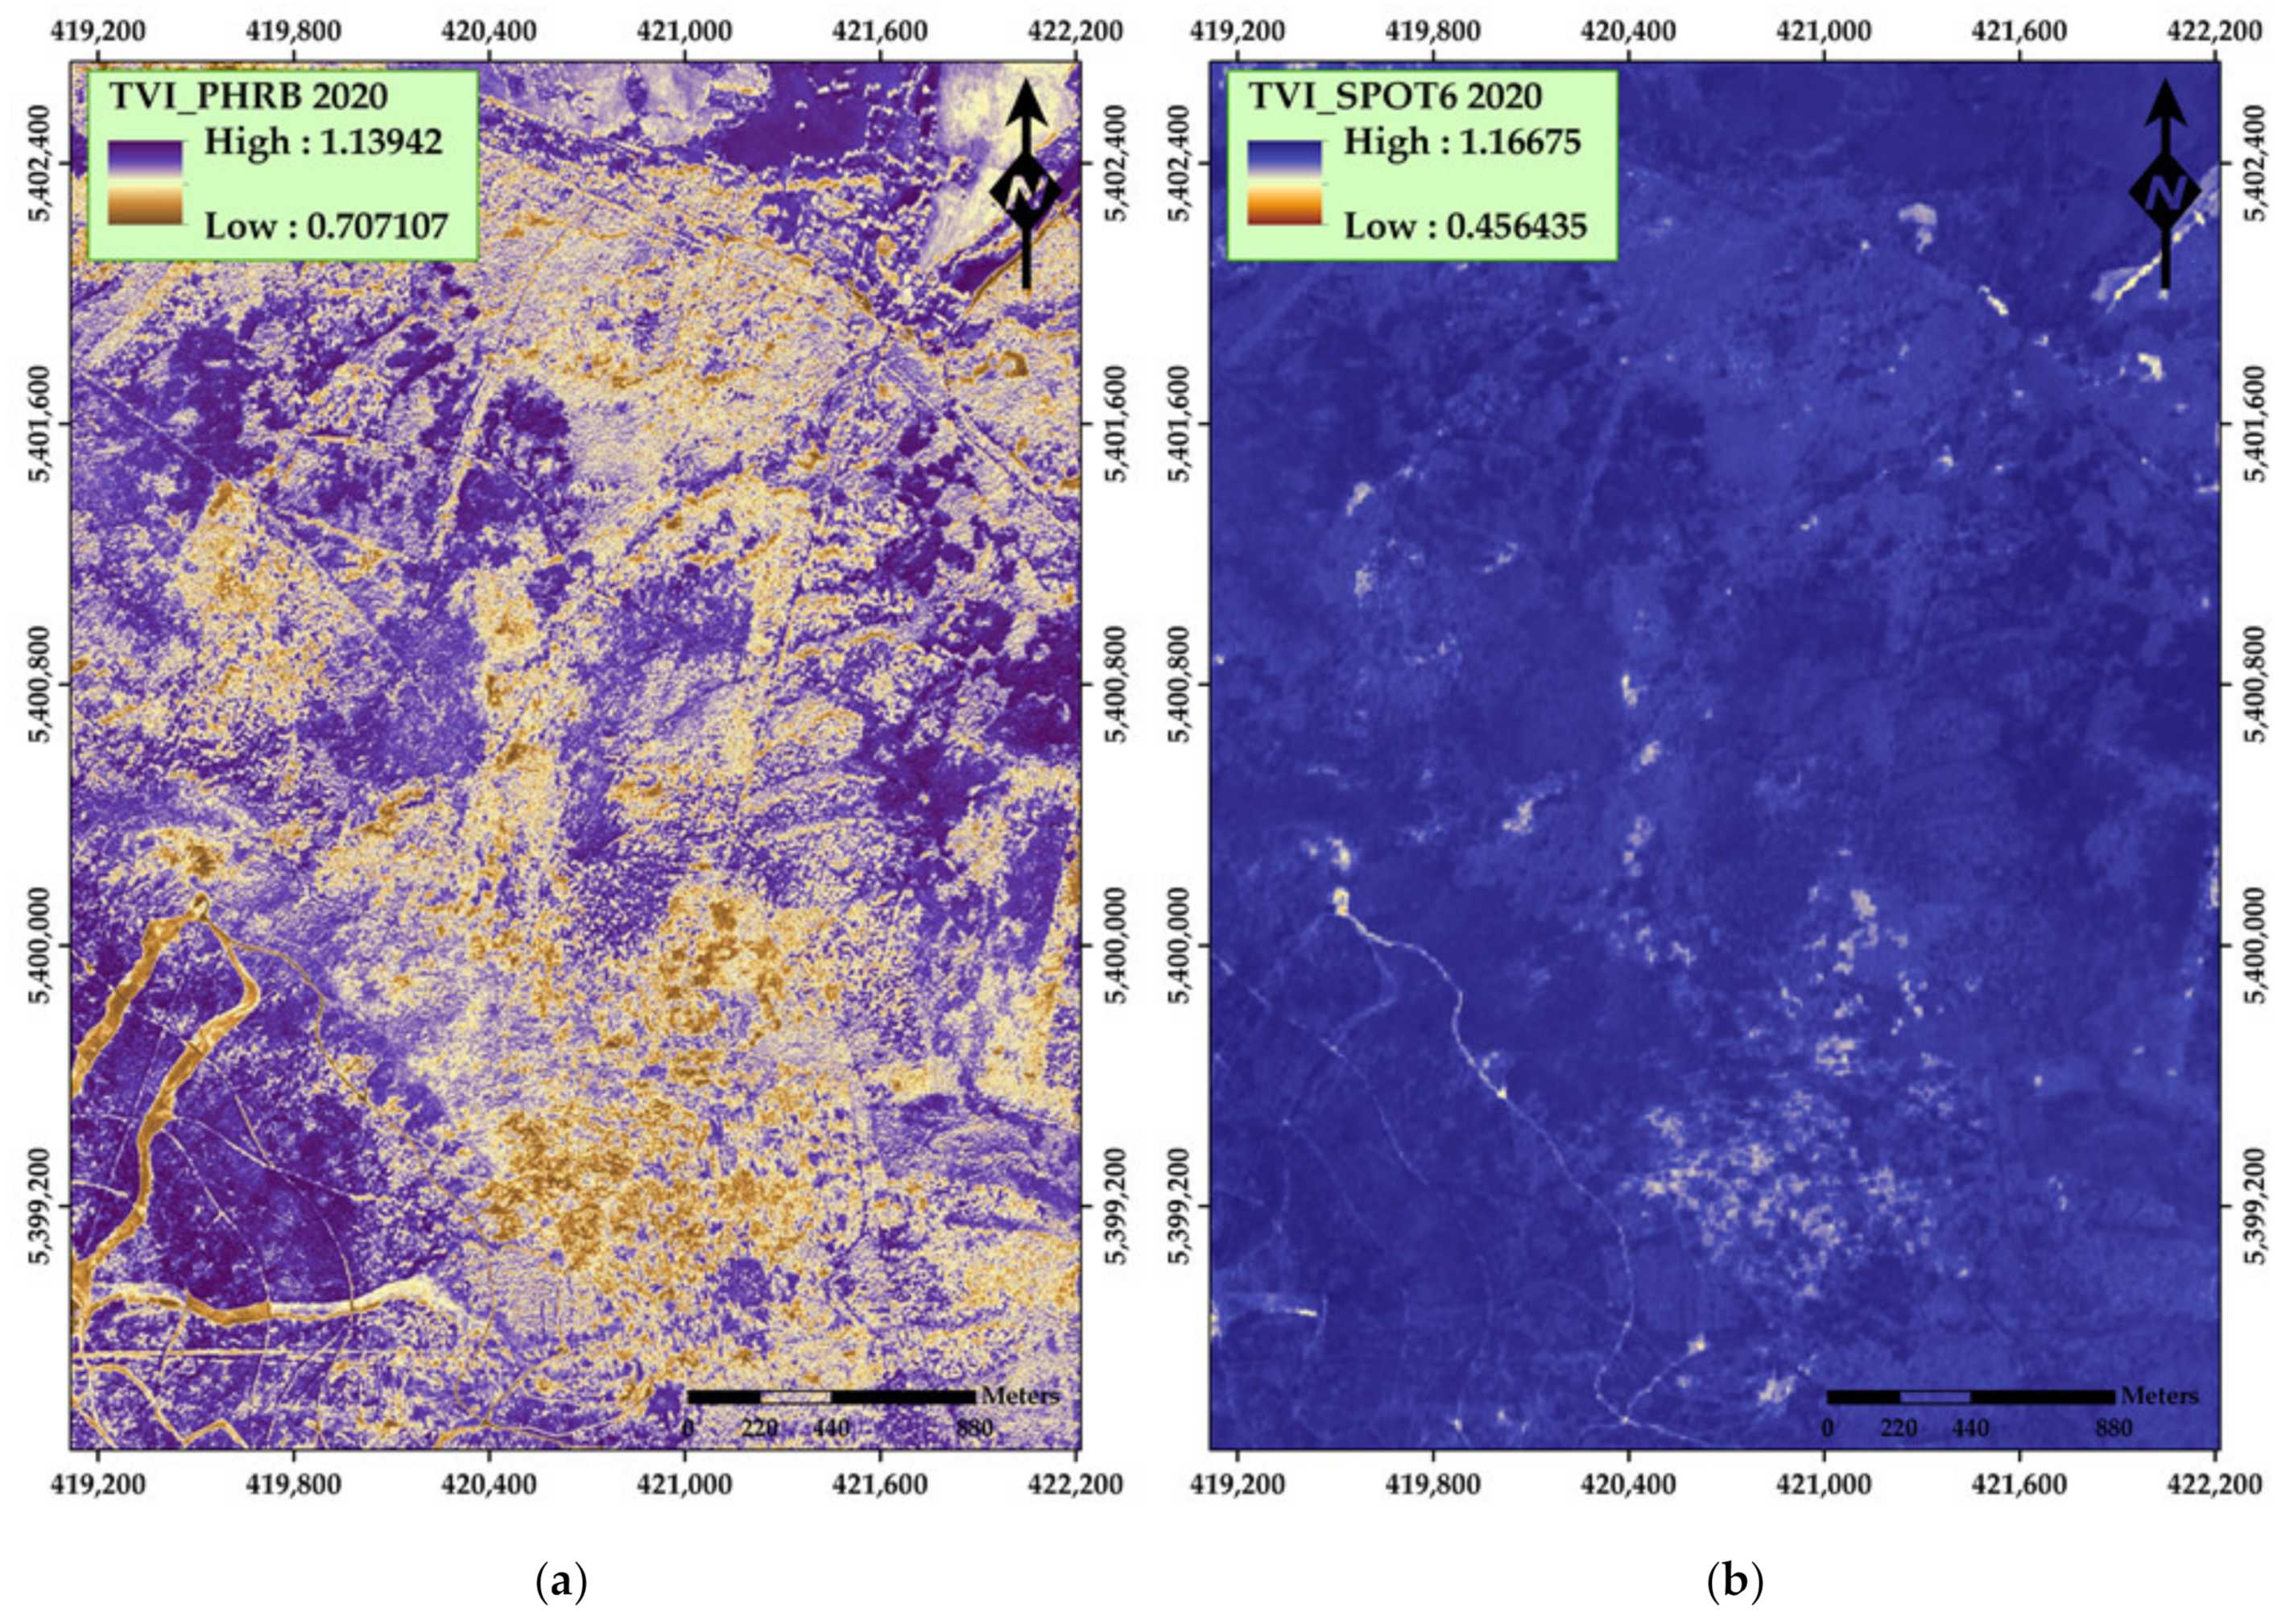
Figure A10. Application of the TVI vegetation index (VI) in: (a) WorldView-2 2018; (b) SPOT-6 2018.
Remotesensing 13 04953 g0a10
Figure A11. Application of the TVI vegetation index (VI) in: (a) WorldView-2 2019; (b) Pléiades 1B 2019; (c) SPOT-6 2019.
Remotesensing 13 04953 g0a11
Figure A12. Application of the TVI vegetation index (VI) in: (a) Pléiades 1B 2020; (b) SPOT-6 2020.
Remotesensing 13 04953 g0a12

Appendix B

Figure A13. Application of the MCARI vegetation index (VI) in: (a) WorldView-2 2018; (b) WorldView-2 2019.
Remotesensing 13 04953 g0a13
Figure A14. Application of the PSRI vegetation index (VI) in: (a) WorldView-2 2018; (b) WorldView-2 2018.
Remotesensing 13 04953 g0a14
Figure A15. Application of the NDRE vegetation index (VI) in: (a) WorldView-2 2018; (b) WorldView-2 2019.
Remotesensing 13 04953 g0a15

Appendix C

Figure A16. Application of the of the PCA transformation algorithm in: (a) WorldView-2 2018; (b) SPOT-6 2018.
Remotesensing 13 04953 g0a16
Figure A17. Application of the of the PCA transformation algorithm in: (a) WorldView-2 2019; (b) Pléiades 1B 2019; (c) SPOT-6 2019.
Remotesensing 13 04953 g0a17
Figure A18. Application of the of the PCA transformation algorithm in: (a) Pléiades 1B 2020; (b) SPOT-6 2020.
Remotesensing 13 04953 g0a18

Appendix D

Figure A19. Application of the of the tasseled cap transformation algorithm showing (a) brightness for 2018 and (b) brightness 2019, as derived from WorldView-2.
Remotesensing 13 04953 g0a19
Figure A20. Application of the of the tasseled cap transformation algorithm showing (a) brightness for 2019 and (b) brightness 2020, as derived from Pléiades 1B.
Remotesensing 13 04953 g0a20
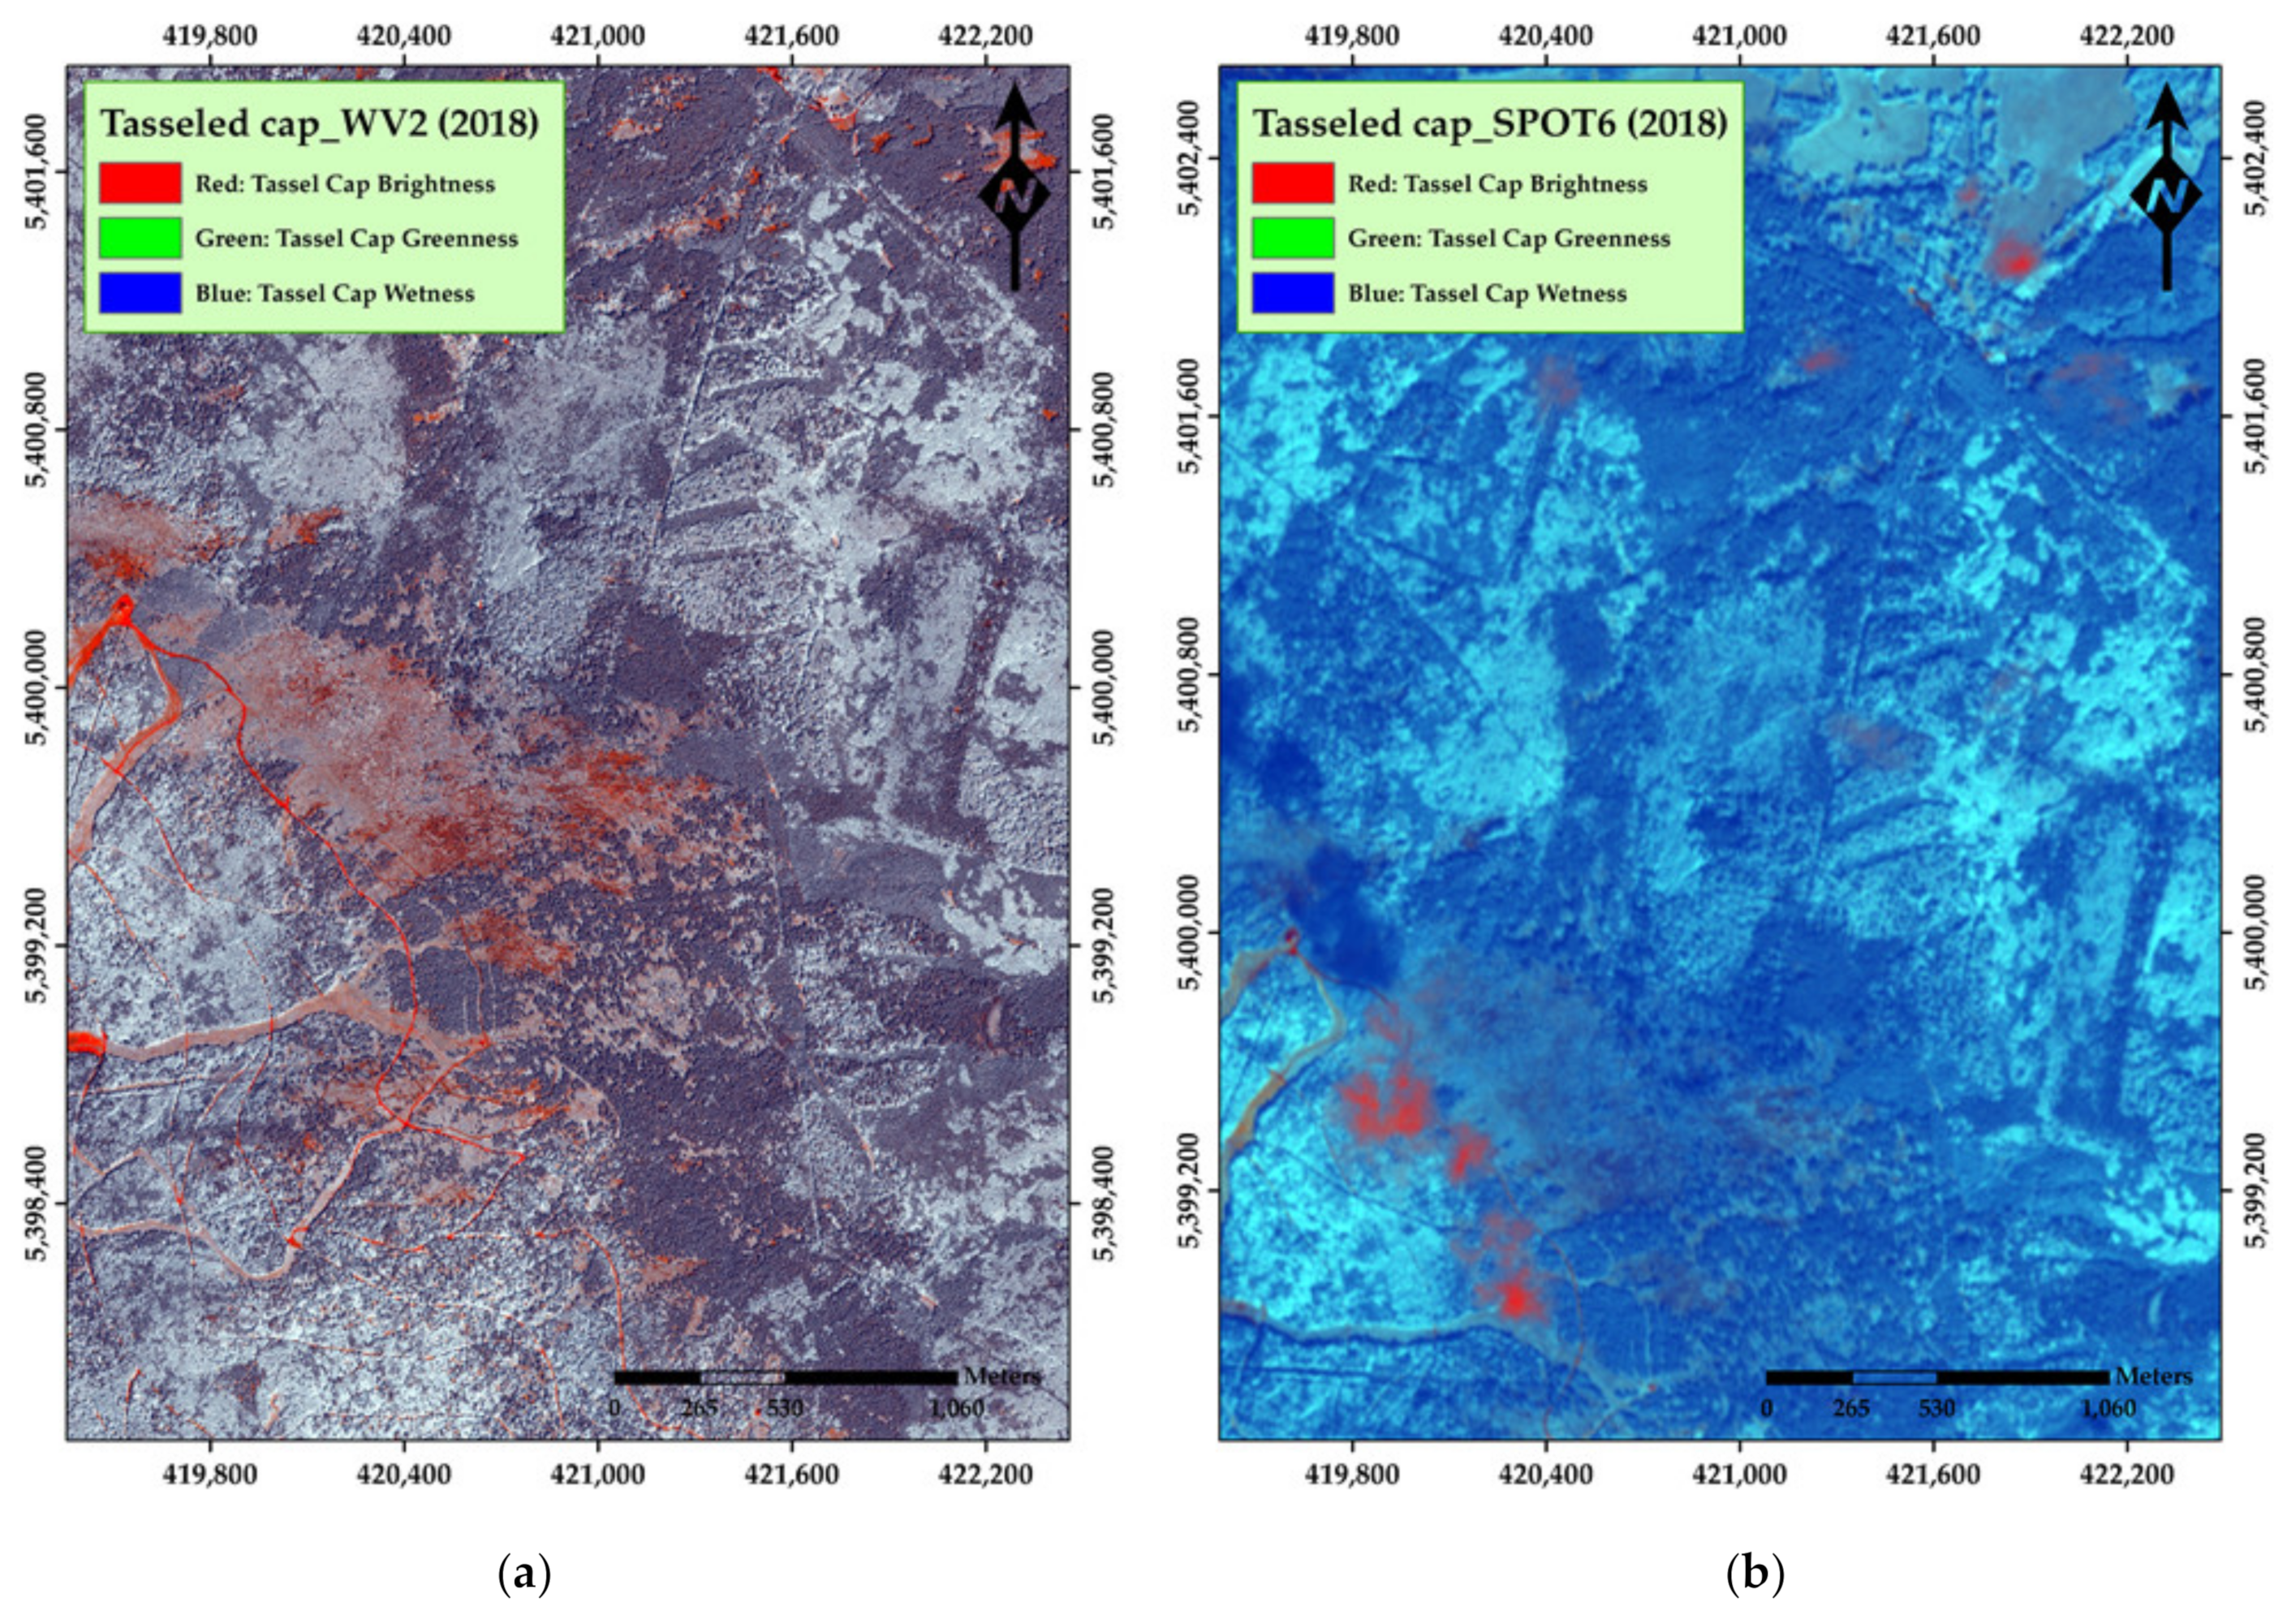
Figure A21. Example of the tasseled cap transformation algorithm on (a) WorldView-2 2018 and (b) SPOT-6 in 2018, using all three channels (brightness, greenness, and wetness).
Remotesensing 13 04953 g0a21
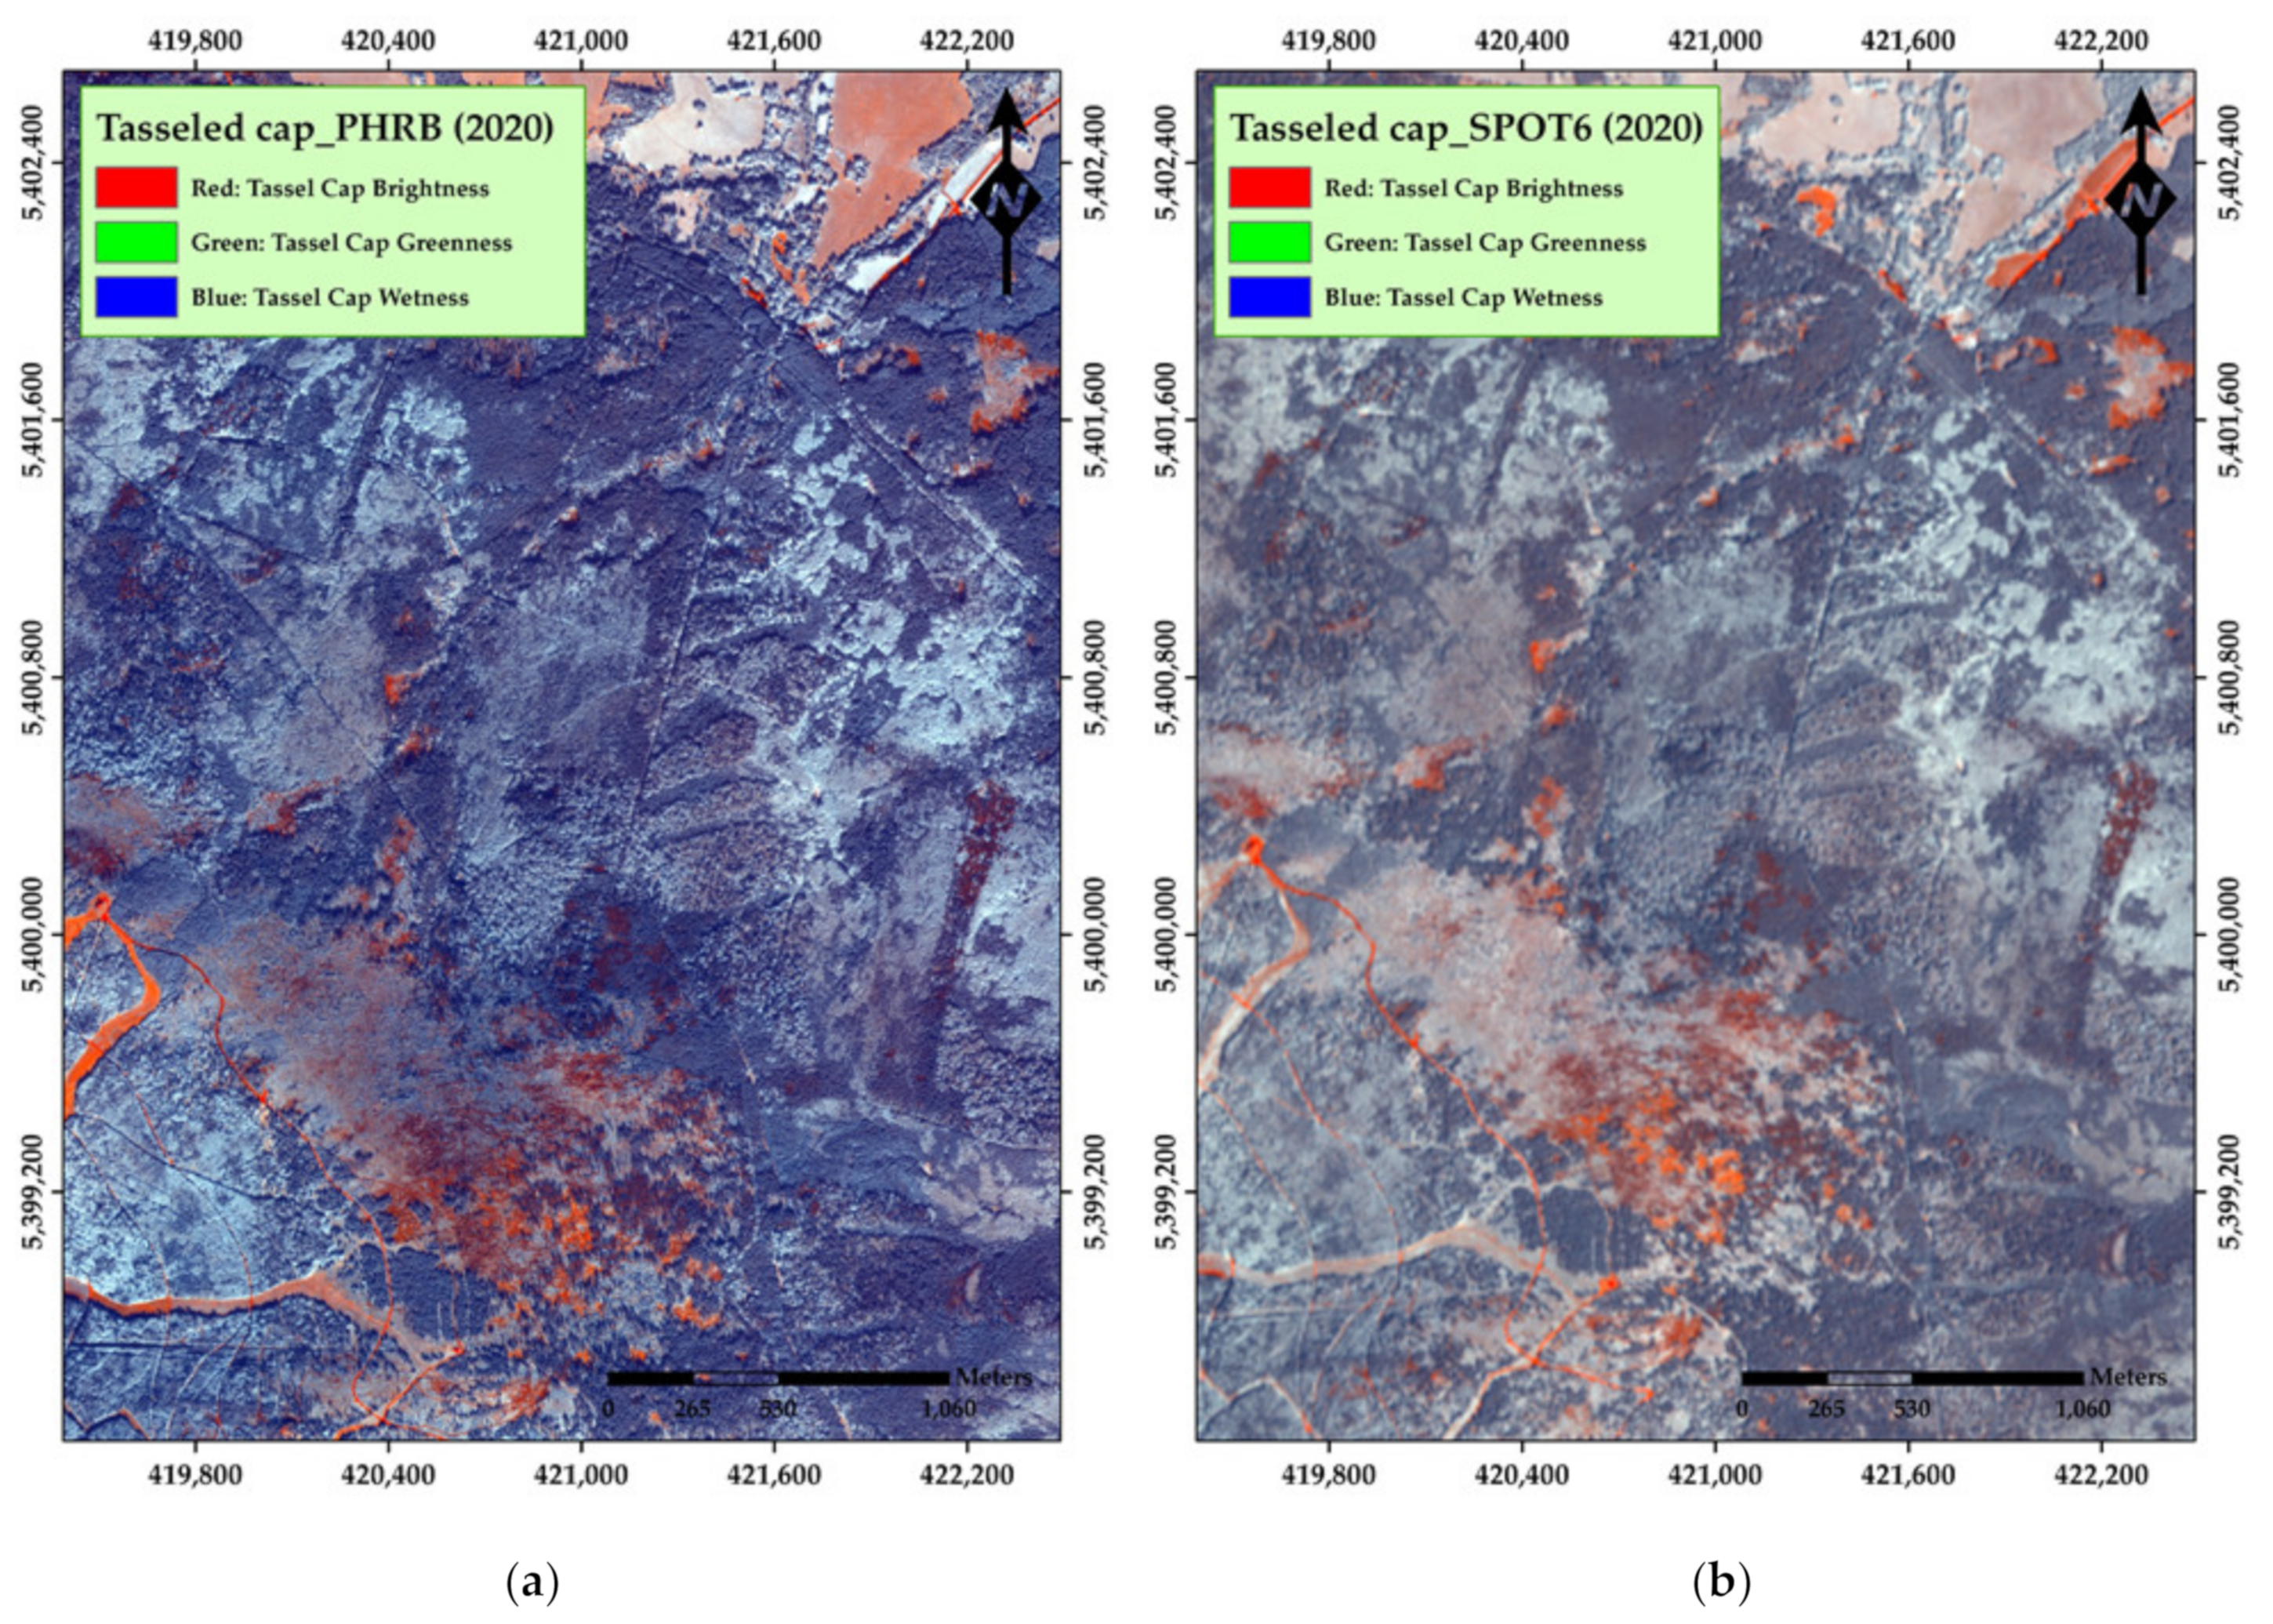
Figure A22. Example of the tasseled cap transformation algorithm on (a) Pléiades 1B 2020 and (b) SPOT-6 in 2020, using all three channels (brightness, greenness, and wetness).
Remotesensing 13 04953 g0a22

References

  1. Hlásny, T.; König, L.; Krokene, P.; Lindner, M.; Montagné-Huck, C.; Müller, J.; Qin, H.; Raffa, J.F.; Schelhaas, M.; Svoboda, M.; et al. Bark Beetle Outbreaks in Europe: State of Knowledge and Ways Forward for Management. Curr. For. Rep. 2021, 7, 138–165. [Google Scholar] [CrossRef]
  2. Grodzki, W. Mass outbreaks of the spruce bark beetle Ips typographus in the context of the controversies around the Białowieża Primeval Forest. For. Res. Pap. 2016, 77, 324–331. [Google Scholar] [CrossRef] [Green Version]
  3. Forest Management Institute of the Czech Republic. Information on the State of Forests from the Comprehensive Forest Management Plans for 2019. Available online: http://www.uhul.cz/ke-stazeni/informace-o-lese/slhp (accessed on 26 October 2020).
  4. Gardiner, B. Wind damage to forests and trees: A review with an emphasis on planted and managed forests. J. For. Res. 2021, 26, 248–266. [Google Scholar] [CrossRef]
  5. Bentz, B.J.; Jönsson, A.M.; Schroeder, M.; Weed, A.; Wilcke, R.A.I.; Larsson, K. Ips typographus and Dendroctonus ponderosae Models Project Thermal Suitability for Intra- and Inter-Continental Establishment in a Changing Climate. Front. For. Glob. Chang. 2019, 2, 1–17. [Google Scholar] [CrossRef]
  6. Marini, L.; Økland, B.; Jönsson, A.M.; Bentz, B.; Carroll, A.; Forster, B.; Grégoire, J.-C.; Hurling, R.; Nageleisen, L.M.; Netherer, S.; et al. Climate drivers of bark beetle outbreak dynamics in Norway spruce forests. Ecography 2017, 40, 1426–1435. [Google Scholar] [CrossRef]
  7. Brázdil, R.; Stucki, P.; Szabó, P.; Řezníčková, L.; Dolák, L.; Dobrovolný, P.; Tolasz, R.; Kotyza, O.; Chromá, K.; Suchánková, S. Windstorms and Forest Disturbances in the Czech Lands: 1801–2015. Agric. For. Meteorol. 2018, 250, 47–63. [Google Scholar] [CrossRef]
  8. Jakoby, O.; Lischke, H.; Wermelinger, B. Climate change alters elevational phenology patterns of the European spruce bark beetle (Ips typographus). Glob. Change Biol. 2019, 25, 4048–4063. [Google Scholar] [CrossRef]
  9. Modlinger, R.; Novotný, P. Quantification of time delay between damages caused by windstorms and by Ips typographus. For. J. 2015, 61, 221–231. [Google Scholar] [CrossRef] [Green Version]
  10. Hlásny, Τ.; Zimová, S.; Merganičová, K.; Štěpánek, P.; Modlinger, R.; Turčáni, M. Devastating outbreak of bark beeltes in the Czech Republic: Drivers, impacts and management implications. For. Ecol. Manag. 2021, 490, 119075. [Google Scholar] [CrossRef]
  11. Hlásny, T.; Merganičová, K.; Modlinger, R.; Marušák, R.; Löwe, R.; Turčáni, M. Prognosis of bark beetle outbreak and a new platform for the dissemination of information about the forests in the Czech republic. Rep. For. Res. 2021, 66, 197–205. [Google Scholar]
  12. Lausch, A.; Heurich, M.; Fahse, L. Spatio-Temporal Infestation Patterns of Ips Typographus (L.) in the Bavarian Forest National Park, Germany. Ecol. Indic. 2013, 31, 73–81. [Google Scholar] [CrossRef]
  13. Götz, L.; Psomas, A.; Bugmann, H. Early detection of bark beetle infestations by remote sensing: What is feasible today? Schweiz. Z. Forstwes. 2020, 171, 36–43. [Google Scholar] [CrossRef]
  14. Hall, R.J.; Castilla, G.; White, J.C.; Cooke, B.J.; Skakun, R.S. Remote sensing of forest pest damage: A review and lessons learned from a Canadian perspective. Can. Entomol. 2016, 148, S296–S356. [Google Scholar] [CrossRef]
  15. Hollaus, M.; Vreugdenhil, M. Radar Satellite Imagery for Detecting Bark Beetle Outbreaks in Forests. Curr. For. Rep. 2019, 5, 240–250. [Google Scholar] [CrossRef] [Green Version]
  16. Senf, C.; Seidl, R.; Hostert, P. Remote Sensing of Forest Insect Disturbances: Current State and Future Directions. Int. J. Appl. Earth Obs. Geoinf. 2017, 60, 49–60. [Google Scholar] [CrossRef] [Green Version]
  17. Lausch, A.; Erasmi, S.; King, D.J.; Magdon, P.; Heurich, M. Understanding forest health with remote sensing—Part I—A review of spectral traits, processes and remote-sensing characteristics. Remote Sens. 2016, 8, 1029. [Google Scholar] [CrossRef] [Green Version]
  18. Masek, J.G.; Hayes, D.J.; Hughes, J.M.; Healey, S.P.; Turner, D.P. The role of remote sensing in process-scaling studies of managed forest ecosystems. For. Ecol. Manag. 2015, 355, 109–123. [Google Scholar] [CrossRef] [Green Version]
  19. Abdollahnejad, A.; Panagiotidis, D.; Bílek, L. An Integrated GIS and Remote Sensing Approach for Monitoring Harvested Areas from Very High-Resolution, Low-Cost Satellite Images. Remote Sens. 2019, 11, 2539. [Google Scholar] [CrossRef] [Green Version]
  20. Abdollahnejad, A.; Panagiotidis, D.; Surový, P. Estimation and Extrapolation of Tree Parameters Using Spectral Correlation between UAV and Pléiades Data. Forests 2018, 9, 85. [Google Scholar] [CrossRef] [Green Version]
  21. Wagner, F.H.; Ferreira, M.P.; Sanchez, A.; Hirye, M.C.M.; Gloor, M.Z.E.; Philips, O.L.; de Souza Filho, C.R.; Shimabukuro, Y.E.; Aragao, L.E.O.C. Individual tree crown delineation in a highly diverse tropical forest using very high-resolution satellite images. ISPRS J. Photogramm. Remote Sens. 2018, 145, 362–377. [Google Scholar] [CrossRef]
  22. Eitel, J.U.H.; Vierling, L.A.; Litvak, M.E.; Long, D.S.; Schulthess, U.; Ager, A.A.; Krofcheck, D.J.; Stosheck, L. Broadband, red-edge information from satellites improves early stress detection in a New Mexico conifer woodland. Remote Sens. Environ. 2001, 115, 3640–3646. [Google Scholar] [CrossRef]
  23. Fassnacht, F.E.; Latifi, H.; Ghosh, A.; Joshi, P.K.; Koch, B. Assessing the potential of hyperspectral imagery to map bark beetle-induced tree mortality. Remote Sens. Environ. 2014, 140, 533–548. [Google Scholar] [CrossRef]
  24. Adamczyk, J.; Osberger, A. Red-edge vegetation indices for detecting and assessing disturbances in Norway spruce dominated mountain forests. Int. J. Appl. Earth Obs. Geoinf. 2015, 37, 90–99. [Google Scholar] [CrossRef]
  25. Immitzer, M.; Atzberger, C. Early Detection of Bark Beetle Infestation in Norway Spruce (Picea abies, L.) using WorldView-2 Data. Photogramm. Fernerkund. Geoinf. 2014, 5, 0351–0367. [Google Scholar] [CrossRef]
  26. Mullen, K.E. Early Detection of Mountain Pine Beetle Damage in Ponderosa Pine Forests of the Black Hills Using Hyperspectral and WorldView-2 Data. Master’s Thesis, Minnesota State University, Mankato, MN, USA, 2016. [Google Scholar]
  27. Filchev, L. An assessment of European spruce bark beetle infestation using WorldView-2 Satellite data. In Proceedings of the 1st European SCGIS Conference with International Participation―Best Practices: Application of GIS Technologies for Conservation of Natural and Cultural Heritage Sites, Sofia, Bulgaria, 21–23 May 2012; SRTI-Bulgarian Academy of Science (BAS) and SCGIS: Sofia, Bulgaria, 2010. [Google Scholar]
  28. Huo, L.; Persson, H.J.; Lindberg, E. Early detection of forest stress from European spruce bark beetle attack, and a new vegetation index: Normalized distance red & SWRIR (NDRS). Remote Sens. Environ. 2021, 255, 112240. [Google Scholar]
  29. Lukeš, P.; Strejček, R.; Křístek, Š.; Mlčoušek, M. Forest Health Assessment in Czech Republic Using Sentinel-2 Satellite Data. Certified Methodology; Forest Management Institute: Brandýs nad Labem, Czech Republic, 2018; ISBN 978-80-88184-21-8. [Google Scholar]
  30. Barka, I.; Lukeš, P.; Bucha, T.; Hlásny, T.; Strejček, R.; Mlčoušek, M.; Křístek, Š. Remote sensing-based forest health monitoring systems—Case studies from Czechia and Slovakia. Cent. Eur. For. J. 2018, 64, 259–275. [Google Scholar]
  31. Albrecht, J. Českobudějovicko. In Chráněná Území ČR, Svazek VIII.; Mackovčin, P., Sedláček, M., Eds.; AOPK ČR a EkoCentrum: Brno, Praha, Czech Republic, 2003; p. 808. [Google Scholar]
  32. Hotelling, H. Analysis of a complex of statistical variables into principal components. J. Educ. Psychol. 1933, 24, 498–520. [Google Scholar] [CrossRef]
  33. Crist, E.P.; Cicone, R.C. Application of the tasseled cap concept to simulated thematic mapper data. Photogramm. Eng. Remote Sens. 1984, 50, 343–352. [Google Scholar]
  34. Crist, E.P.; Cicone, R.C. A physically-based transformation of thematic mapper data—The TM tasseled cap. IEEE Trans. Geosci. Remote Sens. 1984, GE-22, 256–263. [Google Scholar] [CrossRef]
  35. Horne, J.H. A tasseled cap transformation for Ikonos images. In Proceedings of the ASPRS 2003 Annual Conference Proceedings, Anchorage, AK, USA, 3–9 May 2003; pp. 1–7. [Google Scholar]
  36. Huang, C.; Wylie, B.; Yang, L.; Homer, C.; Zylstra, G. Derivation of a tasseled cap transformation based on Landsat 7 at-satellite reflectance. Int. J. Remote Sens. 2002, 23, 1741–1748. [Google Scholar] [CrossRef]
  37. Ivits, E.; Lamb, A.; Langar, F.; Hemphill, S.; Koch, B. Orthogonal transformation of segmented SPOT5 images. Photogramm. Eng. Remote Sens. 2008, 74, 1351–1364. [Google Scholar] [CrossRef]
  38. Huete, A. A soil-adjusted vegetation index (SAVI). Remote Sens. Environ. 1988, 25, 295–309. [Google Scholar] [CrossRef]
  39. Rouse, J.; Haas, J.W.J.; Schell, R.H.; Deering, J.A. Monitoring vegetation systems in the great plains with ERTS. In Proceedings of the Third ERTS Symposium (NASA SP-351), Washington, DC, USA, 1 January 1974; pp. 309–317. [Google Scholar]
  40. Birth, G.S.; McVey, G.R. Measuring the Color of Growing Turf with a Reflectance Spectrophotometer 1. Agron. J. 1968, 60, 640–643. [Google Scholar] [CrossRef]
  41. Deering, D.W.; Rouse, J.W.; Haas, R.H.; Schell, J.A. Measuring Forage Production of Grazing Units from Landsat MSS Data. In Proceedings of the 10th International Symposium on Remote Sensing of Environment, Ann Arbor, MI, USA, 6–10 October 1975; pp. 1169–1178. [Google Scholar]
  42. Daughtry, C.S.T. Estimating Corn Leaf Chlorophyll Concentration from Leaf and Canopy Reflectance. Remote Sens. Environ. 2000, 74, 229–239. [Google Scholar] [CrossRef]
  43. Ren, S.; Chen, X.; An, S. Assessing plant senescence reflectance index-retrieved vegetation phenology and its spatiotemporal response to climate change in the Inner Mongolian Grassland. Int. J. Biometeorol. 2016, 61, 601–612. [Google Scholar] [CrossRef] [PubMed]
  44. Clarke, T.; Moran, M.; Barnes, E.; Pinter, P.; Qi, J. Planar domain indices: A method for measuring a quality of a single component in two-component pixels. In Proceedings of the IGARSS 2001. Scanning the Present and Resolving the Future. In Proceedings of the IEEE 2001 International Geoscience and Remote Sensing Symposium (Cat. No.01CH37217), Sydney, NSW, Australia, 9–13 July 2001; pp. 1279–1281. [Google Scholar]
  45. Abdollahnejad, A.; Panagiotidis, D. Tree Species Classification and Health Status Assessment for a Mixed Broadleaf-Conifer Forest with UAS Multispectral Imaging. Remote Sens. 2020, 12, 3722. [Google Scholar] [CrossRef]
  46. Matsuki, T.; Yokoya, N.; Iwasaki, A. Hyperspectral Tree Species Classification of Japanese Complex Mixed Forest with the Aid of Lidar Data. IEEE J. Sel. Top. Appl. Earth Obs. Remote Sens. 2015, 8, 2177–2187. [Google Scholar] [CrossRef]
  47. Gilewski, M. The role of light in the plants world. Photonics Lett. Pol. 2019, 11, 115–117. [Google Scholar] [CrossRef]
  48. Huggett, B.A.; Savage, J.A.; Hao, G.-Y.; Preisser, E.L.; Holbrook, N.M. Impact of hemlock woolly adelgid (Adelges tsugae) infestation on xylem structure and function and leaf physiology in eastern hemlock (Tsuga canadensis). Funct. Plant Biol. 2017, 45, 501–508. [Google Scholar] [CrossRef]
  49. Ford, M.C.; Zietlow, D.R.; Brantley, S.T.; Brown, C.L.; Albert, M.E., III.; Jetton, R.M.; Rhea, J.R.; Arnold, P. Physiological responses of eastern hemlock (Tsuga canadensis) to light, adelgid infestation, and biological control: Implications for hemlock restoration. For. Ecol. Manag. 2020, 460, 117903. [Google Scholar]
  50. Jones, H.G.; Vaughan, R.A. Remote Sensing of Vegetation: Principles, Techniques, and Applications; Oxford University Press: Oxford, UK, 2010; Volume 68. [Google Scholar]
  51. Ollinger, S.V. Sources of variability in canopy reflectance and the convergent properties of plants. New Phytol. 2010, 189, 375–394. [Google Scholar] [CrossRef]
  52. Lillesand, T.; Kiefer, R.W.; Chipman, J. Remote Sensing and Image Interpretation; John Wiley and Sons: Hoboken, NJ, USA, 2015. [Google Scholar]
  53. Guerra-Hernández, J.; Díaz-Varela, R.A.; Ávarez-González, J.G.; Rodríguez-González, P.M. Assessing a novel modelling approach with high resolution UAV imagery for monitoring health status in priority riparian forests. For. Ecosyst. 2021, 8, 61. [Google Scholar] [CrossRef]
  54. Liu, Q.; Liu, G. Using Tasseled Cap Transformation of CBERS-02 Images to Detect Dieback or Dead Robinia pseudoacacia Plantation. In Proceedings of the IEEE 2009 2nd International Congress on Image and Signal Processing, Tianjin, China, 17–19 October 2009; 2009; pp. 1–5. [Google Scholar] [CrossRef]
  55. Erener, A. Remote sensing of vegetation health for reclaimed areas of Seyitömer open cast coal mine. Int. J. Coal. Geol. 2011, 86, 20–26. [Google Scholar] [CrossRef]
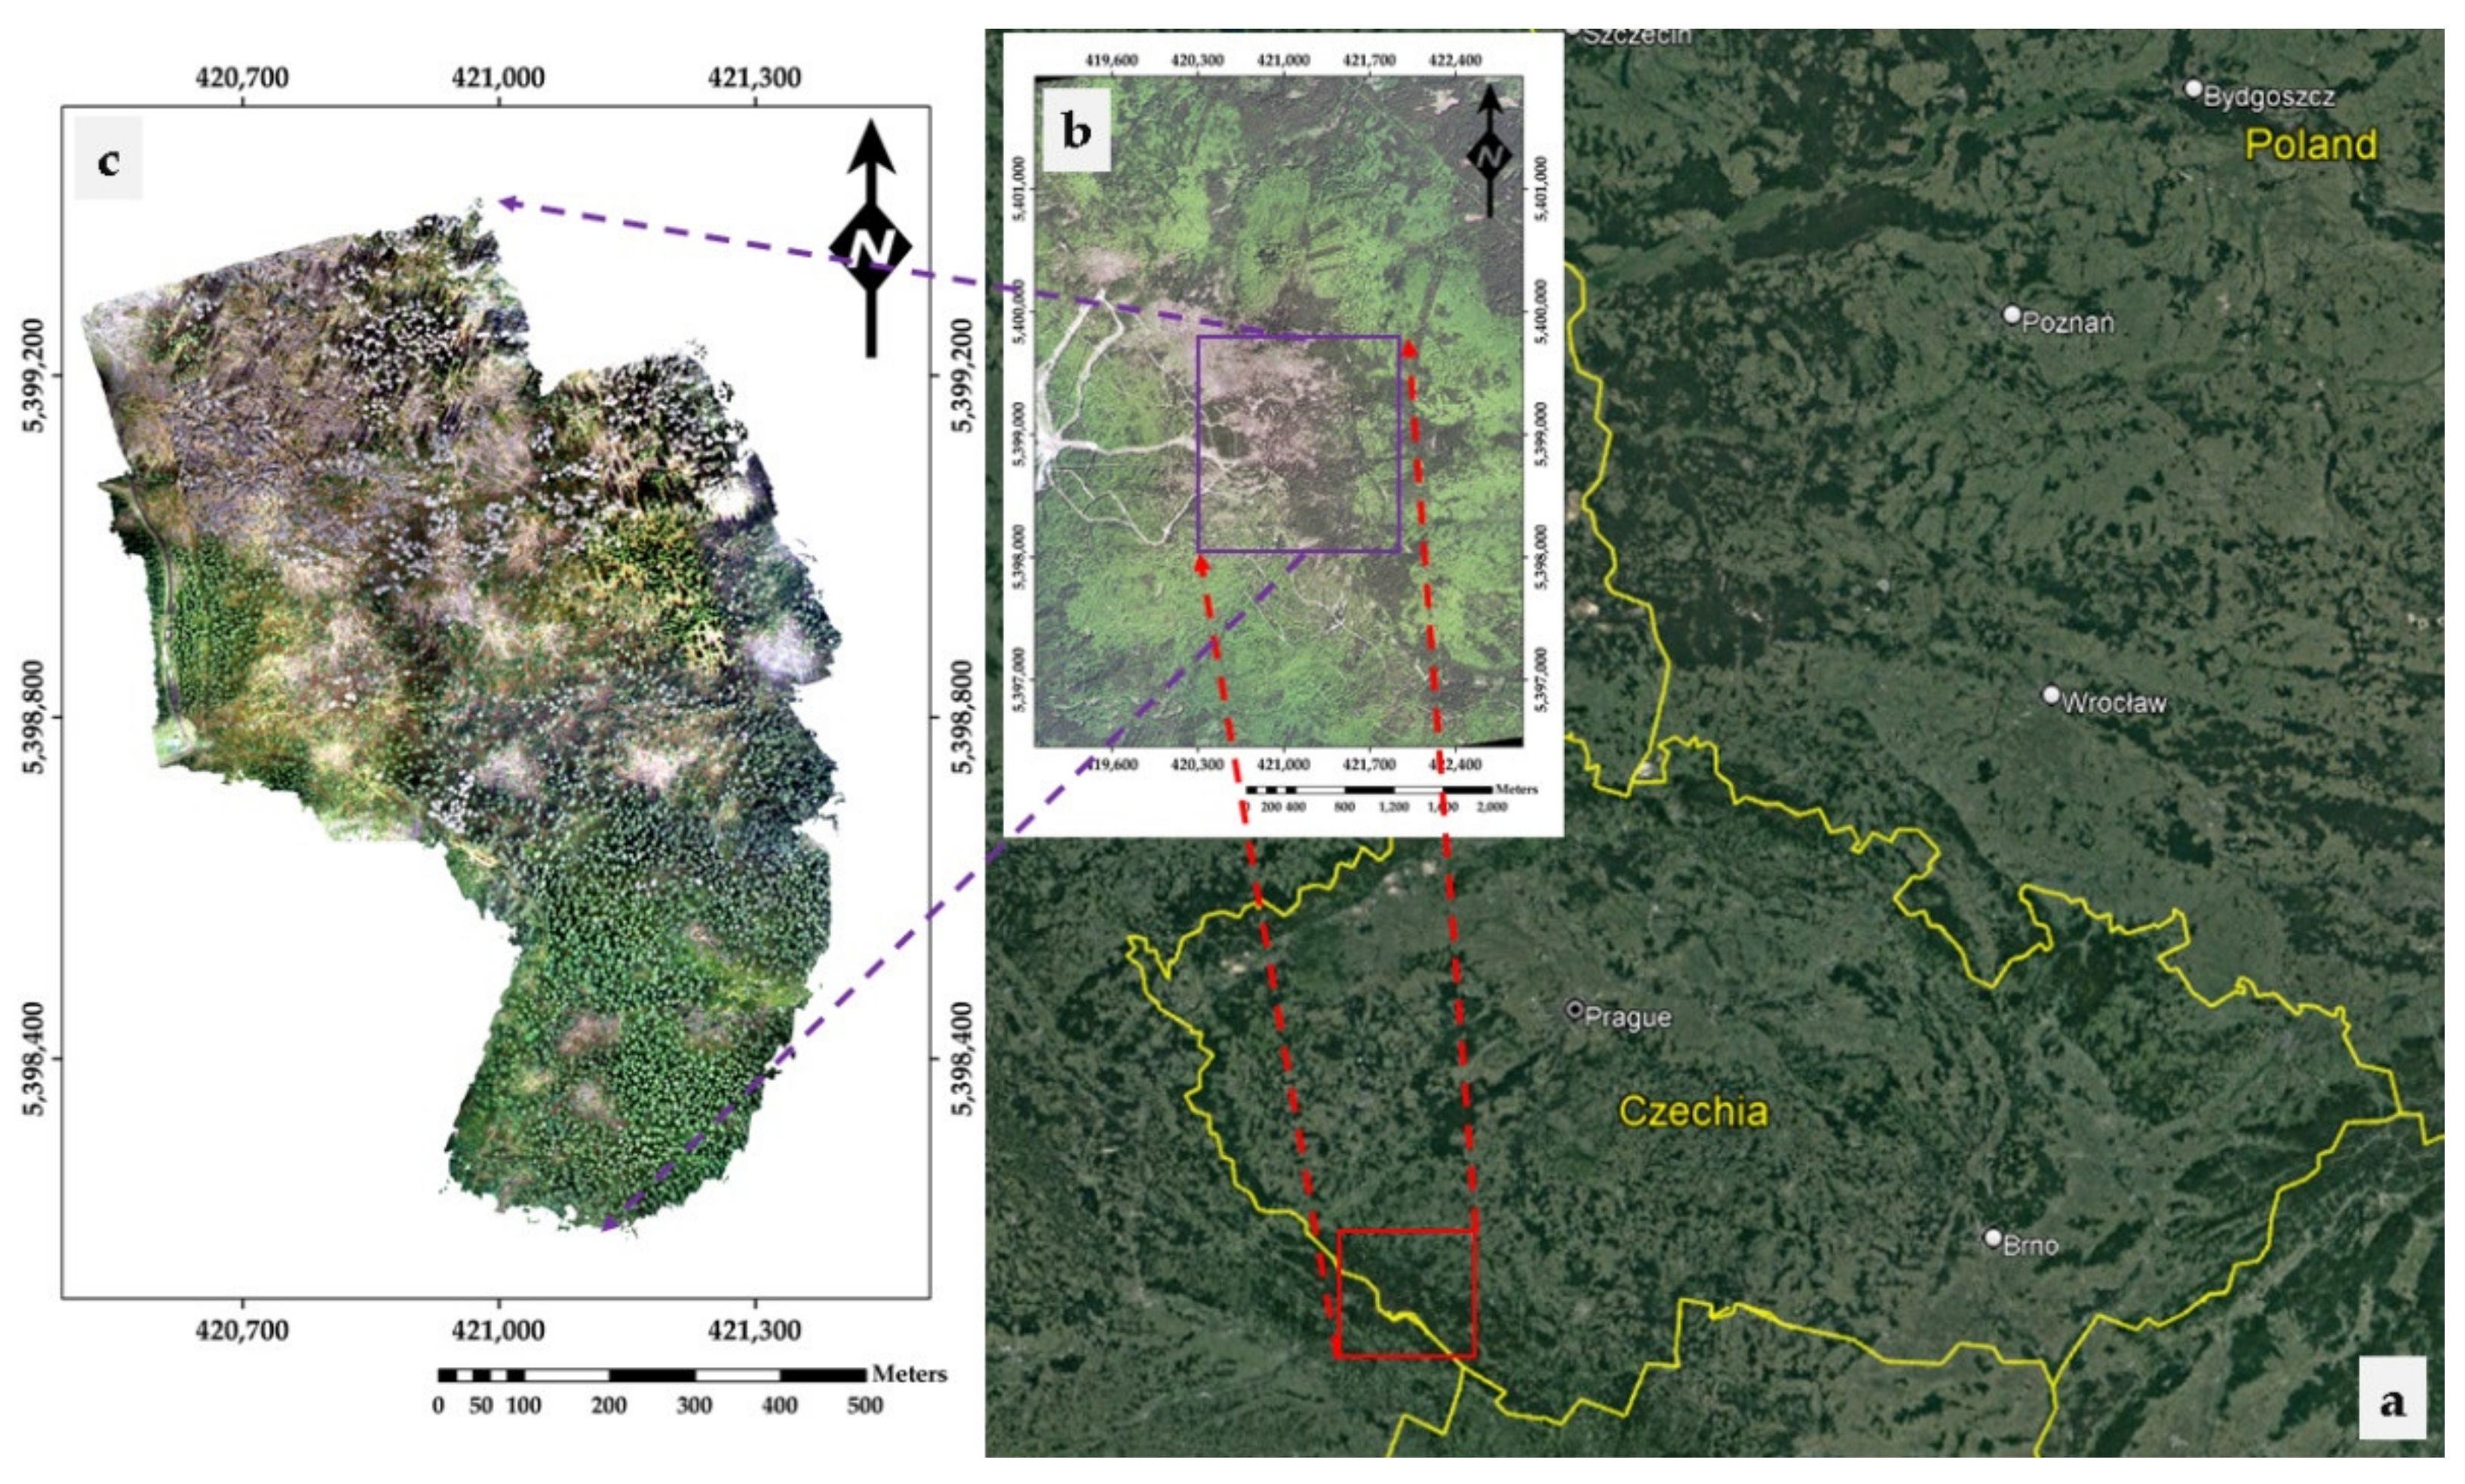
Figure 1. (a) The relative location of the study area in Šumava National Park, Czech Republic; (b) magnified area taken from Pléiades 1B, showing the exact location of the study area; (c) unmanned aerial vehicle (UAV) orthomosaic of the study area. The coordinate system used was WGS 1984 Web Mercator.
Remotesensing 13 04953 g001
Figure 2. Sample of the UAV R-G-B orthophoto images taken from the study area in Smrčina in June 2020, and a visual assessment of the tree health status into four categories (two for downed trees and two for the standing trees). (a) The yellow arrow shows an example of a tree with a green crown. These trees were attractive for bark beetle infestation in spring 2020, labeled as “lying attractive” (LA). The blue arrow indicates a tree example with a rusty-colored or dry crown. These trees were attacked during the previous swarming and labeled as “lying dead” (LD; dehydrated without any residual glucose in the phloem). (b) The green arrow shows an example of a healthy standing tree, labeled as “standing healthy” (SH), while the red arrow shows an example of a standing dead tree, labeled as “standing dead” (SD).
Remotesensing 13 04953 g002
Figure 3. Sample selection based on UAV data from 2018. LA: lying attractive, LD: lying dead, SD: standing dead, and SH: standing healthy.
Remotesensing 13 04953 g003
Figure 4. Application of the tasseled cap transformation algorithm showing (a) greenness for 2018 and (b) greenness for 2019, as derived from WorldView-2.
Remotesensing 13 04953 g004
Figure 5. Application of the tasseled cap transformation algorithm showing (a) wetness for 2018 and (b) wetness for 2019, as derived from WorldView-2.
Remotesensing 13 04953 g005
Figure 6. Application of the tasseled cap transformation algorithm showing (a) greenness for 2019 and (b) greenness for 2020, as derived from Pléiades 1B.
Remotesensing 13 04953 g006
Figure 7. Application of the tasseled cap transformation algorithm showing (a) wetness for 2019 and (b) wetness for 2020, as derived from Pléiades 1B.
Remotesensing 13 04953 g007
Figure 8. Example of the tasseled cap transformation algorithm on (a) WorldView-2, (b) Pléiades 1B, and (c) SPOT-6 in 2019, using all three channels (brightness, greenness, and wetness).
Remotesensing 13 04953 g008
Figure 9. Box plots displaying the differences in mean values for the tested transformations and vegetation indices (VIs) from all satellites.
Remotesensing 13 04953 g009
Figure 10. Post hoc analysis for vegetation indices (VIs) and transformations, showing the significant difference between the mean values of the four categorical classes (LA: lying attractive, LD: lying dead, SD: standing dead, SH: standing healthy). Letters (a–d) above and below the box plots were used to denote significant differences between groups (p-value < 0.05).
Remotesensing 13 04953 g010
Figure 11. (a) Coastal blue mean values for WorldView-2 in 2018, (b) mean blue values for WorldView-2 in 2018, and (c) mean blue values for SPOT-6 in 2018. These bands successfully separated all the classes from each other (LA: lying attractive, LD: lying dead, SD: standing dead, SH: standing healthy). Letters (a–d) above and below the box plots were used to denote significant differences between groups (p-value < 0.05).
Remotesensing 13 04953 g011
Table 1. Statistical summary table of the sample classes.
YearClassesSample
Frequency
Average Area (m2)Sum of Area (m2)
20181 LA30218.62 6558.69
1 LD55164.68 9057.24
1 SD18185.67 3342.04
1 SH109284.2330,981.56
20191 LA21228.74 4803.56
1 LD66171.2111,299.85
1 SD19168.38 3199.16
1 SH106289.0330,636.98
20201 LA10349.22 3492.23
1 LD89185.0816,471.75
1 SD45350.7115,781.75
1 SH68208.7314,193.81
1 LA: lying attractive, LD: lying dead, SD: standing dead, SH: standing healthy.
Table 2. Specifications of all satellite platforms and their sensors used for this study.
Satellite PlatformImagery Products
Resolution
Spectral Bands (nm)Image Location Accuracy
Pléiades 1B2 m multispectral—0.50 m PANRed: 600–720 With 1 GPSs is 1 m;
without GPSs is 3 m (CE90)
Green: 490–610
Blue: 430–550
NIR: 750–950
PAN: 480–830
WorldView-21.64 m multispectral—0.41 m PAN Coastal blue: 400–450 ≤3 m (using a GPS receiver, a gyroscope, and a star tracker) without any GCPs
Blue: 450–510
Green: 510–580
Yellow: 585–625
Red: 630–690
Red edge: 705–745
NIR1: 770–895
NIR2: 860–1040
PAN: 450–800
SPOT-66 m multispectral—1.5 m PAN Red: 620–690 35 m CE 90 without GCP within 30 viewing angle cone; 10 m CE90 for Ortho where Reference3D is available
Blue: 450–520
Green: 530–600
NIR: 760–890
PAN: 450–750
1 GCPs: ground control points.
Table 3. Reflectance indices for each satellite platform.
Satellite PlatformUsed IndicesFormulaCitation
Pléiades 1B
SPOT-6
Soil Adjusted Vegetation Index (SAVI)[1.5 × (NIR − Red)]/(NIR + Red + 0.5)Huete [38]
Normalized Difference Vegetation Index (NDVI)(NIR − Red/NIR + Red)Rouse et al. [39]
Simple Ratio (SR)(NIR/Red)Birth and McVey [40]
Transformed Vegetation Index (TVI)1 SQRT((NIR − Red)/(NIR + Red) + 0.5)Deering et al. [41]
WorldView-2Soil Adjusted Vegetation Index (SAVI)[1.5 × (NIR − Red)]/(NIR + Red + 0.5)Huete [38]
Normalized Difference Vegetation Index (NDVI)(NIR − Red/NIR + Red)Rouse et al. [39]
Simple Ratio (SR)(NIR/Red)Birth and McVey [40]
Transformed Vegetation Index (TVI)SQRT((NIR − Red)/(NIR + Red) + 0.5)Deering et al. [41]
Modified Chlorophyll Absorption Ratio Index (MCARI)[(Red-edge − Red) − 0.2 × (Red-edge − Green)] × (Red-edge/Red)Daughtry et al. [42]
Plant Senescence Reflectance Index (PSRI)(Red − Green)/(Red-edge)Ren et al. [43]
Normalized Difference Red-edge Index (NDRE)(NIR − Red-edge)/(NIR + Red-edge)Clarke et al. [44]
1 SQRT: square root.
Table 4. Summary of the most important results from Eta-squared (η2), PHRB.
SatelliteYear of ImageryBand ETA-Squared (2018)ETA-Squared (2019)ETA-Squared (2020)
PHRB2019NDVI (mean)0.340.330.28
SAVI (mean)0.340.330.28
SR (mean)0.380.380.34
TVI (mean)0.330.320.27
Wetness (mean)0.210.180.15
2020Greenness (mean)0.120.140.04
Table 5. Summary of the most important results from Eta-squared (η2), WV2.
SatelliteYear of ImageryBand ETA-Squared (2018)ETA-Squared (2019)ETA-Squared (2020)
WV22018Coastal Blue (mean)0.370.360.36
Blue (mean)0.360.340.35
Green (mean)0.330.310.32
Yellow (mean)0.420.400.40
Red (mean)0.410.390.40
Brightness (mean)0.360.380.28
Wetness (min)0.300.300.36
2019Coastal Blue (mean)0.520.490.58
Blue (mean)0.510.480.57
Green (mean)0.450.430.49
Yellow (mean)0.460.440.54
Red (mean)0.480.460.60
PSRI0.250.240.29
Wetness (min)0.340.330.51
Table 6. Summary of the most important results from Eta-squared (η2), SPOT6.
SatelliteYear of ImageryBand ETA-Squared (2018)ETA-Squared (2019)ETA-Squared (2020)
SPOT62018Blue (mean)0.400.380.39
Green (mean)0.380.370.39
Red (mean)0.410.400.41
Brightness (mean)0.360.360.28
Wetness (mean)0.400.380.43
SR (mean)0.210.210.26
2019Blue (mean)0.400.380.49
Green (mean)0.410.400.43
Red (mean)0.380.360.46
Brightness (mean)0.580.580.42
Greenness(mean)0.270.220.04
Wetness (median)0.270.210.12
2020Blue (min)0.190.180.26
Green (min)0.150.140.19
Publisher’s Note: MDPI stays neutral with regard to jurisdictional claims in published maps and institutional affiliations.