Technical Note

Fishing for Feral Cats in a Naturally Fragmented Rocky Landscape Using Movement Data

1
School of Earth and Planetary Science, Curtin University, Bentley, WA 6102, Australia
2
Bentley Delivery Centre, Biodiversity and Conservation Science, Department of Biodiversity, Conservation and Attractions, Locked Bag 104, Perth, WA 6983, Australia
*
Author to whom correspondence should be addressed.
Remote Sens. 2021, 13(23), 4925; https://doi.org/10.3390/rs13234925
Submission received: 25 October 2021 / Revised: 19 November 2021 / Accepted: 1 December 2021 / Published: 4 December 2021

Abstract

:
Feral cats are one of the most damaging predators on Earth. They can be found throughout most of Australia’s mainland and many of its larger islands, where they are adaptable predators responsible for the decline and extinction of many species of native fauna. Managing feral cat populations to mitigate their impacts is a conservation priority. Control strategies can be better informed by knowledge of the locations that cats frequent the most. However, this information is rarely captured at the population level and therefore requires modelling based on observations of a sample of individuals. Here, we use movement data from collared feral cats to estimate home range sizes by gender and create species distribution models in the Pilbara bioregion of Western Australia. Home ranges were estimated using dynamic Brownian bridge movement models and split into 50% and 95% utilisation distribution contours. Species distribution models used points intersecting with the 50% utilisation contours and thinned by spacing points 500 m apart to remove sampling bias. Male cat home ranges were between 5 km2 (50% utilisation) and 34 km2 (95% utilisation), which were approximately twice the size of the female cats studied (2–17 km2). Species distribution modelling revealed a preference for low-lying riparian habitats with highly productive vegetation cover and a tendency to avoid newly burnt areas and topographically complex, rocky landscapes. Conservation management can benefit by targeting control effort in preferential habitat.

Graphical Abstract

1. Introduction

Most invasive species have been introduced without consideration of their pervasiveness or environmental ramifications [1]. In Australia, invasive plants and animals are a significant economic burden, with their cost of management estimated to be more than AUD 13 billion per year [2]. Unfortunately, eradication success stories are few (e.g., [3]), particularly if invasion is advanced or occupying a broad range of biomes (e.g., [4]). Some invasive species have come from locations where their physiological tolerances are well adapted to their new environment and have occupied niches that were not filled when they arrived, such as by the cane toad (Rhinella marina) in Australia [5]. Similarly, some introductions can prosper by slotting into niches between existing native species [6]. This includes the feral domestic cat (Felis catus), which is a ubiquitous predator throughout the globe [7]. In Australia, feral cats could fill a niche between quolls (Dasyurus spp.) and dingoes (Canis familiaris) [5]. Determining strategies for their management requires knowledge of their preferred habitat and, for animals, of the extent and frequency of locations they utilise for their everyday activities [8].
Movement data acquired from Global Positioning System (GPS) tracking collars enable the passive monitoring of an animal’s movements throughout their range at regular intervals [9]. This information can be analysed to estimate their home range—the space utilised as they undertake their daily activities, such as hunting, seeking a mate or caring for young [10]. Home ranges can be estimated using conventional tools, such as kernel density surfaces or convex polygons, but these methods do not take full advantage of the temporal nature of the data, which can lead to poor and unrealistic results [11]. The dynamic Brownian Bridge Movement Models (DBBMMs) does take advantage of these positional sequences (tracks), by using space as a probability surface that models the transition from one location to the next, based on how much time was available in between [12].
Determining the spatial behaviour and delineating the home ranges of invasive animals is important for informing the scale of the problem and analysing interactions within species (e.g., territorialism), between sexes and for predator-prey interactions [13]. However, as collars are usually only placed on a few individuals, identification of habitats beyond the sample set often needs to be extrapolated. Identifying correlations between high density utilisation locations and covariates may be useful for identifying high use areas over less exhaustively sampled terrain. Species distribution models (SDMs) have proven useful to this end [14,15,16].
Feral cats occur in heterogeneous abundances across 99.8% of Australia and many of its larger territorial islands, from deserts to tropical woodlands [17]. Their population size fluctuates between 1.4 and 5.6 million, depending on available prey, which generally correlates with wetter conditions [17]. They are opportunistic, generalist carnivores that kill millions of native animals every day, including 3.2 million mammals, 1.2 million birds, 1.9 million reptiles, 0.25 million frogs and 3 million invertebrates [18]. This has resulted in the decline of many mammal species, with more than 20 extinctions and many more threatened species on the brink [19]. Culling using the aerial application of poisoned bait is currently recognised as the only feasible method for controlling feral cats at a large scale, if the risk to non-target species is minimal [20,21]. Clearly, for baiting to be effective, the bait needs to be distributed in areas that feral cats are likely to frequent [8].
Twelve species of mammal have been lost from the mainland portion of the Pilbara bioregion of Western Australia in the past 200 years [22]. Predation by feral cat poses an ongoing risk to numerous populations of declining species, including the threatened night parrot (Pezoporus occidentalis), northern quoll (Dasyurus hallucatus) and greater bilby (Macrotis lagotis) [23,24]. Feral cat management was identified as one of the top three most cost-effective conservation strategies for the Pilbara, together with the management of feral ungulates and the creation of sanctuaries [23]. A trial aerial baiting study using Eradicat® feral cat bait, a manufactured sausage-style bait containing the toxin ‘1080′ (sodium fluoroacetate), was undertaken in the Pilbara from 2016 to 2019. GPS radio-collars were fitted to 15 feral cats primarily to provide estimates of mortality rates following the baiting operations in 2018 and 2019 [21].
Land managers can improve their control strategies if armed with mapped estimates of their habitat preferences. However, much of this knowledge is anecdotal and rarely available in mapped form. Furthermore, the Pilbara bioregion includes landscapes with many inland mountain ranges with cliffs and deep gorges [25], making comprehensive surveys of nocturnal and evasive feral cats extremely difficult. The size, inaccessibility and heterogeneity of the Pilbara necessitate a more targeted approach to baiting in areas of high utilisation. The recent advances in GPS radio-collars and their batteries have helped to overcome these difficulties. However, this rich temporal, dynamic data has seldom been used to drive conventionally static habitat models. Here we incorporate dynamic Brownian Bridge Movement models into species distribution models to identify suitable feral cat habitats for informing baiting programs in a naturally fragmented rocky landscape.
We have two main aims. The first is to use GPS collar data to identify the home ranges of feral cats, as a cohort and separated by gender. We expect that male cats will range further than female cats due to increased territoriality and for seeking a mate. Our second aim is to subsample the GPS collar data to extract the highly utilized territory of each cat that correlates with environmental variables to produce an accurate species distribution model at the landscape scale. We expect that, under the rugged conditions of the Pilbara bioregion, feral cats will seek habitat that enables efficient hunting and relief from the hot midday sun.

2. Materials and Methods

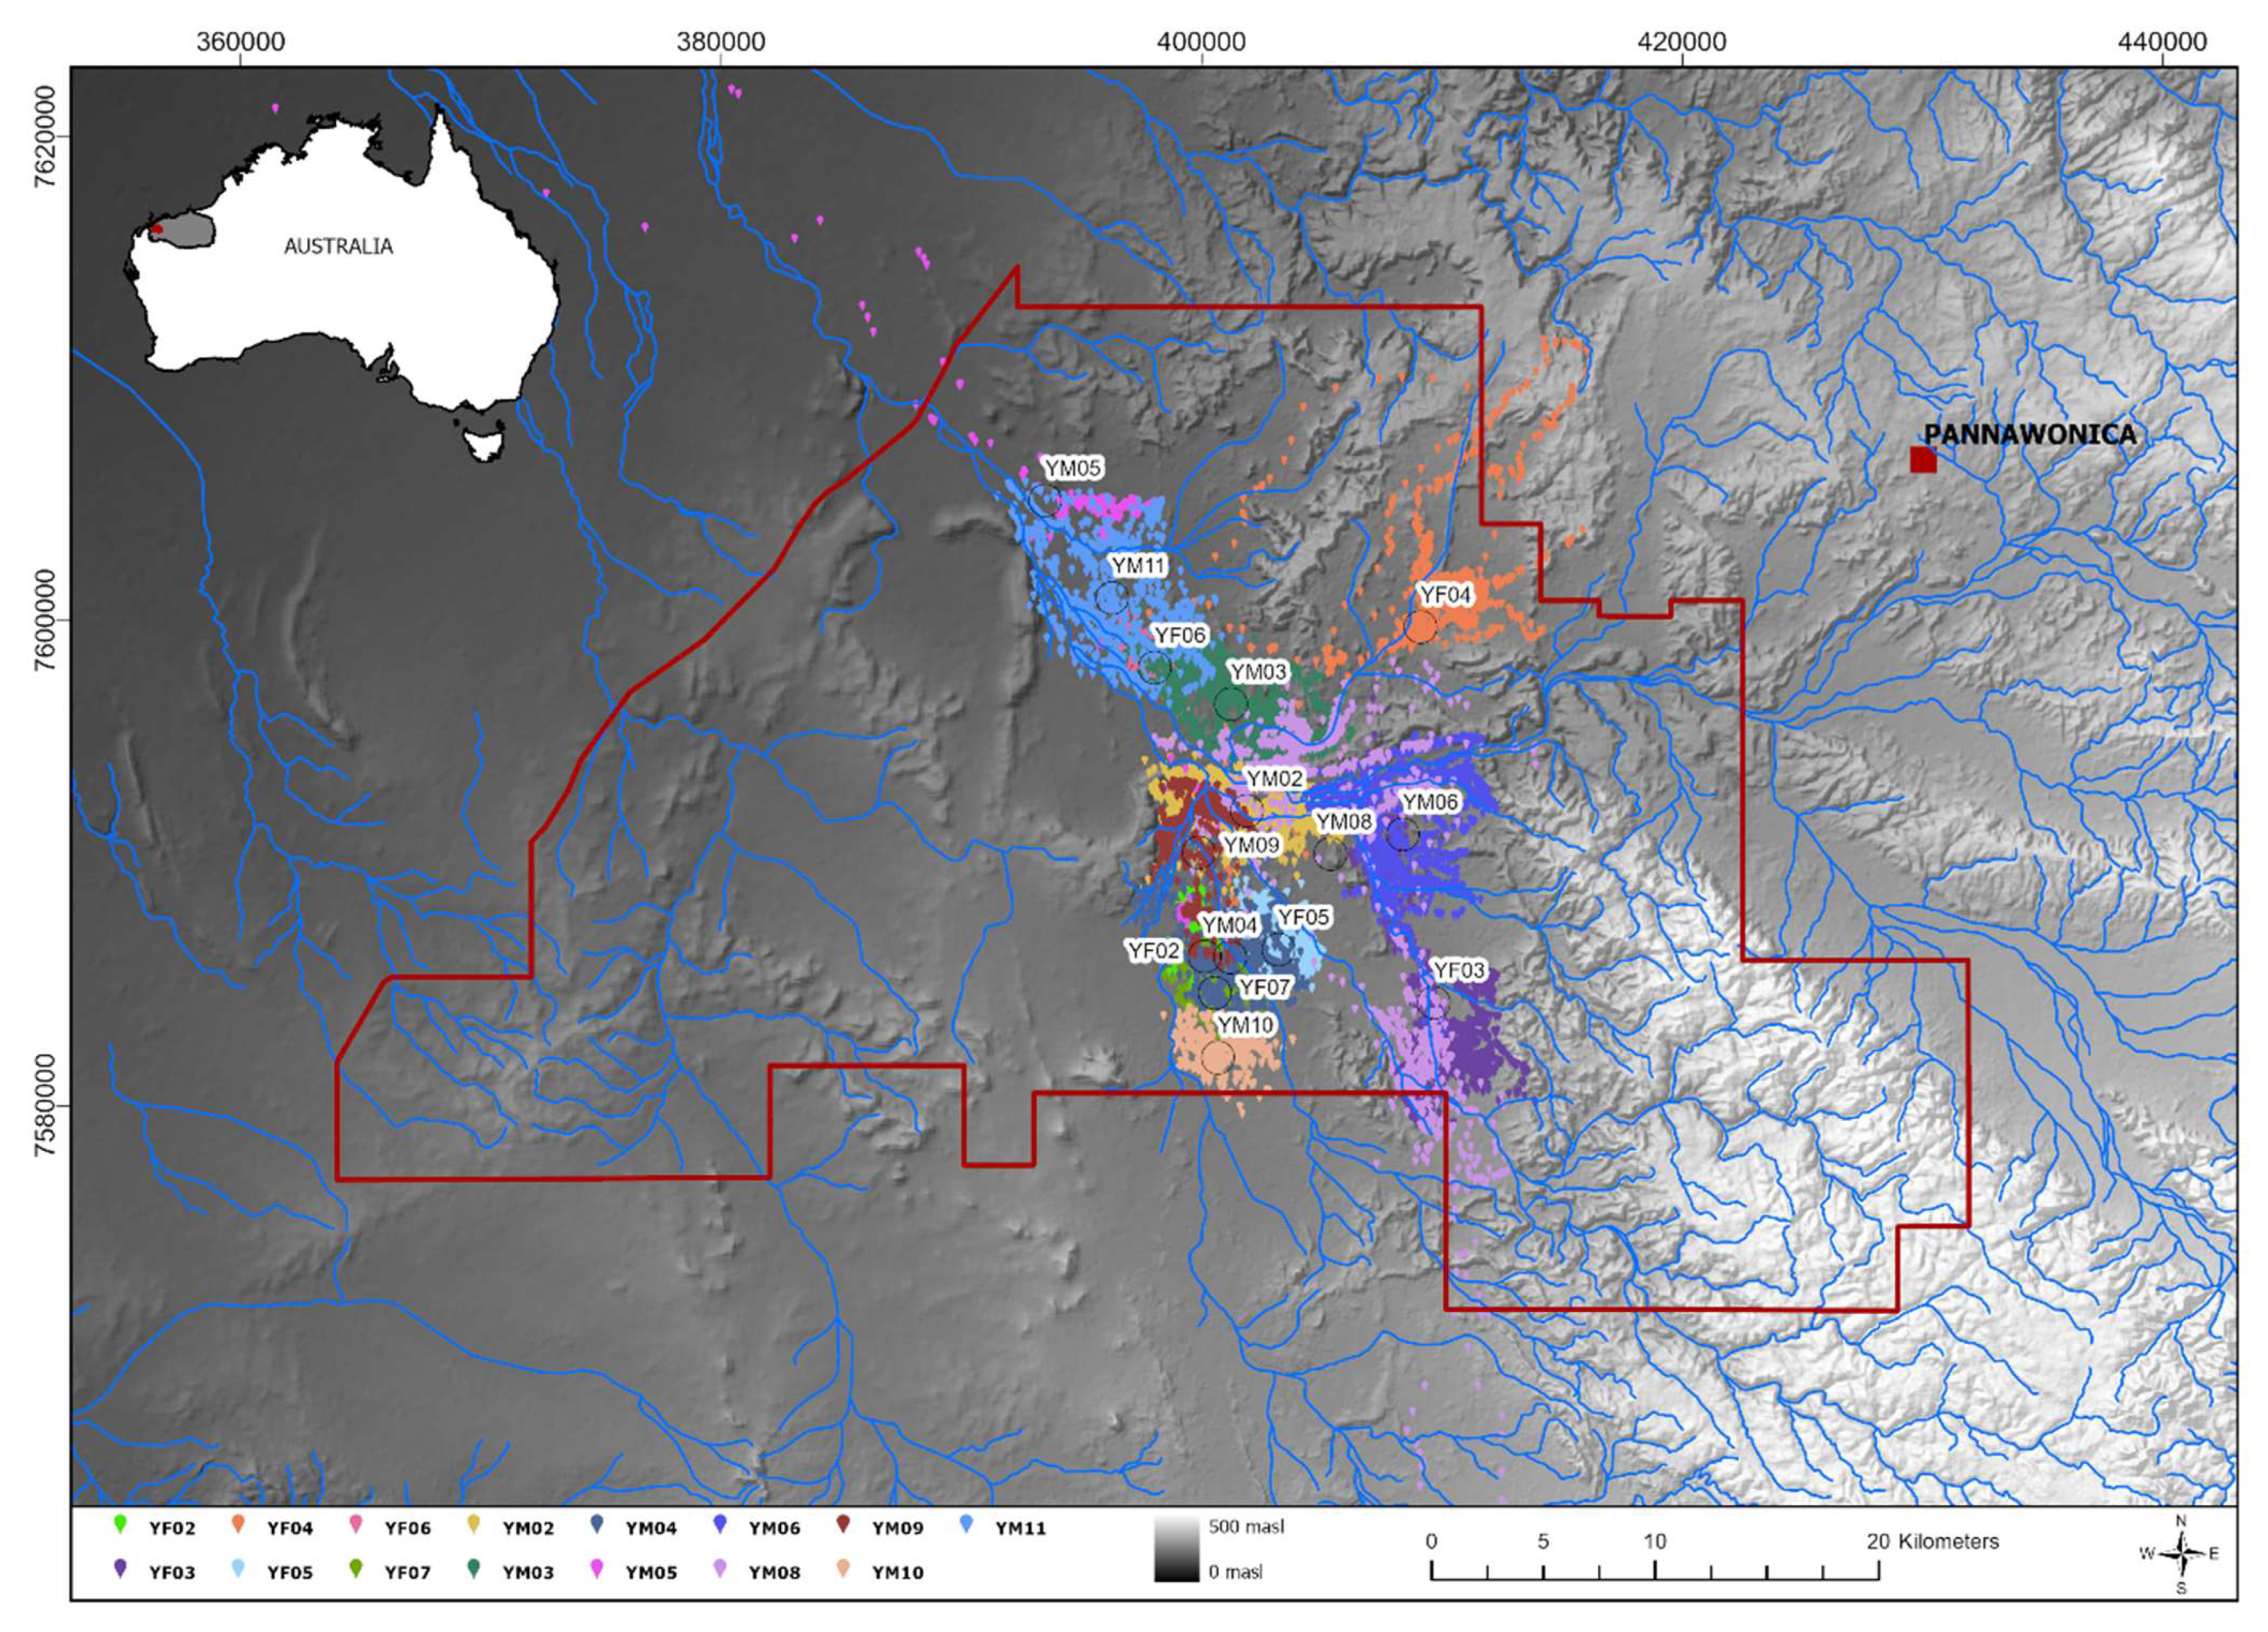
2.1. Study Site and Sample Collection
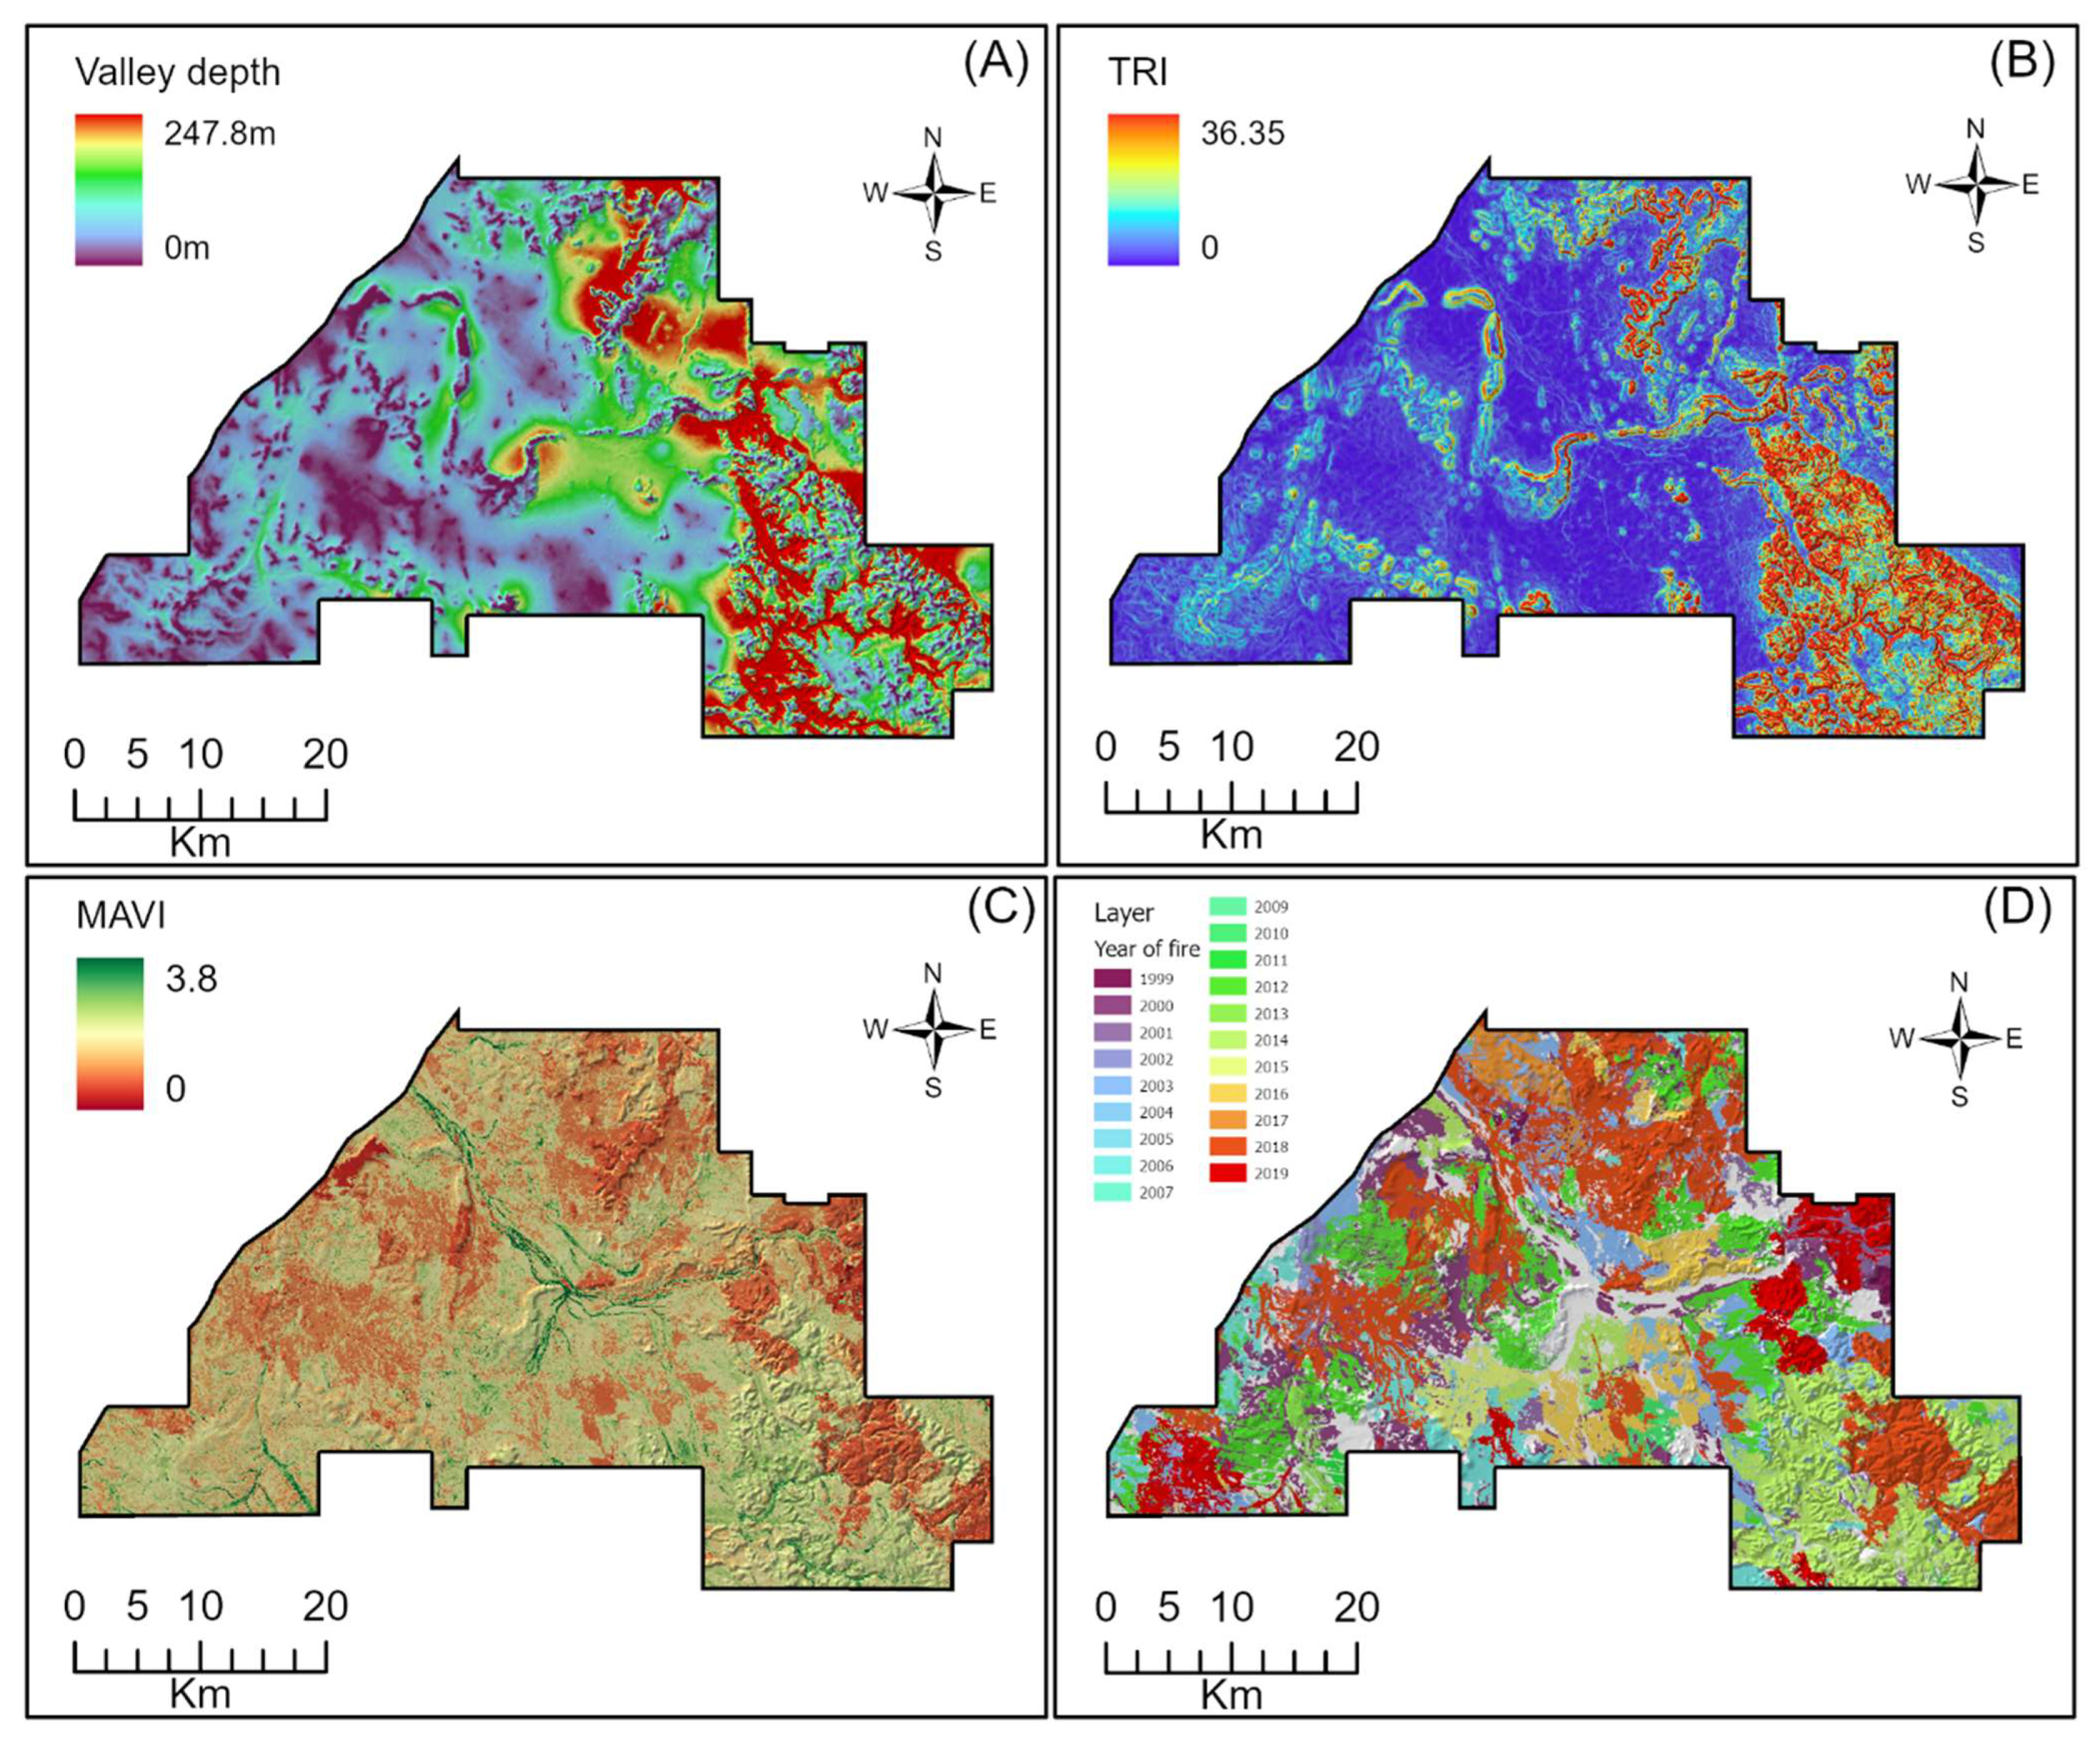
The study was conducted on Yarraloola station, located in the northwest Pilbara bioregion of Western Australia (Figure 1). The Hamersley subregion section of this large cattle grazing station was the focal area for this study. Topography is considerably more complex in the south-eastern portion of the station, which also lies adjacent to the rugged Hamersley range (Figure 1). The study site experiences a semi-arid climate with very hot summers, with maximum temperatures above 40 °C and milder winters with daily temperatures ranging from 13 °C to 28 °C [26]. Average annual rainfall recorded at Pannawonica is 407 mm but varies depending on the frequency of summer tropical cyclones [26]. Vegetation is predominately made up of hummock grasses with scatted low open woodlands of Acacia species [26]. Non-perennial rivers and creeks include the Robe River, Warramboo and Mungarathoona creeks.
GPS/VHF radio-telemetry collars (Advanced Telemetry Systems, Isanti, MN, USA) were fitted to feral cats captured using padded leg-hold traps in 2018 and 2019 [21]. Only cats over ca. 1.7 kg were collared to ensure that the cat’s movements were not impeded by the mass of the collar in any way (i.e., the collar was <5% of the animal’s body mass). The tracking collars were programmed to take 24 GPS fixes per day between July and September (the baiting season) and four fixes per day for other months [21]. The GPS fixes for fifteen cats are displayed in Figure 1. The density of feral cats in the study site are relatively low [21]. Collared cats range from sub-adults to large mature adults of both sexes, presumably representing the population present.

2.2. Spatial Layers

We used the hydrologically enforced 30 m resolution digital elevation model (DEM) obtained from the Shuttle Radar Topographic Mission [27] shown in Figure 1 to derive metrics related to valley depth (Figure 2A) and terrain ruggedness (Figure 2B) using SAGA software [28]. Valley depth is calculated as the difference between the elevation and an interpolated ridge level, and terrain ruggedness is a measure of topographic heterogeneity, where 0 indicates even terrain and larger values indicate more rugged terrain [28]. To summarise vegetation productivity over a full year, we used the large integral of the moisture adjusted vegetation index (LI-MAVI; [29,30] based on Landsat 8 imagery for the year 2019 (Figure 2C). To explore the impact of fire scars, we used fire history from 1999 to 2019 ([31]; Figure 2D). This was provided by DBCA as the year of fire and converted to a time since burnt variable for modelling.

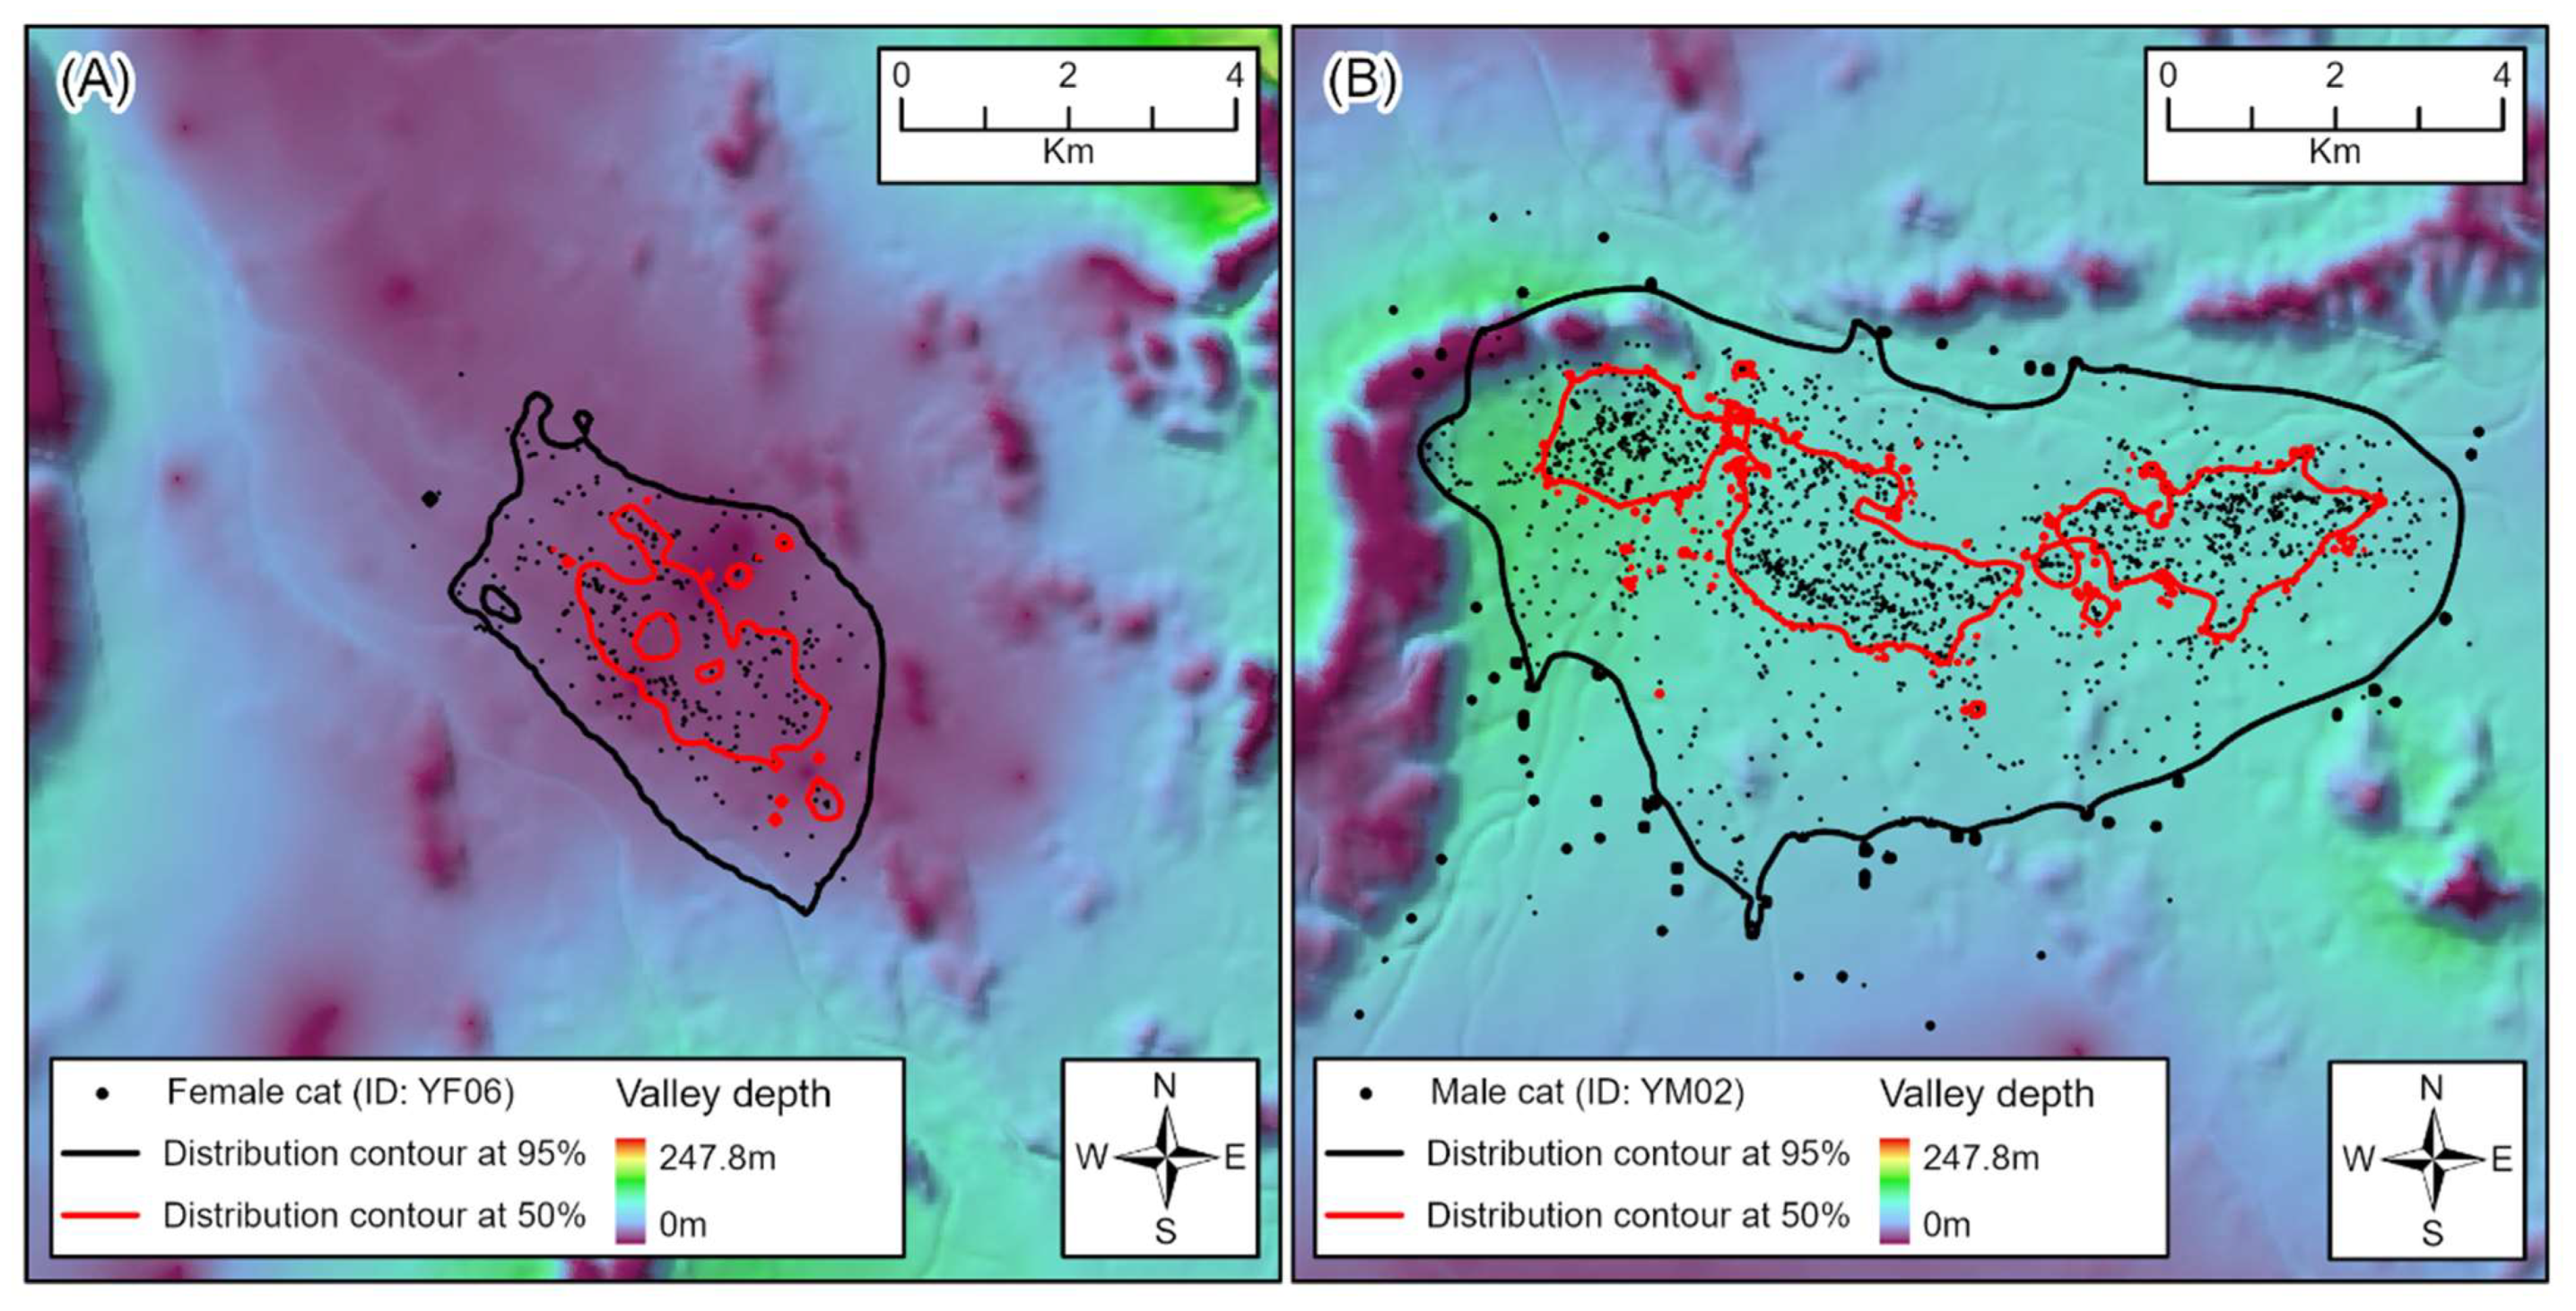
2.3. Home Range Analysis

To incorporate the temporal component in our estimation of space use, we used dynamic Brownian bridge movement modelling (dBBMM) to explore the home ranges of our collared cats. The original Brownian bridge movement model quantified the probability of a given cell to be utilised based on the time taken to move from one location to the next, as recorded in the tracking data [32]. This family of modelling types quantifies the utilisation distribution (UD) based on an animal’s movement path rather than just individual points and are suitable for temporally correlated data of high volumes [33]. Kranstauber et al. [33] made them more “dynamic” by allowing for changes in behaviour to determine change points along a movement path and demonstrated that this extension outperforms the classical model in their simulations and exemplars.
We used the move package in R [34] for dBBMM and to extract UDs for each cat. The UD represents the home range by estimating the size of the area used by the animal but can also provide information regarding how intensely an animal is using different areas within that home range [33]. We extracted a 95% and 50% UD contour for each individual cat.

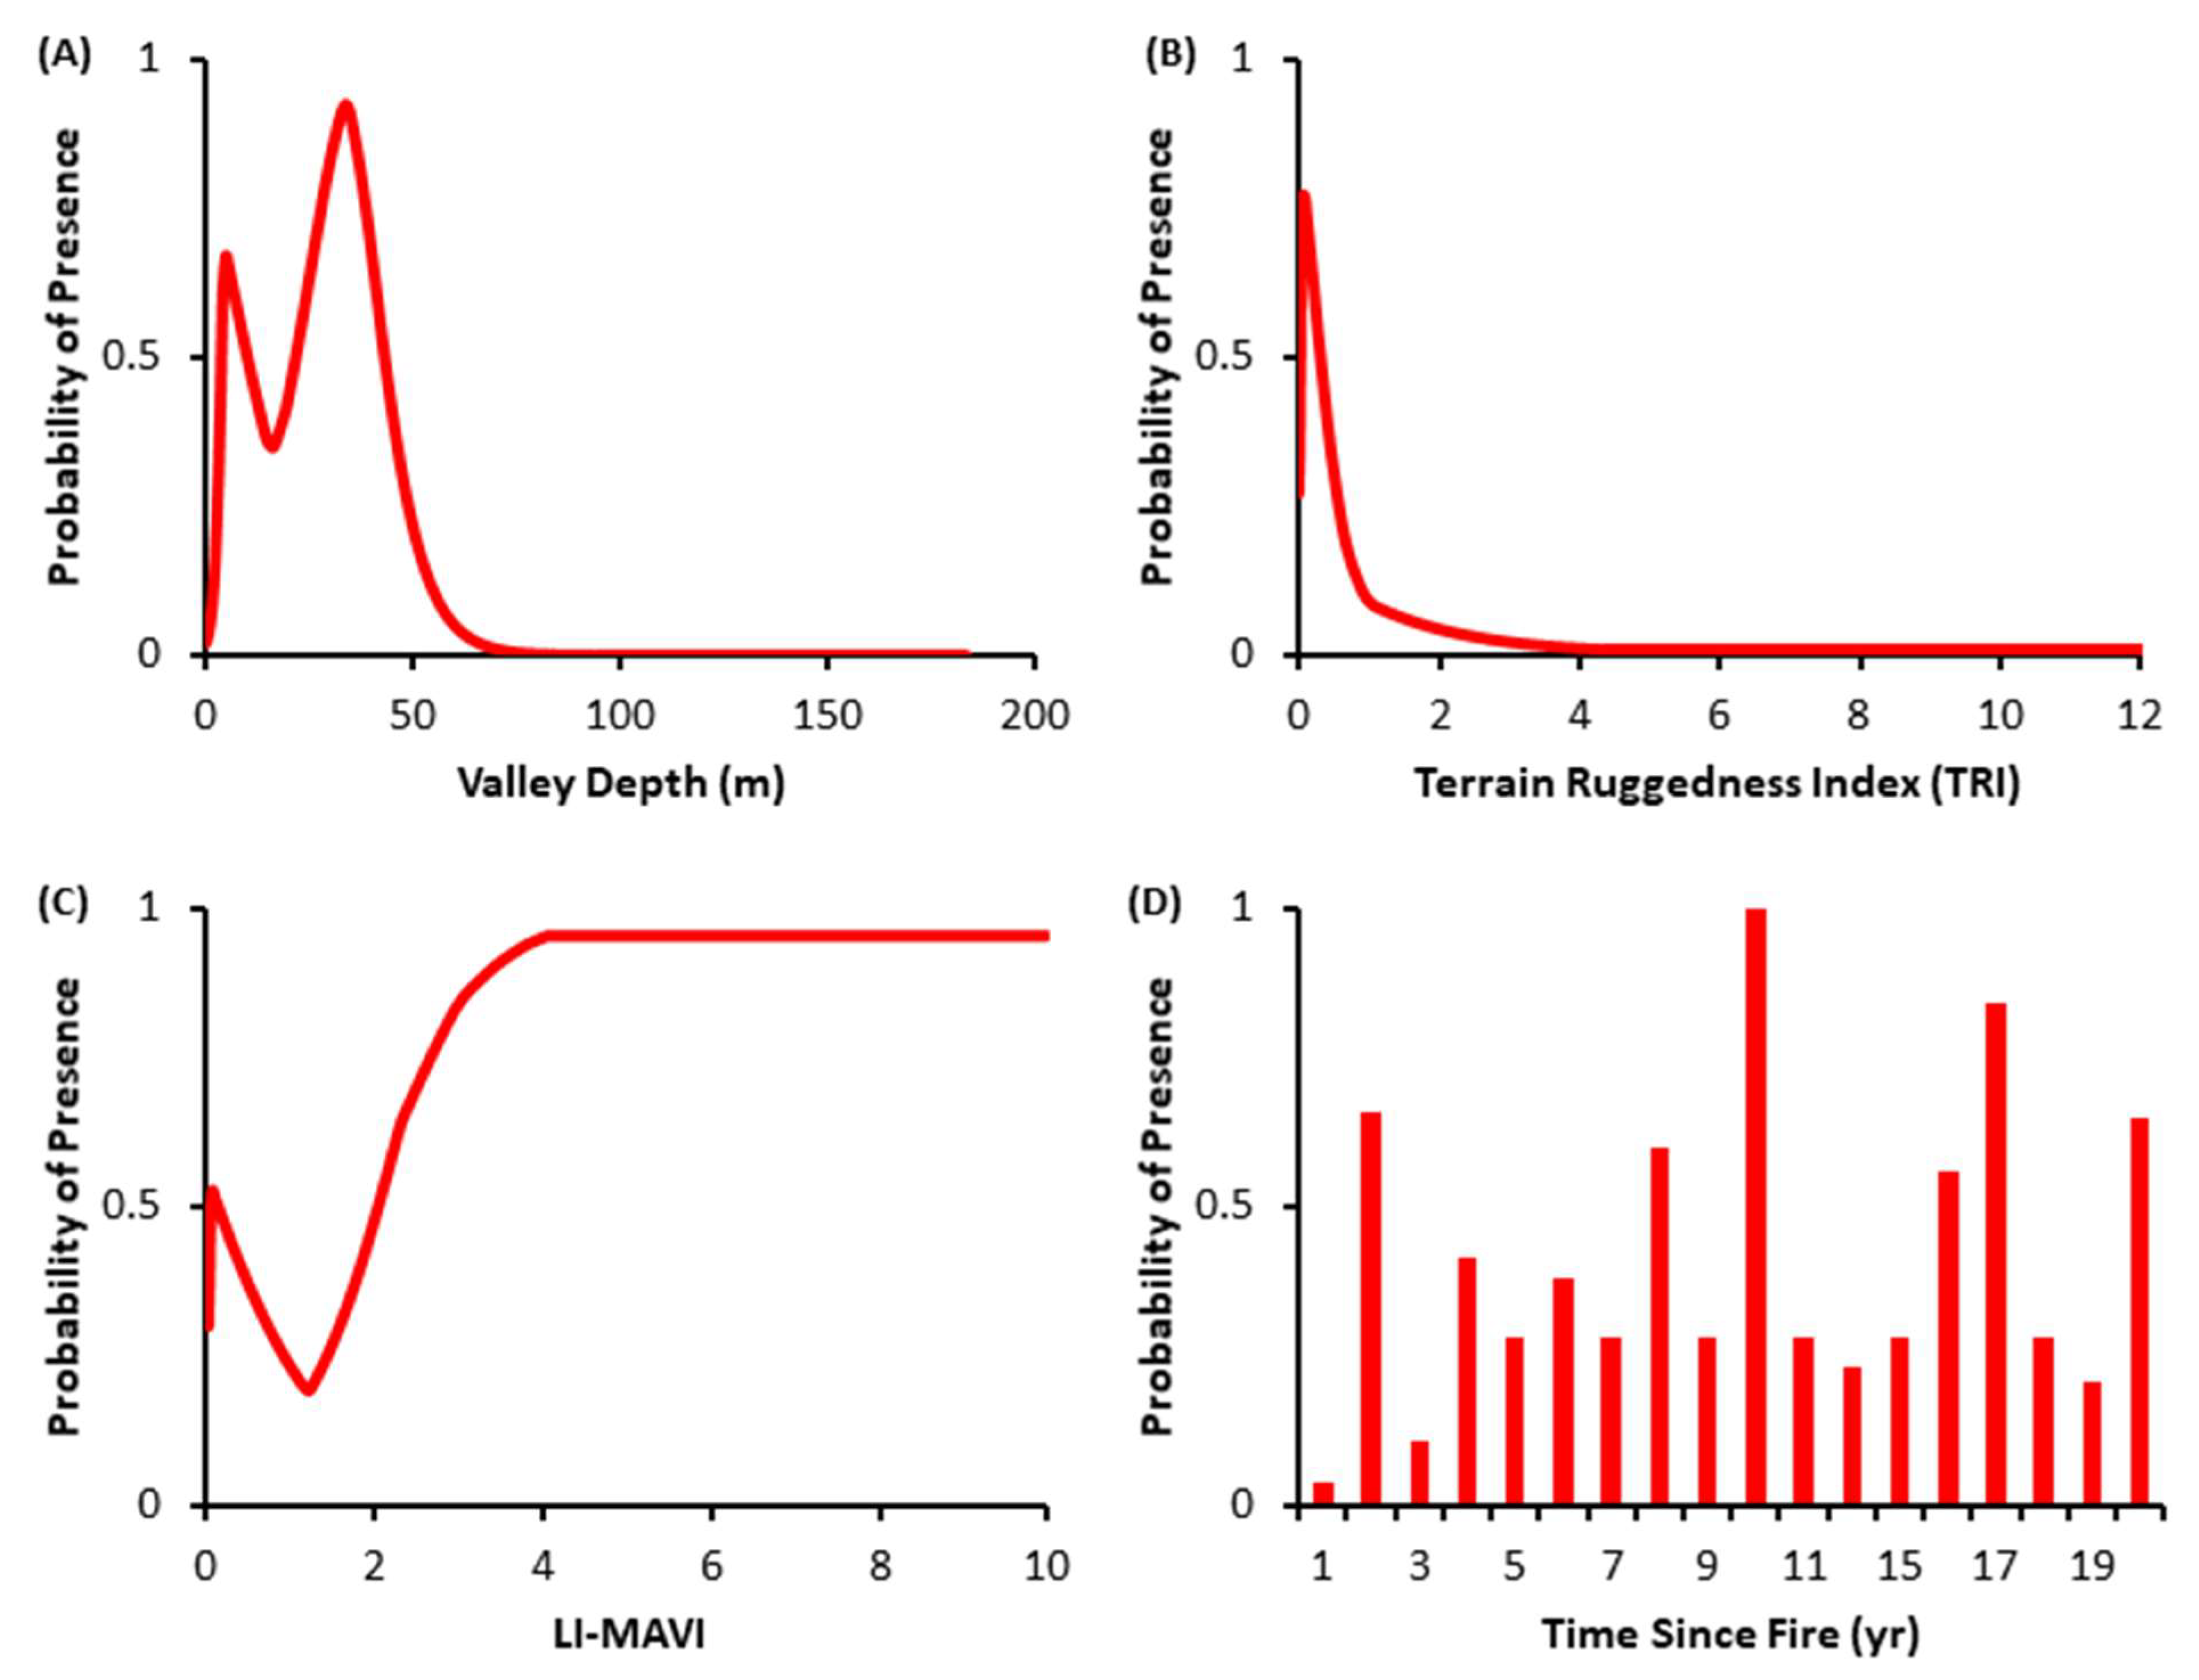
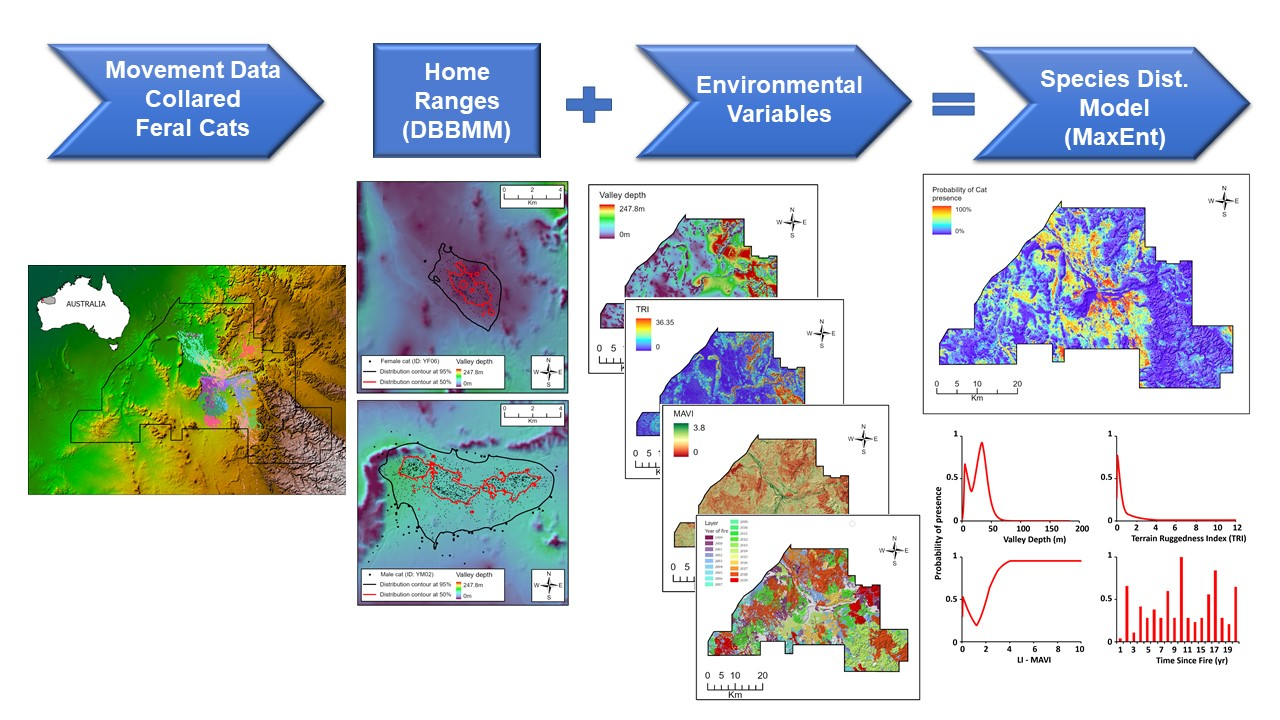
2.4. Species Distribution Models

We filtered GPS tracking points to only those occurring within the 50% UD contours to train the model from locations in highly utilised territory. These points were used in maximum entropy modelling together with the spatial layers. Maximum entropy (MaxEnt) finds the probability distribution of maximum entropy subject to a set of constraints derived from the sampling data [35,36]. The use of background points, rather than true absences, means non-presence does not preclude the possibility of occurrence, which is appropriate for exotic species (e.g., [37,38]). The contribution of each spatial layer was evaluated using permutation importance, which is determined by randomly permuting the values of each variable amongst the training points and measuring the reduction in discrimination potential [39]. Large reductions denote a spatial layer that is highly important. Variable importance metrics were interpreted together with the response curves of each spatial layer. Overall model importance was summarised using the AUC statistic, where 0.5 is random and 1 indicates a perfect model [40]. The worst performing variable at each iteration of the model was removed, and the model of most appropriate complexity was chosen based on the second-order Akaike Information Criterion (AICc), which rewards models that fit the data well while penalising unnecessary parameters [41].

3. Results

3.1. Home Ranges

At the individual scale, the estimated home ranges using the dBBMM for each of the feral cats varied in size considerably. Home ranges were between 3.91 km2 (Cat ID: YF02) and 69.79 km2 (Cat ID: YM03), based on the 95% UD, and averaged 27.32 km2 (Table 1). Home ranges were considerably smaller at the more condensed 50% UD contour, ranging from 0.59 km2 to 13.07 km2 and averaging 4.12 km2. T-tests identified home ranges of male cats were approximately double the size of female cats. This was significantly different at both the 50% UD contour (5.40 km2 vs. 2.21 km2) and the 95% UD contour (34.44 km2 vs. 16.65 km2). Exemplars of the UDs for the two genders are shown in Figure 3.

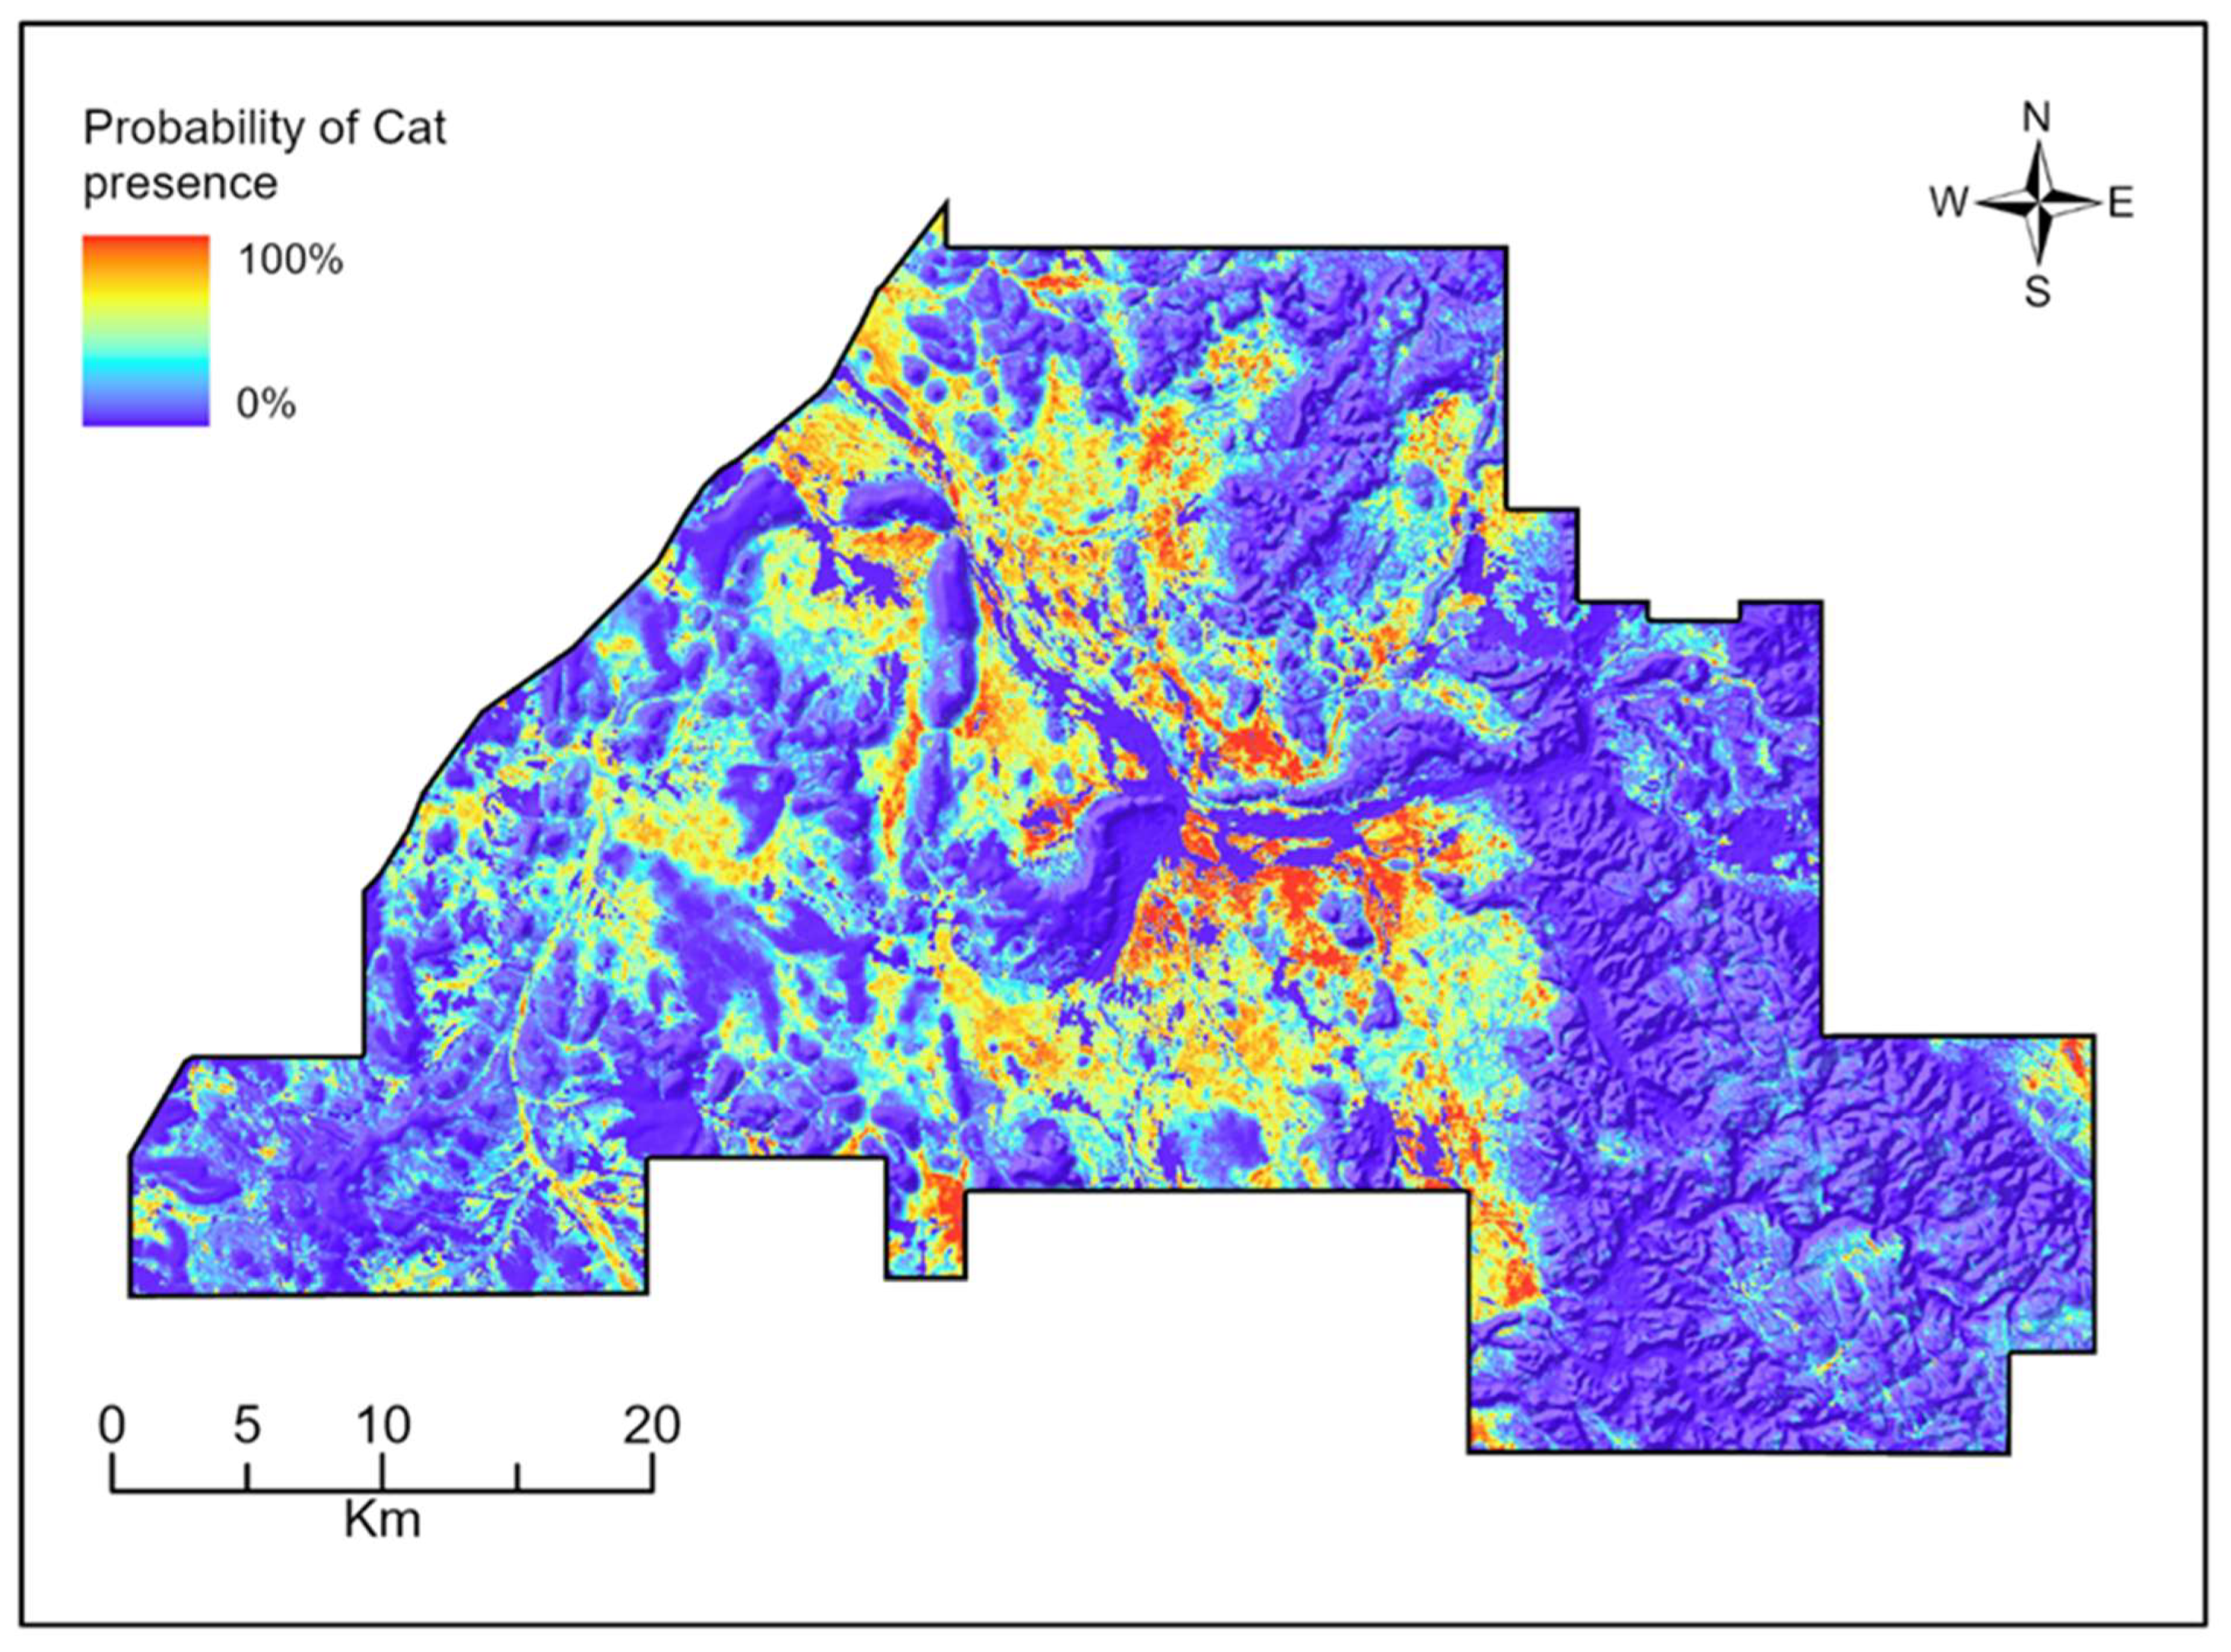
3.2. Species Distribution Models

An SDM was built using all spatial layers and the points within the 50% UD contour and yielded an AUC of 0.90 (Table 2). Subsequent models were produced by backward selection, yielding AUC values between 0.74 and 0.88 (Table 2). Nonetheless, the full model had the lowest AICs and was therefore retained, and all other models were ignored from further analysis. Valley depth was the strongest predictor of feral cat habitat, contributing 47% to the final model (Table 2). This was followed by terrain ruggedness, time since fire and LI-MAVI (Table 2). The final model is shown in Figure 4.
The response curves for the four explanatory variables are shown in Figure 5. These plots represent a Maxent model created using only the corresponding variable. Valley depths between 5 and 40 m were found to be most suitable, indicating an inclination for cats to spend a disproportionate amount of time in riparian zones (Figure 5A). The response curve for topographic ruggedness peaked at a value of 0.12 and rapidly declined, indicating a proclivity for even terrain and hence the avoidance of rugged topography (Figure 5B). Areas with the highest level of year-round green and moist vegetation based on the LI-MAVI index were favoured habitats, and these were often coincident with riparian zones within the study area (Figure 5C). The time since fire variable suggests avoidance of recently burnt areas, up to 1 year, but was otherwise randomly arranged (Figure 5D).

4. Discussion

Defining the environmental niche of invasive animals, as opposed to plants, has unique challenges. Not only is it difficult to define the potential range of most exotic species (e.g., [37]), animals are generally not stationary and can be difficult to observe, especially if they are nocturnal or deliberately evasive, as in the case of feral cats [42]. This can make obtaining a suitable sample size indicative of their habitat preferences difficult, rendering traditional spatial analysis techniques for habitat delineation unsuitable. However, trapping and fitting GPS/VHF radio-telemetry collars allows for semi-continuous movement data that produces many hundreds of points per animal, per season, which can provide insight into the locations more commonly utilised.
Here, we used movement data, acquired from fifteen cats, in dynamic Brownian bridge movement models (dBBMM). These models remove random forays that are unlikely to be highly suitable habitat and can be used to delineate utilisation distributions (UDs), which illustrate an animal’s space-use patterns or relative frequency of occurrence at a given point in space. For example, several cats (e.g., YM05, YM08 and YF04) undertook long distance forays during the study (Figure 1), but these were excluded from habitat modelling by restricting training data to only movement data that intersected with the 50% UD contour (where cats spend at least half their time). This enabled the construction of a species distribution model, with very high discrimination between presence and background locations, which highlighted riparian zones as a desirable habitat for feral cats. This has broader implications for more targeted baiting strategies.

4.1. Home Ranges

We found the average home range size was significantly larger for male cats than for female cats, as did Bengsen et al. [8]. However, our average home range size, measured using the 95% UD contour, was twice as large for males as it was for females (34.44 km2 for males and 16.65 km2 for females). This is considerably larger than that identified by Bengsen et al. [8], who found male cats utilised around 5.10 km2 and female cats around 4.36 km2 from 47 study sites across the globe. The home ranges of the Pilbara feral cats are also considerably larger than the average home ranges of domestic feral cats, which mostly roam in an area of less than 1 km2 [42]. However, these studies reported UDs based on the minimum convex polygon method, which does not exclude random forays. Nonetheless, the obvious gender disparity does suggest that males occupy large territories, potentially for finding a mate, hunting and patrolling. Other studies have also found that the male home ranges are larger and may overlap the home ranges of several females [43]. This suggests that species distribution models may be further refined by separating by gender.

4.2. Species Distribution Models

In Australia, feral cats have been found to be associated with open habitats such as spinifex grasslands. In the Cape York Peninsula, cats were also found to select areas with little canopy cover and shallow water [44]. These preferences may enable more efficient hunting practices [45]. However, they differ from our findings. Our study identified creek lines with persistent vegetation cover as the most preferred locations. This habitat preference more closely resembled cats in the arid areas of South Australia, which also preferred vegetated creek lines as well as sand dunes [46]. It is likely that these habitats provide protection from heat, a corridor for hunting purposes and additional protection from locally occurring apex predators such as dingoes and wedge-tailed eagles (Aquila audax). Feral cats are excellent climbers, so the larger trees associated with creek lines provide the opportunity to seek refuge when required [47].
Our model also identified that the cats have no preference for the steep, rugged topography found to the east of the study area. Hohnen et al. [48] also recognised an aversion to complex topography in their study of feral cats in the adjacent Kimberley region of Western Australia. In our study area, this avoidance has proven beneficial to northern quolls, as they use these rocky and hilly areas as refuges and for breeding [49,50]. Rugged terrain may also provide a natural barrier to feral cat movement, particularly to areas subjected to control [51].
Some studies in Australia have shown that feral cats select habitats affected by frequent fires [44,52]. However, this is not shown to be the case in this study area. The time since fire response curve suggests that our cats reject freshly burnt locations. Fires in our study area over the period when cats were collared were very hot and removed much of the vegetation. The cats appear to return to burnt areas after about 12 months.

4.3. Conservation Implications

There is evidence that feral cat control by active baiting had a positive influence on Northern Quoll activity on Yarraloola [21]. Once the feral cat numbers are reduced, limiting re-invasion from surrounding areas remains an ongoing challenge in open systems [53]. Camera trap monitoring of cats only identified a single re-invasion event at the study site in the three years that followed the initial baiting program in 2016, with no recovery in the cat population in 2017 and 2019 [21]. The large areas of unsuitable rocky habitat and the narrow corridors provided by the drainage channels, as suggested by the SDM’s in this study, may be a factor limiting the recolonisation of the baited area by cats.
The movement corridors provided by the riparian drainage channels represent areas to be targeted for intensive cat control action. A uniform winter aerial baiting approach was used in the current study at Yarraloola; however, it is thought that a combination of targeted aerial and ground-baiting by hand would be more cost effective [21]. The SDMs produced here highlight the areas where this focused approach would possibly expose more cats to the bait, and the efficacy of such an approach should be quantified. As ‘bait-resistance’ [54] occurs in feral cat populations subjected to annual baiting programs, periodic trapping is required to remove these individuals, typically large male cats [20]. Our model will allow these traps to be placed strategically in the areas where they are most likely to be encountered.

5. Conclusions

Advances in tracking animals with GPS/VHF radio-telemetry collars will continue to improve our ability to model their behaviours and habitat preferences. This data has provided a wealth of information on the movement of feral cats at our study site that would not otherwise be available or derivable, including delineation of their home range, behaviour, and habitat preferences. We found males had significantly larger home ranges (5–34 km2) than females (2–17 km2). Coupled with terrain derivatives and vegetation productivity, species distribution modelling was accurate and identified riparian zones with persistent vegetation cover as preferred habitat and topographically complex, rugged, hilly areas in the eastern parts of the study area as least preferred habitat. Trapping and baiting strategies are likely to benefit from focusing on these habitats as opposed to uniform control actions.

Author Contributions

Conceptualization, T.P.R., R.v.D. and S.D.W.; methodology, T.P.R. and S.D.W.; formal analysis and investigation, S.D.W., T.P.R. and L.T.; resources, T.P.R., R.v.D. and R.P.; data curation, R.P., S.D.W. and R.v.D.; writing—original draft preparation, S.D.W.; writing—review and editing, T.P.R., R.P. and R.v.D.; visualization, S.D.W., T.P.R. and L.T.; supervision, T.P.R. and R.v.D. All authors have read and agreed to the published version of the manuscript.

Funding

This study was undertaken as part of a Threatened Species Offset Plan funded by Rio Tinto.

Institutional Review Board Statement

The study was conducted according to the guidelines of the Declaration of Helsinki, and approved by the Animal Ethics Committee of the Department of Biodiversity, Conservation and Attractions (permits AEC 2015/16 and 2018/04).

Informed Consent Statement

Not applicable.

Data Availability Statement

Demographic and collaring data for individual cats available at https://doi.org/10.1371/journal.pone.0251304.s007 (accessed 17 July 2020).

Acknowledgments

We kindly thank the Robe River Kuruma (RRK) Traditional Owners for access to their traditional lands and the RRK rangers for their assistance in the field. Alicia Whittington was the primary organiser and tracker for the helicopter tracking sessions. Hannah Anderson, Neal Birch, Lucy Clausen, Jason Fletcher, Brooke Richards and Derek Sandow assisted with the trapping and ground tracking of feral cats.

Conflicts of Interest

The authors declare no conflict of interest. The funders had no role in the design of the study; in the collection, analyses, or interpretation of data; in the writing of the manuscript or in the decision to publish the results.

References

  1. Pimentel, D. (Ed.) Non-Native Invasive Species of Arthopods and Plant Pathogens in the British Isles. In Biological Invasions; CRC: Boca Raton, FL, USA, 2002; pp. 151–158. [Google Scholar]
  2. Hoffmann, B.; Broadhurst, L. The economic cost of managing invasive species in Australia. NeoBiota 2016, 31, 1–18. [Google Scholar] [CrossRef] [Green Version]
  3. Schartel, T.; Bayles, B.; Cooper, M.; Simmons, G.; Thomas, S.; Varela, L.; Daugherty, M. Reconstructing the European Grapevine Moth (Lepidoptera: Tortricidae), Invasion in California: Insights from a successful eradication. Ann. Entomol. Soc. Am. 2019, 112, 107–117. [Google Scholar] [CrossRef]
  4. Smart, A.; Tingley, R.; Phillips, B. Estimating the benefit of quarantine: Eradicating invasive cane toads from islands. NeoBiota 2020, 60, 117–136. [Google Scholar] [CrossRef]
  5. Fleming, P.; Ballard, G.; Reid, N.; Tracey, J. Invasive species and their impacts on agri-ecosystems: Issues and solutions for restoring ecosystem processes. Rangel. 2017, 39, 523–535. [Google Scholar] [CrossRef] [Green Version]
  6. Gause, G. The Struggle for Existence; Hafner: New York, NY, USA, 1934. [Google Scholar]
  7. Loss, S.R.; Marra, P.P. Population impacts of free-ranging domestic cats on mainland vertebrates. Front. Ecol. Environm. 2017, 15, 502–509. [Google Scholar] [CrossRef]
  8. Bengsen, A.; Algar, D.; Ballard, G.; Buckmaster, T.; Comer, S.; Fleming, P.; Friend, J.A.; Johnston, M.; McGregor, H.; Moseby, K.; et al. Feral cat home-range size varies predictably with landscape productivity and population density. J. Zool. 2016, 298, 112–120. [Google Scholar] [CrossRef]
  9. McGranahan, D.; Geaumont, B.; Spiess, W. Assessment of a livestock GPS collar based on an open-source datalogger informs best practices for logging intensity. Ecol. Evol. 2018, 8, 5649–5660. [Google Scholar] [CrossRef] [PubMed]
  10. Burt, W.H. Territoriality and Home Range Concepts as Applied to Mammals. J. Mammal. 1943, 24, 346–352. [Google Scholar] [CrossRef]
  11. Kranstauber, B. Modelling animal movement as Brownian bridges with covariates. Mov. Ecol. 2019, 7, 22. [Google Scholar] [CrossRef] [Green Version]
  12. Fleming, C.; Calabrese, J. A new kernel density estimator for accurate home-range and species-range area estimation. Methods Ecol. Evol. 2017, 8, 571–579. [Google Scholar] [CrossRef]
  13. Robley, A.; Reddiex, B.; Arthur, A.; Pech, R.; Forsyth, D. Interactions Between Feral Cats, Foxes, Native Carnivores, and Rabbits in Australia; Department of the Environment and Heritage: Canberra, Australia, 2004. [Google Scholar]
  14. Guisan, A.; Zimmerman, N. Predictive habitat distribution models in ecology. Ecol. Modell. 2000, 135, 147–186. [Google Scholar] [CrossRef]
  15. Guisan, A.; Tingley, R.; Baumgartner, J.; Naujokaitis-Lewis, I.; Sutcliffe, P.; Tulloch, A.; Regan, T.; Brotons, L.; McDonald-Madden, E.; Mantyka-Pringle, C. Predicting species distributions for conservation decisions. Ecol. Lett. 2013, 16, 1424–1435. [Google Scholar] [CrossRef]
  16. Rocchini, D.; Andreo, V.; Förster, M.; Garzon-Lopez, C.; Gutierrez, A.; Gillespie, T.; Hauffe, H.; He, K.; Kleinschmidt, B.; Mairota, P. Potential of remote sensing to predict species invasions: A modelling perspective. Prog. Phys. Geogr. 2015, 39, 283–309. [Google Scholar] [CrossRef] [Green Version]
  17. Legge, S.; Murphy, B.; McGregor, H.; Woinarski, J.; Augusteyn, J.; Ballard, G.; Baseler, M.; Buckmaster, T.; Dickman, C.; Doherty, T.; et al. Enumerating a continental-scale threat: How many feral cats are in Australia? Biol. Conserv. 2017, 206, 293–303. [Google Scholar] [CrossRef]
  18. Woinarski, J.C.; Legge, S.M.; Dickman, C.R. Cats in Australia: Companion and Killer; CSIRO Publishing: Clayton, Australia, 2019. [Google Scholar]
  19. Woinarski, J.; Burbidge, A.; Harrison, P. The Action Plan for Australian Mammals 2012; Commonwealth Scientific and Industrial Research Organisation Publising (CSIRO Publishing): Clayton, Australia, 2014. [Google Scholar]
  20. Lohr, C.A.; Algar, D. Managing feral cats through an adaptive framework in an arid landscape. Sci. Total. Environ. 2020, 720, 137631. [Google Scholar] [CrossRef]
  21. Palmer, R.; Anderson, H.; Richards, B.; Craig, M.D.; Gibson, L. Does aerial baiting for controlling feral cats in a heterogeneous landscape confer benefits to a threatened native meso-predator? PLoS ONE 2021, 16, e0251304. [Google Scholar] [CrossRef] [PubMed]
  22. McKenzie, N.; Burbidge, A.; Baynes, A.; Brereton, R.; Dickman, C.; Gordon, G.; Gibson, L.A.; Menkhorst, P.W.; Robinson, A.C.; Williams, M.R.; et al. Analysis of factors implicated in the recent decline of Australia’s mammal fauna. J. Biogeogr. 2007, 34, 597–611. [Google Scholar] [CrossRef]
  23. Carwardine, J.; Nicol, S.; van Leeuwen, S.; Walters, B.; Firn, J.; Reeson, A.; Martin, T.G.; Chadés, I. Priority Threat Management for Pilbara Species of Conservation Significance; CSIRO Ecosystems Sciences: Brisbane, Australia, 2014. [Google Scholar]
  24. Martin, G.R.; Twigg, L.E.; Robinson, D.J. Comparison of the diet of feral cats from rural and pastoral Western Australia. Wildl. Res. 1996, 23, 475–484. [Google Scholar] [CrossRef]
  25. Thackway, R.; Cresswell, I. An Interim Biogeographical Regionalisation for Australia; Australian Nature Conservation Agency: Canberra, Australia, 1995.
  26. Van Vreeswyk, A.; Leighton, K.; Payne, A.; Hennig, P. An Inventory and Condition Survey of the Pilbara Region, Western Australia; Technical Bulletin 92; Department of Agriculture and Food: Perth, Australia, 2004. [Google Scholar]
  27. Gallant, J.; Wilson, N.; Dowling, T.; Read, A.; Inskeep, C. SRTM-Derived 1 Second Digital Elevation Models Version 1.0.; Record 1; Geoscience Australia: Canberra, Australia, 2011. [Google Scholar]
  28. Conrad, O.; Bechtel, B.; Bock, M.; Dietrich, H.; Fischer, E.; Gerlitz, L.; Wehberg, J.; Wichmann, V.; Böhner, J. System for automated geoscientific analyses (SAGA) v. 2.1.4. Geosci. Model Dev. Discuss. 2015, 8, 1991–2007. [Google Scholar] [CrossRef] [Green Version]
  29. Zhu, G.; Ju, W.; Chen, J.; Liu, Y. A Novel Moisture Adjusted Vegetation Index (MAVI) to reduce background reflectance and topographical effects on LAI retrieval. PLoS ONE 2014, 9, e102560. [Google Scholar] [CrossRef] [Green Version]
  30. Van Leeuwen, W.J.; Davison, J.E.; Casady, G.M.; Marsh, S.E. Phenological characterization of desert sky island vegetation communities with remotely sensed and climate time series data. Remote Sens. 2010, 2, 388–415. [Google Scholar] [CrossRef] [Green Version]
  31. Department Biodiversity, Conservation and Attractions. Yarraloola Annual Desktop Fire Regime Monitoring: 2019; Department of Biodiversity, Conservation and Attractions: Perth, Australia, 2020. [Google Scholar]
  32. Byrne, M.; McCoy, J.; Hinton, J.; Chamberlain, M.; Collier, B.A. Using dynamic Brownian bridge movement modelling to measure temporal patterns of habitat selection. J. Anim. Ecol. 2014, 83, 1234–1243. [Google Scholar] [CrossRef]
  33. Kranstauber, B.; Kays, R.; LaPoint, S.D.; Wikelski, M.; Safi, K. A dynamic Brownian bridge movement model to estimate utilization distributions for heterogeneous animal movement. J. Anim. Ecol. 2012, 81, 738–746. [Google Scholar] [CrossRef]
  34. Kranstauber, B.; Smolla, M.; Scharf, A.K. Move: Visualizing and Analyzing Animal Track Data. R Package Version 4.0.4. 2020. Available online: https://cran.r-project.org/web/packages/move/move.pdf (accessed on 17 July 2020).
  35. Clark, J.; Wang, Y.; August, P. Assessing current and projected suitable habitats for tree-of-heaven along the Appalachian Trail. Philos. Trans. R. Soc. B Biol. Sci. 2014, 369, 20130192. [Google Scholar] [CrossRef] [PubMed] [Green Version]
  36. Baldwin, R. Use of Maximum Entropy Modeling in Wildlife Research. Entropy 2009, 11, 854–866. [Google Scholar] [CrossRef]
  37. Robinson, T.; van Klinken, R.; Metternicht, G. Comparison of alternative strategies for invasive species distribution modeling. Ecol. Modell. 2010, 221, 2261–2269. [Google Scholar] [CrossRef] [Green Version]
  38. West, A.; Kumar, S.; Brown, C.; Stohlgren, T.; Bromberg, J. Field validation of an invasive species Maxent model. Ecol. Inform. 2016, 36, 126–134. [Google Scholar] [CrossRef] [Green Version]
  39. Phillips, S. A Brief Tutorial on Maxent. 2017. Available online: https://biodiversityinformatics.amnh.org/open_source/maxent/Maxent_tutorial2017.pdf (accessed on 16 June 2020).
  40. Fielding, A.; Bell, J. A review of methods for the assessment of prediction errors in conservation presence/absence models. Environ. Conserv. 1997, 24, 38–49. [Google Scholar] [CrossRef]
  41. Warren, D.; Seifert, S. Ecological niche modeling in Maxent: The importance of model complexity and the performance of model selection criteria. Ecol. Appl. 2011, 21, 335–342. [Google Scholar] [CrossRef] [Green Version]
  42. Kays, R.; Dunn, R.R.; Parsons, A.W.; Mcdonald, B.; Perkins, T.; Powers, S.A.; Shell, L.; McDonald, J.L.; Cole, H.; Kikillus, H.; et al. The small home ranges and large local ecological impacts of pet cats. Anim. Conserv. 2020, 23, 516–523. [Google Scholar] [CrossRef]
  43. Spotte, S. Free-Ranging Cats: Behavior, Ecology, Management; John Wiley & Sons: Chicester, UK, 2014. [Google Scholar]
  44. McGregor, H.; Cliff, H.; Kanowski, J. Habitat preference for fire scars by feral cats in Cape York Peninsula, Australia. Wildl. Res. 2016, 43, 623–633. [Google Scholar] [CrossRef]
  45. Stobo-Wilson, A.; Stokeld, D.; Einoder, L.; Davies, H.; Fisher, A.; Hill, B.M.; Mahney, T.; Murphy, B.P.; Stevens, A.; Woinarksi, C.Z.; et al. Habitat structural complexity explains patterns of feral cat and dingo occurrence in monsoonal Australia. Divers. Distrib. 2020, 26, 832–842. [Google Scholar] [CrossRef]
  46. Moseby, K.; Stott, J.; Crisp, H. Movement patterns of feral predators in an arid environment–implications for control through poison baiting. Wildl. Res. 2009, 36, 422–435. [Google Scholar] [CrossRef]
  47. Fancourt, B.A.; Cremasco, P.; Wilson, C.; Gentle, M.N. Do introduced apex predators suppress introduced mesopredators? A multiscale spatiotemporal study of dingoes and feral cats in Australia suggests not. J. Appl. Ecol. 2019, 56, 2584–2595. [Google Scholar] [CrossRef]
  48. Hohnen, R.; Tuft, K.; McGregor, H.; Legge, S.; Radford, I.; Johnson, C. Occupancy of the invasive feral cat varies with habitat complexity. PLoS ONE 2016, 11, e0152520. [Google Scholar] [CrossRef] [PubMed] [Green Version]
  49. Hernandez-Santin, L.; Goldizen, A.W.; Fisher, D.O. Introduced predators and habitat structure influence range contraction of an endangered native predator, the northern quoll. Biol. Cons. 2016, 203, 160–167. [Google Scholar] [CrossRef]
  50. Moore, H.A.; Michael, D.R.; Ritchie, E.G.; Dunlop, J.A.; Valentine, L.E.; Hobbs, R.J.; Nimmo, D.G. A rocky heart in a spinifex sea: Occurrence of an endangered marsupial predator is multiscale dependent in naturally fragmented landscapes. Landsc. Ecol. 2021, 36, 1359–1376. [Google Scholar] [CrossRef]
  51. Recio, M.; Seddon, P.; Moore, A. Niche and movement models identify corridors of introduced feral cats infringing ecologically sensitive areas in New Zealand. Biol. Conserv. 2015, 192, 48–56. [Google Scholar] [CrossRef]
  52. McGregor, H.; Legge, S.; Jones, M.; Johnson, C. Feral cats are better killers in open habitats, revealed by animal-borne video. PLoS ONE 2015, 10, e0133915. [Google Scholar] [CrossRef] [Green Version]
  53. Comer, S.; Speldewinde, P.; Tiller, C.; Clausen, L.; Pinder, J.; Cowen, S.; Algar, D. Evaluating the efficacy of a landscape scale feral cat control program using camera traps and occupancy models. Sci. Rep. 2018, 8, 5335. [Google Scholar] [CrossRef] [Green Version]
  54. Allsop, S.E.; Dundas, S.J.; Adams, P.J.; Kreplins, T.L.; Bateman, P.W.; Fleming, P.A. Reduced efficacy of baiting programs for invasive species: Some mechanisms and management implications. Pac. Conserv. Biol. 2017, 23, 240–257. [Google Scholar] [CrossRef] [Green Version]
Figure 1. Location of the study site (Yarraloola station) located in the northwest Pilbara Bioregion of Western Australia. Tracking data of fifteen collared cats are shown as coloured pins. Identification numbers are centroids of the tracking data per cat. YF and YM are prefixes denoting female (F) and male (M) cats, respectively, on Yarraloola (Y) station. Demographic and collaring data for individual cats can be seen at https://doi.org/10.1371/journal.pone.0251304.s007 (accessed 17 July 2020).
Remotesensing 13 04925 g001
Figure 2. Images of the spatial data sets explored as potential correlates for species distribution modelling. (A) Valley depth, (B) Terrain ruggedness index (TRI), (C) large integral of the moisture adjusted vegetation index (LI-MAVI; see text), and (D) the year of the most recent fire.
Remotesensing 13 04925 g002
Figure 3. Examples of the dynamic Brownian Bridge movement modelling results converted to contours of utilisation distribution at 95% (black polygons) and 50% (red polygons) for (A) Female cat with id: YF06 and (B) Male cat with id: YM02. Points within the 50% utilisation contour were used for further analysis after rarefication.
Remotesensing 13 04925 g003
Figure 4. Species distribution model showing the preferred habitat locations of feral cats in the study area produced using the Maximum entropy method.
Remotesensing 13 04925 g004
Figure 5. Response curves characterising the relationship between probability of occurrence for each variable. Curves represent a single MaxEnt model created using only one of each of the four variables: (A) Valley depth, (B) terrain ruggedness (TRI), (C), the large integral of the moisture adjusted vegetation index (LI-MAVI) over 2019 and (D) time since fire.
Remotesensing 13 04925 g005
Table 1. Estimated areas for the 50% and 95 % predicted home ranges, calculated using the dynamic Brownian Bridge Movement Model for all the cats with tracking collars at the study site.
Cat IDSexBody Mass (g)Area of Estimated Home Range (km2)
50%95%
YF02 Remotesensing 13 04925 i00117000.593.91
YF03 Remotesensing 13 04925 i00133906.4146.55
YF04 Remotesensing 13 04925 i00131201.6125.81
YF05 Remotesensing 13 04925 i00126301.537.83
YF06 Remotesensing 13 04925 i00129302.047.85
YF07 Remotesensing 13 04925 i00140401.087.98
YM02 Remotesensing 13 04925 i00241705.6325.70
YM03 Remotesensing 13 04925 i002420013.0769.79
YM04 Remotesensing 13 04925 i00250003.6927.91
YM05 Remotesensing 13 04925 i00220500.758.63
YM06 Remotesensing 13 04925 i002463010.6247.21
YM08 Remotesensing 13 04925 i00230805.9966.01
YM09 Remotesensing 13 04925 i00244002.4715.99
YM10 Remotesensing 13 04925 i00240752.1011.04
YM11 Remotesensing 13 04925 i00245354.2737.64
Mean 4.1227.32
Median 2.4725.70
Std Dev 3.6921.72
Table 2. The permutation importance of the environmental variables used in MaxEnt modelling.
Spatial LayerVariable Importance (%)
Model 1Model 2Model 3Model 4
Valley depth47.050.153.0100
Ruggedness36.138.747.0
Time since fire10.311.2
LI-MAVI6.6
AUC0.900.880.850.74
AICc23,26023,55723,59924,778
Publisher’s Note: MDPI stays neutral with regard to jurisdictional claims in published maps and institutional affiliations.

