
A Novel Method for Layover Detection in Mountainous Areas with SAR Images


Abstract
:
1. Introduction
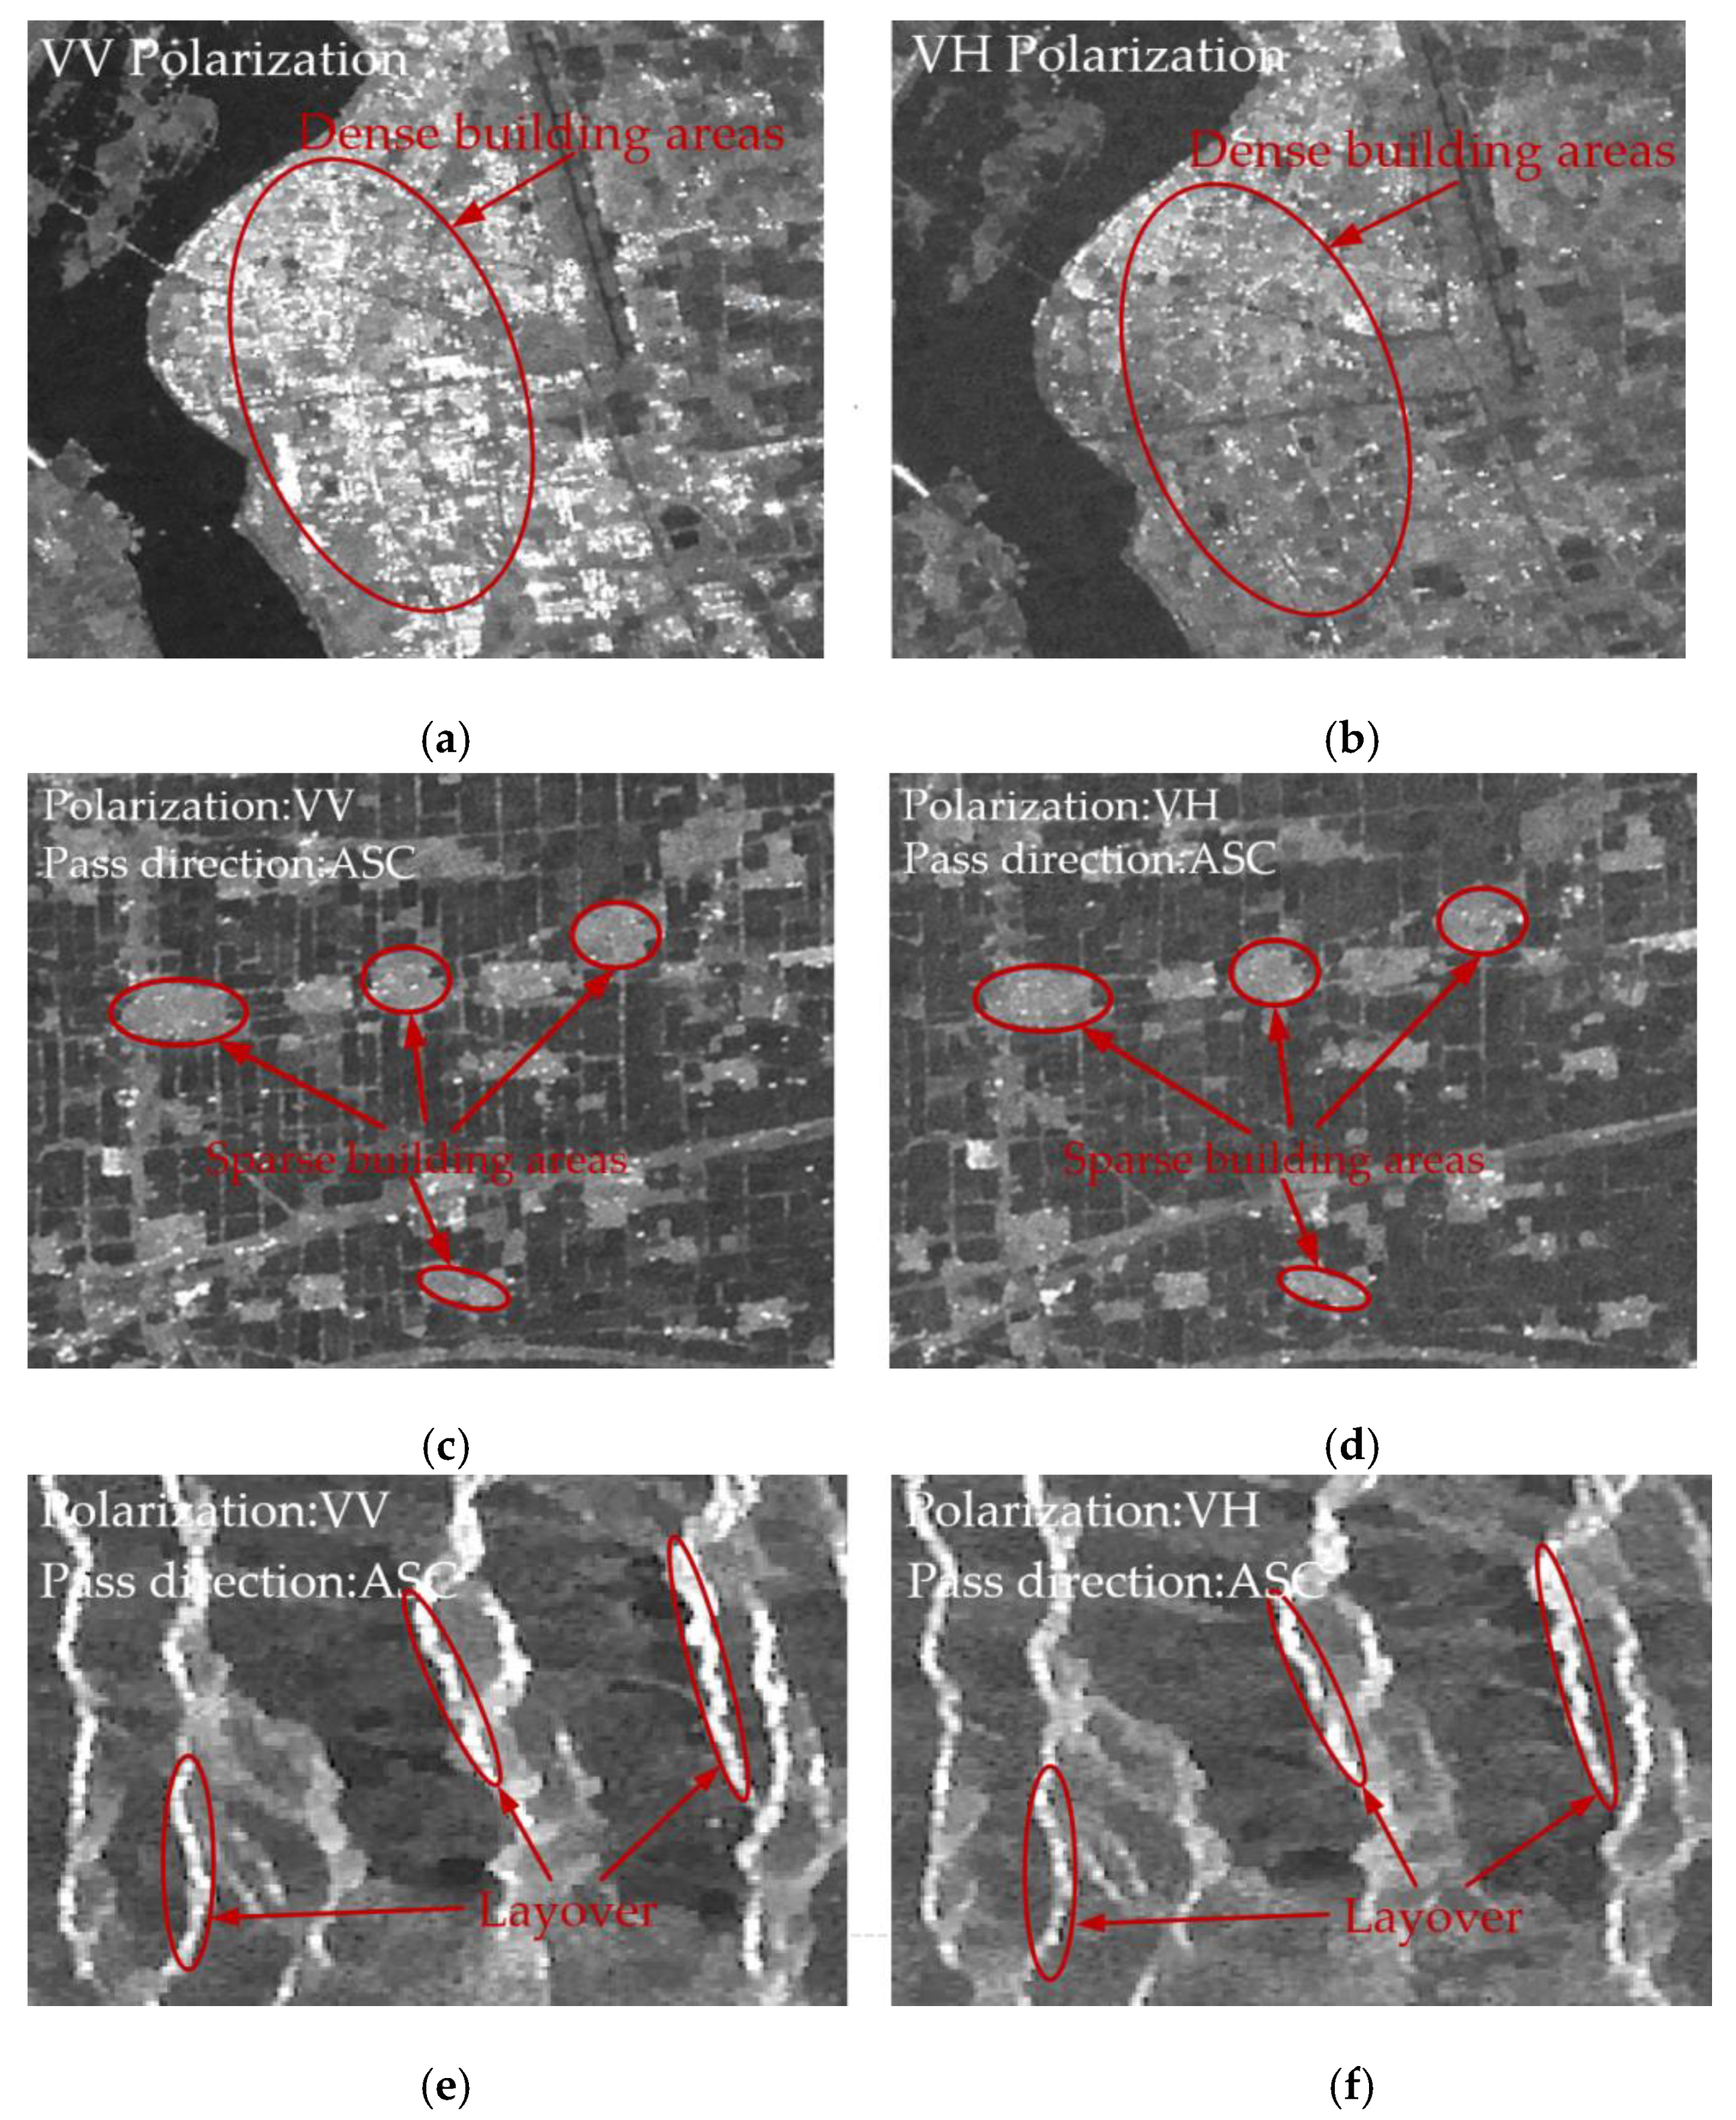
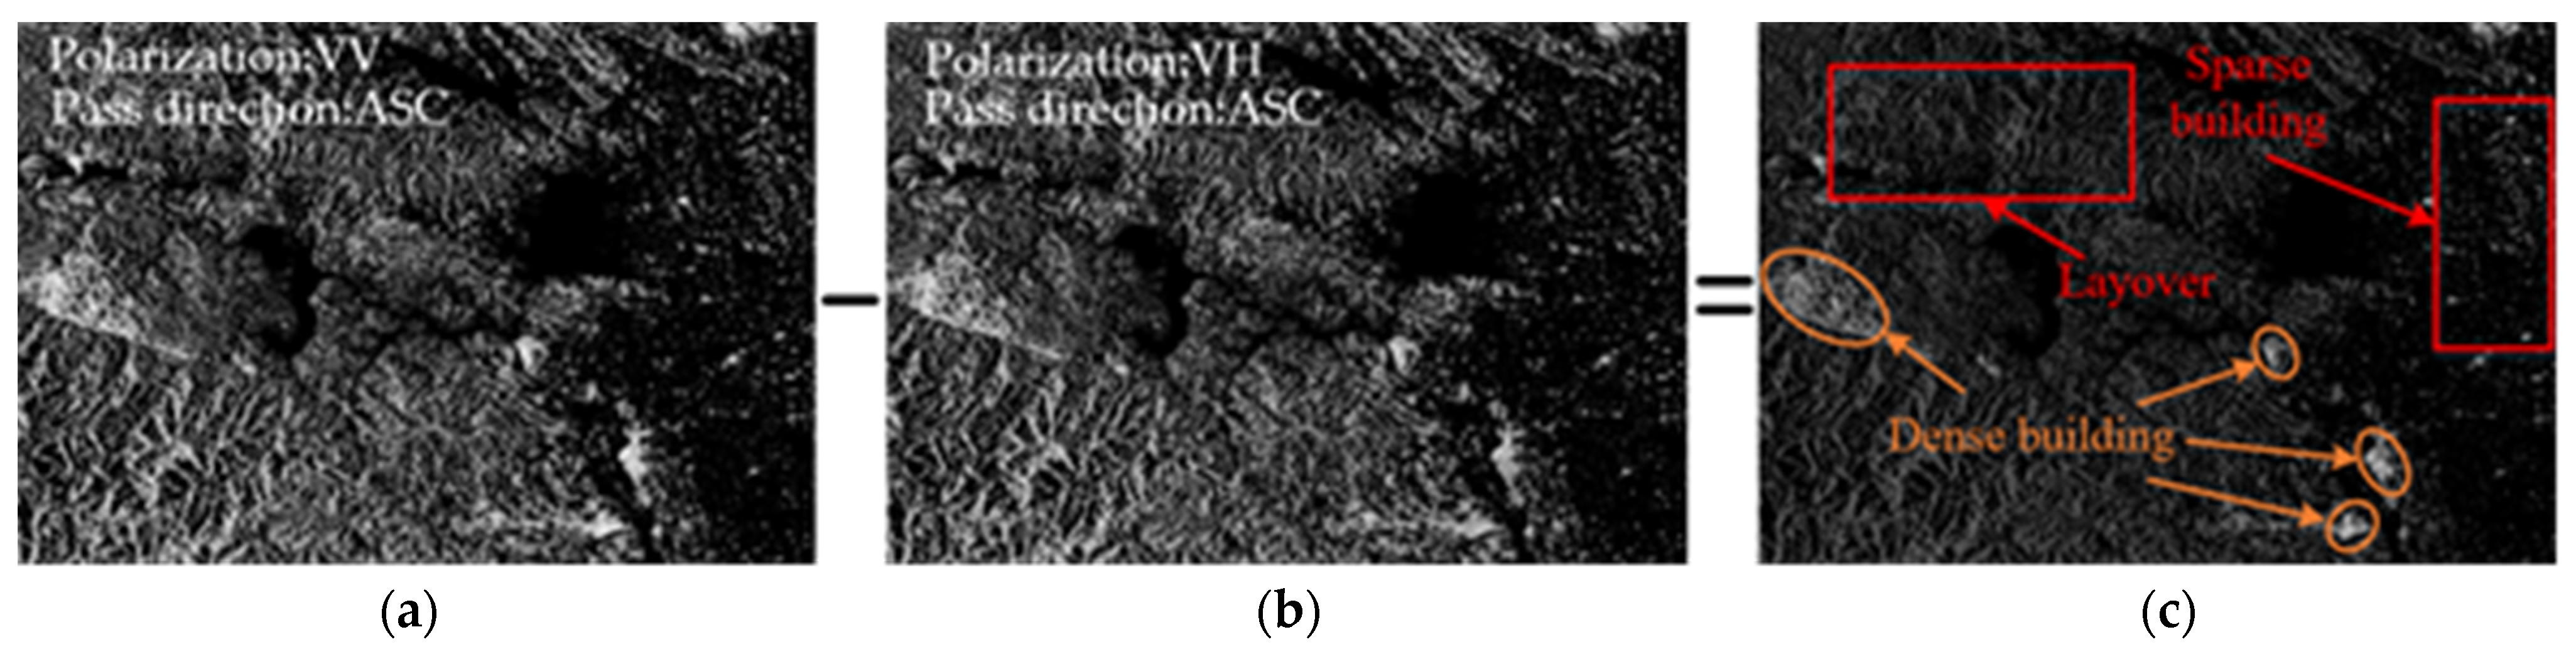
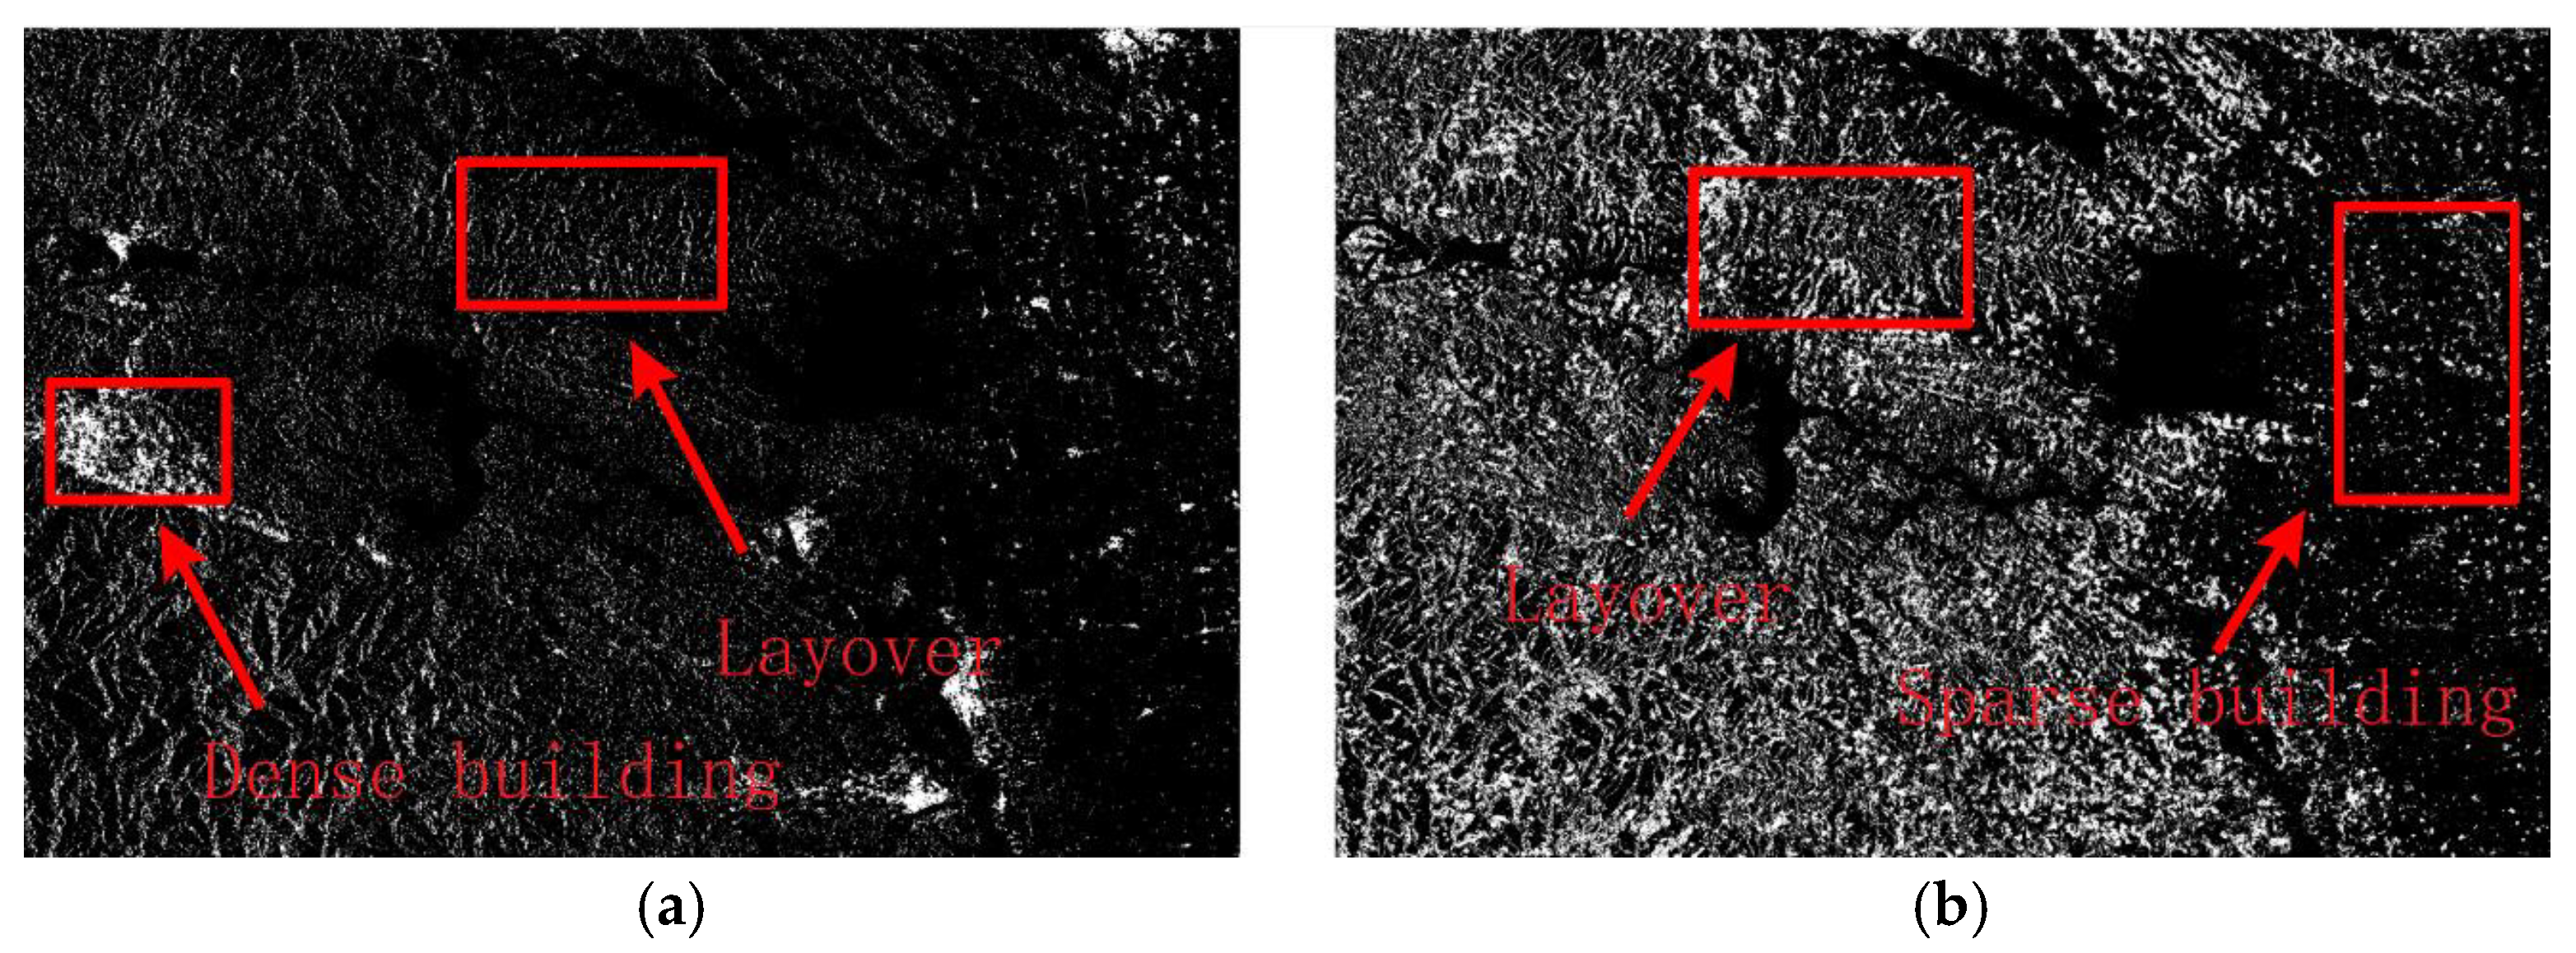
- Layover can be distinguished from built-up areas by a BC difference between the VV and VH images, although they are visually similar.
- A medium-resolution SAR image can do well in layover detection. Thus, some research can remove the dependence on a high-resolution image, especially in the absence of it.
2. Geometry Model and BC Analysis in Mountainous Areas
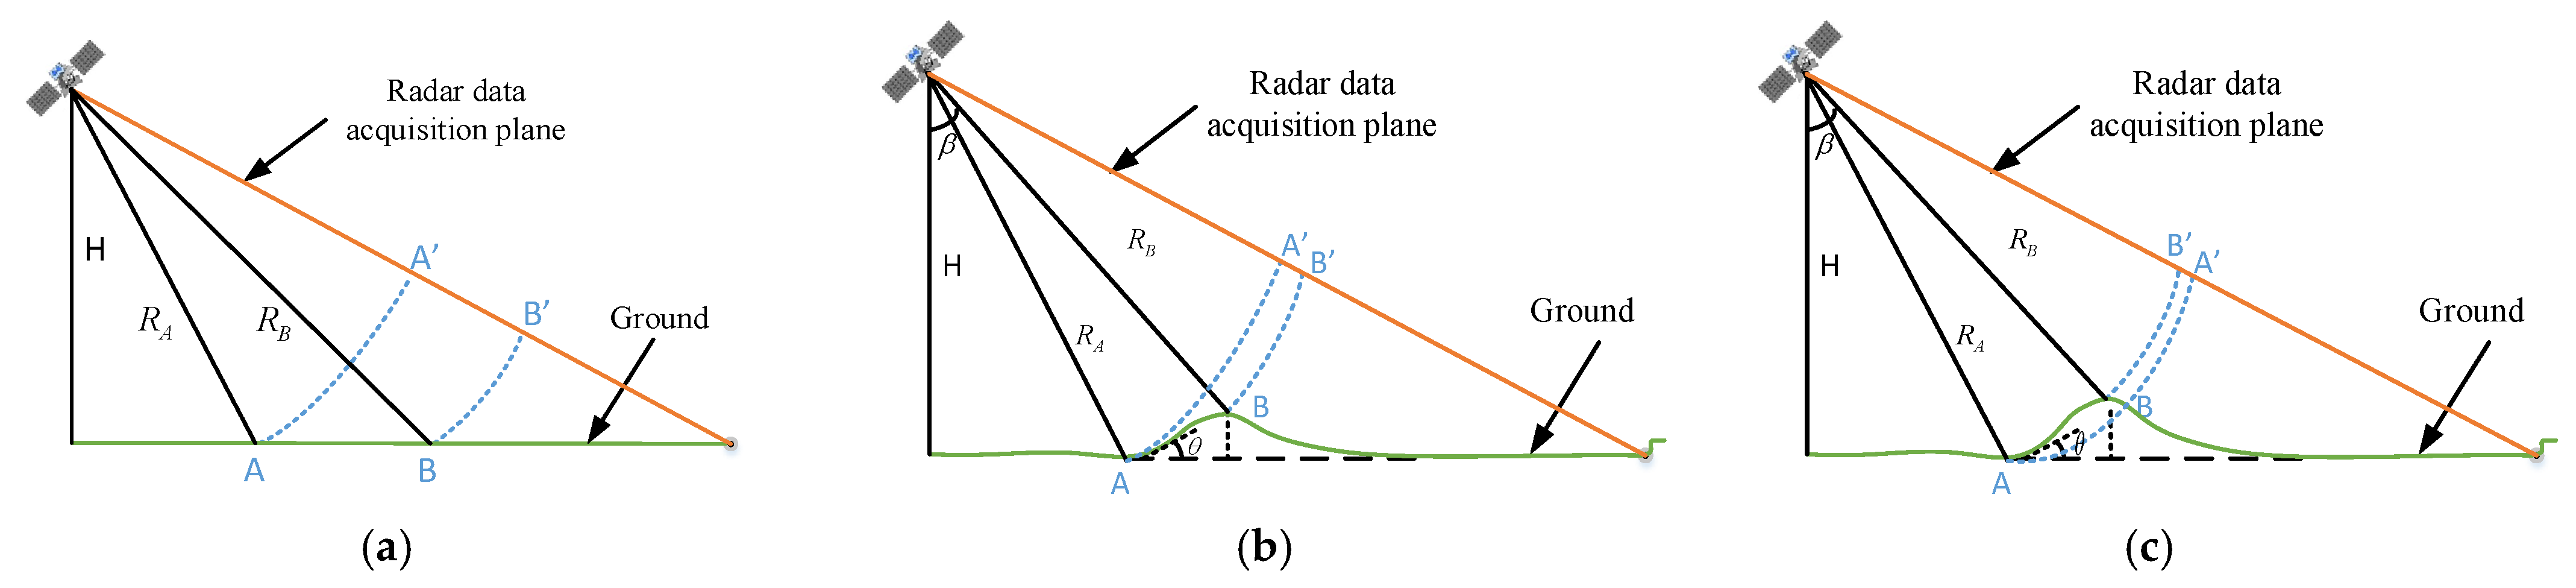
2.1. Geometry Model
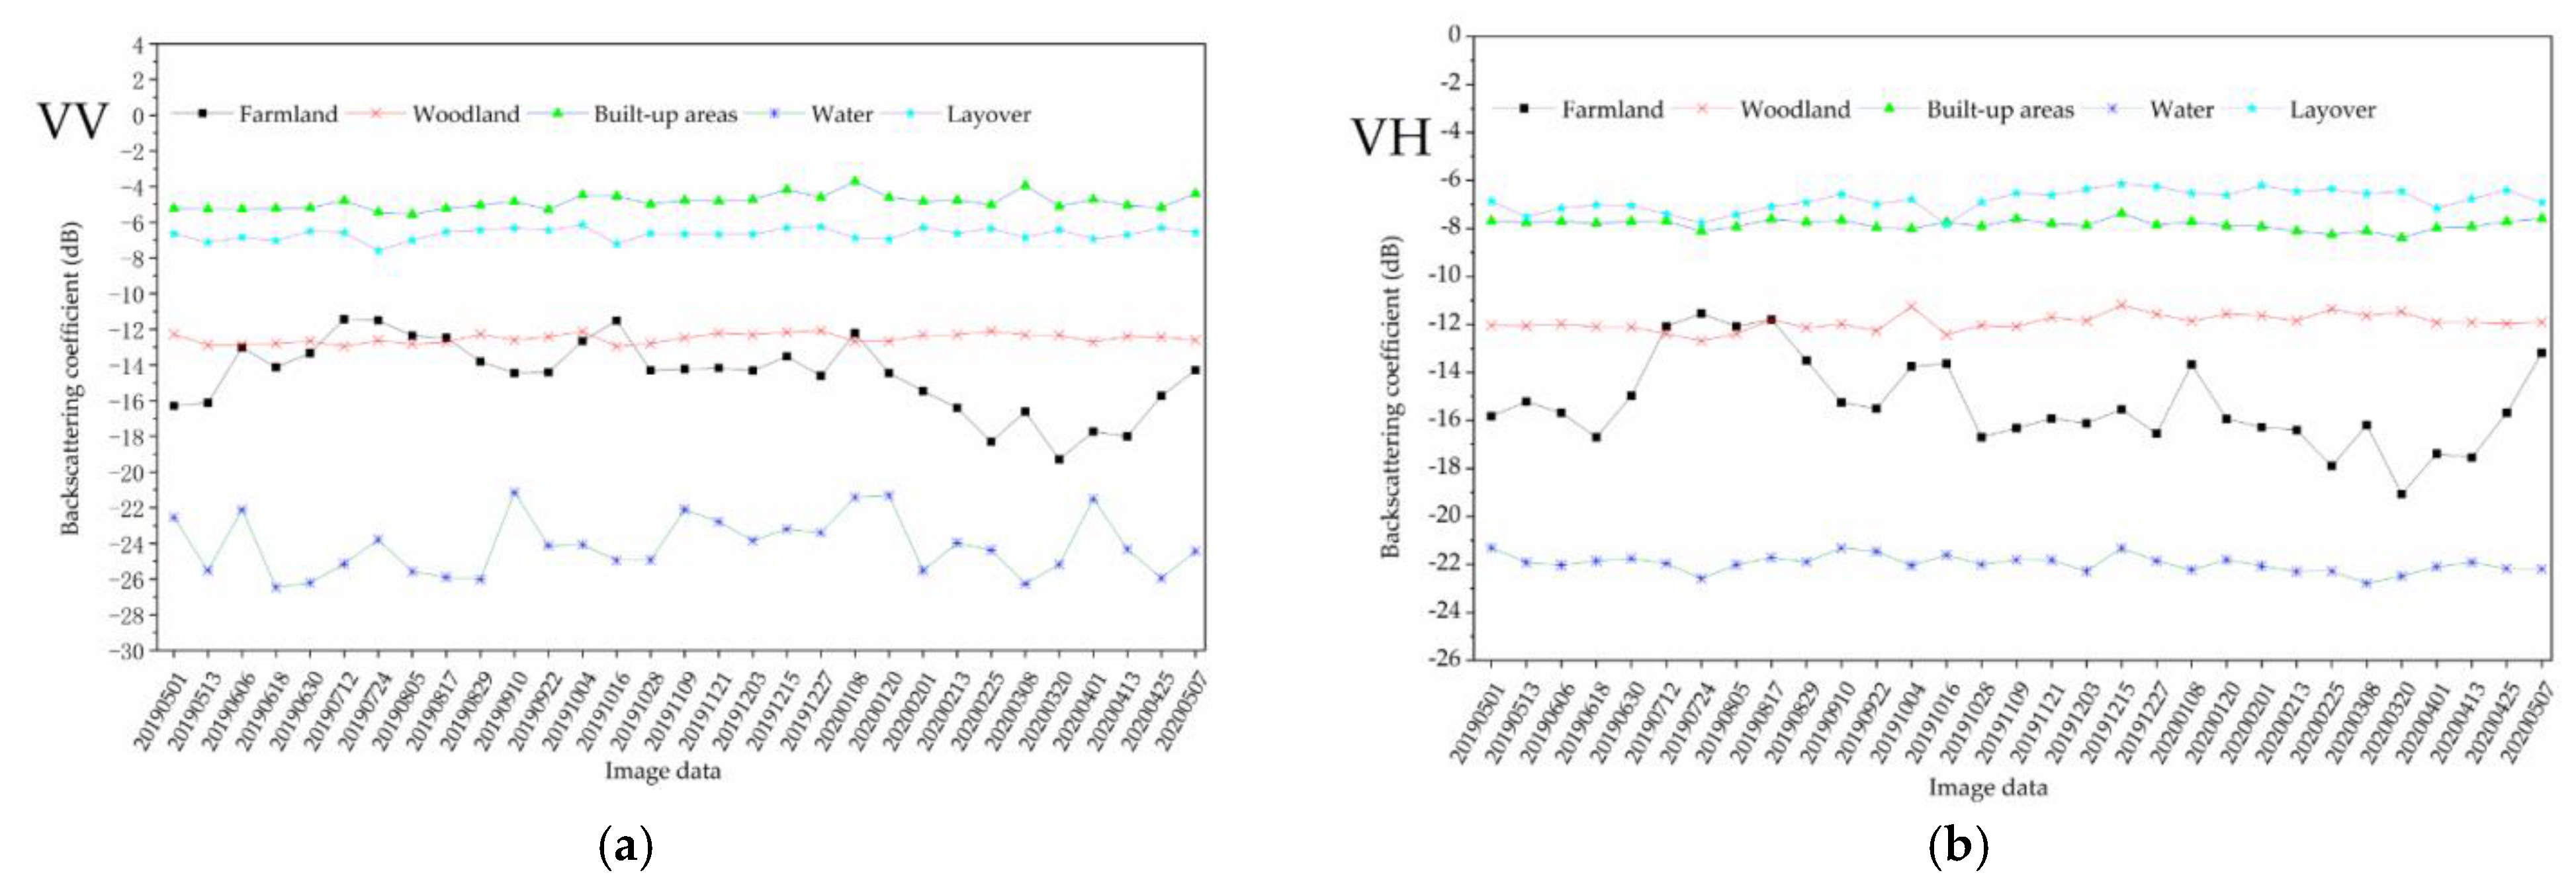
2.2. BC Analysis
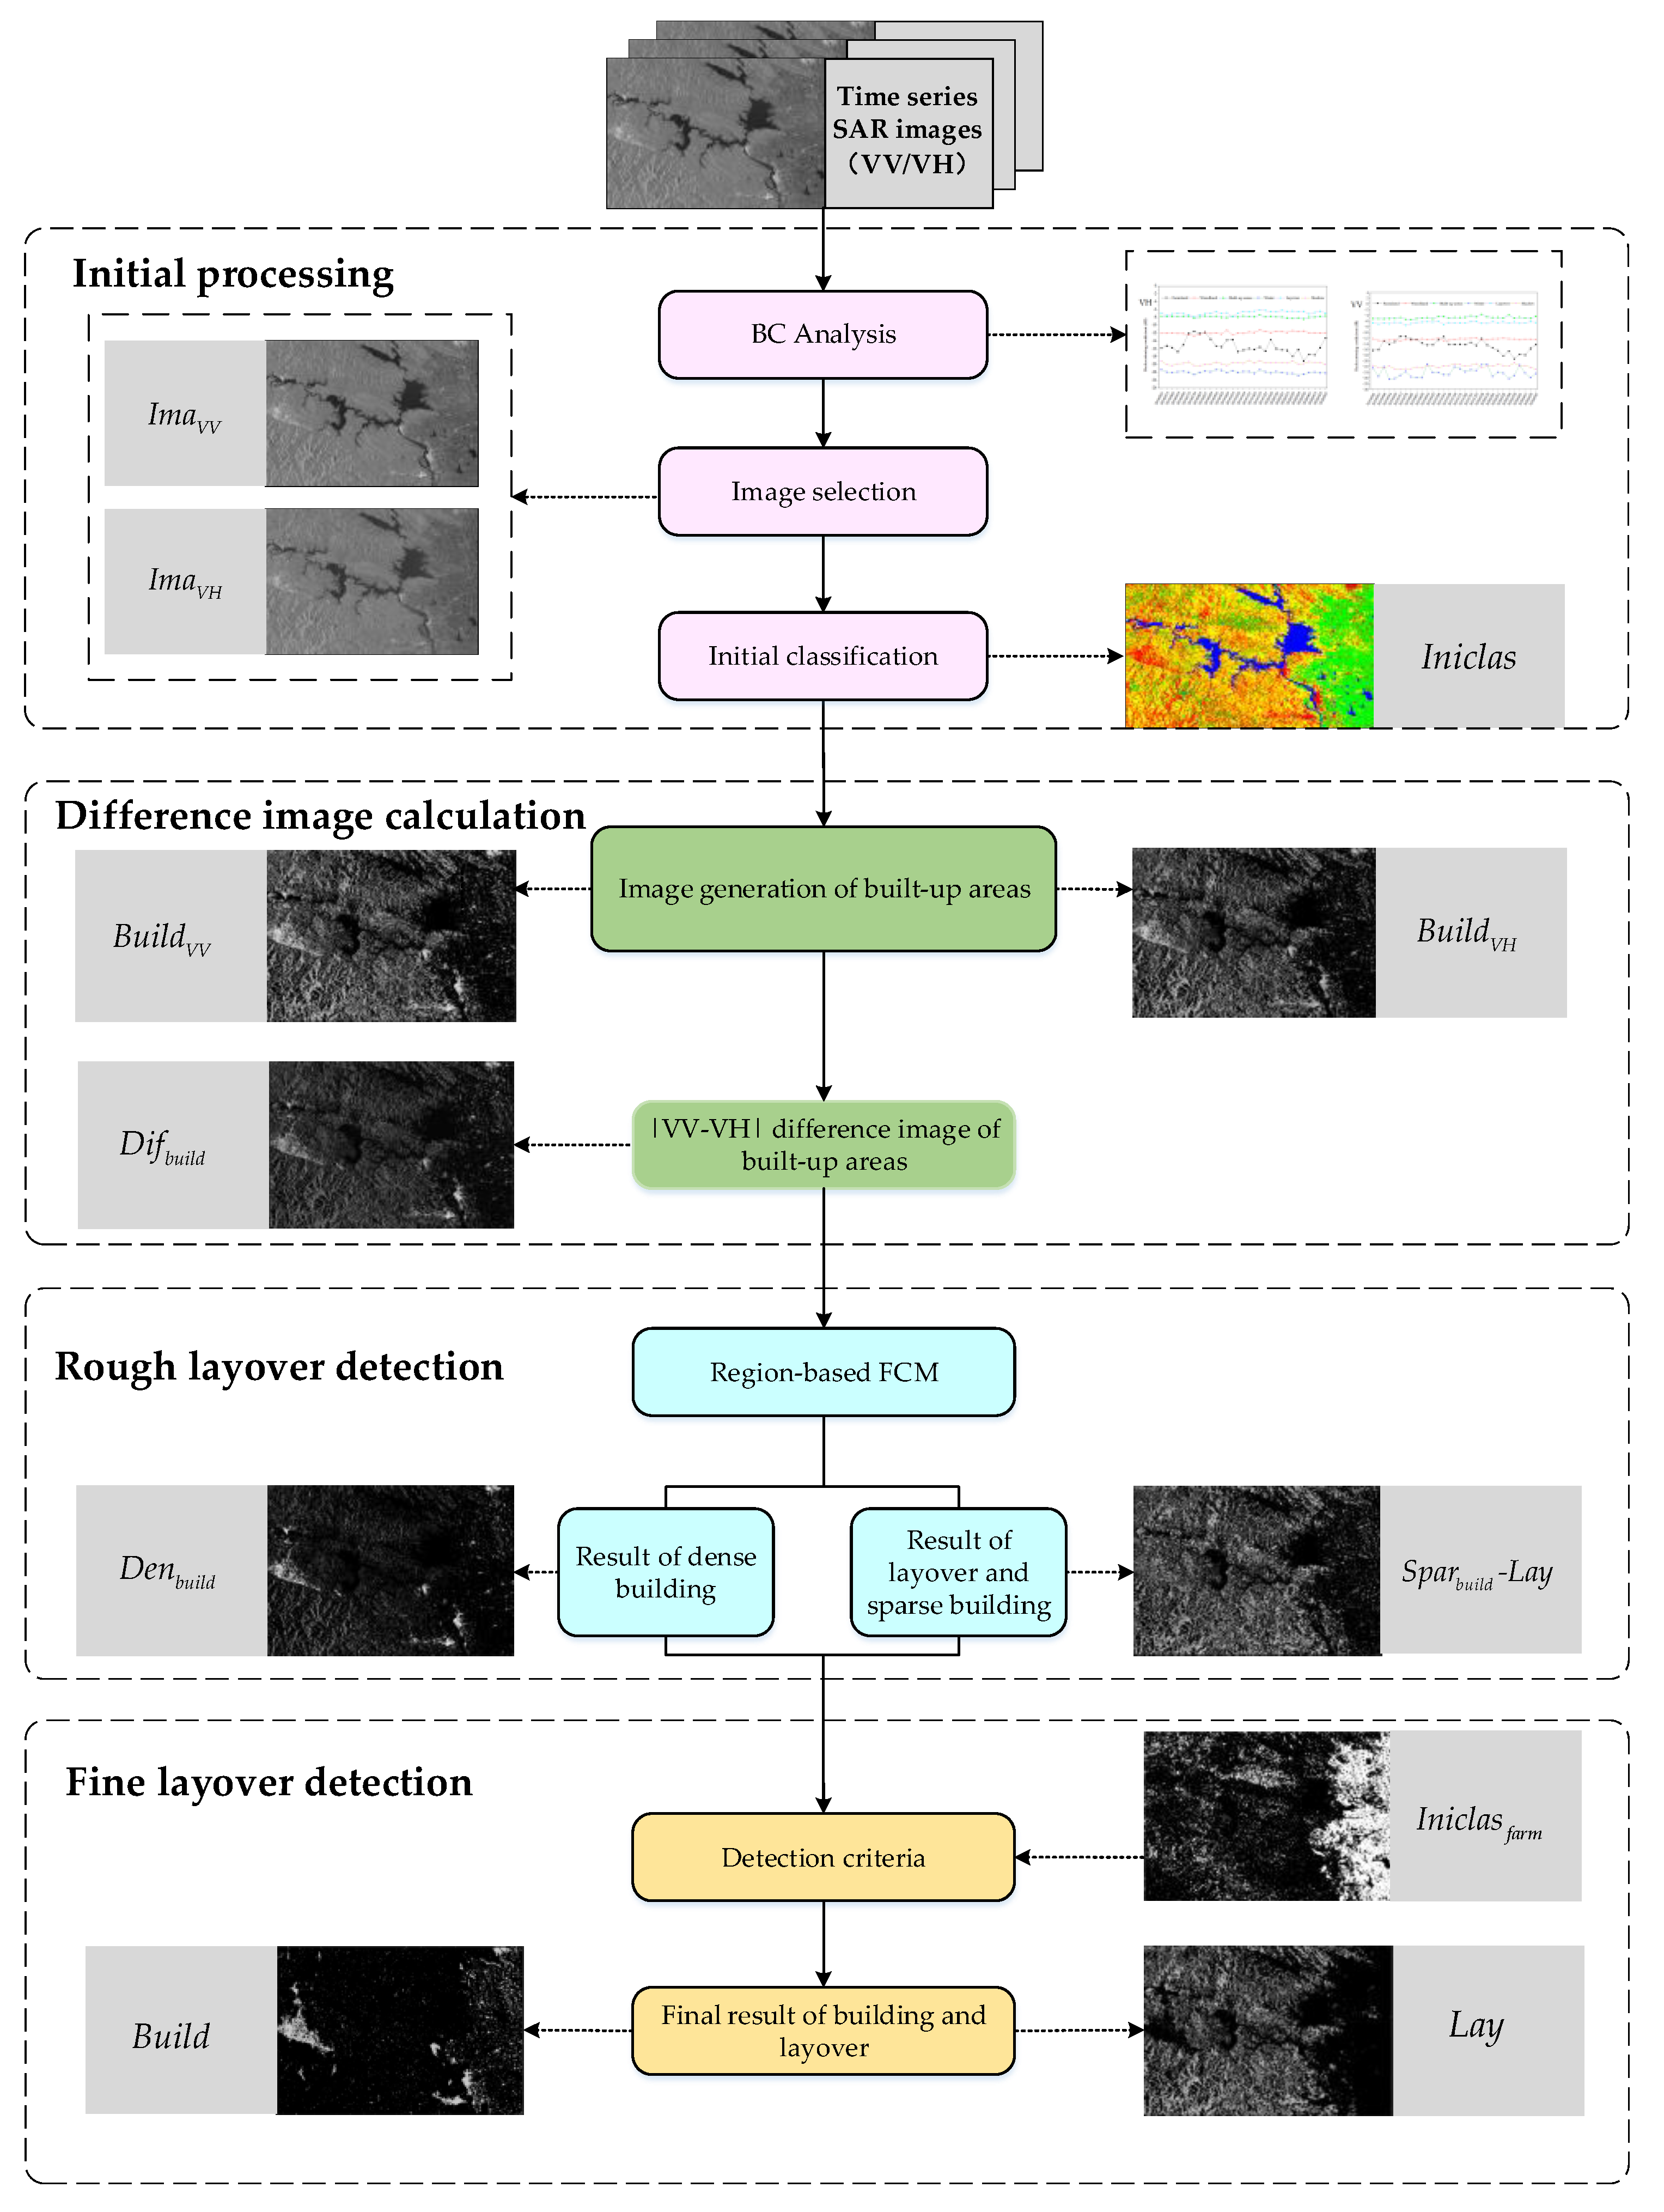
3. Proposed Method for Layover Detection
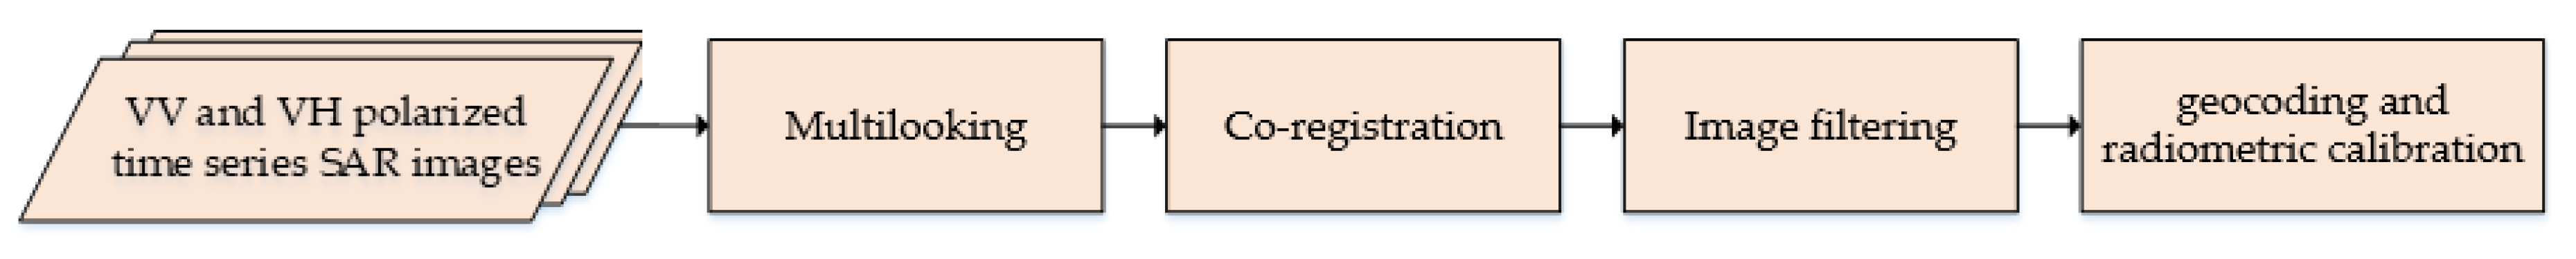
3.1. Initial Processing
3.2. Difference Image Calculation
3.3. Rough Layover Detection
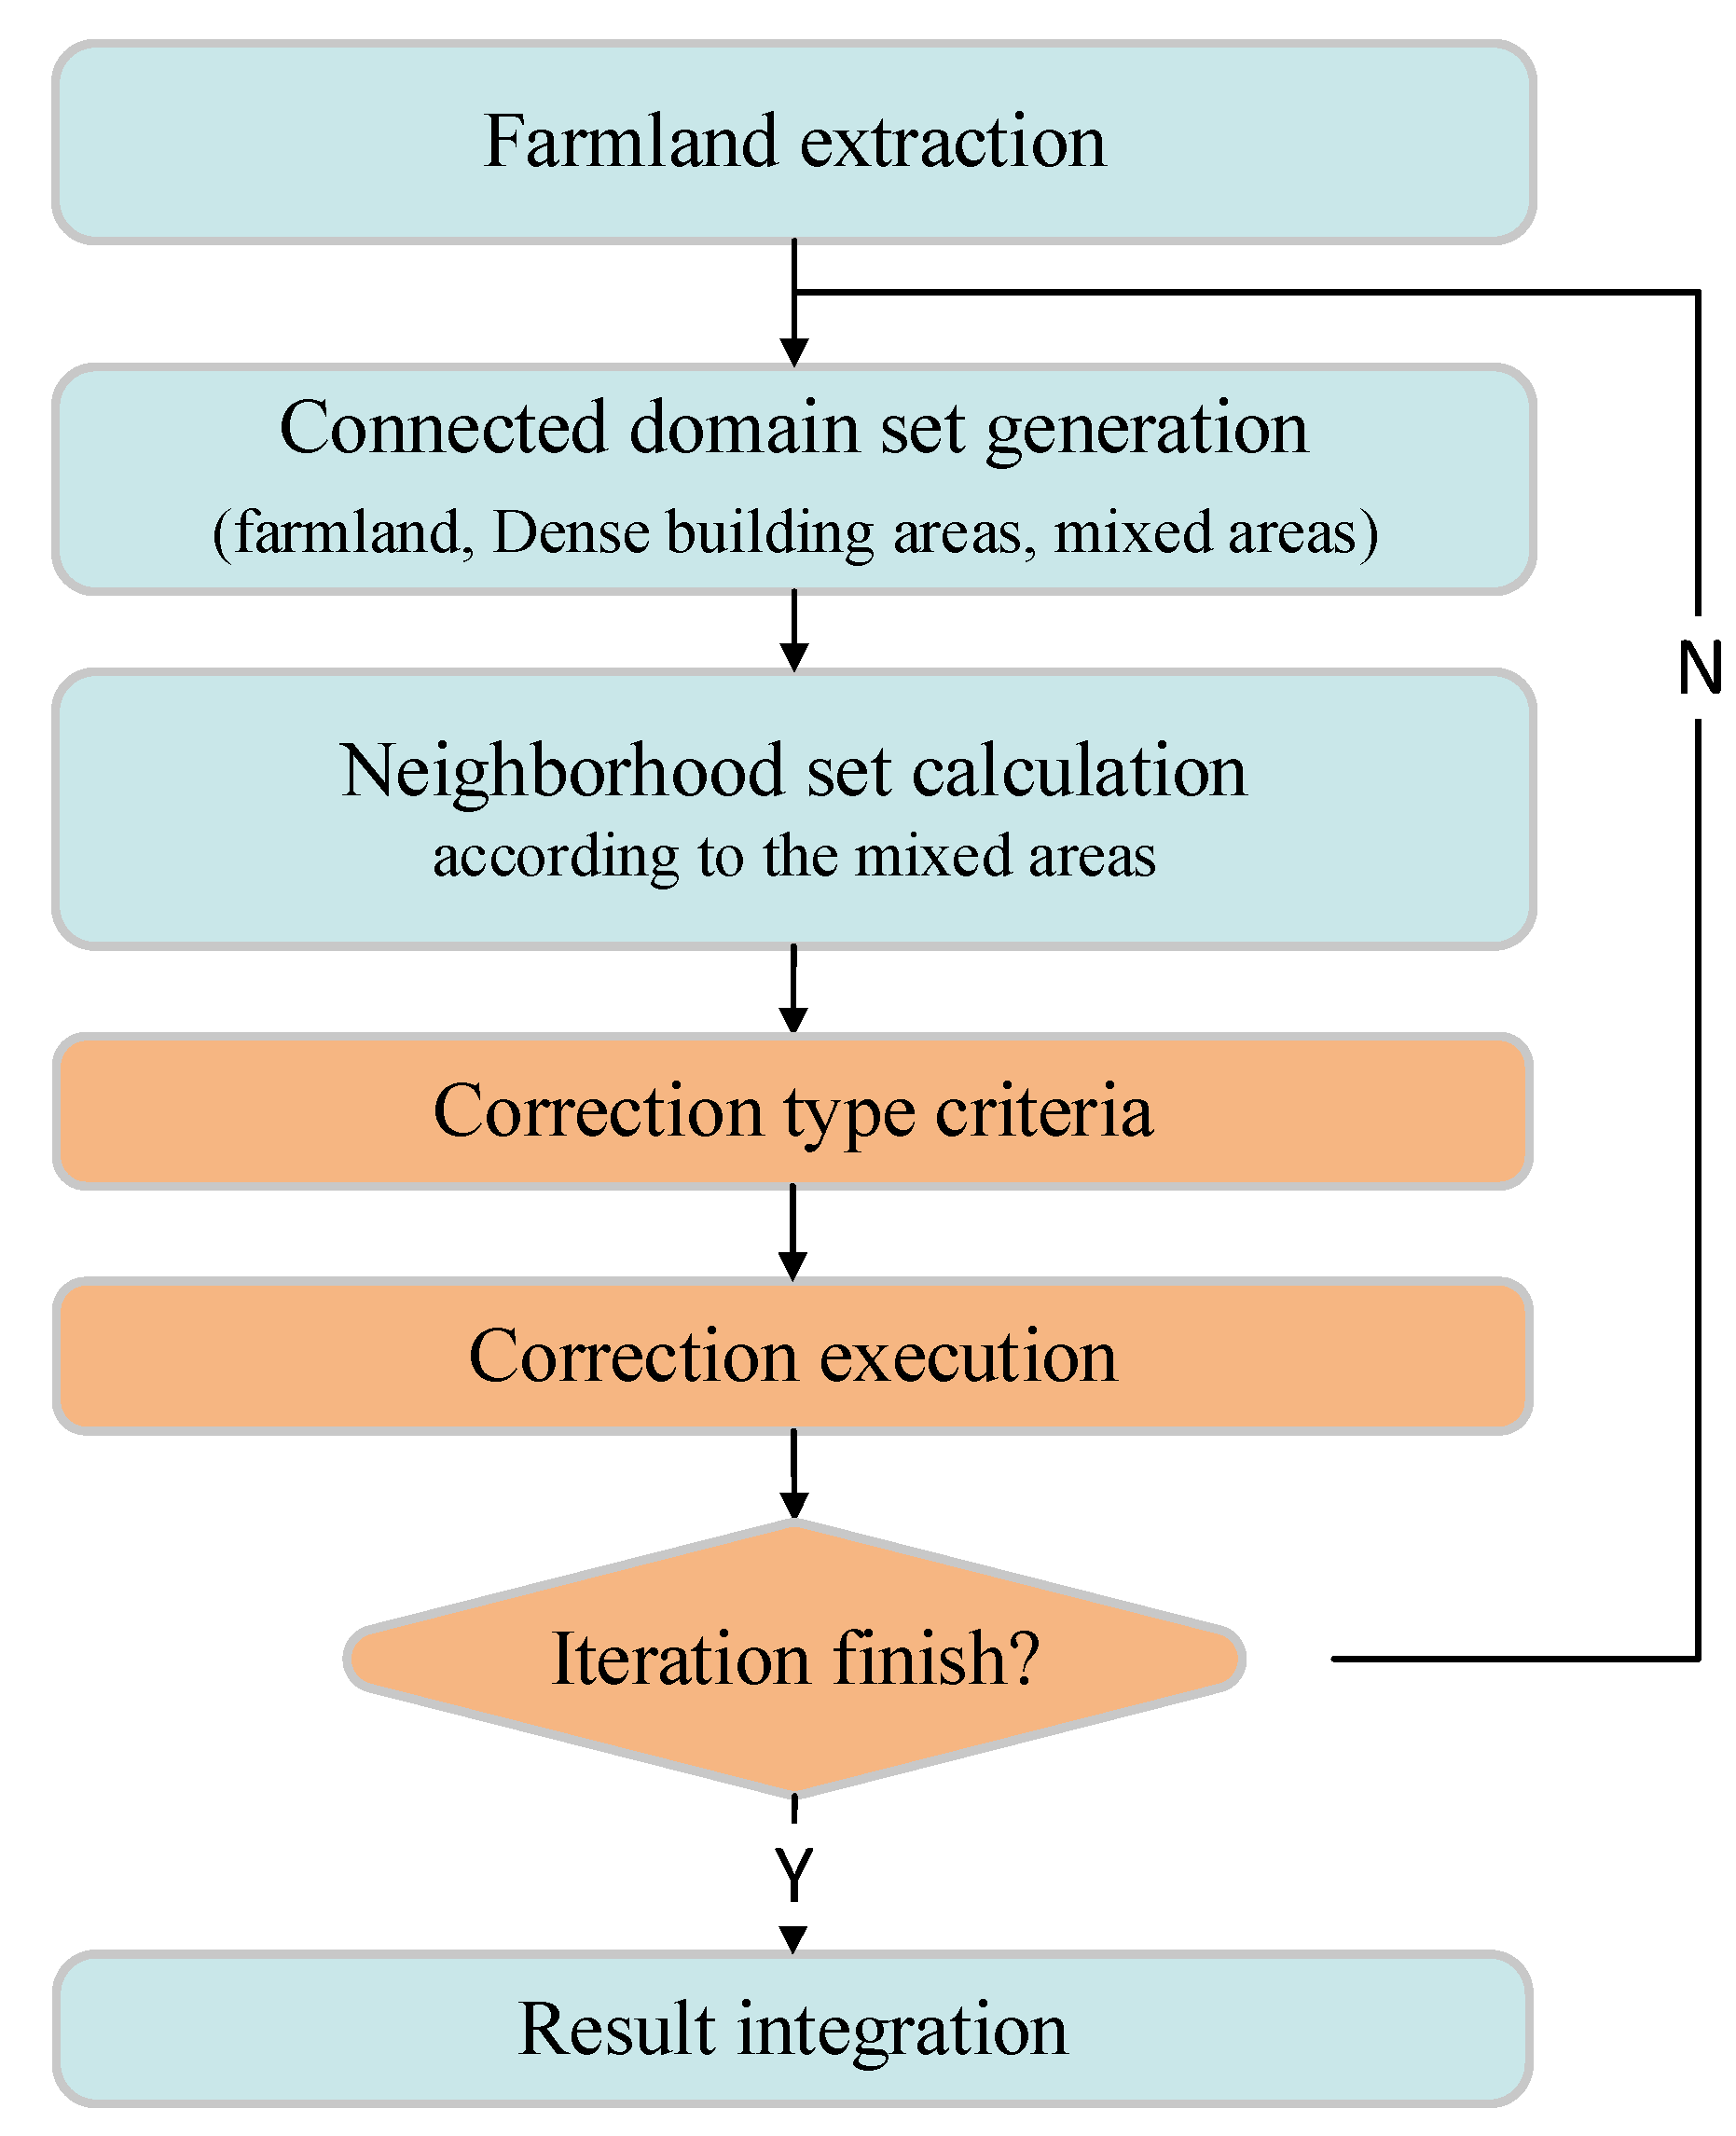
3.4. Fine Layover Detection
4. Experimental Results and Analysis
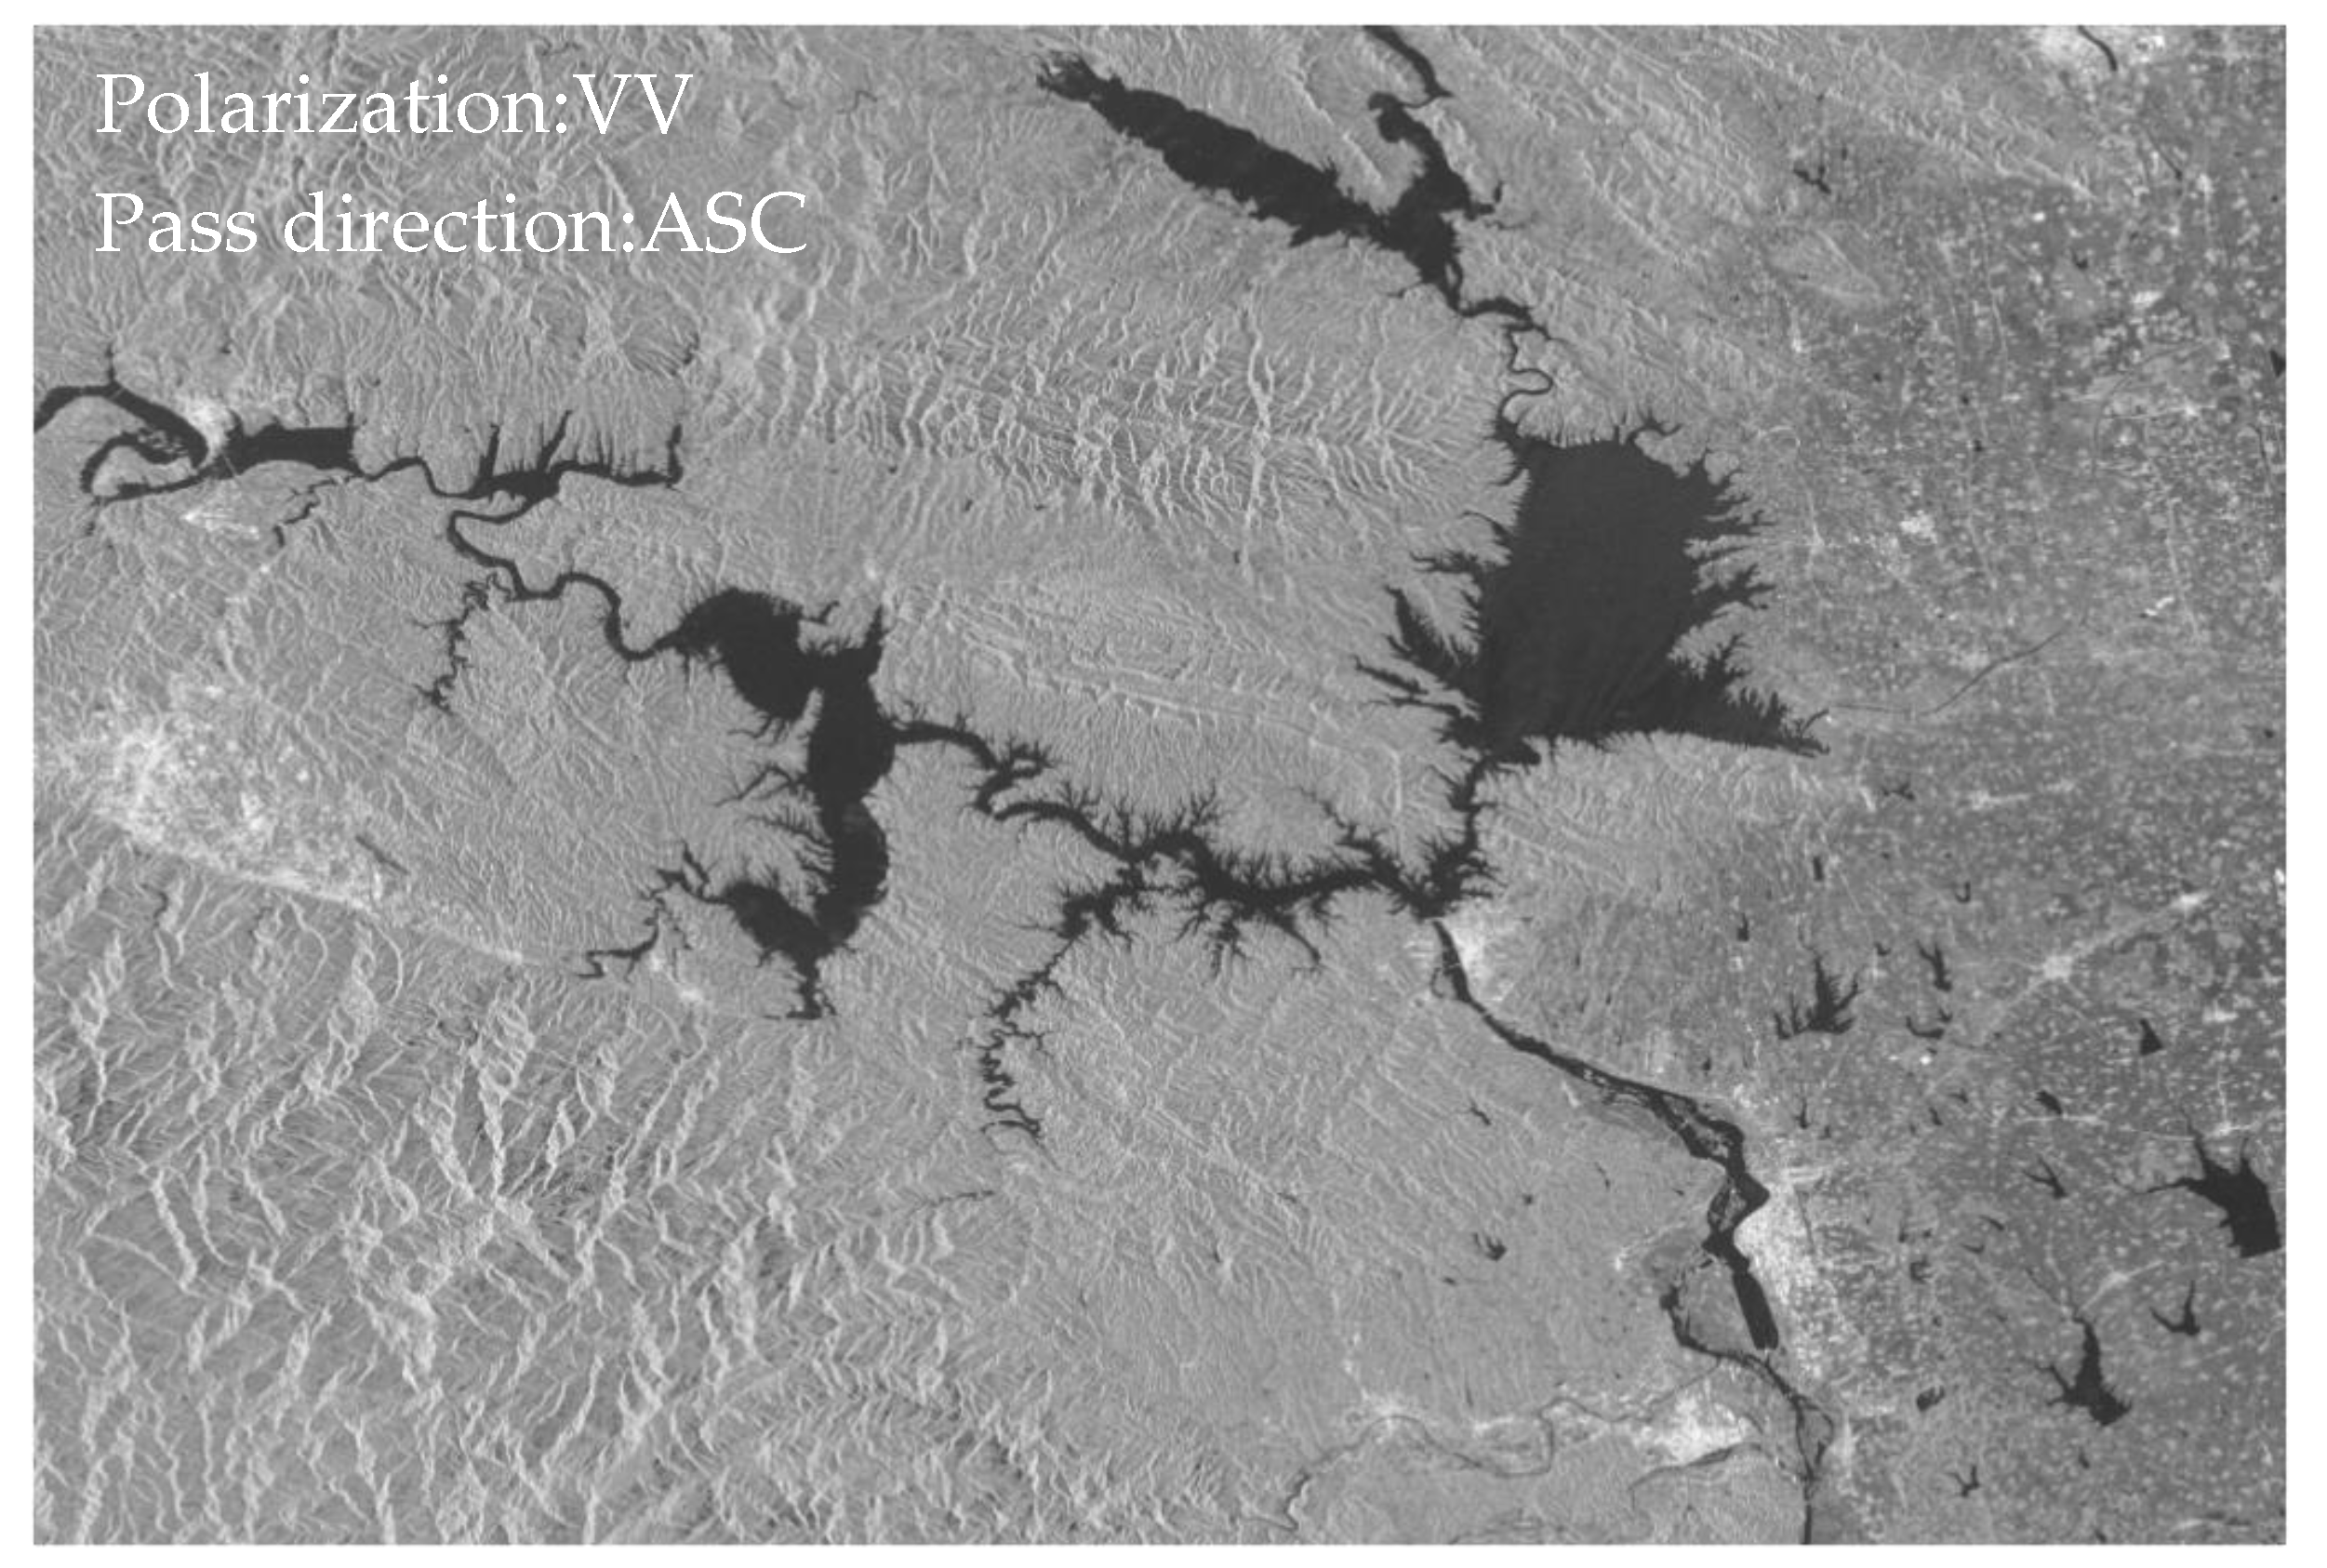
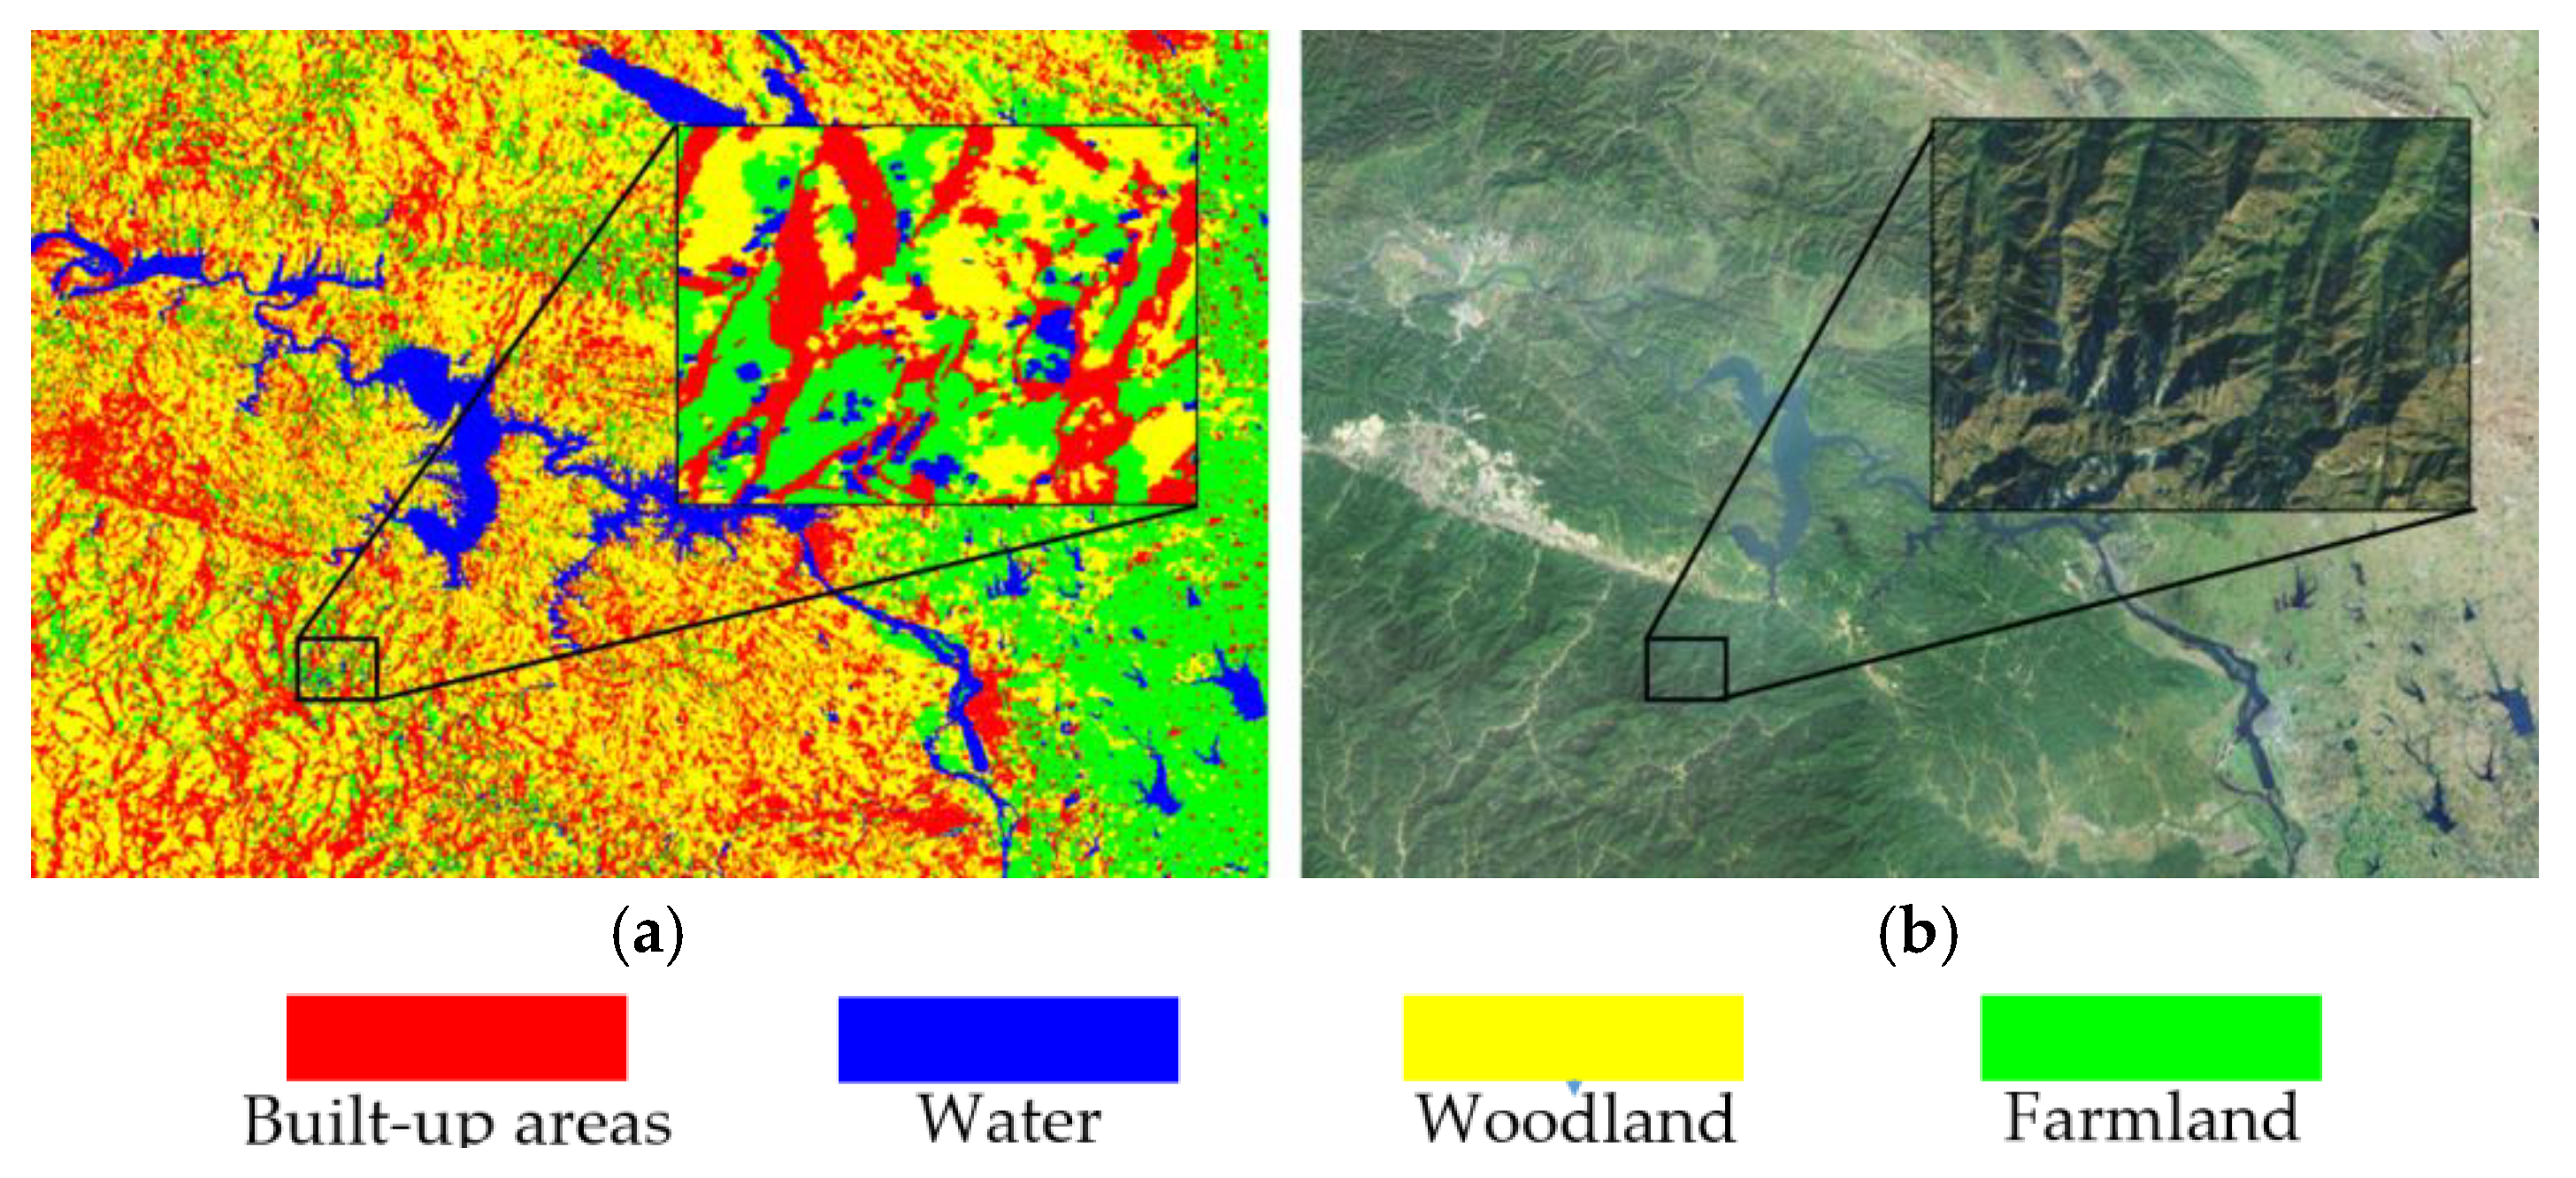
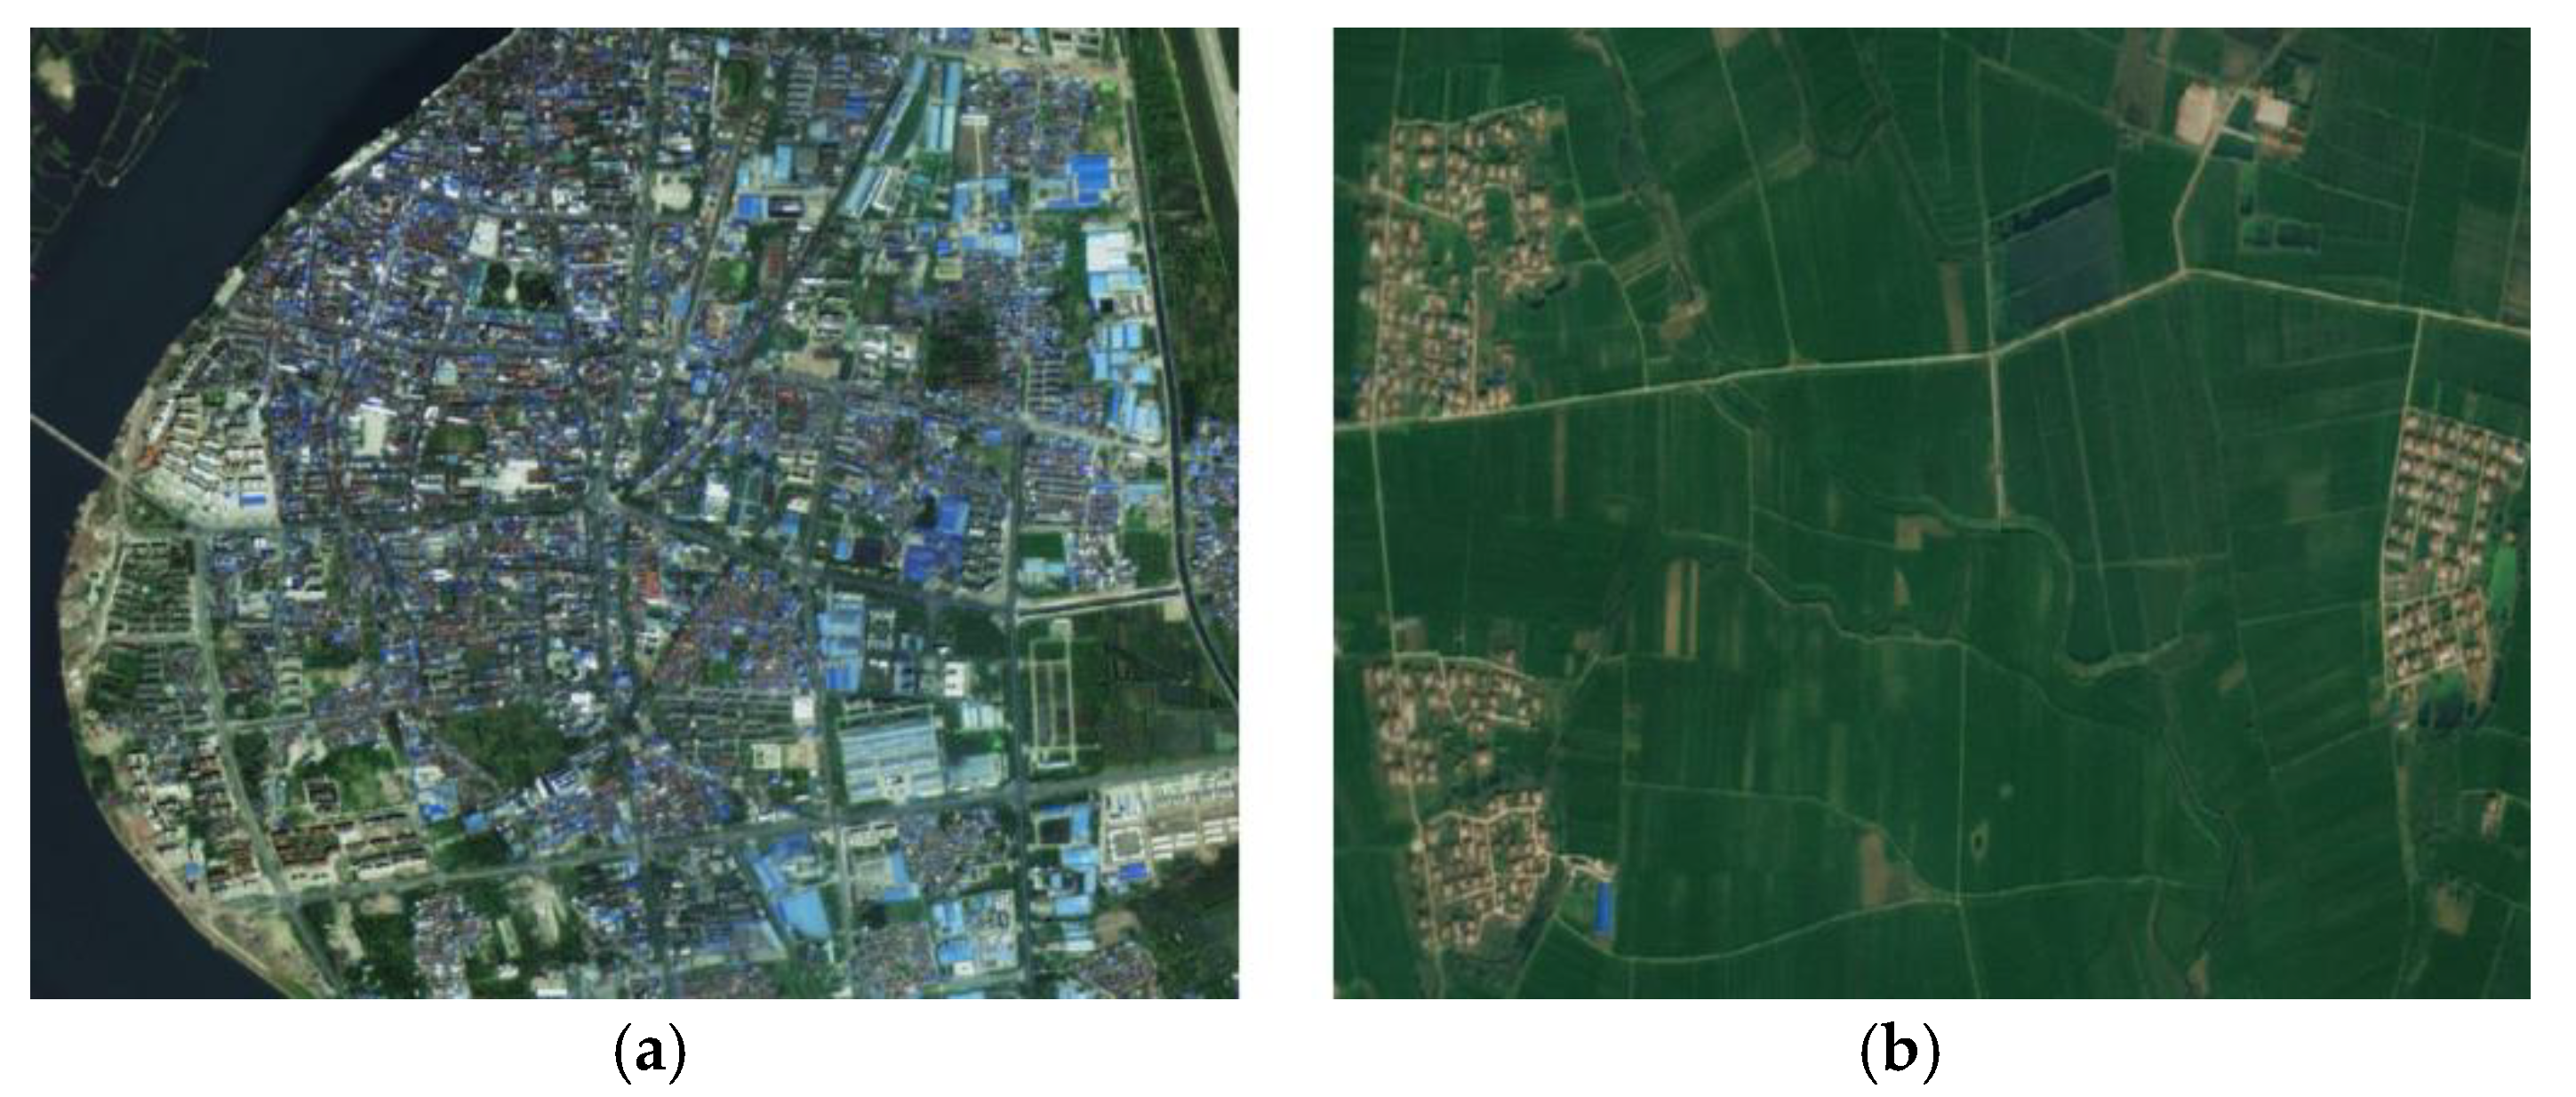
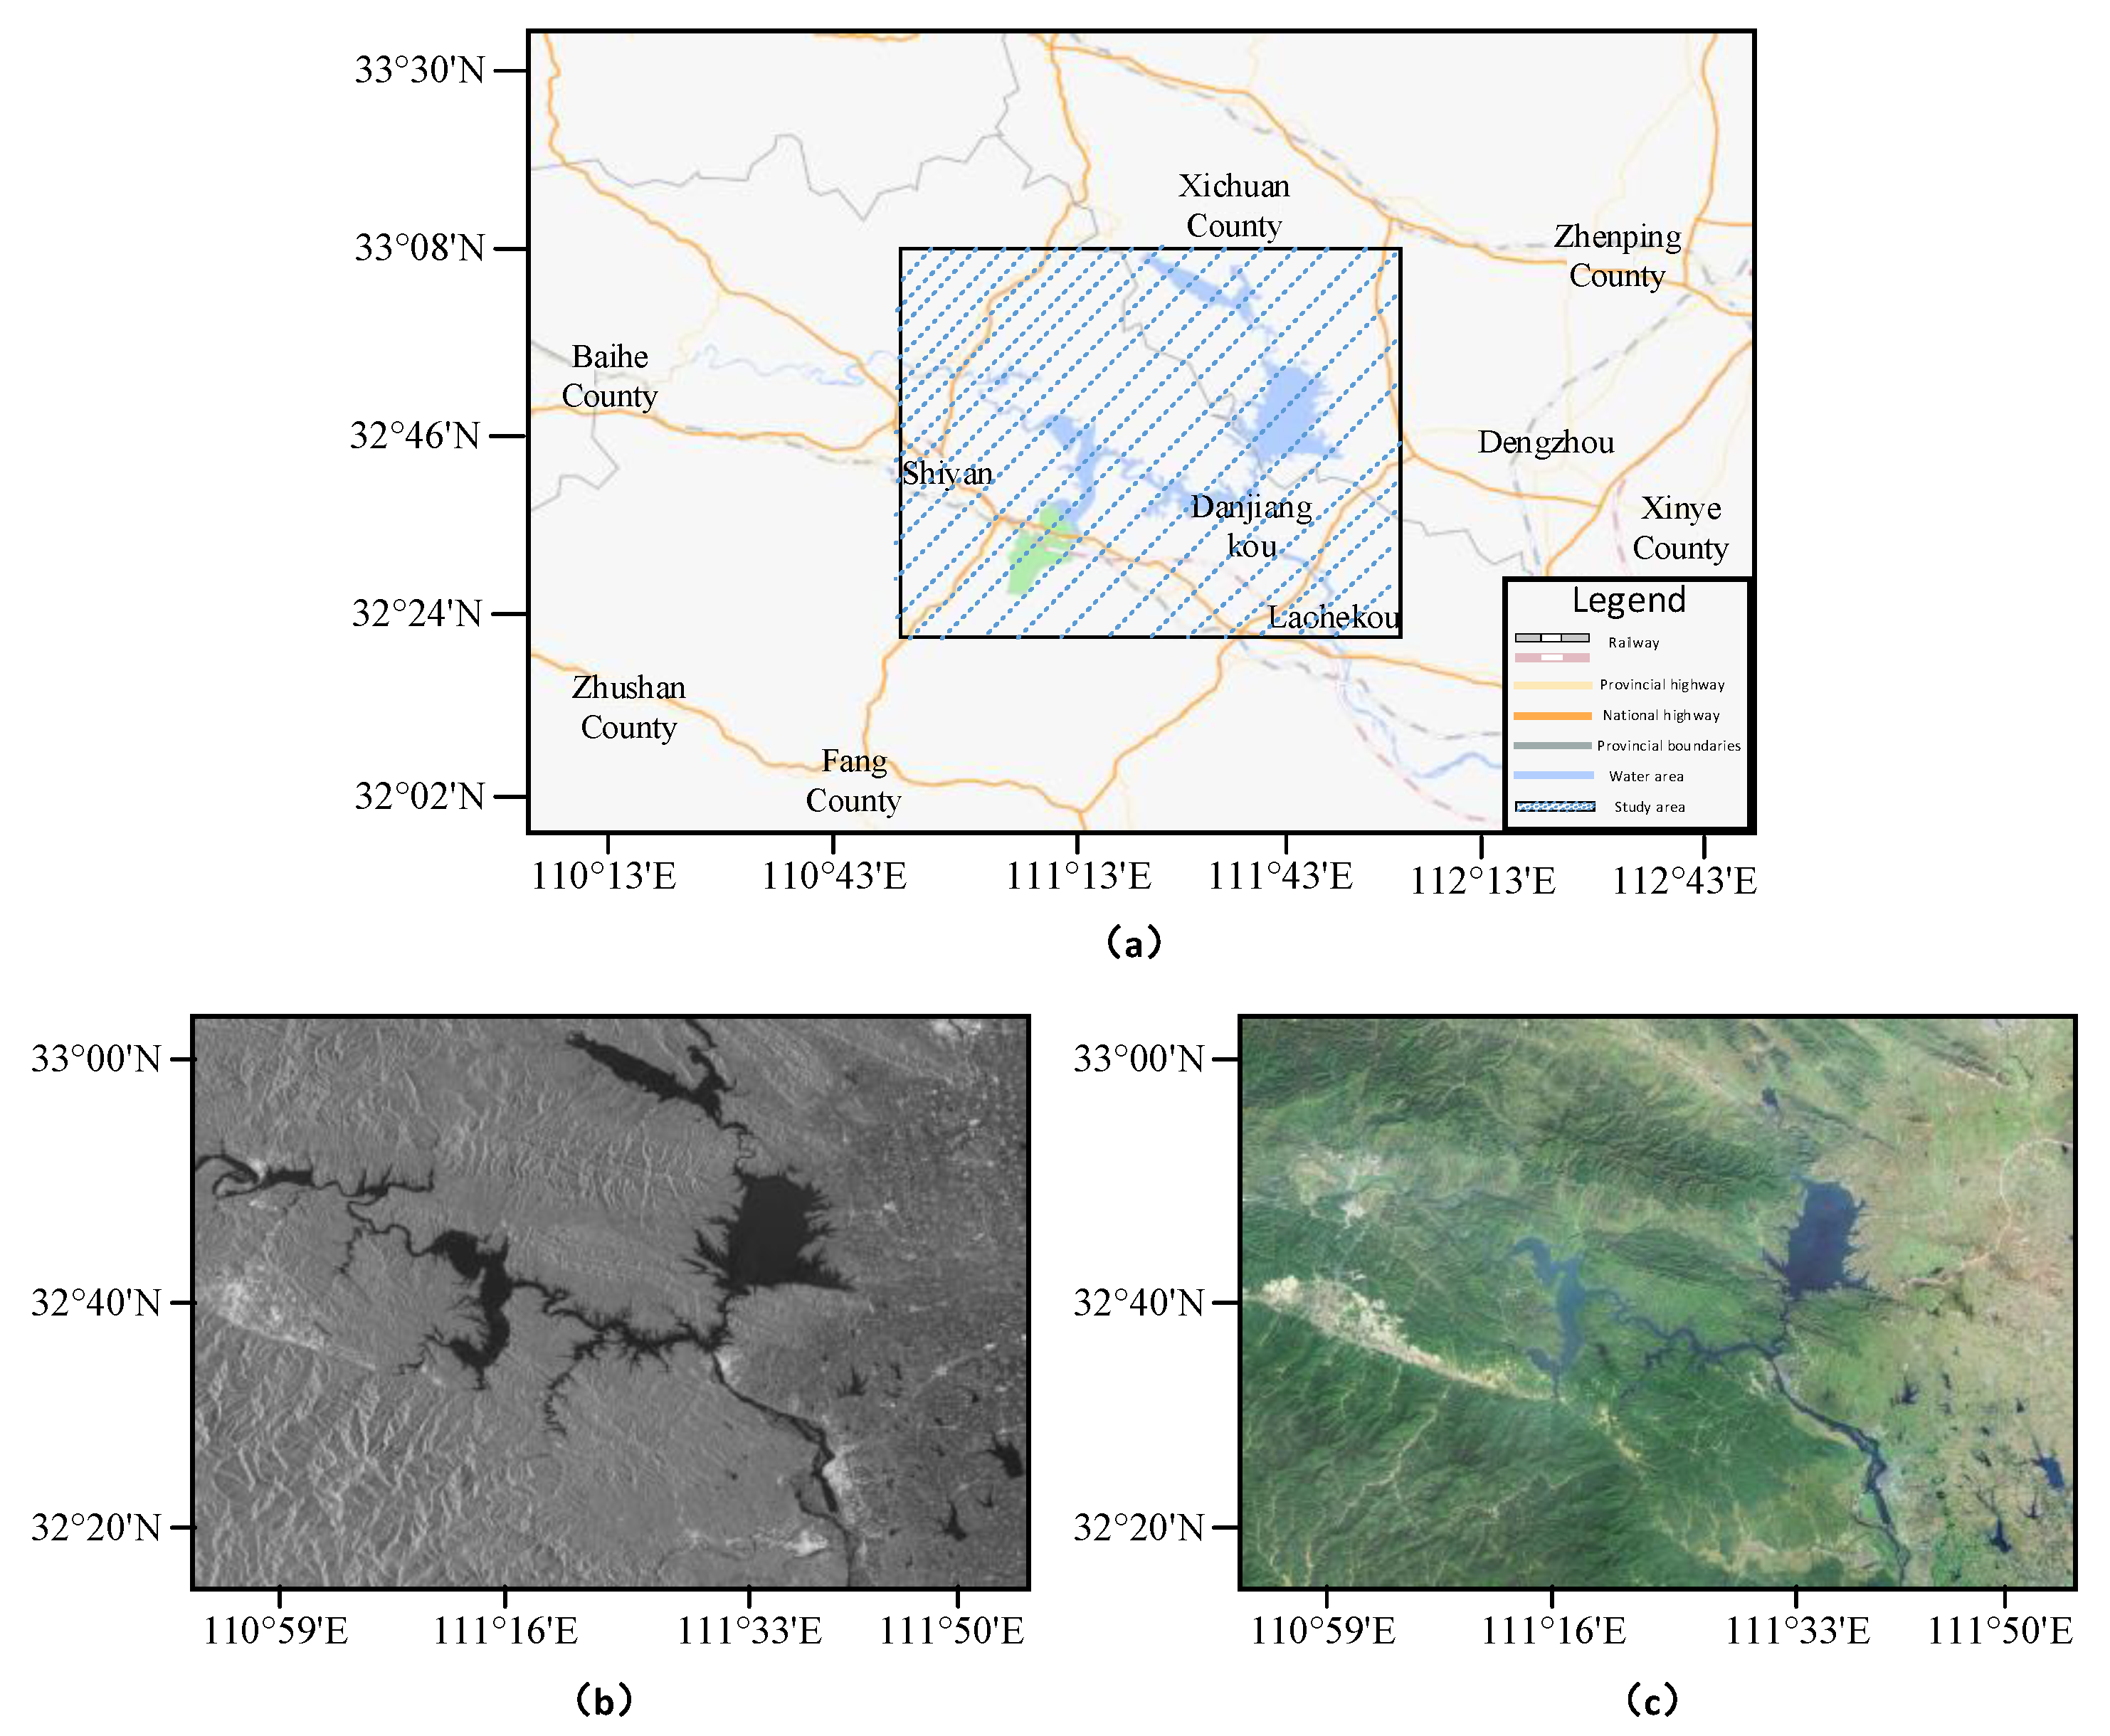
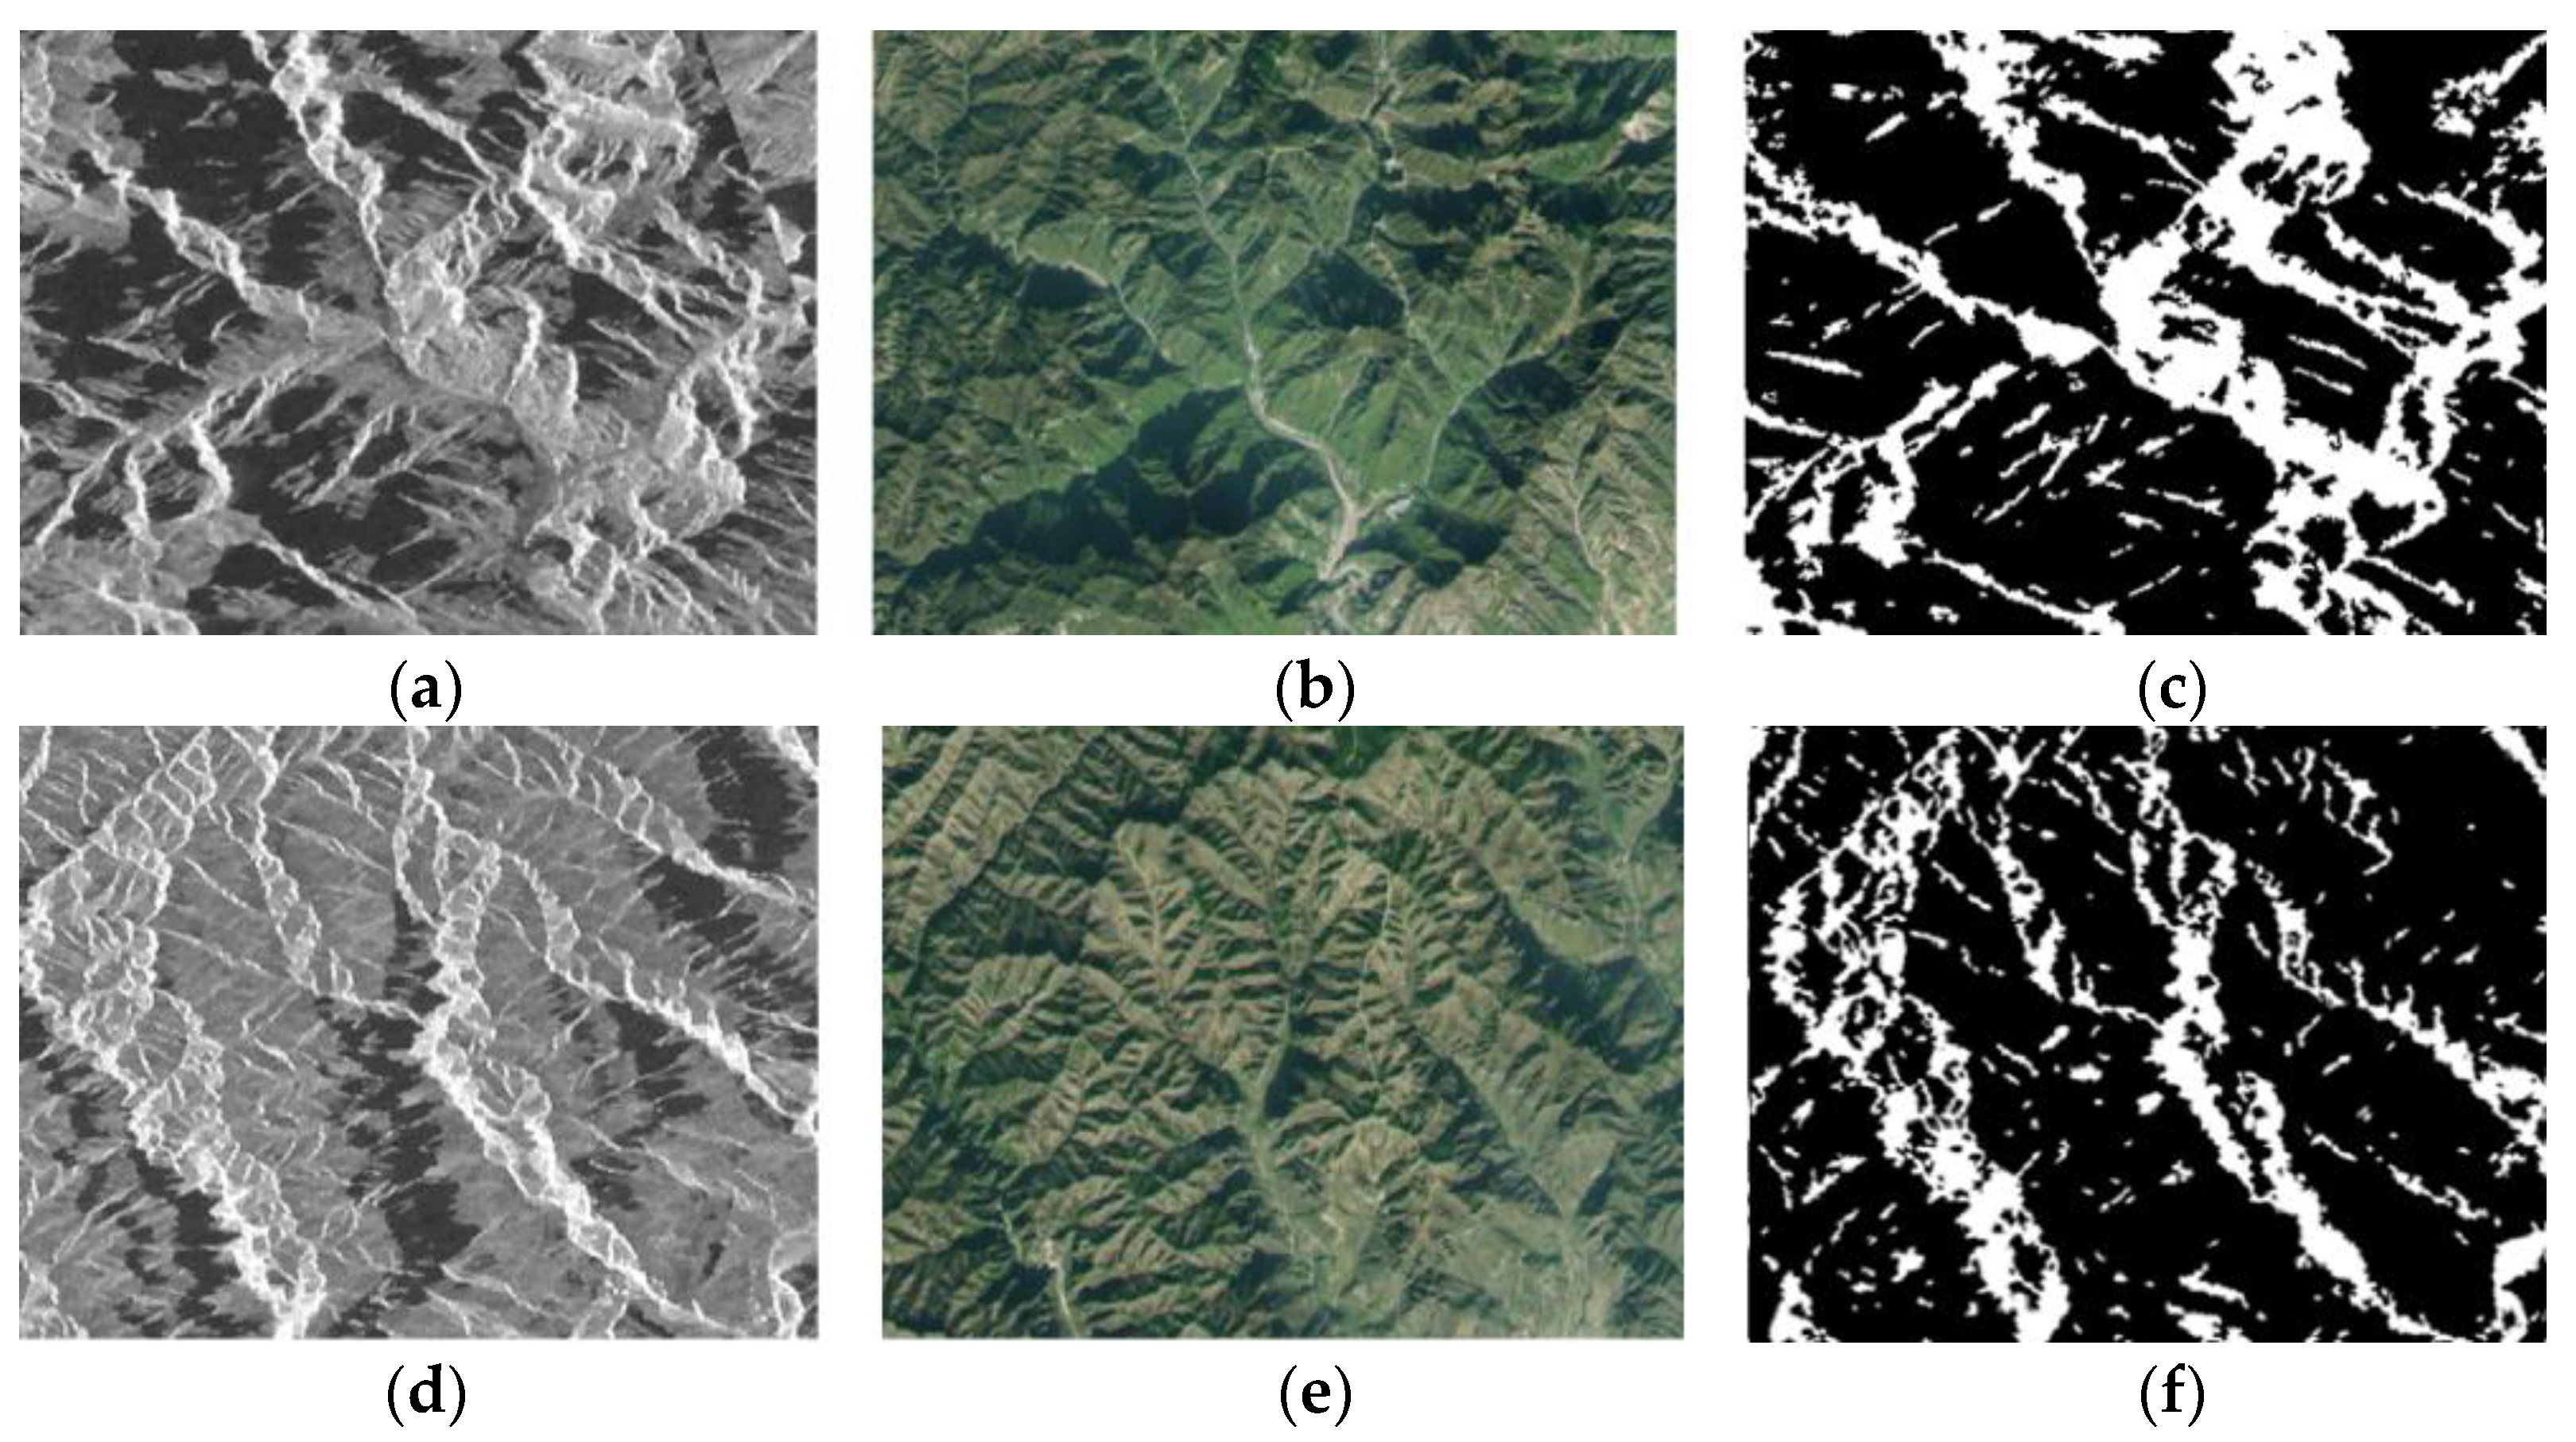
4.1. Study Area and Data
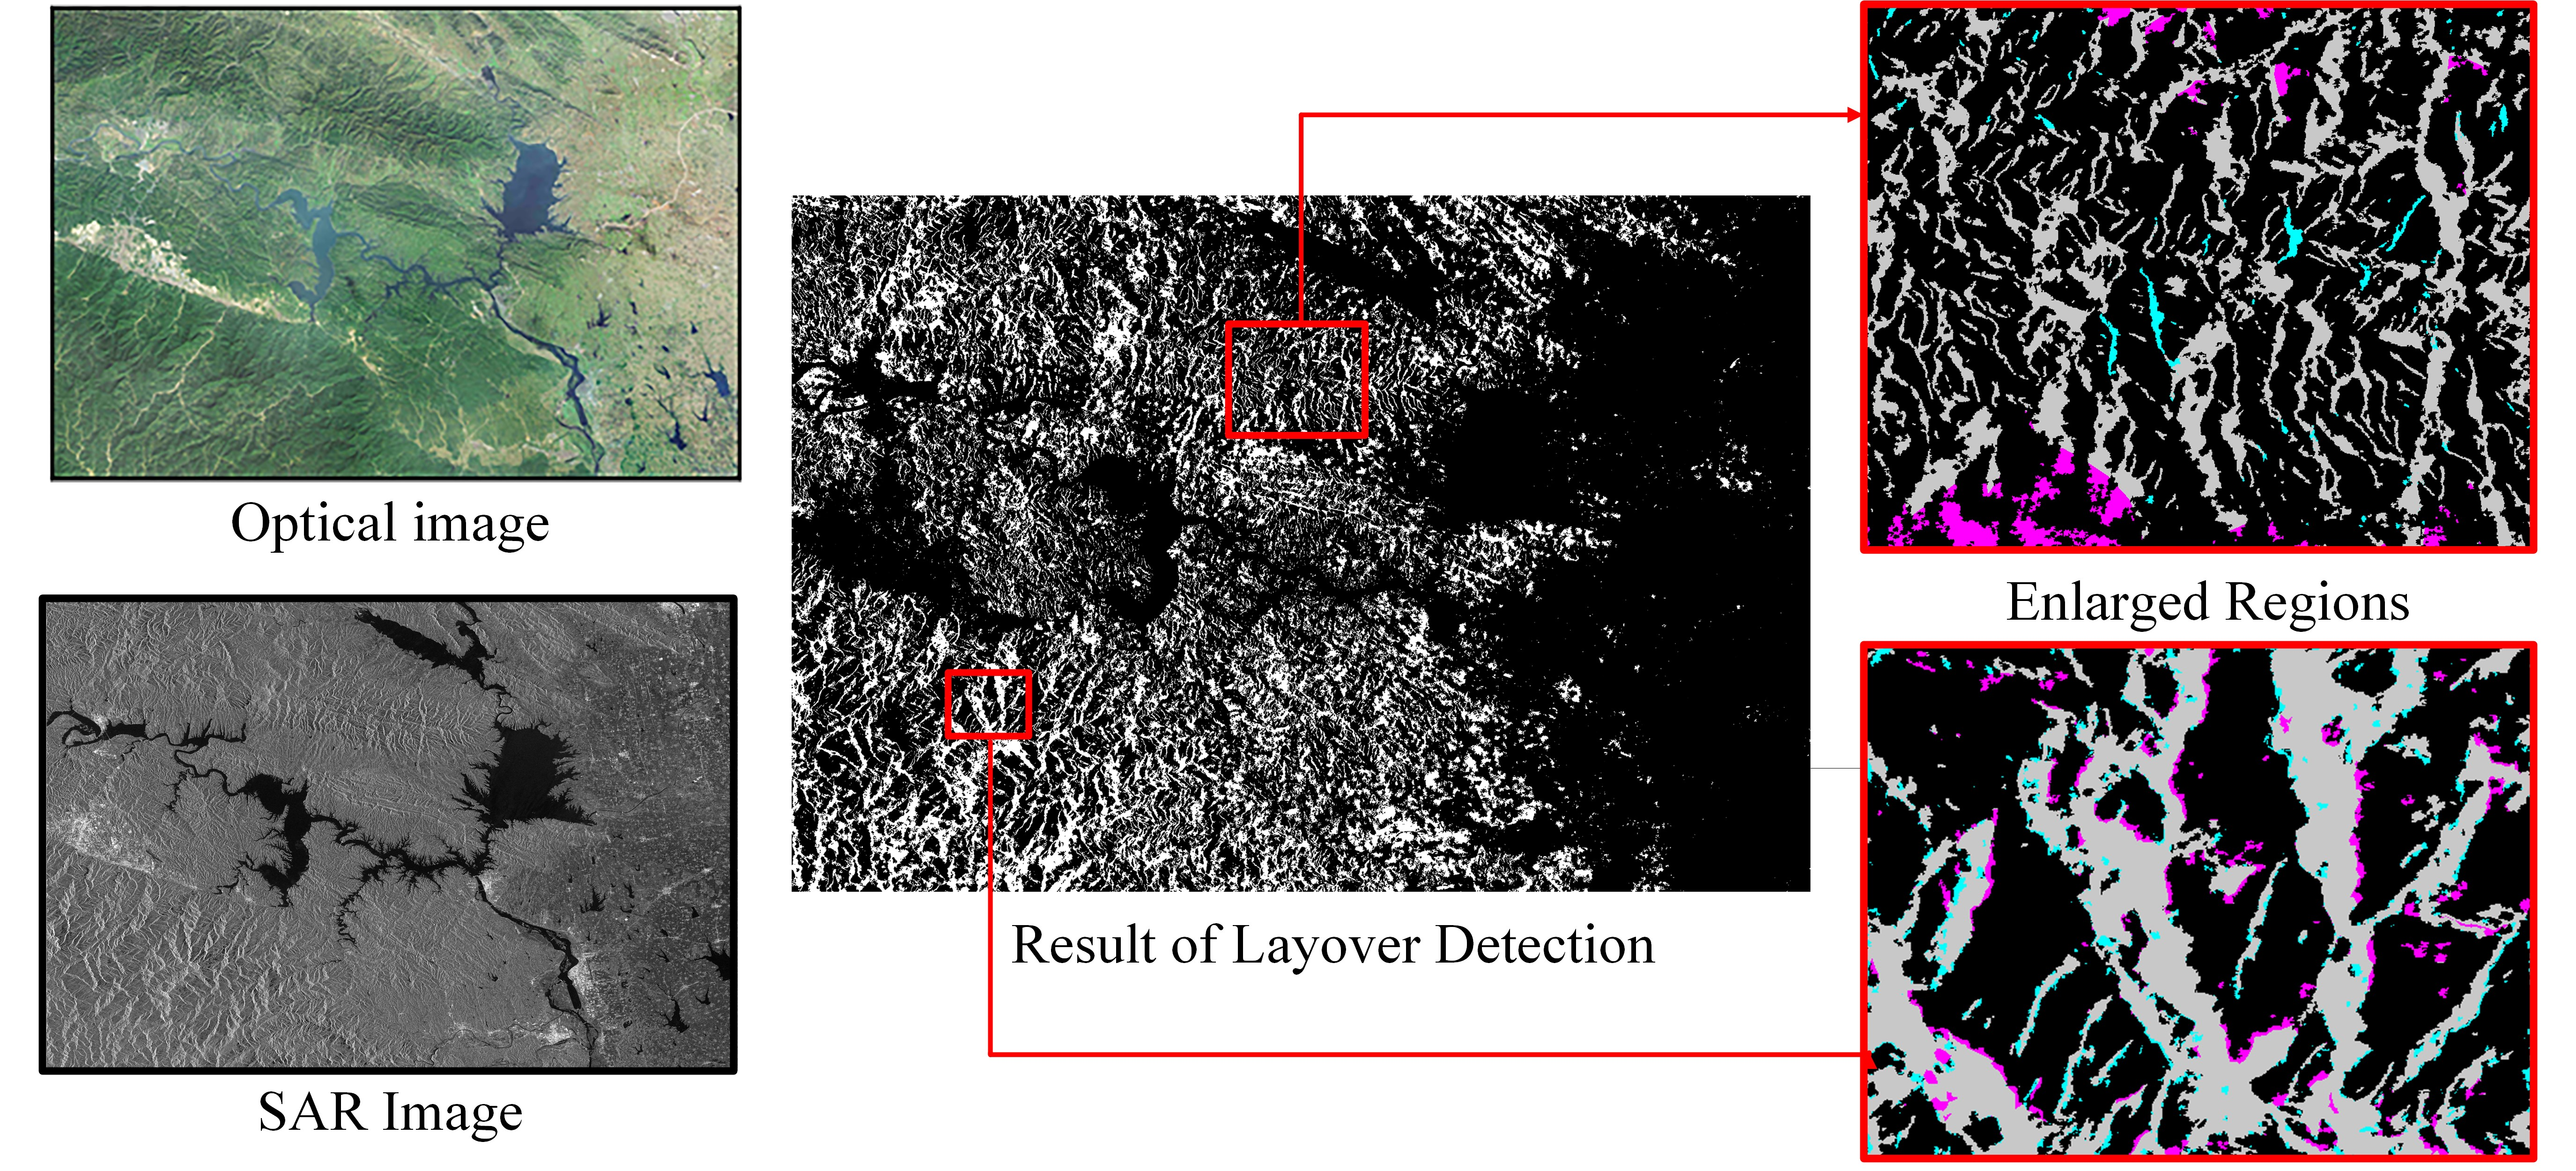
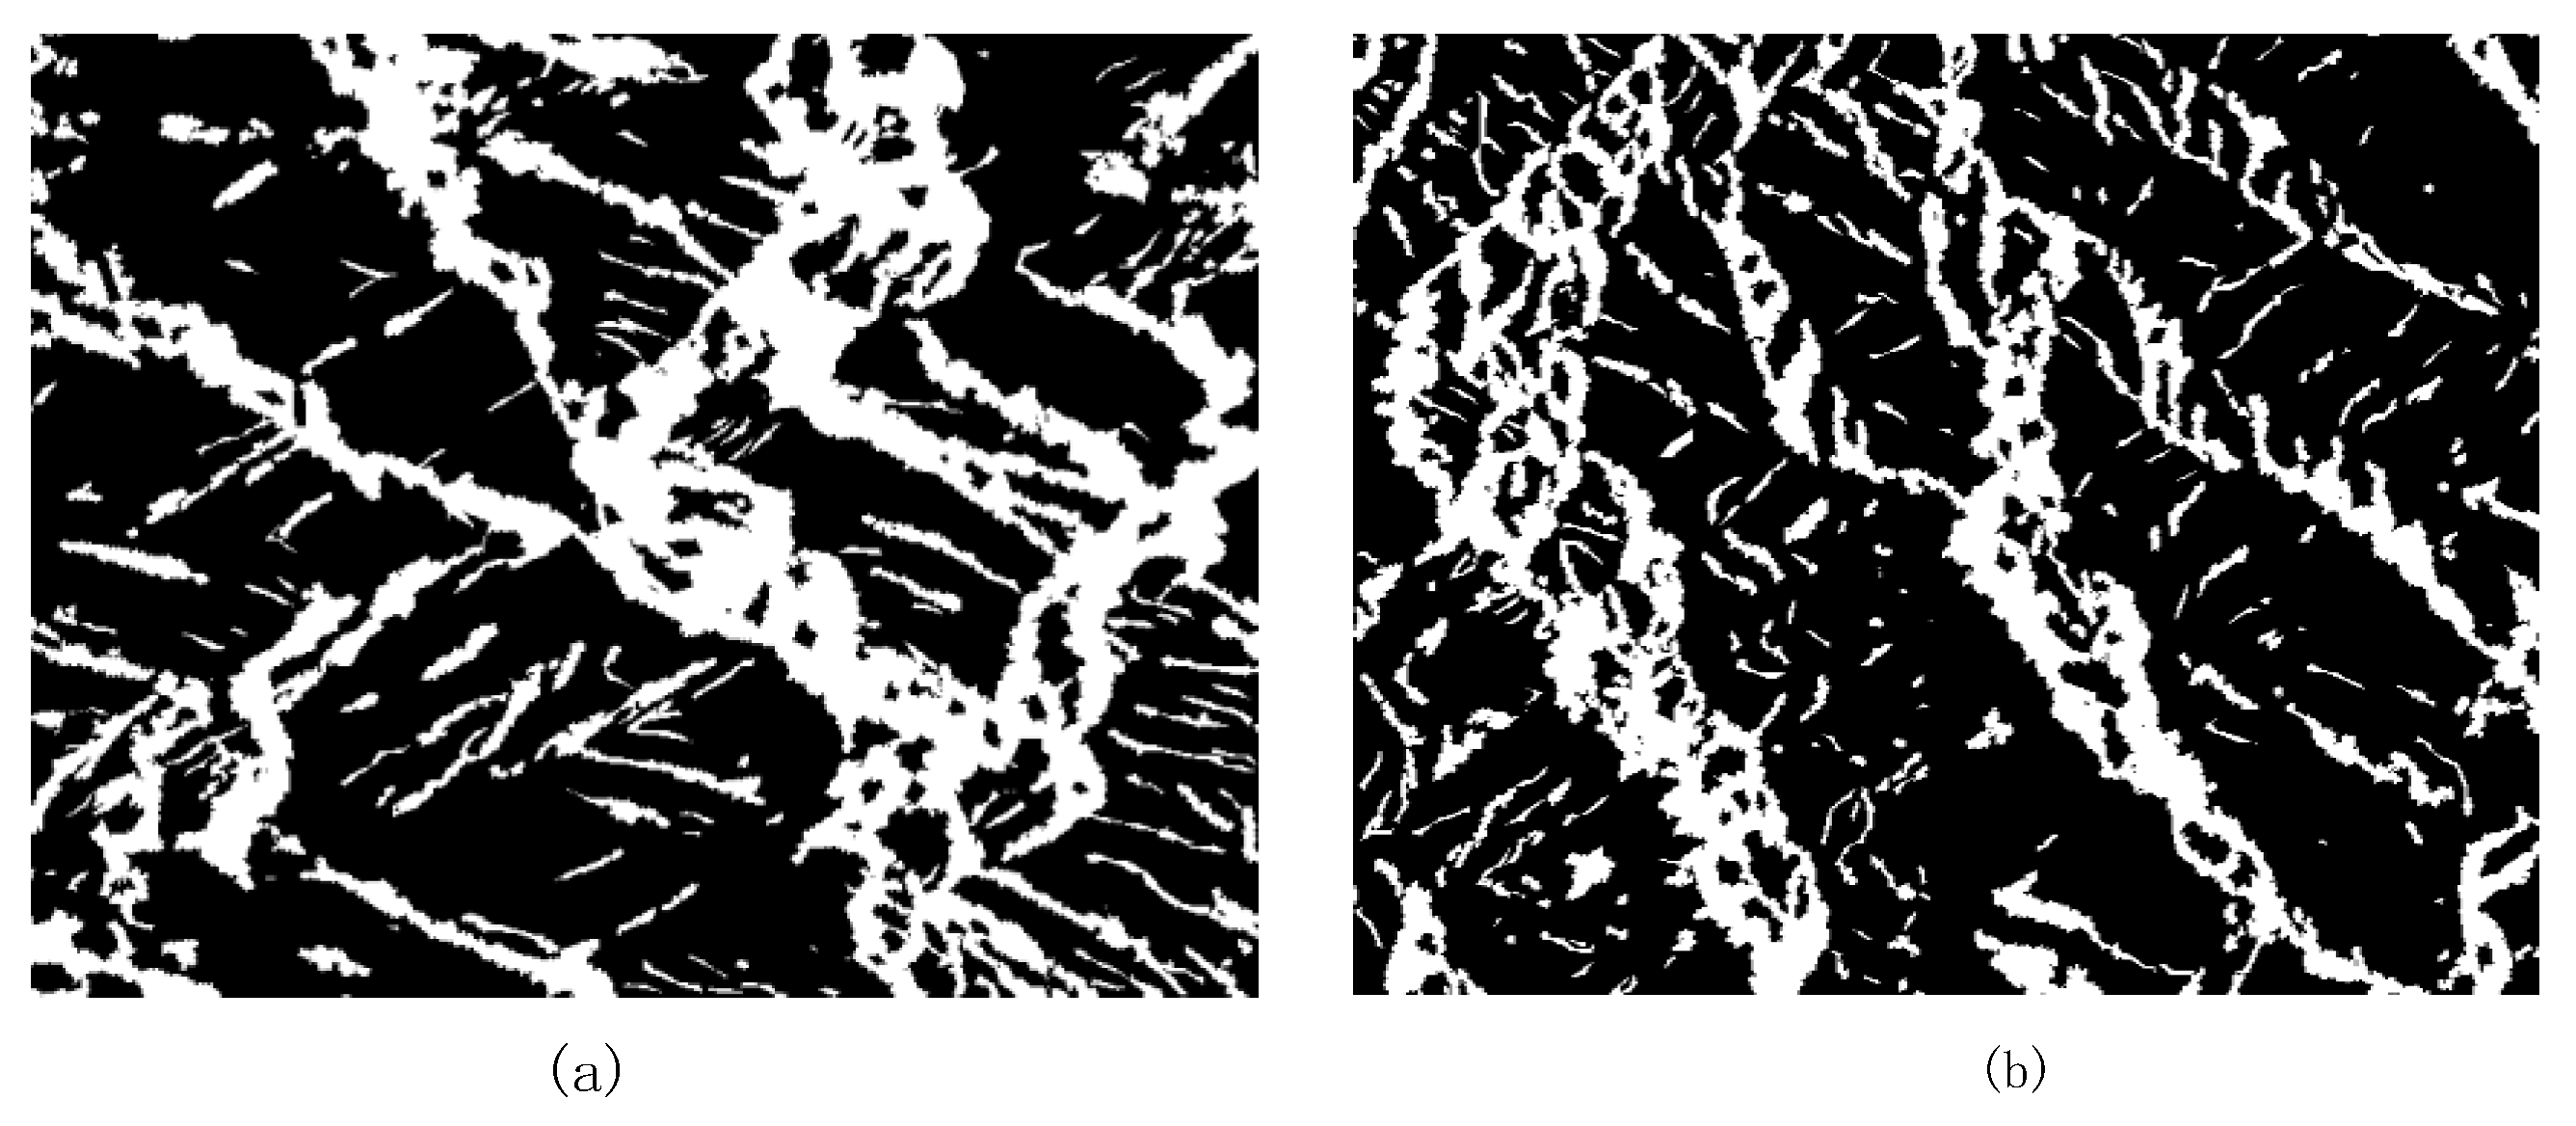
4.2. Layover Detection Experiment
4.3. Quantitative Analysis and Discussion
4.3.1. Accuracy Analysis of the Proposed Method
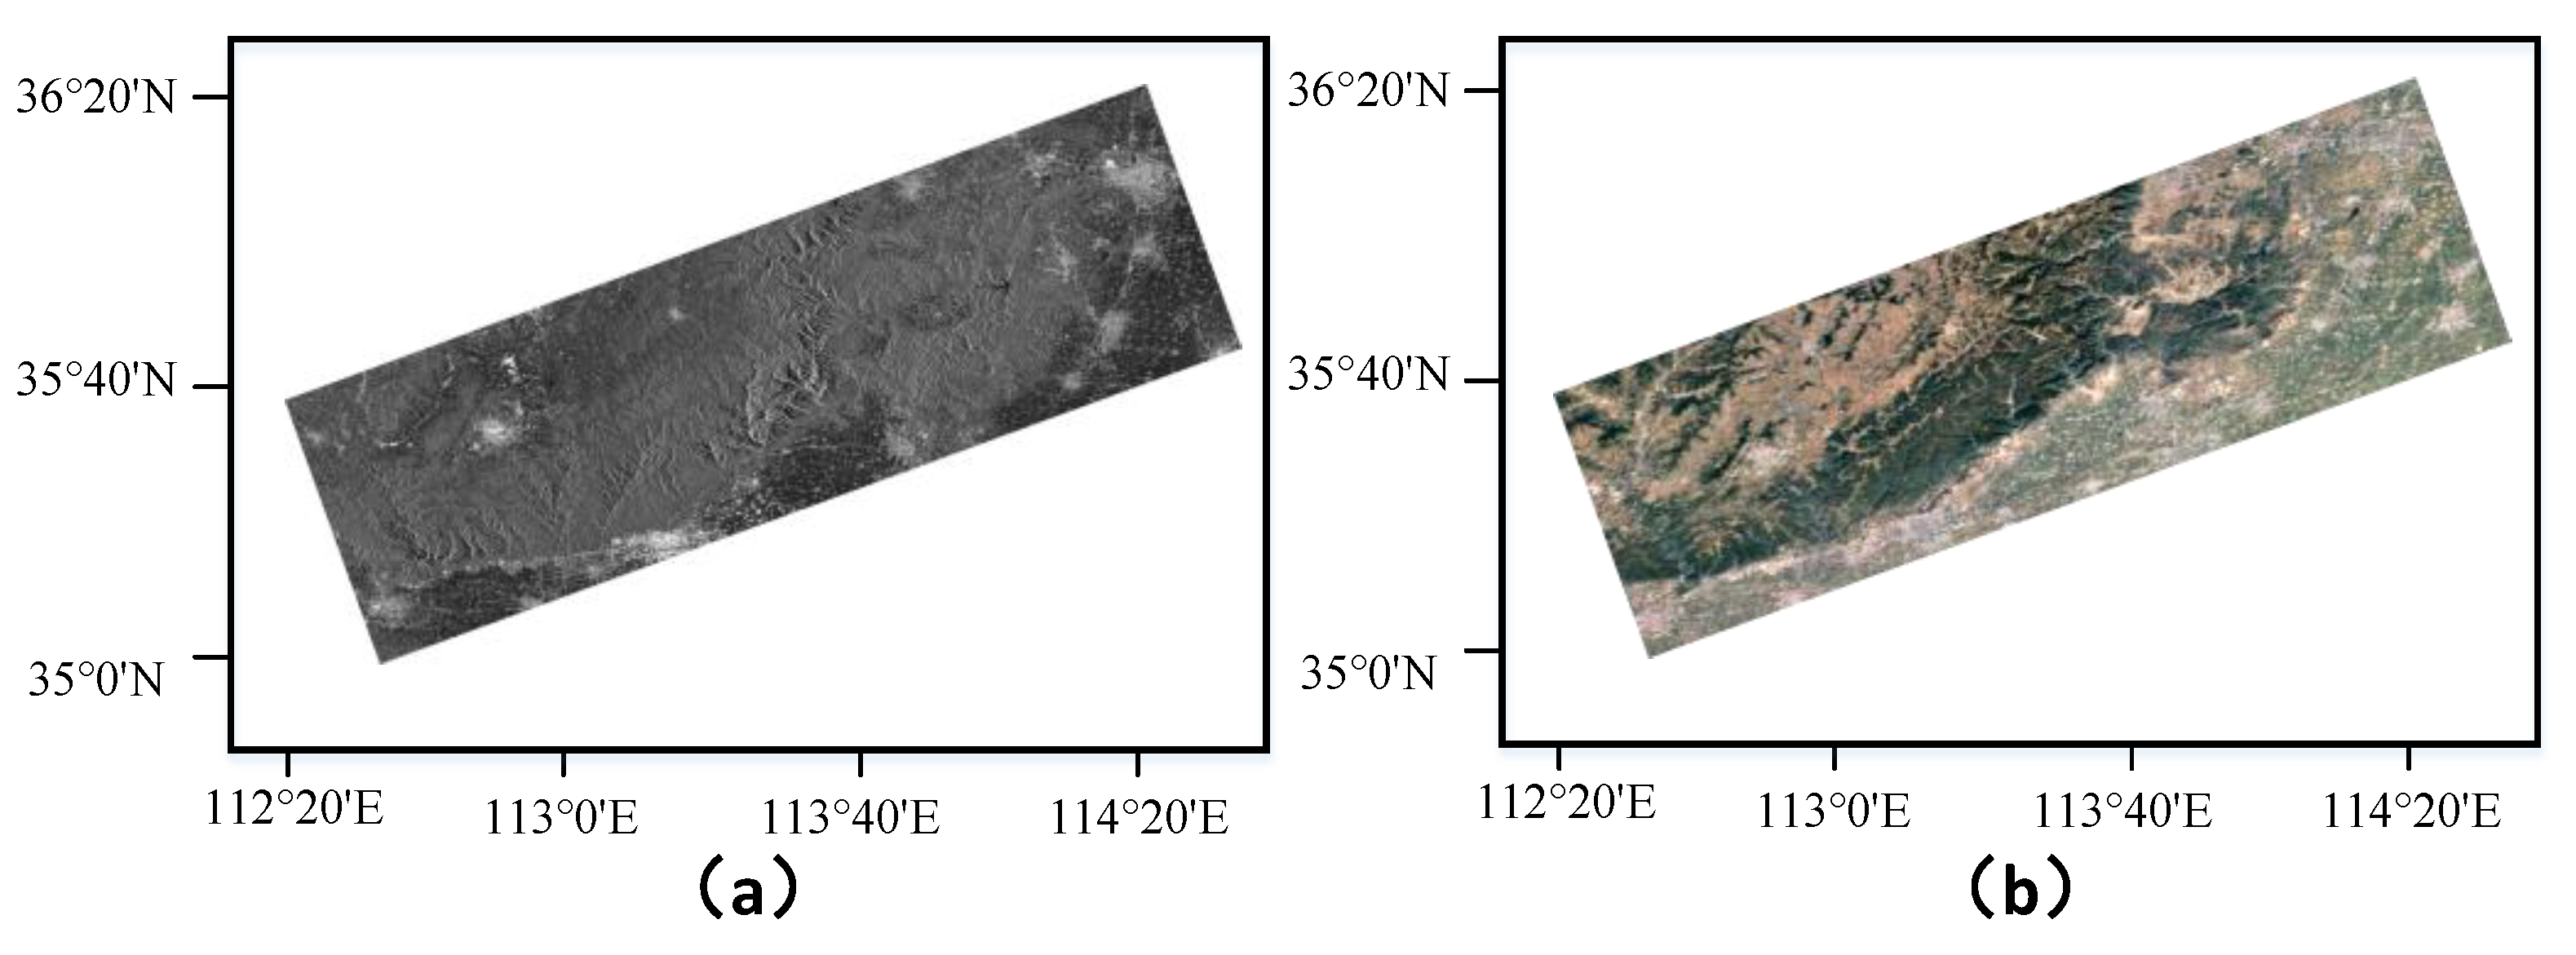
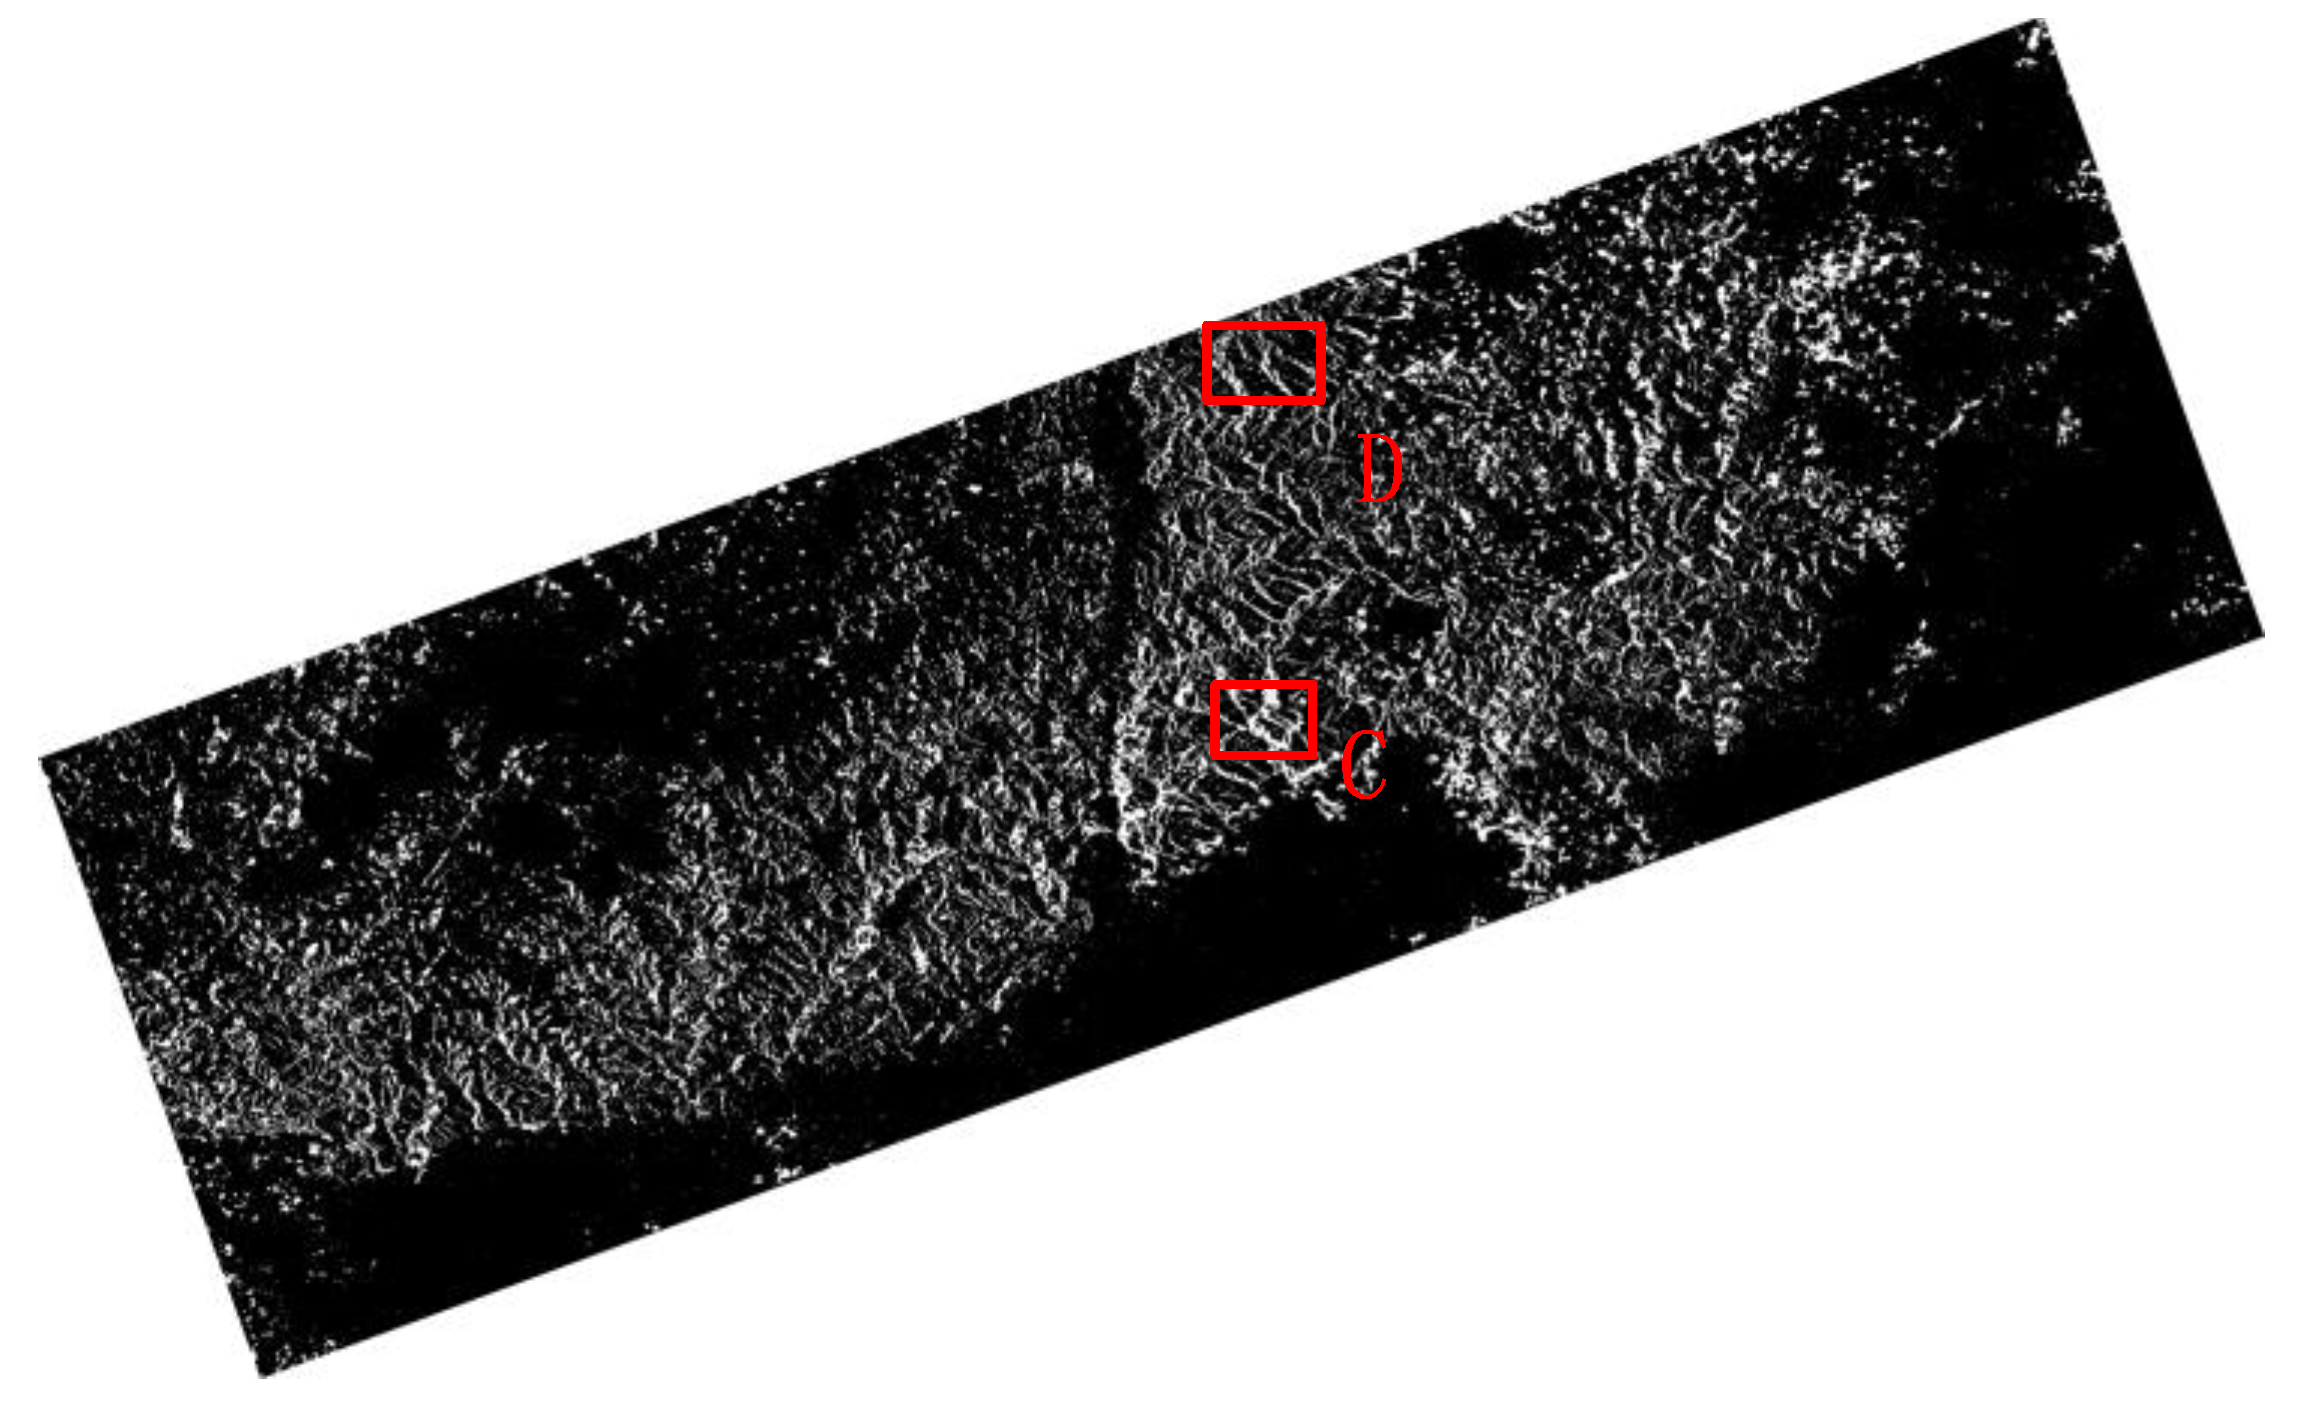
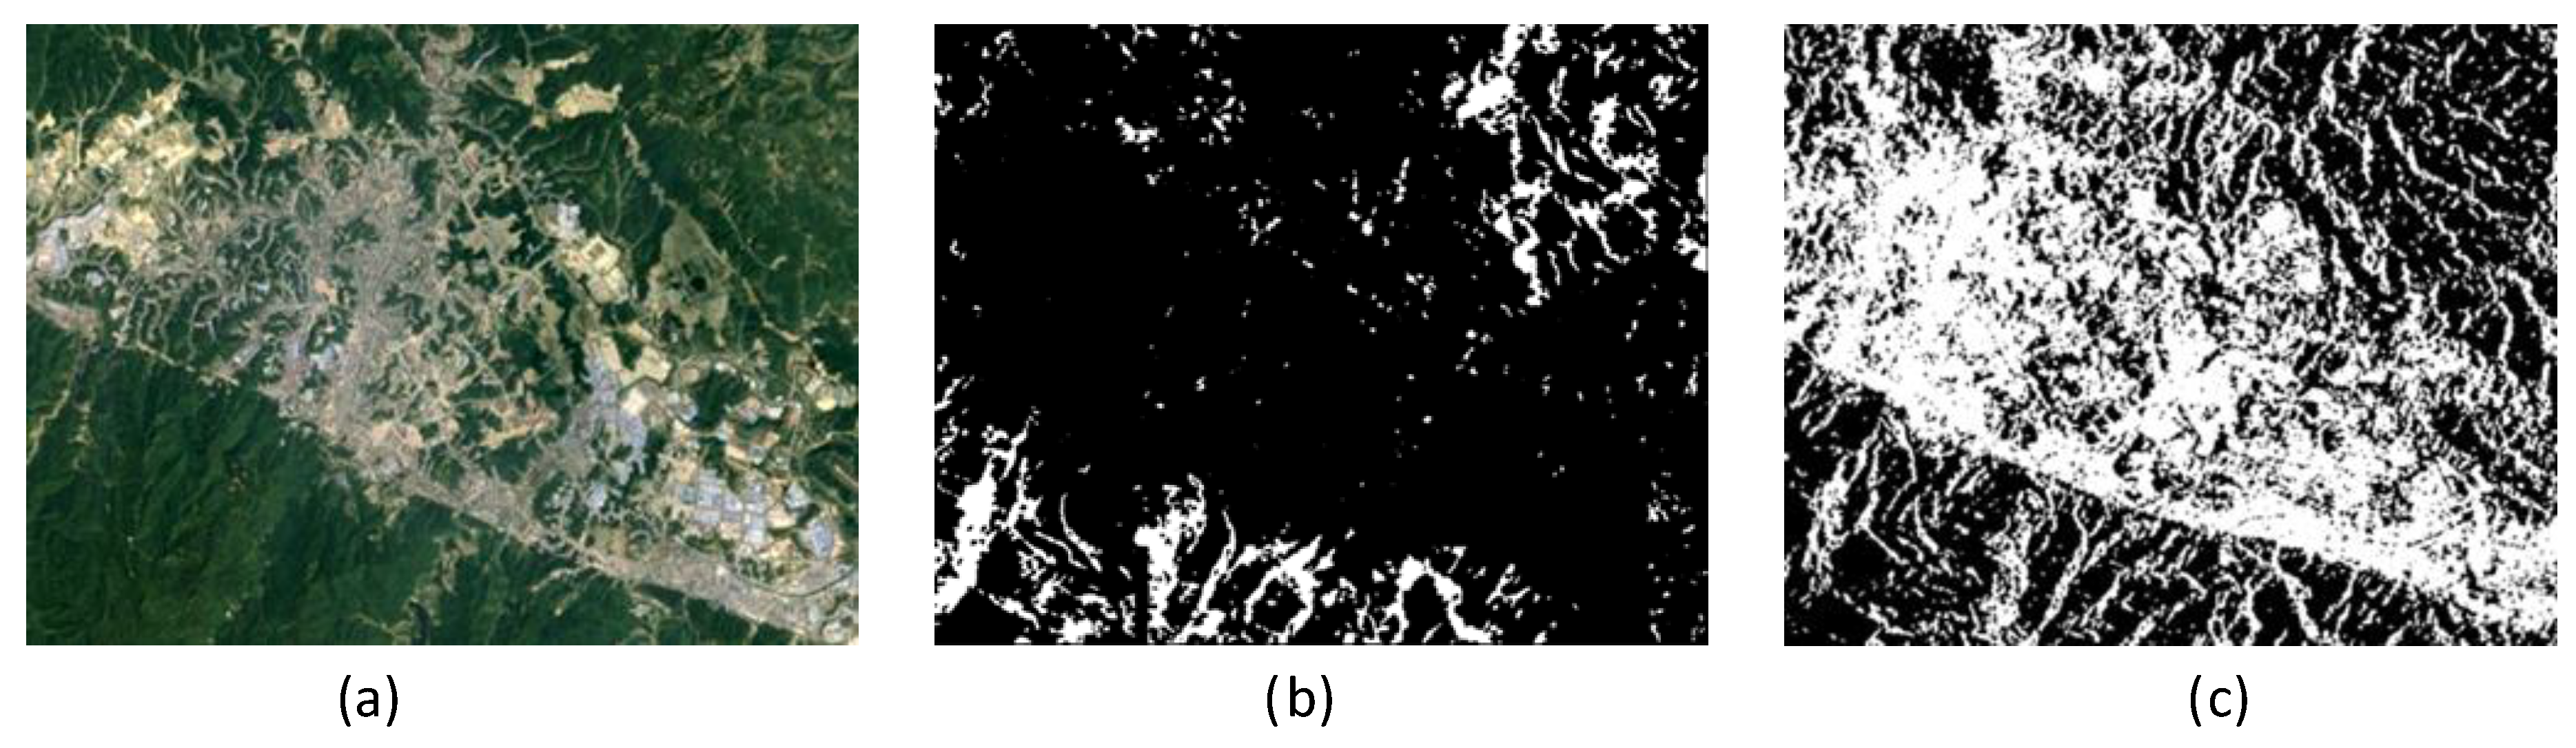
4.3.2. Universality Analysis of the Proposed Method
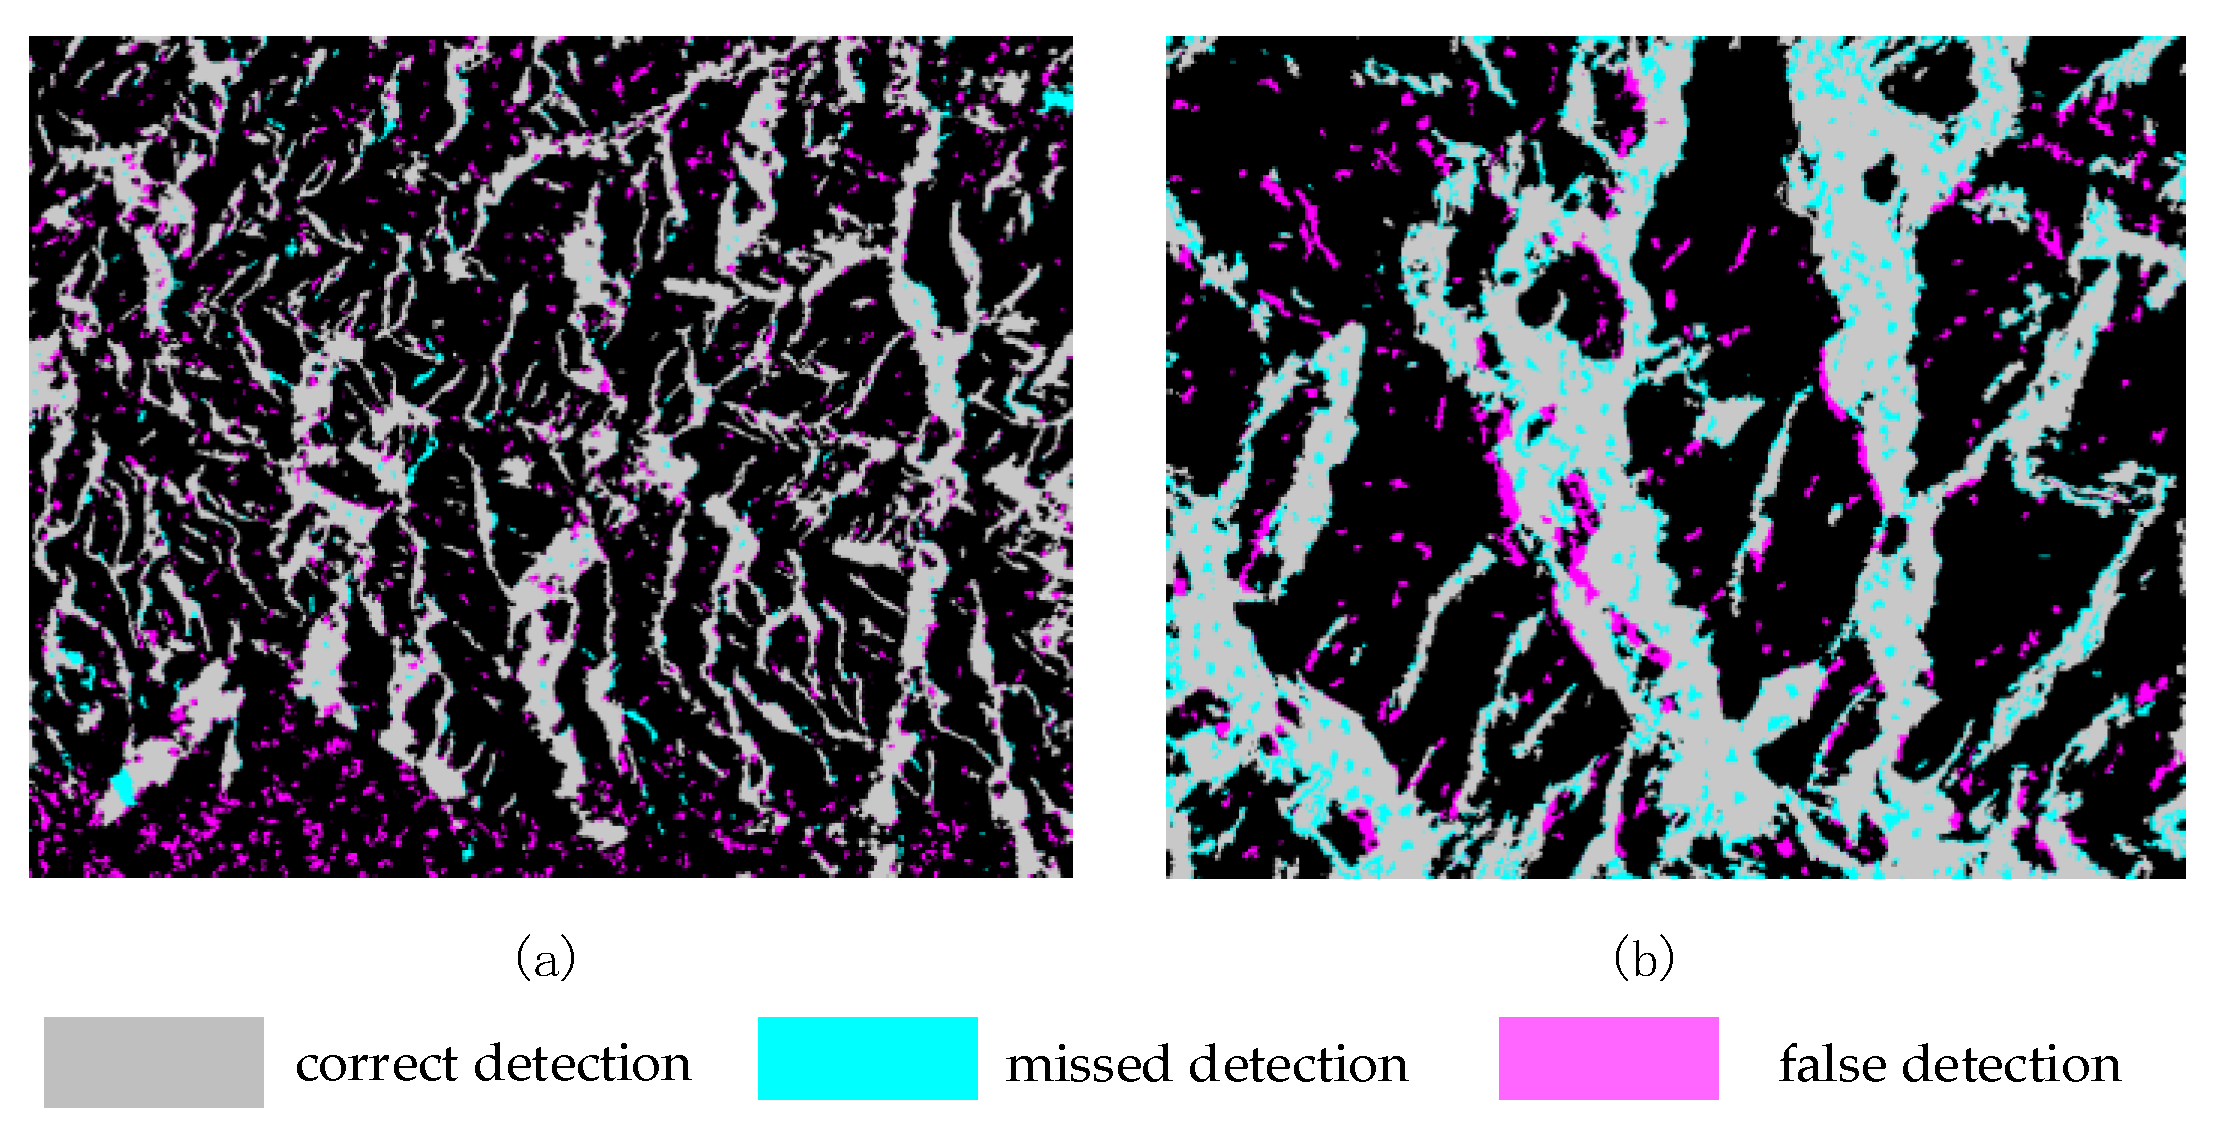
4.3.3. Comparative Analysis with Other Method
5. Conclusions
Author Contributions
Funding
Institutional Review Board Statement
Informed Consent Statement
Data Availability Statement
Acknowledgments
Conflicts of Interest
References
- Zhang, T.; Zhang, X. High-Speed Ship Detection in SAR Images Based on a Grid Convolutional Neural Network. Remote Sens. 2019, 11, 1206. [Google Scholar] [CrossRef] [Green Version]
- Ghazifard, A.; Akbari, E.; Shirani, K.; Safaei, H. Evaluating land subsidence by field survey and D-InSAR technique in Damaneh City, Iran. J. Arid. Land 2017, 9, 778–789. [Google Scholar] [CrossRef]
- Kang, M.; Baek, J. SAR Image Change Detection via Multiple-Window Processing with Structural Similarity. Sensors 2021, 21, 6645. [Google Scholar] [CrossRef] [PubMed]
- Gao, Y.; Gao, F.; Dong, J.; Wang, S. Change Detection From Synthetic Aperture Radar Images Based on Channel Weighting-Based Deep Cascade Network. IEEE J. Sel. Top. Appl. Earth Obs. Remote Sens. 2019, 12, 4517–4529. [Google Scholar] [CrossRef]
- Zhang, X.; Liu, G.; Zhang, C.; Atkinson, P.M.; Tan, X.; Jian, X.; Zhou, X.; Li, Y. Two-Phase Object-Based Deep Learning for Multi-Temporal SAR Image Change Detection. Remote Sens. 2020, 12, 548. [Google Scholar] [CrossRef] [Green Version]
- Chen, H.; Shi, Z. A Spatial-Temporal Attention-Based Method and a New Dataset for Remote Sensing Image Change Detection. Remote Sens. 2020, 12, 1662. [Google Scholar] [CrossRef]
- Doulgeris, A.P. An automatic u-distribution and markov random field segmentation algorithm for PolSAR images. IEEE Trans. Geosci. Remote Sens. 2014, 53, 1819–1827. [Google Scholar] [CrossRef] [Green Version]
- Maghsoudi, Y.; Collins, M.J.; Leckie, D.G. Radarsat-2 Polarimetric SAR Data for Boreal Forest Classification Using SVM and a Wrapper Feature Selector. IEEE J. Sel. Top. Appl. Earth Obs. Remote Sens. 2013, 6, 1531–1538. [Google Scholar] [CrossRef]
- De Oliveira, C.G.; Paradella, W.R. An Assessment of the Altimetric Information Derived from Spaceborne SAR (RADARSAT-1, SRTM3) and Optical (ASTER) Data for Cartographic Application in the Amazon Region. Sensors 2008, 8, 3819–3829. [Google Scholar] [CrossRef] [Green Version]
- Miller, S.D.; Straka, W.C.; Bachmeier, A.S.; Schmit, T.J.; Partain, P.T.; Noh, Y.-J. Earth-viewing satellite perspectives on the Chelyabinsk meteor event. Proc. Natl. Acad. Sci. USA 2013, 110, 18092–18097. [Google Scholar] [CrossRef] [PubMed] [Green Version]
- Yi, Y.S.; Zhang, L.R.; Xin, L.; Liu, N. A Large Scene Imaging Algorithm for Missile-borne Side-looking SAR. J. Electron. Inf. Technol. 2010, 32, 587–592. [Google Scholar] [CrossRef]
- Gatelli, F.; Guamieri, A.M.; Parizzi, F.; Pasquali, P.; Prati, C.; Rocca, F. The wavenumber shift in SAR interferometry. IEEE Trans. Geosci. Remote Sens. 1994, 32, 855–865. [Google Scholar] [CrossRef] [Green Version]
- Gini, F.; Lombardini, F.; Montanari, M. Layover solution in multibaseline SAR interferometry. IEEE Trans. Aerosp. Electron. Syst. 2002, 38, 1344–1356. [Google Scholar] [CrossRef]
- Eineder, M.; Adam, N. A maximum-likelihood estimator to simultaneously unwrap, geocode, and fuse SAR interferograms from different viewing geometries into one digital elevation model. IEEE Trans. Geosci. Remote Sens. 2005, 43, 24–36. [Google Scholar] [CrossRef]
- Cai, B.; Du, X.Y.; Dong, Z.; Liang, D.N. Layover and Shadow Detection Based on Distributed Spaceborne Single-Baseline InSAR. J. Signal Process. 2010, 26, 961–967. [Google Scholar] [CrossRef] [Green Version]
- Ren, Y.; Zou, H.X.; Qin, X.X.; Ji, K.F. A method for layover and shadow detecting in InSAR. J. Cent. South Univ. 2013, 44, 396–400. [Google Scholar]
- Du, X.Y.; Yang, Q.; Cai, B.; Liang, D.N. A new method on shadow and layover detection of InSAR. In Proceedings of the IEEE 2017 Sixth Asia-Pacific Conference on Antennas and Propagation (APCAP), Xi’an, China, 16–19 October 2017. [Google Scholar] [CrossRef]
- Guindon, B.; Adair, M. Analytic Formulation of Spaceborne SAR Image Geocoding and “Value-Added” Product Generation Procedures using Digital Elevation Data. Can. J. Remote Sens. 1992, 18, 2–12. [Google Scholar] [CrossRef]
- Li, N.; Wang, R.; Deng, Y.; Liu, Y.; Wang, C.; Balz, T.; Li, B. Polarimetric Response of Landslides at X-Band Following the Wenchuan Earthquake. IEEE Geosci. Remote Sens. Lett. 2014, 11, 1722–1726. [Google Scholar] [CrossRef]
- Kakooei, M.; Nascetti, A.; Ban, Y. Sentinel-1 Global Coverage Foreshortening Mask Extraction: An Open Source Implementation Based on Google Earth Engine. In Proceedings of the IGARSS 2018—2018 IEEE International Geoscience and Remote Sensing Symposium, Valencia, Spain, 22–27 July 2018; pp. 6836–6839. [Google Scholar] [CrossRef]
- Zhang, T.T.; Yang, H.L.; Li, D.M.; Li, Y.J.; Liu, J.N. Identification of layover and shadows regions in SAR images: Taking Badong as an example. Bull. Surv. Mapp. 2019, 11, 85–88. [Google Scholar] [CrossRef]
- Wang, H.; Cheng, Q.; Wang, T.; Zhang, G.; Wang, Y.; Li, X.; Jiang, B. Layover Compensation Method for Regional Spaceborne SAR Imagery Without GCPs. IEEE Trans. Geosci. Remote Sens. 2021, 59, 8367–8381. [Google Scholar] [CrossRef]
- Na, M.-A.; Gulnur, I.; Ma, C.-Y.; Mamat, S. Extraction of crop acreage based on multi-temporal and dual-polarization SAR data. Acta Agron. Sin. 2020, 46, 1099–1111. [Google Scholar] [CrossRef]
- Xu, J.; Zhen, L.; Tian, B.S.; Lei, H.; Quan, C.; Fu, S.T. Polarimetric analysis of multi-temporal RADARSAT-2 SAR images for wheat monitoring and mapping. Int. J. Remote Sens. 2014, 35, 3840–3858. [Google Scholar] [CrossRef]
- El Hajj, M.; Baghdadi, N.; Zribi, M.; Angelliaume, S. Analysis of Sentinel-1 Radiometric Stability and Quality for Land Surface Applications. Remote Sens. 2016, 8, 406. [Google Scholar] [CrossRef] [Green Version]
- Yamaguchi, Y.; Sato, A.; Boerner, W.M.; Sato, R.; Yamada, H. Four-Component Scattering Power Decomposition With Rotation of Coherency Matrix. IEEE Trans. Geosci. Remote Sens. 2011, 49, 2251–2257. [Google Scholar] [CrossRef]
- National Earth System Science Data Center. Available online: http://www.geodata.cn/ (accessed on 28 March 2021).
- Zheng, C.; Yao, H. Segmentation for remote-sensing imagery using the object-based Gaussian-Markov random field model with region coefficients. Int. J. Remote Sens. 2019, 40, 4441–4472. [Google Scholar] [CrossRef]
- Kumar, A.; Ghosh, S.K.; Dadhwal, V.K. Full fuzzy land cover mapping using remote sensing data based on fuzzy c-means and density estimation. Can. J. Remote Sens. 2007, 32, 81–87. [Google Scholar] [CrossRef]
- Achanta, R.; Shaji, A.; Smith, K.; Lucchi, A.; Fua, P.; Süsstrunk, S. SLIC Superpixels Compared to State-of-the-Art Superpixel Methods. IEEE Trans. Pattern Anal. Mach. Intell. 2012, 34, 2274–2282. [Google Scholar] [CrossRef] [Green Version]
- Zhang, Y.; Liu, K.; Dong, Y.; Wu, K.; Hu, X. Semisupervised Classification Based on SLIC Segmentation for Hyperspectral Image. IEEE Geosci. Remote Sens. Lett. 2019, 17, 1440–1444. [Google Scholar] [CrossRef]
- Sun, W.; Guo, M. Image segmentation based on SLIC and conditional random field. Appl. Res. Comput. 2015, 32, 3817–3820. [Google Scholar] [CrossRef]
- Tan, X.; Xia, X.; Li, S. Water quality characteristics and integrated assessment based on multistep correlation analysis in the Danjiangkou reservoir, China. J. Environ. Inf. 2015, 25, 60–70. [Google Scholar] [CrossRef]
- Kang, L.; Xiaocong, H.E. Risk analysis of synchronous asynchronous encounter probability of rich-poor precipitation in the Middle Route of South-to-North Water. J. Adv. Water Sci. 2011, 22, 44–50. [Google Scholar] [CrossRef]
- Wu, L.; Wang, L.; Min, L.; Hou, W.; Guo, Z.; Zhao, J.; Li, N. Discrimination of Algal-Bloom Using Spaceborne SAR Observations of Great Lakes in China. Remote Sens. 2018, 10, 767–789. [Google Scholar] [CrossRef] [Green Version]
- Yu, Z.R.; Yang, X.M.; Chen, Y.J. Ecological protection and restoration of mountains-rivers-vegetations-farmlands-lakes-grasslands in Nantaihang area, Henan Province: Integrated landscape management. Acta Ecol. Sin. 2019, 39, 8886–8895. [Google Scholar] [CrossRef]
- Geudtner, D.; Torres, R.; Snoeij, P.; Ostergaard, A.; Navas-Traver, I. Sentinel-1 mission capabilities and SAR system. In Proceedings of the 2013 IEEE Radar Conference, Ottawa, ON, Canada, 29 April–3 May 2013; pp. 1–4. [Google Scholar] [CrossRef]
- Cui, X.C.; Su, Y.; Chen, S.W. Polarimetric SAR ship detection based on polarimetric rotation domain features and superpixel technique. J. Radars 2021, 10, 35–48. [Google Scholar]


| SAR Sensor Platform | Mode | Swath (km2) | Resolution (m) |
|---|---|---|---|
| Sentinel-1A/B | TOPS | 250 | 20 |
| GF-3 | Standard strip | 130 | 25 |
| TerraSAR-X | ScanSAR | 100 | 16 |
| ALOS-2 | ScanSAR | 350 | 25 |
| COSMO-SkyMed | ScanSAR | 100 | 30 |
| Category | Built-Up Areas | Vegetation | Farmland | Water |
|---|---|---|---|---|
| BC | >−13 dB | (−10 dB)–(−15 dB) | (−8 dB)–(−18 dB) | <−18 dB |
| Dense Building Areas | Sparse Building Areas | Layover Areas | |
|---|---|---|---|
| VV image | −1.98 dB | −8.89 dB | −5.8 dB |
| VH image | −7.34 dB | −8.42 dB | −6.01 dB |
| Study Area | Image Date |
|---|---|
| Danjiangkou Reservoir | 1/May/2019, 13/May/2019, 6/June/2019, 18/June/2019, 30/June/2019, 12/July/2019, 24/July/2019, 5/August/2019, 17/August/2019, 29/August/2019, 10/September/2019, 22/September/2019, 4/October/2019, 16/October/2019, 28/October/2019, 9/September/2019, 21/November/2019, 3/December/2019, 15/December/2019, 27/December/2019, 8/January/2020, 20/January/2020, 1/February/2020, 13/February/2020, 25/February/2020, 8/March/2020, 20/March/2020, 1/April/2020, 13/April/2020, 25/April/2020, 7/May/2020 |
| Region A | 185,307 | 7455 | 18,839 | 87.6% |
| Region B | 88,541 | 9561 | 8167 | 83.3% |
| Study Area | Image Date |
|---|---|
| South Taihang | 19/July/2019, 31/July/2019, 12/August/2019, 24/August/2019, 5/September/2019, 17/September/2019, 29/September/2019, 11/October/2019, 23/October/2019, 4/November/2019, 16/November/2019, 28/November/2019, 10/December/2019, 22/December/2019, 3/January/2020, 15/January/2020, 27/January/2020, 8/February/2020, 3/March/2020, 15/March/2020, 27/March/2020, 8/April/2020, 20/April/2020, 2/May/2020, 14/May/2020, 7/June/2020, 19/June/2020, 1/July/2020, 25/July/2020 |
| Region C | 84,594 | 5126 | 8640 | 86.0% |
| Region D | 67,818 | 5110 | 6316 | 85.6% |
| DifferenceFoM | |||||
|---|---|---|---|---|---|
| Region A | 182,166 | 10,596 | 31,732 | 81.1% | 6.5% lower |
| Region B | 80,730 | 17,372 | 9295 | 75.1% | 8.2% lower |
Publisher’s Note: MDPI stays neutral with regard to jurisdictional claims in published maps and institutional affiliations. |
© 2021 by the authors. Licensee MDPI, Basel, Switzerland. This article is an open access article distributed under the terms and conditions of the Creative Commons Attribution (CC BY) license (https://creativecommons.org/licenses/by/4.0/).
Share and Cite
Wu, L.; Wang, H.; Li, Y.; Guo, Z.; Li, N. A Novel Method for Layover Detection in Mountainous Areas with SAR Images. Remote Sens. 2021, 13, 4882. https://doi.org/10.3390/rs13234882
Wu L, Wang H, Li Y, Guo Z, Li N. A Novel Method for Layover Detection in Mountainous Areas with SAR Images. Remote Sensing. 2021; 13(23):4882. https://doi.org/10.3390/rs13234882
Chicago/Turabian StyleWu, Lin, Hongxia Wang, Yuan Li, Zhengwei Guo, and Ning Li. 2021. "A Novel Method for Layover Detection in Mountainous Areas with SAR Images" Remote Sensing 13, no. 23: 4882. https://doi.org/10.3390/rs13234882
APA StyleWu, L., Wang, H., Li, Y., Guo, Z., & Li, N. (2021). A Novel Method for Layover Detection in Mountainous Areas with SAR Images. Remote Sensing, 13(23), 4882. https://doi.org/10.3390/rs13234882