Article

Cross-Comparison of Global Surface Albedo Operational Products-MODIS, GLASS, and CGLS

1
College of Surveying and Mapping and Geographic Science, Liaoning Technical University, Fuxin 123000, China
2
Xinjiang Institute of Ecology and Geography, Chinese Academy of Sciences, Urumqi 830011, China
3
CAS Research Center for Ecology and Environment of Central Asia, Urumqi 830011, China
4
College of Resources and Environmental, University of Chinese Academy of Sciences, Beijing 100049, China
5
Institute of Resource and Environmental Science, Xinjiang University, Urumqi 830046, China
6
Xinjiang Branch, Chinese Academy of Sciences, Urumqi 830011, China
7
School of Aeronautics and Astronautics, Sun Yat-sen University Shenzhen Campus, Shenzhen 518107, China
8
Shenyang Gas Co., Ltd., Shenyang 110000, China
9
RIOH Automobile Testing & Certification Technology Co., Ltd., Beijing 101103, China
*
Author to whom correspondence should be addressed.
C. Shao and Y. Shuai co-first authors.
Remote Sens. 2021, 13(23), 4869; https://doi.org/10.3390/rs13234869
Submission received: 19 September 2021 / Revised: 24 November 2021 / Accepted: 25 November 2021 / Published: 30 November 2021
(This article belongs to the Section Environmental Remote Sensing)

Abstract

:
Surface albedo, as an important parameter for land surface geo-biophysical and geo-biochemical processes, has been widely used in the research communities involved in surface energy balance, weather forecasting, atmospheric circulation, and land surface process models. In recent years, operational products using satellite-based surface albedo have, from time to time, been rapidly developed, contributing significantly to the estimation of energy balance at regional or global scales. The increasing number of research topics on dynamic monitoring at a decades-long scale requires a combination of albedo products generated from various sensors or programs, while the quantitative assessment of agreement or divergence among different surface albedo products still needs further understanding. In this paper, we investigated the consistency of three classical operational surface albedo products that have been frequently used by researchers globally via the official issued datasets-MODIS, GLASS (Global LAnd Surface Satellite), and CGLS (Copernicus Global Land Service). The cross-comparison was performed on all the identical dates available during 2000–2017 to represent four season-phases. We investigated the pixel-based validity of each product, consistency of global annual mean, spatial distribution and different temporal dynamics among the discussed products in white-sky (WSA) and black-sky (BSA) albedo at visible (VIS), near-infrared (NIR), and shortwave (SW) regimes. Further, varying features along with the change of seasons was also examined. In addition, the variation in accuracy of shortwave albedo magnitude was explored using ground measurements collected by the Baseline Surface Radiation Network (BSRN) and the Surface Radiation Budget Network (SUFRAD). Results show that: (1) All three products can provide valid long-term albedo for dominant land surface, while GLASS can provide additional estimation over sea surfaces, with the highest percentage of valid land surface pixels, at up to 93% in 24 October. The invalid pixels mainly existed in the 50°N–60°N latitude belt in December for GLASS, Central Africa in April and August for MODIS, and northern high latitudes for CGLS. (2) The global mean albedo of CGLS at the investigated bands has significantly higher values than those of MODIS and GLASS, with a relative difference of ~20% among the three products. The global mean albedo of MODIS and GLASS show a generally increasing trend from April to December, with an abrupt rise at NIR and SW of CGLS in June of 2014. Compared with SW and VIS bands, the linear temporal trend of the NIR global albedo mean in three products continues to increase, but the slope of CGLS is 10–100 times greater than that of the other two products. (3) The differences in albedo, which are higher in April, October, and December than in August, exhibit a small variation over the main global land surface regions, except for Central Eurasia, North Africa, and middle North America. The magnitude of global absolute difference among the three products usually varies within 0.02–0.06, but with the largest value occasionally exceeding 0.1. The relative difference is mainly within 10–20%, and can deviate more than 40% away from the baseline. In addition, CGLS has a greater opportunity to achieve the largest difference compared with MODIS and GLASS. (4) The comparison with ground measurements indicates that MODIS generally performs better than GLASS and CGLS at the sites discussed. This study demonstrates that apparent differences exist among the three investigated albedo products due to the ingested source data, algorithm, atmosphere correction etc., and also points at caution regarding data fusion when multiple albedo products were organized to serve the following applications.

Graphical Abstract

1. Introduction

Surface albedo, defined as the ratio of solar radiation reflected from the Earth’s surface to total incoming solar radiation, is a critical geographical parameter that has been widely used in the surface energy budget of medium and long-term weather forecasting, global change, general circulation models, etc. [1,2]. Surface albedo, varying with natural processes and human activities, is often marked by deforestation, reforestation, urbanization, agriculture management, etc., and in turn feeds back into the atmosphere to alter the climate system, then further influencing land surface ecosystems [3,4,5]. Charney et al. claimed that increased surface albedo caused by the decrease of vegetation cover could lead to or perpetuate drought in the Sahara Desert [6]. Veraverbeke et al. evaluated post-fire changes in surface temperature and surface albedo using multi-temporal MODIS data, and concluded that surface albedo sharply decreased immediately after the fire event [7]. Hu et al. claimed that human-induced albedo change would bring negative radiative forces, with land cover changes, using the 1992–2012 time series data, which may further promote cooling effects in northern China [4]. Other studies have pointed out that the natural reforesting process in fire-disturbed forest regions can last for decades, whereas the development or transition among surface ecosystems can last for up to hundreds of years, especially those involved in the climate change [8,9,10]. Temporal analysis of albedo variation occurring with land surface changes is required, in order to help in revealing the energy balance features in many surface bio-geophysical and bio-geochemical processes, as well as related feedback to the climate system, which can also provide relevant references for environmental climate change simulation. Consequently, the long-term, high quality and temporal-spatial data series is of great significance for regional or global climate change, and biogeochemical, hydrological, and weather forecast models.
Satellite data provide a unique opportunity to monitor surface albedo at a regional or global scale. With the support of Earth observation programs globally, an open policy regarding current or historic archived data, supported by several satellite programs, makes it possible to retrieve the surface albedo from multi-source land surface observations. By now, quite a few surface albedo products at various resolutions have been generated from different satellite observations [11], which include the operationally standard products that have been frequently used by worldwide customers, such as MODIS/VIIRS (Visible Infrared Imaging Radiometer Suit) [12,13], CGLS (Copernicus Global Land Service) [14], GLASS (Global LAnd Surface Satellite) [15,16], and those listed in Table S1 [17,18,19,20,21,22,23,24,25,26]. These products are generated at temporal intervals, spanning from a daily to an annual mode, in sporadic individual years or a continuous series of years, with the spatial resolution varying from 30 m to 55 km in order to fit the requirement of energy balance in numerous research communities. The albedo algorithm in the early stage usually adopts the single-angle model with an isotropic assumption of land surface, while the modern approach has adequately considered anisotropy features through multi-angle observations, first to inverse a Bidirectional Reflection Distribution Function (BRDF) model of the target, then to integrate an illumination or view hemisphere to estimate certain albedo quantities [27]. Compared with other BRDF-based approaches, the semi-empirical kernel-driven linear model is widely adopted by most current operational surface albedo products due to its simplicity and operability [28], especially the kernel-driven linear model Ross-Thick/Li-Sparse-Reciprocal (RTLSR) [29].
There has been a rapidly increasing requirement for long-term surface albedo series in recent decades to serve in the budgetary related estimation of energy along with natural or anthropological disturbances among endmembers of land surface [30,31,32]. As for natural disturbances, Riiheläet al. analyzed 30-year albedo over Greenland ice sheets to examine the relationship between ice sheet and surface energy balance using a CLARA-A2 albedo dataset between 1982–2015 [33]. Möllera et al. investigated albedo changes in ice caps before and after eruption of the Icelandic volcano “Eyjafjallajökull” using MOD10A1 and MCD43A3 products between 2001–2016, and claimed an overall decrease of albedo magnitude within the duration of the volcanic ash cover [34]. For human activities, Deng et al. used the MODIS albedo product and other datasets, to explore the feedback of the “Three Northern Protection Forests” program on climate variables, and pointed out a decreasing trend of surface albedo during 2000–2015 [3]. Zhao et al. adopted GLASS albedo data across the “Beijing-Tianjin-Hebei” region from 1990 to 2010 and concluded that surface albedo tended to decrease with the progress of urbanization [35]. Numerous studies of long-term processes intend to adopt these operational standard products due to their open policy, routine generation and continuity of data service. Among them, the global cover datasets MODIS, GLASS, and CGLS have been widely used all over the word many research topics. Compared with MODIS and GLASS, the CGLS dataset released several years ago has rapidly increasing potential for further applications in terms of its temporal representativeness, though it has relatively less data users at present. In the context of long-term response and feedback among climate and land surface ecosystems, applications, along with the growing demand, require the construction of multiple surface albedo datasets to span several programs of the Earth Observation System (EOS) and acquire decades’ worth of data series.
Quantities of albedo with different definitions are frequently generated by diverse approaches from various satellite-based observations which usually have diverse spatial and temporal resolutions. Shuai et al. pointed out that a non-ignorable relative difference exists among albedo terms defined over certain observed geometries or at different spectral regimes, which can potentially introduce considerable errors in subsequent applications [27]. He et al. [36] discussed nine shortwave (SW) albedo datasets spanning 1981–2010 including MODIS, MERIS (Medium-Resolution Imaging Spectrometer), GLASS, GlobAlbedo, CLARA-SAL (Clouds, Albedo, and Radiation-Surface Albedo), ERBE (Earth Radiation Budget Experiment), and three surface SW radiation datasets: ISCCP (International Satellite Cloud Climatology Project), GEWEX (Global Energy and Water Exchanges Project), and CERES (Clouds and the Earth’s Radiant Energy System), and subsequently claimed about 0.02–0.03 difference in global mean albedo, and better agreement in summer than winter, particularly at high latitudes where the maximal difference range varies from 0.1 to 0.4. Song et al. [37] compared the SW albedo of MISR, MODIS and CGLS products during 2012–2016 with ground measurements, and concluded that MODIS had the best agreement with ground measurements, sequentially followed by MISR and CGLS, with enhanced biases. Mota et al. [38] investigated the evolution of surface albedo over a burned area using MODIS, CGLS and GlobAlbedo products during 2005–2011 at a global scale, and concluded that the trend of broadband SW and near-infrared (NIR) changes provided by GlobAlbedo and MODIS data suites exhibited better spatial and temporal consistency with the rhythm of fire emergence and the subsequent recovery progress, compared with the performance of the CGLS albedo product. Thus, it is inevitable that the consistency of albedo products is assessed before organizing them for any particular application.
A further thorough comparison of albedo quantities is still required to meet the need of long-term research. First, albedo quantities at various spectral regimes, not only SW albedo, are needed by different research communities. Although SW broadband albedo can represent the total energy reflected by the earth’s surface, visible (VIS) and NIR broadband albedos implying a special vegetation signature of are requested by an increasing number of users for land cover detection or monitoring [29]. Abera et al. revealed that VIS albedo has a stronger response than NIR albedo over four natural vegetation types disturbed by precipitation extremes [39]. Secondly, most of the assessment of individual albedo products compare with ground measurements in the early stage of product development [40,41], or take a cross-comparison between two datasets later [13,42,43], but only over limited validation sites, which makes it hard to illuminate their performance on a regional or global scale. Further, recent investigations at a global or regional scale intend to focus on the mean value comparison for the long-term series [34] or on the distribution of spatial difference for a short period [43], and are less concerned with discussion of pixel-based product availability, the inverse algorithm, spectral band comparison, and distribution of spatial difference at the global scale of a long-term series with exactly matched product dates and spatial resolutions. Therefore, we will compare the pixel-based albedo differences in the VIS, NIR, and SW regime of three operational global products (MODIS, GLASS and CGLS) on all of available and identical days from 2000–2017 to avoid the potential uncertainty induced by date switches. Section 2 describes the albedo datasets and the methodology for albedo calculation and comparison, and Section 3 presents the results, followed by discussion in Section 4, and conclusion in Section 5.

2. Data and Methodology

2.1. Data

This paper selected three operational surface albedo products, MODIS, GLASS and CGLS, that have been widely used in the satellite-based community for this study of the consistency of surface albedo retrievals. To establish the relevant baseline of magnitude difference, we also adopted high quality ground measurements of surface albedo over representative ground covers as the means to evaluate divergence among the discussed products.

2.1.1. Ground Measurements

The high-quality land surface radiation measurements collected by BSRN and SUFRAD networks are adopted as the ground baseline to evaluate the performance of our cross-comparison [44,45,46]. Though numerous radiation stations have been established since the 1950s, their application for satellite-based surface albedo validation is quite limited due to less representativeness at the spatial scale and the lack of detailed flux components or auxiliary atmosphere parameters. Most of the stations built before 1990s belong to the routine meteorological observation network whose purpose mainly is to collect signals of incoming solar radiation, and less attention is paid to the surface outgoing radiation. Further, the tower height mounted by radiation devices is usually 1–2 m [47], and thus the footprint of the face-down instrument is far smaller than the 1 km-pixel scale. In addition, the observation system of ground meteorological stations is often deployed within a 25 m × 25 m plot which is frequently covered by various small patches [47]. Thus, most of the early meteorological stations have a limited representativeness for the surrounding surface at 1 km spatial resolution. Later, with the need to validate satellite-based products and the requirement to upscale surface parameters, towers with increased height of up to tens of meters emerged for collecting surface or near surface parameters at various grades of spatial scale.
Baseline Surface Radiation Network (BSRN) and Surface Radiation Budget Network (SUFRAD) stations are typically equipped with 10-m towers on which three pyranometers (0.28~3.0 μm) and one pyrheliometer are mounted to continuously measure four flux components of solar radiation every 1 min or 3 min. Total downwelling solar radiation, also called global solar radiation, is measured on the main platform by a face-up broadband pyranometer, while upwelling solar radiation is measured by a face-down pyranometer on a cross-arm near the top of the tower. The direct normal and diffused shortwave components are monitored respectively with a normal incidence pyrheliometer and a shaded pyranometer that rides on the solar tracker. Several studies have claimed the high representativeness of surrounding land cover situations at these SURFRAD and BRSN radiation sites (as shown in Figure 1 and listed Table 1) [18,46]. This paper required the 2000–2017 four-component flux data for incoming and outgoing solar radiation, as well as measurements of auxiliary atmosphere parameters from SURFRAD and the BRSN official supplier (http://bsrn.awi.de and http://www.esrl.noaa.gov/gmd/grad/surfrad/, accessed on 20 May 2020). Before being used for comparison, the ground data with obvious errors, such as fill values and outliers, were removed from the data series, and clear and cloudy days were distinguished based on clear sky criterion with fraction of diffuse illumination less than 30%. To match the satellite-based retrievals, ground measures of surface albedo at local solar noon were averaged from the ratio of upward to downward shortwave radiation between 11:00–13:00.

2.1.2. MODIS

MODIS albedo products were developed first by the Boston University BRDF/Albedo team in the 1990s and later at the University of Massachusetts, Boston, for continuous VIIRS BRDF/albedo products, circa 2010s, estimated by the semi-empirical linear RTLSR kernel-driven model from atmospherically-corrected multi-angle surface reflectance of MODIS mounted on Terra and Aqua [12,48]. Black-Sky- and White-Sky-Albedo (BSA & WSA) were defined under two extreme ideal conditions respectively without any diffuse, or only with ideal diffuse, radiation in the hemisphere, calculated through the integration of directional reflectance over related illumination and view hemispheres at the VIS (0.3~0.7 μm), NIR (0.7~5.0 μm), and SW (0.3~5.0 μm) regimes. MODIS has been providing the global surface albedo products at 500 m,1 km, and 0.05° spatial scale and serving data users daily, or with 8-day or 16-day products, since 2000 and probably for further decades via the contribution of its successor VIIRS. The current MODIS/VIIRS BRDF/albedo data released by the NASA/USGS official data pool is MODIS Collection 6 (C6) and VIIRS Version 001. MCD43 C6 is upgraded by a daily rolling strategy with the enhancement of observations collected on the most recent days within the 16-day retrieval window [49], and the 1 km MCD43B data suit has been discontinued and replaced by MCD43D in geographic projection of CMG (Climate Modeling Grid) format, which is estimated using all of the available clear-sky 500 m observations within the 1 km-bin. The output data suit saved in HDF-EOS format includes BSA and WSA of three broad-bands (VIS, NIR, and SW), seven narrow-bands (0.620~0.670 μm, 0.841~0.876 μm, 0.459~0.479 μm, 0.545~0.565 μm, 1.300~1.250 μm, 1.628~1.652 μm, 2.105~2.135 μm), and quality assessment (QA) data layers. According to the Committee on Earth Observation Satellites (CEOS) Land Product Validation (LPV) hierarchy, MODIS BRDF/albedo products have achieved stage 3 validation. Accuracy of the high-quality 500 m MODIS operational albedo estimation is less than 0.05, verified over most of the validation sites: SURFRAD, ARM (Atmospheric Radiation Measurement Network), FLUXNET, and BSRN [41,46,50]. We adopted the global daily 1km MCD43D (C6) including BSA and WSA from 2000–2017, and downloaded them from the recent updated official open data pool https://search.earthdata.nasa.gov/search (accessed on 22 June 2020).

2.1.3. GLASS

The GLASS albedo product was developed by the Beijing Normal University with the support of the key project “Generation and Applications of Global Products of Essential Land Variables” of the “863 program” [51]. The adopted retrieval scheme of GLASS albedo is the Angular Bin (AB) and statistics-based temporal filter (STF) algorithm. The AB algorithm depends on the “observation geometry”-based lookup table established over various land covers, such as vegetation, soil, snow/ice, partial snow/ice, ocean water, sea-ice, and coastal zone. The observation geometry represented by the solar zenith angle, observed zenith angle and relative azimuth is gridded into 2° of zenith angle and 5° of azimuth angle to establish the priori anisotropy lookup table from ~6 km POLDER3 collections and asymptotic radiative transfer (ART) model simulations, respectively, for land surface and snow/ice to estimate BSA and WSA at a spectral regime of VIS (0.3~0.7 μm), NIR (0.7~5.0 μm), and SW (0.3~5.0 μm) directly from AVHRR and MODIS reflectance data. Then a further refinement is performed using the STF algorithm with a 17-day or 33-day filter window to fill gaps and filter outliers from the preliminary outputs generated by the AB algorithm [15,16]. The data suit of GLASS includes 8-day global surface albedo in 1 km and 0.05° spatial resolution from the period 1998–2018. The final product is formatted into HDF-EOS with individual data files of BSA and WSA at VIS, NIR, and SW broadbands, as well as the QA layer. The 0.05° product, after 2000, provides additional data sets of blue-sky albedo at SW, VIS and NIR broadbands. The validation of GLASS albedo product using the ground measurements of 53 relatively homogeneous FLUXNET sites shows the reasonably consistent magnitude and trend of the clear-day ground measurements with bias less than 0.001 and RMSE (Root Mean Square Error) less than 0.05 [42]. Further, the cross-validation between GLASS and MCD43B albedo values shows very similar results, especially for the data with a “good” quality flag [42]. In this study, we required the global 8-day 1 km GLASS02A06 gridded tiles of BSA and WSA at three broadbands in sinusoidal projection form 2000–2017 taken from the official website http://glass-product.bnu.edu.cn/introduction/abd.html (accessed on 25 June 2020).

2.1.4. CGLS

The CGLS (Copernicus Global Land Service) surface albedo, as one of the main bio-geophysical products, is developed with support from the European flagship Earth observation program “Copernicus”, and has been released through the CGLS platform to meet the requirement of global long-term data organization (https://land.copernicus.eu/global, accessed on 22 July 2020).The CGLS albedo also adopts the semi-empirical linear kernel-driven model presented by Roujean et al. to inverse BRDF [14], and then retrieve the ALDH (Directional-Hemispheric Albedo, also called BSA) and ALBH (Bi-Hemispheric Albedo, also called WSA) at VIS (0.3–0.7 μm), NIR (0.7–4.0 μm) and SW (0.3–4.0 μm) broadbands through integration over related illumination-view geometry [14]. The product suite provides 10-day 1 km surface albedo and quality assessment (QA) within the global region of 75°N to 60°S in the NetCDF and TIFF format. The BSA and WSA for three broadbands (VIS, NIR, SW) are produced within a 30-day BRDF retrieval window, first from SPOT VEGETATION from December 1998–May 2014, later transformed into PROBA-V measurements. The 30-day retrieval window of CGLS sequentially ends on the 5th, 15th, and 25th day of each month, thus the start-date is 29 days ahead of each end-day with a one-day shift in leap years. According to protocols and metrics consistent with the guideline proposed by the CEOS LPV group for validation of satellite-derived land products, CGLS products were validated using ground measurements of FLUXNET, SURFRAD, NEON (National Ecological Observatory Network) and reference products (MDOIS, POLDER-3, etc.). Both quality assessments indicate that CGLS surface albedo achieved reasonable quality in most of the evaluation criteria globally, with limitation under snow conditions [43,52,53]. In this study, we used the global 10-day 1 km CGLS BSA and WSA products at three broadbands with geographic latitude and longitude projection in CMG format from 2000 to 2017 downloaded from https://land.copernicus.eu/global/products/sa (accessed on 25 July 2020).
In addition, as three dominant operational land surface albedo products, MODIS, GLASS, and CGLS have sufficiently high frequency to be organized together for long term study. MODIS, GLASS and CGLS have not only the same broadband BSA and WSA products as VIS, NIR and SW broadband, but also similar spatial resolution from hundreds of kilometers over the global region. Further, all the albedo retrieval algorithms considered the surface anisotropy feature. Thus, it will provide solid assistance for the user community to assess consistency among these products, and to present the distribution of difference in each albedo term. In addition, MODIS, GLASS and CGLS can provide products over identical retrieval dates (23 April, 13 August, 24 October, and 3 December) representing various seasons in both southern and northern hemispheres, which permits the chance to improve the cross-comparison among different satellite-based products by avoiding the disturbance induced by different retrieval dates. Therefore, the identical retrieval dates of MODIS, GLASS, and CGLS over the period 2000–2017 were used to examine their consistency at 1 km spatial resolution using MODIS related data suites (MCD43D) MCD43D31, MCD43D42–MCD43D51 and MCD43D52–MCD43D61.
It is necessary to transform various data suites into an identical reference system before the investigation of cross-comparison. The GLASS data suite is tiled in the sinusoidal projection, while MODIS and CGLS are provided with geographic latitude and longitude projection with the ellipsoid WGS84. In this study, we mosaicked all of the available GLASS tiles on each discussed date from 2000–2017, and then reprojected each global GLASS data into the geographic latitude and longitude projection to align with the projection of MODIS and CGLS using the open-source toolkit GDAL. Figure 1 shows an example of the mosaicked global GLASS BSA at NIR on 23 April 2000, and the transformation from sinusoidal projection to geographic latitude and longitude projection.

2.2. Methodology

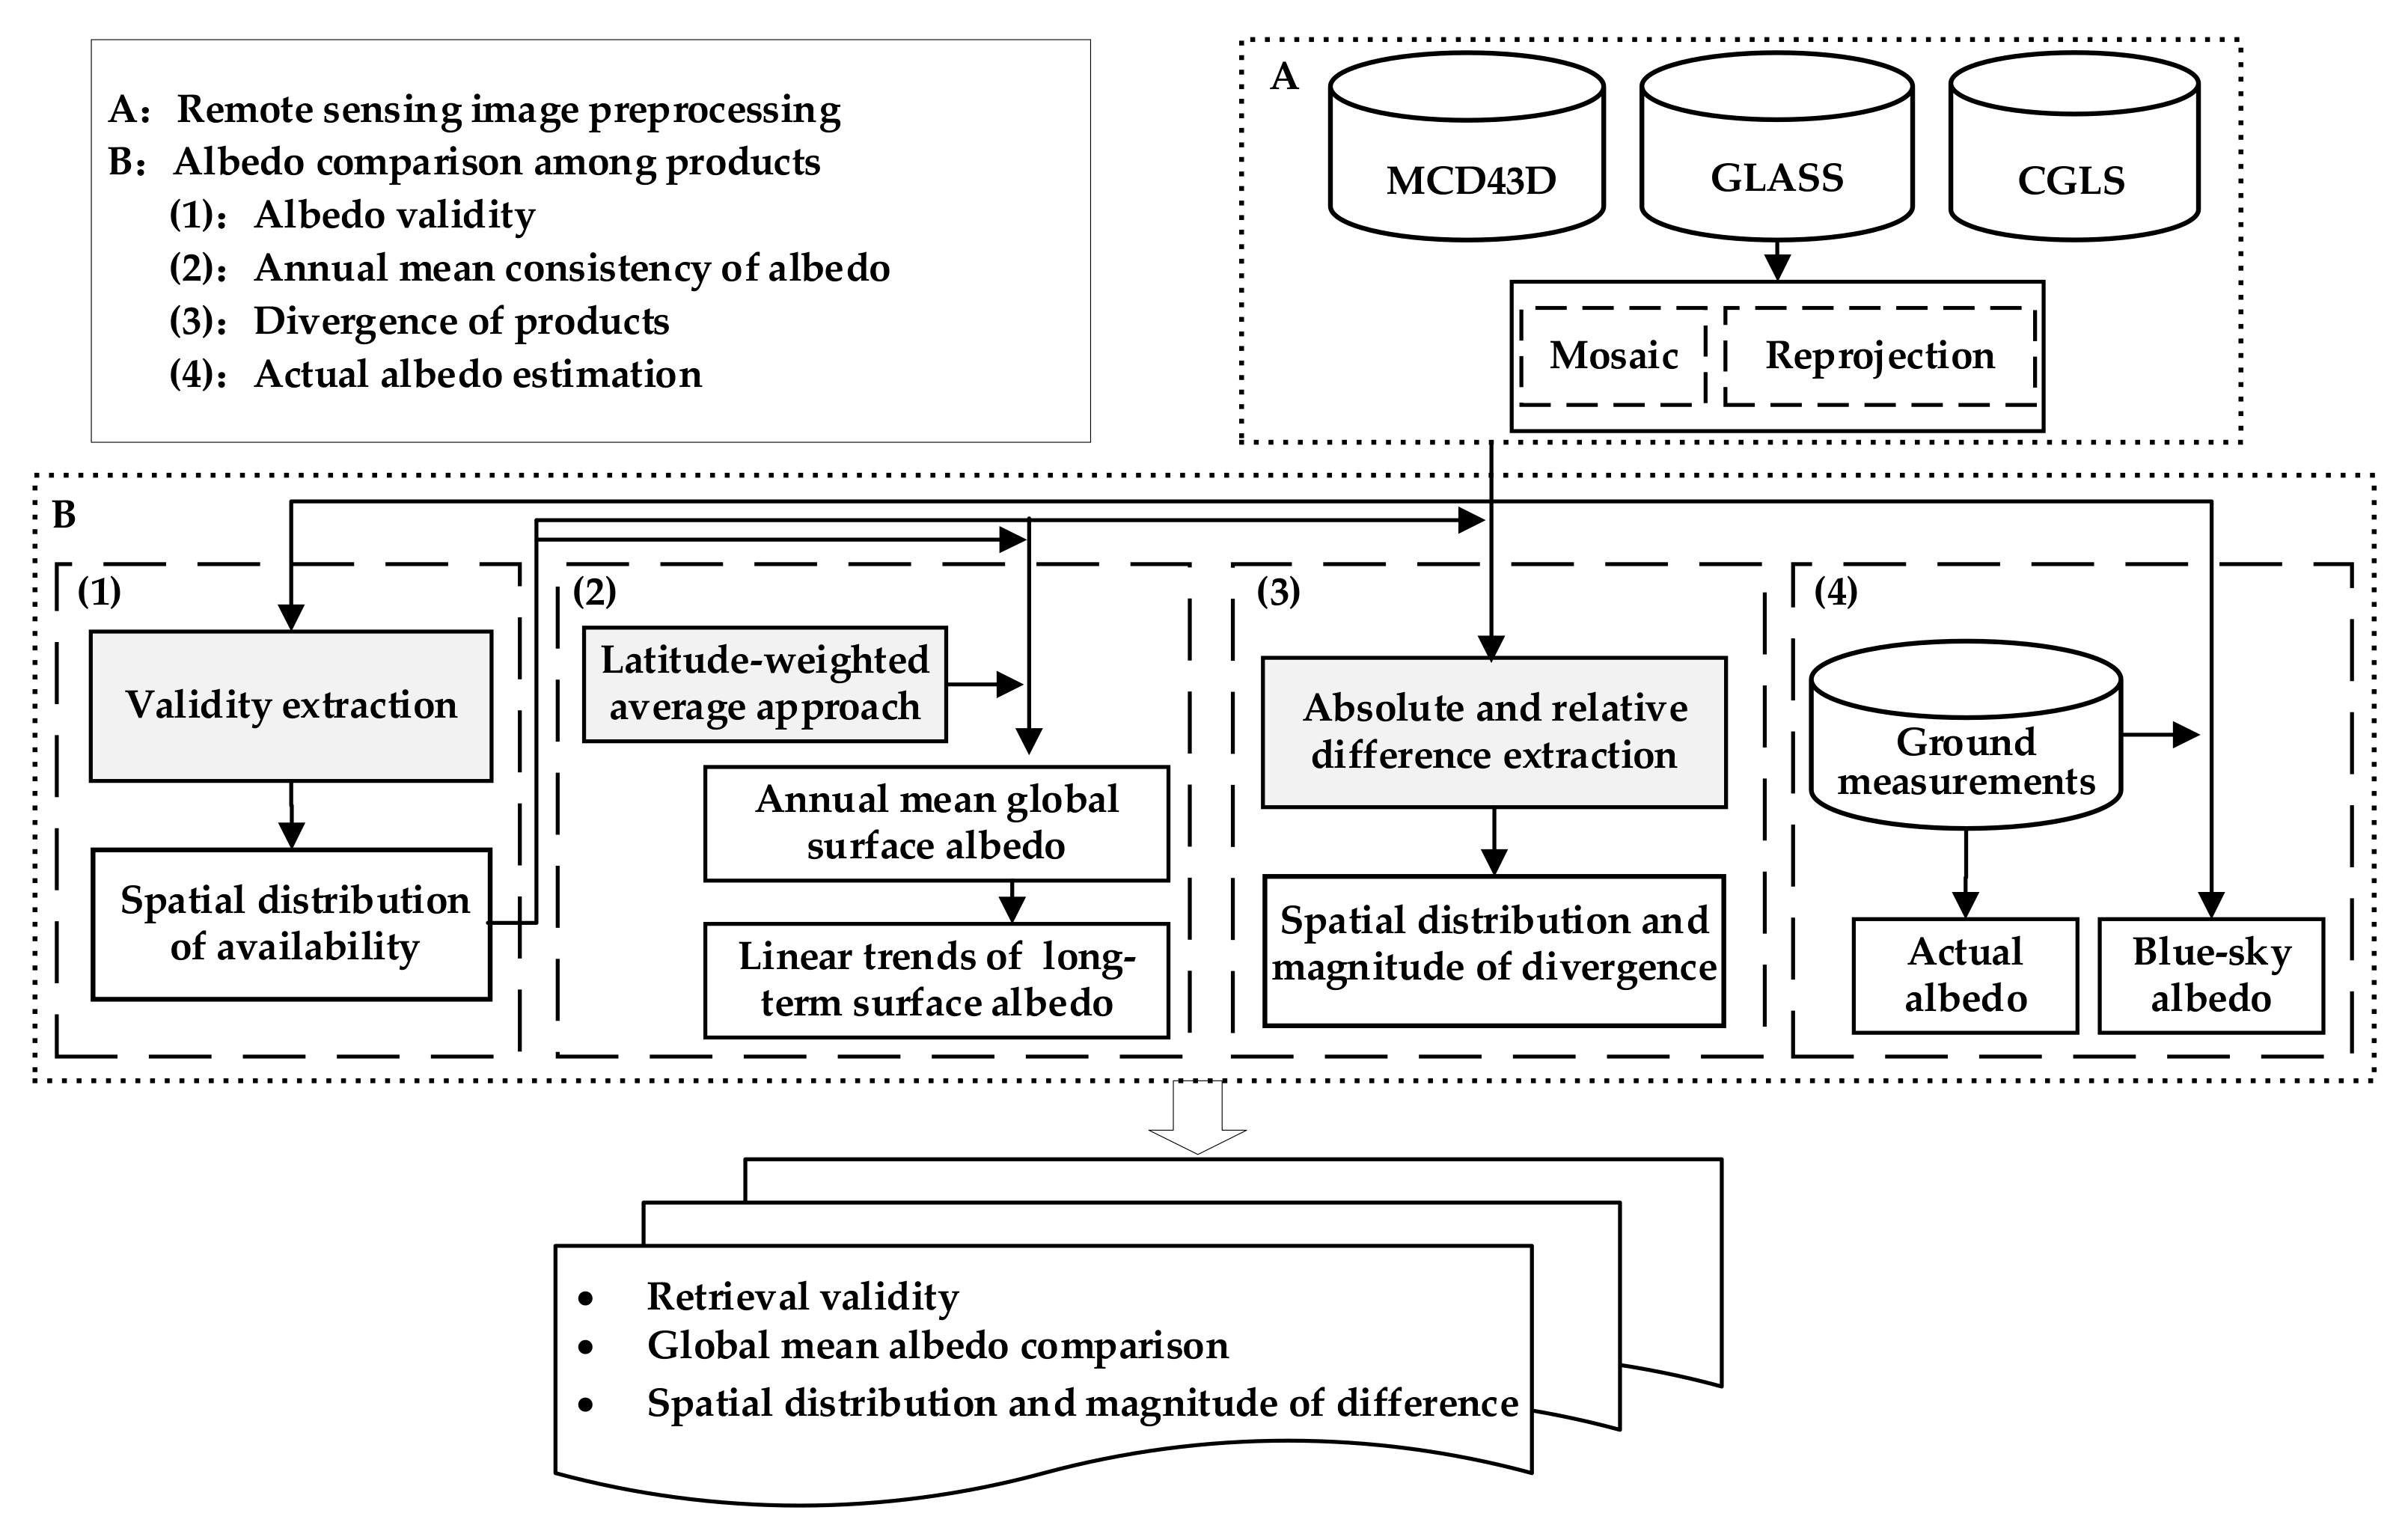
Measures shown in the processing chain (Figure 2) are adopted to evaluate the pixel-based validity, annual mean consistency and variation among MODIS, GLASS and CGLS surface albedo products, as well as the comparison with ground observations.
(1) Measures of retrieval validity: the spatial distribution of successful retrievals varies with the potential of the algorithm, ingested input, and the objective of the product service. The frequency of successful retrievals is used to measure the data availability over individual pixels, as shown in Equation (1).
f i , D = d = 1 D N R i , d d = 1 D N o b s i , d × 100 %
where f i , D means the frequency of successful retrievals for pixel i within the duration days D , and N R i , d and N o b s i , d respectively represent the number of successful retrievals and nominal inversion performance for pixel i on day d.
(2) Annual mean consistency of albedo: To characterize the surface albedo consistency of our planet, the annual mean global surface albedo of each product is estimated through a latitude-weighted average approach (Equation (2)), in which the effect of pixel area is considered to reduce the error induced by the potential distortion of non-equal-area projection, such as a geographic and other latitude and longitude projection [54]. Then the linear trend of annual mean surface albedo for long-term series is achieved by linear fit.
α ¯ i j = F j α i j cos θ i j F j cos θ i j
where α i j and θ i j is the albedo value of individual pixels and latitude of each pixel center for the jth year and the ith product, respectively, with the universe of disclosure j = 1, 2, … m and i = 1, 2, … n, in which m is the investigated duration, and n is the total number of compared products, representing samples collecting from the satellite. F j is the surface downward radiation of each pixel for the jth year. Considering the validity of current downward surface radiation products, the daily downward radiation data from GLASS with a resolution of 0.05° were used in this paper.
(3) Magnitude variation: the variation of albedo magnitude among the discussed products was evaluated by measuring the absolute difference ( Δ α i ) and relative difference ( Δ R D i ), shown in Equations (3) and (4). Δ α i presents the distance of albedo value retrieved by the jth albedo product away from the reference value, while Δ R D i denotes the percentage of Δ α i for retrievals of the ith product to the compared baseline. For the comparison of this work, the reference magnitude of albedo is defined as the average of available retrievals provided by MODIS, GLASS and CGLS over the discussed period.
Δ α i = j = 1 m α i j i = 1 n α i j n m
Δ R D i = j = 1 m Δ α i i = 1 n α i j n m × 100 %
where α i j , i, j, m and n are the same as those represented in Equation (2).
(4) Actual albedo estimation: BSA and WSA of involved satellite products are estimated respectively under two extreme skylight conditions with only direct or ideal diffuse radiation, not the baseline albedo quantity measured under the actual weather conditions. Before examining the differences among satellite-based albedo using the concurrent ground measurements, we have to convert BSA and WSA albedo into actual albedo. The linear weighted model of BSA and WSA is adopted to estimate the actual albedo (also called blue-sky albedo) α by Equation (5) [55,56].
α = 1 s × α B S A + s × α W S A
where α B S A and α W S A represent shortwave BSA and WSA, respectively, and s is the sky scattering ratio, which is the proportion of the diffuse radiation to the total solar radiation.

3. Result

3.1. Retrieval Validity

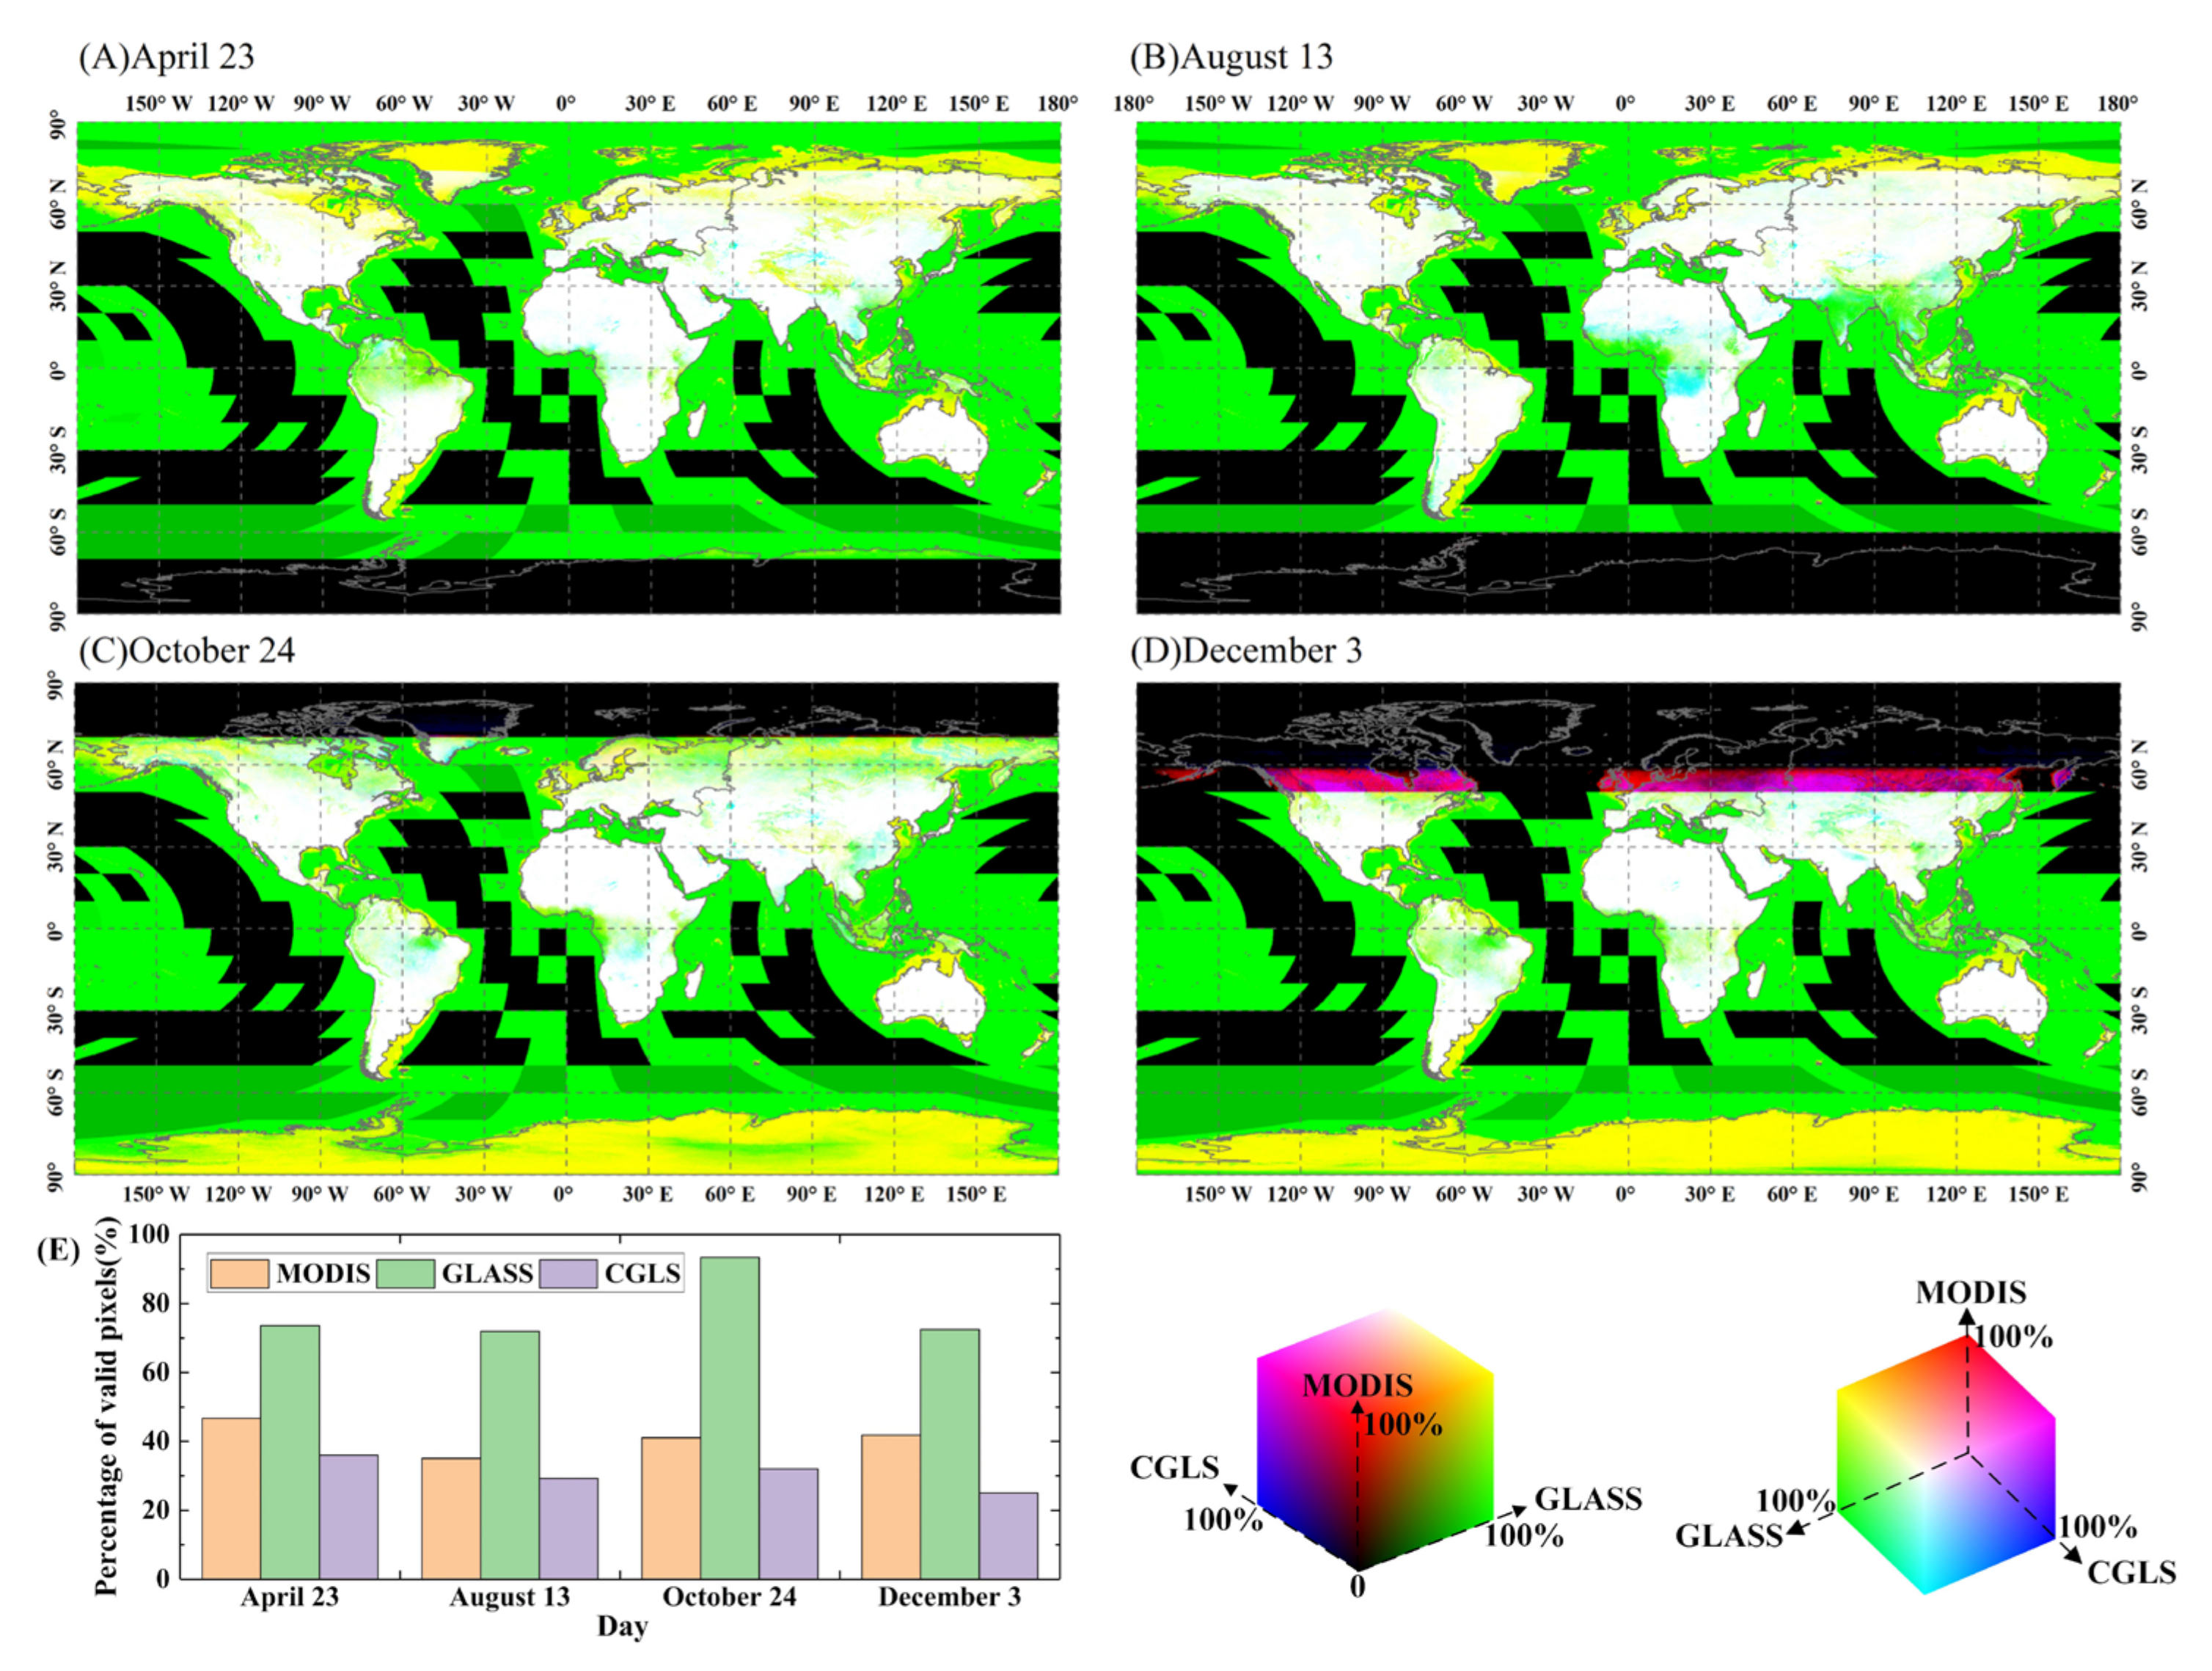
The spatial distribution of retrieval validity was calculated by Equation (1) from MODIS, GLASS and CGLS standard products on four identical retrieval dates for each year from 2000–2017. The combination of retrieval validity percentage calculated from three discussed products are mapped into the RGB color cube shown at the bottom-right of Figure 3. From the global region, all three products can provide valid long-term albedo over most of the global terrestrial region. Compared with MODIS and CGLS that only perform albedo retrievals over land or inland water region, GLASS also put efforts into the retrieval of ocean surface (pure greens in Figure 3A–D). For the land region inversed together by three albedo products, Figure 3 exhibits dominant consistency over the southern region of both Americas, most regions of Australia, southern and northern regions of Africa and parts of Eurasia (pure white in Figure 3A–D). The distribution and percentage of valid retrievals show different features among the three products with the change of retrieval dates. Compared with other dates, the valid land pixels concurrently retrieved by MODIS, GLASS and CGLS on August 13 present the lowest percentage over Africa due to increasing failed retrieval in Central Africa. Further, the available retrievals from Eurasia, and North America shrink southward dramatically from October to December partially due to the abrupt missing data of GLASS within the 50°N–60°N latitude belt on 3 December (Figure 3C,D). As shown in Figure 3E, the percentage of MODIS valid pixels is generally above 41%, with elevated successful retrieval of 46% on 23 April and a lower value of 35% on 13 August. CGLS has a consistent lower percentage between 25% and 35% with the highest value on 23 April and the lowest on 3 December. A different situation is shown in GLASS with ~72% on all dates except for the abrupt increase of up to 93% on 24 October. On the other hand, the invalid pixels mostly emerge in Antarctica on 23 April with an extra northward extension on 13 August, and in the northern high latitude region on 24 October with a further southward extension on 3 December (black regions in the South and North poles). In addition, retrievals of MODIS and CGLS decrease around the northern Amazon region on 23 April, over the Gulf of Guinea and South Asia on 13 August, and in northeastern Brazil on 24 October and 3 December. Missing data in CGLS are intensively located in the northern high latitudes, mainly in Greenland, Northern and Central Russia on 23 April and 13 August, and in Antarctica in autumn and winter. MODIS invalid retrieval over land regions is distributed mainly in Central Nigeria on 23 April, and in most of Congo in the summer.

3.2. Global Mean Albedo Comparison

The global mean albedo of the terrestrial region was calculated by Equation (2) to assist in further understanding of the retrieval performance among various albedo products at albedo quantities and spectral bands. Figure 4 shows the global mean of BSA and WSA at NIR, SW and VIS broadbands generated respectively by MODIS, GLASS and CGLS on four investigated dates of 2000–2017, as well as the determination of temporal linear trends. First, the mean WSA provided by three products is always higher than the related BSA at about 0.01–0.02 at NIR, 0.007–0.010 at SW, and 0.003–0.009 at VIS on the investigated dates from 2000–2017. The difference between WSA and BSA keeps reducing at individual band level from April to December. For instance, the WSA and BSA difference at NIR on 23 April (Figure 4(A1)) is around 0.02, while it drops to ~0.01 on 3 December (Figure 4(D1)). At the band dimension, all three products have a similar dynamic range with the highest mean albedo value above 0.27 at NIR, 0.20–0.27 at SW, and 0.12–0.15 at VIS. Compared with CGLS, MODIS mean values are very close to that produced by GLASS but slightly elevated in most situations in Figure 4 except for VIS band on 13 August, 24 October, and 3 December (Figure 4(B3–D3)). The mean value of CGLS is frequently greater than that of MODIS and GLASS, sometimes with an absolute difference of up to 0.05, or about 20% relative difference, to MODIS/GLASS retrievals, shown in Figure 4(B2), and occasionally slightly lower than MODIS or GLASS (Figure 4(A1,B1,B3)).
It is worth noting that the global mean albedo varies among investigated dates and during the temporal dimension of the years 2000–2017. The global mean albedos, no matter which band, quantity or product, increase from April to December, generally with a persistent increment, with sporadic fluctuation in the CGLS data suite such as that shown in Figure 4(B1,B3). Another special variation is the abrupt rising of CGLS values at NIR and SW in April 2015, and other dates of 2014, with an extreme increasing absolute difference up to 0.04, and about a 14% relative difference compared with retrievals of MODIS and GLASS (Figure 4(B1,B2)). In contrast, the absolute and relative difference of the “abrupt rising” at VIS band is respectively dimmed into ~0.009 and 9% on the April date in 2015 (Figure 4(A3)), back to 0.015 and 12% in August 2014 (Figure 4(B3)), and no apparent increase on the remaining two dates (Figure 4(C3,D3)). In addition, the determination of temporal trend through linear model over each global mean albedos of 2000–2017 indicates a persistent increasing trend at NIR of three products, but the slope of CGLS is 10–100 times larger than that of MODIS and GLASS. Compared with the continuous increasing trend of CGLS, GLASS shows the shallow decreasing trends at SW and VIS bands, as well as MODIS’s decrease at the VIS band.

3.3. Differences among Albedo Products

3.3.1. Spatial Distribution of Difference

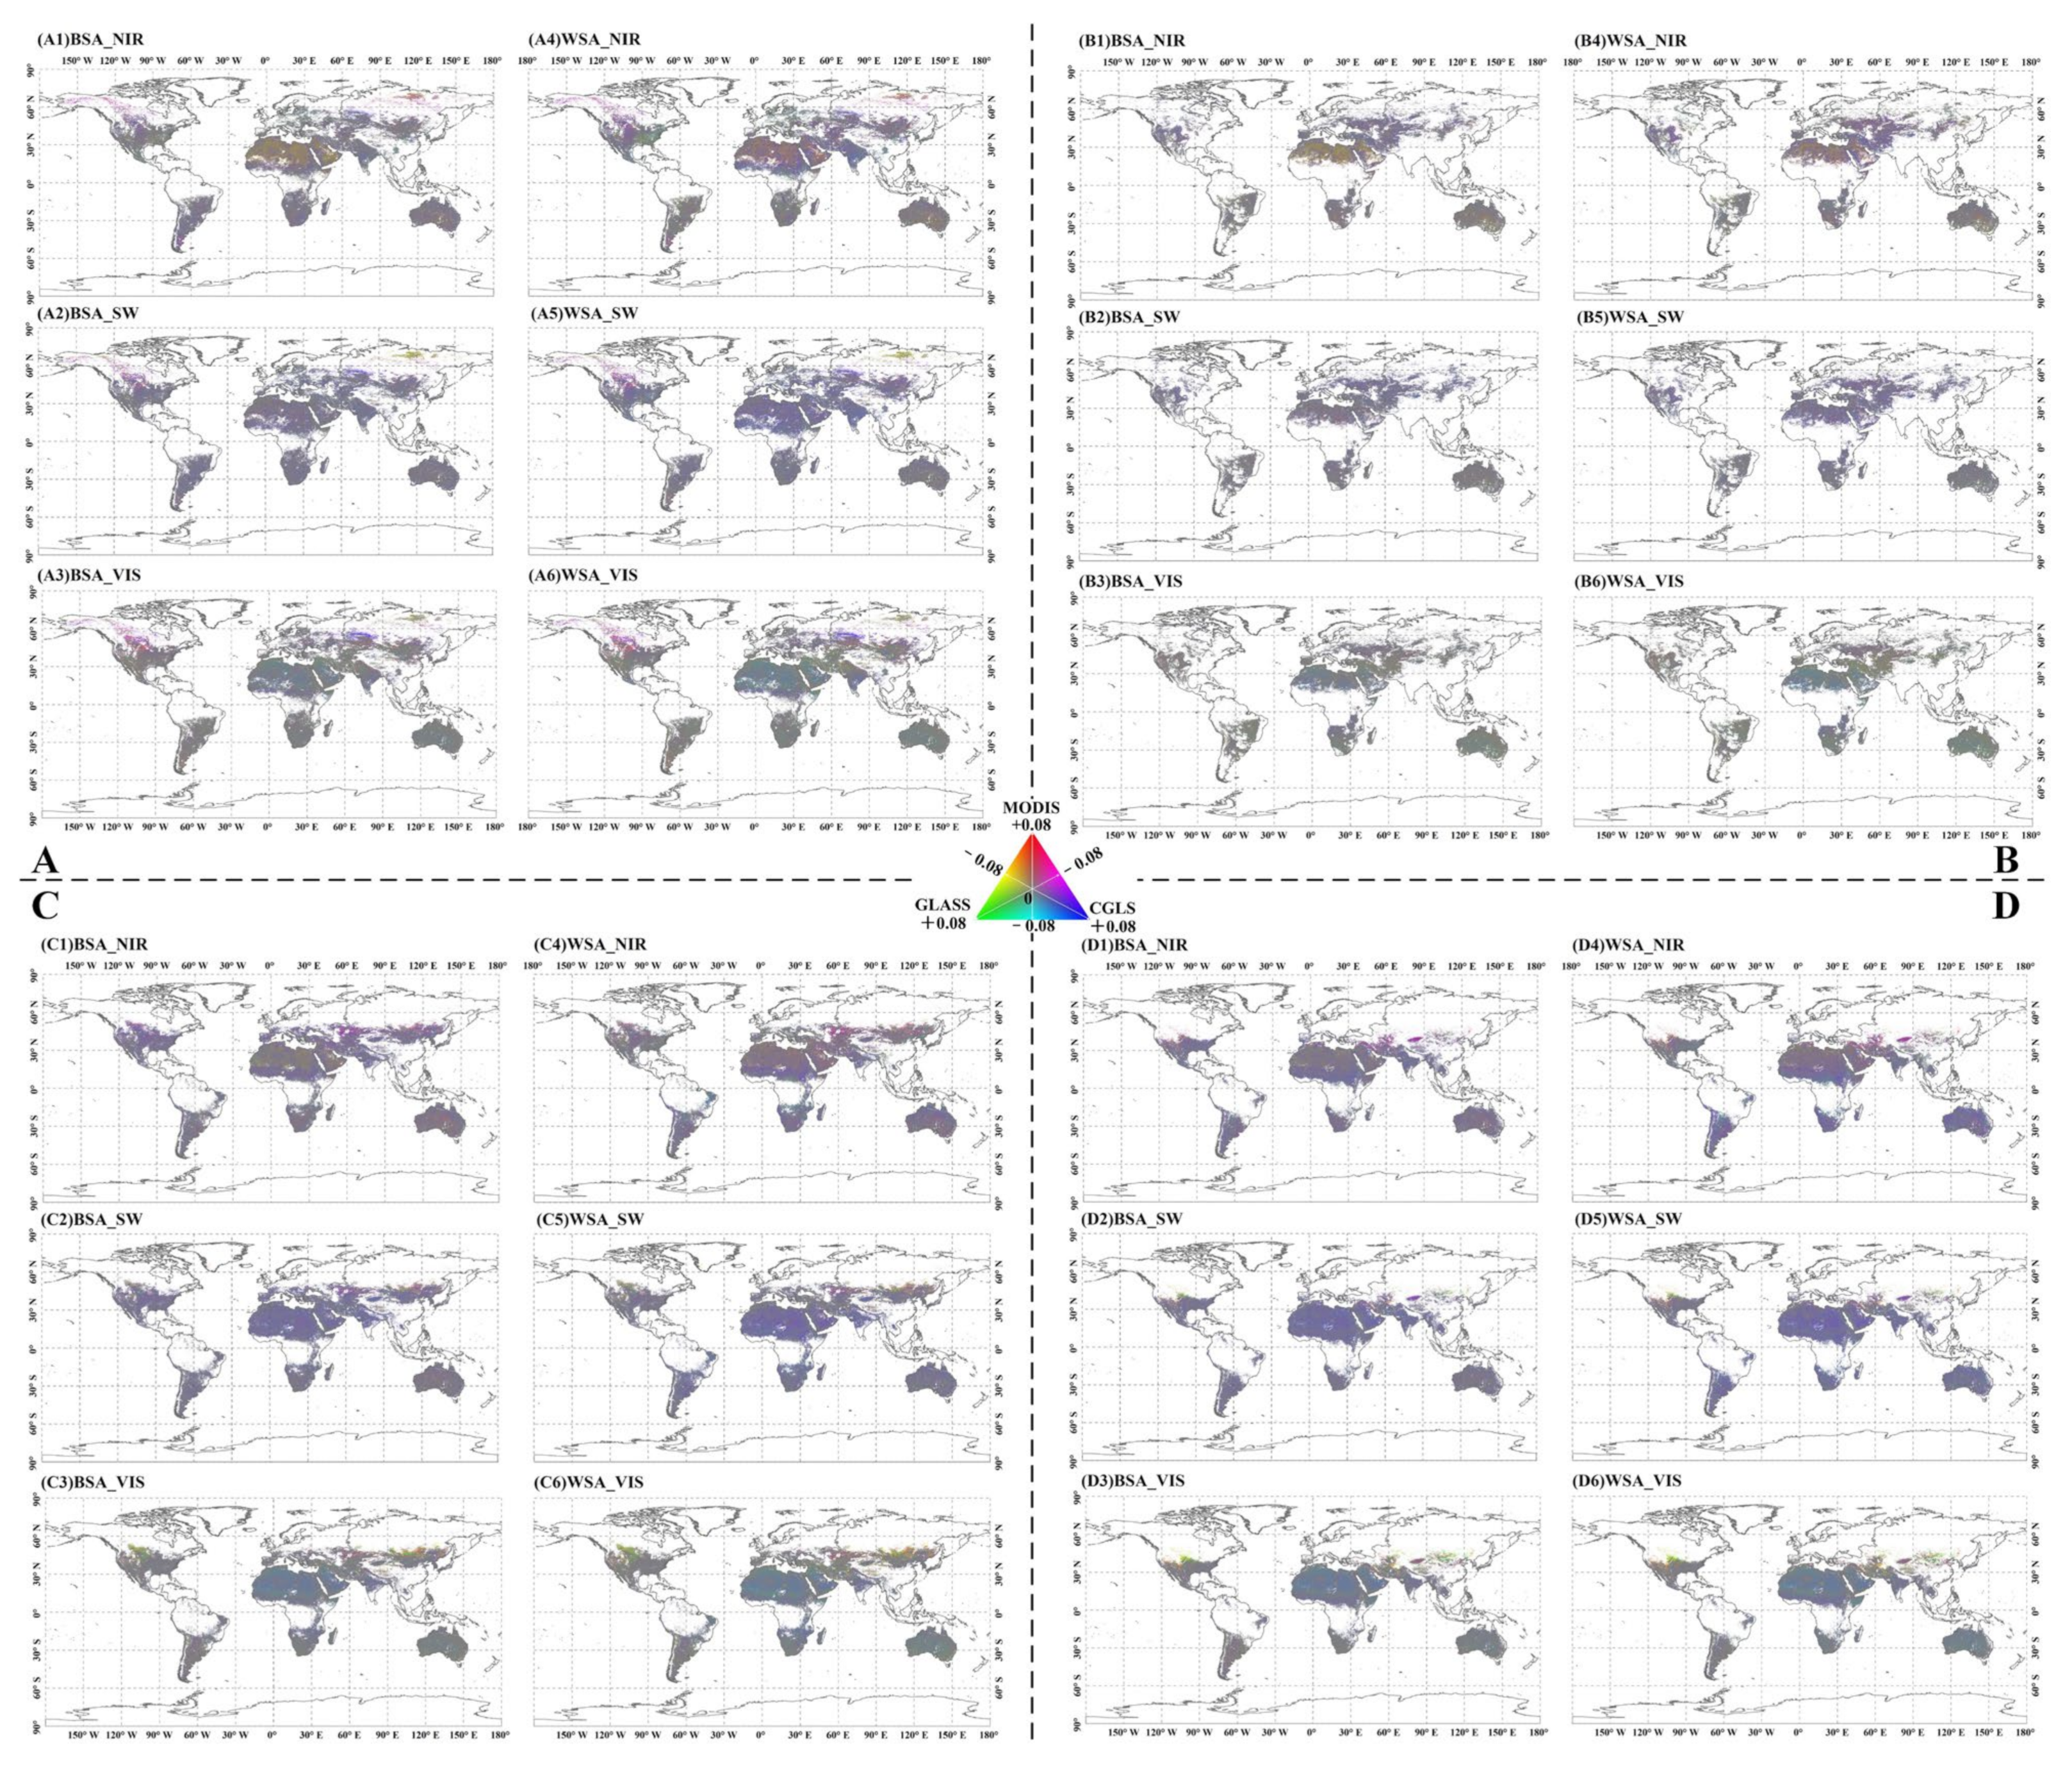
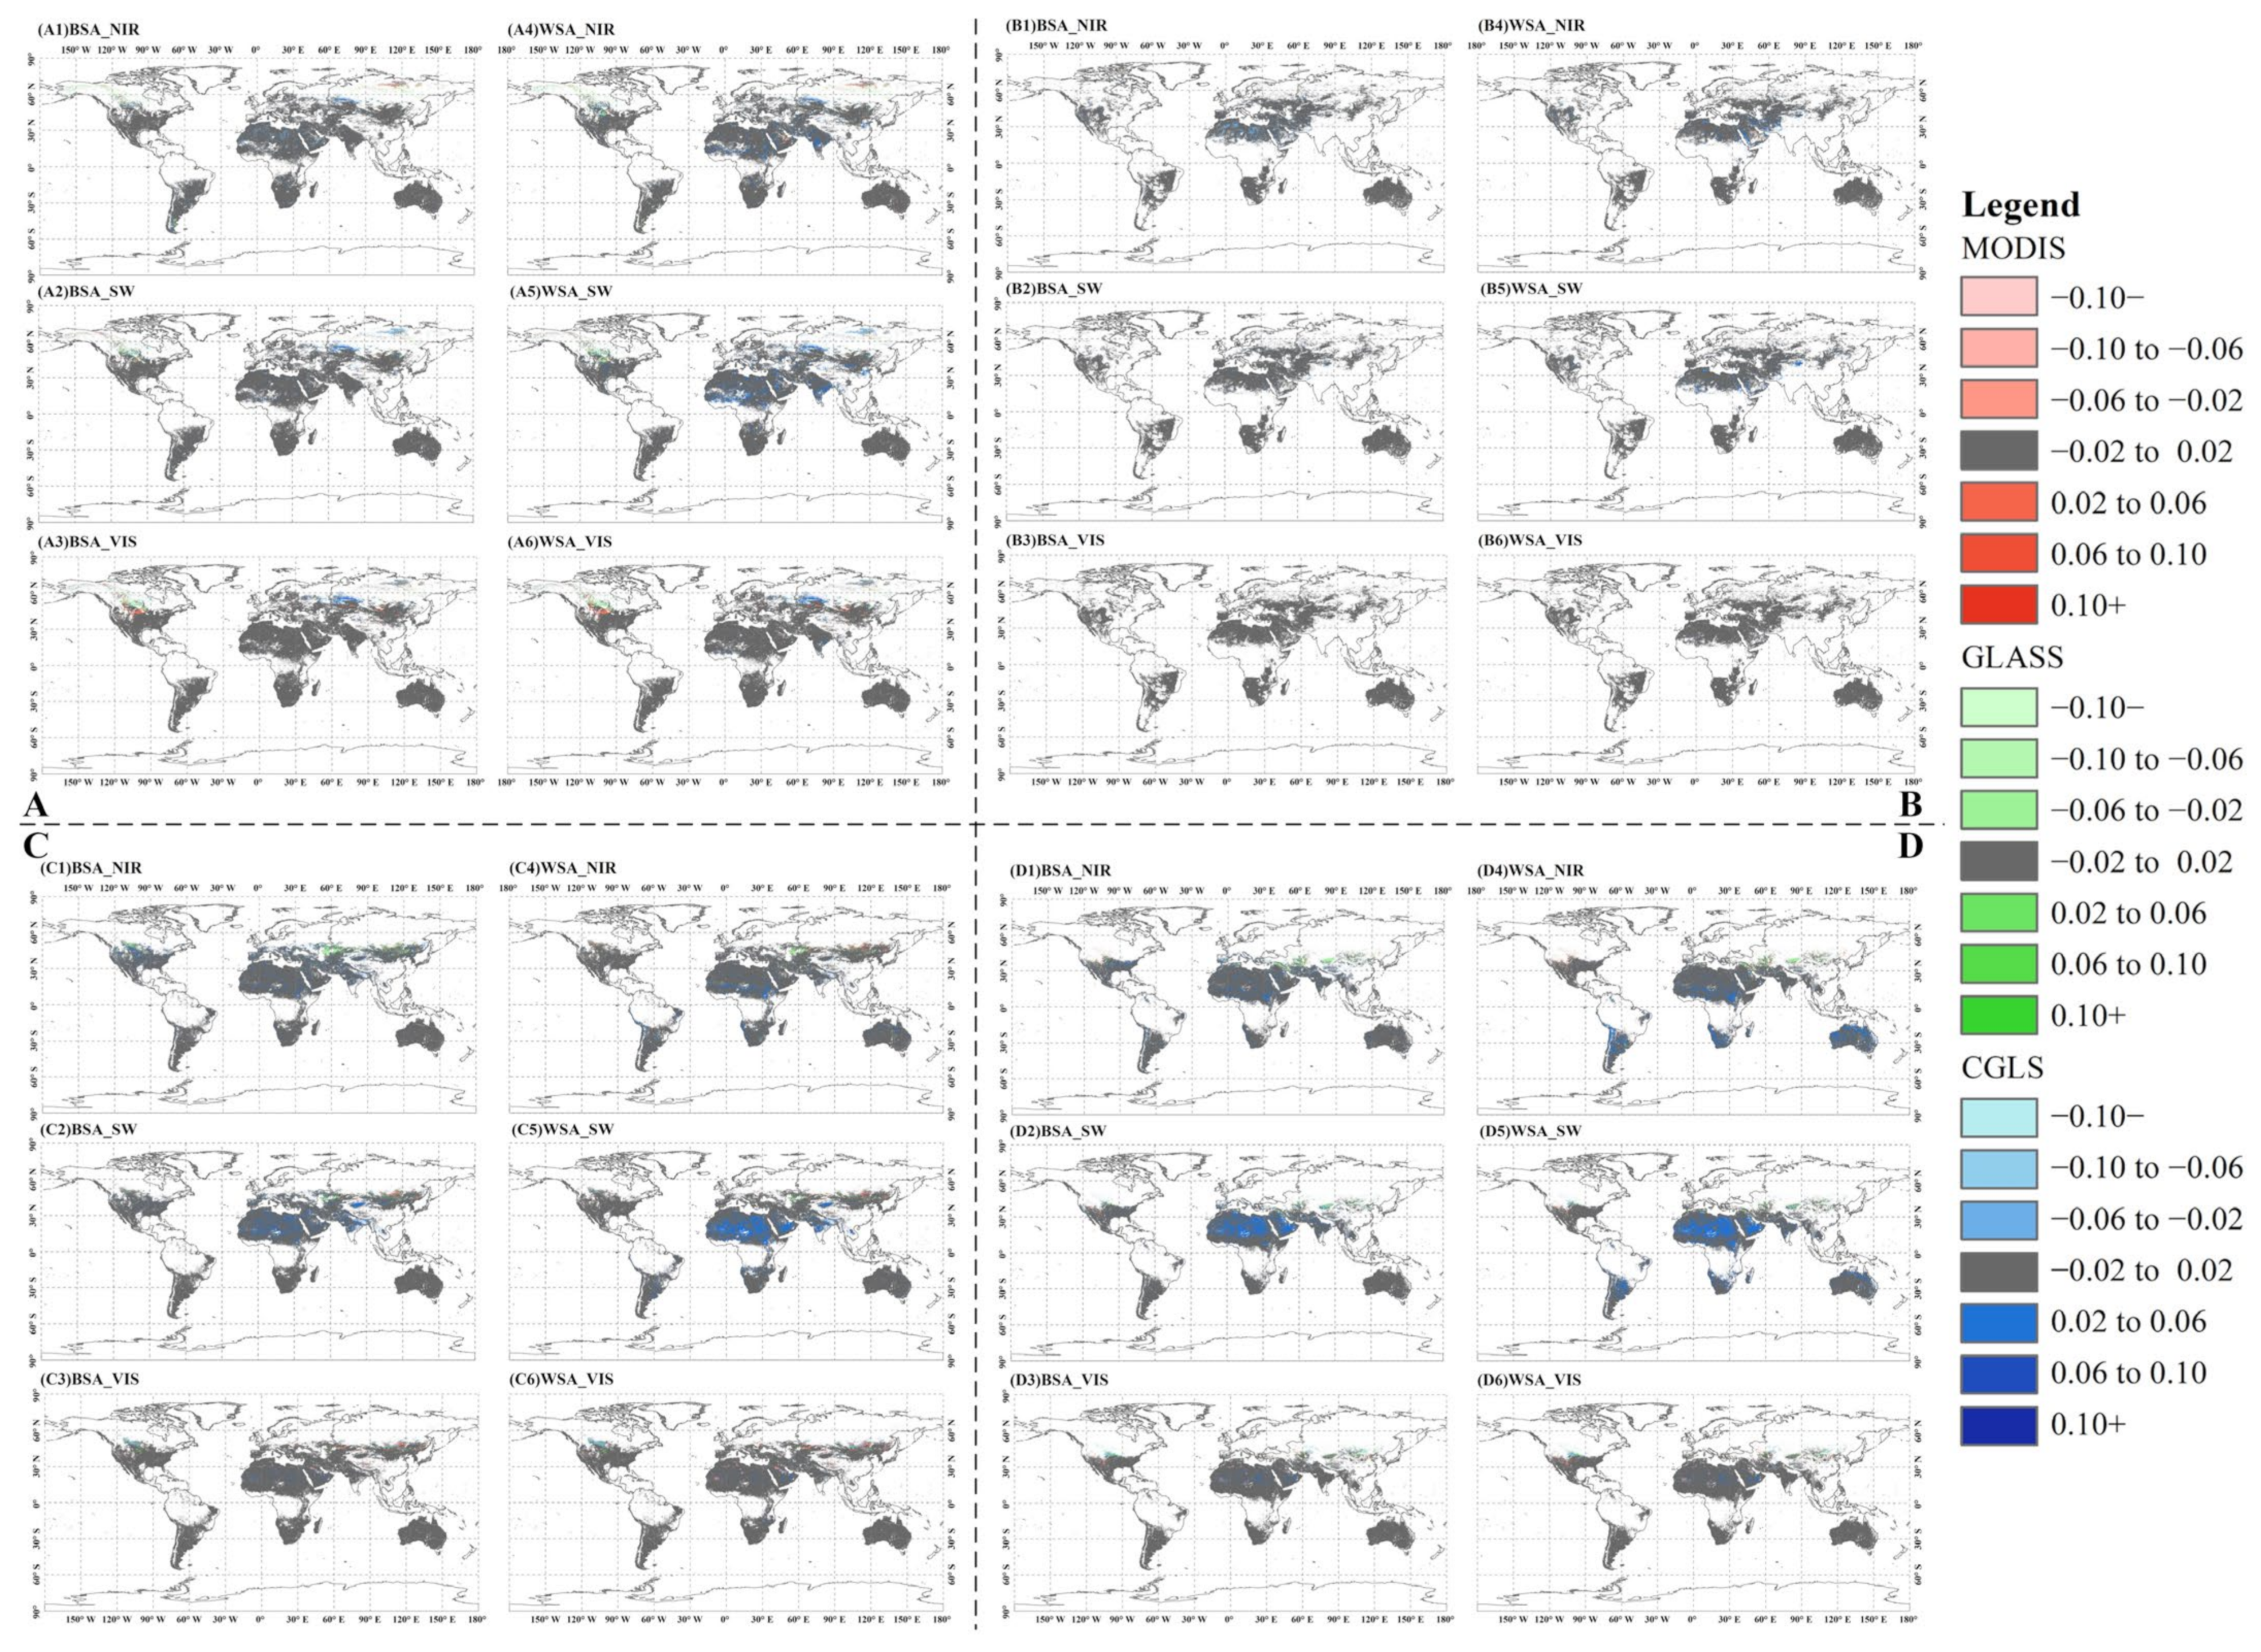
The absolute and relative albedo differences were calculated for each land pixel concurrently with valid MODIS, GLASS, and CGLS retrievals on the four discussed dates of 2000–2017 in terms of Equations (3) and (4). The spatial distribution of these albedo differences varies with the change of location, band, and retrieval date. Generally, the absolute difference exhibits small variation over most regions of global land surface as shown in Figure 5, especially in the southern hemisphere compared with the elevated difference in the northern hemisphere. The higher difference among the three products emerges over Northern Russia, Central Asia, North Africa, and the middle of North America around the border between Canada and United States, etc. (green, rosy-red, purple-blue, dark-brown, yellow-green in Figure 5A–D). Though there is less difference between WSA and BSA of each discussed identical broadband, apparent variation can still be captured among bands over the region of South America, Africa and Australia in rosy-red or dark-brown at NIR, purple-blue at SW, and scattered green at VIS. Both BSA and WSA of MODIS and CGLS at three investigated bands on 23 April show apparent difference from GLASS over Alberta, Manitoba, Northwest Territories, Saskatchewan, Yukon, Canada and Alaska, United States, while CGLS shows apparent difference from MODIS and GLASS over the southern Western Siberian Plain. A clear difference is observed in North Africa and the Arabian Peninsula in CGLS, no matter which band we discuss, while GLASS is different from the other two products in Australia on 13 August. GLASS also has apparent difference in Dundgovi, Hentiy, Övörhangay, and Töv in Mongolia and Central Asia at the discussed bands of BSA and WSA on 24 October, and in the Tarim Basin, Inner Mongolia, China, and Colorado, Kansas, Nebraska, United States, on 3 December. Compared with the identical region via the available retrievals from MODIS, GLASS, and CGLS on the four dates, the changes can be captured, mainly from brown or grey-green or greyish purple-red to greyish blue-purple, while the bands of BSA and WSA show less variation. For example, there is a change from greyish yellow-green on 23 April and 13 August to greyish purple-red on 24 October and finally greyish blue-purple on 3 December in Australia, whereas in North Africa the color changes from a greyish purple-red on 23 April and 13 August to a greyish blue-purple on 24 October and 3 December.
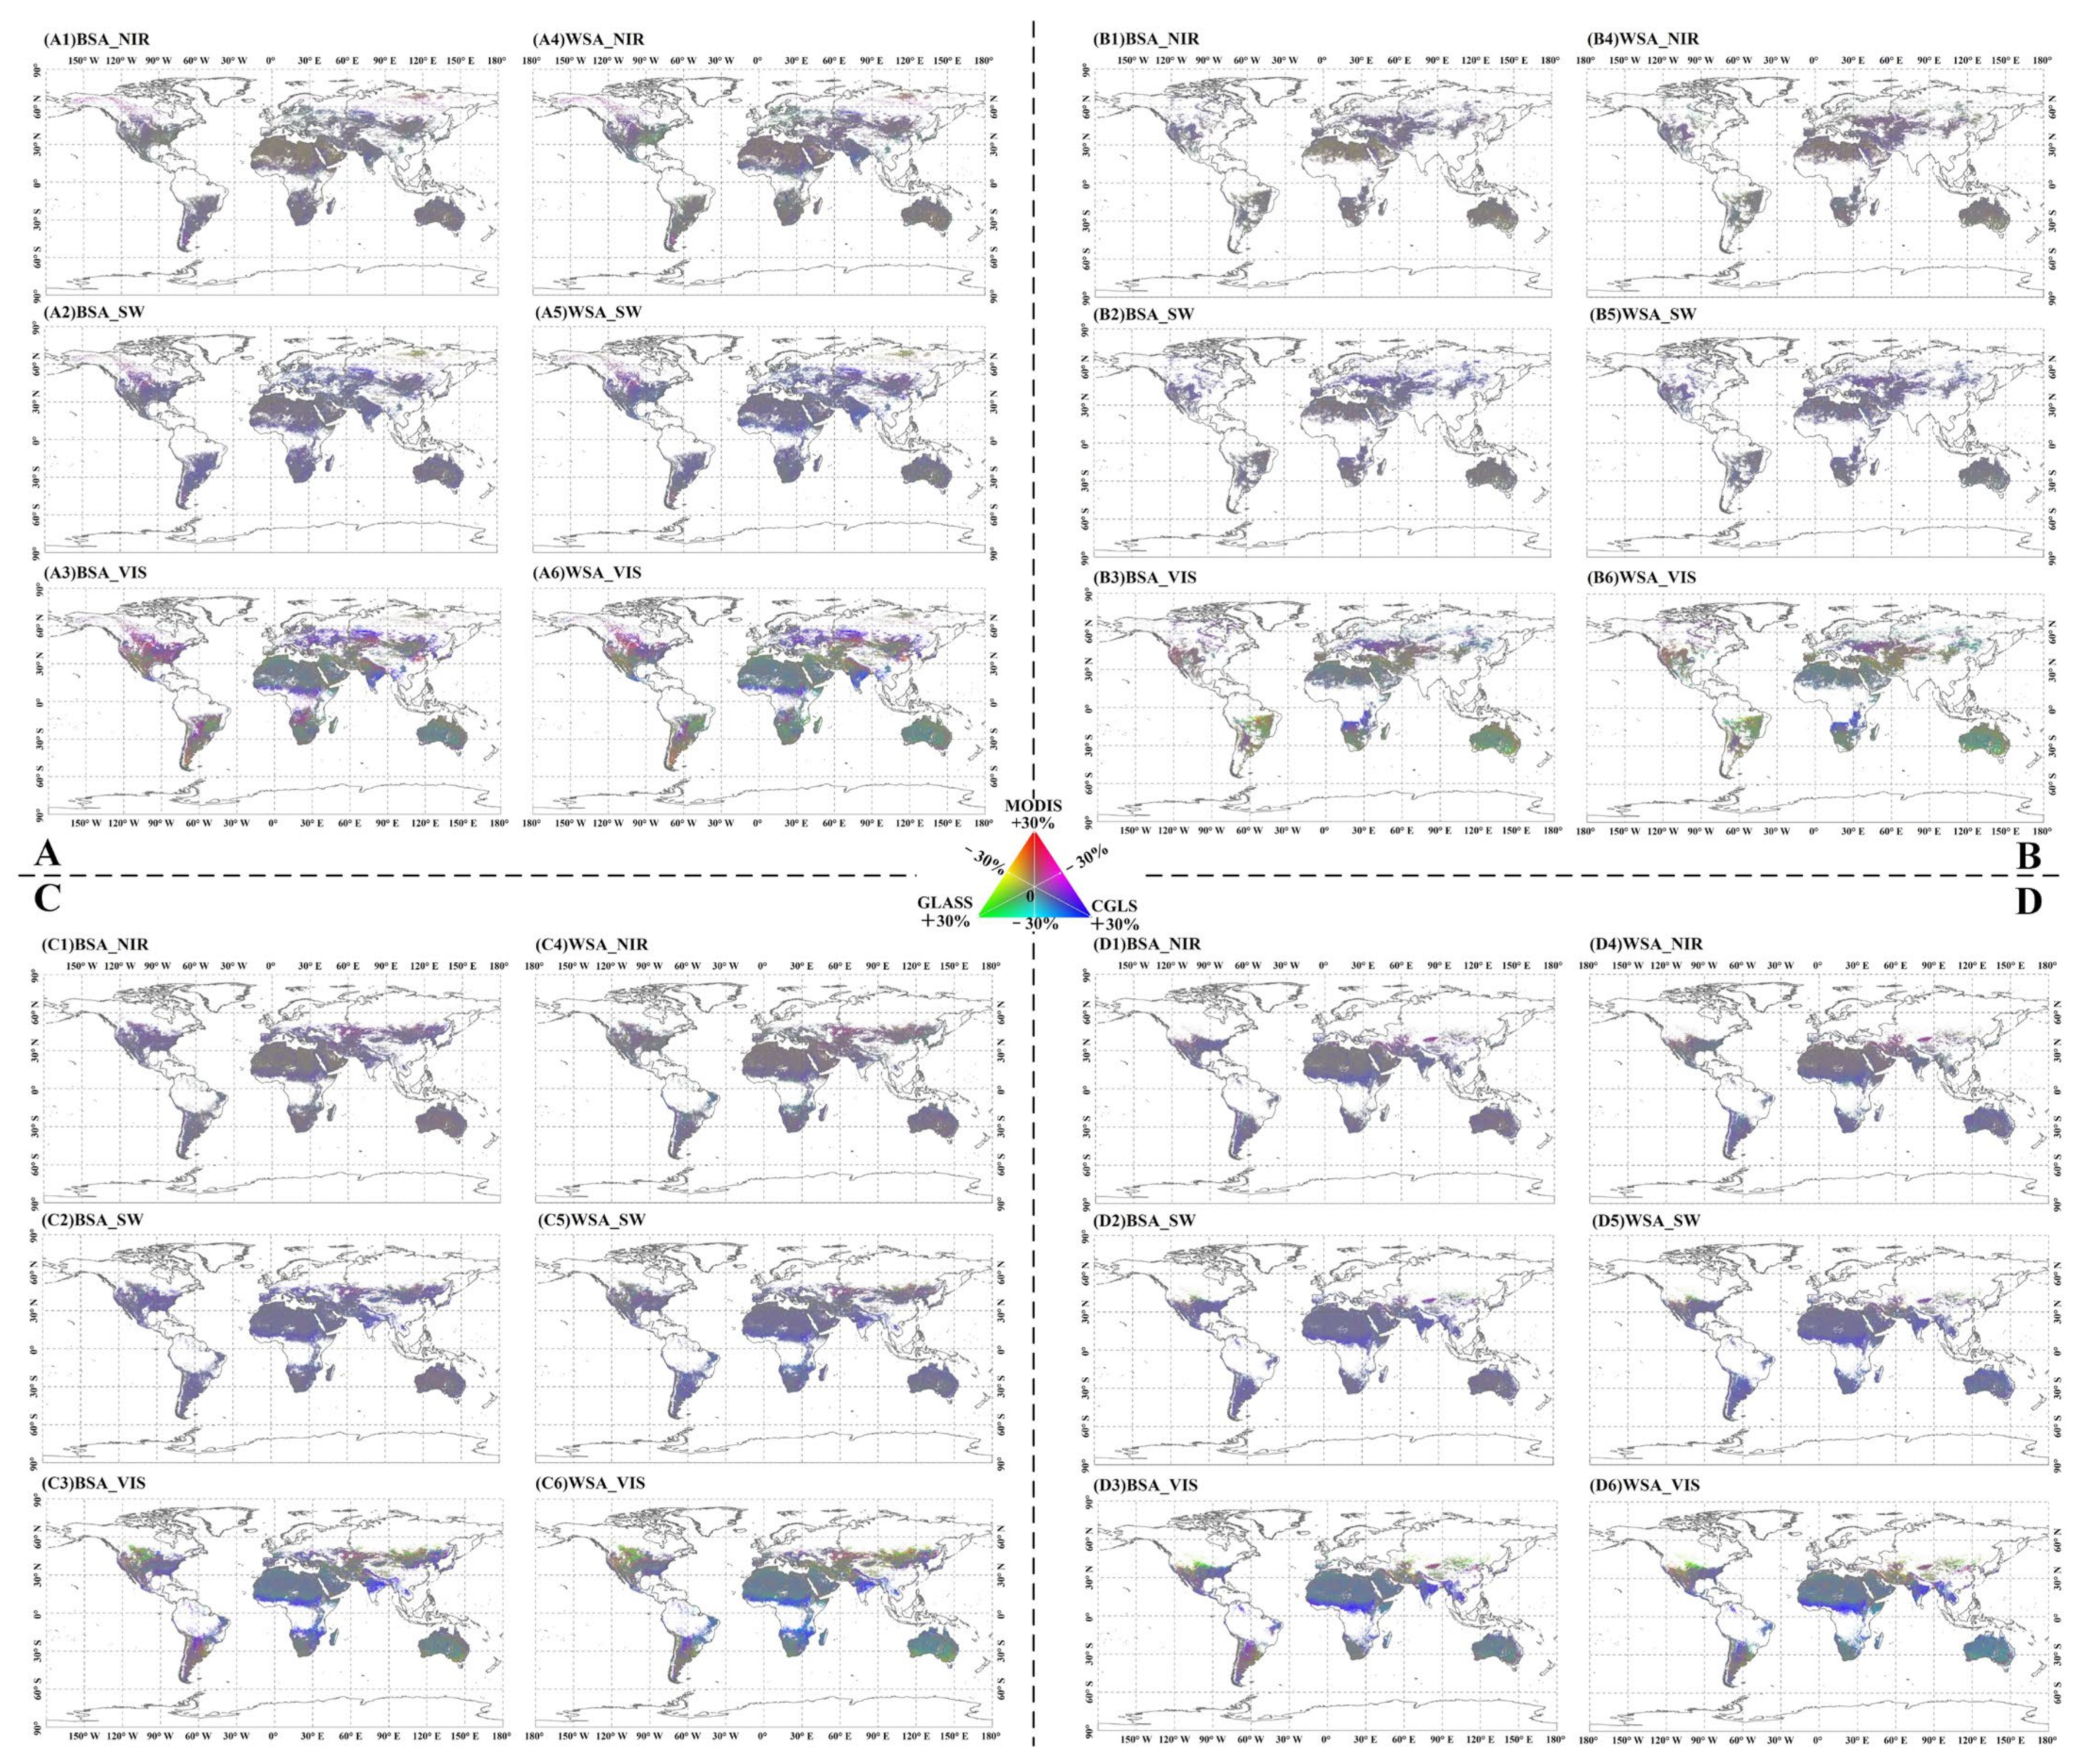
Figure 6 shows the combination of MODIS, GLASS and CGLS relative difference to the mean of three products over each valid pixel within the global land region. It can be clearly seen that the enhanced difference varies in bands, dates, and spatial distribution. Compared with NIR and SW bands, the VIS band shows higher relative difference with rich color transition from rosy red to dark green or purple, etc., especially over the middle of the United States, the middle of Eurasia, and East-Central South America, no matter which date we discuss. For instance, the brick-, rosy-, purple-red, and purple at the VIS band on 23 April are formed due to the reduced involvement of GLASS with a lower value in the green channel, around the northern Missouri watershed of the United States and the extended region with the same latitude in Central Asia. The combined color over most regions of Australia is brown or dark purple at NIR and SW, and green at VIS on multiple dates. Comparing the distribution of relative differences on four dates, the combination of 23 April (Figure 6A) has an enriched gradation of colors, followed by that of October (Figure 6B) and December (Figure 6C), while August (Figure 6D) shows less color variation especially over NIR and SW bands. Even if we limit this discussion to the region with concurrent retrievals, subtle changes can be captured, for example, over eastern USA from greenish grey in April to purple-bluish color in October and December.

3.3.2. Magnitude of Apparent Difference

Though the above results of Section 3.3.1 qualitatively exhibit the spatial variation of multiband albedo among MODIS, GLASS and CGLS, quantitative information is required to evaluate the degree of differentiae among bands, dates, and regions of the three compared albedo products. Figure 7 shows the combination of graded absolute difference of MODIS, GLASS, and CGLS BSA and WSA, respectively, at NIR, SW, and VIS on the four discussed dates, in which pixels having absolute difference within (−0.02, 0.02) in all three combined components are graded in grey, and other valid pixels show in red, green, and blue depending on the largest absolute difference component from MODIS, GLASS, or CGLS, respectively. The dominant region of available retrievals shows in gray with a statistics percentage of 88~93, 92~99, 84~93 and 75~93, respectively, on 23 April, 13 August, 24 October and 3 December. The apparent absolute difference is distributed mainly in the northern hemisphere, especially over Central North America and Eurasia within the latitude belt of 40°N–60°N, as well as North Africa. Compared with SW and NIR bands, the VIS band generally has a low dynamic range of (−0.02, 0.02), scattered values above 0.02, respectively, on MODIS and GLASS at South Dakota and North Dakota, USA, and furthermore in Central Eurasia with various elevated difference from one of the three products. The SW band exhibits the typical higher CGLS at 0.02–0.06 over North Africa, especially on 24 October and 3 December. Especially, the absolute difference within (0.02, 0.06) frequently occurs in the retrieval of CGLS, especially at the WSA SW band of the generation on 24 October and 3 December, at up to 20%. Furthermore, pixels with the absolute difference in other grades show in small proportion with a distribution scattered all over the global land surface, occasionally exhibiting an extreme absolute difference above 0.1 as shown in southern Central Asia at BSA-SW of GLASS on 3 December.
Figure 8 exhibits the spatial distribution of relative differences among albedo quantities at VIS, NIR and SW bands estimated from the three discussed operational products. Generally, the range of relative differences over the global region mainly concentrates within (−10%, 10%) shown in gray color, and with the dynamic percentage 75–94% of 23 April, 83–96% of 13 August, 70–95% of 24 October, and 67–91% of 3 December over valid pixels of each date. Regions with significant relative difference are mostly distributed in Central Africa, South Asia, Eastern European plains, southern South America at CGLS, and Central North America, and northern East Asia at MODIS and GLASS. The magnitude of relative differences frequently distributed among individual products is 10–20% from baseline values. Compared with MODIS and GLASS, the generation of CGLS has higher probability of acquiring the largest difference, with valid pixels of 9% at VIS and WSA-SW bands on 23 April, 6% at BSA-SW and BSA-VIS on 13 August, 12% at VIS and SW in both BSA and WSA on 24 October, and 19% at WSA-SW on 3 December. In addition, magnitude of relative difference in other graded levels occasionally emerges from pixels scattered over the global region, but the relative difference of pixels in a tiny minority can deviate more than 40% away from the baseline, such as BSA-VIS of CGLS on 24 October in the northeast Indian Peninsula.

3.4. Comparison with Ground Measurements

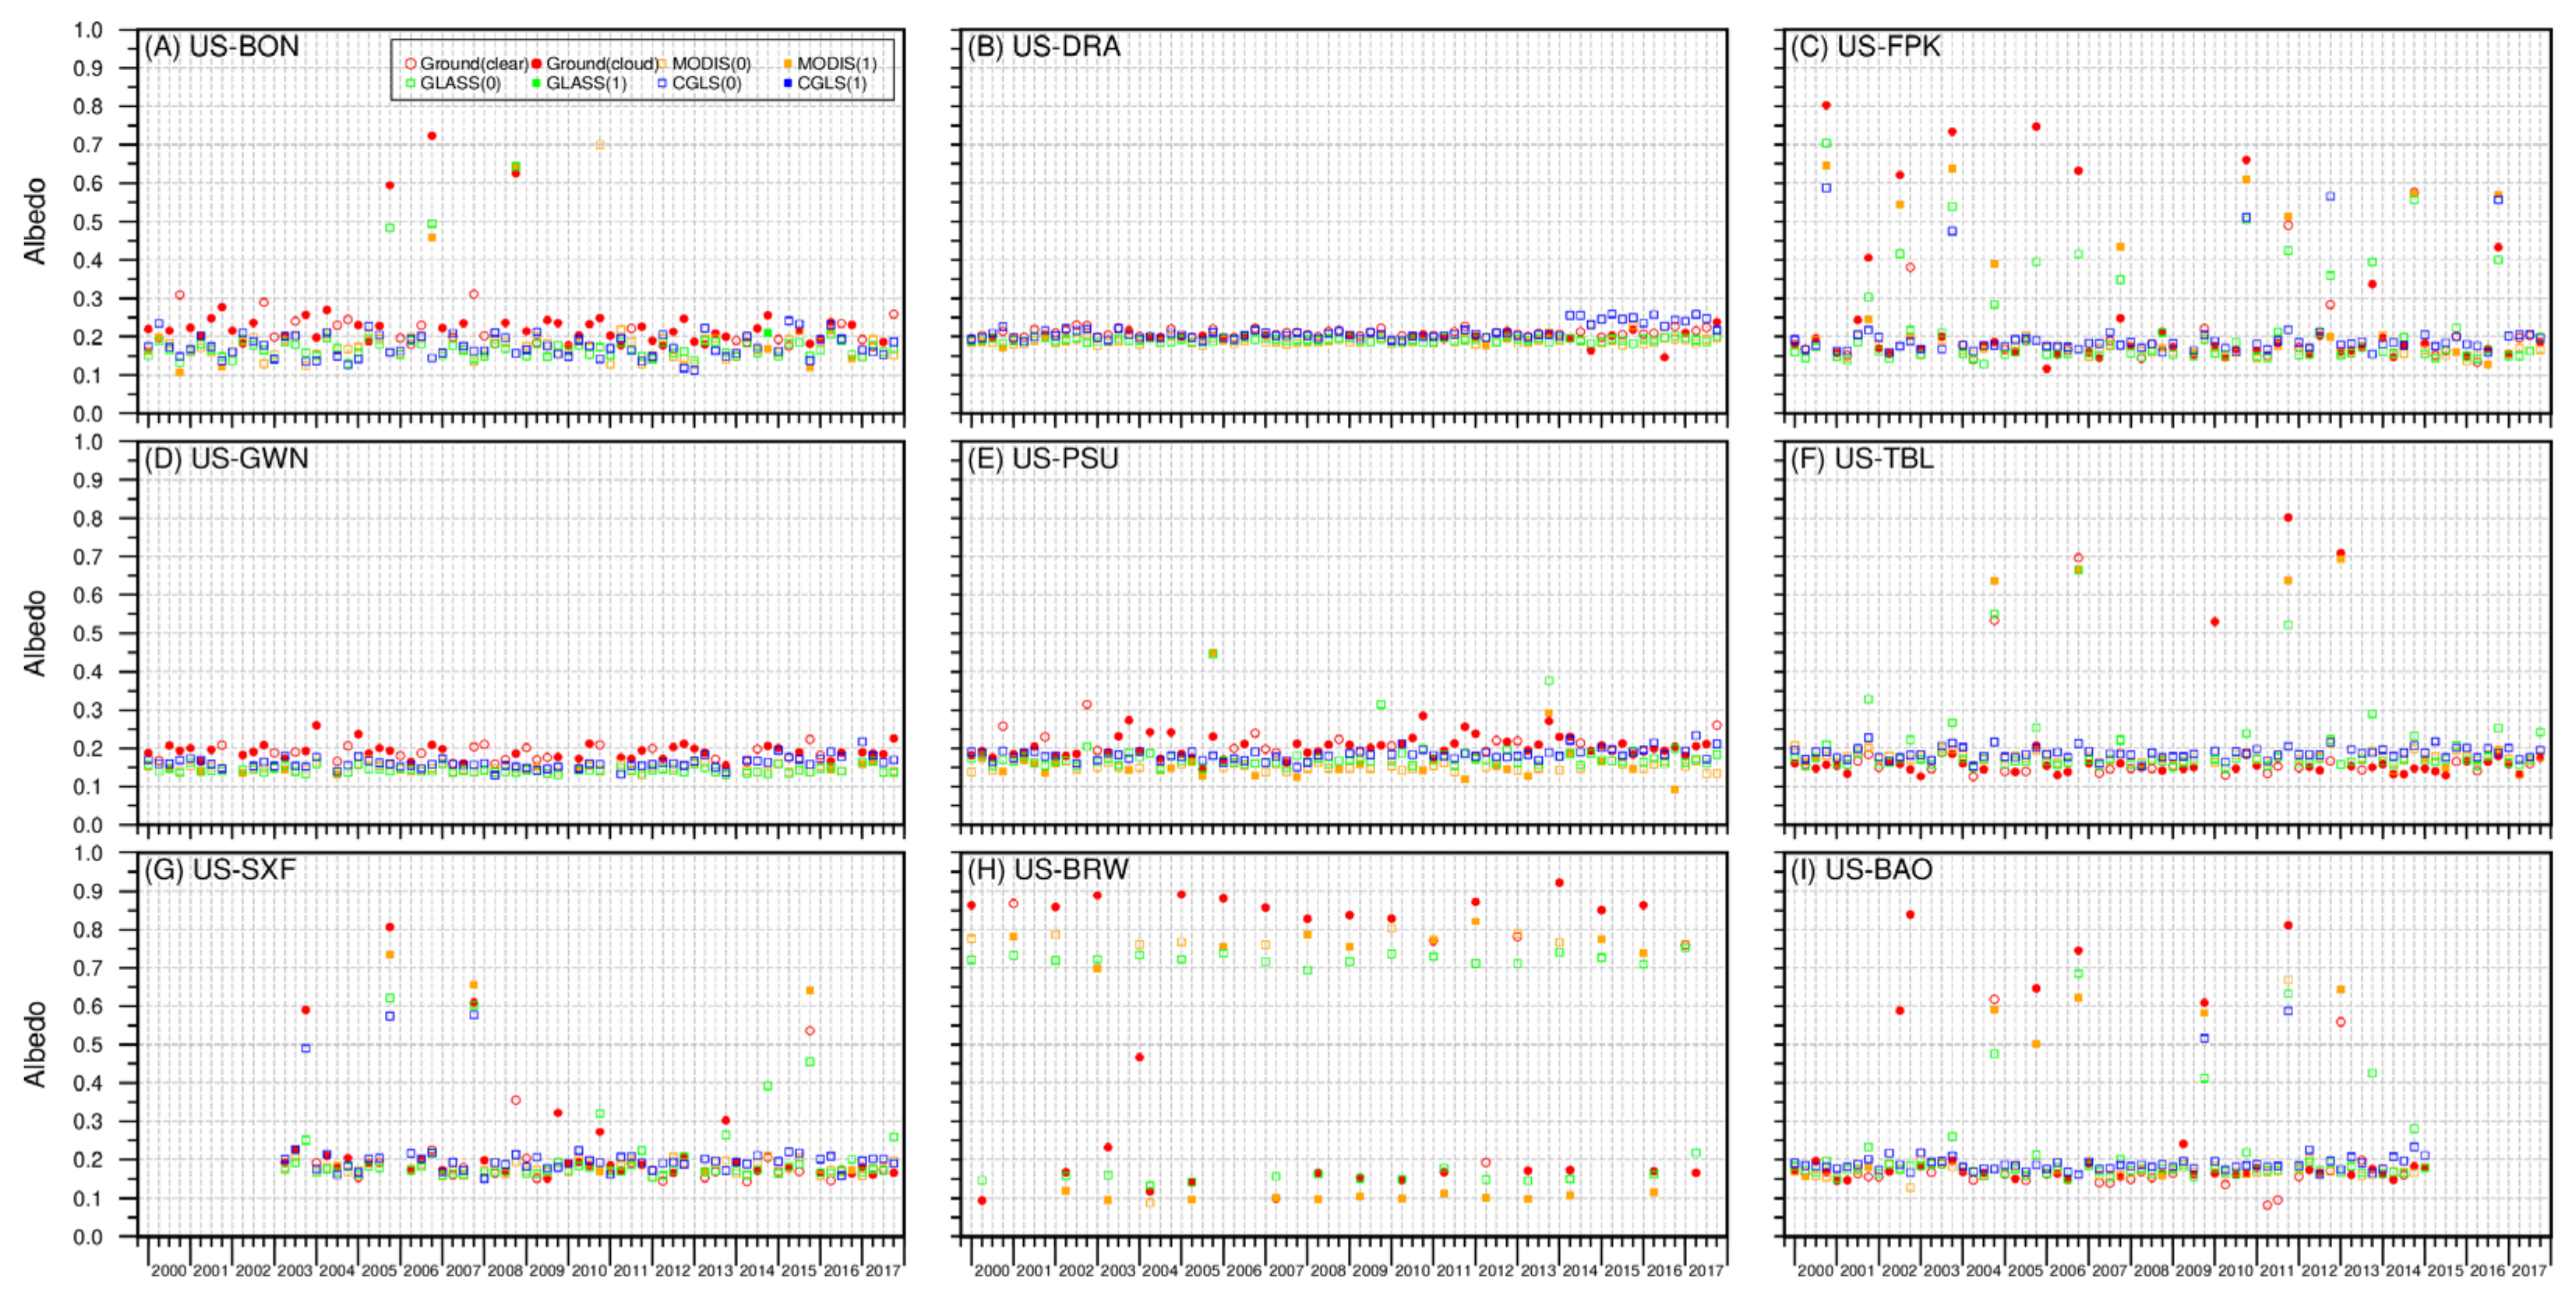
The ground measurements were adopted as the third party to further evaluate the performance of the three discussed operational albedo products over representative ground stations. Figure 9 shows the comparison between ground SW albedo measurements and the satellite-based blue-sky albedo estimated respectively from BSA-SW and WSA-SW of MODIS, GLASS, and CGLS on available dates of the years 2000–2017. Compared with ground measurements, there is an under-estimation which is greater than 0.03, for instance BON (Figure 9A) and PSU (Figure 9E), or over-estimation which is less than 0.05, for instance TBL (Figure 9F) and BAO (Figure 9I) for the blue-sky albedo of the three products. The RMSE and mean error of MODIS is 0.047 and −0.018, which generally performs better than GLASS and CGLS when comparing ground measurements at all discussed sites (Table 2). The difference between the three products and ground measurements fluctuates with locations and seasons. These discussed sites can be divided into three situations. First, the difference between three products and ground fluctuates slightly, by about 0.02, for instance the US-DRA (Figure 9B) and US-GWN (Figure 9D), except for a sudden rise~0.04 in CGLS after 13 August 2014. Compared with ground measurements, CGLS performs better than MODIS and GLASS at US-DRA and US-GWN (Table 2). Second, regarding US-FPK (Figure 9C), US-SXF (Figure 9G), US-TBL (Figure 9F), US-BAO (Figure 9I), US-BON (Figure 9A) and US-PSU (Figure 9E), the difference between products and ground is small, about 0.03 in most cases, but due to the impact of snowfall, CGLS differs apparently from ground, while MODIS and GLASS are frequently closer to ground with an absolute difference of ~0.1 in the spring, autumn and winter seasons of special years. For example, MODIS is the closest to ground measurements with absolute differences of −0.02, and greater by 0.12 than GLASS and ~0.4 than CGLS at the US-BAO on 3 December 2004. Third, the difference between the three products and ground is apparent. At the US-BRW (Figure 9H) located at the northernmost point in the United States, MODIS is generally derived using a backup algorithm. In general, the difference between MODIS and ground is smaller than that of GLASS, while CGLS has no valid data. In terms of the different seasons, MODIS is generally greater than GLASS, by up to 0.09, and less than ground measurements, by up to 0.15 on 23 April, while GLASS is greater than MODIS with an absolute difference of ~0.05, which is closer to ground measurements and almost identical to it in some years, such as 2005, 2008, 2009, and 2010 on 13 August.

4. Discussion

We investigated the consistency or difference of satellite-based land surface albedo products that have been frequently used in numerous applications. As the important standard products routinely providing continuous surface albedo over the global region, MODIS, GLASS, and CGLS, generating the same albedo quantities, were adopted to prevent effects introduced by various definitions of albedo in this investigation [27]. We organized BSA and WSA at VIS, NIR, and SW bands of three discussed data suites on all of the available identical days of 2000–2017 to avoid the potential uncertainty caused by date switches [27]. Our above efforts indicate that an apparent difference exists in the retrieval validity, consistency of global annual mean, spatial distribution and temporal dynamics, in terms of the cross-comparison at VIS, NIR, and SW bands in the global region and the direct comparison with field measurements at SW band over nine ground stations.
In detail, all of the albedo produced by the MODIS, GLASS, and CGLS operational systems have the potential to provide long-term valid retrievals over a global region, but with features changing in spatial and temporal dimensions. Due to the non-identical purpose pursued by each product, MODIS and CGLS data suites only focus on the albedo generation over land surface, while the GLASS dataset includes albedo generation over most ocean regions in addition to the global land and inland water surface as shown in Figure 3. The global spatial distribution of valid retrievals also keeps varying, apparently with the switch of seasons, mainly because of the number of clear observations collected in the daytime. Thus, there is no valid retrieval during the period of polar night over Antarctica in April and August, and for the North pole region in October and December. In addition, over most of the global land region’s concurrently performed albedo estimation, three discussed data suites have high consistency except for variations emerging in Antarctica, west-central Africa, the northern part of South America, and the circular north pole including Greenland. This may be induced by the pre- or post-processing of the retrievals, for instance, the atmosphere correction approach used in MODIS inputs is the 6S (Second Simulation of Satellite Signal in the Solar Spectrum) model [57], while that used in CGLS is the Simplified Model for Atmospheric Correction (SMAC) [58]. Further, GLASS performs an extra post-processing of smoothing and gap-filling on the preliminary estimation of albedo data [42], which improves the percentage of valid retrievals that may fail in the inversion of MODIS and CGLS.
The magnitude of surface albedo products discussed above shows different mean values and various distribution feature of the differences among albedo quantities, and spectral bands or products over the global land surface. The global mean WSA albedo shows a persistent higher value than that of related BSA in MODIS, GLASS, and CGLS, which is determined by the definition of WSA and BSA [27]. BSA is calculated by the integral of BRDF over the view hemisphere, while WSA has a further integral over the illumination hemisphere. Both the global mean value and pixel-based magnitude of surface albedo at NIR, VIS, and SW broadband of the three investigated products exhibits a similar dynamic range, but with detectable differences in most of the global land region, and occasionally with significant difference among products. The difference of global mean between MODIS and GLASS is lower compared with that generated by CGLS, due to frequent CGLS retrievals with relative difference up to 20%, and slightly elevated GLASS over most of the discussed situations, when taking MODIS as the baseline. Though there is only small variation of the pixel-based absolute and relative difference exhibited among the three products, the magnitude of difference varies with the change in retrieval regions. For instance, the magnitude of CGLS exhibits apparent deviation from MODIS and GLASS over North Africa and the Arabian Peninsula at any band discussed, while that of GLASS shows increased difference from MODIS and CGLS over Australia in August. Potential reasons inducing these differences may involve input data sources, data preprocessing, and related algorithms. Moreover, the magnitude of available albedo difference over identical regions also varies with the change of inverse dates, such as that shown over Australia in which we can find lower CGLS colored in yellow-green in April and August, lower GLASS in purple-red in October, and higher CGLS in blue-purple in December. Similarly, the difference of global mean value between WSA and BSA keeps reducing at the individual band when dates change, from 0.02 in April to ~0.01 in December. This implies effects probably emerging from number and quality of collected observations, scope of available region, performed successful retrievals, and algorithm adaptability on land surface situation changing through season switches. The input data, atmospheric corrections method, and inversion algorithms are possible reasons for the variation introduced above.
The difference in source data respectively ingested by MODIS, GLASS, and CGLS can induce variations transferred into albedo retrievals through difference implied in the sensors. As presented above, the source data of MODIS and GLASS albedo generation are the combined observations collected from MODIS instruments on board both Terra/Aqua, while CGLS system adopts SPOT/VEGETATION and PROBA-V. The Spectral Response Function (SRF) of MODIS, SPOT-VGT, and PROBA-V indicates the difference of band location, band width, and response percentage of input signal over similar spectral channels [59]. Compared with SPOT and PROBA -V, the MODIS sensor has narrower band width, especially at NIR and SWIR bands [60], which may enhance the difference at NIR albedo band over the vegetation region during leaf-on season as presented in the results section, and can also propagate into other broadband albedo values. The SRF shape of MODIS and SPOT is close to “Gaussian distribution”, while that of PROBA -V shows an asymmetric shape with higher response percentage at the lower or upper range of each spectral regime [14,59], while the SPOT/VGT and PROBA-V channels provide very similar spectral characteristics in the Blue, Red and NIR bands, but the PROBA-V spectral response in SWIR band is narrower than that of SPOT/VGT [14], which may be one of the reasons inducing the albedo difference of CGLS at NIR and SW bands from June 2014 (Figure 4(A1,A2,B1,B2,C1,C2,D1,D2)). In addition, the abrupt increase of annual absolute differences before and after 2014 over CGLS albedo data series is probably caused by the replacement of input source data from SPOT/VGT to PROBA-V in June of 2014 (Figure S6). This is consistent with the validation of PROBA-V surface albedo, which claimed the systematic positive biases of albedo values in NIR and SW bands between PROBA-V and SPOT/VGT products during the overlapping period of the two sensors from November 2013 to January 2014 [52].
Models used in data preprocessing or albedo estimation are another important reason for the induced difference among discussed albedo products. Depending on the feature of the acquisitions collected by individual sensors, each satellite preprocessing chain adopts various methods to correct the atmosphere contamination. MODIS top-of-atmosphere product adopts the 6S model to theoretically remove the atmosphere effect on surface radiation, while CGLS takes SMAC (Simplified Model for Atmospheric Correction). Proud et al. [61] pointed out that SMAC fails to provide highly accurate correction in multiple sets of atmospheric conditions over Africa when compared with 6S. The anomalies could affect the albedo product, even if the error cannot be quantified directly (Figure 4(B1–B3)). Moreover, after correcting the bug for Sun–Earth distance in SPOT data, the surface reflectance shows the seasonal variation and becomes higher, with large differences of up to 7% [62], with reflectance data ingested by CGLS is SPOT/VEGETATION (Collection 2) that has not been fixed due to the SunEarth bug [14]. The reflectance difference induced by various preprocessing models should be transferred into the estimation of albedo, thus contributing to the difference of surface albedo among the three operational products, including the seasonal variation of CGLS (Figure 4). In addition, the inversion algorithm is another important factor contributing to the albedo difference among products. MODIS and CGLSA adopt the semi-empirical linear kernel-driven model RTLSR to first retrieve BRDF and then estimate surface albedo by intervals of the BRDF overview or illumination hemisphere. GLASS employs the angular bin and STF algorithm, which improves the inversion effect of snow and ice by using an ART model [63,64]. Though MODIS and CGLS use the same inversion model of BRDF and identical scheme of albedo estimation, different geometrical kernels are used, as CGLS adopts a Roujean kernel and MODIS selects a Li_Sparse_Reciprocal kernel. Pokrovsky et al. [65] claimed that different kernels can result in differences in the estimation of albedo. Further, each inversion scheme has its particular advantages or disadvantages, such as kernel-driven models and the direct estimation algorithm which may lead to differences among products, especially in snow-covered areas [64]. As shown over the Central United States on 3 December, the annual absolute difference at BSA VIS reveals significant difference mainly in the northern part of the investigated regions due to snow and ice (Figure S7). Similar performance can be found from ground measurements at field station US-TBL (Figure 9F) and US-BAO (Figure 9I), which fall in this region. Therefore, a different inversion algorithm can lead to variation in the three products’ surface albedo, especially over the snow and ice region. Furthermore, the approach of narrow-to-broadband conversion is frequently used to acquire the broadband albedo, such as at VIS, NIR, and SW bands, through the weighted sum of narrow band albedos. MODIS and GLASS use the same broadband albedo range with a conversion algorithm based on Liang (2000) [66], while CGLS defines a different broadband albedo interval, and the conversion algorithm was originally determined by Van Leeuwen and Roujean (2002) [67] for VEGETATION and further applied to PROBA-V by VITO (Flemish Institute for Technological Research). This may induce a slight difference in the compared albedo products at each broadband.

5. Conclusions

This paper investigated the consistence or difference among three operational surface albedo products (MODIS, GLASS and CGLS) that have been frequently used by researchers all over the world. We discussed the validity of each data suite, consistency of global annual mean albedo, spatial distribution and magnitude variation of differences in BSA and WSA at VIS, NIR, and SW regimes, followed the cross-comparison with ground measurements at the shortwave band over the same period of 2000–2017. The following conclusions are drawn.
First, all three products can provide valid long-term albedo for most terrestrial areas and GLASS can provide additionally for sea areas. The distribution and percentage of terrestrial valid retrievals for the three products vary with retrieval dates, with the GLASS having the highest percentage of terrestrial valid pixels (up to 93% on 24 October), followed by MODIS (up to 46% on 23 April), and CGLS having the least successful retrieval (up to 35% on 23 April). The area of invalid retrieval includes Antarctica (in April and August) and the northern high latitude region (in October and December), with areas of missing data shifting poleward during the period of polar nights. In addition, the missing data in CGLS is mainly located in the northern high latitudes, MODIS mainly in Central Africa in April and August, and GLASS in the 50°N–60°N latitude belt in December.
Second, the investigation of the global mean albedo of the terrestrial region indicates that the mean albedo varies among investigated bands and dates from 2000 to 2017. The mean albedo of CGLS is frequently greater than that of MODIS/GLASS, with absolute differences up to 0.05 or relative difference ~20% to MODIS/GLASS retrievals at SW. The global mean albedo for the investigated bands of all three products has an increasing trend from April to December, except for CGLS, with sporadic fluctuation. Compared with MODIS and GLASS, another particular change is the abrupt rise in CGLS at NIR and SW in June of 2014, with an increase of absolute differences of up to 0.04 and relative differences about 14%. Furthermore, the linear temporal trend of global albedo mean reveals that SW and VIS bands in each product have different trending; for example, there is a continuous increasing trend in CGLS, contrasted to the decreasing trend in GLASS. Further, the slope of linear increasing trend at the NIR band of CGLS is 10–100 times greater than that of MODIS and GLASS.
Third, the absolute differences between the three products are smaller in the southern hemisphere than in the northern hemisphere, and the regions with apparent differences for the investigated bands are mainly located in Central North America for MODIS and CGLS and the southern Siberian Plain for CGLS in April, North Africa and the Arabian Peninsula for CGLS and Australia for GLASS in August, Central Mongolia and Central Asia for GLASS in October, and Tarim Basin, Inner Mongolia, China and Central USA for GLASS in December. On the other hand, the VIS band shows higher relative differences compared with NIR and SW bands, especially in Central US, Central Eurasia and East-Central South America. In addition, the changes of absolute and relative differences with dates can be captured in the identical region; for example, the absolute difference of CGLS gradually increases from April to December in North Africa. Regarding the magnitude of variation, the absolute difference for the three products mainly concentrates within (−0.02, 0.02) over the global region, with a significant range of absolute variance between 0.02 and 0.06 at CGLS, particularly in WSA SW band, up to 20% on 24 October and 3 December, occasionally an extreme absolute difference above 0.1 emerging; while relative differences are mainly concentrated within (−10%,10%), with the magnitude of relative differences frequently distributed among individual products 10–20% away from the baseline value. The CGLS has higher opportunity to acquire the largest relative difference compared with MODIS and GLASS, e.g., with valid pixels of 19% at WSA-SW on 3 December. Infrequently, the deviation of relative differences can reach more than 40% from the baseline. In terms of ground measurements, MODIS with a RMSE of 0.047 and mean error of –0.018 generally performs better than GLASS and CGLS at all sites discussed, while for those sites without the influence of snowfall, CGLS performs better than GLASS and MODIS when the difference between the three products and ground fluctuates slightly.
The input data, approach of atmospheric correction, and the inversion algorithm may cause differences between products, which requires us to select data suites with higher consistency during the organization of various albedo products. GLASS is recommended for sea area related long-term studies, and MODIS or GLASS can combine together for long-term studies at 60°N–90°N or 60°S–90°S. CGLS may increase its temporal consistency and serve the user community better once bugs are fixed. For areas where three products have detectable or apparent difference, thorough consideration is needed to evaluate whether the difference can reverse or introduce more uncertainty on results of any further applications. In addition, to improve the consistency of the three products, it is important to pay more attention to the apparent difference areas and to refine related inversion algorithms.

Supplementary Materials

The following are available online at https://www.mdpi.com/article/10.3390/rs13234869/s1, Table S1: A list of the current surface albedo products derived from satellites. Figure S1: Combination of absolute difference of MODIS, GLASS, and CGLS to their mean value on 23 April (A), August 13 (B), 24 October (C) and 3 December (D) of 2000–2017 at BSA (left column) and WSA (right column) of NIR (1st row), SW (2nd row), and VIS (3rd row) band in panel A-D. Note, the absolute difference of MODIS, GLASS and CGLS within the dominant dynamic range (−0.08, +0.08) are respectively mapped into RGB channel as that shown in the triangle color panel. Figure S2: Combination of relative difference of MODIS, GLASS and CGLS to their mean value on 23 April (A), 13 August (B), 24 October (C) and 3 December (D) of 2000–2017 at BSA (left column) and WSA (right column) of NIR (1st row), SW (2nd row), and VIS (3rd row) band in panel A–D. Note, the relative difference of MODIS, GLASS and CGLS within the dominant dynamic range (−30%, +30%) are respectively mapped into RGB channel as that shown in the triangle color panel. Figure S3: Spatial distribution of absolute difference among BSA and WSA (left and right columns of each panel) of MODIS (red), GLASS (green) and CGLS (blue) at NIR, SW, and VIS (respectively 1st, 2nd, and 3rd row in each panel) within (grey) and out of (colored) [−0.02, 0.02] that are graded in terms of the retrieval having largest difference away three products’ mean, on 23 April (panel A), 13 August (panel B), 24 October (panel C) and 3 December (panel D) of 2000–2017. Figure S4: Spatial distribution of relative difference among BSA and WSA (left and right columns of each panel) of MODIS (red), GLASS (green) and CGLS (blue) at NIR, SW, and VIS (respectively 1st, 2nd, and 3rd row in each panel) within (grey) and out of (colored) [−10%, 10%] that are graded in terms of the retrieval having largest relative difference to that of three products’ mean, on 23 April (panel A), 13 August (panel B), 24 October (panel C) and 3 December (panel D) of 2000–2017. Figure S5: Location of two special cases covering representative surface clusters for absolute difference selected from MCD12Q1 IGBP map in North Africa, and central United States. Figure S6: NIR BSA performance on 13 August of North Africa case with the combination of MODIS, GLASS and CGLS absolute differences averaged within 2000–2017. Figure S7: VIS BSA performance on 3 December of Central United States case with the combination of MODIS, GLASS and CGLS absolute differences averaged within 2000–2017.

Author Contributions

Conceptualization, Y.S. and C.S.; methodology, C.S. and Y.S.; data organization, C.S., L.T., X.M., W.H., Q.Z.; writing—original draft preparation, C.S. and Y.S.; writing—review and editing, A.X., T.L., Y.T., C.W., Y.M.; supervision, Y.S.; funding acquisition, Y.S. All authors have read and agreed to the published version of the manuscript.

Funding

This research was supported by National Natural Science Foundation of China (No. 42071351), National Key Research and Development Program of China (No.2020YFA0608501, No.2017YFB0504204), CAS “BR” (No. Y 938091), Project supported discipline innovation team of Liaoning Technical University (No. LNTU20TD-23), The Liaoning Key Research and Development Program (No.2020JH2/10100044), National Natural Science Foundation of China (Grant Nos. 42030109, 42074012).

Acknowledgments

We thank the relevant teams and organizations for providing the data sets used in this study. The GLASS albedo product is provided by Beijing Normal University and available at http://glass-product.bnu.edu.cn/introduction/abd.html, accessed on 25 June 2020. The MODIS albedo and land cover products are available at https://search.earthdata.nasa.gov/search, accessed on 22 June 2020.The CGLS albedo product is available at https://land.copernicus.eu/global/index.html, accessed on 25 July 2020. Measurements of BSRN and SUFRAD are provided by NOAA available at http://bsrn.awi.de, accessed on 20 May 2020 and http://www.esrl.noaa.gov/gmd/grad/surfrad/, accessed on 20 May 2020. And the authors would like to give thanks to Junfeng Zhang of Xinjiang Institute of Ecology and Geography, Chinese Academy of Sciences for his help in this research.

Conflicts of Interest

The authors declare no conflict of interest.

References

  1. Dickinson, R.E. Land surface processes and climate—Surface albedos and energy balance. In Advances in Geophysics; Elsevier: Amsterdam, The Netherlands, 1983; Volume 25, pp. 305–353. [Google Scholar] [CrossRef]
  2. Liang, S.L.; Wang, D.D.; He, T.; Yu, Y.Y. Remote sensing of earth’s energy budget: Synthesis and review. Int. J. Digit. Earth 2019, 12, 737–780. [Google Scholar] [CrossRef] [Green Version]
  3. Deng, C.L.; Zhang, B.Q.; Cheng, L.Y.; Hu, L.Q.; Chen, F.H. Vegetation dynamics and their effects on surface water-energy balance over the Three-North Region of China. Agric. Meteorol. 2019, 275, 79–90. [Google Scholar] [CrossRef]
  4. Hu, Y.H.; Hou, M.T.; Zhao, C.L.; Zhen, X.J.; Yao, L.; Xu, Y.H. Human-induced changes of surface albedo in Northern China from 1992–2012. Int. J. Appl. Earth Obs. Geoinf. 2019, 79, 184–191. [Google Scholar] [CrossRef]
  5. Zhao, F.; Lan, X.; Li, W.; Li, T. Influence of Land Use Change on the Surface Albedo and Climate Change in the Qinling-Daba Mountains. Sustainability 2021, 13, 10153. [Google Scholar] [CrossRef]
  6. Charney, J.; Stone, P.H.; Quirk, W.J. Drought in the Sahara: A biogeophysical feedback mechanism. Science 1975, 187, 434–435. [Google Scholar] [CrossRef] [Green Version]
  7. Veraverbeke, S.; Verstraeten, W.W.; Lhermitte, S.; Van De Kerchove, R.; Goossens, R. Assessment of post-fire changes in land surface temperature and surface albedo, and their relation with fire–burn severity using multitemporal MODIS imagery. Int. J. Wildland Fire 2012, 21, 243–256. [Google Scholar] [CrossRef] [Green Version]
  8. Lyons, E.A.; Jin, Y.F.; Randerson, J.T. Changes in surface albedo after fire in boreal forest ecosystems of interior Alaska assessed using MODIS satellite observations. J. Geophys. Res. Biogeosci. 2008, 113. [Google Scholar] [CrossRef] [Green Version]
  9. Bright, B.C.; Hudak, A.T.; Kennedy, R.E.; Braaten, J.D.; Khalyani, A.H. Examining post-fire vegetation recovery with Landsat time series analysis in three western North American forest types. Fire Ecol. 2019, 15, 1–14. [Google Scholar] [CrossRef] [Green Version]
  10. Wu, X.; Wei, Y.; Fu, B.; Wang, S.; Zhao, Y.; Moran, E.F. Evolution and effects of the social-ecological system over a millennium in China’s Loess Plateau. Sci. Adv. 2020, 6, 276. [Google Scholar] [CrossRef]
  11. Qu, Y.; Liang, S.L.; Liu, Q.; He, T.; Liu, S.H.; Li, X.W. Mapping Surface Broadband Albedo from Satellite Observations: A Review of Literatures on Algorithms and Products. Remote Sens. 2015, 7, 990–1020. [Google Scholar] [CrossRef] [Green Version]
  12. Schaaf, C.B.; Gao, F.; Strahler, A.H.; Lucht, W.; Li, X.W.; Tsang, T.; Strugnell, N.C.; Zhang, X.Y.; Jin, Y.F.; Muller, J.P.; et al. First operational BRDF, albedo nadir reflectance products from MODIS. Remote Sens. Environ. 2002, 83, 135–148. [Google Scholar] [CrossRef] [Green Version]
  13. Liu, Y.; Wang, Z.; Sun, Q.; Erb, A.M.; Li, Z.; Schaaf, C.B.; Zhang, X.; Roman, M.O.; Scott, R.L.; Zhang, Q.; et al. Evaluation of the VIIRS BRDF, Albedo and NBAR products suite and an assessment of continuity with the long term MODIS record. Remote Sens. Environ. 2017, 201, 256–274. [Google Scholar] [CrossRef]
  14. Carrer, D.; Smets, B.; Ceamanos, X.; Roujean, J.-L. SPOT/VEGETATION and PROBA-V Surface Albedo Products—1 Km Version 1; Algorithm Theoretical Basis Document (ATBD), Issue 2.11. Copernicus Global Land Operations CGLOPS-1 (Framework Service Contract N° 199494-JRC). Available online: https://land.copernicus.eu/global/sites/cgls.vito.be/files/products/CGLOPS1_ATBD_SA1km-V1_I2.11.pdf (accessed on 10 May 2020).
  15. Liu, N.F.; Liu, Q.; Wang, L.Z.; Liang, S.L.; Wen, J.G.; Qu, Y.; Liu, S.H. A statistics-based temporal filter algorithm to map spatiotemporally continuous shortwave albedo from MODIS data. Hydrol. Earth Syst. Sci. 2013, 17, 2121–2129. [Google Scholar] [CrossRef] [Green Version]
  16. Qu, Y.; Liu, Q.; Liang, S.; Wang, L.; Liu, N.; Liu, S. Direct-estimation algorithm for mapping daily land-surface broadband albedo from MODIS data. IEEE Trans. Geosci. Remote Sens. 2013, 52, 907–919. [Google Scholar] [CrossRef]
  17. Diner, D.J.; Martonchik, J.V.; Borel, C.; Gerstl, S.A.W.; Gordon, H.R.; Knyazikhin, Y.; Myneni, R.; Pinty, B.; Verstraete, M.M. Multi-Angle Imaging Spectro-Radiometer: Level 2 Surface Retrieval Algorithm Theoretical Basis Document; Jet Propulsion Laboratory, California Institute of Technology: Pasadena, CA, USA, 2008. Available online: https://eospso.gsfc.nasa.gov/sites/default/files/atbd/ATB_L2Surface43.pdf (accessed on 10 May 2020).
  18. Shuai, Y.M.; Masek, J.G.; Gao, F.; Schaaf, C.B. An algorithm for the retrieval of 30-m snow-free albedo from Landsat surface reflectance and MODIS BRDF. Remote Sens. Environ. 2011, 115, 2204–2216. [Google Scholar] [CrossRef]
  19. Shuai, Y.M.; Masek, J.G.; Gao, F.; Schaaf, C.B.; He, T. An approach for the long-term 30-m land surface snow-free albedo retrieval from historic Landsat surface reflectance and MODIS-based a priori anisotropy knowledge. Remote Sens. Environ. 2014, 152, 467–479. [Google Scholar] [CrossRef]
  20. Leonard, O.; Pinnock, P.; Mulle, J.-P.; Kennedy, T.; Lewis, P.; Kharbouche, S.; Fisher, D.; North, P.; Fisher, J.; Preusker, R.; et al. GlobAlbedo: Algorithm Theoretical Basis Document. European Space Agency. Available online: http://www.globalbedo.org/docs/ (accessed on 10 May 2020).
  21. Schroeder, T.; Fischer, J.; Preusker, R.; Schaale, M.; Regner, P. Retrieval of surface reflectances in the framework of the MERIS GLOBAL LAND SURFACE ALBEDO MAPS Project. In Proceedings of the MERIS (A) ATSR Workshop 2005 (ESA SP-597), Frascati, Italy, 26–30 September 2005. [Google Scholar]
  22. Muller, J.P.; Preusker, R.; Fischer, J.; Zuhlke, M.; Brockmann, C.; Regner, P. ALBEDOMAP: MERIS land surface albedo retrieval using data fusion with MODIS BRDF and its validation using contemporaneous EO and in situ data products. In Proceedings of the 2007 IEEE International Geoscience and Remote Sensing Symposium (IGARSS 2007), Barcelona, Spain, 23–28 June 2007; pp. 2404–2407. [Google Scholar]
  23. Carrer, D.; Roujean, J.-L.; Meurey, C. Comparing operational MSG/SEVIRI land surface albedo products from Land SAF with ground measurements and MODIS. IEEE Trans Geosci. Remote Sens. 2009, 48, 1714–1728. [Google Scholar] [CrossRef]
  24. Kati, A.; Jääskeläinen, E.; Riihelä, A.; Manninen, T.; Andersson, K. Algorithm Theoretical Basis Document–CM SAF Cloud, Albedo, Radiation Data Record, AVHRR-based, Edition 2 (CLARA-A2) –Surface Albedo. EUMETSAT Satellite Application Facility on Climate Monitoring. Available online: https://www.cmsaf.eu/SharedDocs/Literatur/document/2016/saf_cm_fmi_atbd_gac_sal_2_3_pdf.pdf?__blob=publicationFile (accessed on 10 May 2020).
  25. Maignan, F.; Breon, F.M.; Lacaze, R. Bidirectional reflectance of Earth targets: Evaluation of analytical models using a large set of spaceborne measurements with emphasis on the Hot Spot. Remote Sens. Environ. 2004, 90, 210–220. [Google Scholar] [CrossRef]
  26. Lacaze, R.; Maignan, F. POLDER-3/PARASOL Land Surface Algorithms Description. Available online: https://www.theia-land.fr/wp-content-theia/uploads/sites/2/2018/12/PARASOL_TE_AlgorithmDescription_I3.11.pdf (accessed on 10 May 2020).
  27. Shuai, Y.; Tuerhanjiang, L.; Shao, C.; Gao, F.; Zhou, Y.; Xie, D.; Liu, T.; Liang, J.; Chu, N. Re-understanding of land surface albedo and related terms in satellite-based retrievals. Big Earth Data 2020, 4, 45–67. [Google Scholar] [CrossRef]
  28. Roujean, J.L.; Leroy, M.; Deschamps, P.Y. A bidirectional reflectance model of the Earth’s surface for the correction of remote sensing data. J. Geophys. Res. Atmos. 1992, 97, 20455–20468. [Google Scholar] [CrossRef]
  29. Lucht, W.; Schaaf, C.B.; Strahler, A.H. An algorithm for the retrieval of albedo from space using semiempirical BRDF models. IEEE Trans. Geosci. Remote Sens. 2000, 38, 977–998. [Google Scholar] [CrossRef] [Green Version]
  30. Houspanossian, J.; Gimenez, R.; Jobbagy, E.; Nosetto, M. Surface albedo raise in the South American Chaco: Combined effects of deforestation and agricultural changes. Agric. Meteorol. 2017, 232, 118–127. [Google Scholar] [CrossRef] [Green Version]
  31. Hovi, A.; Lindberg, E.; Lang, M.; Arumae, T.; Peuhkurinen, J.; Sirparanta, S.; Pyankov, S.; Rautiainen, M. Seasonal dynamics of albedo across European boreal forests: Analysis of MODIS albedo and structural metrics from airborne LiDAR. Remote Sens. Environ. 2019, 224, 365–381. [Google Scholar] [CrossRef]
  32. Planque, C.; Carrer, D.; Roujean, J.L. Analysis of MODIS albedo changes over steady woody covers in France during the period of 2001–2013. Remote Sens. Environ. 2017, 191, 13–29. [Google Scholar] [CrossRef]
  33. Riihelä, A.; King, M.D.; Anttila, K. The surface albedo of the Greenland Ice Sheet between 1982 and 2015 from the CLARA-A2 dataset and its relationship to the ice sheet’s surface mass balance. Cryosphere 2019, 13, 2597–2614. [Google Scholar] [CrossRef] [Green Version]
  34. Möllera, R.; Dagsson-Waldhauserova, P.; Mller, M.; Möller, R.; Dagsson-Waldhauserova, P.; Möller, M.; Kukla, P.A.; Schneider, C.; Gudmundsson, M.T. Persistent albedo reduction on southern Icelandic glaciers due to ashfall from the 2010 Eyjafjallajökull eruption. Remote Sens. Environ. 2019, 233, 111396. [Google Scholar] [CrossRef]
  35. Zhao, G.S.; Dong, J.W.; Cui, Y.P.; Liu, J.Y.; Zhai, J.; He, T.; Zhou, Y.Y.; Xiao, X.M. Evapotranspiration-dominated biogeophysical warming effect of urbanization in the Beijing-Tianjin-Hebei region, China. Clim. Dyn. 2019, 52, 1231–1245. [Google Scholar] [CrossRef]
  36. He, T.; Liang, S.L.; Song, D.X. Analysis of global land surface albedo climatology and spatial-temporal variation during 1981–2010 from multiple satellite products. J. Geophys. Res. Atmos. 2014, 119, 10281–10298. [Google Scholar] [CrossRef]
  37. Song, R.; Muller, J.P.; Kharbouche, S.; Woodgate, W. Intercomparison of Surface Albedo Retrievals from MISR, MODIS, CGLS Using Tower and Upscaled Tower Measurements. Remote Sens. 2019, 11, 644. [Google Scholar] [CrossRef] [Green Version]
  38. Mota, B.; Gobron, N.; Cappucci, F.; Morgan, O. Burned area and surface albedo products: Assessment of change consistency at global scale. Remote Sens. Environ. 2019, 225, 249–266. [Google Scholar] [CrossRef]
  39. Abera, T.A.; Heiskanen, J.; Pellikka, P.K.; Maeda, E.E. Impact of rainfall extremes on energy exchange and surface temperature anomalies across biomes in the Horn of Africa. Agric. Meteorol. 2020, 280, 107779. [Google Scholar] [CrossRef]
  40. Salomon, J.G.; Schaaf, C.B.; Strahler, A.H.; Gao, F.; Jin, Y.F. Validation of the MODIS Bidirectional Reflectance Distribution Function and Albedo retrievals using combined observations from the Aqua and Terra platforms. IEEE Trans. Geosci. Remote Sens. 2006, 44, 1555–1565. [Google Scholar] [CrossRef]
  41. Liu, J.C.; Schaaf, C.; Strahler, A.; Jiao, Z.T.; Shuai, Y.M.; Zhang, Q.L.; Roman, M.; Augustine, J.A.; Dutton, E.G. Validation of Moderate Resolution Imaging Spectroradiometer (MODIS) albedo retrieval algorithm: Dependence of albedo on solar zenith angle. J. Geophys. Res. Atmos. 2009, 114. [Google Scholar] [CrossRef]
  42. Liu, Q.; Wang, L.Z.; Qu, Y.; Liu, N.F.; Liu, S.H.; Tang, H.R.; Liang, S.L. Preliminary evaluation of the long-term GLASS albedo product. Int. J. Digit. Earth 2013, 6, 69–95. [Google Scholar] [CrossRef]
  43. Sánchez-Zapero, J.; de la Madrid, L.; Camacho, F. Validation Report of Surface Albedo (SA) from PROBA-V Collection 1 km Version 1.5 (Issue I2.21). Copernicus Global Land Operations CGLOPS-1 (Framework Service Contract N° 199494-JRC). Available online: https://land.copernicus.eu/global/sites/cgls.vito.be/files/products/CGLOPS1_VR_SA1km-PROBAV-V1.5_I2.21.pdf (accessed on 9 April 2020).
  44. Driemel, A.; Augustine, J.; Behrens, K.; Colle, S.; Cox, C.; Cuevas-Agulló, E.; Denn, F.M.; Duprat, T.; Fukuda, M.; Grobe, H.; et al. Baseline Surface Radiation Network (BSRN): Structure and data description (1992–2017). Earth Syst. Sci. Data 2018, 10, 1491–1501. [Google Scholar] [CrossRef] [Green Version]
  45. Augustine, J.A.; Hodges, G.B.; Cornwall, C.R.; Michalsky, J.J.; Medina, C.I.; Augustine, J.A.; Hodges, G.B.; Cornwall, C.R.; Michalsky, J.J.; Medina, C.I. An update on SURFRAD–the GCOS Surface Radiation Budget Network for the Continental United States. J. Atmos. Ocean. Technol. 2005, 22, 1460–1472. [Google Scholar] [CrossRef]
  46. Wang, Z.S.; Schaaf, C.B.; Sun, Q.S.; Shuai, Y.M.; Roman, M.O. Capturing rapid land surface dynamics with Collection V006 MODIS BRDF/NBAR/Albedo (MCD43) products. Remote Sens. Environ. 2018, 207, 50–64. [Google Scholar] [CrossRef]
  47. World Meteorological Organization. Guide to Instruments and Methods of Observation: Volume I—Measurement of Meteorological Variables; WMO-No.8; World Meteorological Organization: Geneva, Switzerland, 2018; pp. 256–267. [Google Scholar]
  48. Liu, Y.; Wang, Z.; Sun, Q.; Wang, Z.S.; Zhan, L.; Román, M.O.; Crystal, S. VIIRS BRDF, Albedo, and NBAR Product Algorithm Theoretical Basis Document. Available online: https://www.umb.edu/editor_uploads/images/school_for_the_environment_cs/Viirs/VIIRS_ATBD_Apr_Jul2017_final.pdf (accessed on 10 May 2020).
  49. Shuai, Y. Tracking Daily Land Surface Albedo and Reflectance Anisotropy with MODerate-Resolution Imaging Spectroradiometer (MODIS). Ph.D. Thesis, Boston University, Boston, MA, USA, 2010. [Google Scholar]
  50. Shuai, Y.M.; Schaaf, C.B.; Strahler, A.H.; Liu, J.C.; Jiao, Z.T. Quality assessment of BRDF/albedo retrievals in MODIS operational system. Geophys. Res. Lett. 2008, 35. [Google Scholar] [CrossRef]
  51. Liang, S.; Zhang, X.; Xiao, Z.; Cheng, J.; Liu, Q.; Zhao, X. Global Land Surface Satellite (GLASS) Products: Algorithms, Validation and Analysis; Springer Science & Business Media: Berlin/Heidelberg, Germany, 2013. [Google Scholar]
  52. Sanchez-Zapero, J. Scientific Quality Evaluation (SQE) of PROBA-V Surface Albedo (SA) Collection 1 km Version 1 (Issue I1.00). Copernicus Global Land Operations CGLOPS-1 (Framework Service Contract N° 199494-JRC). Available online: https://land.copernicus.eu/global/sites/cgls.vito.be/files/products/CGLOPS1_SQE2017_SA1km-V1_I1.00.pdf (accessed on 9 April 2020).
  53. Sanchez-Zapero, J. Quality Assessment Report of Surface Albedo (SA) -Version 1 SPOT/VEGETATION (Issue I1.10). Gio Global Land Component-Lot I (Framework Service Contract N° 388533-JRC). Available online: https://land.copernicus.eu/global/sites/cgls.vito.be/files/products/CGLOPS1_SQE2017_SA1km-V1_I1.00.pdf (accessed on 9 April 2020).
  54. Zhang, X.T.; Liang, S.L.; Wang, K.C.; Li, L.; Gui, S. Analysis of Global Land Surface Shortwave Broadband Albedo From Multiple Data Sources. IEEE J. Sel. Top. Appl. Earth Obs. Remote Sens. 2010, 3, 296–305. [Google Scholar] [CrossRef]
  55. Lewis, P.; Barnsley, M. Influence of the Sky Radiance Distribution on Various Formulations of the Earth Surface Albedo. In Proceedings of the 6th International Symposium on Physical Measurements and Signatures in Remote Sensing, Val d’Isère, France, 17–21 January 1994; pp. 707–715. [Google Scholar]
  56. Román, M.O.; Schaaf, C.B.; Lewis, P.; Gao, F.; Anderson, G.P.; Privette, J.L.; Strahler, A.H.; Woodcock, C.E.; Barnsley, M. Assessing the coupling between surface albedo derived from MODIS and the fraction of diffuse skylight over spatially-characterized landscapes. Remote Sens. Environ. 2010, 114, 738–760. [Google Scholar] [CrossRef]
  57. Vermote, E.; Vermeulen, A. Atmospheric correction algorithm: Spectral reflectances (MOD09). ATBD Version 1999, 4, 1–107. [Google Scholar]
  58. Carrer, D.; Smets, B.; Swinnen, E.; Ceamanos, X.; Roujean, J.-L. Top of canopy normalized reflectance (toc-r) Collection 1km Version 1.5; Algorithm Theoretical Basis Document (ATBD), Issue 2.11. Copernicus Global Land Operations CGLOPS-1 (Framework Service Contract N° 199494-JRC). Available online: https://land.copernicus.eu/global/sites/cgls.vito.be/files/products/CGLOPS1_ATBD_TOCR1km-V1.5_I2.21.pdf (accessed on 10 May 2020).
  59. Gu, L.X.; Shuai, Y.M.; Shao, C.Y.; Xie, D.H.; Zhang, Q.L.; Li, Y.M.; Yang, J. Angle Effect on Typical Optical Remote Sensing Indices in Vegetation Monitoring. Remote Sens. 2021, 13, 1699. [Google Scholar] [CrossRef]
  60. Sánchez-Zapero, J.; Camacho, F.; Martínez-Sánchez, E.; Lacaze, R.; Carrer, D.; Pinault, F.; Benhadj, I.; Muñoz-Sabater, J. Quality Assessment of PROBA-V Surface Albedo V1 for the Continuity of the Copernicus Climate Change Service. Remote Sens. 2020, 12, 2596. [Google Scholar] [CrossRef]
  61. Proud, S.R.; Fensholt, R.; Rasmussen, M.O.; Sandholt, I. A comparison of the effectiveness of 6S and SMAC in correcting for atmospheric interference of Meteosat Second Generation images. J. Geophys. Res. Atmos. 2010, 115. [Google Scholar] [CrossRef]
  62. Toté, C.; Swinnen, E.; Sterckx, S.; Clarijs, D.; Quang, C.; Maes, R. Evaluation of the SPOT/VEGETATION Collection 3 reprocessed dataset: Surface reflectances and NDVI. Remote Sens. Environ. 2017, 201, 219–233. [Google Scholar] [CrossRef]
  63. Ding, A.X.; Jiao, Z.T.; Dong, Y.D.; Zhang, X.N.; He, D.D.; Cui, L.; Yin, S.Y.; Chang, Y.X. Performance assessment of the operational MODIS BRDF model for snow/ice cover type. J. Remote Sens. 2019, 23, 1147–1158. [Google Scholar] [CrossRef]
  64. Kokhanovsky, A.A.; Breon, F.M. Validation of an Analytical Snow BRDF Model Using PARASOL Multi-Angular and Multispectral Observations. IEEE Geosci. Remote Sens. Lett. 2012, 9, 928–932. [Google Scholar] [CrossRef]
  65. Pokrovsky, O.; Roujean, J.L. Land surface albedo retrieval via kernel-based BRDF modeling: II. An optimal design scheme for the angular sampling. Remote Sens. Environ. 2003, 84, 120–142. [Google Scholar] [CrossRef]
  66. Liang, S.L. Narrowband to broadband conversions of land surface albedo I Algorithms. Remote Sens. Environ. 2001, 76, 213–238. [Google Scholar] [CrossRef]
  67. Van Leeuwen, W.J.; Roujean, J.-L. Land surface albedo from the synergistic use of polar (EPS) and geo-stationary (MSG) observing systems: An assessment of physical uncertainties. Remote Sens. Environ. 2002, 81, 273–289. [Google Scholar] [CrossRef]
Figure 1. Reprojection transformation of GLASS in BSA at NIR on 23 April 2000. (A) Sinusoidal projection, (B) Geographic latitude and longitude projection. Note: The spatial distributions of ground sites (colorful star) are listed in Table 1.
Remotesensing 13 04869 g001
Figure 2. Flowchart for comparison of the albedo products.
Remotesensing 13 04869 g002
Figure 3. Validity combination of MODIS, GLASS, and CGLS retrievals during 2000–2017, respectively, in red, green, and blue channels of color cube (front and back at the bottom-right) on 23 April (A), 13 August (B), 24 October (C) and 3 December (D), as well the percentage of valid pixels for each product and each date over the global land region (E). Note: the percentage of valid pixels is mapped into RGB color space (R: 0–255; G: 0–255; B: 0–255) depending on the color modulation scheme shown in the color cube, and black means no available data for the three products.
Remotesensing 13 04869 g003
Figure 4. Global mean BSA (solid lines in dark color) and WSA (solid lines in light color) at NIR (1st row), SW (2nd row), and VIS (3rd row) aggregated from MODIS (red), GLASS (green), and CGLS (blue) on 23 April (1st column), 13 August (2nd column), 24 October (3rd column) and 3 December (4th column) of the year 2000–2017, and as well as the temporal trend-lines (dashed) fitted from the linear model. Note: The slope of linear trends is labeled with the related color for each product, where the underlined numbers are WSA and the non-underlined are BSA. Bold type indicates a significance level of p < 0.05 for linear trends using the t-test.
Remotesensing 13 04869 g004
Figure 5. Combination of absolute difference of MODIS, GLASS, and CGLS to their mean value on 23 April (A), 13 August (B), 24 October (C) and 3 December (D) of 2000–2017 at BSA (left column) and WSA (right column) of NIR (1st row), SW (2nd row), and VIS (3rd row) band in panel (AD). Note, the absolute difference of MODIS, GLASS and CGLS within the dominant dynamic range (−0.08, +0.08) are respectively mapped into the RGB channel as shown in the triangle color panel. Separate figures are also given in Figure S1 of the Supplementary Materials.
Remotesensing 13 04869 g005
Figure 6. Combination of relative difference of MODIS, GLASS and CGLS to their mean value on 23 April (A), August 13 (B), 24 October (C) and 3 December (D) of 2000–2017 at BSA (left column) and WSA (right column) of NIR (1st row), SW (2nd row), and VIS (3rd row) band in panel (AD). Note, the relative difference of MODIS, GLASS and CGLS within the dominant dynamic range (−30%, +30%) are respectively mapped into the RGB channel as shown in the triangle color panel. Separate figures are also given in Figure S2 of the Supplementary Materials.
Remotesensing 13 04869 g006
Figure 7. Spatial distribution of absolute difference among BSA and WSA (left and right columns of each panel) of MODIS (red), GLASS (green) and CGLS (blue) at NIR, SW, and VIS (respectively 1st, 2nd, and 3rd row in each panel) within (grey) and out of (colored) (−0.02, 0.02) which are graded in terms of retrieval having the greatest t difference from the three products’ mean, on 23 April (panel (A)), 13 August (panel (B)), 24 October (panel (C)) and 3 December (panel (D)) of 2000–2017. Separate figures are also given in Figure S3 of the Supplementary Materials.
Remotesensing 13 04869 g007
Figure 8. Spatial distribution of relative difference among BSA and WSA (left and right columns of each panel) of MODIS (red), GLASS (green) and CGLS (blue) at NIR, SW, and VIS (respectively 1st, 2nd, and 3rd row in each panel) within (grey) and out of (colored) (−10%, 10%) that are graded in terms of the retrieval having the largest relative difference to that of three products’ mean, on 23 April (panel (A)), 13 August (panel (B)), 24 October (panel (C)) and 3 December (panel (D)) of 2000–2017. Separate figures are also given in Figure S4 of the Supplementary Materials.
Remotesensing 13 04869 g008
Figure 9. Comparison of the blue-sky albedo between ground measurements (round point) and retrievals by MODIS (yellow), GLASS (green) in high- (empty square) or acceptable- (solid square) quality and CGLS (blue) in high quality (empty square) or out of range or invalid (solid square) at typical albedo validation stations US-BON (A), US-DRA (B), US-FPK (C), US-GWN (D), US-PSU (E), US-TBL (F), US-SXF (G), US-BRW (H), US-BAO (I). Ground (cloud) and Ground (clear) respectively indicate cloudy or clear condition of each individual ground observation.
Remotesensing 13 04869 g009
Table 1. Information on the selected ground sites.
Station NameLatitude (°)Longitude (°)NetworkTower
Height (m)
Land Classification (IGBP)
Bondville (US-BON)40.052−88.373SURFRAD10Croplands
Desert Rock (US-DRA)36.624−116.019SURFRAD10 Open Shrublands
Fort Peck (US-FPK)48.308−105.102SURFRAD10 Grasslands
Goodwin Creek (US-GWN)34.255−89.873SURFRAD10Deciduous Broadleaf
Penn State (US-PSU)40.720−77.931SURFRAD10 Deciduous Broadleaf
Table Mountain (US-TBL)40.125−105.237SURFRAD10 Bare soil and Rocks
Sioux Falls (US-SXF)43.730−96.620SURFRAD10 Croplands
Barrow (US-BRW)71.323−156.607BSRN4 Snow and Ice
Boulder (US-BAO)40.050−105.004BSRN300 Cropland Mosaics
Table 2. Comparison between albedo products and ground measurements during available clear days.
Result
Station Name
MODISGLASSCGLS
RMSE Mean ErrorRMSEMean ErrorRMSEMean Error
Bondville (US-BON)0.077−0.0480.074−0.0540.069−0.04
Desert Rock (US-DRA)0.024−0.0220.021−0.0190.0170.002
Fort Peck (US-FPK)0.046−0.0180.044−0.0170.0950.001
Goodwin Creek (US-GWN)0.048−0.0450.05−0.0460.037−0.032
Penn State (US-PSU)0.072−0.0650.057−0.0510.034−0.027
Table Mountain (US-TBL)0.0320.0230.0370.0220.118−0.002
Sioux Falls (US-SXF)0.0440.0030.054−0.0030.0450.013
Barrow (US-BRW)0.056−0.0320.073−0.06--
Boulder (US-BAO) 0.0330.0160.09−0.0020.123−0.005
All sites0.047−0.0180.055−0.020.075−0.009
Publisher’s Note: MDPI stays neutral with regard to jurisdictional claims in published maps and institutional affiliations.