Abstract
Irregularities in the spatial distribution of ionospheric electron density introduce temporal fluctuations in the intensity and phase of radio signals received from Global Navigation Satellite Systems (GNSS). The impact of phase fluctuations originating from irregularities in the auroral and polar ionospheres on GPS positioning was investigated on three days in March 2018 in the presence of quiet-to-moderately disturbed magnetic conditions by combining measurements from GPS and EISCAT UHF/ESR incoherent scatter radars. Two different positioning solutions were analysed: broadcast kinematic (BK) and precise static (PS). The results show that the propagation through irregularities induced residual errors on the observables leading to an increase in the positioning error, in its variability, and in the occurrence of gaps. An important aspect emerging from this study is that the variability of the 3-D positioning error was reduced, and the presence of gaps disappeared when the positioning solutions were evaluated at a 1 s rate rather than at a 30 s rate. This is due to the transient nature of residual errors that are more significant over 30 s time intervals in the presence of irregularities with scale size between few kilometres in the E region to few tens of kilometres in the F region.
1. Introduction
Our modern society increasingly relies on continuous and reliable GNSS positioning, navigation, and timing, from surveying to safety-critical applications such as autonomous navigation [1,2,3]. However, irregularities in the ionospheric electron density distribution can induce disturbances in the GNSS signals which propagate. These disturbances take the form of temporal fluctuations in the intensity and phase of received GNSS radio signals and cause higher-order errors that cannot be eliminated through the dual-frequency combination of observables [4] or through standard global/regional models. These higher-order residual errors on dual-frequency combinations introduced by ionospheric irregularities along GNSS ray paths lead to an increase in the magnitude and variability of the positioning error [4].
The size of ionospheric irregularities varies between larger and smaller spatial scales due to the action of plasma instability mechanisms in the equatorial, mid-latitude, and high-latitude ionosphere [5]. In the case of GNSS signals, propagation through large-scale ionospheric irregularities induces phase fluctuations over longer temporal intervals, whereas the propagation through small-scale irregularities leads to scintillation (i.e., fluctuations over shorter temporal intervals) in the intensity and phase of the received GNSS signals as a consequence of a scattering process. Phase fluctuations originating from the propagation through larger-scale ionospheric irregularities are typically quantifiable through the rate of change of the slant Total Electron Content (TEC) [6] (i.e., temporal fluctuations in Slant TEC). On the other hand, intensity and phase scintillation arising from propagation through small-scale ionospheric irregularities is quantified by means of the scintillation indices and , respectively [7,8,9,10].
In the equatorial ionosphere, GNSS signals experience both TEC fluctuations and scintillation as they propagate through large-to-small scale field-aligned irregularities that form in conjunction with plasma bubbles and plumes of ionisation. The occurrence of large-to-small scale field-aligned irregularities in the equatorial ionosphere maximises the post-sunset sector and increases with solar activity [7,11,12,13,14].
In the auroral and polar ionospheres, phase fluctuations originate from large-scale field-aligned irregularities forming during particle precipitation, whilst in the polar ionosphere phase fluctuations also arise from polar patches drifting across GNSS ray paths [9,10,15,16,17,18,19,20]. The occurrence of large-scale field-aligned irregularities in the auroral and polar ionospheres increases during disturbed magnetic conditions, for example, in the presence of magnetic storms and substorms [10,21,22,23,24]. In the presence of enhancements in temporal TEC fluctuations and scintillation, higher-order error terms in the observables induce an increase in positioning errors and in the occurrence of outages [4,8,23].
In the case of the positioning required for high-accuracy applications, errors in the observables need to be modelled to higher orders [1,4,25]: the positioning algorithms (e.g., precise point positioning) are equipped with various models for the correction of these errors, which introduces high levels of complexity. In general, the complexity of the positioning algorithms increases as the models attempt to correct for higher-order error terms in order to achieve higher accuracy in the positioning solution [1,4]. In the case of errors induced by ionospheric irregularities through enhancements in TEC fluctuations and scintillation, several approaches are possible for the improvement of the positioning solution through the modelling of higher-order error terms. However, these models typically require external information (e.g., knowledge of scintillation indices, network PPP corrections), operate in post-processing (e.g., refinement of the precise point positioning), and assume a linear behaviour in the receiver (e.g., by modelling stand-alone variances) [2,22,23,24,26,27]. The net result is that the positioning algorithms depend upon a large number of inputs, their complexity increases significantly, and their effects are limited by the validity of the assumptions utilised.
Here, the origin of the increase in positioning errors and in the occurrence of outages in the presence of field-aligned irregularities in the auroral and polar ionosphere was investigated by taking advantage of an EISCAT UHF (European Incoherent SCATter Ultra High Frequency radar) and ESR (EISCAT Svalbard Radar) experiment that sampled the volume where GPS ray paths propagated. The experiment was conducted during quiet-to-moderate magnetic conditions in March 2018 and two different positioning solutions were considered: (a) a single-point single-epoch positioning with dual-frequency L1 and L2 carrier phases and pseudoranges, and with broadcast ephemeris (labelled as Broadcast Kinematic, BK) and (b) a single-point single-epoch with dual-frequency L1 and L2 carrier phases and pseudoranges, and with precise ephemeris (labelled as Precise Static, PS). The former is typical of real-time applications, whilst the latter is equivalent to post-processing Precise Point Positioning. Only the GPS constellation was considered in the positioning solutions. In order to understand the type of errors induced by irregularities in the auroral and polar ionospheres, EISCAT UHF/ESR electron density profiles were compared with the 3-D positioning error estimated both at 30 s and 1 s rates. This study addressed the following questions: (1) what are the irregularities in the auroral and polar ionospheres that determine higher variability and gaps in the positioning solution? (2) whether a shorter sampling interval can mitigate against higher variability and outages in the positioning solutions.
2. Materials and Methods
An experiment with EISCAT UHF/ESR incoherent scatter radars was conducted during March 2018 and it was aimed at characterising ionospheric irregularities occurring in the auroral and polar ionospheres. EISCAT UHF/ESR beams sampled the ionospheric volume where GPS ray paths propagated: the radars’ beams were directed along lines typically transverse to GPS ray paths. The EISCAT UHF/ESR beams aimed at different shell heights (i.e., 120, 250, and 350 km) alternately, by taking into account GPS ray paths propagating to a given GPS ground station. In the case of EISCAT, GPS ray paths to the International GNSS Service (IGS) station in Kiruna were considered; in the case of ESR, GPS ray paths to the IGS station in Ny-Ålesund were considered (more details are illustrated in a companion paper, indicated here as [20]). The alternance of the beam directions over time together with a 60 s integration time [15,16] necessary to calculate electron density profiles imply that EISCAT UHF/ESR beams were sampling the ionospheric volume traversed by GPS ray paths sparsely in space and time. The sparsity of the electron density profiles implies a limitation in the resolution of the spatial and temporal variability of the irregularities detected: this limitation is expected to be overcome with EISCAT_3D.
The increase in positioning errors and in the occurrence of outages were interpreted in view of the electron density profiles measured through EISCAT UHF/ESR as well as of the phase fluctuations occurring on GPS signals.
The phase fluctuations occurring in GPS signals propagating through the volume sampled by EISCAT UHF/ESR beams were quantified by means of temporal fluctuations in the uncalibrated Slant TEC [6]. The uncalibrated slant TEC was estimated for each Pseudorandom Noise (PRN) of relevance by utilising RINEX files containing observables at 30 s and at 1 s sampling intervals. RINEX Navigation files containing standard satellite information and RINEX observations files containing 1 s (after downloading, 15-min individual files were concatenated to ensure continuity in the estimates) and 30 s (single 24-h file) observables were obtained by using the software RTKLIB (RTKGET, http://www.rtklib.com/) which downloaded the files from the Crustal Dynamics Data Information System (CDDIS, https://cddis.nasa.gov/) repository.
From RINEX observation files, the uncalibrated slant TEC was estimated from 1 s as well as 30 s observables as:
where is time, and are carrier phases in cycles corresponding to frequencies and in (, , and fundamental frequency ), and are the wavelengths in m. TEC is given in () [28,29,30]. Equation (1) states that the geometry-free combination for carrier phases is proportional to the uncalibrated TEC due to the presence of additional biases and errors which are typically assumed to be constant or to vary slowly with time. For the purposes of this study, the temporal variation in the uncalibrated TEC was utilised to quantify fluctuations on the carrier phases in the presence of irregularities given its proportionality to the geometry-free combination which has relevance for the positioning solutions. Therefore, temporal TEC fluctuations (or rate of change) () for each PRN and at each epoch were estimated as:
where is the uncalibrated slant TEC at epoch k, is TEC at epoch , and is the change in time [15,31,32]. Here, can be 1 s or 30 s. TEC fluctuations were calculated for different ionospheric conditions in conjunction with EISCAT UHF/ESR measurements. In view of Equations (1) and (2), an enhancement in temporal TEC fluctuations indicates the presence of residual errors in the carrier phases that are not fully removed through dual-frequency combinations, thus typically leading to an increase in positioning errors [4].
The BK and PS positioning solutions were calculated at 1 s and at 30 s rates by means of the software gLAB, available on-line at https://gage.upc.es/gLAB/ [33,34]. In each of the days during EISCAT UHF/ESR measurements BK and PS solutions were calculated for the IGS ground stations in Kiruna (KIRU, in relation to EISCAT electron density profiles) and Ny-Ålesund (NYA1, in relation to ESR electron density profiles). The software gLAB utilised GPS carrier phases (L1 and L2) and pseudoranges (P1 and P2) for the calculation of the BK and PS positioning estimates [34].
The Antenna Exchange Format (ANTEX) files, which provide information on the antenna phase centre of the GNSS satellites and of the ground stations, were obtained from standard repositories through gLAB (tp://ftp.igs.org/pub/station/general/pcv_archive/).
In the case of the BK solution, the orbit and clock data were obtained from the RINEX Navigation files, whereas in the case of the PS solution the orbit and clock data were obtained from Standard Product (SP3) files and Clock (CLK) files (ftp://cddis.gsfc.nasa.gov/pub/gps/products) [35].
The BK solution was considered because of its relevance to real-time applications (e.g., autonomous navigation, civil aviation, precision agriculture), whereas the PS solution was considered because of its relevance to post-processing applications (e.g., geodesy, surveying) [36,37,38].
The performance of the positioning solutions during the EISCAT UHF/ESR experiment was investigated on the basis of the instantaneous 3-D positioning error . The instantaneous 3-D positioning error was calculated as [39,40,41]:
where , , and are the ground stations coordinates in the Earth-centred Earth-fixed (ECEF) reference frame at each epoch and , , and are the receiver a-priori ECEF coordinates contained in the RINEX observation files [39,40,41,42].
, , and and, consequently, the 3-D positioning error were calculated at 1 s and at 30 s sampling intervals for both the BK and the PS solutions. was then compared with TEC fluctuations at 1 s and 30 s intervals respectively, in correspondence to the electron density structures detected through EISCAT UHF/ESR.
The temporal fluctuations in TEC, , were considered for all PRNs with elevation angle above 5° for consistency with the positioning solutions which were based on the same elevation mask angle for minimisation of Dilution of Precision (DOP) [34].
The software gLAB utilised both the geometry-free combination and the Melbourne-Wübbena combination [43,44,45] to detect cycle slips and data gaps [33,34,46,47]. If enhancements in temporal TEC fluctuations corresponded to an increase in cycle slips and data gaps, then higher-order residual errors were to become dominant in the carrier phases and, hence, on their combination.
3. Results
Figure 1 shows the positioning results in conjunction with the EISCAT measurements carried out on 12 March 2018. Figure 1a shows the results in the case of 30 s observables (i.e., calculated every 30 s), whilst Figure 1b shows the results in the case of 1 s observables (i.e., calculated every 1 s). Figure 1c shows the directions of EISCAT beams in terms of azimuth and elevation angles from the EISCAT UHF antenna’s position in Tromsø.
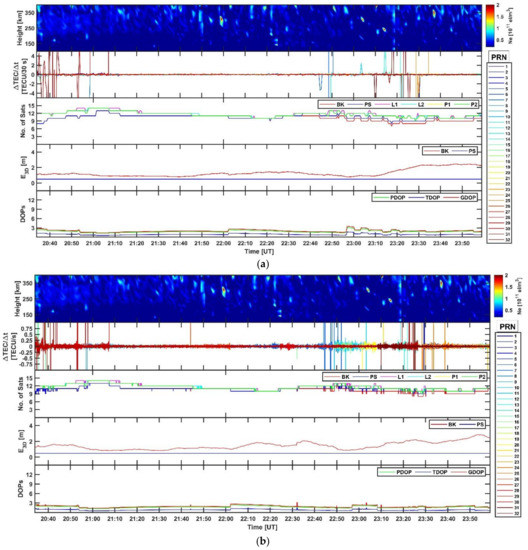
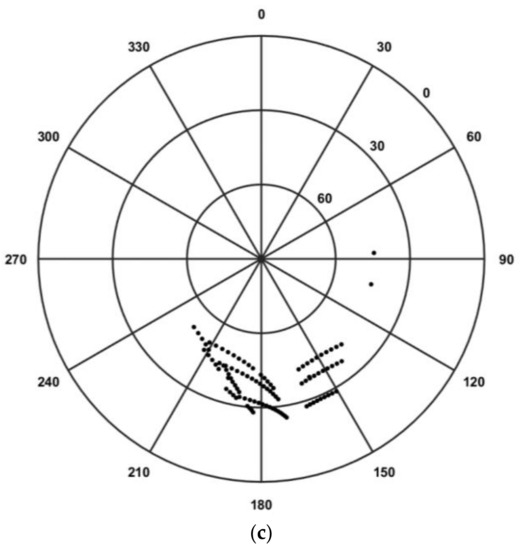
Figure 1.
EISCAT electron density profiles, TEC fluctuations and positioning errors for the ground station KIRU (Kiruna) between 20:00 and 24:00 UT on 12 March 2018. (a) From top to bottom: EISCAT electron density profiles; 30 s temporal TEC fluctuations for all the PRNs in view with elevation angle above 5°; number of available observables (L1, L2, P1, and P2) from all the PRNs in view together with the number of PRNs considered in the BK solution (red line) and in the PS solution (blue line); 30 s 3-D positioning error
for the BK solution (red line) and for the PS solution (blue line); and 30 s DOPs. (b) Same as (a) but for 1 s TEC fluctuations and positioning solutions (the electron density profiles are repeated to facilitate the comparison). In (a,b) the TEC fluctuations from different PRNs are plotted with different colours according to the PRN legend on the right-hand side. (c) Azimuth and elevation angles of the EISCAT beams (from Tromsø).
Figure 1a,b show (from top to bottom) electron density profiles, TEC fluctuations, number of available observables from all PRNs in view together with the number of PRNs considered within the positioning solutions, the 3-D positioning error and the dilutions of precision. In Figure 1a,b the electron density profiles are repeated in the top panels to facilitate the comparison.
The magnetic conditions on 12 March 2018 were very quiet with (https://www.swpc.noaa.gov/products/planetary-k-index) and with no significant structures detected by EISCAT in the auroral ionosphere. Almost all the available PRNs were considered in the positioning solutions with only a very few of them showing larger residual errors, leading to low values and low variability in both positioning solutions. In this case, enhancements in TEC fluctuations occurred in a few isolated instances and did not produce any impact on the positioning solutions: did not show any significant increase and there were no gaps in the solutions. Furthermore, no significant difference between the 30 s and the 1 s positioning solutions could be noticed. The measurements on 12 March 2018, (Figure 1) can be considered as a quiet reference case study which more active case studies (15 and 16 March 2018, ) can be compared with.
Figure 2 shows same quantities as in Figure 1 but for EISCAT measurements collected during 15 March 2018. In this case, more active magnetic conditions () favoured inhomogeneous and intermittent particle precipitation in the auroral oval which originated ionisation irregularities and, consequently, enhancements in temporal TEC fluctuations visible over 30 s and 1 s intervals (more details are provided in [20]). In the case of the 30 s positioning solutions, fewer PRNs were utilised for the positioning solutions in correspondence of enhancements in TEC fluctuations. This fact resulted in increases of and of its variability accompanied by gaps in the 30 s BK solution. In the case of the 30 s PS solution, maintained lower values with low variability but showed an increase in the presence of gaps similarly to the 30 s BK solution. Gaps in both the 30 s PS and BK solutions occurred when the number of PRNs usable in the positioning solutions became less than 4 (https://gage.upc.edu/sites/default/files/gLAB/gLAB_SUM.pdf). On the contrary, showed low variability in the case of the 1 s BK solution and no gaps occurred on both BK and PS solutions at 1 s despite enhancements in 1 s TEC fluctuations occurred in correspondence of irregularities detected through EISCAT.
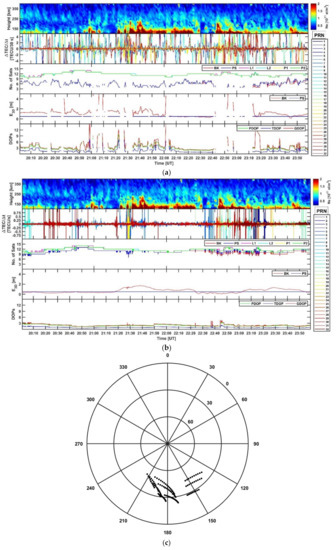
Figure 2.
EISCAT electron density profiles, TEC fluctuations and positioning errors for the ground station KIRU (Kiruna) between 20:00 and 24:00 UT on 15 March 2018. (a) From top to bottom: EISCAT electron density profiles; 30 s temporal TEC fluctuations for all the PRNs in view with elevation angle above 5°; number of available observables (L1, L2, P1, and P2) from all the PRNs in view together with the number of PRNs considered in the BK solution (red line) and in the PS solution (blue line); 30 s 3-D positioning error
for the BK solution (red line) and for the PS solution (blue line); and 30 s DOPs. (b) Same as (a) but for 1 s TEC fluctuations and positioning solutions (the electron density profiles are repeated to facilitate the comparison). In (a,b) the TEC fluctuations from different PRNs are plotted with different colours according to the PRN legend on the right-hand side. (c) Azimuth and elevation angles of the EISCAT beams (from Tromsø).
Figure 3 shows same quantities as in Figure 1 and Figure 2 but for ESR measurements collected on 16 March 2018 (). ESR beams executed some north-south scans between 20:30–21:00 UT and 23:00–24:00 UT because of mechanical constraints in the radar’s antenna which led to the points in the azimuth/elevation plot being scattered over larger areas [20]. Enhancements in TEC fluctuations occurred between 21:20 and 21:40 UT in correspondence of a fast-moving plasma patch and between 21:00–21:10, 21:40–22:00 UT, and 23:00–23:20 UT in correspondence of particle precipitation [20], during which the 30 s BK showed larger values with larger variability together with gaps whereas only gaps were noticeable in the 30 s PS .
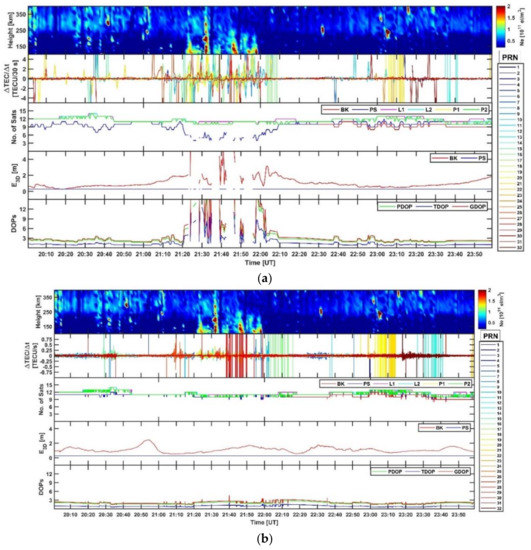
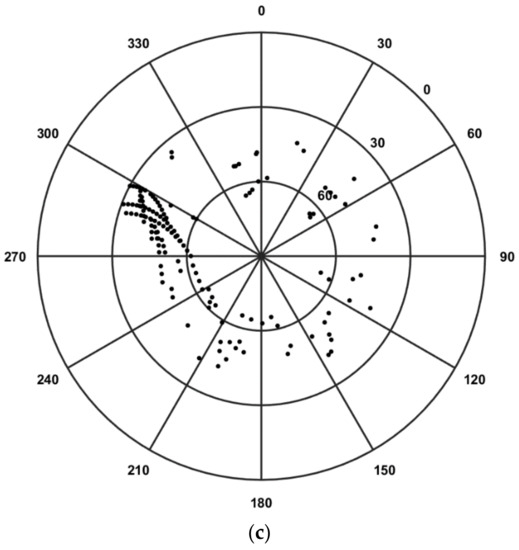
Figure 3.
ESR electron density profiles, TEC fluctuations and positioning errors for the ground station NYA1 (Ny-Ålesund) between 20:00 and 24:00 UT on 16 March 2018. (a) From top to bottom: ESR electron density profiles; 30 s temporal TEC fluctuations for all the PRNs in view with elevation angle above 5°; number of available observables (L1, L2, P1, and P2) from all the PRNs in view together with the number of PRNs considered in the BK solution (red line) and in the PS solution (blue line); 30 s 3-D positioning error
for the BK solution (red line) and for the PS solution (blue line); and 30 s DOPs. (b) Same as (a) but for 1 s TEC fluctuations and positioning solutions (the electron density profiles are repeated to facilitate the comparison). In (a,b) the TEC fluctuations from different PRNs are plotted with different colours according to the PRN legend on the right-hand side. (c) Azimuth and elevation angles of the ESR beams (from Longyearbyen).
The 1 s BK showed lower variability than the 30 s BK and no gaps were noticeable in both BK and PS positioning solutions calculated at 1 s intervals.
4. Discussion
In the presence of enhancements in temporal TEC fluctuations originating from irregularities forming between the E and F regions in the auroral and polar ionospheres, the positioning solutions calculated at 30 s and at 1 s intervals showed different behaviours. In general, the 1 s positioning solutions tended to be characterised by a lower 3-D positioning error with lower variability and by the absence of gaps. On the other hand, the 30 s BK positioning solution typically showed higher variability in and gaps, whereas the 30 s PS solution showed lower values and lower variability for although with the presence of gaps.
Therefore, the two questions that arise here are: (1) what type of irregularities determines higher variability and gaps in the positioning solutions; (2) whether a higher sampling rate for the observables can produce any mitigation against higher variability and outages in the positioning solutions.
In order to investigate the first question, the link between electron density irregularities detected through EISCAT UHF/ESR, temporal TEC fluctuations, and positioning solutions was explored in detail. In this analysis, gLAB utilised by default both carrier phases (L1 and L2) and pseudoranges (P1 and P2) to compute BK and PS positioning solutions. For both PS and BK solutions, gLAB used both Melbourne-Wübbena (geometry-free and ionosphere-free) and geometry-free (dependent upon the ionosphere) combinations to detect cycle slips (https://gage.upc.edu/sites/default/files/gLAB/gLAB_SUM.pdf).
From the results, it emerges that whenever 30 s TEC fluctuations enhanced simultaneously on various PRNs, the dilutions of precision (DOPs) and the 3-D positioning error increased their values and variabilities in the case of the 30 s BK solution; gaps occurred on both the 30 s BK and PS solutions due to the decrease in the number of available satellites (dropping below 4) with carrier phases and pseudoranges suitable for the positioning algorithm. On the contrary, enhancements in 1 s TEC fluctuations occurred on fewer PRNs and with lower magnitude over shorter time intervals in comparison with 30 s observables; the values and variabilities of DOPs and of were lower, and no gaps occurred on the 1 s BK and PS solutions. Therefore, the identification of those irregularities in the auroral and polar ionosphere introducing these effects on positioning can be researched through the evaluation of enhancements in TEC fluctuations in correspondence of structures detected through EISCAT UHF/ESR.
GPS ray paths were propagating through irregularities forming as a consequence of particle precipitation in the auroral ionosphere between 21:20–22:30 UT and 22:40–24:00 UT on 15 March 2018 (Figure 2) and in the polar ionosphere between 21:00–21:10, 21:40–22:00 UT, and 23:00–23:20 UT on 16 March 2018 (Figure 3); irregularities also formed in conjunction with a fast-moving patch in the polar ionosphere between 21:20–21:40 UT on 16 March 2018 (Figure 3) [20]. In general, enhancements in 1 s TEC fluctuations showed lower values over shorter time intervals in comparison with 30 s TEC fluctuations. EISCAT UHF/ESR electron density profiles indicate that enhancements in TEC fluctuations occurred in correspondence of irregularities forming between the E and F regions following particle precipitation in the auroral and polar ionospheres (Figure 2 and Figure 3) as well as a fast-moving patch in the polar ionosphere (Figure 3) [20].
It is plausible to assume that the irregularities traversed by GPS ray paths must have had a larger scale size such that the changes in TEC over 1 s intervals were smaller as compared to larger changes over 30 s intervals. This is supported by the fact that the resolution in range of EISCAT UHF/ESR changes between few kilometres in the E region and tens of kilometres in the F region [15,16,20].
The spatial scales over which the TEC changes took place are illustrated in Figure 4, Figure 5 and Figure 6: distances between consecutive pierce points every 30 s (based on 30 s navigation files) and every 1 s (based on interpolated 1 s navigation files) for GPS ray paths above 5° elevation angle were calculated at 110 km (E region) and 300 km (F region) shell heights. TEC fluctuations from Figure 1, Figure 2 and Figure 3 are repeated in Figure 4, Figure 5 and Figure 6 to facilitate the comparison.
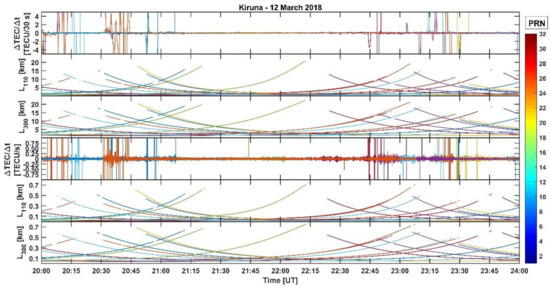
Figure 4.
From top to bottom: 30 s TEC fluctuations for GPS PRNs ray paths above 5° elevation from Kiruna; distances between their consecutive pierce points at 110 km shell height (E region) and 300 km shell height (F region) every 30 s ( and
at 30 s, respectively); 1 s TEC fluctuations and pierce points distances every 1 s ( and
at 1 s). The calculations are for the time interval between 20:00 and 24:00 UT during 12 March 2018. TEC fluctuations and distances corresponding to different PRNs are plotted with different colours according to the PRN legend on the right-hand side.
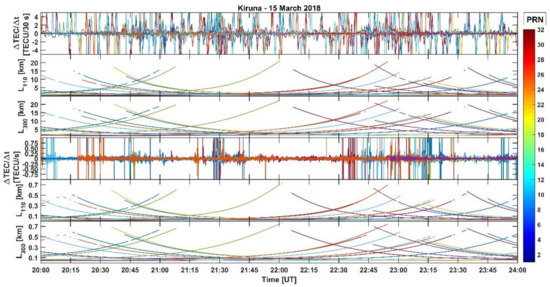
Figure 5.
From top to bottom: 30 s TEC fluctuations for GPS PRNs ray paths above 5° elevation from Kiruna; distances between their consecutive pierce points at 110 km shell height (E region) and 300 km shell height (F region) every 30 s ( and
at 30 s, respectively); 1 s TEC fluctuations and pierce points distances every 1 s ( and
at 1 s). The calculations are for the time interval between 20:00 and 24:00 UT during 15 March 2018. TEC fluctuations and distances corresponding to different PRNs are plotted with different colours according to the PRN legend on the right-hand side.
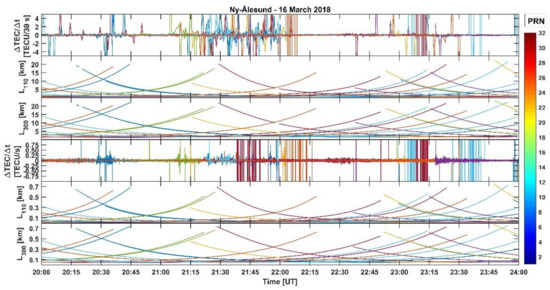
Figure 6.
From top to bottom: 30 s TEC fluctuations for GPS PRNs ray paths above 5° elevation from Ny-Ålesund; distances between their consecutive pierce points at 110 km shell height (E region) and 300 km shell height (F region) every 30 s ( and
at 30 s, respectively); 1 s TEC fluctuations and pierce points distances every 1 s ( and
at 1 s). The calculations are for the time interval between 20:00 and 24:00 UT during 16 March 2018. TEC fluctuations and distances corresponding to different PRNs are plotted with different colours according to the PRN legend on the right-hand side.
In the case of a quiet () and benign ionosphere (12 March 2018) only few PRNs experienced isolated enhancements in TEC fluctuations at lower elevation angles (Figure 4). During more active () auroral conditions (15 March 2018, Figure 5), more PRNs experienced enhancements in TEC fluctuations over 30 s than over 1 s at all elevation angles. Similarly, in the polar ionosphere enhancements in TEC fluctuations were experienced by more PRNs over 30 s than over 1 s at various elevation angles due to particle precipitation as well as to the transit of a polar patch (16 March 2018, Figure 6). On average, 30 s TEC changes took place over distances approximately between 1–20 km and between the E and F regions, respectively (Figure 5 and Figure 6). The TEC changes over 1 s intervals occurred over distances smaller than approximately 1 km between the E and F regions. Therefore, the observations at 1 s rate originated from areas with smaller differences in TEC; on the other hand, observations at 30 s originated from areas with larger differences in TEC. That is, if the irregularities had scale sizes larger than 1 km it is likely to expect smaller changes in TEC over 1 s intervals and larger changes over 30 s intervals. As indicated by the EISCAT UHF/ESR electron density profiles (Figure 2 and Figure 3), the sharpest changes in TEC over 30 s intervals corresponding to gaps in the positioning solutions were induced by irregularities forming between the E and F regions in both the auroral and polar ionospheres.
Hence, it can be deduced that irregularities introducing outages in the 30 s positioning solutions: (a) had an individual scale size ranging from approximately few kilometres in the E region to few tens of kilometres in the F region, (b) were forming between the E and the F regions, (c) were occurring over spatial distances between 400 km in the E region and 800 km in the F region (these facts are demonstrated in [20]), (d) their intersections with GPS ray paths had separation distances of few kilometres in the E region and few tens of kilometres in the F region.
In order to investigate the second question about any advantage offered by a higher sampling rate, the origin of gaps in the positioning solutions was investigated through Figure 7, Figure 8, Figure 9, Figure 10, Figure 11, Figure 12 and Figure 13. Figure 7, Figure 8, Figure 9 and Figure 10 show the number of satellites in view together with the number of satellites excluded from a given positioning solution (both at 30 s and at 1 s intervals) due to specific reasons (different line colours and styles in Figure 7, Figure 8 and Figure 9). The specific reasons for the exclusion of a PRN from the positioning solution were obtained from the PRINT SATSEL message output from gLAB (https://gage.upc.edu/sites/default/files/gLAB/gLAB_SUM.pdf). Possible specific reasons for the exclusion of a PRN include: the arc being too short, the occurrence of a cycle slip, an outlier in the geometry-free () combination, an outlier in the Melbourne-Wübbena () combination, elevation angles lower than 5°. These specific reasons appeared to be the most recurrent in the case studies analysed here although other reasons are in principle recognised by gLAB (https://gage.upc.edu/sites/default/files/gLAB/gLAB_SUM.pdf). In Figure 7, Figure 8 and Figure 9, Figure 11, Figure 12 and Figure 13 the number of satellites excluded is essentially the same in the BK and PS solutions because the two solutions utilised the same cycle-slip detectors (https://gage.upc.edu/sites/default/files/gLAB/gLAB_SUM.pdf) [34].
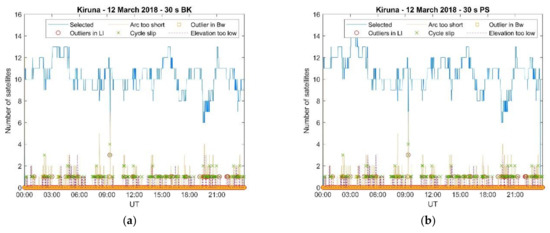
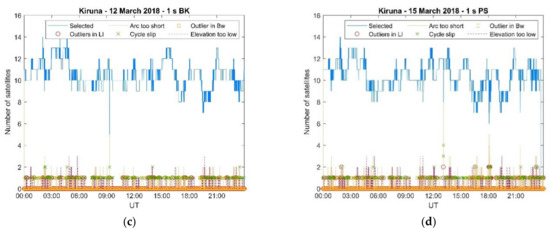
Figure 7.
The number of satellites utilised in the positioning solutions and the number of those excluded (due to specific reasons) in the case of Kiruna 12 March 2018. (a) Kiruna 12 March 2018, 30 s BK; (b) Kiruna 12 March 2018, 30 s PS; (c) Kiruna 12 March 2018, 1 s BK; and (d) Kiruna 12 March 2018, 1 s PS.
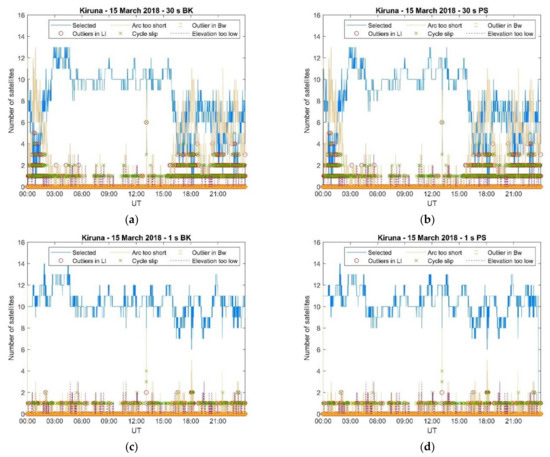
Figure 8.
The number of satellites utilised in the positioning solutions and the number of those excluded (due to specific reasons) in the case of Kiruna 15 March 2018. (a) Kiruna 15 March 2018, 30 s BK; (b) Kiruna 15 March 2018, 30 s PS; (c) Kiruna 15 March 2018, 1 s BK; and (d) Kiruna 15 March 2018, 1 s PS.
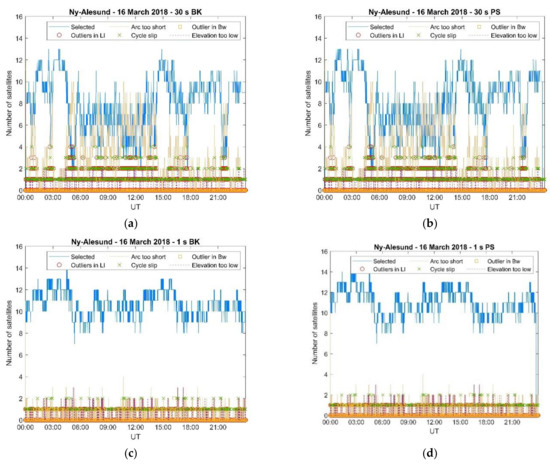
Figure 9.
The number of satellites utilised in the positioning solutions and the number of those excluded (due to specific reasons) in the case of Ny-Ålesund 16 March 2018. (a) Ny-Ålesund 16 March 2018, 30 s BK; (b) Ny-Ålesund 16 March 2018, 30 s PS; (c) Ny-Ålesund 16 March 2018, 1 s BK; and (d) Ny-Ålesund 16 March 2018, 1 s PS.
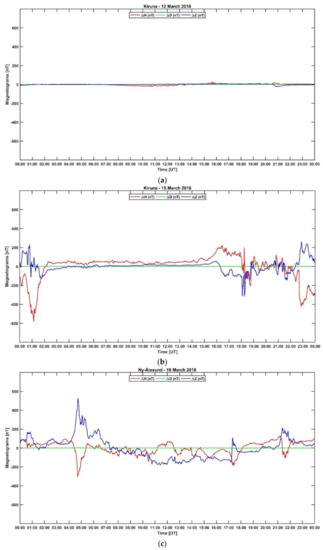
Figure 10.
Variations in the HDZ local geomagnetic field components (—red colour, —green colour, and —blue colour, in nT) between 00:00 and 24:00 UT from IMAGE stations located at (a) Kiruna (KIR) on 12 March 2018, (b) Kiruna (KIR) on 15 March 2018, and (c) Ny-Ålesund (NAL) on 16 March 2018 (https://space.fmi.fi/image/www/?page=user_defined).
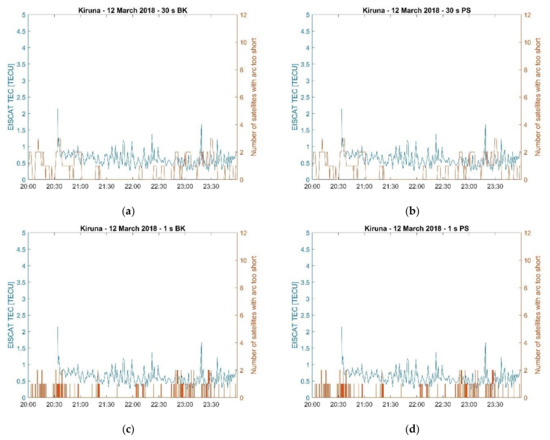
Figure 11.
Comparison between EISCAT VTEC and the number of satellites excluded from the positioning solutions in the case of Kiruna on 12 March 2018. (a) Kiruna 12 March 2018, 30 s BK; (b) Kiruna 12 March 2018, 30 s PS; (c) Kiruna 12 March 2018, 1 s BK; and (d) Kiruna 12 March 2018, 1 s PS.
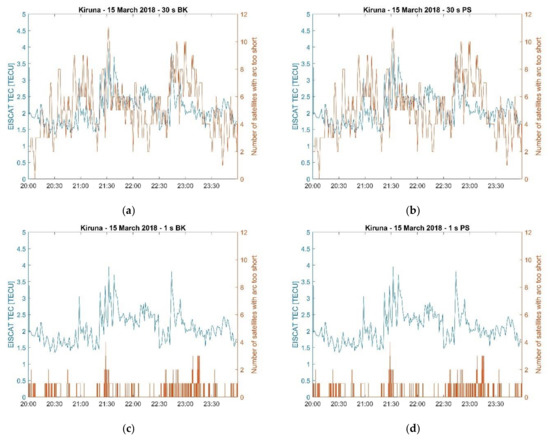
Figure 12.
Comparison between EISCAT VTEC and the number of satellites excluded from the positioning solutions in the case of Kiruna on 15 March 2018. (a) Kiruna 15 March 2018, 30 s BK; (b) Kiruna 15 March 2018, 30 s PS; (c) Kiruna 15 March 2018, 1 s BK; and (d) Kiruna 15 March 2018, 1 s PS.
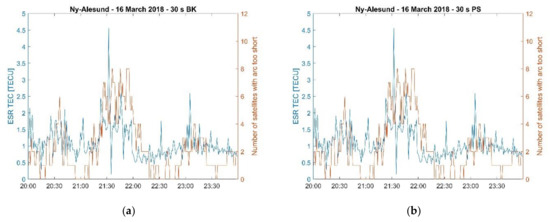
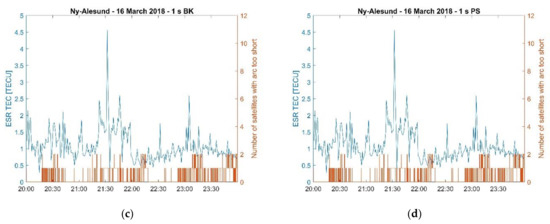
Figure 13.
Comparison between ESR VTEC and the number of satellites excluded from the positioning solutions in the case of Ny-Ålesund on 16 March 2018. (a) Ny-Ålesund 16 March 2018, 30 s BK; (b) Ny-Ålesund 16 March 2018, 30 s PS; (c) Ny-Ålesund 16 March 2018, 1 s BK; and (d) Ny-Ålesund 16 March 2018, 1 s PS.
Figure 7, Figure 8 and Figure 9 illustrates how the number of satellites utilised in the positioning solutions varied between 00:00 and 24:00 UT on 12 March 2018 (Kiruna), 15 March 2018 (Kiruna) and 16 March 2018 (Ny-Ålesund), respectively. The number of satellites utilised in the 30 s positioning solution decreased in the more active days in the auroral and polar ionospheres because of a combination of aspects, i.e., arc too short, occurrence of a cycle slip, outliers in the geometry-free () combination, outliers in the Melbourne–Wübbena () combination. Occasionally, PRNs were excluded because of an elevation angle lower than 5° although this aspect seemed to be independent of geomagnetic conditions and related to the orbits. On the contrary, the number of satellites utilised in the 1 s positioning solutions remained stable throughout the days considered here.
The inspection of the magnetograms recorded in Kiruna on 12 March 2018 and 15 March 2018, and in Ny-Ålesund on 16 March 2018 (Figure 10) reveals how sensitive the 30 s positioning solutions were to magnetic conditions: the decrease in the number of satellites utilised closely matched the perturbations in the geomagnetic field.
During the EISCAT UHF/ESR measurements (20:00–24:00 UT) such a decrease in the number of satellites utilised in the positioning solutions occurred in correspondence of irregularities forming due to particle precipitation and a polar plasma patch which were detected on the electron density profiles. This aspect is further illustrated through Figure 11, Figure 12 and Figure 13 which show the variation of the radars’ Vertical Total Electron Content (VTEC) estimated by integrating the EISCAT UHF/ESR electron density profiles with height between 100 km and 400 km of altitude [20]. Figure 11, Figure 12 and Figure 13 show that the number of satellites excluded from the 30 s positioning solutions increased when the radar’s VTEC showed higher values and higher variability in correspondence of irregularities forming between the E and the F regions. Here, the number of satellites with too short an arc represents the cumulative number of satellites excluded for individual specific reasons (as shown in Figure 7, Figure 8 and Figure 9). On the contrary, the 1 s positioning solutions were not affected as the number of satellites utilised remained almost constant in the presence of those irregularities.
The geometry-free combination is given by the combination of L1 and L2 carrier phases and it can be written as [48]:
where and are the carrier phases in cycles corresponding to the carrier frequencies and in ; and are the wavelengths in m; the slant TEC is given in TECU. The terms and contain biases and errors, and are given by:
where , describes receiver and satellite instrumental biases, describes the ambiguity in the carrier phases, describes the phase wind-up, describes errors due to multipath, and describes errors due to receiver noise [44].
In the Melbourne-Wübbena combination () [43,44,45] carrier phases and codes measurements are combined through the wide-lane () and narrow-lane () combinations [49,50]. It can be shown that the Melbourne-Wübbena combination is given by:
where the wide-lane combination for the carrier phases is given by:
and the narrow-lane combination for the code pseudoranges is given by:
with and the pseudoranges (in units of m) estimated from the code at the carrier frequencies and .
In Equation (6), it can be shown that:
where describes receiver and satellite instrumental biases, describes errors due to multipath, and describes errors due to the receiver noise [49].
Residual errors in the presence of ionospheric irregularities during active geomagnetic conditions () must arise from the error terms described through Equations (4)–(9). A close inspection of Equations (5)–(9) indicates that the receiver and satellite instrumental biases together are not expected to vary with geomagnetic conditions and can be considered constant over the short-term measurement epochs of relevance. Errors due to ground multipath could, in principle, have an effect since all PRNs with elevation angles higher than 5° were considered: however, ground multipath cannot justify the results presented here as it depends upon the orbits and does not vary with geomagnetic conditions. Necessarily, the error terms that can be affected by a degradation in the geomagnetic conditions are the terms referring to the ambiguities, to the phase wind-up, and to the receiver noise. The presence of irregularities (as indicated by enhancements in GPS TEC fluctuations as well as by higher values and higher variability in radars’ VTEC) introduces higher phase errors with higher variability in the receiver carrier and code tracking [4,49]. These higher errors with higher variability generated at the signal tracking stage then propagate onto the observables to produce higher residual errors with higher variability: these residual errors increase the uncertainty on the phase ambiguities, the phase wind-up and the receiver noise over shorter temporal intervals.
In Equations (4)–(9) these error terms are typically indicated as constants (or as very slow functions of time). However, the results presented through Figure 1, Figure 2, Figure 3 and Figure 7, Figure 8, Figure 9, Figure 10, Figure 11, Figure 12, Figure 13 indicate that they become faster functions of time over shorter temporal intervals (i.e., temporal transients) in the presence of ionospheric irregularities: that is, they increase with the variability in the ionisation (summarised through the radars’ VTEC in Figure 11, Figure 12 and Figure 13). These higher-order temporal transients in the error terms in Equations (5) and (9) are not removed through the dual-frequency combination of the observables and therefore introduce residual errors in the positioning solution. Due to their higher variability these transients introduce outliers in the cycle-slip detectors based upon the geometry-free and the Melbourne–Wübbena combinations, hence leading to gaps in the positioning solutions. These higher-order temporal transients remain low and vary slowly with time over 1 s intervals whereas they vary more significantly over 30 s intervals given that GPS TEC fluctuations attain lower variability over 1 s intervals as opposed to 30 s intervals in the presence of irregularities with a scale size ranging from approximately few kilometres in the E region to few tens of kilometres in the F region (compare Figure 1, Figure 2, Figure 3 and Figure 11, Figure 12, Figure 13).
Although the results presented here depend upon the specific implementation of the cycle-slip detectors within a given positioning algorithm, it is evident how irregularities in the active auroral and polar ionosphere introduce a degradation due to the increase of errors in the phase and code measurements, with the net result of reducing the number of satellites available for the positioning solutions.
These results indicate that the thresholds and the internal parameters of the models utilised in the cycle-slip detectors within positioning algorithms such as gLAB can be improved for the 30 s positioning solutions [51] to reflect the variability in TEC, as illustrated here in the case of active auroral and polar ionospheres. However, the use of a higher sampling rate immediately increased the performance of the positioning solutions both in real-time and in post-processing. This aspect is in line with the results shown in Vani et al. [42] where a high sampling rate was found necessary to reduce errors and gaps in the positioning solution during the presence of intensity scintillation originating from small-scale irregularities in the post-sunset equatorial ionosphere.
A higher sampling rate for the observables measurements and a higher rate at which positioning is performed seemed to provide an immediate mitigation against residual errors introduced during active geomagnetic conditions. A higher sampling rate has the advantage of reducing the complexity of both the receiver and the positioning algorithms: it is indeed not necessary to optimise the tracking stages of the receiver or the specific settings of the positioning algorithms (e.g., by introducing additional models that depend upon external information in order to specifically correct for higher-order error terms due to enhanced TEC fluctuations and scintillation) as they become optimal over shorter sampling intervals in their standard configuration. The trade-off between a larger memory storage requirement (to accommodate for higher sampling rates) and the reduction in the complexity of both the receiver logics and the positioning algorithm seems to provide a suitable solution for precision applications in both real-time and post-processing.
Therefore, in relation to question (1), the irregularities responsible for higher variability and gaps in the positioning solutions were those forming between the E and the F regions with scale sizes ranging approximately from few kilometres in the E region to few tens of kilometres in the F region. This scale size is comparable to the separation distance between their intersections with GPS ray paths. These irregularities originated enhancements in GPS TEC fluctuations over 30 s intervals and over 1 s intervals. However, TEC changes over 1 s intervals were smaller than those occurring over 30 s: this aspect can be visualised in the schematic diagram in Figure 14 where GPS ray paths spent more time within the irregularities when the sampling interval is 1 s. At 30 s sampling interval these irregularities were responsible for higher phase errors and gaps in the positioning solutions.
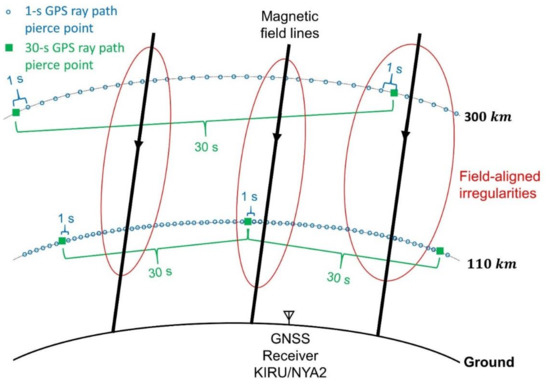
Figure 14.
Schematic diagram that illustrates the comparison between measurements collected at 1 s and at 30 s sampling intervals in relation to the scale size of field-aligned irregularities in the auroral and polar ionospheres. There are more intersection points (i.e., pierce points) between GPS ray paths and a given irregularity at 1 s intervals than at 30 s intervals.
In relation to question (2), higher-order temporal transients introduced residual errors on the observables as well as outliers in the cycle-slip detectors: these transients were responsible for the increase in the 3-D positioning error and in the occurrence of gaps. Whilst these transients have lower values and lower variability over 1 s intervals, they become significant over 30 s intervals in the presence of irregularities forming between the E and the F regions in the active auroral and polar ionospheres.
5. Conclusions
The performance of GPS positioning in the presence of enhanced TEC fluctuations in the auroral and polar latitudes was investigated in conjunction with measurements collected through EISCAT UHF/ESR incoherent scatter radars. Two dual-frequency positioning solutions were implemented: a single-epoch solution relying upon broadcast ephemeris (BK, typical of real-time applications) and a single-epoch solution relying upon precise ephemeris (PS or PPP, typical of post-processing applications).
The BK and PS positioning solutions were estimated at both 30 s and 1 s rates by utilising observables from GPS satellites collected at the IGS ground stations in Kiruna and Ny-Ålesund during individual days in March 2018.
In general, the 30 s BK positioning solution showed higher variability in the 3-D positioning error and the presence of gaps, whereas the 30 s PS solution showed lower values and lower variability for though it was affected by gaps. On the other hand, the 1 s positioning solutions showed lower 3-D positioning errors with lower variability and the absence of gaps.
The higher variability in and the presence of gaps on the 30 s positioning solutions were induced by irregularities forming between the E and the F regions with scale sizes ranging from approximately few kilometres in the E region to a few tens of kilometres in the F region; the intersections between these irregularities and GPS ray paths had separation distances of a few kilometres in the E region and few tens of kilometres in the F region, which is comparable to their scale sizes. These irregularities induced residual errors on the observables (from the receiver’s tracking stages) and outliers in the cycle slip detectors based upon the geometry-free and the Melbourne-Wübbena combinations.
The residual errors introduced by the receiver on the observables had a temporal transient nature: they appeared more significant over 30 s temporal intervals but became less significant over 1 s temporal scales in the presence of irregularities in the active auroral and polar ionospheres.
The results indicate that the use of higher sampling rates for observables as well as for the positioning solutions improves the performance of real-time and post-processing positioning and reduces the complexity of the receiver logics and of the positioning algorithm.
Author Contributions
Conceptualization, B.F., I.A. and I.H.; Methodology, B.F., I.A., H.M.J. and B.C.V.; Software, H.M.J., A.A., T.A. and B.F.; Formal Analysis, H.M.J., B.F. and I.H.; Writing—Original Draft Preparation, H.M.J. and B.F.; Writing—Review & Editing, H.M.J., B.F., I.A., A.A., T.A., B.C.V. and I.H.; Supervision, B.F.; Funding Acquisition, B.F., I.A. and H.M.J. All authors have read and agreed to the published version of the manuscript.
Funding
This research is funded by the Petroleum Technology Development Fund (PTDF), Abuja, Nigeria; EISCAT UK time allocation; and the Natural Environment Research Council (NERC) [Grant number NE/R009082/1 and Grant number NE/V002597/1].
Institutional Review Board Statement
Not applicable.
Informed Consent Statement
Informed consent was obtained from all subjects involved in the study.
Data Availability Statement
EISCAT/ESR data are available at http://portal.eiscat.se/schedule/schedule.cgi. Data from the IMAGE Magnetometer Array are available at https://space.fmi.fi/image/www/index.php. The 1-s and 30-s RINEX data were accessed through the International GNSS Service (IGS) from the online archives of the Crustal Dynamics Data Information System (CDDIS), NASA Goddard Space Flight Center, Greenbelt, MD, USA (https://cddis.nasa.gov/Data_and_Derived_Products/GNSS/GNSS_data_and_product_archive.html), http://dx.doi.org/10.5067/GNSS/gnss_daily_o_001. In the case of the BK solution, the orbit and clock data were obtained from the RINEX Navigation files, whereas in the case of the PS solution the orbit and clock data were obtained from Standard Product (SP3) files and Clock (CLK) files (ftp://cddis.gsfc.nasa.gov/pub/gps/products) [30]. gLAB is a software tool suite develop under a European Space Agency (ESA) Contract by the Research Group of Astronomy and Geomagnetics (gAGE) from the Universitat Politecnica de Catalunya (UPC), is an interactive educational multipurpose package to process and analysis GNSS data (http://www.gage.upc.edu/gLAB).
Acknowledgments
H.M.J. wishes to thank the Petroleum Technology Development Fund (PTDF), Abuja, Nigeria for providing for the PhD research scholarship. The EISCAT campaigns were supported through the EISCAT UK time allocation. This work was also supported by the Natural Environment Research Council (NERC) [Grant number NE/R009082/1 and Grant number NE/V002597/1]. EISCAT is an international association supported by research organisations in China (CRIRP), Finland (SA), Japan (NIPR and STEL), Norway (NFR), Sweden (VR), and the United Kingdom (NERC). We thank the institutes who maintain the IMAGE Magnetometer Array: Tromsø Geophysical Observatory of UiT the Arctic University of Norway (Norway), Finnish Meteorological Institute (Finland), Institute of Geophysics Polish Academy of Sciences (Poland), GFZ German Research Centre for Geosciences (Germany), Geological Survey of Sweden (Sweden), Swedish Institute of Space Physics (Sweden), Sodankylä Geophysical Observatory of the University of Oulu (Finland), and Polar Geophysical Institute (Russia). The 1 s and 30 s RINEX data were accessed through the International GNSS Service (IGS). Many thanks to GNSS Calendar and Utility product available online through http://www.gnsscalendar.com/ where orbit and clock sources both broadcast and precise modes were downloaded. gLAB is a software tool suite develop under a European Space Agency (ESA) Contract by the Research Group of Astronomy and Geomagnetics (gAGE) from the Universitat Politecnica de Catalunya (UPC), is an interactive educational multipurpose package to process and analysis GNSS data (http://www.gage.upc.edu/gLAB). Many thanks to the providers of RTKLIB, which was used to download the 1 s and 30 s RINEX observation and navigation data, used to calculate TEC fluctuations, 3-D position error, variability in timing error, and DOPs.
Conflicts of Interest
The authors declare no conflict of interest.
References
- Cosmen-Schortmann, J.; Azaola-Sáenz, M.; Martinez-Olague, M.A.; Toledo-López, M. Integrity in urban and road environments and its use in liability critical applications. In Proceedings of the 2008 IEEE/ION Position, Location and Navigation Symposium, Monterey, CA, USA, 5 May 2008; IEEE: Piscataway, NJ, USA, 2008; pp. 972–983. [Google Scholar] [CrossRef]
- Lee, J.; Morton, Y.J.; Lee, J.; Moon, H.S.; Seo, J. Monitoring and Mitigation of Ionospheric Anomalies for GNSS-Based Safety Critical Systems: A review of up-to-date signal processing techniques. IEEE Signal Process. Mag. 2017, 34, 96–110. [Google Scholar] [CrossRef]
- Shagimuratov, I.I.; Krankowski, A.; Ephishov, I.; Cherniak, Y.; Wielgosz, P.; Zakharenkova, I. High latitude TEC fluctuations and irregularity oval during geomagnetic storms. Earth Planets Space 2012, 64, 521–529. [Google Scholar] [CrossRef] [Green Version]
- van den IJssel, J.; Forte, B.; Montenbruck, O. Impact of Swarm GPS receiver updates on POD performance. Earth Planets Space 2016, 68, 85. [Google Scholar] [CrossRef] [Green Version]
- Kelley, M.C. The Earth’s Ionosphere: Plasma Physics and Electrodynamics; Academic Press: Cambridge, MA, USA, 2009. [Google Scholar]
- Pi, X.; Mannucci, A.J.; Lindqwister, U.J.; Ho, C.M. Monitoring of global ionospheric irregularities using the worldwide GPS network. Geophys. Res. Lett. 1997, 24, 2283–2286. [Google Scholar] [CrossRef]
- Basu, S.; MacKenzie, E.; Basu, S. Ionospheric constraints on VHF/UHF communications links during solar maximum and minimum periods. Radio Sci. 1988, 23, 363–378. [Google Scholar] [CrossRef]
- Bhattacharyya, A.; Beach, T.L.; Basu, S.; Kintner, P.M. Nighttime equatorial ionosphere: GPS scintillations and differential carrier phase fluctuations. Radio Sci. 2000, 35, 209–224. [Google Scholar] [CrossRef]
- Xu, J.S.; Zhu, J.; Li, L. Effects of a major storm on GPS amplitude scintillations and phase fluctuations at Wuhan in China. Adv. Space Res. 2007, 39, 1318–1324. [Google Scholar] [CrossRef]
- Prikryl, P.; Jayachandran, P.T.; Mushini, S.C.; Pokhotelov, D.; MacDougall, J.W.; Donovan, E.; Spanswick, E.; St-Maurice, J.P. GPS TEC, scintillation and cycle slips observed at high latitudes during solar minimum. In Annales Geophysicae (09927689); Copernicus GmbH: Göttingen, Germany, 2010; Volume 28, Available online: https://ui.adsabs.harvard.edu/link_gateway/2010AnGeo.28.1307P/doi:10.5194/angeo-28-1307-2010 (accessed on 20 January 2021). [CrossRef]
- Kriegel, M.; Jakowski, N.; Berdermann, J.; Sato, H.; Mersha, M.W. Scintillation measurements at Bahir Dar during the high solar activity phase of solar cycle 24. In Annales Geophysicae; Copernicus GmbH: Göttingen, Germany, 2017; Volume 35, pp. 97–106. [Google Scholar]
- Spogli, L.; Alfonsi, L.; Romano, V.; De Franceschi, G.; Francisco, G.M.J.; Shimabukuro, M.H.; Bougard, B.; Aquino, M. Assessing the GNSS scintillation climate over Brazil under increasing solar activity. J. Atmos. Sol. Terr. Phys. 2013, 105, 199–206. [Google Scholar] [CrossRef]
- Cai, X.; Burns, A.G.; Wang, W.; Coster, A.; Qian, L.; Liu, J.; Solomon, S.C.; Eastes, R.W.; Daniell, R.E.; McClintock, W.E. Comparison of GOLD nighttime measurements with total electron content: Preliminary results. J. Geophys. Res. Space Phys. 2020, 125, e2019JA027767. [Google Scholar] [CrossRef]
- Karan, D.K.; Daniell, R.E.; England, S.L.; Martinis, C.R.; Eastes, R.W.; Burns, A.G.; McClintock, W.E. First zonal drift velocity measurement of Equatorial Plasma Bubbles (EPBs) from a geostationary orbit using GOLD data. J. Geophys. Res. Space Phys. 2020, 125, e2020JA028173. [Google Scholar] [CrossRef]
- Forte, B.; Smith, N.D.; Mitchell, C.N.; Da Dalt, F.; Panicciari, T.; Chartier, A.T.; Stevanovic, D.; Vuckovic, M.; Kinrade, J.; Tong, J.R.; et al. Comparison of temporal fluctuations in the total electron content estimates from EISCAT and GPS along the same line of sight. In Annales Geophysicae; Copernicus GmbH: Göttingen, Germany, 2013; Volume 31, p. 745. [Google Scholar] [CrossRef]
- Forte, B.; Coleman, C.; Skone, S.; Häggström, I.; Mitchell, C.; Da Dalt, F.; Panicciari, T.; Kinrade, J.; Bust, G. Identification of scintillation signatures on GPS signals originating from plasma structures detected with EISCAT incoherent scatter radar along the same line of sight. J. Geophys. Res. Space Phys. 2017, 122, 916–931. [Google Scholar] [CrossRef] [PubMed]
- Fejer, B.G.; Kelley, M.C. Ionospheric irregularities. Rev. Geophys. 1980, 18, 401–454. [Google Scholar] [CrossRef]
- Kelley, M.C.; Vickrey, J.F.; Carlson, C.W.; Torbert, R. On the origin and spatial extent of high-latitude F region irregularities. J. Geophys. Res. Space Phys. 1982, 87, 4469–4475. [Google Scholar] [CrossRef]
- Keskinen, M.J.; Ossakow, S.L. Theories of high-latitude ionospheric irregularities: A review. Radio Sci. 1983, 18, 1077–1091. [Google Scholar] [CrossRef]
- John, H.M.; Forte, B.; Astin, I.; Allbrook, T.; Arnold, A.; Vani, B.C.; Häggström, I.; Sato, H. An EISCAT UHF/ESR experiment that explains how ionospheric irregularities induce GPS phase fluctuations at auroral and polar latitudes. Radio Sci. 2021, 56, e2020RS007236. [Google Scholar] [CrossRef]
- Aarons, J. Global morphology of ionospheric scintillations. Proc. IEEE 1982, 70, 360–378. [Google Scholar] [CrossRef]
- Skone, S.; Cannon, M.E. Auroral zone ionospheric considerations for WADGPS. Navigation 1998, 45, 117–127. [Google Scholar] [CrossRef]
- Skone, S.H. The impact of magnetic storms on GPS receiver performance. J. Geod. 2001, 75, 457–468. Available online: https://www.researchgate.net/deref/http%3A%2F%2Fdx.doi.org%2F10.1007%2Fs001900100198 (accessed on 30 November 2020). [CrossRef]
- Doherty, P.H.; Delay, S.H.; Valladares, C.E.; Klobuchar, J.A. Ionospheric scintillation effects on GPS in the equatorial and auroral regions. Navigation 2003, 50, 235–245. [Google Scholar] [CrossRef]
- Defraigne, P.; Pinat, E.; Bertrand, B. Impact of Galileo-to-GPS-time-offset accuracy on multi-GNSS positioning and timing. GPS Solut. 2021, 25, 45. [Google Scholar] [CrossRef]
- Wang, L.; Li, Z.; Wang, N.; Wang, Z. Real-time GNSS precise point positioning for low-cost smart devices. GPS Solut. 2021, 25, 69. [Google Scholar] [CrossRef]
- Guo, K.; Veettil, S.V.; Weaver, B.J.; Aquino, M. Mitigating high latitude ionospheric scintillation effects on GNSS Precise Point Positioning exploiting 1-s scintillation indices. J. Geod. 2021, 95, 30. [Google Scholar] [CrossRef]
- Correia, E.; Muella, M.; Alfonsi, L.; Prol, F.; Camargo, P. GPS scintillations and total electron content climatology in the southern American sector. In Accuracy of GNSS Methods; IntechOpen: London, UK, 2018. [Google Scholar] [CrossRef] [Green Version]
- Rao, K.D.; Dutt, V.S.I. An Assessment of Mapping Functions for VTEC Estimation using Measurements of Low Latitude Dual Frequency GPS Receiver. Int. J. Appl. Eng. Res. 2017, 12, 422–427. [Google Scholar]
- Ward, N. Understanding GPS—Principles and Applications; Kaplan, E.D., Ed.; Artech House Publishers: London, UK, 1996; ISBN 0-89006-793-7. [Google Scholar]
- Carrano, C.S.; Groves, K.M. TEC gradients and fluctuations at low latitudes measured with high data rate GPS receivers. In Proceedings of the 63rd Annual Meeting of the Institute of Navigation, Cambridge, MA, USA, 23 April 2007; pp. 156–163. [Google Scholar]
- Luo, X.; Gu, S.; Lou, Y.; Xiong, C.; Chen, B.; Jin, X. Assessing the Performance of GPS Precise Point Positioning under Different Geomagnetic Storm Conditions during Solar Cycle 24. Sensors 2018, 18, 1784. [Google Scholar] [CrossRef] [Green Version]
- Hernandez-Pajares, M.; Juan, J.M.; Sanz, J.; Ramos-Bosch, P.; Rovira-Garcia, A.; Salazar, D.; Ventura-Traveset, J.; Lopez-Echazarreta, C.; Hein, G. The ESA/UPC GNSS-lab tool (glab). In Proceedings of the 5th ESA Workshop on Satellite Navigation Technologies (NAVITEC’2010), ESTEC, Noordwijk, The Netherlands, 8–10 December 2010. [Google Scholar]
- Ibáñez, D.; Rovira-García, A.; Sanz, J.; Juan, J.M.; Gonzalez-Casado, G.; Jimenez-Baños, D.; López-Echazarreta, C.; Lapin, I. The GNSS Laboratory Tool Suite (gLAB) updates: SBAS, DGNSS and Global Monitoring System. In Proceedings of the 9th ESA Workshop on Satellite Navigation Technologies (NAVITEC 2018), Noordwijk, The Netherlands, 5 December 2018. [Google Scholar] [CrossRef]
- Noll, C. The Crustal Dynamics Data Information System: A resource to support scientific analysis using space geodesy. Adv. Space Res. 2010, 45, 1421–1440. [Google Scholar] [CrossRef] [Green Version]
- El-Hattab, A.I. Assessment of PPP for establishment of CORS network for municipal surveying in Middle East. Surv. Rev. 2014, 46, 97–103. [Google Scholar] [CrossRef]
- Jacobsen, K.S.; Andalsvik, Y.L. Overview of the 2015 St. Patrick’s day storm and its consequences for RTK and PPP positioning in Norway. J. Space Weather Space Clim. 2016, 6, A9. [Google Scholar] [CrossRef]
- Wabbena, G.; Schmitz, M.; Bagge, A. PPP-RTK: Precise point positioning using state-space representation in RTK networks. In Proceedings of the 18th International Technical Meeting of the Satellite Division of The Institute of Navigation (ION GNSS 2005), Long Beach, CA, USA, 13–16 September 2005; pp. 2584–2594. [Google Scholar]
- Borre, K.; Akos, D.M.; Bertelsen, N.; Rinder, P.; Jensen, S.H. A Software-Defined GPS and Galileo Receiver: A Single-Frequency Approach; Springer Science & Business Media: Berlin/Heidelberg, Germany, 2007. [Google Scholar]
- Jacobsen, K.S.; Dähnn, M. Statistics of ionospheric disturbances and their correlation with GNSS positioning errors at high latitudes. J. Space Weather Space Clim. 2014, 4, A27. [Google Scholar] [CrossRef] [Green Version]
- Vani, B.C.; Ivánová, I.; Monico, J.F.; Shimabukuro, M.H. Visualizing the Quality of GNSS Multivariate Data. 2014. Available online: http://mtc-m21b.sid.inpe.br/col/sid.inpe.br/mtc-m21b/2020/05.20.14.54/doc/vani_visualizing.pdf?requiredmirror=sid.inpe.br/mtc-m21b/2013/09.26.14.25.22&searchmirror=sid.inpe.br/mtc-m18@80/2008/03.17.15.17.24&metadatarepository=sid.inpe.br/mtc-m21b/2020/05.20.14.54.22&choice=briefTitleAuthorMisc&searchsite=mtc-m16c.sid.inpe.br:80&languagebutton=en (accessed on 20 January 2021).
- Vani, B.C.; Forte, B.; Monico, J.F.G.; Skone, S.; Shimabukuro, M.H.; de OMoraes, A.; Portella, I.P.; Marques, H.A. A novel approach to improve GNSS Precise Point Positioning during strong ionospheric scintillation: Theory and demonstration. IEEE Trans. Veh. Technol. 2019, 68, 4391–4403. [Google Scholar] [CrossRef]
- Melbourne, W.G. The case for ranging in GPS based geodetic systems. In Proceedings of the 1st International Symposium on Precise Positioning with the Global Positioning System, Rockville, Maryland, 15–19 April 1985; Goad, C., Ed.; US Department of Commerce: Washington, DC, USA, 1985; pp. 375–386. [Google Scholar]
- Wübbena, G. Software Developments for Geodetic Positioning with GPS Using Tl 4100 Code and Carrier Measurements. In Proceedings of the 1st International Symposium on Precise Positioning with the Global Positioning System, Rockville, Maryland, 15–19 April 1985; Goad, C., Ed.; US Department of Commerce: Washington, DC, USA, 1985; pp. 403–412. [Google Scholar]
- Blewitt, G. An automatic editing algorithm for GPS data. Geophys. Res. Lett. 1990, 17, 199–202. [Google Scholar] [CrossRef] [Green Version]
- Cai, C.; Liu, Z.; Xia, P.; Dai, W. Cycle slip detection and repair for undifferenced GPS observations under high ionospheric activity. GPS Solut. 2013, 17, 247–260. [Google Scholar] [CrossRef]
- Zeng, T.; Sui, L.; Xu, Y.; Jia, X.; Xiao, G.; Tian, Y.; Zhang, Q. Real-time triple-frequency cycle slip detection and repair method under ionospheric disturbance validated with BDS data. GPS Solut. 2018, 22, 62. [Google Scholar] [CrossRef]
- Krypiak-Gregorczyk, A.; Wielgosz, P. Carrier phase bias estimation of geometry-free linear combination of GNSS signals for ionospheric TEC modeling. GPS Solut. 2018, 22, 45. [Google Scholar] [CrossRef] [Green Version]
- Teunissen, P.; Montenbruck, O. (Eds.) Springer Handbook of Global Navigation Satellite Systems; Springer: Berlin/Heidelberg, Germany, 2017. [Google Scholar]
- He, X.; Zhang, X. Characteristics Analysis of BeiDou Melbourne-Wübbena Combination. In Proceedings of the China Satellite Navigation Conference (CSNC) 2015, Xi’an, China, 13–15 May 2015; Springer: Berlin/Heidelberg, Germany, 2015; Volume III, pp. 31–45. [Google Scholar]
- Zhang, X.; Guo, F.; Zhou, P. Improved precise point positioning in the presence of ionospheric scintillation. GPS Solut. 2014, 18, 51–60. [Google Scholar] [CrossRef]
Publisher’s Note: MDPI stays neutral with regard to jurisdictional claims in published maps and institutional affiliations. |
© 2021 by the authors. Licensee MDPI, Basel, Switzerland. This article is an open access article distributed under the terms and conditions of the Creative Commons Attribution (CC BY) license (https://creativecommons.org/licenses/by/4.0/).