Abstract
Laser-induced breakdown spectroscopy (LIBS) is a valuable tool for evaluating the geochemical characteristics of Martian rocks and was applied in the Tianwen-1 Mars exploration mission with the payload called Mars Surface Composition Detection Package (MarSCoDe). In this work, we developed a laboratory standoff LIBS system combined with a Martian simulation chamber to examine the geochemical characteristics of igneous rocks, with the intention to provide a reference and a basis for the analysis of LIBS data acquired by MarSCoDe. Fifteen igneous geological standards are selected for a preliminary LIBS spectroscopic study. Three multivariate analysis methods were applied to characterize the geochemical features of igneous standards. First, quantitative analysis was done with Partial Least Squares (PLS) and Least Absolute Shrinkage and Selection (LASSO), where the major element compositions of these samples (SiO2, Al2O3, T Fe2O3, MgO, CaO, K2O, Na2O, and TiO2) were derived. The predicted concentrations ((Fe2O3 + MgO)/SiO2, Fe2O3/MgO, Al2O3/SiO2, and (Na2O + K2O)/Al2O3) were used to identify the geochemical characteristics of igneous rocks. Also, PCA, an unsupervised multivariate method was tested to directly identify the igneous rock lithology with no prior quantification. Higher correlation (0.82–0.88) are obtained using Principal Component Analysis (PCA) scores than using predicted elemental ratios derived by PLS and LASSO, indicating that PCA is better suited to identify igneous rock lithology than via quantitative concentrations. This preliminary study, using this LIBS system, provides suitable methods for the elemental prediction and geochemical identification of martian rocks, and we will use extended geologic standards and continue to build a robust LIBS spectral library for MarSCoDe based on this LIBS system in the future.
1. Introduction
Understanding the geochemical characteristics (mafic, felsic, and alkaline degree) of igneous rocks is critical for Martian geological studies. The primary magmatic crust of Mars is thought to be globally basaltic (i.e., mafic) based on the combination of orbital remote sensing (e.g., Mars Reconnaissance Orbiter), in-situ investigations (e.g., Curiosity rover), and Martian meteorite (e.g., shergottites) studies [1,2,3], which may be formed by the partial melting of the Martian mantle. The widespread presence of felsic rocks are determined in the southern highlands by thermal emission spectroscopy [3,4,5], visible and near-infrared spectroscopy [6,7], and can also be identified in Gale crater by the Curiosity rover [8,9], indicating the Si-rich magmatic rocks (i.e., felsic) may constitute a significant fraction of Martian crust [8]. Moreover, the presence of alkaline feldspar in the Gale crater has been confirmed by the Curiosity rover [8,9,10,11,12], which greatly extends the magmatic diversity compared with the observations by previous Mars landing missions [13].
Laser-induced breakdown spectroscopy (LIBS) is a valuable tool to quantitatively analyze all major elements (e.g., Na, Mg, Al, Si, K, Ca, and Fe) in igneous rocks. LIBS is an atomic emission spectroscopy technique in which the optical emissions from the plasma are generated by laser ablation on the target surface. The ability of LIBS to perform a rapid and remote/stand-off analysis (up to 30 m) at the sub-millimeter scale without sample preparation, makes it a valuable and prospective technique in planetary surface explorations [14,15,16,17,18,19,20]. LIBS has been applied for Mars explorations since the use of ChemCam aboard Curiosity rover in 2012, exhibiting an outstanding potential to extract elemental information of rock and soils on the red planet [15,16]. The SuperCam on the Perseverance rover (landed on Mars in 2021) is an extension of the ChemCam, which carries more versatile remote-sensing techniques including LIBS, time-resolved Raman and luminescence spectroscopies, and visible-infrared reflectance spectroscopy [17,18]. The Mars Surface Composition Detection Package (MarSCoDe) is another payload that uses LIBS techniques, designed for China’s Tianwen-1 Mars exploration mission (landed in Utopia Planitia in 2021). MarSCoDe combined a LIBS system (similar design to ChemCam and SuperCam) and a Short Wave Infrared (SWIR) spectrometer, which can evaluate the elemental compositions and classification characteristics of Martian soils and rocks at a distance of 1.6–7 m [20,21,22,23,24,25,26].
Diverse compositions of igneous rocks can be characterized by multivariate chemometric methods based on their LIBS spectra. PLS is a popular method used to construct a linear multivariate regression model using the manifest factor variation extracted from sampled factors and responses [27,28], and has been successfully applied in LIBS spectra interpretation to provide accurate and robust elemental compositions of geological samples [29,30,31,32,33,34,35]. More specifically, PLS was utilized to interpret LIBS spectra acquired by ChemCam on Mars and obtained accurate compositions with low RMSE values (SiO2: 4.33, TiO2: 0.94, Al2O3: 2.85; FeOT: 2.01, MgO: 1.06, CaO: 2.65, Na2O: 0.62, K2O: 0.72) [36,37,38] and low detection limits (>1%) [16]. The least absolute shrinkage and selection operator (LASSO) is another multivariate regression technique that uses selected channels, and has the greatest influence on elemental prediction [39,40]. Dyar et al. (2012) compared the performance of PLS and LASSO models using the LIBS spectra of igneous rocks, and their comparable accuracy was yielded [32].
A Principal Component Analysis (PCA) is one of the most widely used methods to transform the LIBS spectra into several eigenvectors with essential features for rock classification, with the intent to identify the geochemical characteristics of igneous rocks [41,42,43]. Each factor represents the variance with the original data, and the variance decreases gradually with factors. Sirven et al. (2007) and Schröder et al. (2013) respectively demonstrate the feasibility of rock and salt classifications by LIBS spectra using a PCA, Soft Independent Modeling of Class Analogy (SIMCA), and Partial Least Squares-Discriminant Analysis (PLS-DA) [44,45]. PCA was also successfully applied to classify igneous and sedimentary rocks [46]. Recently, Chatterjee et al. (2019) used a PCA algorithm to classify 20 soil samples collected from different locations of a geothermal area based on their LIBS spectra [47]. The plots of PCA scores exhibit clear clusters resulting from the variation of LIBS spectra, mainly caused by different compositions in previous studies [44,45,46,47]. Therefore, PCA scores can provide critical information on the geochemical identification of igneous rocks.
The objective of the paper is to assist the interpretation of data from Mars, by building a MarSCoDe-like LIBS system in Shandong University (SDU-LIBS). This paper presents an stand-off analytical approach on 15 igneous rocks. The optical constitution of SDU-LIBS is similar to the LIBS system of MarSCoDe, but with different parameters (e.g., laser energy, spectral resolutions, spot size of laser on target, and detection distance) [15,16,20]. The LIBS spectra of 15 igneous rocks are obtained using this LIBS system at 0.94 m, and two multivariate regression models are built using PLS and LASSO algorithms to predict elemental compositions. For geochemical identification, elemental ratios predicted by multivariate models and a PCA are compared with actual elemental ratios, with the intent to provide a rapid and suitable approach to identify the geochemical characteristics of igneous rocks. This LIBS system will be used to build a LIBS spectra library, using extended geologic standards in the future, which is significant for LIBS spectra interpretation obtained by MarSCoDe on Mars.
2. Materials and Methods
2.1. Development of a Stand-Off LIBS System
The SDU-LIBS system (Figure 1 and Table 1) consists of a pulsed laser; a Cassegrain telescope for laser beam focus and plasma light collection; a demultiplexer to separate plasma light; three commercial spectrometers (HR2000+, Ocean Optics Co., Ltd., Dunedin, FL, USA); four fibers and a martian simulation chamber [48]. The design of the demultiplexer in particular can ensure that different spectrometers can collect the emission lines from the same region on plasma. An Nd:YAG Q-switched laser (Dawa-200, Beamtech Optronics Co., Ltd., Beijing, China) is selected as the excitation source, operating at 1064 nm, 8 ns pulse width, 200 mJ maximum single pulse energy, and an adjustable repetition rate of 1–20 Hz. The laser beam is expanded from 6 to 20 mm by an expander (BE05-1064, THORLABS) to cover the surface of the secondary mirror (Mirror 2) in the telescope after passing through a laser dichroic mirror (Dichroic 1, designed from XinXiangBaiHe O.E. CO., LTD., Xinxiang, China) coated by a film of T > 95% at 1064 nm and R > 93% at 250–850 nm. Subsequently, the laser beam is focused on the sample surface by Mirror 1 in the telescope.

Figure 1.
Configuration of SDU-LIBS composed of a pulsed laser, a telescope, a demultiplexer, three spectrometers, four optical fibers, and a Martian simulation chamber. The detailed specifications are presented in Table 1.

Table 1.
Specifications of SDU-LIBS System.
The plasma light generated by the laser ablation on the sample surface is concentrated and collimated by Mirror 1 and Mirror 2 in the telescope, and coupled to a high-OH multimode optical fiber (Fiber 1, 0.22 NA, 300 μm core diameter) after being reflected by a laser dichroic mirror (Dichroic 1). The light is subsequently collimated to the demultiplexer by a reflective collimator (Mirror 4), and divided into three beams based on three wavelength ranges by two dichroic mirrors (Dichroic 2 and 3, designed from SIGMAKOKI) and a reflectance mirror (Mirror 8). The output light from the demultiplexer is coupled to three fibers (Fiber 2–4) and collected by three commercial spectrometers over the following wavelength ranges: ultraviolet (UV, 240–339 nm), violet (VIO, 339–549 nm), and visible and near-infrared (VNIR, 539–972 nm). The cores of Fiber 2–4 are arranged in a circular pattern at the exit side of the demultiplexer and a linear pattern at the entrance side of the spectrometers.
In this work, samples were placed at a distance of 0.94 m from the primary mirror (Mirror 1) of the telescope, and the actual laser-focused spot size (~200 μm in diameter) was defined by the exposed surface of a black anodized aluminum holder. A laser energy of 130 mJ (25.7 mJ on the sample) was applied, and the laser irradiance on the targets was ~2.6 GW/cm2. The experiment was performed in the Martian simulation chamber, which was pumped down to 3 mbar and filled with 7 mbar CO2 to simulate a Mars-like atmosphere.
The optical constitute of SDU-LIBS is similar to the LIBS system of MarSCoDe, but with different parameters. The laser irradiance on targets of MarSCoDe can be calculated by the laser energy on the targets (9.9 mJ at 20 °C), laser spot size (0.11–0.18 mm from the distance of 3–5 m), and the pulse width of laser (4.0 ns), which is 2.4–6.5 GW/cm2. The laser irradiance of SDU-LIBS (~2.6 GW/cm2) is in the irradiance range of MarSCoDe. Moreover, the different spectral responses between different detections of SDU-LIBS and MarSCoDe can be corrected by radiometric calibration, which can transform the response of CCD (Digital Number, DN) to absolute radiance [14,15,20].
2.2. Sample Preparation and LIBS Analysis
Fifteen standard reference materials with a grain size <80 μm were employed in our work (Table 2 and Figure 2), which are found to be homogeneous at the scale of the LIBS beam (~200 μm in diameter). The standards consist of ultrabasic, basic, intermediate, and acid rocks. All powders were pressed to a pellet with a diameter of 2 cm at ~200 MPa for 2 min. The pressed-pellet samples were placed on a mounting platform, which was able to change between different samples and maintain a constant distance between the telescope and the sample surface. For each sample, LIBS spectra were collected from four different locations to avoid the potential inhomogeneity of samples. Five LIBS spectra at each location were received, and each spectrum was obtained by accumulating the emissions of 12 plasmas (6 plasmas for the sample of No. 7 due to saturation of detections) to enhance the Signal to Noise Ratio and avoid the variations of the LIBS instrument (e.g., variation of laser energy). Twenty LIBS spectra were acquired for each sample, and 300 spectra in total were obtained in our work.

Table 2.
The abundance for oxides of major elements (wt.%) of 15 igneous standards.
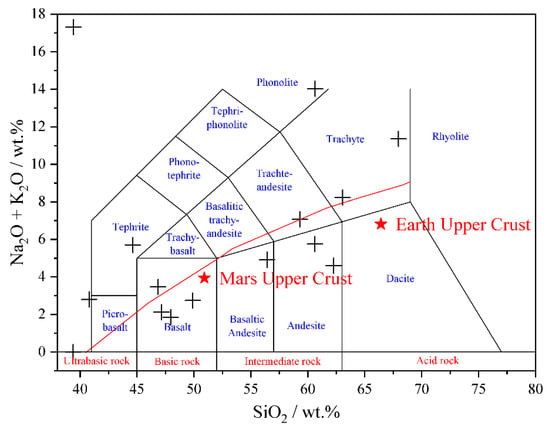
Figure 2.
Total alkali-silica plot of the igneous standards listed in Table 2 (modified from Sautter et al., 2015).
2.3. Data Processing
The steps for LIBS spectra processing include pre-processing, normalization, building multivariate models, and building geochemical identification models, which are listed as follows:
2.3.1. Pre-Processing
- (a)
- Noise removal. The instrument white noise spectra caused by dark currents were removed using Daubechies Wavelet function [36,37].
- (b)
- Continuum removal. The background continuum emission, caused by Bremsstrahlung and ion-electron recombination processes, was removed from de-noised LIBS spectra. The continuum was determined empirically by the interpolated spline function of local minima or a convex hull [36].
The LIBS spectrum before and after the removal of noise and continuum is provided in Figure 3a. The comparison of LIBS emission lines, before and after pre-processing, indicates that there are no additional and unwanted artifacts or variations to the data [49,50].
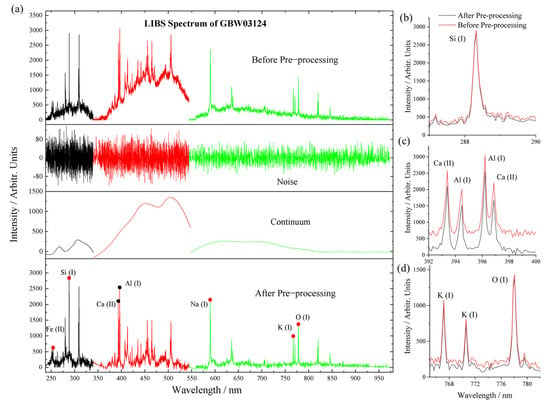
Figure 3.
(a) LIBS spectra of GBW03124 before and after the noise and continuum are removed. (b–d) Comparison of plasma emission lines before and after pre-processing in UV, VIS, and VNIR ranges.
2.3.2. Standardization
Each spectrum was normalized using the total emission of the entire spectrum (i.e., Norm 1) to correct the effects of variable distance and standardize the intensity distributions from different samples [35,36].
2.3.3. Building Multivariate Models
- (a)
- PLS models: The component numbers of PLS was initially set in the range of 1–50. Several PLS models were generated using a leave-one-out cross-validation (LOOCV) method, based on the Python machine learning package sklearn (NIPALS algorithm was automatically selected) [37,51,52]. In other words, the LIBS spectra of each sample were selected as a test set and the other spectra of 14 samples were used as a train set to build a PLS model. The mean (μ) and standard deviation (σ) of the predicted compositions for each sample were subsequently calculated, and a Successfully Predicted Sample (SPS) number can be confirmed in based on whether the actual composition of the sample falls in the predicted composition range of [μ − σ, μ + σ]. The optimized number of factors of PLS models can be determined by a low predicted RMSE value and high SPS number.
- (b)
- LASSO models: The values of alpha were originally set as 0.02–1.0. Models were built using the LOOCV method, based on the Python package sklearn. The optimized alpha value was determined according to a low RMSE value and high SPS number, similar to the method of selecting variables numbers in PLS models.
2.3.4. Building Geochemical Identification Models
- (a)
- Geochemical identification using element ratios predicted by PLS and LASSO models. The elemental mass ratios, including (Fe2O3 + MgO)/SiO2, Fe2O3/MgO, Al2O3/SiO2, and (Na2O + K2O)/Al2O3, were calculated based on PLS and LASSO results for geochemical identification. The corrcoef values were denoted as the correlation coefficient value of predicted and actual elemental ratios. A larger corrcoef value indicates a higher correlation and better performance to identify the geochemical characteristics of igneous rocks.
- (b)
- Geochemical identification using PCA algorithm. Several eigenvectors and PCA scores were extracted from normalized LIBS spectra based on the Python machine learning package sklearn, and the PCA score ratios were calculated for geochemical identification. The corrcoef values were calculated to indicate the correlation between PCA scores and actual elemental ratios. Higher corrcoef values indicate better performance in geochemical identification.
3. Results and Discussion
3.1. Quantitative Abundance Determinations
The hyperparameter in the PLS (component numbers) and LASSO (alpha value) algorithms are key parameters. In PLS regression, the use of too many factors can lead to overfitting, but models with a low number of factors exhibit poor performance [35,37]. The optimized number of factors in PLS and alpha values in LASSO are simultaneously determined by a high SPS number (black points in Figure 4) and a low RMSE value (red points in Figure 4) of 8 element compositions. For instance, the maximum SPS number of MgO (Figure 4b) appears when 6 factors are selected, but with a high RMSE of 3.21, indicating this point is not optimized for PLS regression. Likewise, the minimum RMSE of SiO2 and low SPS number are obtained when 2 factors are selected (Figure 4a), which are not optimized. Finally, 4, 11, 5, 13, 14, 6, 6, 11 factors are selected to build PLS models, and alpha values in LASSO models are determined as 0.28, 0.08, 0.04, 0.04, 0.08, 0.02, 0.02 and 0.04 to yield the abundance of SiO2, Al2O3, T Fe2O3, MgO, CaO, K2O, Na2O, and TiO2, respectively.
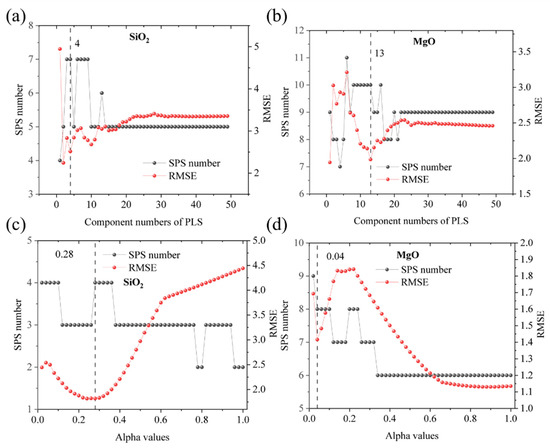
Figure 4.
Selection of the number of factors in PLS models (a,b) and determined alpha values in LASSO models (c,d) for SiO2 and MgO. The optimized number of factors is simultaneously determined by a high SPS number (black points) and a low RMSE value (red points).
A comparison of the quantitative analysis results of 8 elements using PLS and LASSO models are shown in Figure 5 and Table 3. Most data points of predicted and actual elemental abundance are along the 1:1 line, indicating good performance. Samples with extreme compositions can be regarded as outliers, such as the overestimated abundance of SiO2 for samples with SiO2 < 40 wt.% (No. 2 and 7). The underestimation of samples with extremely high elemental abundance may be caused by self-absorption, which is not clear under a low pressure (700 Pa) and may be smoothed by spatial and temporal averaging, using the detection system of SDU-LIBS [53]. In addition, the hardness of samples can affect the relative intensity of emission lines. Harder samples can generate faster plasma shock waves and stronger intensity ratios of ionic and atomic emission lines [54,55], which may lead to high RMSE. The outliers may also be caused by their extreme compositions near the boundary, or even outside the chemical composition range of the training set (i.e., the rest 14 samples). Lower RMSE values, although smaller SPS numbers, can be observed using LASSO models for predicting SiO2, T Fe2O3, MgO, K2O, Na2O, and TiO2. For Al2O3 and CaO, higher RMSE and SPS numbers are acquired by the LASSO models. The comparison of the PLS and LASSO models indicates that they yield comparable results.
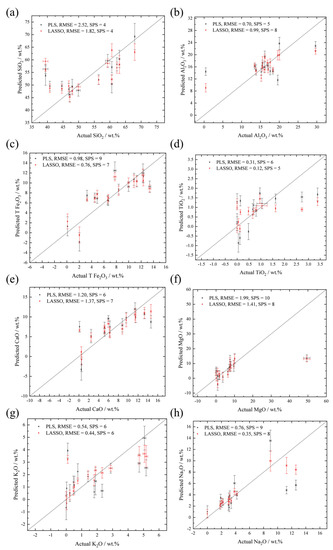
Figure 5.
The scattered plots of actual and predicted oxides of major elements (a–h: SiO2, Al2O3, T Fe2O3, TiO2, CaO, MgO, K2O, and Na2O) using PLS models (black points) and LASSO models (red points). SPS indicates the Successfully Predicted Sample number of the models. The error bar on y-axis represents the standard deviation values of the predicted compositions of 20 LIBS spectra collected from each sample, and the error bar on x-axis is the error of actual elemental abundance.

Table 3.
Comparison of the results of PLS and LASSO models using LOOCV method. The lower RMSE and higher SPS numbers are presented in bold.
3.2. Geochemical Characteristics Based on Predicted Elemental Abundance
The geochemical characteristics of igneous rocks, including felsic (rich in Al), mafic (rich in Fe or Mg), and alkaline (rich in Na and K) characteristics, are significant and are foundational for igneous rock studies on Mars, which can be evaluated by the elemental composition mass ratios of (Fe2O3 + MgO)/SiO2, Fe2O3/MgO, Al2O3/SiO2, and (Na2O + K2O)/Al2O3. The predicted elemental mass ratios are derived from the predicted oxides of major elements (wt.%) using the PLS and LASSO models mentioned above, and a comparison of actual and predicted elemental ratios is provided in Figure 6. All data points are along the 1:1 line. The corrcoef values of actual and predicted (Fe2O3 + MgO)/SiO2, Fe2O3/MgO, Al2O3/SiO2, and (Na2O + K2O)/Al2O3 are 0.70, −0.11, 0.53 and 0.80 for the PLS models and 0.63, 0.34, 0.74 and 0.98 for the LASSO models. The alkaline and mafic characteristics ((Na2O + K2O)/Al2O3) of igneous rocks can be evaluated using composition ratios obtained by PLS and LASSO due to a high corrcoef. Conversely, the low corrcoef of (Fe2O3 + MgO)/SiO2, Fe2O3/MgO, and Al2O3/SiO2 indicates a dissatisfactory performance to identify the geochemical characteristics using the elemental compositions obtained by multivariate models, which may be mainly due to the residual errors of the quantitative method and the standard deviation of actual elemental abundances (shown in Table 2) [56].
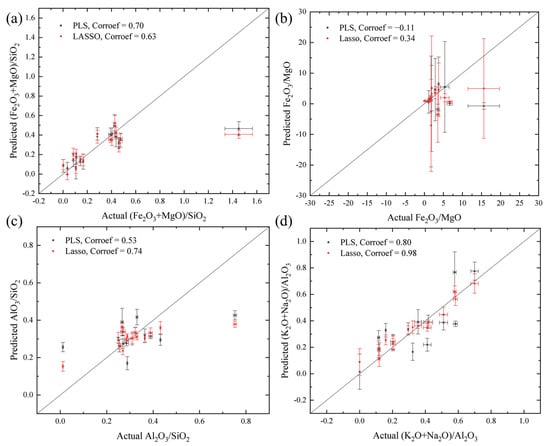
Figure 6.
The predicted and actual (a) (Fe2O3 + MgO)/SiO2, (b) Fe2O3/MgO, (c) Al2O3/SiO2, and (d) (Na2O + K2O)/Al2O3. Predicted elemental ratios are based on the predicted oxides of major elements (wt.%) using the PLS and LASSO models mentioned above. The error bar on x-axis represents the standard deviation value of the results of 20 LIBS spectra collected from each sample.
3.3. Geochemical Characteristics with PCA Scores of LIBS Spectra
The PCA algorithm is applied to transform the LIBS spectra of 15 standards into several factors. The first three factors (PC1, PC2, and PC3) respectively explain 57%, 17%, and 5% of the variance. The loadings of the first three factors and peak attributions are provided in Figure 7 and Table 4 according to the NIST database [57]. The first factor (PC1) constitutes positive contributions of Mg, Fe, Ca, and negative features of Si, Na, and K (Figure 7a). The second factor (PC2) includes positive contributions of Mg and negative contributions of Si, Ca, Al, Na, and K (Figure 7b). For the third factor (PC3, Figure 7c), Si, Al, K, Ca, Na, and O provide the positive contributions, and the negative features are provided by Fe. Therefore, the scores of PC1, PC2, and PC3 provide an effective method to evaluate the geochemical characteristics of the mafic, felsic, and the alkaline degree of igneous rocks.
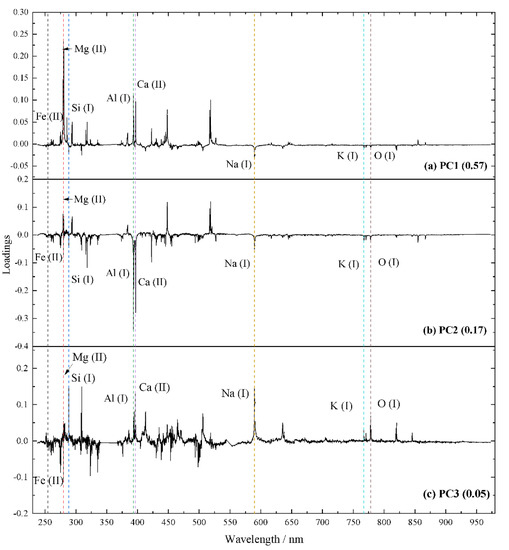
Figure 7.
Loadings of (a) PC1, (b) PC2, and (c) PC3. Positive values represent positive contributions of emission lines on the scores of factors, and the opposite applies to negative loadings.

Table 4.
Characteristics of the lines acquired by PCA.
The plots of the averaged PCA score (acquired from 20 LIBS spectra of each sample) with actual chemical composition ratios are illustrated in Figure 8. For mafic characteristics of igneous rocks (Fe, Mg-rich), the weight ratios of Fe2O3 + MgO and SiO2 increase with PC1 + PC2 scores (corrcoef = 0.85), which is consistent with the obvious contributions of Fe and Mg emission lines and relative lower contributions of Si to PC1 and PC2 (shown in Figure 7). Moreover, the relative contents of the Fe and Mg (Fe2O3/MgO) decrease with PC1 (corrcoef = 0.83) and PC1 − PC3 (corrcoef = 0.85) scores, which is due to the significantly positive contribution of Mg features to PC1 and negative features of Fe to PC3. For the felsic characteristics of igneous rocks, the Al2O3/SiO2 ratios demonstrate an inverse tendency with PC2 − PC3, and the corrcoef is 0.82, which is due to the negative contribution of Al emission lines to PC2 and positive emission lines to PC3 (Figure 7). Furthermore, the weight ratios of (Na2O + K2O)/Al2O3 decrease with the PC1 + PC2 − PC3 scores (corrcoef = 0.84) due to the negative contributions of Na and K features to PC1 and PC2, although they are positive to PC3, and relatively lower contributions of Al features for factors other than Na and K. PCA for geochemical identification of igneous rocks is more suitable (high corrcoef values) than using quantitative values derived by PLS and LASSO.
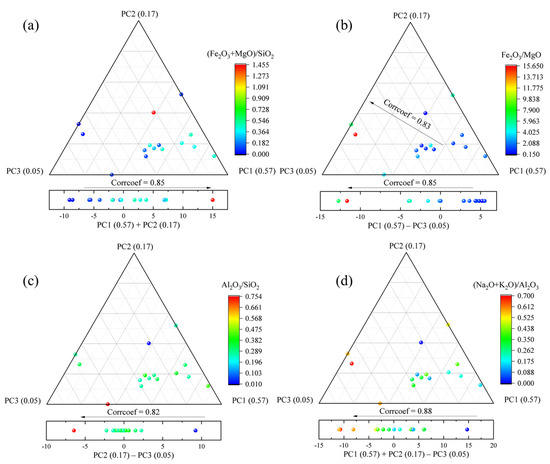
Figure 8.
The ternary plots of relative chemical compositions (a–d: (Fe2O3 + MgO)/SiO2, Fe2O3/MgO, Al2O3/SiO2, and (Na2O + K2O)/Al2O3) with averaged PCA scores of each sample.
4. Conclusions
The main objective of this work is to assist in data interpretation from Mars, by building a MarSCoDe-like LIBS system (SDU-LIBS) in Shandong University. Fifteen igneous rock standards were selected in our work. The accurate chemical compositions of these samples were derived from their LIBS spectra using the PLS and LASSO algorithms. The geochemical characteristics of these samples (mafic, felsic, and alkaline degree) was evaluated based on the element abundance acquired by multivariate models (PLS and LASSO) and PCA scores, respectively. The corrcoef values between PCA scores and the actual composition ratios were higher than those for the predicted composition ratios, indicating PCA is better suited to identify the geochemical characteristics of the igneous rocks.
This first-step study, using the newly-built LIBS system, provides robust methods for the elemental prediction and the geochemical identification of Martian rocks, and we will subsequently continue to build a LIBS spectral library based on the LIBS system, using more geologic standards in the future. The quantitative chemical models and geochemical identification method proposed in this work can provide a reference and basis for the analysis of LIBS data from Tianwen-1 MarSCoDe.
Author Contributions
Conceptualization, Z.L.; methodology, C.L.; software, C.L.; validation, Z.L., Z.W. and J.Z.; formal analysis, C.L.; investigation, C.L.; resources, Z.L.; data curation, C.L., H.B. and Y.L.; writing—original draft preparation, C.L.; writing—review and editing, C.L.; visualization, C.L.; supervision, Z.L.; project administration, Z.L.; funding acquisition, Z.L. All authors have read and agreed to the published version of the manuscript.
Funding
We thank the fundings from the National Natural Science Foundation (U1931211, 11941001, 41972322), the Natural Science Foundation of Shandong Province (ZR2019MD008). This research is also funded by the Pre-research project on Civil Aerospace Technologies No. D020102 funded by China National Space Administration (CNSA). This work is also supported by the Physical-Chemical Materials Analytical & Testing Center of Shandong University at Weihai. This is the SDU-CPS publication #89.
Institutional Review Board Statement
Not applicable.
Informed Consent Statement
Not applicable.
Data Availability Statement
Not applicable.
Acknowledgments
The authors are sincerely appreciated the editors and three reviewers for their constructive reviews.
Conflicts of Interest
The authors declare no conflict of interest.
References
- McSween, H.Y.; Taylor, G.J.; Wyatt, M.B. Elemental composition of the Martian crust. Science 2009, 324, 736–739. [Google Scholar] [CrossRef]
- Carr, M.H.; Head, J.W., III. Geologic history of Mars. Earth Planet. Sci. Lett. 2010, 294, 185–203. [Google Scholar] [CrossRef]
- Bandfield, J.L.; Hamilton, V.E.; Christensen, P. A global view of Martian surface compositions from MGS-TES. Science 2000, 287, 1626–1630. [Google Scholar] [CrossRef]
- Christensen, P.; McSween, H.; Bandfield, J.; Ruff, S.; Rogers, A.; Hamilton, V.; Gorelick, N.; Wyatt, M.; Jakosky, B.; Kieffer, H. Evidence for magmatic evolution and diversity on Mars from infrared observations. Nature 2005, 436, 504–509. [Google Scholar] [CrossRef]
- Bandfield, J.L.; Hamilton, V.E.; Christensen, P.R.; McSween, H.Y., Jr. Identification of quartzofeldspathic materials on Mars. J. Geophys. Res. Planets 2004, 109, 109. [Google Scholar] [CrossRef]
- Wray, J.J.; Hansen, S.T.; Dufek, J.; Swayze, G.A.; Murchie, S.L.; Seelos, F.P.; Skok, J.R.; Irwin, R.P.; Ghiorso, M.S. Prolonged magmatic activity on Mars inferred from the detection of felsic rocks. Nat. Geosci. 2013, 6, 1013–1017. [Google Scholar] [CrossRef]
- Carter, J.; Poulet, F. Ancient plutonic processes on Mars inferred from the detection of possible anorthositic terrains. Nat. Geosci. 2013, 6, 1008–1012. [Google Scholar] [CrossRef]
- Sautter, V.; Toplis, M.J.; Wiens, R.C.; Cousin, A.; Fabre, C.; Gasnault, O.; Maurice, S.; Forni, O.; Lasue, J.; Ollila, A.; et al. In situ evidence for continental crust on early Mars. Nat. Geosci. 2015, 8, 605–609. [Google Scholar] [CrossRef]
- Cousin, A.; Sautter, V.; Payre, V.; Forni, O.; Mangold, N.; Gasnault, O.; Le Deit, L.; Johnson, J.; Maurice, S.; Salvatore, M. Classification of igneous rocks analyzed by ChemCam at Gale crater, Mars. Icarus 2017, 288, 265–283. [Google Scholar] [CrossRef]
- Anderson, A.S.; Mukundan, H.; McInroy, R.E.; Clegg, S.M. Combined LIBS-Raman for remote detection and characterization of biological samples. In Proceedings of the Imaging, Manipulation, and Analysis of Biomolecules, Cells, and Tissues XIII, San Francisco, CA, USA, 9–11 February 2015; p. 932811. [Google Scholar]
- Stolper, E.; Baker, M.; Newcombe, M.; Schmidt, M.; Treiman, A.; Cousin, A.; Dyar, M.; Fisk, M.; Gellert, R.; King, P. The petrochemistry of Jake_M: A Martian mugearite. Science 2013, 341, 1239463. [Google Scholar] [CrossRef] [PubMed]
- Sautter, V.; Fabre, C.; Forni, O.; Toplis, M.; Cousin, A.; Ollila, A.; Meslin, P.; Maurice, S.; Wiens, R.; Baratoux, D. Igneous mineralogy at Bradbury Rise: The first ChemCam campaign at Gale crater. J. Geophys. Res. Planets 2014, 119, 30–46. [Google Scholar] [CrossRef]
- Maurice, S.; Clegg, S.M.; Wiens, R.C.; Gasnault, O.; Rapin, W.; Forni, O.; Cousin, A.; Sautter, V.; Mangold, N.; Le Deit, L.; et al. ChemCam activities and discoveries during the nominal mission of the Mars Science Laboratory in Gale crater, Mars. J. Anal. At. Spectrom. 2016, 31, 863–889. [Google Scholar] [CrossRef]
- Wiens, R.C.; Wan, X.; Lasue, J.; Maurice, S. Laser-induced breakdown spectroscopy in planetary science. In Laser-Induced Breakdown Spectroscopy; Elsevier: Amsterdam, The Netherlands, 2020; pp. 441–471. [Google Scholar]
- Wiens, R.C.; Maurice, S.; Barraclough, B.; Saccoccio, M.; Barkley, W.C.; Bell, J.F.; Bender, S.; Bernardin, J.; Blaney, D.; Blank, J. The ChemCam instrument suite on the Mars Science Laboratory (MSL) rover: Body unit and combined system tests. Space Sci. Rev. 2012, 170, 167–227. [Google Scholar] [CrossRef]
- Maurice, S.; Wiens, R.; Saccoccio, M.; Barraclough, B.; Gasnault, O.; Forni, O.; Mangold, N.; Baratoux, D.; Bender, S.; Berger, G. The ChemCam instrument suite on the Mars Science Laboratory (MSL) rover: Science objectives and mast unit description. Space Sci. Rev. 2012, 170, 95–166. [Google Scholar] [CrossRef]
- Maurice, S.; Wiens, R.C.; Bernardi, P.; Caïs, P.; Robinson, S.; Nelson, T.; Gasnault, O.; Reess, J.-M.; Deleuze, M.; Rull, F. The SuperCam instrument suite on the Mars 2020 rover: Science objectives and Mast-Unit description. Space Sci. Rev. 2021, 217, 1–108. [Google Scholar] [CrossRef]
- Wiens, R.C.; Maurice, S.; Robinson, S.H.; Nelson, A.E.; Cais, P.; Bernardi, P.; Newell, R.T.; Clegg, S.; Sharma, S.K.; Storms, S. The SuperCam instrument suite on the NASA Mars 2020 rover: Body unit and combined system tests. Space Sci. Rev. 2021, 217, 1–87. [Google Scholar] [CrossRef] [PubMed]
- Kalam, S.A.; Rao, S.B.M.; Jayananda, M.; Rao, S.V. Standoff femtosecond filament-induced breakdown spectroscopy for classification of geological materials. J. Anal. At. Spectrom. 2020, 35, 3007–3020. [Google Scholar] [CrossRef]
- Xu, W.; Liu, X.; Yan, Z.; Li, L.; Zhang, Z.; Kuang, Y.; Jiang, H.; Yu, H.; Yang, F.; Liu, C. The MarSCoDe Instrument Suite on the Mars Rover of China’s Tianwen-1 Mission. Space Sci. Rev. 2021, 217, 1–58. [Google Scholar] [CrossRef]
- Jiang, X.; Yang, B.; Li, S. Overview of China’s 2020 Mars mission design and navigation. Astrodynamics 2018, 2, 1–11. [Google Scholar] [CrossRef]
- Li, C.; Zhang, R.; Yu, D.; Dong, G.; Liu, J.; Geng, Y.; Sun, Z.; Yan, W.; Ren, X.; Su, Y.; et al. China’s Mars Exploration Mission and Science Investigation. Space Sci. Rev. 2021, 217, 57. [Google Scholar] [CrossRef]
- Ren, X.; Cai, T.; Liu, D.; Liu, J.; Zhang, H.; Fu, Q.; Zhang, Z.; Xu, W. Preliminary Scientific Exploration Programs for Mars Surface Composition Detection Package of China’s First Mars Exploration. In Proceedings of the European Planetary Science Congress Abstracts, Berlin, Germany, 16–21 September 2018. [Google Scholar]
- Wan, W.; Wang, C.; Li, C.; Wei, Y. China’s first mission to Mars. Nat. Astron. 2020, 4, 721. [Google Scholar] [CrossRef]
- Wu, B.; Dong, J.; Wang, Y.; Li, Z.; Chen, Z.; Liu, W.C.; Zhu, J.; Chen, L.; Li, Y.; Rao, W. Characterization of the Candidate Landing Region for Tianwen-1–China’s First Mission to Mars. Earth Space Sci. Rev. 2021, 8, e2021EA001670. [Google Scholar] [CrossRef]
- Zou, Y.; Zhu, Y.; Bai, Y.; Wang, L.; Jia, Y.; Shen, W.; Fan, Y.; Liu, Y.; Wang, C.; Zhang, A. Scientific objectives and payloads of Tianwen-1, China’s first Mars exploration mission. Adv. Space Res. 2021, 67, 812–823. [Google Scholar] [CrossRef]
- Haaland, D.M.; Thomas, E.V. Partial least-squares methods for spectral analyses. 1. Relation to other quantitative calibration methods and the extraction of qualitative information. Anal. Chem. 1988, 60, 1193–1202. [Google Scholar] [CrossRef]
- Wold, S.; Albano, C.; Dunn, W.; Edlund, U.; Esbensen, K.; Geladi, P.; Hellberg, S.; Johansson, E.; Lindberg, W.; Sjöström, M. Multivariate data analysis in chemistry. In Chemometrics; Springer: Berlin/Heidelberg, Germany, 1984; pp. 17–95. [Google Scholar]
- Sirven, J.-B.; Bousquet, B.; Canioni, L.; Sarger, L. Laser-induced breakdown spectroscopy of composite samples: Comparison of advanced chemometrics methods. Anal. Chem. 2006, 78, 1462–1469. [Google Scholar] [CrossRef] [PubMed]
- Tucker, J.; Dyar, M.; Schaefer, M.; Clegg, S.; Wiens, R. Optimization of laser-induced breakdown spectroscopy for rapid geochemical analysis. Chem. Geol. 2010, 277, 137–148. [Google Scholar] [CrossRef]
- Dyar, M.D.; Tucker, J.M.; Humphries, S.; Clegg, S.M.; Wiens, R.C.; Lane, M.D. Strategies for Mars remote laser-induced breakdown spectroscopy analysis of sulfur in geological samples. Spectrochim. Acta Part B At. Spectrosc. 2011, 66, 39–56. [Google Scholar] [CrossRef]
- Dyar, M.; Carmosino, M.; Breves, E.; Ozanne, M.; Clegg, S.; Wiens, R. Comparison of partial least squares and lasso regression techniques as applied to laser-induced breakdown spectroscopy of geological samples. Spectrochim. Acta Part B At. Spectrosc. 2012, 70, 51–67. [Google Scholar] [CrossRef]
- Anderson, R.B.; Morris, R.V.; Clegg, S.M.; Bell, J.F., III; Wiens, R.C.; Humphries, S.D.; Mertzman, S.A.; Graff, T.G.; McInroy, R. The influence of multivariate analysis methods and target grain size on the accuracy of remote quantitative chemical analysis of rocks using laser induced breakdown spectroscopy. Icarus 2011, 215, 608–627. [Google Scholar] [CrossRef]
- Anderson, R.B.; Bell, J.F., III; Wiens, R.C.; Morris, R.V.; Clegg, S.M. Clustering and training set selection methods for improving the accuracy of quantitative laser induced breakdown spectroscopy. Spectrochim. Acta Part B At. Spectrosc. 2012, 70, 24–32. [Google Scholar] [CrossRef]
- Li, L.-N.; Liu, X.-F.; Xu, W.M.; Wang, J.-Y.; Shu, R. A laser-induced breakdown spectroscopy multi-component quantitative analytical method based on a deep convolutional neural network. Spectrochim. Acta Part B At. Spectrosc. 2020, 169, 105850. [Google Scholar] [CrossRef]
- Wiens, R.C.; Maurice, S.; Lasue, J.; Forni, O.; Anderson, R.B.; Clegg, S.; Bender, S.; Blaney, D.; Barraclough, B.L.; Cousin, A.; et al. Pre-flight calibration and initial data processing for the Chem Cam laser-induced breakdown spectroscopy instrument on the Mars Science Laboratory rover. Spectrochim. Acta Part B At. Spectrosc. 2013, 82, 1–27. [Google Scholar] [CrossRef]
- Clegg, S.M.; Wiens, R.C.; Anderson, R.; Forni, O.; Frydenvang, J.; Lasue, J.; Cousin, A.; Payre, V.; Boucher, T.; Dyar, M.D.; et al. Recalibration of the Mars Science Laboratory ChemCam instrument with an expanded geochemical database. Spectrochim. Acta Part B At. Spectrosc. 2017, 129, 64–85. [Google Scholar] [CrossRef]
- Anderson, R.B.; Clegg, S.M.; Frydenvang, J.; Wiens, R.C.; McLennan, S.; Morris, R.V.; Ehlmann, B.; Dyar, M.D. Improved accuracy in quantitative laser-induced breakdown spectroscopy using sub-models. Spectrochim. Acta Part B At. Spectrosc. 2017, 129, 49–57. [Google Scholar] [CrossRef]
- Andries, E. Sparse models by iteratively reweighted feature scaling: A framework for wavelength and sample selection. J. Chemom. 2013, 27, 50–62. [Google Scholar] [CrossRef]
- Filzmoser, P.; Gschwandtner, M.; Todorov, V. Review of sparse methods in regression and classification with application to chemometrics. J. Chemom. 2012, 26, 42–51. [Google Scholar] [CrossRef]
- Davis, J.C.; Sampson, R.J. Statistics and Data Analysis in Geology; Wiley: New York, NY, USA, 1986; Volume 646. [Google Scholar]
- Pořízka, P.; Klus, J.; Képeš, E.; Prochazka, D.; Hahn, D.W.; Kaiser, J. On the utilization of principal component analysis in laser-induced breakdown spectroscopy data analysis, a review. Spectrochim. Acta Part B At. Spectrosc. 2018, 148, 65–82. [Google Scholar] [CrossRef]
- Moram, S.S.B.; Shaik, A.K.; Byram, C.; Hamad, S.; Soma, V.R. Instantaneous trace detection of nitro-explosives and mixtures with nanotextured silicon decorated with Ag–Au alloy nanoparticles using the SERS technique. Anal. Chim. Acta 2020, 1101, 157–168. [Google Scholar] [CrossRef]
- Sirven, J.-B.; Salle, B.; Mauchien, P.; Lacour, J.-L.; Maurice, S.; Manhes, G. Feasibility study of rock identification at the surface of Mars by remote laser-induced breakdown spectroscopy and three chemometric methods. J. Anal. At. Spectrom. 2007, 22, 1471–1480. [Google Scholar] [CrossRef]
- Schröder, S.; Pavlov, S.; Rauschenbach, I.; Jessberger, E.; Hübers, H.-W. Detection and identification of salts and frozen salt solutions combining laser-induced breakdown spectroscopy and multivariate analysis methods: A study for future martian exploration. Icarus 2013, 223, 61–73. [Google Scholar] [CrossRef]
- El-Saeid, R.; Abdel-Salam, Z.; Pagnotta, S.; Palleschi, V.; Harith, M. Classification of sedimentary and igneous rocks by laser induced breakdown spectroscopy and nanoparticle-enhanced laser induced breakdown spectroscopy combined with principal component analysis and graph theory. Spectrochim. Acta Part B At. Spectrosc. 2019, 158, 105622. [Google Scholar] [CrossRef]
- Chatterjee, S.; Singh, M.; Biswal, B.P.; Sinha, U.K.; Patbhaje, S.; Sarkar, A. Application of laser-induced breakdown spectroscopy (LIBS) coupled with PCA for rapid classification of soil samples in geothermal areas. Anal. Bioanal. Chem. 2019, 411, 2855–2866. [Google Scholar] [CrossRef] [PubMed]
- Wu, Z.; Ling, Z.; Zhang, J.; Fu, X.; Liu, C.; Xin, Y.; Li, B.; Qiao, L. A Mars Environment Chamber Coupled with Multiple In Situ Spectral Sensors for Mars Exploration. Sensors 2021, 21, 2519. [Google Scholar] [CrossRef] [PubMed]
- Engel, J.; Gerretzen, J.; Szymańska, E.; Jansen, J.J.; Downey, G.; Blanchet, L.; Buydens, L.M. Breaking with trends in pre-processing? TrAC—Trends Anal. Chem. 2013, 50, 96–106. [Google Scholar] [CrossRef]
- Myakalwar, A.K.; Dingari, N.C.; Dasari, R.R.; Barman, I.; Gundawar, M.K. Non-gated laser induced breakdown spectroscopy provides a powerful segmentation tool on concomitant treatment of characteristic and continuum emission. PLoS ONE 2014, 9, e103546. [Google Scholar] [CrossRef]
- Wegelin, J.A. A Survey of Partial Least Squares (PLS) Methods, with Emphasis on the Two-Block Case; University of Washington: Seattle, WA, USA, 2000. [Google Scholar]
- Andersson, M. A comparison of nine PLS1 algorithms. J. Chemom. J. Chemom. Soc. 2009, 23, 518–529. [Google Scholar] [CrossRef]
- Hahn, D.W.; Omenetto, N. Laser-induced breakdown spectroscopy (LIBS), part I: Review of basic diagnostics and plasma–particle interactions: Still-challenging issues within the analytical plasma community. Appl. Spectrosc. 2010, 64, 335A–366A. [Google Scholar] [CrossRef]
- Abdel-Salam, Z.; Nanjing, Z.; Anglos, D.; Harith, M. Effect of experimental conditions on surface hardness measurements of calcified tissues via LIBS. Appl. Phys. B 2009, 94, 141–147. [Google Scholar] [CrossRef]
- Aberkane, S.M.; Bendib, A.; Yahiaoui, K.; Boudjemai, S.; Abdelli-Messaci, S.; Kerdja, T.; Amara, S.; Harith, M. Correlation between Fe–V–C alloys surface hardness and plasma temperature via LIBS technique. Appl. Surf. Sci. 2014, 301, 225–229. [Google Scholar] [CrossRef]
- Xu, W.; Sun, C.; Tan, Y.; Gao, L.; Zhang, Y.; Yue, Z.; Shabbir, S.; Wu, M.; Zou, L.; Chen, F. Total alkali silica classification of rocks with LIBS: Influences of the chemical and physical matrix effects. J. Anal. At. Spectrom. 2020, 35, 1641–1653. [Google Scholar] [CrossRef]
- Kramida, A.; Ralchenko, Y.; Reader, J.; NIST ASD Team. NIST Atomic Spectra Database (ver. 5.8). 2021. Available online: https://www.nist.gov/pml/atomic-spectra-database (accessed on 1 October 2021).
Publisher’s Note: MDPI stays neutral with regard to jurisdictional claims in published maps and institutional affiliations. |
© 2021 by the authors. Licensee MDPI, Basel, Switzerland. This article is an open access article distributed under the terms and conditions of the Creative Commons Attribution (CC BY) license (https://creativecommons.org/licenses/by/4.0/).