Article

The Geological History of the Chang’e-5 Sample Return Region

1
State Key Laboratory of Resources and Environmental Information System, Institute of Geographic Sciences and Natural Resources Research, Chinese Academy of Sciences, Beijing 100101, China
2
University of Chinese Academy of Sciences, Beijing 100049, China
3
Jiangsu Centre for Collaborative Innovation in Geographical Information Resource Development and Application, Nanjing 210023, China
4
CAS Center for Excellence in Comparative Planetology, Hefei 230052, China
5
Lunar and Planetary Science Research Center, Institute of Geochemistry, Chinese Academy of Sciences, Guiyang 550002, China
6
School of Earth Sciences and Resources, China University of Geosciences (Beijing), Beijing 100083, China
7
Institute of High and New Techniques Applied to Land Resources, China University of Geosciences (Beijing), Beijing 100083, China
*
Author to whom correspondence should be addressed.
Remote Sens. 2021, 13(22), 4679; https://doi.org/10.3390/rs13224679
Submission received: 5 September 2021 / Revised: 17 November 2021 / Accepted: 17 November 2021 / Published: 19 November 2021
(This article belongs to the Special Issue Planetary Remote Sensing: Chang’E-4/5 and Mars Applications)

Abstract

:
Chang’e-5 (CE-5), China’s first sample-return mission, has successfully landed in Oceanus Procellarum near Mons Rümker. It is important to have a detailed study of the geological evolution of the CE-5 sample return region. This work aims to study the geological background, topography, geomorphology, major chemical composition, mineralogy, and chronology of the landing site region. First, we used the map of topography obtained by the Kaguya TC merged Digital Terrain Model (DTM) to analyze the topographic characteristics. Then, we used the Kaguya Multiband Imager (MI) reflectance data to derive FeO and TiO2 abundance and the hyperspectral data of the Moon Mineralogy Mapper (M3) onboard the Chandrayaan-1 spacecraft to study the mineralogy of the landing site region. Later, we defined and dated the geological units of the landing area using the crater size–frequency distribution (CSFD) method. Finally, we conducted a detailed analysis of the volcanism and tectonism that occurred in the CE-5 landing area. The study region has experienced multi-stage magmatic activities (~3.36 Ga to ~1.22 Ga) and formed multiple mare units with different chemical and mineral compositions. The relationship between the wrinkle ridges cut by small impact craters suggests that the U7/Em5 has experienced Copernican aged tectonism recently ~320 Ma. The U7/Em5 unit where the Chang’e-5 sample return mission landed is dominantly composed of mature pyroxene and the basalts are mainly high-iron and mid-titanium basalts. Additionally, the analysis of pure basalt in the U7/Em5 suggests that the samples returned by the CE-5 mission may contain the ejecta and ray materials of young craters, including sharp B, Harding, Copernicus, and Aristarchus.

1. Introduction

Chang’e-5 (CE-5) is the first Chinese lunar sampling return mission. The lander successfully landed at 43.0576°N, 51.9161°W [1] in Oceanus Procellarum near Mons Rümker on 1 December 2020 and returned 1.731 kg of extraterrestrial samples from the landing area on 16 December 2020 [2]. We studied the region from 36.9°N to 48.0°N and from 42.7°W to 61.0°W, which contains the landing site of the CE-5 mission, northeast of Oceanus Procellarum (Figure 1).
To date, there have been 22 successful soft landing and manned lunar landing missions on the Moon, including Luna, Surveyor, Apollo, and Chang’e series exploration missions. Between 1966 and 1968, Surveyor carried out five exploration missions and obtained more than 87,000 pictures of the moon, which also proved the feasibility of lunar soft landing. The chemical analysis of the Surveyor V landing site shows that the chemical composition of the lunar mare is mainly a silicate similar to basalt [3,4]. Between 1959 and 1976, Luna achieved eight soft landings and sample return missions and Luna 9 achieved the first soft landing. Subsequently, between 1969 and 1972, Apollo carried out six manned lunar landings and obtained 382 kg of lunar samples. According to the study of the Luna and Apollo samples, the ages of the youngest lunar sample and lunar basalt sample are 3.0 Ga and 2.8 Ga, respectively [5,6]. In 2013, China’s Chang’e series exploration mission Chang’e 4 (CE-4) landed on the far-side of the Moon for the first time and found low calcium pyroxene and olivine that may have originated from the lunar mantle [7]. The terrane of the landing site of CE-3 was investigated using the data from the CE-3 lander descent camera and the Yutu rover’s camera [8]. Additionally, the basalts near the Chang’e-3 landing area are believed to be relatively young. Recently, the CE-5 spacecraft of China touched down on the northwest of the Procellarum KREEP Terrane (PKT) [9], which includes the youngest mare basalts (1–2 Ga) on the Moon that have not been sampled by any previous missions [10,11,12,13]. Thus, the Chang’e-5 mare basalts are very important for us to understand the recent thermal evolution of the Moon [11]. Determining the ages of the mare within the CE-5 sample return region will provide important constraints on the timing of the latest volcanic activity and thermal evolution on the Moon.
The CE-5 sample return area has experienced multiple periods of magma activity. Additionally, the ages of the mare units in the CE-5 sample return region have been investigated by previous researchers. Zhao et al. [14] and Qian et al. [11] mapped nine spectral homogeneous units in the CE-5 sample return region and determine the model ages of the mare units with the CSFD method using the Kaguya Multiband Imager MI imaging data and combining the FeO and TiO2 content maps. Jia et al. [13] identified craters larger than 100 m based on LROC NAC images, analyzed the crater distribution and dated the related mare units. However, the ages of mare units are not consistent because of the different dating areas and the pollution of the secondary craters.
After the long-term volcanic activity, later massive impact events and tectonic activities formed several important characteristics within the Chang’e-5 sample return region, including impact craters, impact cluster, crater chains, wrinkle ridges, sinuous rilles, and domes (Figure 1), which imply that the Chang’e-5 sample return region has experienced complex evolutionary history. Thus, it is necessary to investigate the geological features of sample return mission landing sites in depth. There are numerous small craters scattered in mare basalts, including primary and secondary craters. Also, secondary crater clusters are the ejecta of large craters, which greatly influence the composition in the landing region. The lunar wrinkle ridges originated from the tectonic process, and the densest ridges are distributed in northwestern Oceania [15]. The longest sinuous rilles in the CE-5 sample return region is the Rima Sharp, which is also the longest on the lunar surface [10]. The formation model of sinuous rilles is still debated, but sinuous rilles located in the mare are considered to have originated from volcanic activities [16,17]. Mons Rümker is the closest volcanic dome to the CE-5 sample return region and has been acknowledged as one of the three major volcanic areas [18]. Zhao et al. [14] comprehensively studied the Mons Rümker region, identified three geologic units, and dated the model ages. Additionally, the average thickness of the northern Oceanus Procellarum basalts was estimated to be about 0.8 km using a localized multitaper spherical-harmonic analysis method [19].
In our study, we systematically study the topographic and geomorphic features, major element compositions, mineralogy, and geological features within the CE-5 sample return area using high-resolution data, including the Kaguya Terrain Camera (TC) Morning Map images, TC Digital Terrain Model (DTM) images, Multiband Imager (MI) reflectance images and the images of Moon Mineralogy Mapper (M3) on the Chandrayaan-1 spacecraft of the ISRO. The primary goal of our investigation is to investigate the history of the latest volcanism and determine the range of ages of volcanism. Another goal of our paper is to attempt to determine the age of young tectonic activities in the CE-5 sample return region. The third goal is to attempt to determine the possible composition of the landing site of the CE-5 sample return mission.

2. Data and Method

We studied the CE-5 sample return region using newly available high-resolution images. These include the following: (1) Kaguya Terrain Camera (TC) Morning Map images (10 m/pixel) [20]. A mosaic of TC Morning images is used to identify the craters in the CE-5 sample return region and determine the model ages of the mare units using the Crater Size–Frequency Distribution (CSFD) method. (2) High-resolution topography data from TC digital terrain models (DTMs) produced by stereo-pair images at 10 m spatial resolution [20]. (3) Spectral data from Kaguya mission and Chandrayaan-1 spacecraft, including Kaguya Multiband Imager (MI) reflectance data and Moon Mineralogy Mapper (M3) hyperspectral data. The mosaic MI visible reflectance data were used to derive the FeO and TiO2 content. M3 provided data with a resolution of 20 or 40 nm, 86 spectral bands from the visible into the near-infrared region (0.42–3.0 μm) [21,22]. The M3 images that we used in this paper are calibrated and radiometrically corrected [22], geometrically corrected [21], thermally corrected [23], and photometrically corrected data [24]. Data from Optical Period 2c were used to analyze and study the mineralogy of the CE-5 sample return region. TC DTM data, TC Morning Map images, and MI reflectance images were downloaded from the KAGUYA (SELENE) Data Archive (http://darts.isas.jaxa.jp/planet/pdap/selene/, accessed on 18 February 2021). Moon Mineralogy Mapper (M3) hyperspectral images were downloaded from Lunar Orbital Data Explorer (https://ode.rsl.wustl.edu/moon/, accessed on 4 February 2021).
There are five visible bands of Kaguya MI reflectance data, and the resolution is 20 m/pixel. The resolution of four near-infrared bands of Kaguya MI reflectance data is 52 m/pixel. In our study, using the algorithm proposed by Lemelin et al. [25], and Otake et al. [26], the abundance of TiO2 and FeO were calculated based on MI visible reflectance data. The algorithms are defined as:
θ Fe 1 =   arctan   ( R 915 R 750 1.39 R 750 0.04 )
θ Fe 2 = 0.0656 × e ( 3.6681     θ Fe 1 )
wt . % FeO   =   θ Fe 2 × 1.0708 0.3986
θ Ti =   arctan   ( R 415 R 750 0.208 R 750 + 0.108 )
wt . % Ti O 2 = 0.72 ×   θ T i 14.964
where Rλ is the reflectance value of wavelength λ. The FeO algorithm has standard deviations of 0.85 wt.% and the TiO2 algorithm has standard deviations of 0.43 wt.% [26,27].
In addition, the false-color composition map calculated based on the MI reflectance data has been used as a reference to define the boundaries of the geological unit. The MI false-color composition map is produced by band ratio combination of MI visible reflectance data. Additionally, the red band is the value of 750 nm/415 nm, the green band is the value of 750 nm/950 nm, the blue band is the value of 415 nm/750 nm. Since this MI false-color composition scheme can sensitively reflect the compositional changes on the lunar surface and combining with TiO2 and FeO abundances are more suitable for determining the boundaries of mare units [28].
M3 is the imaging spectrometer on the Chandrayaan-1 spacecraft. There are 85 spectral channels, and the detection spectrum covers the range from visible to near-infrared, and the wavelength ranges from 430 to 3000 nm [29,30]. M3 reflectance images from the optical period (OP2C) are thermally, geometrically, and photometrically corrected [21,22,31] and thus used to study and analyze the mineralogical characteristics of the CE-5 sample return area.
The M3 team developed several mineral characteristic parameters to analyze the basic mineralogical characteristics of the lunar surface [32,33]. The integrated band depth (IBD) map is a color composition generated by combining the integrated band depth at 1 μm and 2 μm with the reflectance value at 1.58 μm [34].
The algorithms for calculating the IBD at 1 μm and 2 μm are defined as:
I B D ( 1   μ m ) = n = 0 n = 26 ( 1 R ( 790 + 20 n ) R c ( 790 + 20 n ) )
I B D ( 2   μ m ) = n = 0 n = 21 ( 1 R ( 1658 + 40 n ) R c ( 1658 + 40 n ) )
where R(λ) is the reflectance value at wavelength λ, Rc is the reflectance value after removing the continuum, 790 nm and 1658 nm are the calculated starting wavelength values, 20 and 40 are the spectral sampling intervals, n is the number of bands included in the absorption valley [30]. The IBD map was composited for the CE-5 sample return region, in which the red channel is the IBD value at 1 μm, the green channel is the IBD value at 2 μm, and the blue channel is the reflectance value at 1.58 μm.

3. Results

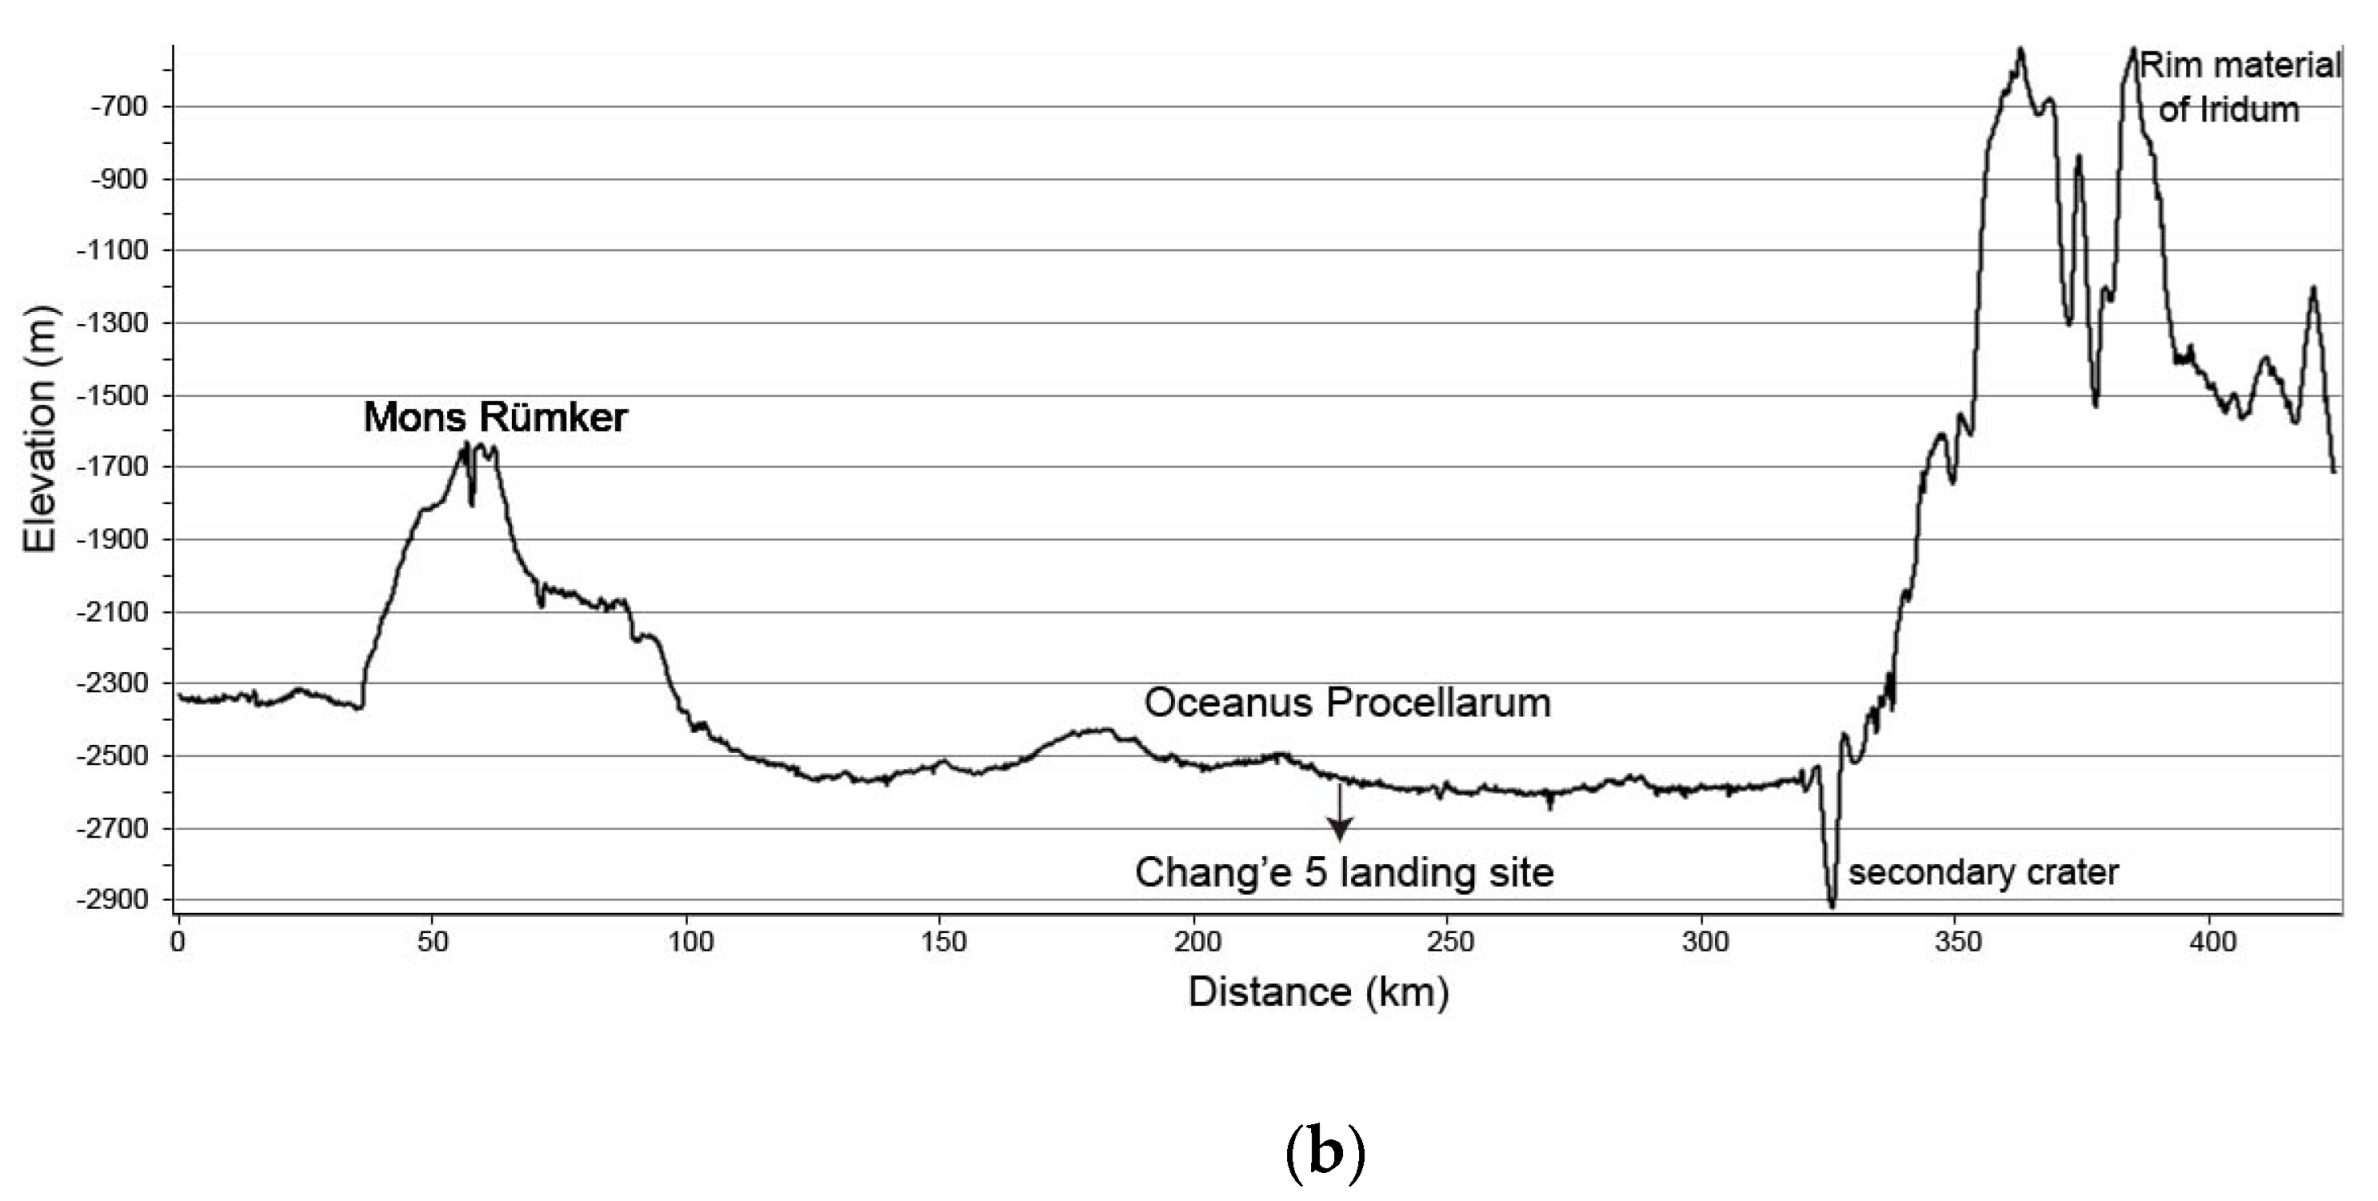
3.1. General Topography of CE-5 Sample Return Region

The CE-5 sample return region, located at the northern part of the Oceanus Procellarum is a relatively smooth mare plain unit (Figure 2a). The topographic relief range of the area is about 5.3 km (from ~−4.8 km to ~0.5 km). The minimum elevation is at the floor of Sharp A crater (~−4.8 km) and the average elevation is about 4.3 km. The most distinctive topographic feature on the mare units is the Mons Rümker that is about ~1 km above the surrounding mare. Besides the Mons Rümker, the most prominent topographic features in the study area are the wrinkle ridges and the sinuous rilles, and the most prominent topographic feature of the rim material of Iridum is the U-shaped craters. Some of the craters are secondary craters. The profile (Figure 2b) shows that the depth-to-diameter ratio is less than 0.2 (D = 5 km, depth = 0.7 km), which indicates that the rim-to-floor depth of crater A is shallower than the primary impact crater. This impact crater is elliptical and there are many similar shallow craters in the southeastern portion of the primary crater. Therefore, it is reasonable to infer that the crater near the mare unit may be a secondary crater.

3.2. Composition of the Study Area

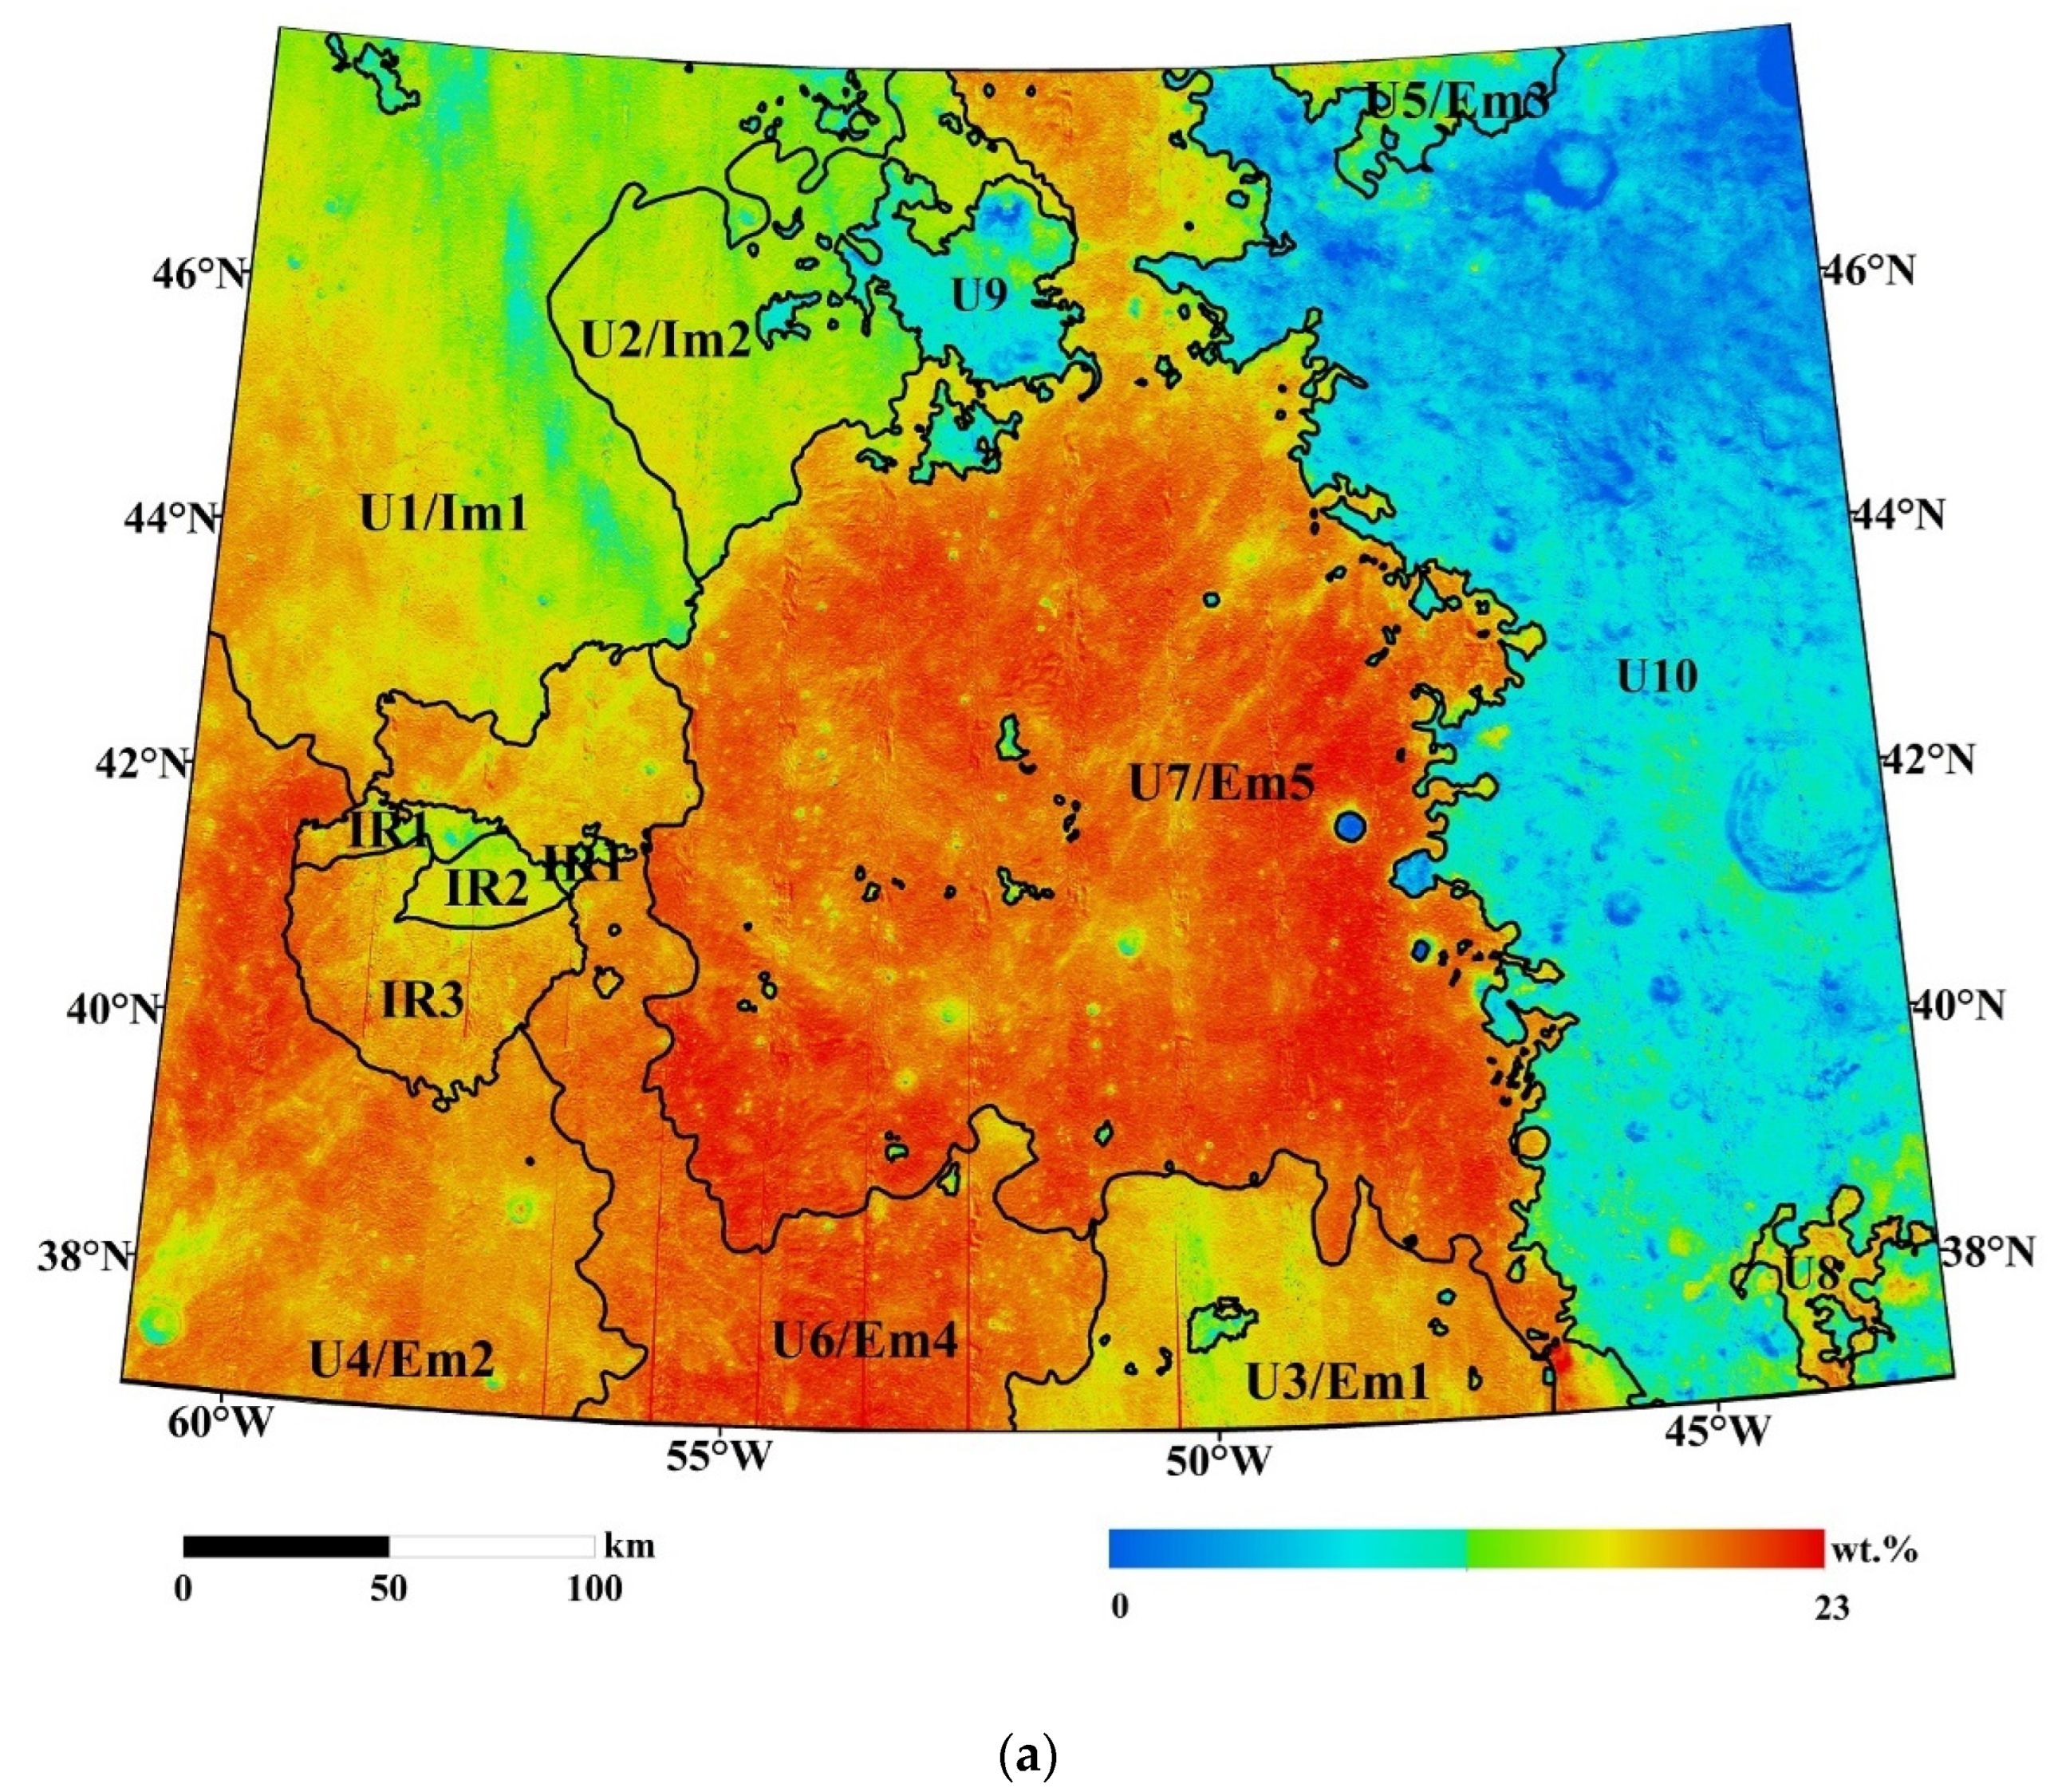
3.2.1. Chemical Composition

One of the main issues with the geological evolution of the CE-5 sample return region is the ages of the volcanic activity that occurred within the related mare units, which is composited of lunar basalts. Additionally, lunar basalts can be “characterized” by their iron and titanium content, and the content of FeO is usually higher than about 17 wt.% and the concentrations of TiO2 are usually higher than about 3 wt.% [35]. The content maps of FeO and TiO2 derived from the Kaguya MI data can cover the CE-5 sample region (Figure 3). The content maps of iron and titanium (Figure 3) show that the FeO and TiO2 contents in the mare units are obviously much higher than in the rim material of the Iridum crater. The concentration of FeO in the CE-5 sample return region is between 0 and 23 wt.% and the mean value of FeO is about 14.65 wt.%. The concentration of TiO2 in the CE-5 sample return region ranges between 0 and 9 wt.% and the mean value of TiO2 is about 2.42 wt.%. The basalts within northern Oceanus Procellarum are mainly high-iron and mid-titanium basalts, and the average content of FeO is nearly 16.11 wt.%, and the average content of TiO2 is nearly 3.24 wt.% (Table 1). The average contents of FeO and TiO2 in the rim material of the Iridum crater (Figure 3 U10) are 10.9 wt.% and 1.08 wt.%, respectively. Figure 3 shows that the rim material of the Iridum crater has the lowest TiO2 and FeO values. The FeO and TiO2 contents of the CE-5 sample return region in our study are consistent with those of Qian et al. [10]. The concentration of FeO and TiO2 also show regional variations in northwestern Oceanus Procellarum, indicating that there were different magmatic activities.

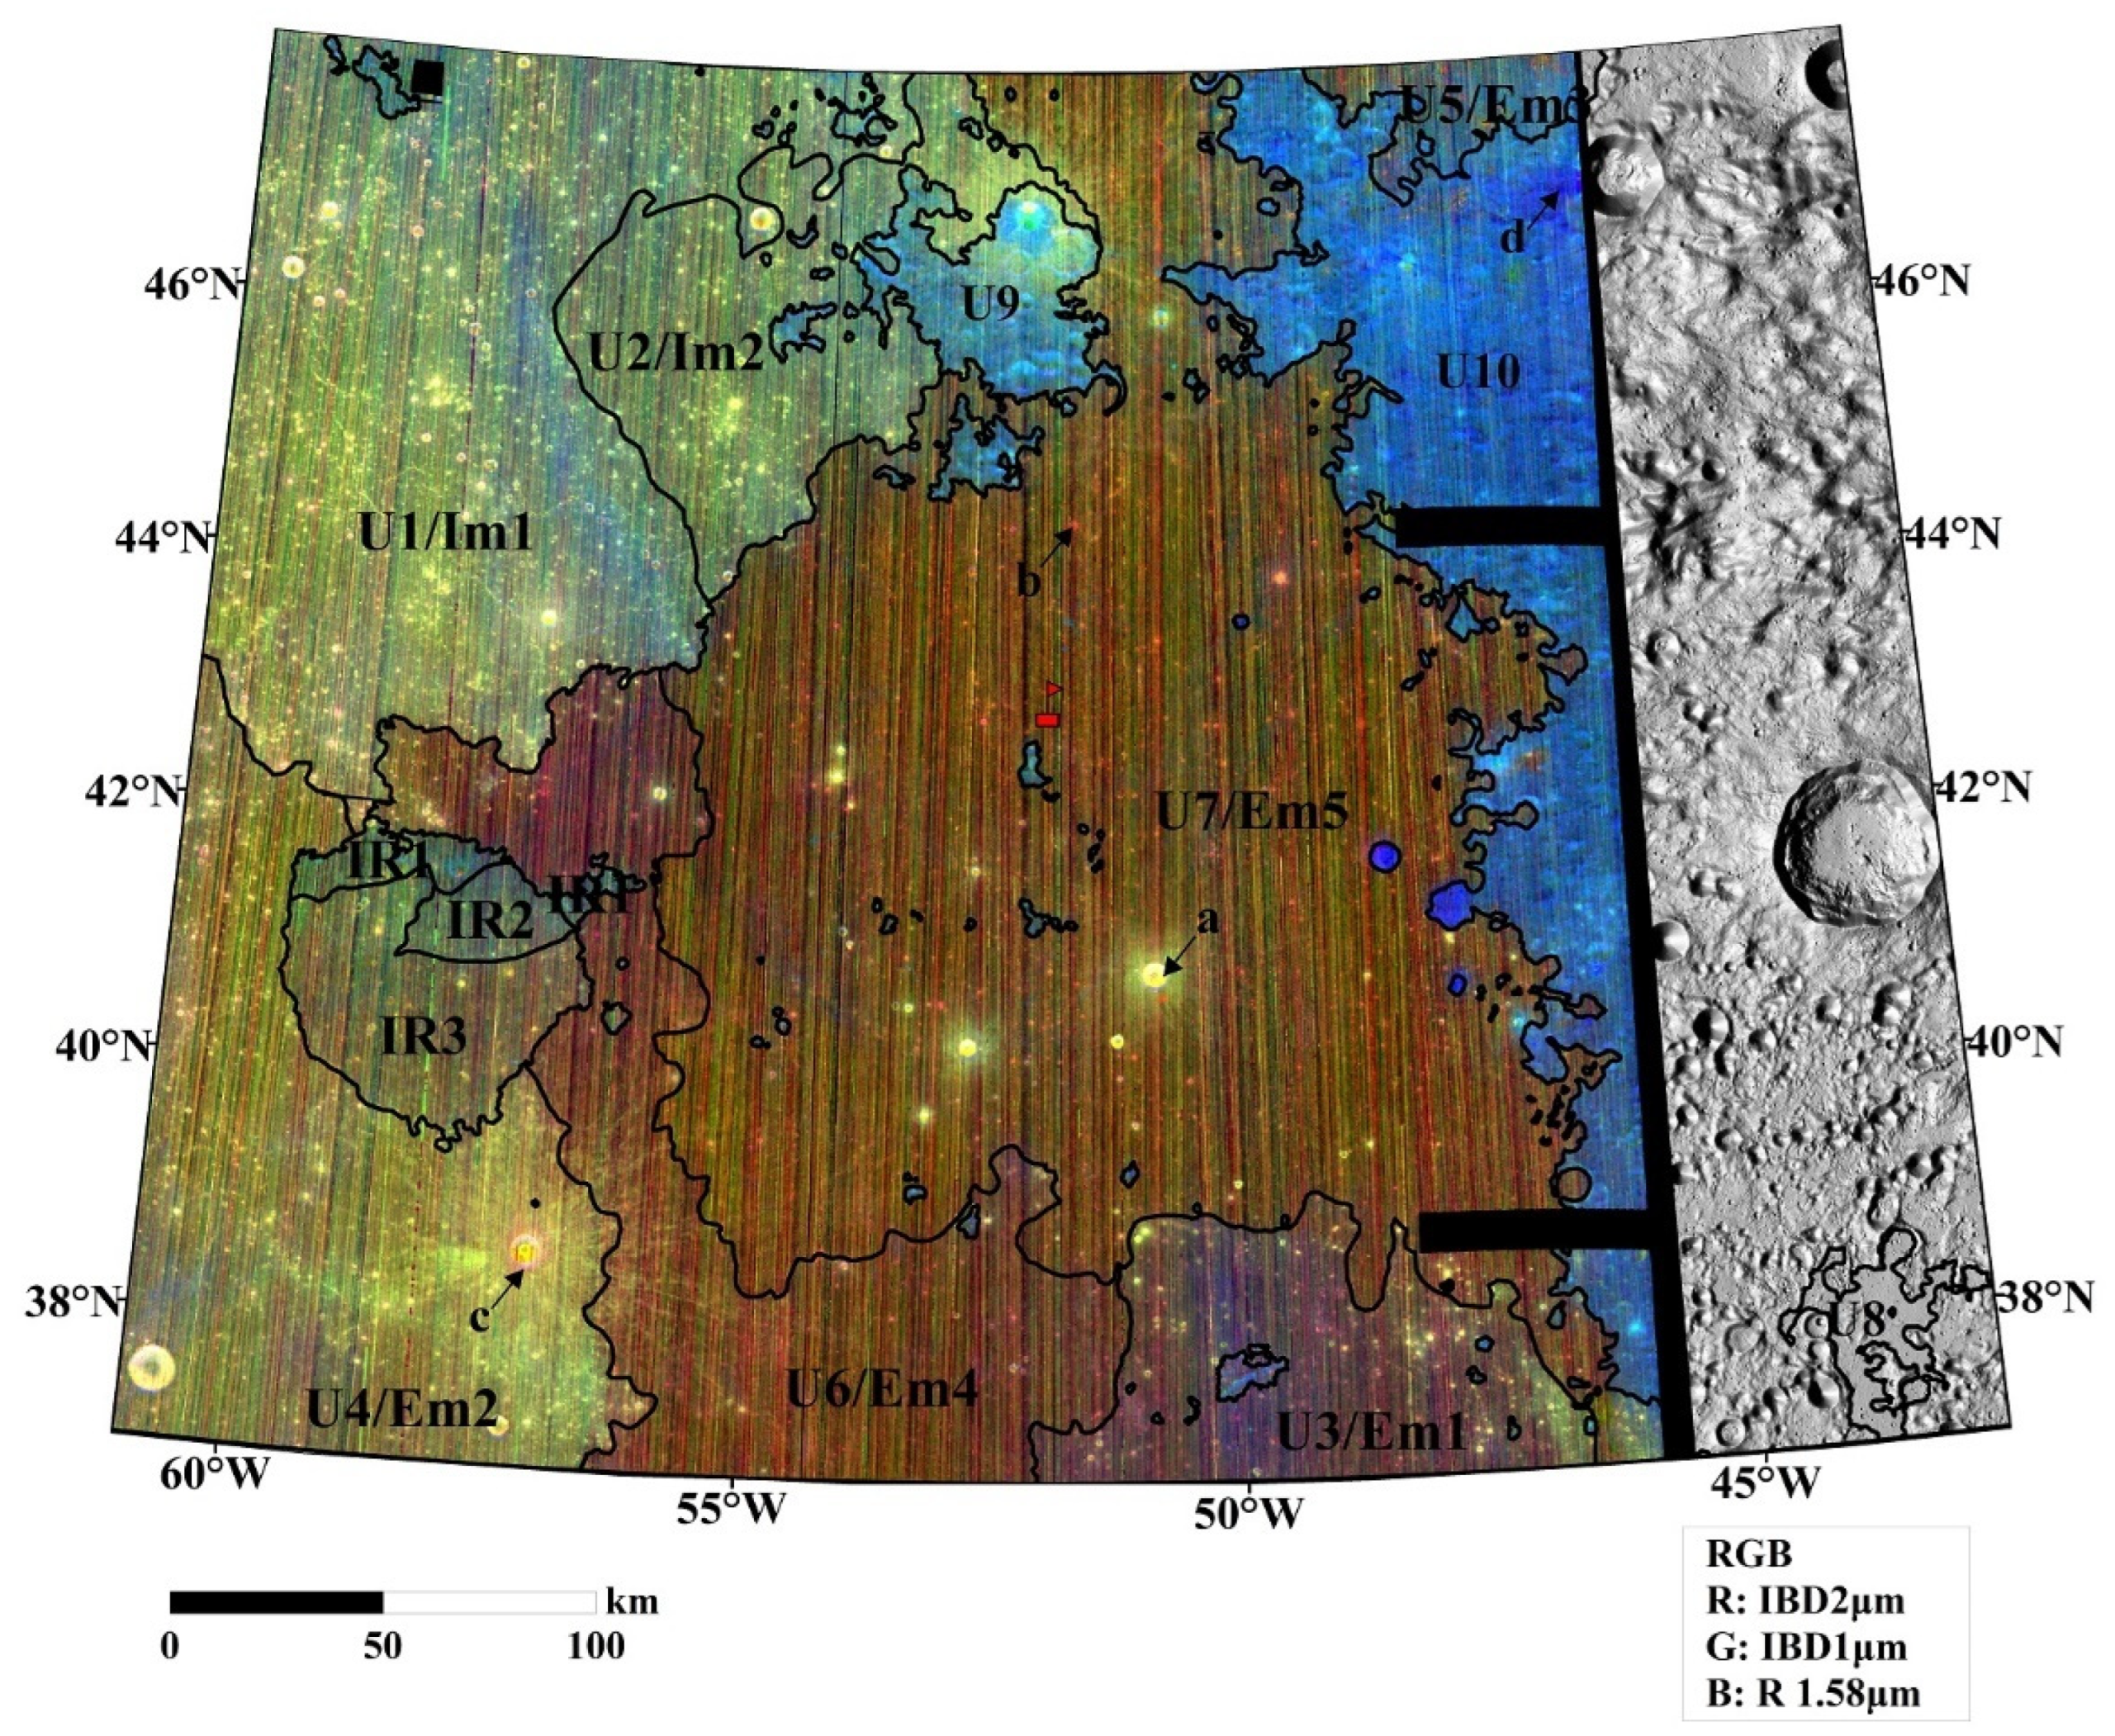
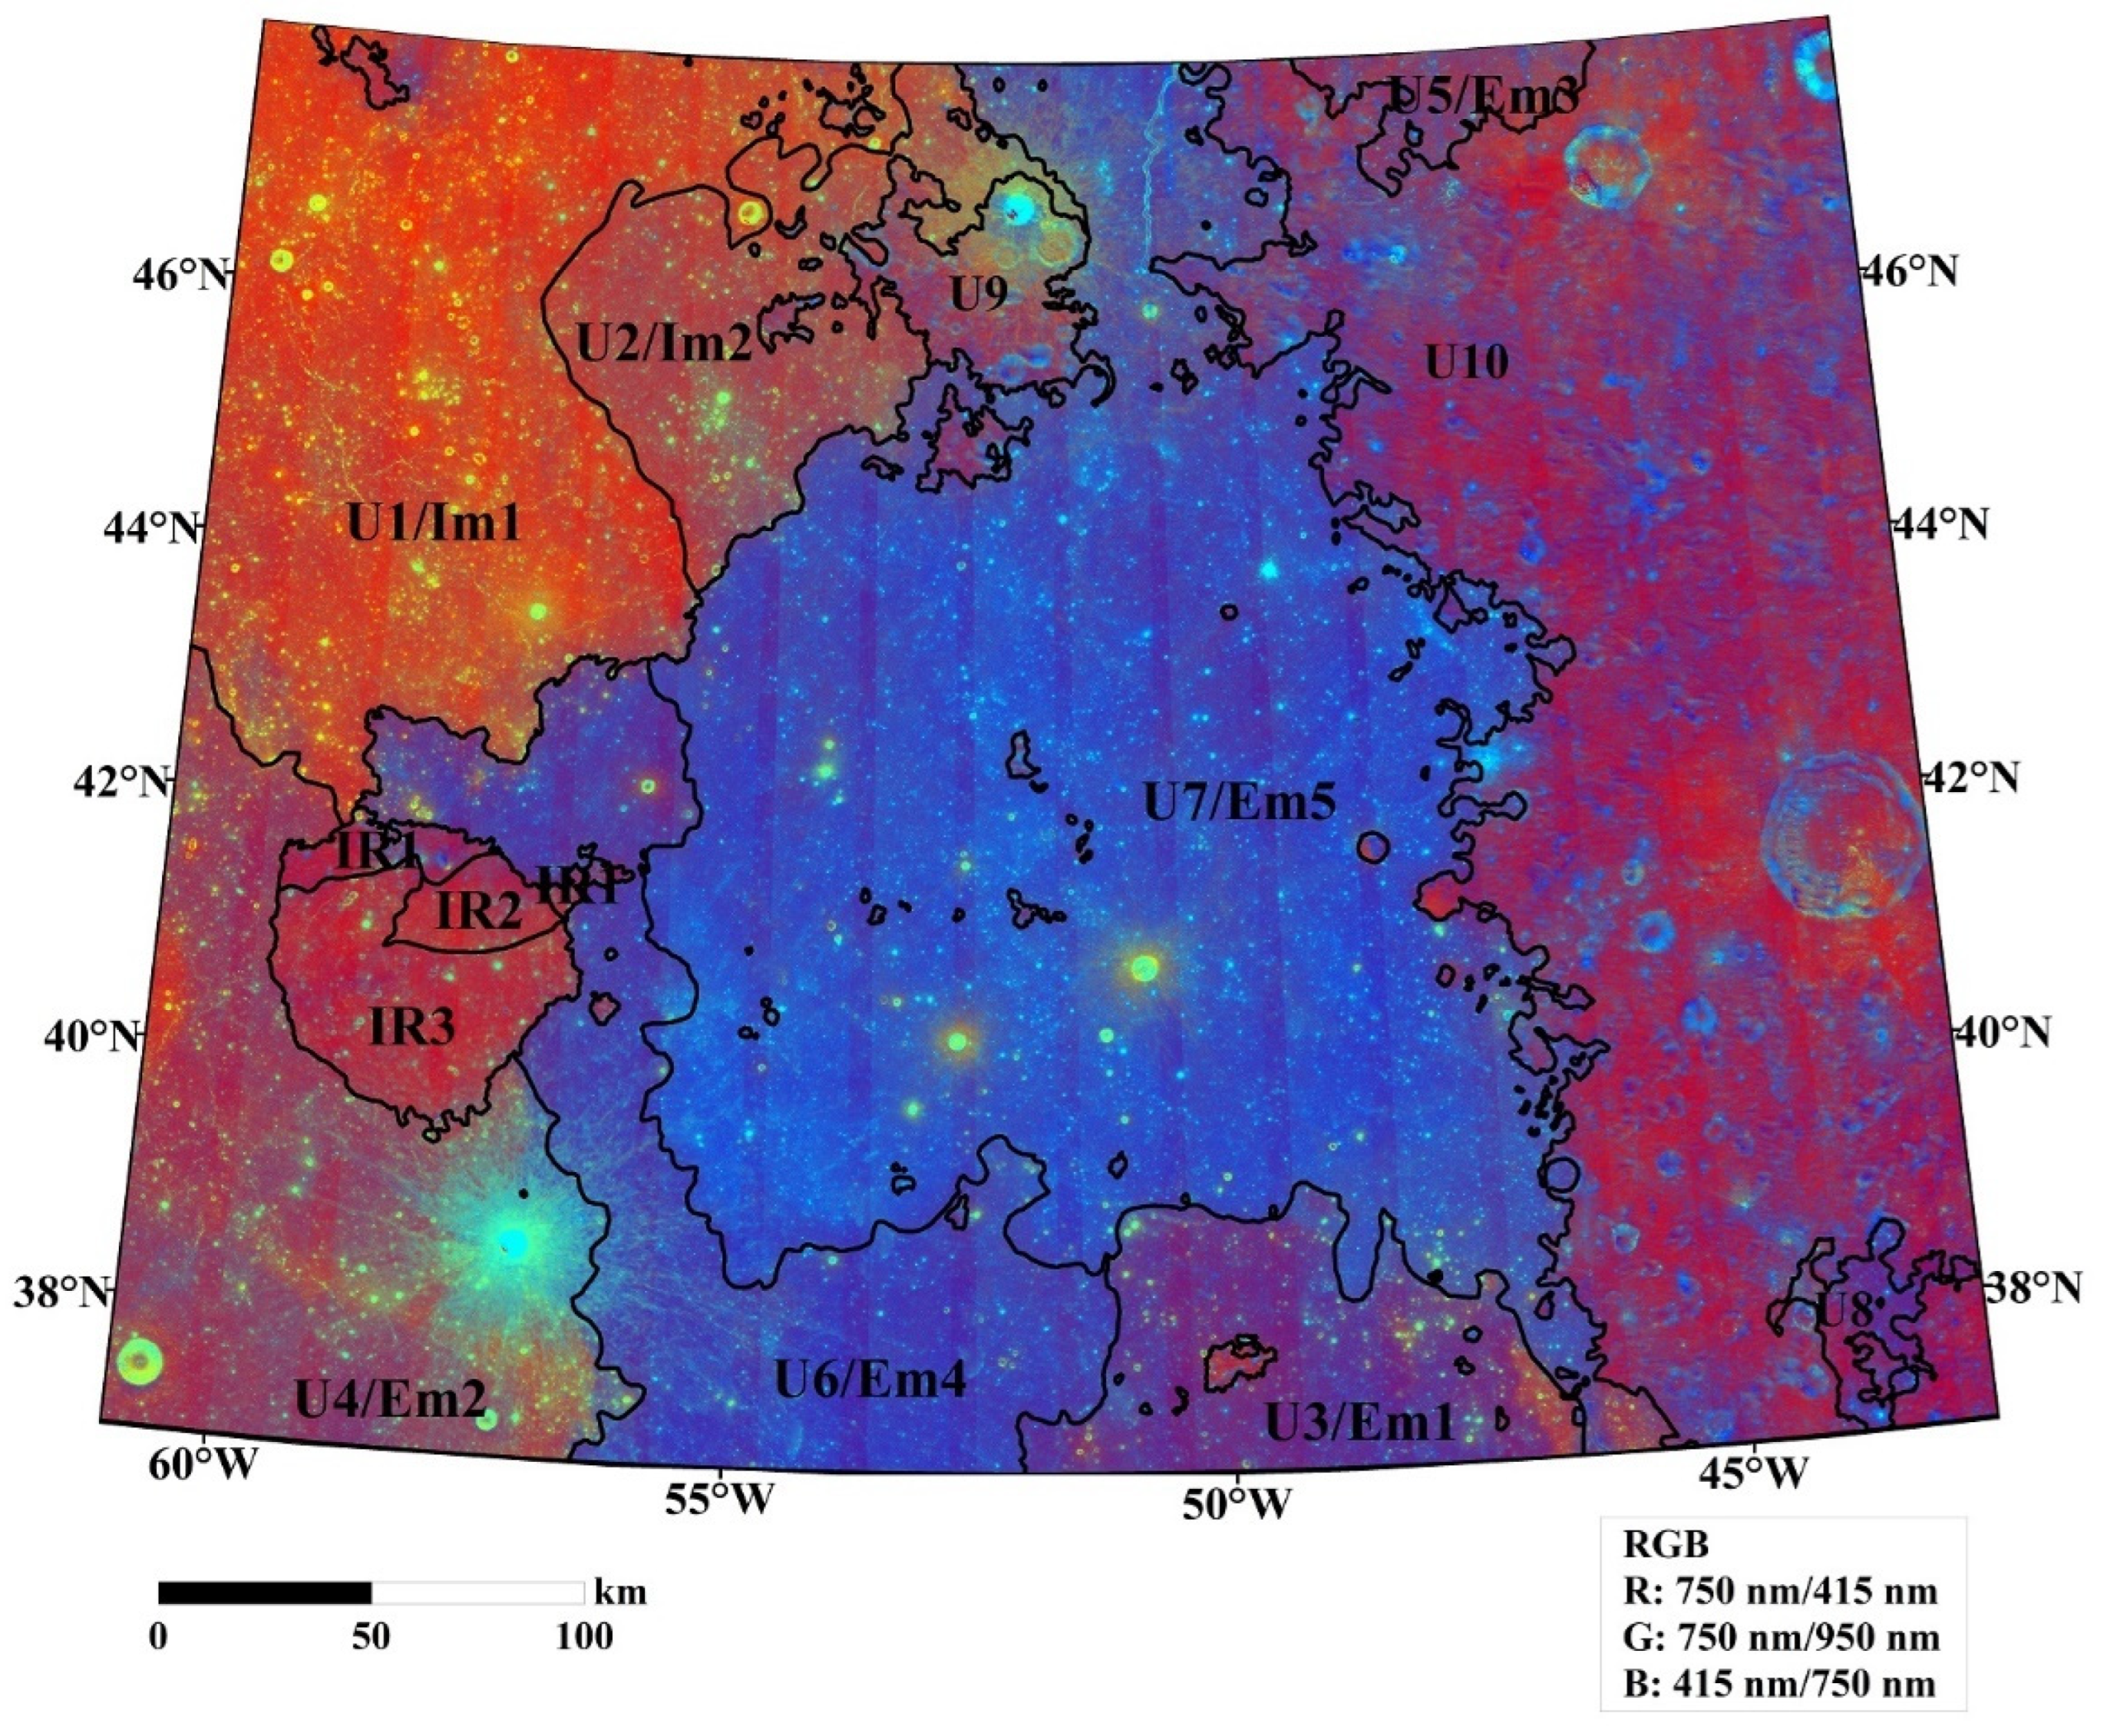
3.2.2. Mineralogy Composition

The major rock-formation minerals include plagioclase feldspar, pyroxene, olivine, ilmenite, and impact-generated glasses. Olivine and pyroxene exhibit strong absorption at 1 μm. However, olivine has a weak 2 μm absorption band and pyroxene has a strong absorption band at 2 μm. In our paper, we use the M3 reflectance to generate a color composition map (Figure 4), in which the red channel is the value of integrated band depth (IBD) at 1 μm, the green channel is the value of IBD at 2 μm, and blue channel represents the 1.58 μm reflectance value [30].
The color composition map of the CE-5 sample return region clearly shows that there are obvious differences between mare areas and the rim materials of the Iridum crater in the northeastern study area (Figure 4). The map shows that there are multiple mare units around the CE-5 landing area. The materials in the Mairan G crater (point a in Figure 4) display strong absorptions at 1 μm and 2 μm (Figure 5a), which indicates that the mineral is most likely fresh pyroxene materials. Additionally, the band center is at 1 μm, which indicates that the evidence of the existence of the compositions of high-Ca pyroxene and gabbroic materials. From the color change on the composite map, it can be seen that there are regional variations in mineral composition in the study area because the color on the composite map varies from yellow–green in the west to red-yellow in the middle and blue in the east. The fresh craters are yellow–green in the color composition map, indicating that the fresh pyroxene is the dominant material. The mare units (e.g., point b in Figure 4) exhibit relatively weak absorption characteristics at 1 μm and 2 μm, which indicates that the reddish materials are composed of mature pyroxene. Additionally, the possible reason for the relatively weak absorption characteristics may be the long-term space weathering [36]. The landing site of the CE-5 sample return mission is in the mare unit U7/Em5 (Figure 4), which displays reddish yellow color in the composition map, indicating that the samples returned by the CE-5 mission may be mature pyroxene. Moreover, the materials in the rim materials of the Iridum crater on the composite map (e.g., point d in Figure 4) are blue, indicating that the mineral is feldspathic materials.

3.3. Mare Units and Surface Age

3.3.1. Definition of Geological Units

Definition of geological units is a basic task that is very important for the determination of surface model ages. To obtain reliable ages of geological units with the method of crater size–frequency distributions requires the definition of homogeneous units [37]. There are color variations in the composite map of spectral ratios among different geological units. Hiesinger et al. [12] used the spectral ratios and albedo features to distinguish homogeneous units. Additionally, iron and titanium content are the main components of mare basalts, and their concentrations vary between different geological units. In this paper, multi-source data, including Kaguya MI false-color composite image, and TiO2, and FeO contents maps derived from MI, have been used to define regional homogeneous spectral units in northern Oceanus Procellarum. We used the color variations of the color ratio composites, and the content variations of TiO2 and FeO to define the geological units’ boundaries. Boundaries are displayed as black lines in Figure 3, Figure 4 and Figure 6. There are eleven geologic units defined and mapped, including eight mare units (U1–U8) and Rümker plateau units. Mons Rümker plateau units were defined and dated by Zhao et al. [14]. U8 is the Mare Imbrium basalt and U9 is part of the ejecta blanket of the Imbrium basin [38]. U10 is the rim material of the Iridum crater. The three geological units have not been investigated too closely in this study. Here, we calculate the MI model concentrations of FeO and TiO2 for the mare units in our study. The results are shown and discussed in the discussion part.

3.3.2. Surface Ages of the Mare Units in the CE-5 Region

In this study, we used the crater size–frequency distribution (CSFD) method based on mosaic images of the Kaguya TC Morning Map to ascertain the model ages of sub-mare units in north Oceanus Procellarum. The CE-5 sample return region is located in the middle latitudes, so the Lambert conformal projection was used in this area [39]. The Neukum crater production and chronology functions were used to fit the CSFD method. Additionally, the software “craterstats” and ArcGIS extension named “CraterTools” [40] were used to help date the ages of the study area. We have determined model ages for the seven mare units (Figure 7) and the results are shown in Table 2.
According to the lunar stratigraphy proposed by Stöffler and Ryder [41], the Imbrian represents the period from 3.85 Ga to 3.16 Ga, and the Eratosthenian period began from 3.16 Ga to 0.8 Ga [42]. Therefore, U1/Im1 and U2/Im2 are Imbrian mare units, and U3/Em1, U4/Em2, U5/Em3, U6/Em4, and U7/Em5 are Eratosthenian mare stratigraphic units. We defined the stratigraphic name of the mare units (Table 2). U1/Im1 is older than U2/Im2. U1/Im1(~3.36 Ga) is the oldest mare unit in the study area and contains five large craters (>3 km in diameter) and large wrinkle ridges in the study area. It is orange–red color in the false-color map (Figure 7). U2/Im2(~3.25 Ga) is near the U1/Im1 unit and dark reddish-purple in the false-color map (Figure 7). Moreover, the chemical composition and mineral composition of the U1/Im1 and U2/Im2 are close to each other. However, we still distinguish U1/Im1 from U2/Im2, because the boundary of U1/Im1 and U2/Im2 is visible in the false-color map (Figure 7). U3/Em1, U4/Em2, U5/Em3, U6/Em4, and U7/Em5 are Eratosthenian-aged units. U4/Em2 (~2.33 Ga) is bluish-purple in color and U5/Em3 (~1.94 Ga) is dark bluish-purple in the false-color map, the two mare units are very close in the content of FeO (Figure 3a). There are differences in the TiO2 concentration of the two units (Figure 3b) so that it can be defined the boundary of the mare units of U4/Em2 and U5/Em3. U4/Em2 has relatively higher FeO and TiO2 contents among the Eratosthenian units (Figure 3). U3/Em1 (~2.45 Ga) is reddish-purple in the false-color map (Figure 7). U6/Em4 (~1.39 Ga) and U7/Em5 (~1.22 Ga) are dark reddish-purple in the false-color map (Figure 7). The contents of FeO and TiO2 of the three mare units are relatively lower than Em2 and Em3 (Figure 3). IR1, IR2, and IR3 are Mons Rümker plateau units. The definition of the boundary of the three units adopted in this paper is based on Zhao, et al. [14].
Table 2 shows that the results of our study compared with previous results (Table 2) [11,13,37]. In general, the results in our study are in agreement with the results of Hiesinger et al. [37], Qian et al. [11], and Jia et al. [13]. Compared with the model ages of Hiesinger et al. [31], there is a little difference except for the mare unit U7/Em5. Compared with the model ages of Qian et al. [11], the age differences between the two results are less than 0.5 Ga. Compared with the absolute model ages of Jia et al. [13], the ages differences of U5/Em3 and U7/Em5 are about 0.7 Ga. The ages of the other mare units are very close to the results of Jia et al. [13].

4. Discussion

4.1. Volcanism in the CE-5 Landing Area

One of the main issues with the geological evolution of the CE-5 sample return region is the ages of the volcanic activities. The volcanic activities are volcanic domes, volcanic plains, and the lunar sinuous rilles in the CE-5 sample return region. We have dated the absolute model ages of the mare units. Here, we investigated and compared the mean contents of FeO and TiO2 for the geological units in the CE-5 sample return region (Table 3). For the mare units, the mean contents of FeO and TiO2 are gradually increased with the ages of mare units except for the Em3 unit. We should consider the possibility that the Em3 is not complete in the study area and the contents of FeO and TiO2 may be underestimated. The mean contents of FeO and TiO2 are most likely greater than 12.82 wt.% and 1.46 wt.%. In general, the mare basalts filled by earlier Imbrian-aged volcanic activities (U1/Im1 and U2/Im2) have lower iron and titanium content, while the mare basalts filled by the later Eratosthenian-aged volcanic activities (U3/Em1, U4/Em2, U6/Em4, and U7/Em5) contains higher iron and titanium content. Thus, the titanium contents are highly correlated with the ages of mare units in the CE-5 sample return region in our study. According to the definition of mare basalts by Giguere et al. [43], mare basalts are classified into five groups by TiO2 content, including “very low titanium”, “low-Ti”, “mid-Ti”, “high-Ti”, and “very high titanium” divided by the values of 1 wt.% TiO2, 4.5 wt.% TiO2, 7.5 wt.% TiO2, and 10 wt.% TiO2. The relationship between the titanium contents and ages of mare units reveals that volcanic activities have evolved from very low-titanium basalts to low-titanium basalts to mid-titanium basalts over time. Moreover, there is a similar relationship between the iron contents and the ages of the mare units in the Chang’e-5 study area.
The oldest feature in the CE-5 sample return region is the Mons Rümker plateau volcanic structure. Mons Rümker is divided into three geological units [14], which are all Imbrian-aged stratigraphic units shown in Table 1. IR1, IR2, and IR3 formed ~3.71 Ga, ~3.58 Ga, and ~3.51 Ga, respectively. From Table 2, it can be seen that the Mons Rümker is all low-titanium deposits. The mean TiO2 contents of the U4/Em2 unit are close to that of the Mons Rümker region and both are low—titanium deposits. Therefore, it can be reasonably inferred that the two units may be from the same magmatic source. Additionally, the formation of the Mons Rümker region is earlier than the U4/Em2 unit.
The FeO and TiO2 contents in the CE-5 landing site are 18.1 wt.% and 6.8 wt.%, respectively. In the geological unit U7/Em5 where the CE-5 probe landed, the average contents of FeO and TiO2 are 18.1 wt.% and 1.04 wt.%, respectively (Table 3). Many mixed materials are contaminated by the ejecta blankets and rays so that the mare basalts on the Moon are not all pure basalts. Kramer et al. [44] used Clementine and GRS data to identify high alumina basalts in Mare Moscoviense and Mare Nectaris. The aluminous nature indicates that the sources of the high alumina basalts contain plagioclase. Therefore, pure mare basalts and non-pure mare basalts can be distinguished by the Al2O3 abundance. The research in Kramer et al. [44] shows that there is a negative correlation between Al2O3 content and FeO content, and the FeO concentration of plagioclase highlands on the lunar surface is always lower than that of lunar mare basalts. Therefore, FeO content can be used instead of Al2O3 content to distinguish uncontaminated mare basalts from basalts and ejecta mixtures. Korovet et al. [45] analyzed the samples returned from Apollo and Luna and found that the FeO abundance of mare basalt ranged from 16 to 23 wt.%, while that of highland plagioclase ranged from 3 to 6.5 wt.%. Xu et al. [46] et al. determined the FeO abundance threshold of CE-5 landing unit to distinguish pure mare basalt and non-pure mare basalt, that is, 17.2 wt.%. In this paper, pure basalt and mixture are distinguished according to this threshold. It can be seen from Figure 8 that the FeO concentration at the landing site of CE-5 is high, greater than 17.2 wt.%, but there are non-pure basalt materials less than 17.2 wt.% in the surrounding area, which may be ejecta and rays from sharp B, Harding, Copernicus, and Aristarchus [46].
The youngest mare unit in the CE-5 sample return region is the U7/Em5 (~1.22 Ga) unit, which is the landing site region of the CE-5 sample return mission. The Em5 unit contains low-titanium, mid-titanium, and high-titanium basalts, indicating that this unit has experienced mare eruption activity more than once. The TiO2 contents of lunar basalts derived from the spectral data vary from ~0.5 wt.% to ~14 wt.% [47,48], which indicates that the mare basalts contain five types of basalts ranging from very low-titanium basalts to very high-titanium basalts. However, the analysis of samples of the Apollo and Luna mission reveals that the mid-titanium basalts are not present in the samples [49]. The CE-5 mission may return the samples of the medium-titanium basalts. Additionally, the longest sinuous rille on the Moon is Rima Sharp [10]. Rima Sharp originates from the Sinus Roris and is located on the surface of the Em5 unit near the landing site of the CE-5 sample return mission. The samples from the CE-5 mission may help us to understand the origins of Rima Sharp.

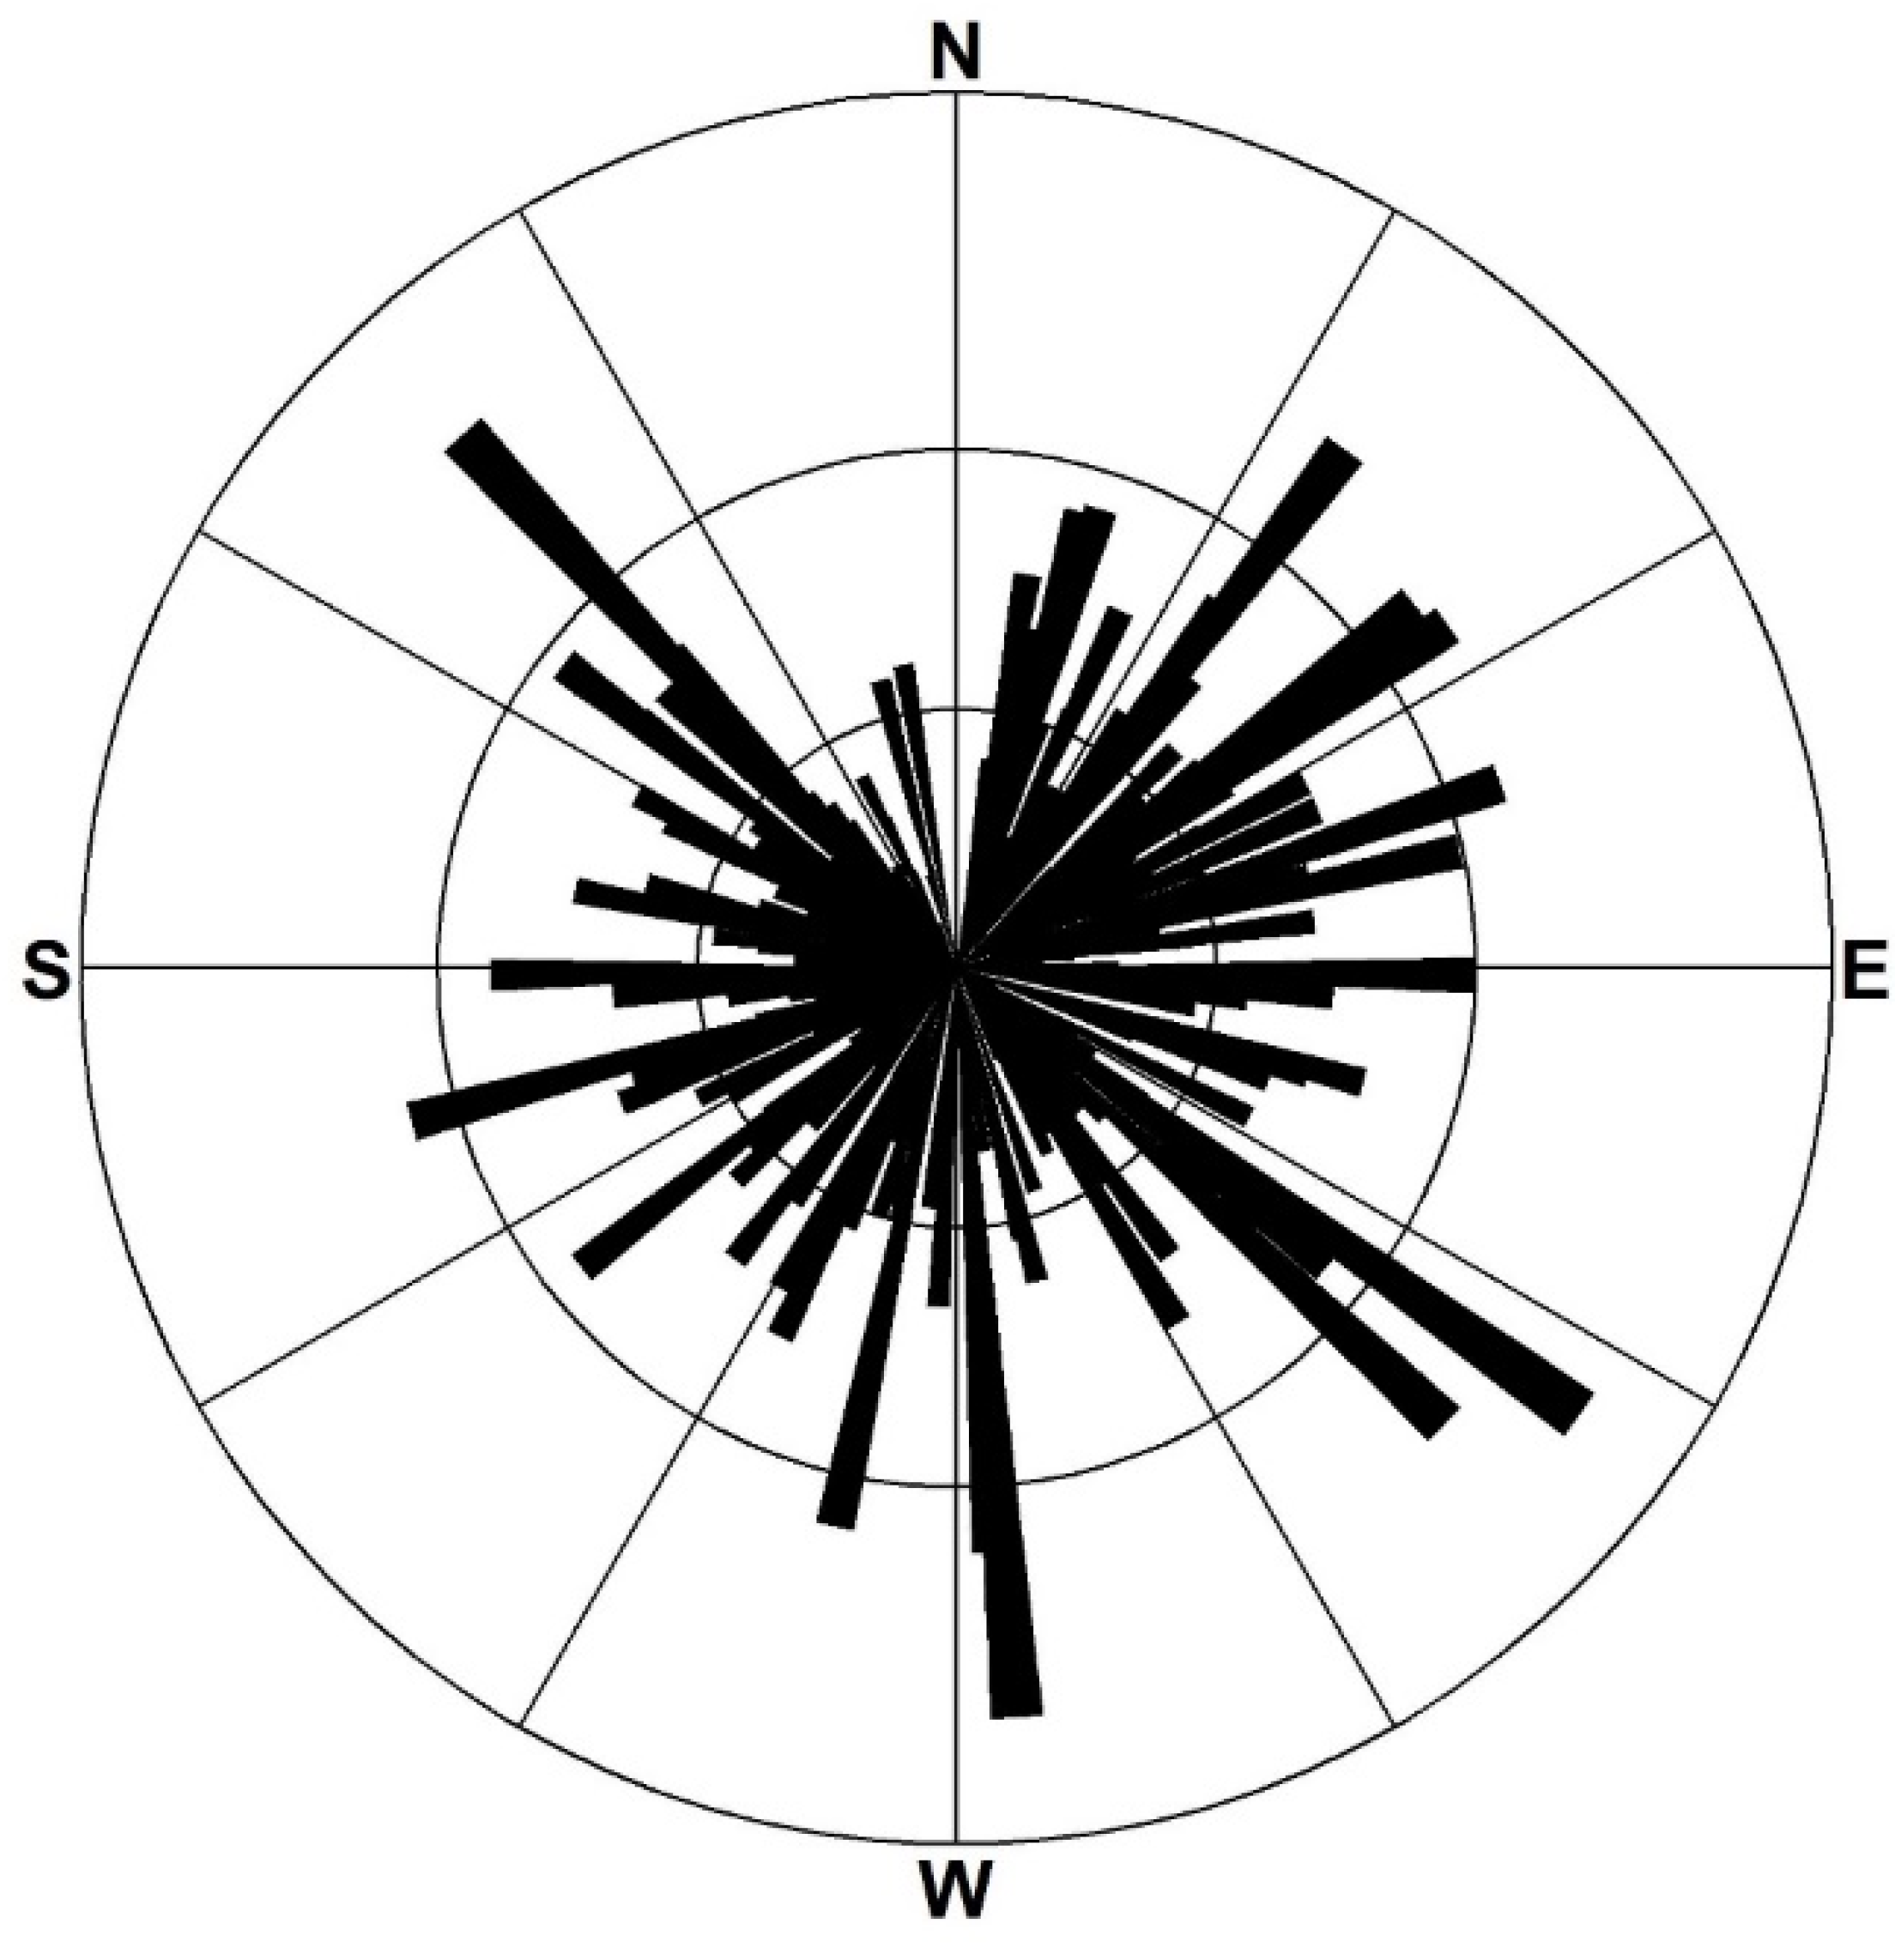
4.2. Tectonism in the CE-5 Sample Return Region

The typical tectonic landforms within the CE-5 sample return region are the wrinkle ridges. In our study, the TC images were used to identify the wrinkle ridges in the CE-5 sample return region. Additionally, the rose diagram weighted by the length of wrinkle ridges (Figure 9) indicates that the ridges have no preferred orientation. Yue et al. [50] used the CSFD method to date the lunar wrinkle ridges and the average model age of wrinkle ridges in Oceanus Procellarum is about 3.35 Ga. However, the CSFD method has uncertainties and inaccuracies when determining the ages of linear features (such as wrinkle ridges). The relationship between the wrinkle ridges cut by the small impact craters may be more effective to determine the model ages of the wrinkle ridges. According to the approach proposed by Moore et al. [51], if the ages of distorted craters are determined, the formation of wrinkle ridges that distorted these craters must postdate the formation of these craters [51]. Williams et al. [52] and Daket et al. [53] have used a similar approach to determine the ages of wrinkle ridges and lobated scraps [52,53] in Mare Frigoris and Mare Imbrium. Thus, we used this approach to determine the wrinkle ridges in the U7/Em5 unit (Figure S1 and S2) where the CE-5 sample return mission landed. When estimating the ages of deformed craters, we refer to the classification of crater morphologies of Moore et al. [51] (Figure S3). The Supplementary Materials (Figure S4) show that the model ages of the wrinkle ridges with distorted craters in the study area range from ~320 Ma–3.2 Ga. The youngest model age of the distorted crater is ~320 Ma and the wrinkle ridge which distorts this crater must postdate the formation of the craters. Therefore, it is speculated that the youngest wrinkle ridge in the U7/Em5 formed recently ~320 Ma. While the age of the oldest wrinkle ridges is between 1 Ga and 3.2 Ga their exact age cannot be determined precisely. Recent studies on the origin of wrinkled ridges show that the formation of wrinkled ridges is related to tectonic activities. The local stress generated by mare basalts filling formed the wrinkle ridges [15,54,55].

5. Conclusions

Detailed analyses of the CE-5 sample return region (36.9°–48.0°N, 42.7°–61.0°W) allow us to map the mare units. The determination of the absolute model ages makes it easy to determine the time series of the major volcanic activities in the study region.
After the formation of the Imbrium basin (~3.85 Ga), the impact event of the Iridum crater occurred and the rim materials of the Iridum crater (U10) were formed during the excavation stage. The mineral of the rim material of the Iridum crater is feldspathic materials, which have the lowest TiO2 and FeO abundances. During the period of Late Imbrian, the Mons Rümker plateau unit formed (~3.7 Ga), the chemical compositions of which are all low-titanium deposits. Then, the volcanism and tectonism occurred and formed multi-stage basalts with different ages.
The oldest mare unit in the CE-5 sample return region is the U1/Im1, which has the age of Late Imbrian age of ~3.36 Ga. The mean contents of FeO and TiO2 of U1/Im1 are 14.7 wt.% and 0.99 wt.%, respectively. Additionally, the youngest volcanic mare basalts in the CE-5 sample return region are concentrated in the unit U7/Em5 and have Eratosthenian age of ~1.22 Ga. The mean contents of FeO and TiO2 of U7/Em5 are 16.85 wt.% and 4.66 wt.%, respectively. Therefore, it is reasonable to speculate on the relationship between titanium contents and ages of mare units that volcanic activity evolved from very low titanium basalt levels to medium titanium basalt levels over time. The determination of the ages of the mare units in the CE-5 sample return region suggests that the study area has experienced long and complex magmatic activities (~3.36 Ga to ~1.22 Ga) and formed multiple mare units with different chemical and mineral compositions. In our study, we determined the age of the youngest wrinkle ridge that may have formed as recently as ~320 Ma using the approach of the relationship between the wrinkle ridges cut by small impact craters.
Analyses of the chemical and mineral composition of the unit U7/Em5 show that the basalts of U7/Em5 are mainly high-iron and mid-titanium basalts. Additionally, the FeO and TiO2 contents in the CE-5 landing site are 18.1 wt.% and 6.8 wt.%, respectively. The mineralogy of the samples from the Chang’e-5 mission may be mature pyroxene that contains the ejecta and ray materials of young craters, including sharp B, Harding, Copernicus, and Aristarchus.

Supplementary Materials

The following are available online at https://www.mdpi.com/article/10.3390/rs13224679/s1, Figure S1: Kaguya TC mosaic showing the location of the distorted craters in the Em5 unit, Figure S2: Kaguya TC images of distorted craters and their respective topographic profile using TC DTM data, Figure S3: Relation among craters diameter, their morphologies and relative ages, adapted from Moore et al., 1980, Figure S4: Age estimation of small craters on the lunar surface after Moore et al., 1980, Table S1: Model age of the distorted craters in the Em5 unit.

Author Contributions

Conceptualization, J.D. and W.C.; methodology, J.D. and W.C.; software, J.D. and Y.J; formal analysis, J.D.; writing—original draft preparation, J.D.; writing—review and editing, J.D., W.C., Y.J., J.L. and J.C.; visualization, J.D.; supervision, J.D., W.C. and B.W. All authors have read and agreed to the published version of the manuscript.

Funding

This research was funded by the B-type Strategic Priority Program of the Chinese Academy of Sciences, grant No. XDB41000000, National Natural Science Foundation of China, No. 42130110, National Natural Science Foundation of China, grant No. 41571388, and the Key projects of national basic work of science and technology, grant No. 2015FY210500.

Institutional Review Board Statement

Not applicable.

Informed Consent Statement

Not applicable.

Data Availability Statement

The Kaguya TC Morning Map data, TC DTM data, and Multiband Imager (MI) data are archived in the SELENE Data Archive at http://darts.isas.jaxa.jp/planet/pdap/selene/ (accessed on 18 February 2021). The M3 Level 2 data are downloaded from Lunar Orbital Data Explorer at https://ode.rsl.wustl.edu/moon/ (accessed on 4 February 2021).

Acknowledgments

The authors gratefully acknowledge all those who worked on the SELENE Data Archive and the Planetary Data System archive. The authors also thank the anonymous reviewers and the editor for their useful comments and suggestions on this paper.

Conflicts of Interest

The authors declare no conflict of interest.

References

  1. Wang, J.; Zhang, Y.; Di, K.; Chen, M.; Duan, J.; Kong, J.; Xie, J.; Liu, Z.; Wan, W.; Rong, Z.; et al. Localization of the Chang’e-5 lander using Radio-Tracking and Image-Based methods. Remote Sens. 2021, 13, 590. [Google Scholar] [CrossRef]
  2. Qiao, L.; Chen, J.; Xu, L.; Wan, S.; Cao, H.; Li, B.; Ling, Z. Geology of the Chang’e-5 landing site: Constraints on the sources of samples returned from a young nearside mare. Icarus 2021, 364, 114480. [Google Scholar] [CrossRef]
  3. Turkevich, A.L.; Franzgrote, E.J.; Patterson, J.H. Chemical analysis of the moon at the surveyor V landing site. Science 1967, 158, 635–637. [Google Scholar] [CrossRef] [PubMed]
  4. Reeves, R. Exploring the moon. In The Superpower Space Race: An Explosive Rivalry through the Solar System; Springer: Boston, MA, USA, 1994; pp. 101–130. [Google Scholar]
  5. Turkevich, A.L. Comparison of the analytical results from the surveyor, Apollo, and Luna missions. Earth Moon Planets 1972, 5, 411–421. [Google Scholar] [CrossRef]
  6. Liu, J.; Zeng, X.; Li, C.; Ren, X.; Yan, W.; Tan, X.; Zhang, X.; Chen, W.; Zuo, W.; Liu, Y.; et al. Landing site selection and overview of China’s lunar landing missions. Space Sci. Rev. 2021, 217, 1–25. [Google Scholar] [CrossRef]
  7. Li, C.; Liu, D.; Liu, B.; Ren, X.; Liu, J.; He, Z.; Zuo, W.; Zeng, X.; Xu, R.; Tan, X.; et al. Chang’E-4 initial spectroscopic identification of lunar far-side mantle-derived materials. Nat. Cell Biol. 2019, 569, 378–382. [Google Scholar] [CrossRef]
  8. Xiao, L.; Zhu, P.; Fang, G.; Xiao, Z.; Zou, Y.; Zhao, J.; Zhao, N.; Yuan, Y.; Qiao, L.; Zhang, X.; et al. A young multilayered terrane of the northern Mare Imbrium revealed by Chang’E-3 mission. Science 2015, 347, 1226–1229. [Google Scholar] [CrossRef]
  9. Jolliff, B.L.; Gillis, J.J.; Haskin, L.A.; Korotev, R.L.; Wieczorek, M. Major lunar crustal terranes: Surface expressions and crust-mantle origins. J. Geophys. Res. Space Phys. 2000, 105, 4197–4216. [Google Scholar] [CrossRef] [Green Version]
  10. Qian, Y.; Xiao, L.; Head, J.W.; van der Bogert, C.H.; Hiesinger, H.; Wilson, L. Young lunar mare basalts in the Chang’e-5 sample return region, northern Oceanus Procellarum. Earth Planet. Sci. Lett. 2021, 555, 116702. [Google Scholar] [CrossRef]
  11. Qian, Y.Q.; Xiao, L.; Zhao, S.Y.; Zhao, J.N.; Huang, J.; Flahaut, J.; Martinot, M.; Head, J.W.; Hiesinger, H.; Wang, G.X. Geology and Scientific Significance of the Rümker Region in Northern Oceanus Procellarum: China’s Chang’E-5 landing region. J. Geophys. Res. Planets 2018, 123, 1407–1430. [Google Scholar] [CrossRef] [Green Version]
  12. Hiesinger, H.; Head, J.W.; Wolf, U.; Jaumann, R.; Neukum, G. Ages and stratigraphy of lunar mare basalts in Mare Frigoris and other nearside maria based on crater size-frequency distribution measurements. J. Geophys. Res. Space Phys. 2010, 115, 115. [Google Scholar] [CrossRef] [Green Version]
  13. Jia, M.; Yue, Z.; Di, K.; Liu, B.; Liu, J.; Michael, G. A catalogue of impact craters larger than 200 m and surface age analysis in the Chang’e-5 landing area. Earth Planet. Sci. Lett. 2020, 541, 116272. [Google Scholar] [CrossRef]
  14. Zhao, J.; Xiao, L.; Qiao, L.; Glotch, T.D.; Huang, Q. The mons rümker volcanic complex of the moon: A candidate landing site for the Chang’E-5 mission. J. Geophys. Res. Planets 2017, 122, 1419–1442. [Google Scholar] [CrossRef]
  15. Yue, Z.; Li, W.; Di, K.; Liu, Z.; Liu, J. Global mapping and analysis of lunar wrinkle ridges. J. Geophys. Res. Planets 2015, 120, 978–994. [Google Scholar] [CrossRef] [Green Version]
  16. Hurwitz, D.M.; Head, J.W.; Hiesinger, H. Lunar sinuous rilles: Distribution, characteristics, and implications for their origin. Planet. Space Sci. 2013, 79–80, 1–38. [Google Scholar] [CrossRef]
  17. Hulme, G. A review of lava flow processes related to the formation of lunar sinuous rilles. Surv. Geophys. 1982, 5, 245–279. [Google Scholar] [CrossRef]
  18. Whitford-Stark, J.L.; Head, J.W. The Procellarum volcanic complexes-Contrasting styles of volcanism. In Lunar and Planetary Science Conference Proceedings; Lunar and Planetary Institute: Houston, TX, USA, 1977. [Google Scholar]
  19. Gong, S.; Wieczorek, M.A.; Nimmo, F.; Kiefer, W.; Head, J.W.; Huang, C.; Smith, D.E.; Zuber, M.T. Thicknesses of mare basalts on the Moon from gravity and topography. J. Geophys. Res. Planets 2016, 121, 854–870. [Google Scholar] [CrossRef]
  20. Haruyama, J.; Matsunaga, T.; Ohtake, M.; Morota, T.; Honda, C.; Yokota, Y.; Torii, M.; Ogawa, Y. LISM Working group global lunar-surface mapping experiment using the Lunar Imager/Spectrometer on SELENE. Earth Planets Space 2008, 60, 243–255. [Google Scholar] [CrossRef] [Green Version]
  21. Boardman, J.W.; Pieters, C.M.; Green, R.O.; Lundeen, S.R.; Varanasi, P.; Nettles, J.; Petro, N.; Isaacson, P.; Besse, S.; Taylor, L.A. Measuring moonlight: An overview of the spatial properties, lunar coverage, selenolocation, and related Level 1B products of the Moon Mineralogy Mapper. J. Geophys. Res. Space Phys. 2011, 116. [Google Scholar] [CrossRef] [Green Version]
  22. Green, R.O.; Pieters, C.; Mouroulis, P.; Eastwood, M.; Boardman, J.; Glavich, T.; Isaacson, P.; Annadurai, M.; Besse, S.; Barr, D.; et al. The Moon Mineralogy Mapper (M3) imaging spectrometer for lunar science: Instrument description, calibration, on-orbit measurements, science data calibration and on-orbit validation. J. Geophys. Res. Space Phys. 2011, 116. [Google Scholar] [CrossRef] [Green Version]
  23. Clark, R.N.; Pieters, C.M.; Green, R.O.; Boardman, J.W.; Petro, N.E. Thermal removal from near-infrared imaging spectroscopy data of the Moon. J. Geophys. Res. Space Phys. 2011, 116, 116. [Google Scholar] [CrossRef] [Green Version]
  24. Besse, S.; Sunshine, J.; Staid, M.; Boardman, J.; Pieters, C.; Guasqui, P.; Malaret, E.; McLaughlin, S.; Yokota, Y.; Li, J.-Y. A visible and near-infrared photometric correction for Moon Mineralogy Mapper (M3). Icarus 2013, 222, 229–242. [Google Scholar] [CrossRef]
  25. Lemelin, M.; Lucey, P.G.; Miljković, K.; Gaddis, L.R.; Hare, T.; Ohtake, M. The compositions of the lunar crust and upper mantle: Spectral analysis of the inner rings of lunar impact basins. Planet. Space Sci. 2019, 165, 230–243. [Google Scholar] [CrossRef]
  26. Otake, H.; Ohtake, M.; Hirata, N. Lunar iron and titanium abundance algorithms based on SELENE (Kaguya) Multiband Imager data. In Proceedings of the Lunar and Planetary Science Conference, Woodlands, TX, USA, 19–23 March 2012; p. 1905. [Google Scholar]
  27. Lemelin, M.; Lucey, P.G.; Song, E.; Taylor, G.J. Lunar central peak mineralogy and iron content using the Kaguya Multiband Imager: Reassessment of the compositional structure of the lunar crust. J. Geophys. Res. Planets 2015, 120, 869–887. [Google Scholar] [CrossRef]
  28. Pieters, C.M.; Staid, M.I.; Fischer, E.M.; Tompkins, S.; He, G. A sharper view of impact craters from clementine data. Science 1994, 266, 1844–1848. [Google Scholar] [CrossRef] [Green Version]
  29. Pieters, C.M.; Boardman, J.; Buratti, B.; Chatterjee, A.; Clark, R.; Glavich, T.; Green, R.; Head, J., III; Isaacson, P.; Malaret, E.J.C.S. The Moon mineralogy mapper (M3) on chandrayaan-1. Curr. Sci. 2009, 96, 500–505. [Google Scholar]
  30. Qiao, L.; Xiao, L.; Zhao, J.; Huang, Q.; Haruyama, J. Geological features and evolution history of Sinus Iridum, the Moon. Planet. Space Sci. 2014, 101, 37–52. [Google Scholar] [CrossRef]
  31. Besse, S.; Sunshine, J.M.; Staid, M.I.; Petro, N.E.; Boardman, J.W.; Green, R.O.; Head, J.W.; Isaacson, P.J.; Mustard, J.F.; Pieters, C.M. Compositional variability of the Marius Hills volcanic complex from the Moon Mineralogy Mapper (M3). J. Geophys. Res. Space Phys. 2011, 116. [Google Scholar] [CrossRef] [Green Version]
  32. Staid, M.I.; Pieters, C.M.; Besse, S.; Boardman, J.; Dhingra, D.; Green, R.; Head, J.W.; Isaacson, P.; Klima, R.; Kramer, G.; et al. The mineralogy of late stage lunar volcanism as observed by the Moon Mineralogy Mapper on Chandrayaan-1. J. Geophys. Res. Space Phys. 2011, 116. [Google Scholar] [CrossRef]
  33. Mustard, J.F.; Pieters, C.M.; Isaacson, P.J.; Head, J.W.; Besse, S.; Clark, R.N.; Klima, R.; Petro, N.; Staid, M.I.; Sunshine, J.; et al. Compositional diversity and geologic insights of the Aristarchus crater from Moon Mineralogy Mapper data. J. Geophys. Res. Space Phys. 2011, 116. [Google Scholar] [CrossRef] [Green Version]
  34. Cheek, L.C.; Hanna, K.L.D.; Pieters, C.M.; Head, J.W.; Whitten, J.L. The distribution and purity of anorthosite across the Orientale basin: New perspectives from Moon Mineralogy Mapper data. J. Geophys. Res. Planets 2013, 118, 1805–1820. [Google Scholar] [CrossRef]
  35. Taylor, G.J. Lunar Rocks; Cambridge University Press: Cambridge, UK, 1991. [Google Scholar]
  36. Pieters, C.M.; Fischer, E.M.; Rode, O.; Basu, A. Optical effects of space weathering: The role of the finest fraction. J. Geophys. Res. Space Phys. 1993, 98, 20817–20824. [Google Scholar] [CrossRef] [Green Version]
  37. Hiesinger, H.; Jaumann, R.; Neukum, G.; Head, J.W. Ages of mare basalts on the lunar nearside. J. Geophys. Res. Space Phys. 2000, 105, 29239–29275. [Google Scholar] [CrossRef]
  38. Page, N. (LAC-25) Geologic Map of the Cassini Quadrangle of the Moon; USGS: Reston, VA, USA, 1970. [Google Scholar] [CrossRef]
  39. Snyder, J.P. Map Projections--A Working Manual; US Government Printing Office: Washington, DC, USA, 1987; Volume 1395. [Google Scholar]
  40. Kneissl, T.; van Gasselt, S.; Neukum, G. Map-projection-independent crater size-frequency determination in GIS environments—New software tool for ArcGIS. Planet. Space Sci. 2011, 59, 1243–1254. [Google Scholar] [CrossRef]
  41. Stöffler, D.; Ryder, G. Stratigraphy and isotope ages of lunar geologic units: Chronological standard for the inner solar system. Space Sci. Rev. 2001, 96, 9–54. [Google Scholar] [CrossRef]
  42. Liu, J.; Guo, D. Lunar geological timescale. In Encyclopedia of Lunar Science; Springer: Singapore, 2018; pp. 1–3. [Google Scholar]
  43. Giguere, T.A.; Hawke, B.R.; Gillis-Davis, J.J.; Lemelin, M.; Boyce, J.M.; Trang, D.; Lawrence, S.J.; Stopar, J.D.; Campbell, B.A.; Gaddis, L.R.; et al. Volcanic Processes in the Gassendi Region of the Moon. J. Geophys. Res. Planets 2020, 125. [Google Scholar] [CrossRef]
  44. Kramer, G.Y.; Jolliff, B.L.; Neal, C.R. Distinguishing high-alumina mare basalts using Clementine UVVIS and Lunar Prospector GRS data: Mare Moscoviense and Mare Nectaris. J. Geophys. Res. Space Phys. 2008, 113, 113. [Google Scholar] [CrossRef]
  45. Korotev, R.L.; Jolliff, B.L.; Zeigler, R.A.; Gillis, J.J.; Haskin, L.A. Feldspathic lunar meteorites and their implications for compositional remote sensing of the lunar surface and the composition of the lunar crust. Geochim. et Cosmochim. Acta 2003, 67, 4895–4923. [Google Scholar] [CrossRef]
  46. Xu, Z.; Guo, D.; Liu, J. Maria basalts chronology of the Chang’E-5 sampling site. Remote. Sens. 2021, 13, 1515. [Google Scholar] [CrossRef]
  47. Lucey, P.G.; Blewett, D.T.; Jolliff, B.L. Lunar iron and titanium abundance algorithms based on final processing of Clementine ultraviolet-visible images. J. Geophys. Res. Space Phys. 2000, 105, 20297–20305. [Google Scholar] [CrossRef]
  48. Sato, H.; Robinson, M.S.; Lawrence, S.J.; Denevi, B.W.; Hapke, B.; Jolliff, B.L.; Hiesinger, H. Lunar mare TiO2 abundances estimated from UV/Vis reflectance. Icarus 2017, 296, 216–238. [Google Scholar] [CrossRef]
  49. Pieters, C. Mare basalt types on the front side of the moon-A summary of spectral reflectance data. In Proceedings of the Lunar and Planetary Science Conference Proceedings, Huston, TX, USA, 13–17 March 1978; pp. 2825–2849. [Google Scholar]
  50. Yue, Z.; Michael, G.; Di, K.; Liu, J. Global survey of lunar wrinkle ridge formation times. Earth Planet. Sci. Lett. 2017, 477, 14–20. [Google Scholar] [CrossRef]
  51. Moore, H.; Boyce, J.; Hahn, D. Small impact craters in the lunar regolith—Their morphologies, relative ages, and rates of formation. Moon Planets 1980, 23, 231–252. [Google Scholar] [CrossRef]
  52. Williams, N.; Iii, J.F.B.; Watters, T.R.; Banks, M.E.; Daud, K.; French, R.A. Evidence for recent and ancient faulting at Mare Frigoris and implications for lunar tectonic evolution. Icarus 2019, 326, 151–161. [Google Scholar] [CrossRef]
  53. Daket, Y.; Yamaji, A.; Sato, K.; Haruyama, J.; Morota, T.; Ohtake, M.; Matsunaga, T. Tectonic evolution of northwestern Imbrium of the Moon that lasted in the Copernican Period. Earth Planets Space 2016, 68, 68. [Google Scholar] [CrossRef] [Green Version]
  54. Watters, T.R.; Johnson, C.L. Lunar tectonics. Planet. Tecton. 2010, 11, 121–182. [Google Scholar]
  55. Watters, T.R.; Robinson, M.S.; Banks, M.E.; Tran, T.; Denevi, B. Recent extensional tectonics on the Moon revealed by the Lunar reconnaissance orbiter camera. Nat. Geosci. 2012, 5, 181–185. [Google Scholar] [CrossRef]
Figure 1. The context of the CE-5 samples return region. The background is a mosaic of TC morning data (10 m pixel size). The white outline represents the boundary of Oceanus Procellarum [3]. The wrinkle ridges are represented by black lines and the sinuous rilles are represented by red lines.
Remotesensing 13 04679 g001
Figure 2. (a) Topography map of the CE-5 sample return region (based on Kaguya TC DTM data). The white solid line denotes the position of the topographic profile; (b) Elevation profile from northwest to southeast (AA′) based on Kaguya TC DTM data.
Remotesensing 13 04679 g002aRemotesensing 13 04679 g002b
Figure 3. (a) The FeO content maps of the CE-5 sample return region based on the MI data. (b) The TiO2 abundance map of the CE-5 sample return region based on the MI data. The black lines outline compositional homogeneous units defined for northern Oceanus Procellarum.
Remotesensing 13 04679 g003aRemotesensing 13 04679 g003b
Figure 4. IBD map of the CE-5 landing area based on the M3 data. The red channel is the value of IBD at 1 μm, the green channel is the value of IBD at 2 μm, and the blue channel represents the 1.58 μm reflectance value.
Remotesensing 13 04679 g004
Figure 5. Spectra curve characteristics of typical compositions within the CE-5 sample return region. (a) The spectra of Fresh pyroxene and mature pyroxene material in Oceanus Procellarum mare basalts. (b) Feldspathic materials in rim materials of the Iridum crater.
Remotesensing 13 04679 g005
Figure 6. Kaguya MI false color composite image in CE-5 sample return region.
Remotesensing 13 04679 g006
Figure 7. The absolute model ages of the mare units in the CE-5 sample return region using the CSFD method.
Remotesensing 13 04679 g007
Figure 8. The pure basalt areas and non-pure basalt areas in the CE-5 sample return region.
Remotesensing 13 04679 g008
Figure 9. Rose diagram of wrinkle ridges weighted by the length in the CE-5 sample return region.
Remotesensing 13 04679 g009
Table 1. Mean content of FeO and TiO2.
UnitsFeO 1,2 (wt.%)TiO2 1,2 (wt.%)
Mare northern Oceanus Procellarum16.11 (1.46)3.24 (1.81)
The rim of the Iridum crater10.9 (1.63)1.08 (0.53)
1 Mean FeO and TiO2 contents. 2 The values in brackets for FeO and TiO2 indicate the standard deviation of each geological unit.
Table 2. Stratigraphic Units in the CE-5 area.
UnitsSurface Age (Ga)Error (Ga)StratigraphyHiesinger (2000)Qian (2018)Jia (2020)
U13.36+0.03/−0.03Im13.43.393.27
U23.25+0.04/−0.05Im23.43.163.23
U32.45+0.09/−0.09Em12.1 1.70
U42.33+0.13/−0.13Em2 2.30
U51.94+0.12/−0.12Em31.5 2.54
U61.39+0.07/−0.07Em4 1.512.07
U71.22+0.03/−0.03Em51.31.21
IR13.71 1+0.04/−0.05 1IR1
IR23.58 1+0.03/−0.04 1IR2
IR33.51 1+0.04/−0.06 1IR3
1 CSFD results by Zhao et al. [8].
Table 3. Mean content of FeO and TiO2 of mare units in the CE-5 sample return region.
Unit (wt.%)FeO 1,2 (wt.%)TiO2 1,2 (wt.%)
U1/Im114.70 (1.06)0.99 (0.35)
U2/Im214.43 (0.75)1.31 (0.37)
U3/Em115.88 (0.82)2.99 (0.67)
U4/Em216.66 (0.74)2.33 (0.59)
U5//Em312.82 (1.39)1.46 (0.55)
U6/Em416.82 (0.98)4.25 (1.03)
U7/Em516.85 (1.04)4.66 (1.25)
IR115.19 (1.14)1.95 (0.52)
IR215.01 (0.72)1.51 (0.38)
IR316.25 (0.74)1.85 (0.44)
1 Mean FeO and TiO2 contents. 2 The values in parentheses of FeO and TiO2 refer to standard deviation values of the mare units.
Publisher’s Note: MDPI stays neutral with regard to jurisdictional claims in published maps and institutional affiliations.

