Abstract
Wireless underground sensor networks (WUSN) consist of sensor nodes that are operated in the soil medium. To evaluate the signal attenuation law of WUSN nodes, in this study, a WUSN node signal transmission test platform was built in the laboratory. The signal intensity data of WUSN nodes under different experimental conditions were obtained by orthogonal test. The WUSN node signal attenuation model was established. The test results show that the transmission of WUSN node signals in the soil medium is seriously affected by soil moisture content, node burial depth, soil compactness, and horizontal distance between nodes. The R2 of the models was between 0.790 and 0.893, and the RMSE of the models was between 2.489 and 4.192 dbm. Then, the WUSN node signal attenuation model involving the four factors was established. The R2 and RMSE of the model were, respectively, 0.822 and 4.87 dbm. The WUSN node signal attenuation model established in this paper can facilitate WUSN node deployment.
1. Introduction
The acquisition of farmland soil parameter information is the focus of agricultural environmental information technology, and it is one of the key issues in the field of international agricultural science and technology research [1,2,3]. Temperature, humidity, and other types of sensors are buried in the soil [4]. The sensors are wired to data reading and wireless transceiver devices on the ground to achieve wired sensor network (WSN) communication in the underground soil [5,6]. However, these exposed communications devices affect farm machinery, and they are vulnerable to geological hazards or extreme weather conditions [7,8].
In recent years, wireless underground sensor network (WUSN) has made great progress in overcoming the shortcomings of traditional WSN, such as poor concealment and low reliability [9,10,11]. In WUSN, sensor devices equipped with wireless receiving and sending modules are buried in underground soil. The modules send and receive data wirelessly, having the characteristics of high reliability, large coverage, and easy upgrade [12,13,14,15]. Thus, WUSN has very broad application prospects, and it becomes an important research direction in agricultural environment monitoring information technology [16,17]. WUSN supports three different communication modes: underground to underground communication (UG2UG), underground to above-ground communication (UG2AG), and above-ground to underground communication (AG2UG). Figure 1 shows the communication structure of WUSN.
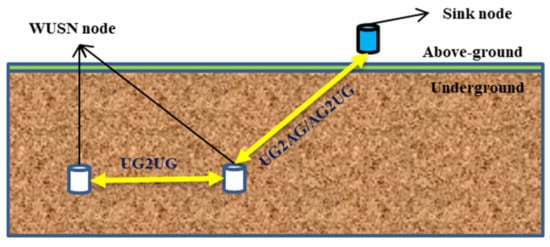
Figure 1.
WUSN communication structure.
In the application field of WUSN, researchers at home and abroad have carried out preliminary research [18,19,20,21,22]. The communication quality of sensor nodes in the soil is mainly affected by node emission frequency, soil type, antenna type, and other factors [23,24,25]. For example, when the soil moisture content increases from 9.5% to 37.3%, the communication distance of sensor nodes decreases by 70%, and the node burial depth needs to decrease from 35 cm to 15 cm. For AG2UG, the signal transmission distance increases by three times, while for UG2AG, the signal transmission distance only increases by 0.4 times [26]. The maximum transmission distance of UG2UG is 4–20 m, which mainly depends on the soil type. UG2AG can transmit 100–200 m [27], and WUSN with a radio frequency of 433 MHz is feasible in agricultural applications [28]. The parameters that are important to analyze the quality of soils include soil bulk density, soil macro and micronutrients, soil organic matter, pH level, soil water potential, pesticides, pathogens, and temperature [29,30]. In the transmission of WUSN node signals in underground soil, the signal strength is affected by the joint influence of multiple factors [31,32]. Among them, soil moisture content, node burial depth, soil compactness, and horizontal distance between nodes greatly reduce WUSN node signal intensity. Therefore, a mathematical model between signal strength and multiple soil factors is required to evaluate the transmission characteristics of WUSN node signals in the soil medium.
This work focuses on revealing WUSN transmission rules in soil medium. The purpose of this study is to (i) set up a soil test platform in the laboratory to investigate the received signal intensity of WUSN nodes under different conditions of soil moisture content, node burial depth, soil compactness, soil temperature, soil acidity and alkalinity, and horizontal distance between nodes; (ii) obtain the important factors affecting WUSN node signal transmission in soil medium; (iii) establish a mathematical model between the received signal intensity and important influencing factors, and take this model as the attenuation model of the WUSN node signal in soil medium.
2. Materials and Methods
This section describes materials and methods relevant to this study, including study site and test design, WUSN nodes, and soil test platform for node signal transmission tests.
2.1. Study Site and Experiment Design
The research site is located in Yangling District, Xianyang City, Shaanxi Province (108°07′E, 34°28′N, altitude 435–563 m). At this site, the annual precipitation is 635.1 to 663.9 mm, and the average annual temperature is 12.9 °C. It belongs to the warm temperate monsoon sub-humid climate. The soil type is typical Lou soil in the Guanzhong region, and the soil is fertile and suitable for the growth of a variety of crops [33,34].
The experiment settings in this study are as follows. The range of soil moisture content was 10–30%; the depth of nodes was 30–70 cm; the soil compactness was 0.5–4.5 kg/cm2; the soil acidity and alkalinity was 5–9; the soil temperature was 10–30 °C, and the level range between nodes was 10–90 cm. Meanwhile, nine levels were selected for all these six factors. In the underground transmission test of WUSN node signals, the WUSN node and sink node were arranged in a soil medium. Considering the experimental factors, the orthogonal test method was adopted for the test, and the received signal intensity data of the sink node were obtained under different test conditions. The orthogonal tests are shown in Table A1 of the Appendix A.
In this study, ferrous sulfate and industrial soda ash were used to regulate the acidity and alkalinity of the soil. Agilent N9912A (Agilent Technologies Inc., Santa Clara, CA, USA) handheld spectrum analyzer was used to detect the signal intensity of WUSN nodes, and a TJSD-750 soil compactness tester (Zhejiang Topu Yunnong Technology Co., Ltd., Hangzhou, China) was used to detect soil compactness. A Tr-3001 soil multi-parameter tester (Jinan Renzhi Measurement and Control Technology Co., Ltd., Jinan, China) was used to detect soil temperature, humidity, and acidity.
2.2. WUSN Node Design and Soil Test Platform Construction Method
The wireless underground sensor network node consists of a VSM-3000 soil moisture sensor (Shandong Weimengshi Technology Co., Ltd., Qingzhou City, China), an STC89C52 single-chip microcomputer, and an HC-12 radio frequency module (Guangzhou Huicheng Information Technology Co., Ltd., Guangzhou, China) that uses standard one-quarter wavelength unipole omnidirectional antenna and GFSK modulation [35,36]. In the design of the energy supply module, an external battery pack was used to supply power. The WUSN nodes need to be waterproof because the deep soil moisture is high. In the experiment, the WUSN nodes were packaged in waterproof plastic boxes, as shown in Figure 2.
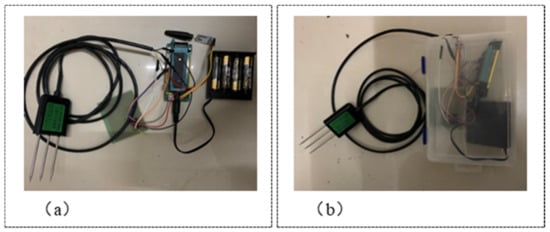
Figure 2.
WUSN nodes (a) before node encapsulation, and (b) after node encapsulation.
The composition of soil directly affects the signal transmission quality of WUSN nodes [37,38], but it is difficult to effectively test WUSN node communication due to the complexity and diversity of farmland soil parameters and the interference of many external factors. In this study, a soil test platform was built in the laboratory, and modulated soil was used to test WUSN node communication. The size of the soil test platform is 2.5 × 1 × 1.5 m, and the platform is made of copper and nickel metal electromagnetic shielding material. Therefore, the reflection generated by WUSN node signals inside the platform can be ignored. Since the shielding material is not waterproof, a layer of waterproof plastic covered the outside of the shielding material. The picture of the soil test platform is shown in Figure 3.
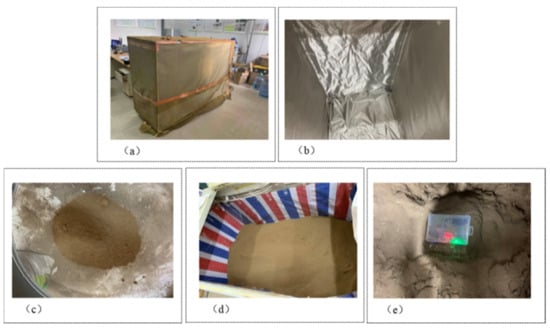
Figure 3.
The soil test platform: (a) outside the platform, (b) inside the platform, (c) sieve soil, (d) inside the platform after waterproof treatment, and (e) buried location of WUSN nodes.
The soil used in the experiment was taken from the underground of farmland in Yangling District with a depth of 30 cm to 70 cm. After natural air drying, the soil was sieved through a sieve with an aperture of 2 mm. According to particle size, the soil was divided into sand, silt, and clay particles [39]. The physical properties of the soil used for testing are listed in Table 1.

Table 1.
Basic physical properties of the soil for test.
When the WUSN node communication test was carried out on the soil test platform, the soil factors under test were adjusted according to the test scheme listed in Table A1. Among them, the soil moisture content was changed by adding pure water to the soil inside the platform and stirring evenly; the soil compactness was changed by pressing the soil surface inside the platform with heavy objects; the soil acidity and alkalinity were changed by adding ferrous sulfate or industrial soda to the soil inside the platform and stirring evenly; the soil temperature was changed by adding low temperature- or high temperature-treated soil to the soil inside the platform and stirring evenly. After the soil factors were adjusted, a WUSN node and a sink node were buried in the corresponding positions according to the test plan. The antennas of the two nodes were placed horizontally and parallel, and then the antenna end of the spectrum analyzer was buried in the antenna position of the sink node. To ensure the accuracy of detection data, the signal intensity value was evaluated three times at each position. The average of the three readings was calculated and taken as the signal strength at that location. Figure 4 shows the schematic diagram of the WUSN node communication test.
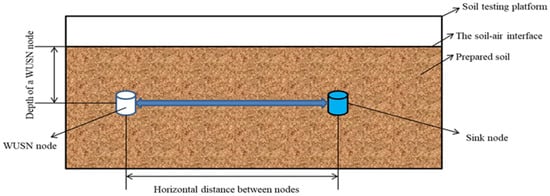
Figure 4.
Schematic diagram of WUSN node communication test on the soil test platform.
2.3. WUSN Node Signal Attenuation Model Establishment and Verification Method
2.3.1. Establishment of the WUSN Node Signal Attenuation Model
As soil factors are complex and diverse, and each factor has a certain effect on WUSN node signals [40,41,42]. Therefore, important soil factors need to be screened out to establish the signal attenuation model of WUSN nodes. The random forest algorithm has the advantages of simple implementation, high precision, and strong anti-over-fitting ability [43]. The schematic diagram of the random forest algorithm is shown in Figure 5. In this study, the random forest algorithm was adopted to determine the important factors for the received signal intensity of sink nodes, and the values of the experimental factor were obtained under different test conditions.
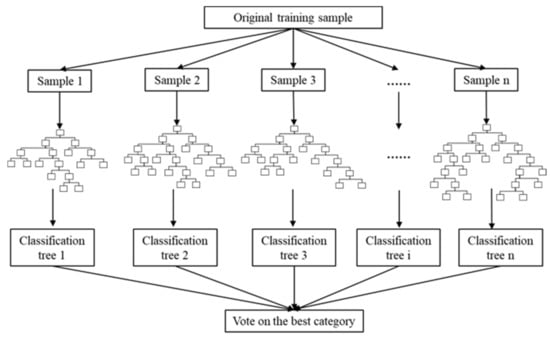
Figure 5.
Schematic diagram of random forest algorithm.
The process of using a random forest algorithm to estimate the importance of variables is as follows. If the size of the training set is N, n training samples (called the Bootstrapping method) are randomly selected from each training set and taken as the training set for the tree. If the total number of features in each training sample is M, given a maximum number of features m<<M, M feature subsets are randomly selected from M features. Each time the tree splits, the optimal feature is selected from these M features. Each tree grows to the maximum extent, and there is no pruning process. The generated multiple classification trees form a random forest. For each classification tree in the random forest, the corresponding out-of-bag (OOB) data is used to calculate its OOB data error, and the calculation result is denoted as errOOB1. Meanwhile, noise interference is added to feature X of all samples of OOB data outside the bag randomly so that the value of samples at feature X can be randomly changed. The out-of-bag data error of the classification tree is calculated again, and the calculation result is denoted as errOOB2. Assuming that there are n trees in the random forest, the importance score for feature X can be represented as ∑(errOOB2-errOOB1)/N. The higher the importance score of feature X, the higher the importance of the feature. In this paper, the random forest TreeBagger function of MATLAB software was used for training. The size of the training set was 81; the maximum number of features was set as the square rounding of the total number of features in each training sample; the number of classification trees was set to 100, and other parameters were set as default. The k-fold cross-validation method was used to evaluate the training effect of the model.
The signal attenuation model of WUSN node was established according to OOB error rate to select the experimental factors with high importance [44,45]. Before the model was established, the variance inflation factor was used to conduct a multicollinearity test for each factor [46], and the calculation of variance inflation factor is shown in Formula (1).
In Formula (1), R represents the negative correlation coefficient of regression analysis between one factor and other factors. The larger the VIF, the greater the possibility of collinearity between factors. In this study, the factors with VIF greater than 10 were identified as multicollinearity factors. For factors with multicollinearity, only one factor of the related factors can be retained in the model.
Then, the significance test of the variables excluding multicollinearity factors was performed [47], and the t-test was adopted for the significance test of variables. The calculation formulas are shown in Equations (2) and (3).
where Se represents the standard deviation of the error term, xi represents the value of the i-th independent variable; n represents the sample size, and βi represents the estimated regression coefficient. If , then the independent variable x has a significant influence on the dependent variable y; otherwise, there is no significant linear relationship between the two variables. The multiple linear regression model was established after the multicollinearity test of each factor and the significance test of variables was completed.
2.3.2. WUSN Node Signal Attenuation Model Verification
Two tests were conducted to verify the reliability of the WUSN node signal attenuation model proposed in this paper. First, the single-factor attenuation model was derived according to the initial test conditions. Then, the single-factor test method was adopted to obtain the test data under the change of the received signal strength of the sink node with a certain factor. In this process, the correlation between the value of the single-factor attenuation model and the test data is investigated. Second, the WUSN node signal attenuation model was verified. The orthogonal test method was used to obtain the signal strength data received by the WUSN node under different test conditions, and the correlation between the value of the signal attenuation model with the test data was determined. If the two test results are highly correlated, the WUSN node signal attenuation model established in this paper has good reliability.
3. Result
3.1. Signal Sttenuation Model of WUSN Nodes
The training effect and variable importance order of the random forest model are shown in Figure 6.
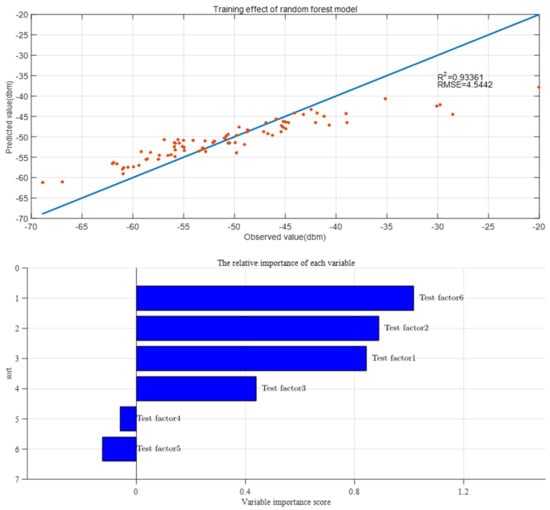
Figure 6.
Training results of random forest algorithm (upper) Training effect of random forest model; (lower) the random forest model algorithm to evaluate the importance of variables.
It can be seen from Figure 6a that the predicted value of the received signal strength at the sink node of the random forest model has a strong correlation with the actual observed value. The R2 is 0.934 and RMSE is 4.544 dbm, indicating that the model is well trained, and the results are reliable. According to Figure 6b, the importance scores of soil moisture content, node burial depth, soil compactness, soil acidity and alkalinity, soil temperature, and horizontal distance between nodes are 0.843, 0.889, 0.439, −0.060, −0.124, and 1.017, respectively. To select the experimental factors with high importance, this study investigated the change of OOB error rate with the increase in the number of important features of random forest, and the result is shown in Figure 7.
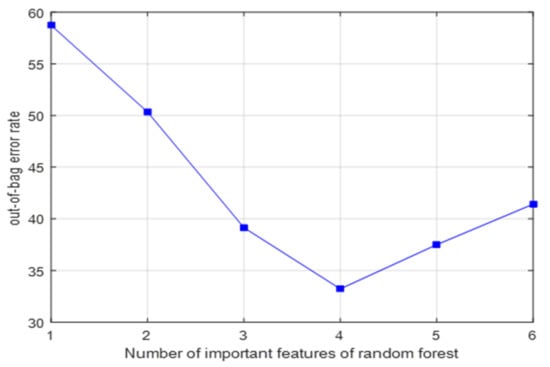
Figure 7.
Relationship between OOB error rate and number of important features.
It can be seen from Figure 7 that when the top four test factors in importance score ranking were included in the random forest model, OOB error rate was the lowest, and the prediction accuracy of the model was the highest. Therefore, these factors were included in the WUSN node signal attenuation model established in this paper. The coefficient of the model and the VIF and T values are listed in Table 2.
Table 2.
Regression results of the model.
It can be seen from Table 2 that all the four selected factors passed the multicollinearity test and variable significance test, and each factor was significantly valid at the level of 0.001.
Based on the factors listed in Table 2, the WUSN node signal attenuation model can be obtained, and it is shown in Formula (4).
where R is the received signal intensity of the sink node (dbm); W is soil moisture content (%); D is the buried depth of the WUSN node (cm); C is the soil compactness (kg/cm2); and L is the horizontal distance between the nodes (cm).
R = −0.559W − 0.282D − 1.850C − 0.162L − 12.695
R2 = 0.822, RMSE = 4.87 dbm
It can be seen from Formula (4) that the received signal intensity R has a quaternized relationship with soil moisture content W, buried depth D, soil compactness C, and horizontal distance L. If the soil moisture content increases by 2.5%, the received signal intensity will decrease by about 1.4 dbm; if the buried depth of node increases by 5 cm, the received signal intensity will decrease by about 1.41 dbm; if the soil compactness increases by 0.5 kg/cm2, the received signal intensity will decrease by about 0.93 dbm; if the horizontal distance between nodes increases by 10 cm, the received signal intensity will decrease by about 1.62 dbm. The R2 and RMSE of the model are 0.822 and 4.87 dbm, respectively. Thus, the model achieves high accuracy, and the prediction results have a high reference value.
3.2. Verify the Signal Attenuation Model of WUSN Nodes
To verify the reliability of the WUSN node signal attenuation model established in Section 3.1, the single-factor test method was adopted to investigate the change of the received signal strength of the sink node with a certain factor. The initial test conditions were set as soil moisture content of 10%, node burial depth of 30 cm, soil compactness of 0.5 kg/cm2, and horizontal distance between nodes of 10 cm. Nine data levels were selected for each test factor. Four groups of tests were conducted, and the signal intensity data were recorded. Four single-factor attenuation models were derived from Formula (4) under initial test conditions. The fitting of the single-factor attenuation model and test data is shown in Figure 8.
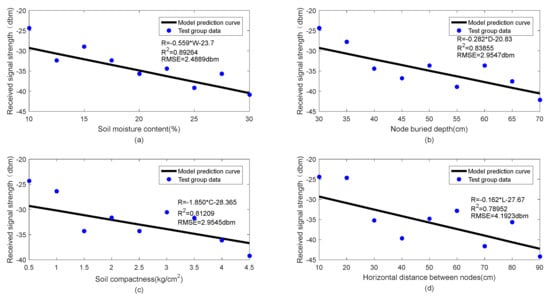
Figure 8.
(a–d) Comparison between prediction results of single-factor attenuation model and experimental data.
Figure 8 illustrates the change of soil factors (soil moisture content, node burial depth, soil compactness, and horizontal distance between nodes) obtained by the WUSN node signal attenuation models and test data fitting. It can be seen from Figure 8 that the four single-factor attenuation models fit well with the test data, and the four test factors all seriously attenuated WUSN node signals. In Figure 8a, the model goodness-fitting R2 is 0.893, and the RMSE is 2.489 dbm; in Figure 8d, the model goodness-fitting R2 is 0.790, and the RMSE is 4.192 dbm. Therefore, the attenuation model involving multiple factors under different initial test conditions can be derived according to the WUSN node signal attenuation model established in this paper. The specific single-factor attenuation model equation, goodness of fit R2, and RMSE are listed in Table 3.
Table 3.
Specific data of single-factor attenuation model.
Then, the orthogonal test method was adopted to obtain the received signal intensity test data of WUSN nodes under different test conditions: The soil moisture content is 10–20%; the buried depth of nodes is 30–50 cm; the soil compactness is 0.5–2.5 kg/cm2, and the horizontal distance between nodes is 10–50 cm. Five data levels were selected for each test factor. According to the orthogonal test method, there are 25 groups of tests in total. The WUSN node communication test results under the influence of multiple test factors are shown in Table 4.
Table 4.
WUSN node communication test results influenced by multiple test factors.
The parameters of each factor in Table 4 are substituted into Formula (4) to obtain the predicted data of the WUSN node signal attenuation model. The comparison between the obtained test data and the predicted data is shown in Figure 9.
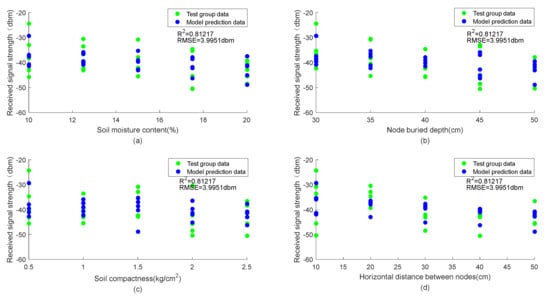
Figure 9.
(a–d) Comparison between predicted results and test data.
Figure 9 shows the distribution of the predicted values of the WUSN node signal attenuation model and the test values (soil moisture content, node burial depth, soil compactness, and horizontal distance between nodes). It can be seen from Figure 9 that the prediction results of the WUSN node signal attenuation model established in this study are highly consistent with the test data. The R2 and RMSE of the model are, respectively, 0.812 and 4 dbm. Thus, the WUSN node signal attenuation model established in this paper has good reliability.
4. Discussions
4.1. Influence of Soil Moisture Content on the Signal Transmission of WUSN Nodes
Compared with soil properties such as soil compactness, soil acidity and alkalinity, and soil temperature, soil moisture content has the greatest influence on WUSN node signal transmission. Relevant literature also shows that soil moisture content is the most important factor affecting WUSN node signal transmission in soil media [27]. Thus, the results obtained in this paper are consistent with those of the existing studies. In this study, when the soil moisture content falls within 10–30%, the relationship between soil moisture content and WUSN node signal intensity is basically linear. With the increase of soil moisture content, WUSN node signal intensity gradually decreases. Meanwhile, according to relevant literature [48,49,50,51,52], when the soil moisture content exceeds a certain critical value, the dielectric property of soil water is similar to that of ordinary water. In this case, with the increase of soil moisture content, the dielectric constant of soil will increase rapidly, and the electromagnetic wave signal will be attenuated sharply. However, it was not found in this study that WUSN node signal intensity decreases rapidly with the increase of soil moisture content, which may be caused by the low soil moisture content. The attenuation law of the WUSN node signal under the condition of high soil moisture content will be studied in the future.
4.2. The Influence of Node Burial Depth and Horizontal Distance between Nodes on the Signal Transmission of WUSN Nodes
Under the same soil test conditions, the attenuation of WUSN node signals by the buried depth of nodes is about 1.74 times the horizontal distance between nodes. Therefore, when deploying WUSN nodes, the node burial depth needs to be considered first. Relevant literature shows that there are three paths for WUSN node signals to reach the underground sink node [53,54,55,56], namely, direct wave path, reflected wave path, and side wave path. In shallow soil, node signals mainly arrive at the direct wave path and reflected wave path; in deep soil, they mainly arrive at the side wave path. Both direct and reflected waves travel in the soil medium, while side waves travel in the ground air for some distance apart from the soil medium. Moreover, when the horizontal distance between nodes far exceeds the buried depth of nodes, the direct wave path and reflected wave path attenuate severely, and WUSN node signals mainly arrive at the underground sink node as side waves. Therefore, the signal attenuation laws of WUSN nodes are different in shallow soil and deep soil, short distance between nodes and a long distance between nodes. The research results of this paper show that under the node burial depth of 30–70 cm, if the node burial depth increases by 5 cm, the received signal intensity decreases by about 1.41 dbm. The node burial depth has a linear relationship with WUSN node signal intensity. Under the horizontal distance between nodes of 10–90 cm, if the horizontal distance between nodes increases by 10 cm, the received signal intensity decreases by 1.62 dbm. The horizontal distance between nodes has a linear relationship with the signal intensity of WUSN nodes. There is no change in the attenuation rate of WUSN node signal strength with the increase of node burial depth or horizontal distance between nodes, which may be caused by the shallow node burial depth or small horizontal distance between nodes. In the future, the signal attenuation law of WUSN nodes under when deeply buried nodes and large horizontal distance between nodes will be studied.
4.3. Influence of Soil Compactness on WUSN Node Signal Transmission
Soil compactness has a great influence on WUSN node signal transmission in soil media. When the soil compactness increases from 0.5 kg/cm2 to 4.5 kg/cm2, the WUSN node signal intensity decreases by about 7.4 dbm. Relevant literature shows that the penetration resistance of soil is negatively correlated with the attenuation amplitude of electromagnetic wave [57,58,59]. Therefore, WUSN nodes are more suitable to be deployed in soft soil, and the attenuation law of WUSN node signals in various types of soil will be studied in the future.
5. Conclusions
In this paper, a WUSN node signal transmission test platform was constructed in the laboratory, and the orthogonal experiment method was adopted to obtain the received signal strength of the WUSN node under different experimental conditions. Then, the attenuation model of WUSN node signal transmission in soil medium was established. It is found that the signal intensity of WUSN nodes decreases gradually with the increase of soil moisture content, node burial depth, soil density, and horizontal distance between nodes. Specifically, when the soil moisture content increases by 2.5%, the received signal intensity decreases by about 1.4 dbm; when the node burial depth increases by 5 cm, the received signal intensity decreases by about 1.41 dbm; when soil compactness increases by 0.5 kg/cm2, the received signal intensity decreases by 0.93 dbm; when the horizontal distance between nodes increases by 10 cm, the received signal intensity decreases by 1.62 dbm. The R2 and RMSE of the established WUSN node signal attenuation model are 0.822 and 4.87 dbm, respectively. Since this model contains four test factors, it can be used to evaluate the attenuation law of the WUSN node signal under the four test factors. The lowest (highest) R2 and RMSE of the established single-factor attenuation model are 0.790 and 4.192 dbm (0.893 and 2.489 dbm). This model contains only one test factor, and it can be used to evaluate the attenuation law of WUSN node signal changes under one test factor. Based on the WUSN node signal attenuation model established in this paper, the optimal burial depth and maximum distance between WUSN nodes can be calculated to facilitate WUSN node deployment.
Author Contributions
Conceptualization, M.H. and Z.Z.; Formal analysis, M.H.; Investigation, M.H., J.Y., J.Z.; Writing—original draft, M.H.; Writing—review and editing, Z.Z. and W.H. All authors have read and agreed to the published version of the manuscript.
Funding
This study was supported by the National Natural Science Foundation of China (51979233), the National Key R&D plan of the Ministry of Science and Technology of the People’s Republic of China (2017YFC0403203): and the 111 Project (No. B12007).
Acknowledgments
We would like to thank Jianhong Yu, Changjiang Guo for their helpful work on field data collection.
Conflicts of Interest
The authors declare no conflict of interest.
Appendix A
Table A1.
Table of 6 factors and 9 horizontal orthogonal experiments.
Table A1.
Table of 6 factors and 9 horizontal orthogonal experiments.
| The Test Factors | ||||||
|---|---|---|---|---|---|---|
| Test No. | Soil Moisture Content | Node Buried Depth | Soil Compactness (kg/cm2) | Soil Acid Alkalinity | Soil Temperature (°C) | Horizontal Distance between Nodes (cm) |
| (%) | (cm) | |||||
| 1 | 20 | 45 | 1 | 7.5 | 27.5 | 10 |
| 2 | 27.5 | 50 | 4.5 | 5.5 | 25 | 60 |
| 3 | 15 | 55 | 1 | 9 | 10 | 50 |
| 4 | 17.5 | 70 | 1.5 | 5.5 | 27.5 | 50 |
| 5 | 30 | 55 | 3.5 | 6 | 27.5 | 40 |
| 6 | 17.5 | 65 | 4.5 | 6 | 12.5 | 10 |
| 7 | 17.5 | 50 | 3.5 | 7.5 | 10 | 80 |
| 8 | 30 | 35 | 2.5 | 6.5 | 10 | 70 |
| 9 | 30 | 50 | 2 | 5 | 15 | 30 |
| 10 | 27.5 | 65 | 4 | 8.5 | 27.5 | 80 |
| 11 | 10 | 35 | 2 | 6 | 25 | 50 |
| 12 | 17.5 | 40 | 1 | 8.5 | 30 | 70 |
| 13 | 10 | 50 | 3 | 9 | 27.5 | 70 |
| 14 | 12.5 | 30 | 4 | 6 | 20 | 70 |
| 15 | 15 | 50 | 4 | 8 | 17.5 | 10 |
| 16 | 22.5 | 30 | 3.5 | 8.5 | 12.5 | 50 |
| 17 | 20 | 35 | 3 | 8.5 | 17.5 | 30 |
| 18 | 10 | 30 | 0.5 | 5 | 10 | 10 |
| 19 | 10 | 70 | 4 | 7 | 22.5 | 40 |
| 20 | 12.5 | 35 | 1 | 5.5 | 12.5 | 20 |
| 21 | 15 | 35 | 4.5 | 5 | 22.5 | 80 |
| 22 | 27.5 | 55 | 1.5 | 5 | 17.5 | 70 |
| 23 | 10 | 40 | 3.5 | 5.5 | 17.5 | 90 |
| 24 | 22.5 | 60 | 4 | 5.5 | 10 | 30 |
| 25 | 25 | 55 | 2.5 | 5.5 | 15 | 10 |
| 26 | 30 | 70 | 4.5 | 9 | 30 | 90 |
| 27 | 22.5 | 35 | 0.5 | 8 | 27.5 | 90 |
| 28 | 30 | 45 | 0.5 | 5.5 | 20 | 80 |
| 29 | 10 | 55 | 4.5 | 8.5 | 20 | 20 |
| 30 | 27.5 | 45 | 3 | 6 | 10 | 20 |
| 31 | 15 | 30 | 3 | 5.5 | 30 | 40 |
| 32 | 15 | 40 | 1.5 | 6 | 15 | 30 |
| 33 | 17.5 | 60 | 3 | 5 | 20 | 90 |
| 34 | 20 | 40 | 4.5 | 8 | 10 | 40 |
| 35 | 27.5 | 60 | 2.5 | 9 | 12.5 | 40 |
| 36 | 25 | 35 | 1.5 | 7.5 | 20 | 40 |
| 37 | 30 | 65 | 3 | 8 | 15 | 50 |
| 38 | 27.5 | 35 | 3.5 | 7 | 30 | 10 |
| 39 | 25 | 50 | 1 | 6 | 22.5 | 90 |
| 40 | 12.5 | 55 | 2 | 8 | 30 | 80 |
| 41 | 17.5 | 35 | 4 | 9 | 15 | 60 |
| 42 | 20 | 65 | 2 | 5.5 | 22.5 | 70 |
| 43 | 20 | 60 | 0.5 | 6 | 30 | 60 |
| 44 | 12.5 | 40 | 2.5 | 5 | 27.5 | 60 |
| 45 | 12.5 | 60 | 4.5 | 7.5 | 17.5 | 50 |
| 46 | 30 | 60 | 1.5 | 8.5 | 22.5 | 10 |
| 47 | 12.5 | 65 | 1.5 | 7 | 10 | 90 |
| 48 | 12.5 | 45 | 3.5 | 9 | 22.5 | 30 |
| 49 | 17.5 | 55 | 0.5 | 7 | 25 | 30 |
| 50 | 27.5 | 70 | 1 | 8 | 20 | 30 |
| 51 | 30 | 30 | 1 | 7 | 17.5 | 60 |
| 52 | 22.5 | 45 | 4.5 | 7 | 15 | 70 |
| 53 | 25 | 60 | 3.5 | 8 | 25 | 70 |
| 54 | 15 | 65 | 3.5 | 6.5 | 20 | 60 |
| 55 | 15 | 60 | 2 | 7 | 27.5 | 20 |
| 56 | 17.5 | 30 | 2.5 | 8 | 22.5 | 20 |
| 57 | 20 | 70 | 3.5 | 5 | 15 | 20 |
| 58 | 25 | 30 | 4.5 | 6.5 | 27.5 | 30 |
| 59 | 27.5 | 30 | 2 | 7.5 | 15 | 90 |
| 60 | 15 | 70 | 0.5 | 7.5 | 12.5 | 70 |
| 61 | 17.5 | 45 | 2 | 6.5 | 17.5 | 40 |
| 62 | 10 | 65 | 2.5 | 7.5 | 30 | 30 |
| 63 | 22.5 | 50 | 1.5 | 6.5 | 30 | 20 |
| 64 | 22.5 | 40 | 2 | 9 | 20 | 10 |
| 65 | 12.5 | 70 | 3 | 6.5 | 25 | 10 |
| 66 | 15 | 45 | 2.5 | 8.5 | 25 | 90 |
| 67 | 20 | 30 | 1.5 | 9 | 25 | 80 |
| 68 | 12.5 | 50 | 0.5 | 8.5 | 15 | 40 |
| 69 | 10 | 60 | 1 | 6.5 | 15 | 80 |
| 70 | 30 | 40 | 4 | 7.5 | 25 | 20 |
| 71 | 25 | 70 | 2 | 8.5 | 10 | 60 |
| 72 | 27.5 | 40 | 0.5 | 6.5 | 22.5 | 50 |
| 73 | 20 | 55 | 4 | 6.5 | 12.5 | 90 |
| 74 | 10 | 45 | 1.5 | 8 | 12.5 | 60 |
| 75 | 20 | 50 | 2.5 | 7 | 20 | 50 |
| 76 | 22.5 | 65 | 1 | 5 | 25 | 40 |
| 77 | 22.5 | 70 | 2.5 | 6 | 17.5 | 80 |
| 78 | 25 | 40 | 3 | 7 | 12.5 | 80 |
| 79 | 25 | 65 | 0.5 | 9 | 17.5 | 20 |
| 80 | 22.5 | 55 | 3 | 7.5 | 22.5 | 60 |
| 81 | 25 | 45 | 4 | 5 | 30 | 50 |
References
- McBratney, A.; Whelan, B.; Ancev, T.; Bouma, J. Future directions of precision agriculture. Precis. Agric. 2005, 6, 7–23. [Google Scholar] [CrossRef]
- Lajoie-O’Malley, A.; Bronson, K.; van der Burg, S.; Klerkx, L. The future(s) of figital agriculture and sustainable food systems: An analysis of high-level policy documents. Ecosyst. Serv. 2020, 45, 101183. [Google Scholar] [CrossRef]
- Hassan, S.I.; Alam, M.M.; Illahi, U.; AI Ghamdi, M.A.; Almotiri, S.H.; Su’Ud, M.M. A systematic review on monitoring and advanced control strategies in smart agriculture. IEEE Access 2021, 9, 32517–32548. [Google Scholar] [CrossRef]
- Hardie, M. Review of Novel and Emerging Proximal Soil Moisture Sensors for Use in Agriculture. Sensors 2020, 20, 6934. [Google Scholar] [CrossRef] [PubMed]
- Ruiz-Garcia, L.; Lunadei, L.; Barreiro, P.; Robla, J. A review of wireless sensor technologies and applications in agriculture and food industry: State of the art and current trends. Sensors 2009, 9, 4728–4750. [Google Scholar] [CrossRef]
- Prasad, P. Recent trend in wireless sensor network and its applications: A survey. Sens. Rev. 2015, 35, 229–236. [Google Scholar] [CrossRef]
- Akyildiz, I.F.; Stuntebeck, E.P. Wireless underground sensor networks: Research challenges. Ad Hoc Netw. 2006, 4, 669–686. [Google Scholar] [CrossRef]
- Silva, A.R.; Vuran, M.C. Communication with aboveground devices in wireless underground sensor networks: An empirical study. In Proceedings of the 2010 IEEE International Conference on Communications, Cape Town, South Africa, 23–27 May 2010; pp. 1–6. [Google Scholar] [CrossRef]
- Vuran, M.C.; Salam, A.; Wong, R.; Irmak, S. Internet of underground things in precision agriculture: Architecture and technology aspects. Ad Hoc Netw. 2018, 81, 160–173. [Google Scholar] [CrossRef]
- Sambo, D.W.; Forster, A.; Yenke, B.O.; Sarr, I.; Dayang, P. Wireless underground sensor networks path loss model for precision agriculture (WUSN-PLM). IEEE Sens. J. 2020, 20, 5298–5313. [Google Scholar] [CrossRef]
- Wang, B.; Chen, T. Understanding the continuous usage in wireless sensor networks of wisdom agriculture. Int. J. Mob. Commun. 2019, 17, 422. [Google Scholar] [CrossRef]
- Zhang, Z. Design of wireless underground sensor network nodes for field information acquisition. J. Afr. Agric. Res. 2012, 7, 82–88. [Google Scholar] [CrossRef]
- Akyildiz, D.I.F.; Vuran, M.C. Wireless Underground Sensor Networks; John Wiley & Sons, Ltd.: Hoboken, NJ, USA, 2010. [Google Scholar] [CrossRef]
- Liu, Z.; Lin, H.E.; Electronics, S.O. A new design of wireless sensor underground network transceiver based on magnetic induction technology. Chin. J. Electron Devices 2018, 41, 104–109. [Google Scholar] [CrossRef]
- Zhang, Z. Research on Key Technologies of Wireless Underground Sensor Network for Farmland Soil Moisture Water Content. Ph.D. Thesis, Northwest A&F University, Xianyang, China, 2015. Available online: https://kns.cnki.net/KCMS/detail/detail.aspx?dbname=CDFDLAST2018&filename=1015333656.nh (accessed on 1 November 2021).
- Li, J.; Liu, X.; Lu, T.; Feng, Y. Research on wireless underground sensors network. Comput. Knowl. Technol. 2008, 2, 1738–1740. [Google Scholar] [CrossRef]
- Vuran, M.; Dong, X.; Preston, K. Wireless underground sensor networks: System in support of future agriculture. J. Nanotechnol. Eng. Med. 2013, 4, 020906. [Google Scholar] [CrossRef]
- Castellanos, G.; Deruyck, M.; Martens, L.; Joseph, W. System assessment of WUSN using NB-IoT UAV-Aided networks in potato crops. IEEE Access 2020, 8, 56823–56836. [Google Scholar] [CrossRef]
- Parameswaran, V.; Zhou, H.; Zhang, Z. Irrigation control using Wireless Underground Sensor Networks. In Proceedings of the 2012 Sixth International Conference on Sensing Technology (ICST), Kolkata, India, 18–21 December 2012; pp. 659–665. [Google Scholar] [CrossRef]
- Yu, X.; Wu, P.; Zhang, Z.; Wang, N.; Han, W. Electromagnetic wave propagation in soil for wireless underground sensor networks. Prog. Electromagn. Res. M 2013, 30, 11–23. [Google Scholar] [CrossRef]
- Zungeru, A.M.; Chuma, J.; Mangwala, M.; Sigweni, B.; Matsebe, O. Signal propagation and analysisin wireless underground sensor networks. Int. J. Eng. Res. Afr. 2019, 41, 60–78. [Google Scholar] [CrossRef]
- Akkaş, M.A.; Sokullu, R. Channel modeling and analysis for wireless underground sensor networks in water medium using electromagnetic waves in the 300–700 MHz range. Wirel. Pers. Commun. 2015, 84, 1449–1468. [Google Scholar] [CrossRef]
- Yu, X.; Zhang, Z.; Chai, R. Experiment on through-the-earth communication characteristics of soil information acquisition sensor nodes. J. Drain. Irrig. Mach. Eng. 2019, 37, 1005–1012. [Google Scholar] [CrossRef]
- Han, W.; Wu, P.; Yu, X.; Zhang, Z.; Li, D. Research progress in wireless sensor network for agricultural environment monitoring. Trans. CSAE 2011, 27, 326–330. [Google Scholar] [CrossRef]
- Trang, H.; Le, T.D.; Hwang, S.O. Connectivity analysis of underground sensors in wireless underground sensor networks. Ad Hoc Netw. 2018, 71, 104–116. [Google Scholar] [CrossRef]
- Zemmour, H.; Baudoin, G.; Diet, A. Soil effects on the underground-to-aboveground communication link in ultrawideband wireless underground sensor networks. IEEE Antennas Wirel. Propag. Lett. 2017, 16, 218–221. [Google Scholar] [CrossRef]
- Hardie, M.; Hoyle, D. Underground wireless data transmission using 433-MHz LoRa for agriculture. Sensors 2019, 19, 4232. [Google Scholar] [CrossRef] [PubMed]
- Yu, X.; Han, W.; Wu, P.; Zhang, Z. Experiment of propagation haracteristics based on different frequency channels of wireless underground sensor network in soil. Trans. Chin. Soc. Agric. Mach. 2015, 46, 252–260. [Google Scholar] [CrossRef]
- Schillaci, C.; Perego, A.; Valkama, E.; Märker, M.; Saia, S.; Veronesi, F.; Lipani, A.; Lombardo, L.; Tadiello, T.; Gamper, H.A.; et al. New pedotransfer approaches to predict soil bulk density using WoSIS soil data and environmental covariates in Mediterranean agro-ecosystems. Sci. Total Environ. 2021, 780, 146609. [Google Scholar] [CrossRef] [PubMed]
- Ali, M.A.; Dong, L.; Dhau, J.; Khosla, A.; Kaushik, A. Perspective—Electrochemical sensors for soil quality assessment. J. Electrochem. Soc. 2020, 167, 037550. [Google Scholar] [CrossRef]
- Li, W.; Zhang, G.; Zheng, L. Simulation of channel model for WUSN based on NS2. Comput. Mod. 2016, 1, 121–126. [Google Scholar] [CrossRef]
- Abdorahimi, D.; Sadeghioon, A.M. Comparison of radio frequency path loss models in soil for wireless underground sensor networks. J. Sens. Actuator Netw. 2019, 8, 35. [Google Scholar] [CrossRef]
- Qiao, X. The Construction of Green Infrastructure in Yangling. Master’s Thesis, Northwest A&F University, Xianyang, China,, 2015. Available online: https://kns.cnki.net/KCMS/detail/detail.aspx?dbname=CMFD201601&filename=1015331982.nh (accessed on 1 November 2021).
- Wu, J.; Qi, Y.; Chang, Q.; Liu, M.; Bai, L. Attribution of lou soil in Chinese soil taxonomy and establishment of representative soil series in Guanzhong area. Acta Pedol. Sin. 2021, 58, 371–375. [Google Scholar] [CrossRef]
- Ding, Y. Study and implement of the digital GFSK modulation and demodulation. Electron. Test 2010, 10, 52–55. Available online: https://kns.cnki.net/kcms/detail/detail.aspx?dbcode=CJFD&dbname=CJFD2010&filename=WDZC201010014&uniplatform=NZKPT&v=Nb5ehory8IfteTXLACJrbZeZbCW2xtlSZ1qs30YN0VLGBRwuZk2NegZIgcl6Em2W (accessed on 1 November 2021).
- Shimizu, M.; Aoki, N.; Shirakawa, K.; Tozawa, Y.; Daido, Y. New method of analyzing BER performance of GFSK with postdetection filtering. IEEE Trans. Commun. 1997, 45, 429–436. [Google Scholar] [CrossRef]
- Daniels, D.J. Surface-penetrating radar. Electron. Commun. Eng. J. 1996, 8, 165–182. [Google Scholar] [CrossRef]
- Dhillon, S.S.; Chakrabarty, K.; Iyengar, S.S. Sensor placement for grid coverage under imprecise detections. In Proceedings of the Fifth International Conference on Information Fusion. FUSION 2002. (IEEE Cat.No.02EX5997), Annapolis, MD, USA, 8–11 July 2002; Volume 2, pp. 1581–1587. [Google Scholar] [CrossRef]
- Huai, T.; Pang, J.; Wen, Q.; Song, Y. Fractal characteristics of soil particle size distribution in soils different in land use. J. Ecol. Rural. Environ. 2008, 24, 41–44. [Google Scholar] [CrossRef]
- Guo, X. Discuss the composition of soil organic matter and its effect on soil fertility. Inn. Mong. Prataculture 2013, 25, 19–21. [Google Scholar] [CrossRef]
- Dai, X. Changes of Nutrient Balance in Soil in Midwest Region of Guanzhong Plain. Master’s Thesis, Northwest A&F University, Xianyang, China,, 2012. Available online: https://kns.cnki.net/KCMS/detail/detail.aspx?dbname=CMFD2012&filen-ame=1012436235 (accessed on 1 November 2021).
- Bogena, H.; Huisman, J.; Meier, H.; Rosenbaum, U.; Weuthen, A. Hybrid wireless underground sensor networks: Quantification of signal attenuation in soil. Vadose Zone J. 2009, 8, 755–761. [Google Scholar] [CrossRef]
- Palczewska, A.; Palczewski, J.; Robinson, R.M.; Neagu, D. Interpreting random forest models using a feature contribution method. In Proceedings of the 2013 IEEE 14th International Conference on Information Reuse & Integration (IRI), San Francisco, CA, USA, 14–16 August 2013; pp. 112–119. [Google Scholar] [CrossRef]
- Wang, R.; Asghari, V.; Hsu, S.C.; Lee, C.J.; Chen, J.H. Detecting corporate misconduct through random forest in China’s construction industry. J. Clean. Prod. 2020, 268, 122266. [Google Scholar] [CrossRef]
- Wei, G.; Cosman, P.; Berry, C.C.; Feng, Z.; Schafer, W.R. Automatic tracking, feature extraction and classification of C. elegans phenotypes. IEEE Trans. Biomed. Eng. 2004, 51, 1811–1820. [Google Scholar] [CrossRef]
- Wei, H. Diagnosis and treatment of multicollinearity in regression analysis. J. Zhoukou Norm. Univ. 2019, 36, 16–20. [Google Scholar] [CrossRef]
- Xu, J.; Xu, S. Variable screening technique and statistical test in regression analysis. Shanghai Chem. Ind. 2016, 41, 5. [Google Scholar] [CrossRef]
- Guo, W.; Zhang, P.; Song, K.; Han, W.; Xu, J. Dielectric properties of Lou soil and moisture content detection affected by frequency and temperature. J. Drain. Irrig. Mach. Eng. 2013, 31, 713–718. [Google Scholar] [CrossRef]
- Zhang, P. Analysis to Effects of Main Factors on Dielectric Properties of Soils. Master’s Thesis, Northwest A&F University, Xianyang, China,, 2013. Available online: https://kns.cnki.net/KCMS/detail/detail.aspx?dbname=CMFD201401&filename=1013345469.nh (accessed on 1 November 2021).
- Wang, J.R.; Schmugge, T.J. An empirical model for the complex dielectric permittivity of soils as a function of water content. IEEE Trans. Geosci. Remote. Sens. 1980, GE-18, 288–295. [Google Scholar] [CrossRef]
- Xu, S. Analysis of soil moisture content measurement technology and permittivity influencing factors. Technol. Innov. Appl. 2017, 27, 34. [Google Scholar]
- Chen, Q.; Zeng, J.; Li, Z.; Zhou, J.; Tian, B. Relationship model of soil moisture and dielectric constant monitored with remote sensing. Trans. Chin. Soc. Agric. Eng. 2012, 28, 171–175. [Google Scholar] [CrossRef]
- Sun, Z.; Akyildiz, I.F. Connectivity in wireless underground sensor networks. In Proceedings of the 2010 7th Annual IEEE Communications Society Conference on Sensor, Mesh and Ad Hoc Communications and Networks (SECON), Boston, MA, USA, 21–25 June 2010; pp. 1–9. [Google Scholar] [CrossRef]
- Wang, K.I.; Wu, S.; Ivoghlian, A.; Salcic, Z.; Austin, A.; Zhou, X. LWS: A LoRaWAN wireless underground sensor network simulator for agriculture applications. In Proceedings of the 2019 IEEE SmartWorld, Ubiquitous Intelligence & Computing, Advanced & Trusted Computing, Scalable Computing & Communications, Cloud & Big Data Computing, Internet of People and Smart City Innovation, Leicester, UK, 19–23 August 2019; pp. 475–482. [Google Scholar] [CrossRef]
- Dong, X.; Vuran, M.C. A channel model for wireless underground sensor networks using lateral waves. In Proceedings of the 2011 IEEE Global Telecommunications Conference—GLOBECOM, Houston, TX, USA, 5–9 December 2011; pp. 1–6. [Google Scholar] [CrossRef]
- Li, L. Study of Some Key Techniques in Wireless Underground Sensor Networks. Ph.D. Thesis, Beijing University of Posts and Telecommunications, Beijing, China, 2008. Available online: https://kns.cnki.net/KCMS/detail/detail.aspx?dbname=CD-FD9908&filename=2008139233.nh (accessed on 1 November 2021).
- Wang, P. The Experimental Study and Signal Inversion of Ground Penetrating Radar for Soil Compactness Detection. Ph.D. Thesis, China University of Mining and Technology (Beijing), Beijing, China, 2010. Available online: https://kns.cnki.net/KCMS/detail/detail.aspx?dbname=CDFD0911&filename=2010240555.nh (accessed on 1 November 2021).
- Sui, J.; Li, T.; Shi, T.; Wang, Q.; Li, Y. Effect of soil compactness on electromagnetic wave attenuation. J. Heilongjiang Bayi Agric. Univ. 1991, 51–53. Available online: https://kns.cnki.net/kcms/detail/detail.aspx?dbcode=CJFD&dbname=CJFD9093-&filename=HLJK199101007&uniplatform=NZKPT&v=r4rHXWdW-1zhvekkfX0lJHic6DGr1BIXAJv8_vsFtWq6QSusjuKyi82sECiOP2ZJ (accessed on 1 November 2021).
- Guo, S. The Soil A New Approach to Estimating the Path Loss in Underground Wireless Sensor Networks Detection Model Based on Genetrating Radar in Reclamation Area. Master’s Thesis, Shandong Agricultural University, Tai’an, China, 2013. Available online: https://kns.cnki.net/KCMS/detail/detail.aspx?dbname=CMFD201402&filename=1014154161.nh (accessed on 1 November 2021).


Publisher’s Note: MDPI stays neutral with regard to jurisdictional claims in published maps and institutional affiliations. |
© 2021 by the authors. Licensee MDPI, Basel, Switzerland. This article is an open access article distributed under the terms and conditions of the Creative Commons Attribution (CC BY) license (https://creativecommons.org/licenses/by/4.0/).