1. Introduction
The international sanctions that were introduced in 2012 by the United States (USA) and the European Union (EU) against Iran’s oil and financial sectors had an immediate impact on the economy. Between 2012 and 2015, the average annual economic growth was −1.1%, compared to 2.4% in the prior four-year period [
1]. Moreover, Iranian crude oil exports dropped from 2.4 to 1.4 million barrels per day in the same period [
2]. Shadow economy activity also significantly decreased by more than 30 percentage points, suffering more from the sanctions than the formal economy [
3]. When the formal part of the economy is under increased pressure, a declining informal economy may endanger the political stability of a country, increasing the risk of internal conflict [
4,
5].
After almost three years of negotiations, Iran and the five permanent members of the United Nations Security Council (China, France, Russia, United Kingdom, and the USA), the EU, and Germany came to an agreement called the Joint Comprehensive Plan of Action (JCPOA), which was implemented in 2016. As a consequence, most international sanctions against Iran were lifted, and for a short period, it appeared that economic activity returned to pre-sanction levels or better. However, in 2018, the US government decided to withdraw from the JCPOA and re-introduced sanctions against Iran, effectively ending the agreement and returning Iran to a situation under sanctions.
These circumstances allow us to study the effect of the lifting of international sanctions on the Iranian shadow economy in 2016 and 2017. Despite many views and perspectives on the definition and measurement of the phenomenon of the shadow economy, there are several approaches to address this topic. According to Schneider and Enste [
6], a shadow economy includes “unreported income from the production of legal goods and services, either from monetary or barter transactions, hence all economic activities that would generally be taxable were they reported to the tax authorities.” In this study, shadow economy growth is calculated with the help of the harmonized global nighttime light (NTL) dataset and gross domestic product (GDP) data from the Iranian Ministry of Economic and Financial Affairs (MEFA) [
7].
The harmonized NTL dataset by Li et al. [
8] utilizes monthly remote sensing data from the Defense Meteorological Satellite Program (DMSP) of the United States Department of Defense and the data from Visible Infrared Imaging Radiometer Suite (VIIRS) of the Earth Observation Group of the United States National Oceanic and Atmospheric Administration (NOAA). The authors created images of yearly data, removed noise, and harmonized the two different types of measurement to create a dataset that can be used as time-series data. The data gathered through remote sensing have several advantages, some of which are relevant for our study. It offers the possibility to measure economic activity that goes beyond the formal GDP, namely the shadow economy. This can help us to get a more precise picture of the impact of the lifting of sanctions on economic activity in Iran. We are using the NTL data to create a panel dataset of 31 Iranian provinces with 837 observations, which we are using together with the official data from MEFA. To estimate the association between the lifting of sanctions and the change of shadow economy in Iranian provinces, we use multiple linear regression, in which the growth of the shadow economy, measured in the first difference of the logarithm, is the dependent variable. We are presenting different specifications and adding a variety of control variables to show the robustness of our results.
The study’s contribution is that it uses a dataset that permits a longer study period relative to prior studies on the case of Iran. The dataset of Li et al. [
8] gives us the possibility to study a longer time period for our panel data approach, instead of the two DMSP/OLS and VIIRS/DNB datasets that are usually not comparable over time. It is essential for our approach because the DMSP dataset ends in the year 2013 and does not include the years of lifted sanctions. Moreover, the effects of lifting sanctions are discussed, which is less covered in the literature compared to the effects of introducing sanctions. This is also true for the behavior of the shadow economy after economic shocks. In addition, this contribution will help to understand the dynamics of the shadow economy in similar economies. Finally, it is an important addition to several recent studies about international sanctions against Iran and already existing studies about its shadow economy [
3,
9,
10,
11,
12,
13,
14,
15,
16,
17,
18,
19,
20,
21,
22,
23]. The paper is structured as follows.
Section 2 presents an overview of the relevant literature related to the topic, and
Section 3 explains the data and methodology. In
Section 4, the results are presented, and we discuss the results in
Section 5.
Section 6 concludes the paper.
2. Literature Review
Using nighttime light (NTL) data in economics has three main advantages. First, the growth in NTL reflects growth in economic activity, but it does not include possible GDP measurement errors in countries with low quality of national accounts [
24,
25,
26]. Second, official GDP statistics do not account for the informal economy, which can be significant in many countries [
3,
27,
28]. These two aspects can lead to underestimating the true effect of economic shocks. This has also been shown by several authors in the context of natural disasters [
29,
30,
31]. The third advantage is that nightlight datasets are available for all countries and smaller geographical units and are therefore comparable across units. Existing studies mainly use NTL to investigate economic activity and social well-being [
24,
25,
29,
30,
31,
32,
33], the shadow economy and remittances [
3,
27,
28], and electricity consumption and light pollution [
34,
35,
36], as well as urban ecosystems and urban extent mapping [
37,
38,
39].
The first part of the literature links NTL to the formal and informal economy. Chen and Nordhaus show that NTL can be used as a proxy for GDP [
24]. Their study is based on Elvidge et al., who estimated the light emissions for 21 countries and showed that the area lit is highly correlated to gross domestic product and electric power consumption [
34]. Henderson et al. went a step further and developed a statistical framework to use NTL to augment official GDP growth measures [
25]. They use it to improve the estimates of true GDP growth in countries with poor data quality. Additionally, Ghosh et al. discussed how nighttime lights could be used as a measure for human well-being such as GDP, poverty, informal economic activity, remittances, human ecological footprint, electrification rates, and how it can be used to calculate the Night Light Development Index (NLDI) and the Information and Technology Development Index (IDI) [
32]. They also studied the role of remittances and the shadow economy in Mexico with the help of NTL from the United States (US) because a large number of remittances are sent from the US to Mexico every year [
27]. According to the authors’ results, the magnitude of Mexico’s informal economy and the inflow of remittances are 150 percent larger than their existing official estimates in the gross national income. Moreover, Tanaka and Keola studied the shadow economy in Cambodia using census data on formally registered non-farm establishments and NTL [
28]. Their results suggest that both formal and informal firms increased their estimated sales, and thus the informal sector increased quantitatively in both absolute and relative terms over time. Another approach from Shi et al. uses NTL to estimate the total freight traffic in China [
33].
The second part of the literature uses the NTL to determine the impact of shocks on the economy, for example, natural disasters. Bertinelli and Strobl use NTL data as a measure of local economic activity to statistically assess the impact of hurricane strikes on local economic growth [
29]. Their results suggest that, on average, hurricane strikes reduce income growth by around 1.5% at the local level, with no effect beyond the year of the strike, which is more than 2 times higher than the impact estimated from aggregate analyses. Moreover, Elliott et al. use a similar approach and focus on the impact of typhoons on local economic activity in coastal China at a spatially highly disaggregated level of approximately 1 km [
30]. According to their results, a typhoon that is estimated to destroy 50% of the property reduces local economic activity by 20% for that year. Klomp examined the impact of large-scale natural disasters on economic development, measured by NTL, and found that natural disasters reduce the number of lights visible from outer space significantly in the short run, while climatic and hydrological disasters cause a large drop in the luminosity in developing and emerging market countries, and geophysical and meteorological disasters decrease light intensity more in industrialized countries [
31].
The third part of the literature focuses on urbanization-related topics. Doll and Pachauri investigate how NTL and spatially explicit population data can be used to study electricity access [
35]. They present satellite-derived estimates of rural populations without access to electricity in developing countries. In addition, they show the slow progress of electricity provision to households in Sub-Saharan Africa. On the contrary, Falchi et al. focus on the topic of light pollution, which did not have a quantification on the global scale before [
36]. With their world atlas of artificial sky luminance, the authors show that more than 80% of the world and more than 99% of the U.S. and European populations live under light-polluted skies. This can affect many dimensions of life, such as ecology, astronomy, health care, and land-use planning. Additionally, Bennie et al. studied the impact of light pollution on 43 global ecosystem types and found that all ecosystem types experienced an increase in light pollution in the period 1992 to 2012, with some ecosystems being affected more than others [
37]. Zhou et al. use the DMSP/OLS nightlights to map the extent and dynamics of urban areas with a five-step method which was tested on the cases of the United States and China [
38]. Their results indicate that the urbanized area occupies about 2% of total land area in the US, ranging from lower than 0.5% to higher than 10% at the state level, and less than 1% in China, ranging from lower than 0.1% to about 5% at the province level with some municipalities as high as 10%. After that, they developed spatially and temporally consistent global urban maps from 1992 to 2013 and found that the percentage of global urban areas relative to the world’s land surface area increased from 0.23% in 1992 to 0.53% in 2013, with Asia being the continent with the most significant urban growth [
39].
Despite challenges in defining and measuring a shadow economy, there is a significant body of literature on this topic [
6,
40,
41,
42,
43,
44,
45,
46,
47,
48,
49,
50,
51]. Schneider and Enste summarize different approaches to measuring the shadow economy, such as the currency demand approach, the electricity demand approach, the labor force approach, or the multiple indicator multiple causes (MIMIC) model [
6,
50]. They use the latter to provide shadow economy estimates for many countries worldwide, including estimations for Iran. Several Iranian researchers have used the mentioned methods as well to determine the size of the shadow economy in the country [
52,
53,
54,
55]. A comprehensive study on the effects of international sanctions on Iran’s informal economy comes from Farzanegan, in which he discusses important transmission channels of financial and energy sanctions, mainly through the foreign exchange markets [
15]. In addition, Farzanegan and Hayo show that the international sanctions from 2012 and 2013 had a significantly stronger negative impact on the growth rate of the shadow economy than on the official GDP growth rate [
3].
Economic sanctions and trade embargos have been discussed for decades in the economic literature. A theoretical framework to understand sanctions was developed by Eaton and Engers [
56,
57], who state that sanctions are “measures that one party (the sender) uses to influence another (the target). Sanctions, or the threat of sanctions, have been used by governments to alter the human rights, trade, or foreign policies of other governments”. However, they ignore that there can be multiple senders, as their framework is only an interaction of two parties. Additionally, they admit that there are many other factors that are not considered in their approach. Additionally, Caruso studied the impact of economic sanctions on trade by looking at the USA and 49 targeted countries from 1960 to 2000. His results suggest that extensive and comprehensive sanctions have a large negative impact on bilateral trade [
58]. In addition, he shows that unilateral extensive US sanctions have a large negative impact, while limited and moderate sanctions induce a slightly positive effect on other G-7 countries’ bilateral trade.
Torbat investigates the impacts of US trade and financial sanctions on Iran [
9]. He summarizes the economic and political effects of different US sanctions since the establishment of the Islamic Republic of Iran in 1979. According to the author, the sanctions mainly damaged the Iranian economy, while the efficacy of sanctions has diminished in the long run and had minimal political effects. In addition, the negative effect on the US economy by losing a trade partner was low since the country is not dependent on a few trade partners. Overall, the author shows that unilateral sanctions might not have the strong effect intended by the sender country. This is also supported by further empirical studies, such as the study from Dizaji and Farzanegan, who analyzed the impact of unilateral and multilateral sanctions on Iran’s military spending [
12]. They found that an increase in the intensity of sanctions is associated with a larger decrease in military spending, both in the short and the long run. Moreover, they show that only the multilateral sanctions by the US and other countries have a statistically significant and negative impact on the military spending of Iran.
Additionally, Farzanegan estimates the effect of international banking and energy sanctions on Iran’s military spending from 2012 to 2015 using the synthetic control method [
16]. He concludes that per capita military spending was reduced by approximately USD 117 per year, on average. This supports previous findings, which show that Iran’s military and security expenditures significantly respond to shocks in oil revenues or oil prices, while social spending components do not show any significant reactions [
14]. The spending behavior of the Iranian government in the wake of sanctions can be linked to the quality of its political institutions [
11,
13]. Dizaji et al. show that sanctions have positive effects on the quality of democratic institutions in the short and medium terms, and trade openness may have a direct and positive impact on the size of its budget. However, the spending allocation depends on how trade affects the government budget and its political behavior simultaneously, which means that a weaker democracy can increase Iran’s military expenditures and may reduce the share of non-military expenditures.
Based on these findings, Dizaji studies how improvements in trade openness in Iran due to lifting sanctions could affect political institutions and military spending [
10]. The results of his impulse response analysis, based on an unrestricted VAR model, suggest that the response of political institutions to a one standard deviation shock to trade openness or to positive changes in trade openness is negative and statistically significant. On the contrary, government revenues and defense and non-defense expenditures respond positively to a positive shock toward trade openness, while shocks to trade openness influence military spending more than non-military spending.
Several other studies focus on the effects of oil price shocks and sanctions on different aspects of Iran’s economy, such as GDP growth, inflation, publicly traded companies, environment, export, technology, foreign investments, and oil production [
19,
20,
21,
22]. Farzanegan and Markwardt analyze the dynamic relationship between oil price shocks and major macroeconomic variables using a VAR approach [
59]. According to their results, the asymmetric effects of oil price shocks, negative and positive, significantly increased inflation. Furthermore, they find a strong positive relationship between positive oil price changes and industrial output growth, as well as the Dutch disease syndrome through significant real effective exchange rate appreciation. Gharehgozli estimates the costs of international sanctions against Iran from 2011 to 2014 using the synthetic control method and finds that sanctions during this period reduced Iran’s real GDP by more than 17%, with the largest drop occurring in 2012 [
18].
Another case study on Iran focuses on the impact of sanctions on the black-market premium on the Iranian Rial and US dollar exchange rate [
23]. As discussed in previous studies [
15,
59], oil price shocks under sanctions may affect foreign exchange markets; thus, Zamani et al. investigate the effects of energy sanctions on the black-market premium on the exchange rate. Using data from 1959 to 2017 and a nonlinear autoregressive distributed lag (NARDL) model, they find that falling oil revenues caused by sanctions increase the black-market premium. Overall, previous studies on Iran have shown that economic sanctions and the lifting of sanctions can affect GDP growth, shadow economy growth, oil exports, trade, inflation, exchange rates, public spending, institutional quality, banking system, and other macroeconomic indicators connected to household welfare, with the focus mainly on the introduction of sanctions and not the removal of sanctions. Therefore, this article will be an important contribution to the latter part of the literature.
3. Data and Methodology
This study uses version 2 of the harmonized global NTL dataset by Li et al. [
8] (
https://figshare.com/articles/dataset/Harmonization_of_DMSP_and_VIIRS_nighttime_light_data_from_1992-2018_at_the_global_scale/9828827/2, accessed on 12 October 2020), which is based on data from the Defense Meteorological Satellite Program/Operational Linescan System (DMSP/OLS) of the United States Department of Defense (
https://eogdata.mines.edu/products/dmsp/, accessed on 5 November 2021), ranging from 1992 to 2013, and data from Visible Infrared Imaging Radiometer Suite/Day Night Band (VIIRS/DNB) of the Earth Observation Group of the United States National Oceanic and Atmospheric Administration (NOAA) (
https://eogdata.mines.edu/products/vnl/, accessed on 5 November 2021), ranging from 2012 to 2018 [
60,
61,
62]. The harmonization procedure contains three major steps. First, they aggregated the global average radiance composite images of the VIIRS/DNB dataset from monthly to yearly observations. In addition, noises from aurora, fires, boats, and other temporal lights were excluded during this step. This might also filter out light emissions that are not very strong, for example, from small villages [
26]. Second, they quantified the relationship between processed VIIRS data and DMSP NTL data in 2013 using a sigmoid function so that the processed VIIRS data have the same spatial resolution and similar radiometric characteristics as the DMSP data. Third, they applied the derived relationship at the global scale to obtain the DMSP-like data from VIIRS and finally generated the consistent NTL data by integrating the temporally calibrated DMSP NTL data (1992–2013) and DMSP-like NTL data from VIIRS (2014–2018). The authors provide one picture in Tagged Image File (TIF) format for each year.
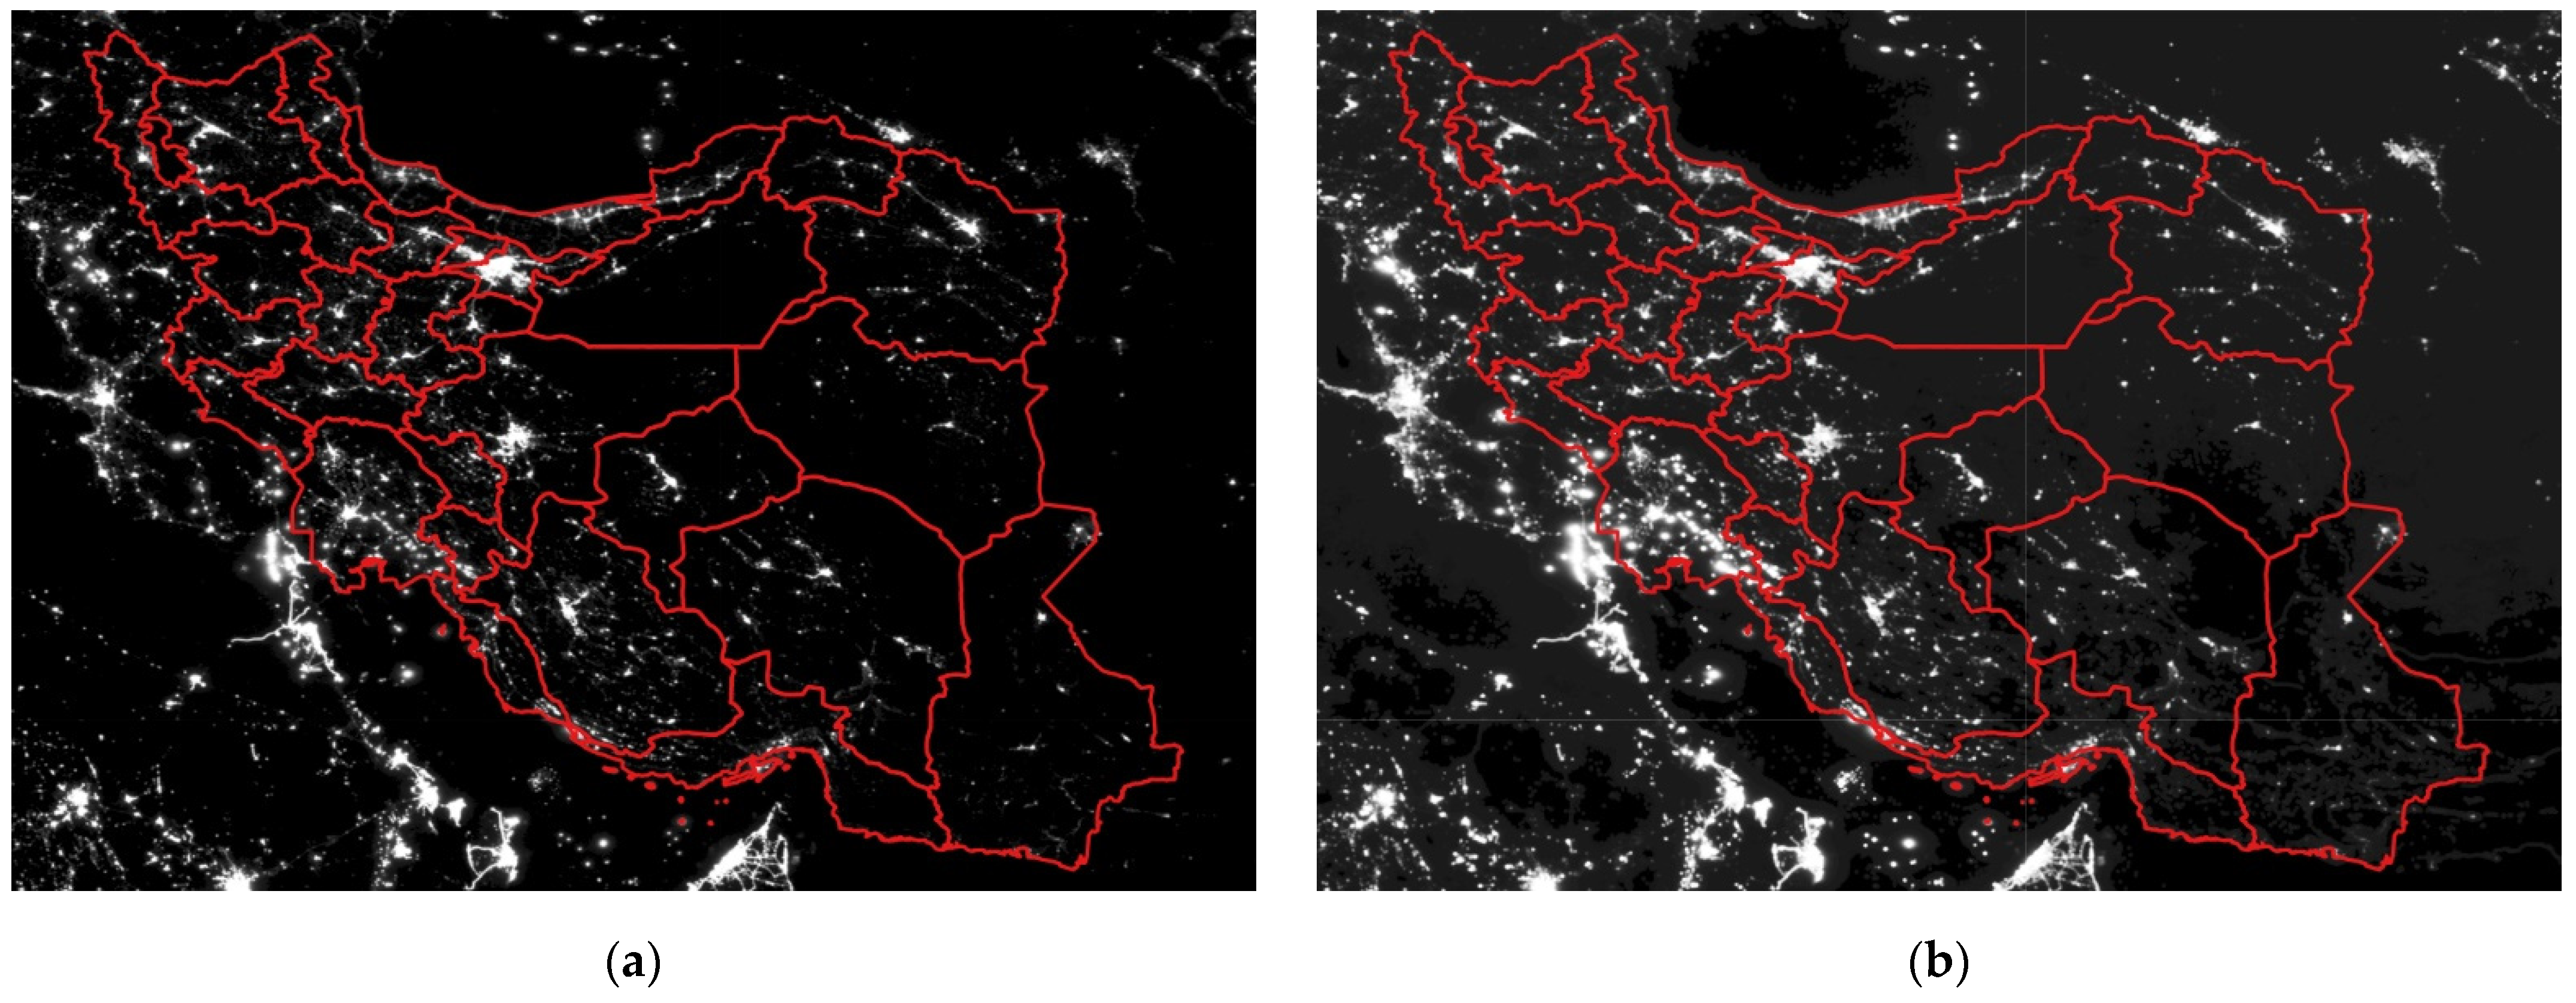
Figure 1a,b show samples of the harmonized NTL dataset from 2013 and 2017 for the provinces of Iran, which is a year during the time of international sanctions against Iran, and a year after the lifting of sanctions. We can see that the light intensity in most of the 31 provinces has increased from 2013 to 2017, thus this will not give us an indication of how the shadow economy changes over time, but we utilize this dataset to calculate the growth of shadow economy, as presented in equation (1). The shapefile used in the figures and in the process of data extraction is from the United Nations Office for the Coordination of Humanitarian Affairs (OCHA), Regional Office for the Middle East and North Africa [
63]. It uses the latest provincial borders, the first-level administrative divisions, after the reform of Tehran province in 2010. With the help of Quantum Geographic Information System’s (QGIS) Zonal Statistics tool and the shapefile, we calculate the average light intensity in each province over the time period 1992–2018. This leaves us with a panel dataset of 837 observations for the NTL. The values represent the yearly mean of nighttime light intensity in each Iranian province and range theoretically from 0 (black) to 63 (white). However,
Table 1 shows that the average NTL for Iranian provinces ranges between 0.139 and 25.426, which tells us that we can use the dataset for our approach. If a province has a value of 63, we would not be able to determine an increase in economic activity because this is the maximum possible value.
The economic data are from the Iranian Ministry of Economic and Financial Affairs (MEFA) (
https://databank.mefa.ir/data?lang=en, accessed on 1 July 2021) and are available for many indicators from 2000 to 2019 [
7]. Different measurements of shadow economies worldwide are usually available on the country level, like the data from Buehn and Schneider for the period 1999 to 2007 [
41]. With their multiple indicator multiple causes (MIMIC) approach, they estimate the shadow economy in Iran to be between 17.3% and 19.1% of the official GDP, while the average of their full sample is 17.1%. An updated estimation for the period 1991 to 2017 estimates values between 13.2% and 20.5% [
48]. However, our study uses NTL to calculate the growth rate of the shadow economy, mainly due to data available on the provincial level. With the following equation, we calculate the shadow economy growth:
We subtract the first difference of the natural logarithm of the current gross domestic product (GDP) in Iranian Rial (IRR) from the first difference of the natural logarithm of the harmonized NTL for 31 Iranian provinces (i) for the period 2005–2018 (t). The nighttime light data were previously used as an indicator of GDP [
24,
25]. However, Farzanegan and Hayo assume that it is likely that shadow economic activity has a positive relationship with the intensity of night light, too [
3]. Therefore, the data on night light has two main components: one is related to activities registered in the official GDP (observed sector), and the other is related to activities in the shadow economy (unregistered sector).
Our dependent variable, the measurement of shadow economy growth, is the difference between the growth rates of nighttime light and GDP. To operationalize the dependent variable, first, we take the natural logarithm of the formal GDP and the natural logarithm of the NTL data. Then the first difference of the natural logarithm of the formal GDP and the first difference of natural logarithm of the NTL data is calculated. The first difference (Δ) of the natural logarithm of a variable represents a growth rate similar to percentage growth, thus providing us with growth rates for NTL and GDP. Finally, we calculate the difference between the growth rates of nighttime light, ΔLn(NTL), and the growth rates of formal GDP, ΔLn(GDP), as presented in equation (1), to capture the relative development of the shadow economy.
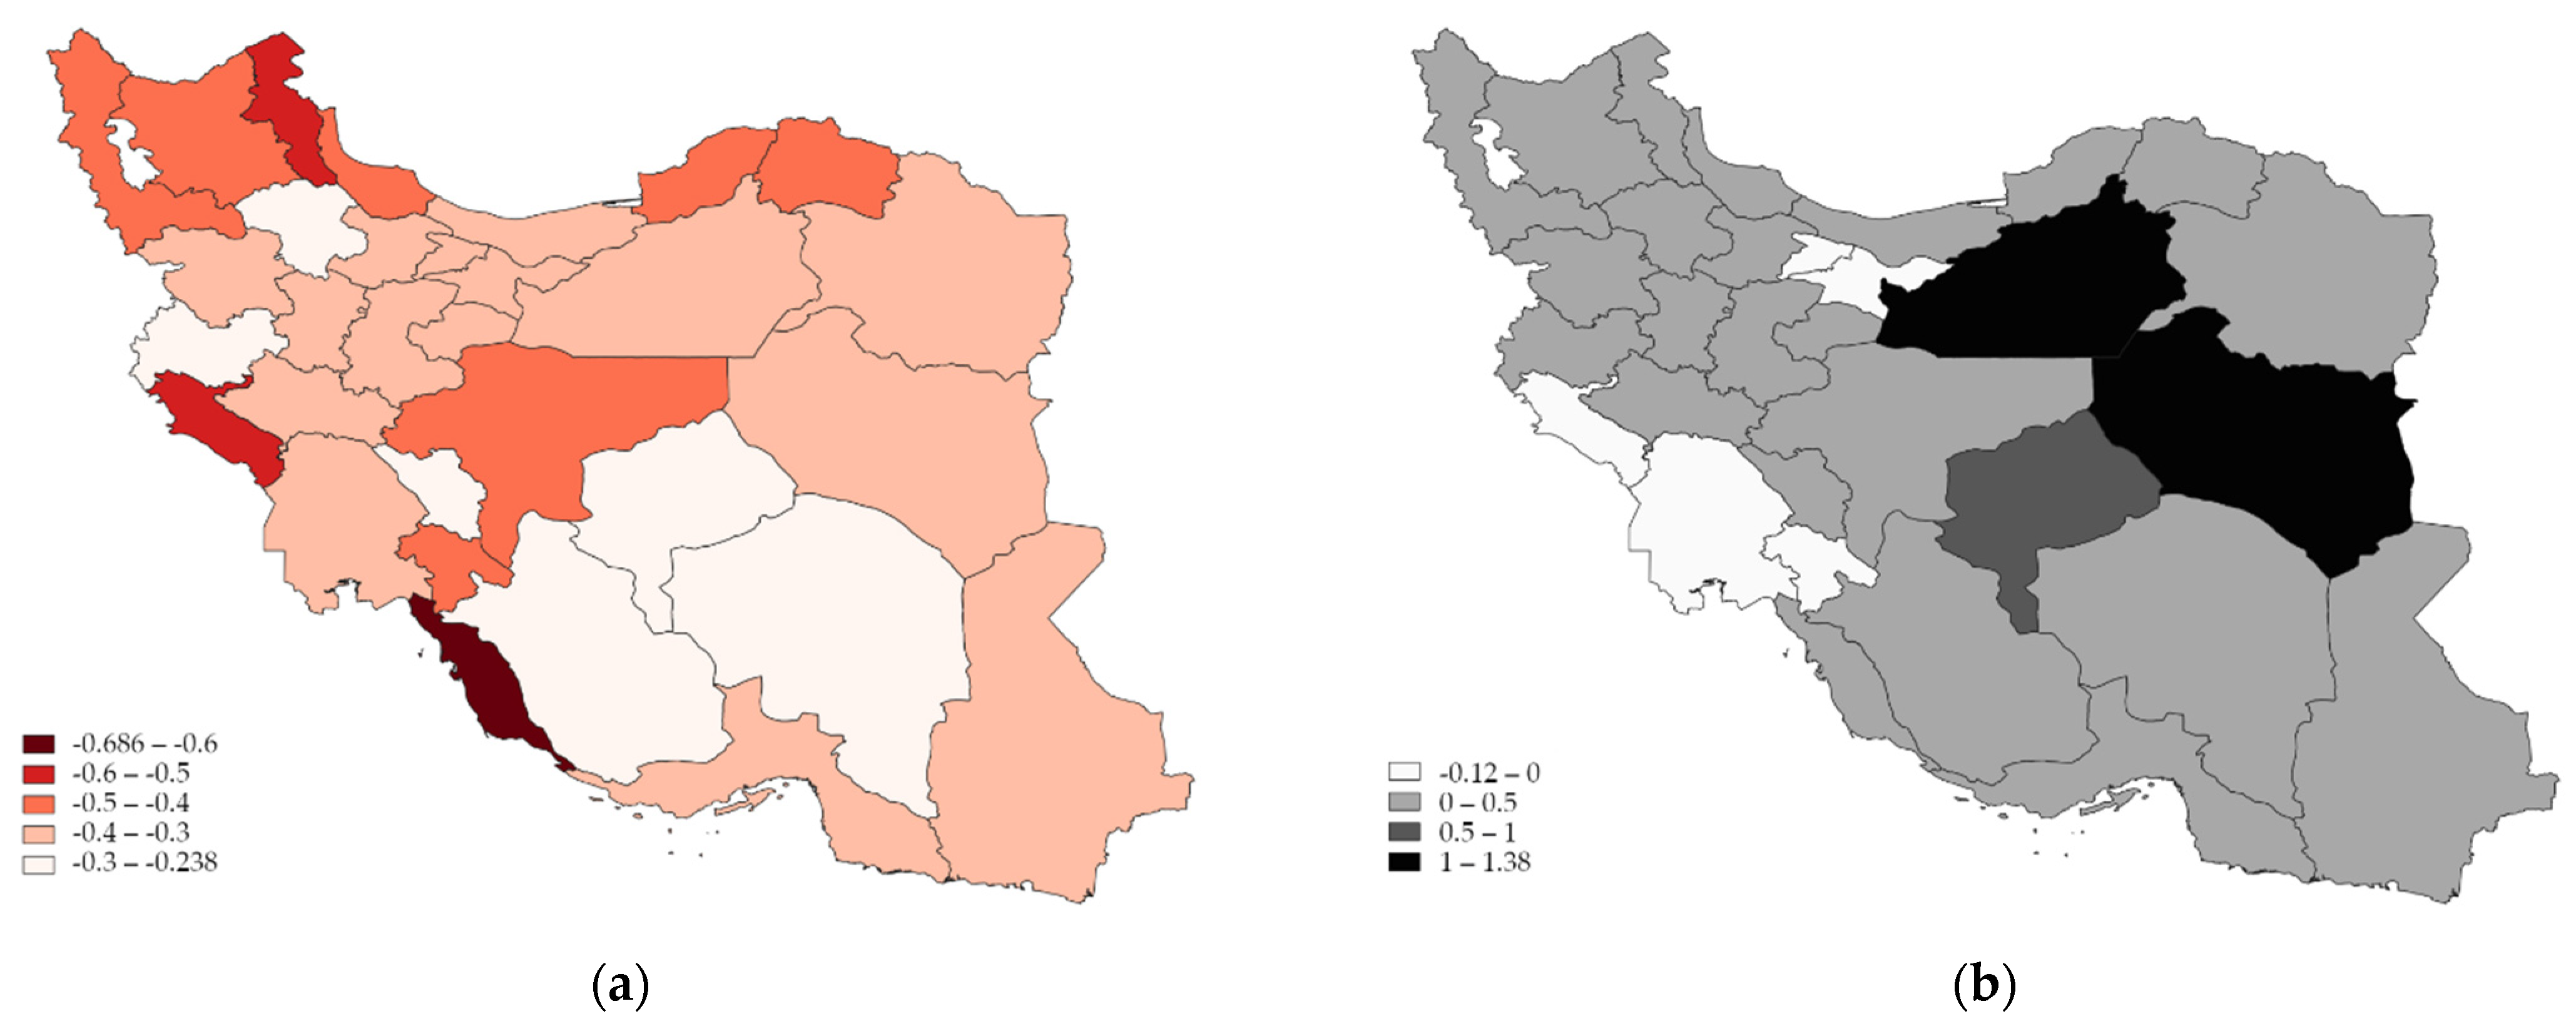
Figure 2a,b show samples of the calculated values for the same two years as in the previous figures, where one year is in the time period of sanctions and the other in the time period of lifted sanctions. When simply comparing the changes of the shadow economy in these two years, we can already see a difference, namely a decrease of shadow economy compared to the year before in all provinces in the year 2013, and a positive value of shadow economy growth in most provinces in the year 2017, compared to the year before. The exceptions are the provinces Alborz, Ilam, Khuzestan, Kohgiluyeh and Boyerahmad, and Tehran. The summary statistics of NTL and other used variables are presented in
Table 1, excluding the dummy variable.
A detailed data description, including sources, is available in
Table A1 in the
Appendix A. From the descriptive statistics, we get a first glimpse of the behavior and the difference between the formal and informal economy in the reflected period. If we compare the volatility of ΔLn(GDP) and ΔLn(Shadow), we see that the shadow economy growth has a larger standard deviation of 0.26, compared to 0.12 of the formal economic growth. This is a first indication that the shadow economy might react more strongly to positive and negative economic shocks, which has been seen in previous studies [
3]. On the one hand, we can argue that the shadow economy reacts or adapts faster to the new economic situation, but on the other hand, that also means more uncertainty for people engaged in the informal economy. The relationship between different variables can be seen in the correlation matrix in
Table A2 of the
Appendix A.
Using the described data, this study uses a regression analysis with ordinary least squares (OLS) and province-fixed effects. We use unbalanced panel data of 31 Iranian provinces from 2001 to 2018 and use the following specification:
The dependent variable is the shadow economy growth that was calculated in (1), where the subscript
i represents the Iranian provinces and the subscript
t represents the years. In addition, the model includes a constant α and an error term
ε, and the term
Lifted represents the dummy variable which takes the value 1, if the year is 2016 or 2017, which were the two years of lifted sanctions under JCPOA, and it takes the value 0 otherwise. We have added a trend term that controls for time trends that have not been controlled for in the model, for example, technological progress or inflation. As the values do not change between provinces, it will also replace the time-fixed effects, which are not included in our estimations, because the inclusion of time dummies to capture possible trends would lead to perfect multicollinearity. The remaining independent variables are control variables, such as other drivers of shadow economy activity like unemployment as well as the size of agriculture and the industry sectors. These are often used in previous studies on the shadow economy, such as in studies by Farzanegan and Hayo or Schneider and Enste [
3,
50]. The service value added divided by total value added was not included due to collinearity. Furthermore, the model includes province fixed-effects π that are used to control for individual factors that affect each province over the period, for example, cultural attitudes toward formal and informal jobs. Despite relative homogeneity in terms of religion and culture, Iran is a multi-ethnic country with several ethnic minorities that are concentrated in different provinces. Moreover, we use robust standard errors that are clustered on the province level.
4. Results
The results of the empirical analysis, presented in
Table 2, suggest that the lifting of international sanctions had a positive and statistically significant effect on the relative growth of Iran’s shadow economy. The seven presented specifications show the relationship between the lifting of sanctions dummy variable, starting from a simple regression and then adding more control variables that are considered important drivers of the shadow economy.
Table A3 in the
Appendix A shows the behavior of the dummy variable if we add the control variables individually. Additionally, we can see that the lifting of sanctions has a stronger effect on the growth rate of the shadow economy than on GDP growth. In 2016 and 2017, the GDP growth of Iran was 13.4% and 3.8% [
1], respectively. This is an increase of 14.7 and 5.1 percentage points compared to 2015, where the annual GDP growth rate was −1.3%. As presented in specification (2.7), the lifting of sanctions in the time period 2016–2017 is on average associated with an increase of shadow economy growth of 13.6 percentage points. The remaining specifications show values between 14.4 and 30.9 percentage points, which are higher than the changes of the formal economy during the lifting of sanctions. This is also in line with arguments presented in the literature on the cyclical features of the shadow economy [
64], especially in developing and emerging economies. A positive shock (lifting of sanctions) which booms the formal economy, does have a stronger positive effect on the informal economy, while a negative shock (imposition of sanctions) which leads to recession of the formal economy, results in a more significant decline of economic activities in the informal economy, as shown in Farzanegan and Hayo [
3].
Due to data availability, the number of observations in our seven specifications in
Table 2 is different, but all coefficients of the dummy variable
Lifted show the same direction and are statistically significant on the 1% level. Additionally, we lose observations by calculating the first differences and adding time lags of the dependent variable. In parentheses, we report robust standard errors clustered on the province level, and the significance levels are shown by one to three asterisks, where three asterisks refer to the 1% level, two asterisks refer to the 5% level, and one asterisk refers to the 10% level. The significant effect is also true for the time lags of our shadow economy indicator that is statistically significant and negative, as expected from earlier studies [
3]. The other control variables, such as different economic sectors, show mixed results. First, the coefficient of the first difference of industrial value added divided by total value added is negative and statistically significant on the 1% level in specifications 2.6 and 2.7 of
Table 2, thus an increase in industrial value added will, on average, decrease the shadow economy growth. This effect is expected and can be explained through the shift of informal industrial companies and workforce to the formal sector. In this case, the shadow economy serves as a substitute for the formal economy.
Second, the coefficient of the first difference of agriculture value added divided by total value added is negative and statistically significant on the 1% level in specification 2.7 of
Table 2; thus, an increase in agriculture value added will, on average, decrease the shadow economy growth. This effect is expected and can be explained through the shift of the informal agricultural workforce to the formal sector. In this case, the shadow economy serves as a substitute for the formal economy. Third, the coefficient of the first difference of services value added divided by total value added, which is reported in
Table A3 of the
Appendix A, is positive and statistically significant on the 1% level in specification 3.6. It was not reported in
Table 2 because it was omitted due to collinearity with the other two sectors. This effect is not expected and would assume that both the formal and informal service sectors serve as complements. This means that an increase in the service value added will increase the shadow economy growth. A possible explanation could be that a part of the workforce in the service sector will not be employed in the formal economy, so the growth of the official service sector might also increase the informal economy.
Moreover, the results suggest that an increase in unemployment is associated with an increase in shadow economy growth, as reflected by the coefficients in specifications 2.5 and 2.6 of
Table 2, which are statistically significant on the 1% and 10% levels, respectively. This effect was expected, as an increase in unemployment will increase the number of people who are seeking jobs in the informal economy. The latter is also considered a safety net in the context of developing countries if the government does not provide any form of unemployment benefits. Firoozabadi et al. show in their case study of the province Sistan and Baluchistan how unemployment pushes people into the informal economy [
54]. However, our result for unemployment is not robust to the inclusion of other control variables such as the value added of different economic sectors. Similar to other control variables used in this study, the available time period is very limited, and as reflected in
Table 2, the number of observations in our specifications significantly reduces when adding some of the control variables. Therefore, there is a systematic shortening of the time period, and we should be careful in the overinterpretation of the control variables. As we do not want to lose observations in our shorter specifications, we kept as many observations as possible and did not limit them to the observations of specification 2.7. Overall, our main finding is that the variable of interest, the dummy variable of lifted sanctions, is statistically significant when adding further control variables or changing the specifications in other ways, as presented in
Table 2 and
Table A3 in the
Appendix A.
5. Discussion
In our study, we used an approach to estimate the change of shadow economy over time utilizing NTL data because there is no direct way of measuring the size or behavior of the shadow economy. This approach is comparable to other indirect ways of measuring the shadow economy, such as the currency demand approach, the electricity demand approach, or the labor force approach [
6,
50]. A more sophisticated approach is the MIMIC model, which uses multiple indicators and multiple causes and is usually used to determine the size of the shadow economy on the country level. This modeling approach, however, needs a large amount of data which we usually do not have for the province level, especially in the context of developing countries. Therefore, remote sensing data such as the NTL are an enormous help to shed light on the shadow economy in lower administrative units than the country level.
However, there are also several weaknesses of the NTL approach, and therefore limitations to our study. Firstly, we have the strong premise that NTL measures economic activity. An indication of this connection is the correlation of the mean of NTL and the GDP of 31 Iranian provinces. Pearson’s correlation coefficient for the two data series is 0.65 based on 570 observations, which suggests a strong positive relationship. This has also been shown in several previous studies [
24,
29,
31,
34]. Secondly, we have a strong premise that the remaining part, when subtracting GDP from NTL, is connected to shadow economy activity. This phenomenon has also been widely discussed in the literature [
3,
27,
28,
32]. If these two premises hold, our approach will reflect the growth rate of the shadow economy.
However, in previous studies, nighttime lights have been used to measure different other forms of human activity, which might not all be associated with the shadow economy, for example, non-commercial private household electricity use. In addition, NTL might also contain other nighttime light sources that are not usually associated with formal or informal economic activities, for example, wildfires. Fortunately, this type of measurement error was removed in the data preparation process by Li et al. [
8] and other researchers who have worked on the DMSP/OLS and VIIRS/DNB datasets before [
60,
61,
62]. Another limitation is that the effect of our dummy variable for the lifting of sanctions only reflects the short-term effect on the shadow economy growth; thus, we do not know if this short period of lifted sanctions has an impact in the long run. We rather argue that the shadow economy is rapidly adapting to economic challenges and thus might only be affected by this shock for a short period of time. Moreover, we do not measure the size of the shadow economy, but only the changes of the shadow economy due to international sanctions.


