Crop Rotation Modeling for Deep Learning-Based Parcel Classification from Satellite Time Series
Abstract
:1. Introduction
1.1. Single-Year Crop-Type Classification
1.2. Multi-Year Agricultural Optimization
1.3. Multi-Year Crop Type Classification
- We propose a straightforward training scheme to leverage multi-year data and show its impact on yearly agricultural parcel classification.
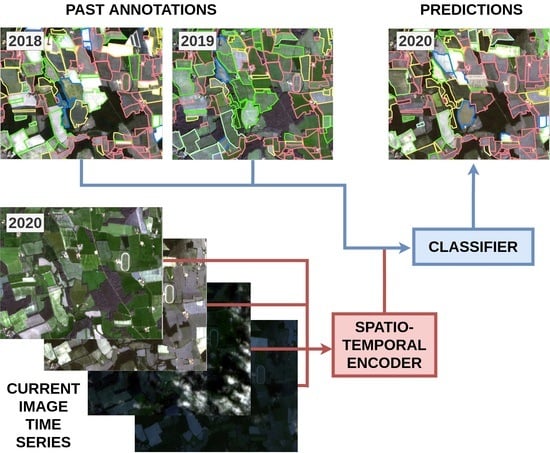
- We introduce a modified attention-based temporal encoder able to model both inter- and intra-annual dynamics of agricultural parcels, yielding a large improvement in terms of precision.
- We present the first open-access multi-year dataset [35] for crop classification based on Sentinel-2 images, along with the full implementation of our model.
- Our code in open-source at the following repository: https://github.com/felixquinton1/deep-crop-rotation, accessed on 11 November 2021.
2. Materials and Methods
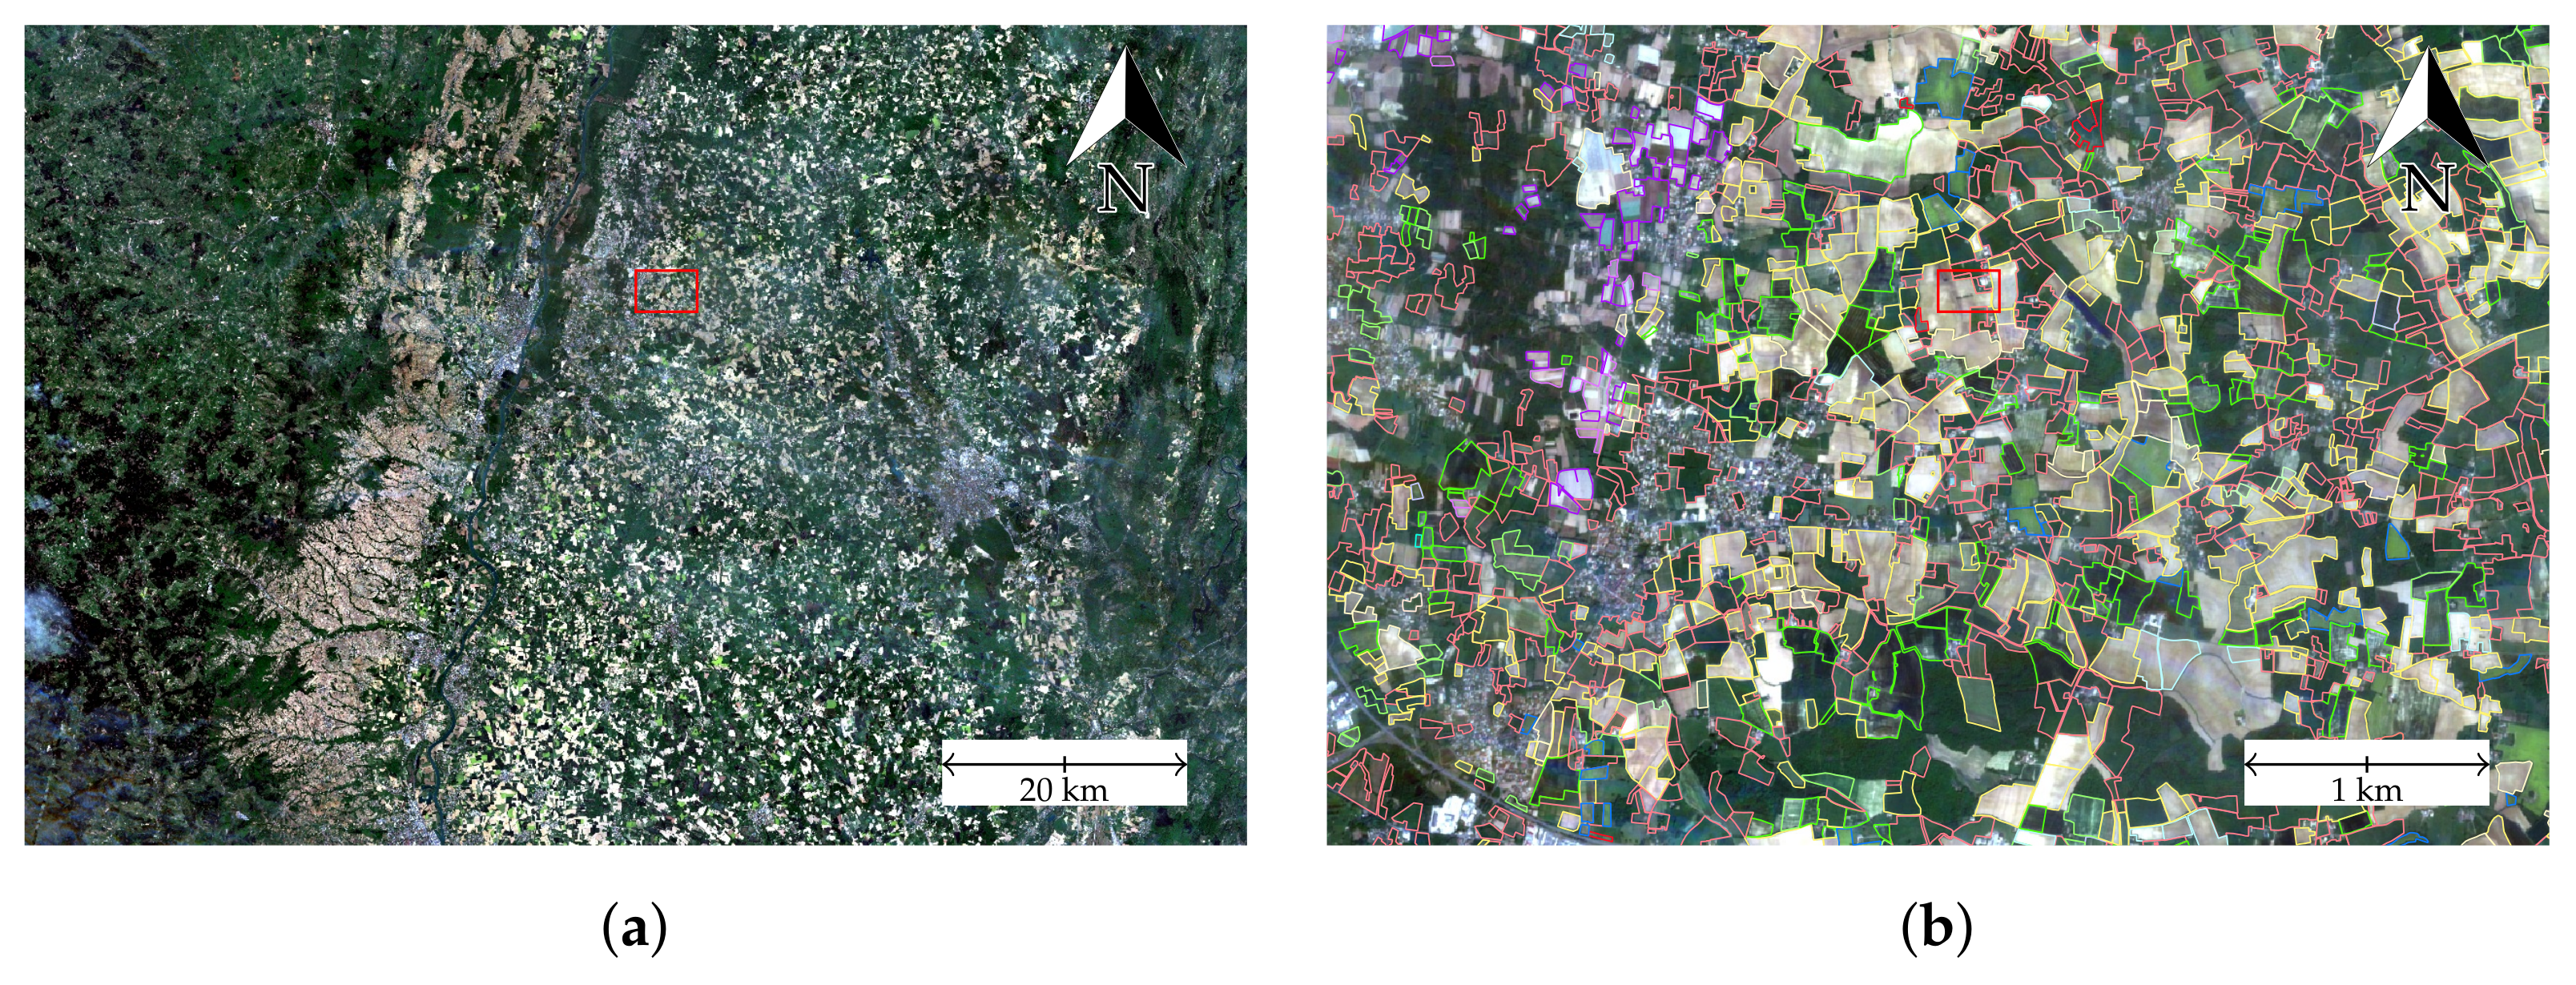
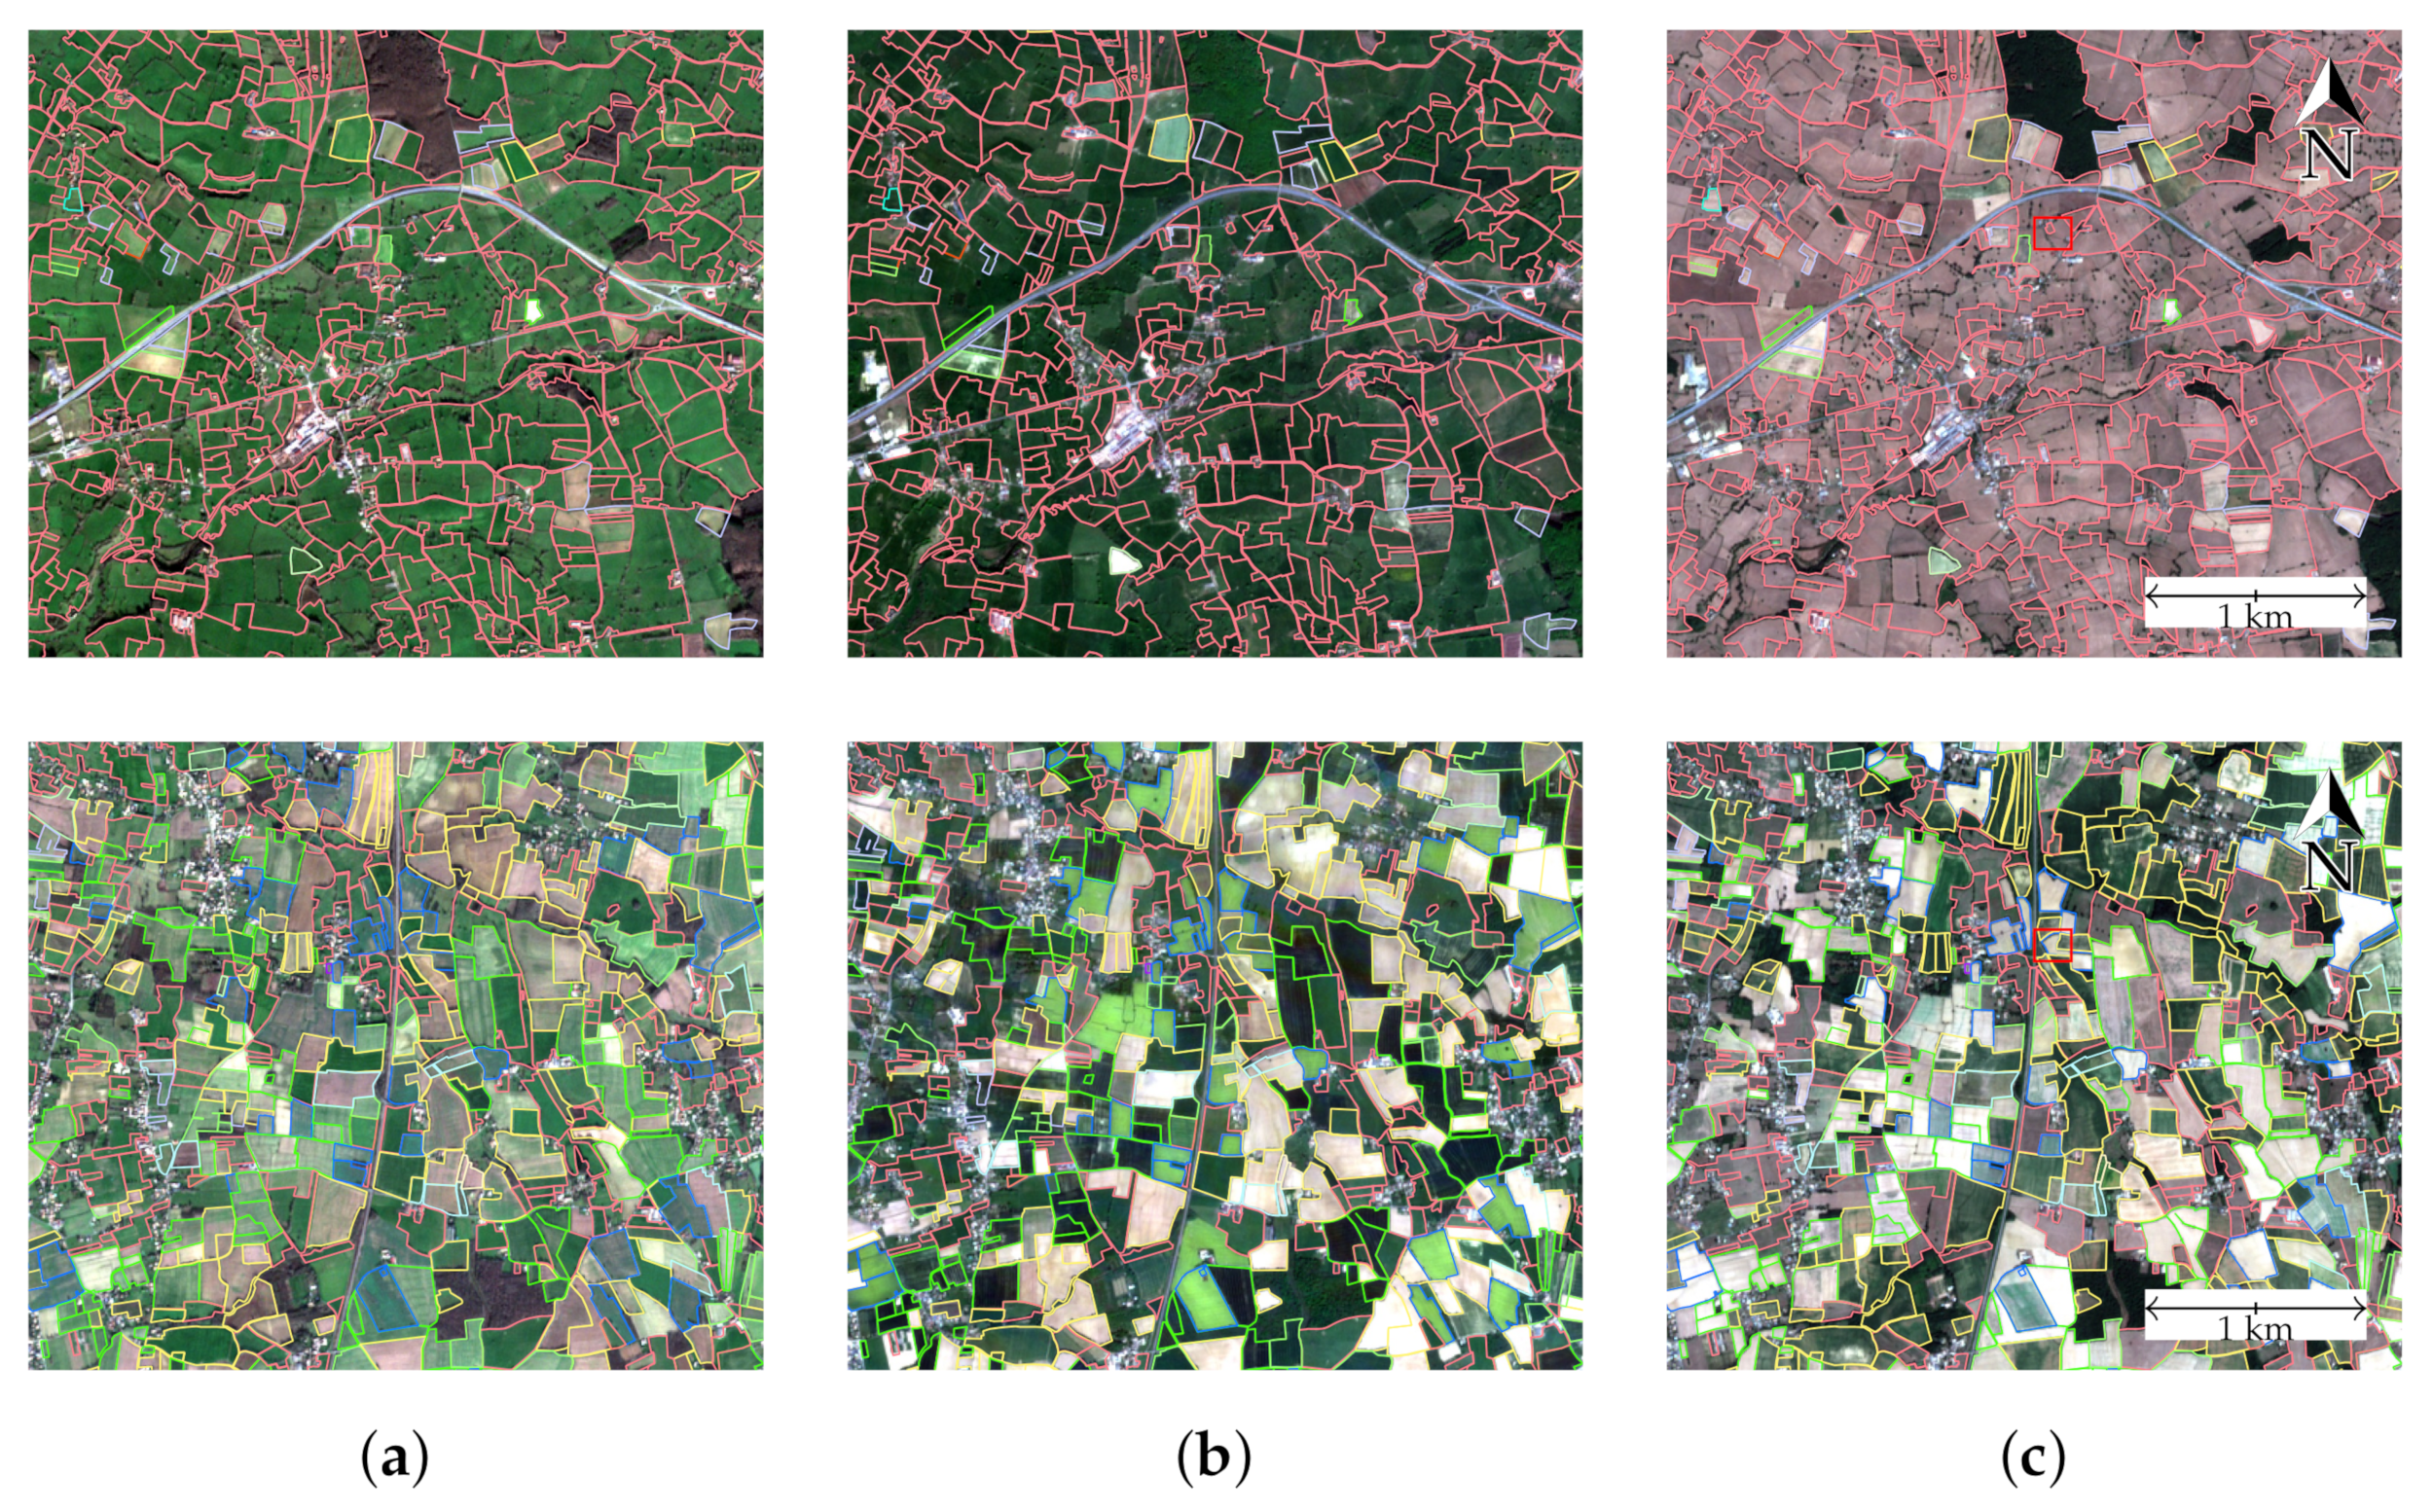
2.1. Dataset
2.2. Pixel-Set and Temporal Attention Encoders
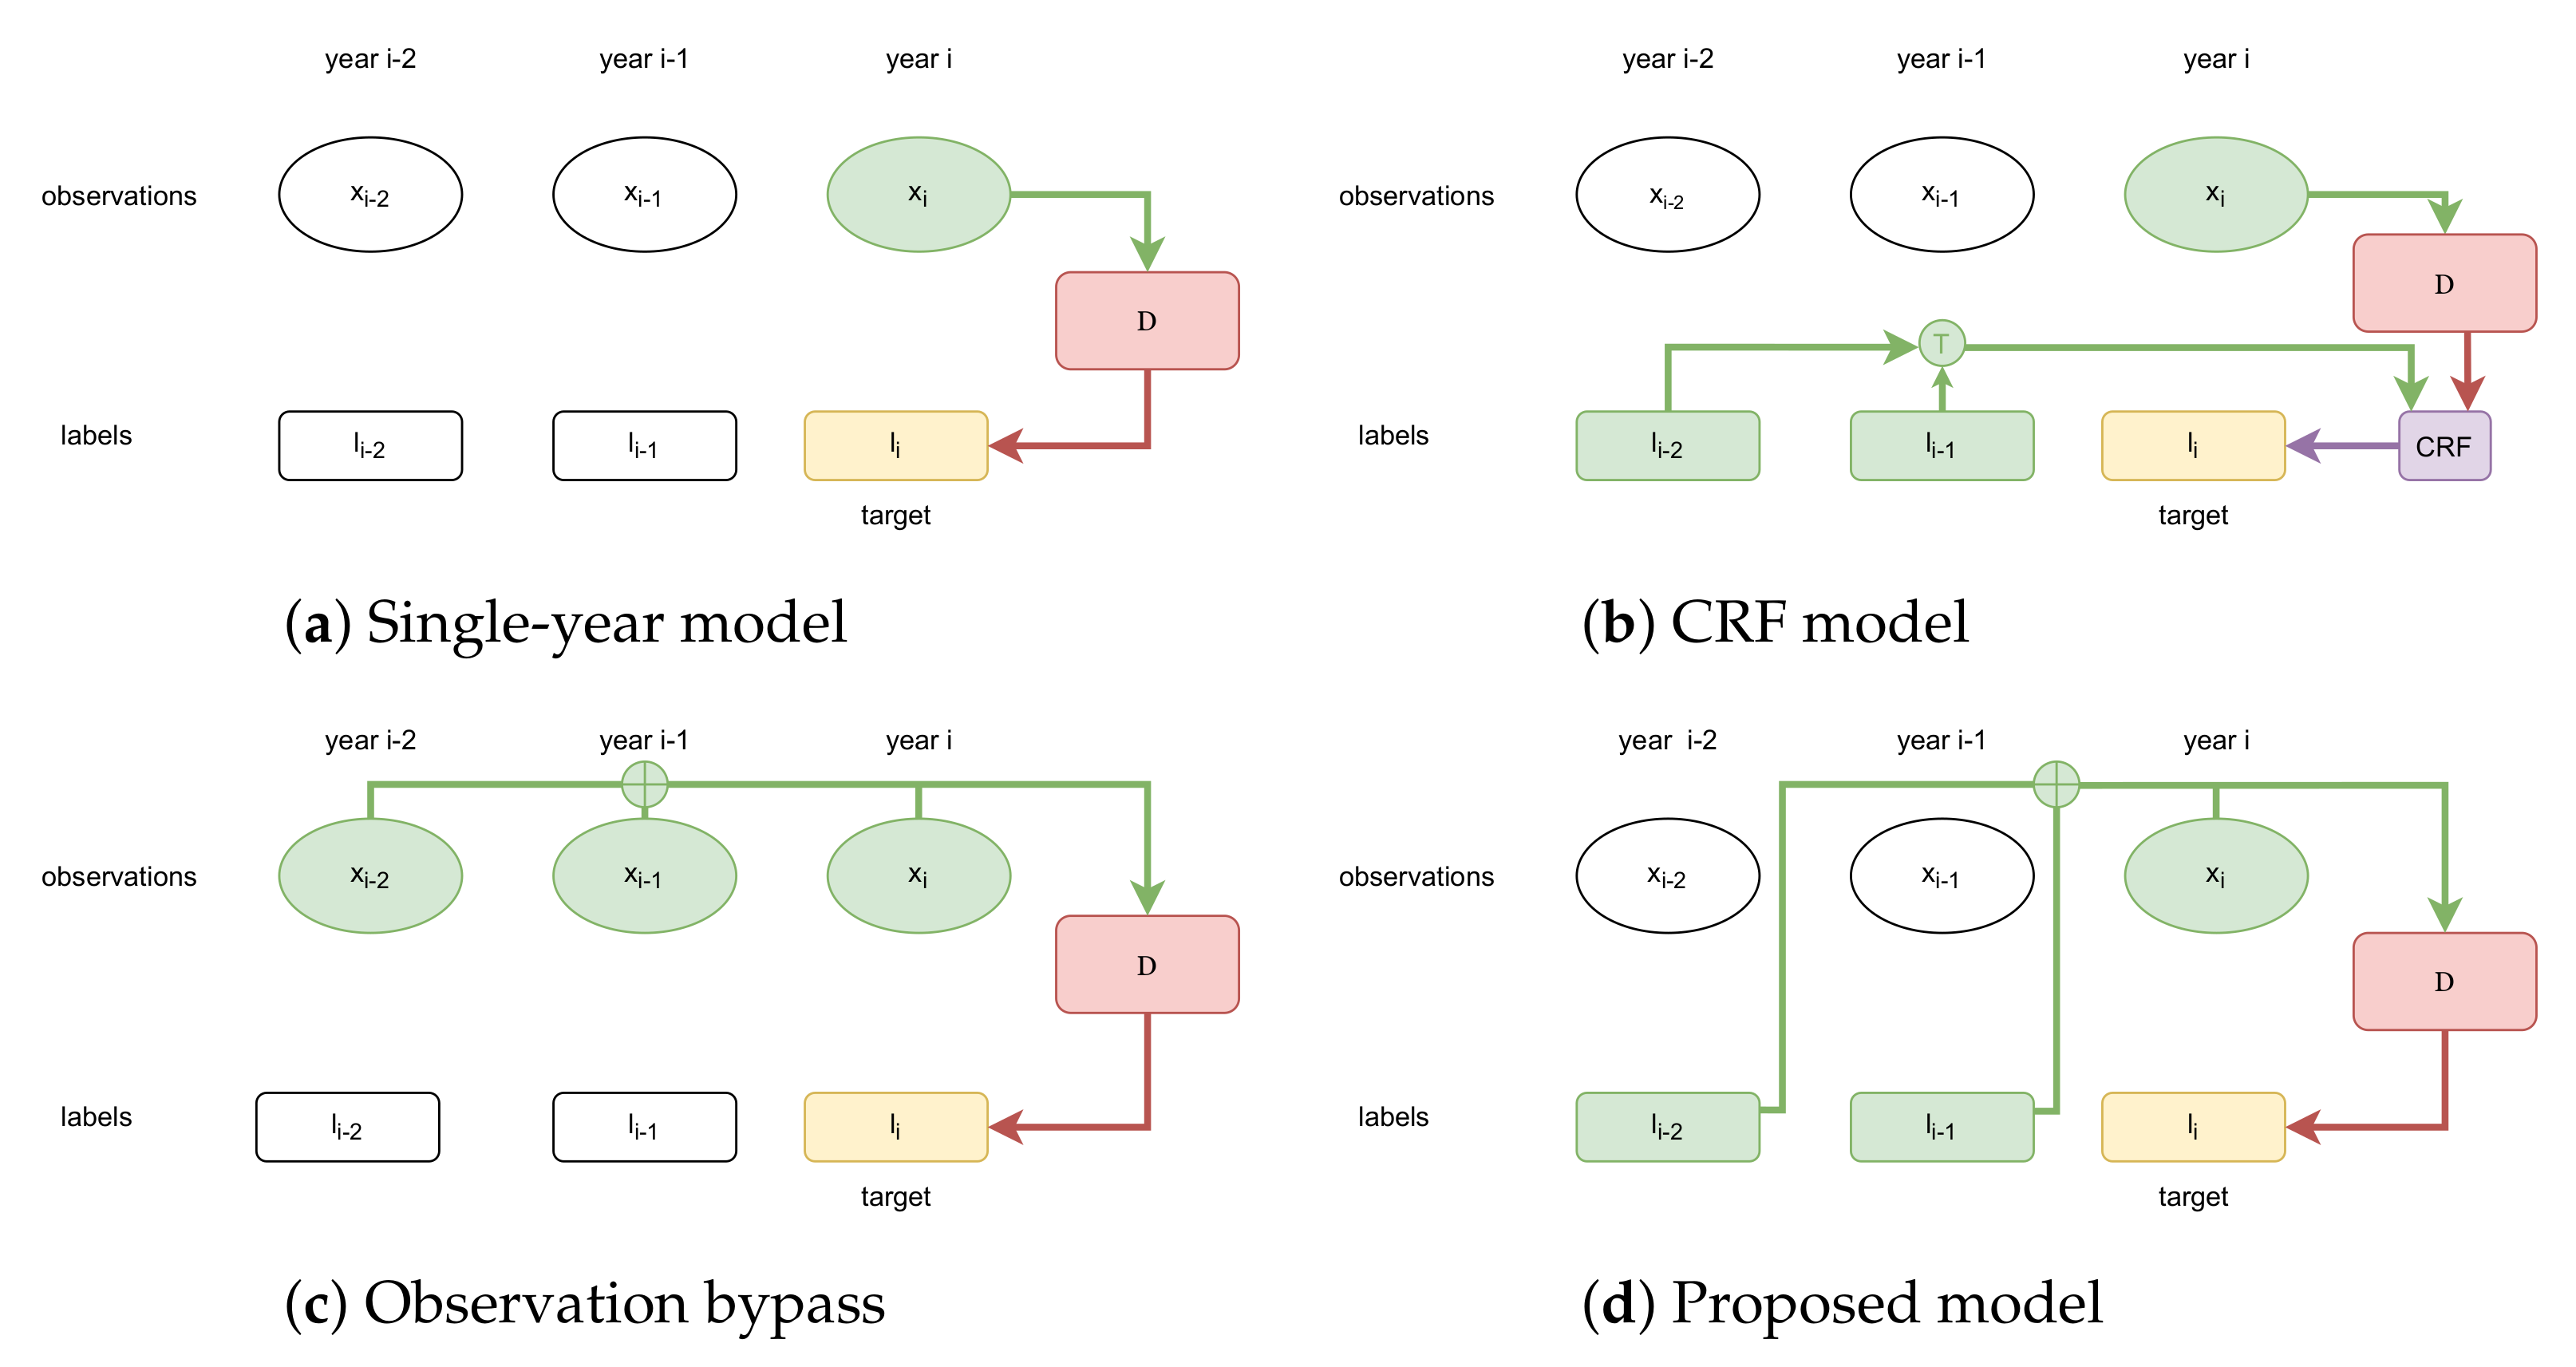
2.3. Multi-Year Modeling
- We only consider the last two previous years because of the limited span of our available data. However, it would be straightforward to extend our approach to a longer duration.
- We consider that the history of a parcel is completely described by its past cultivated crop types, and we do not take the past satellite observations into account. In other words, the label at year i is independent from past observations conditionally to its past labels [39] (Chapter 2). This design choice allows the model to stay tractable in terms of memory requirements.
- The labels of the past two years are summed and not concatenated. The information about the order in which the crops were cultivated is then lost, but this results in a more compact model.
2.4. Baseline Models
2.5. Training Protocol
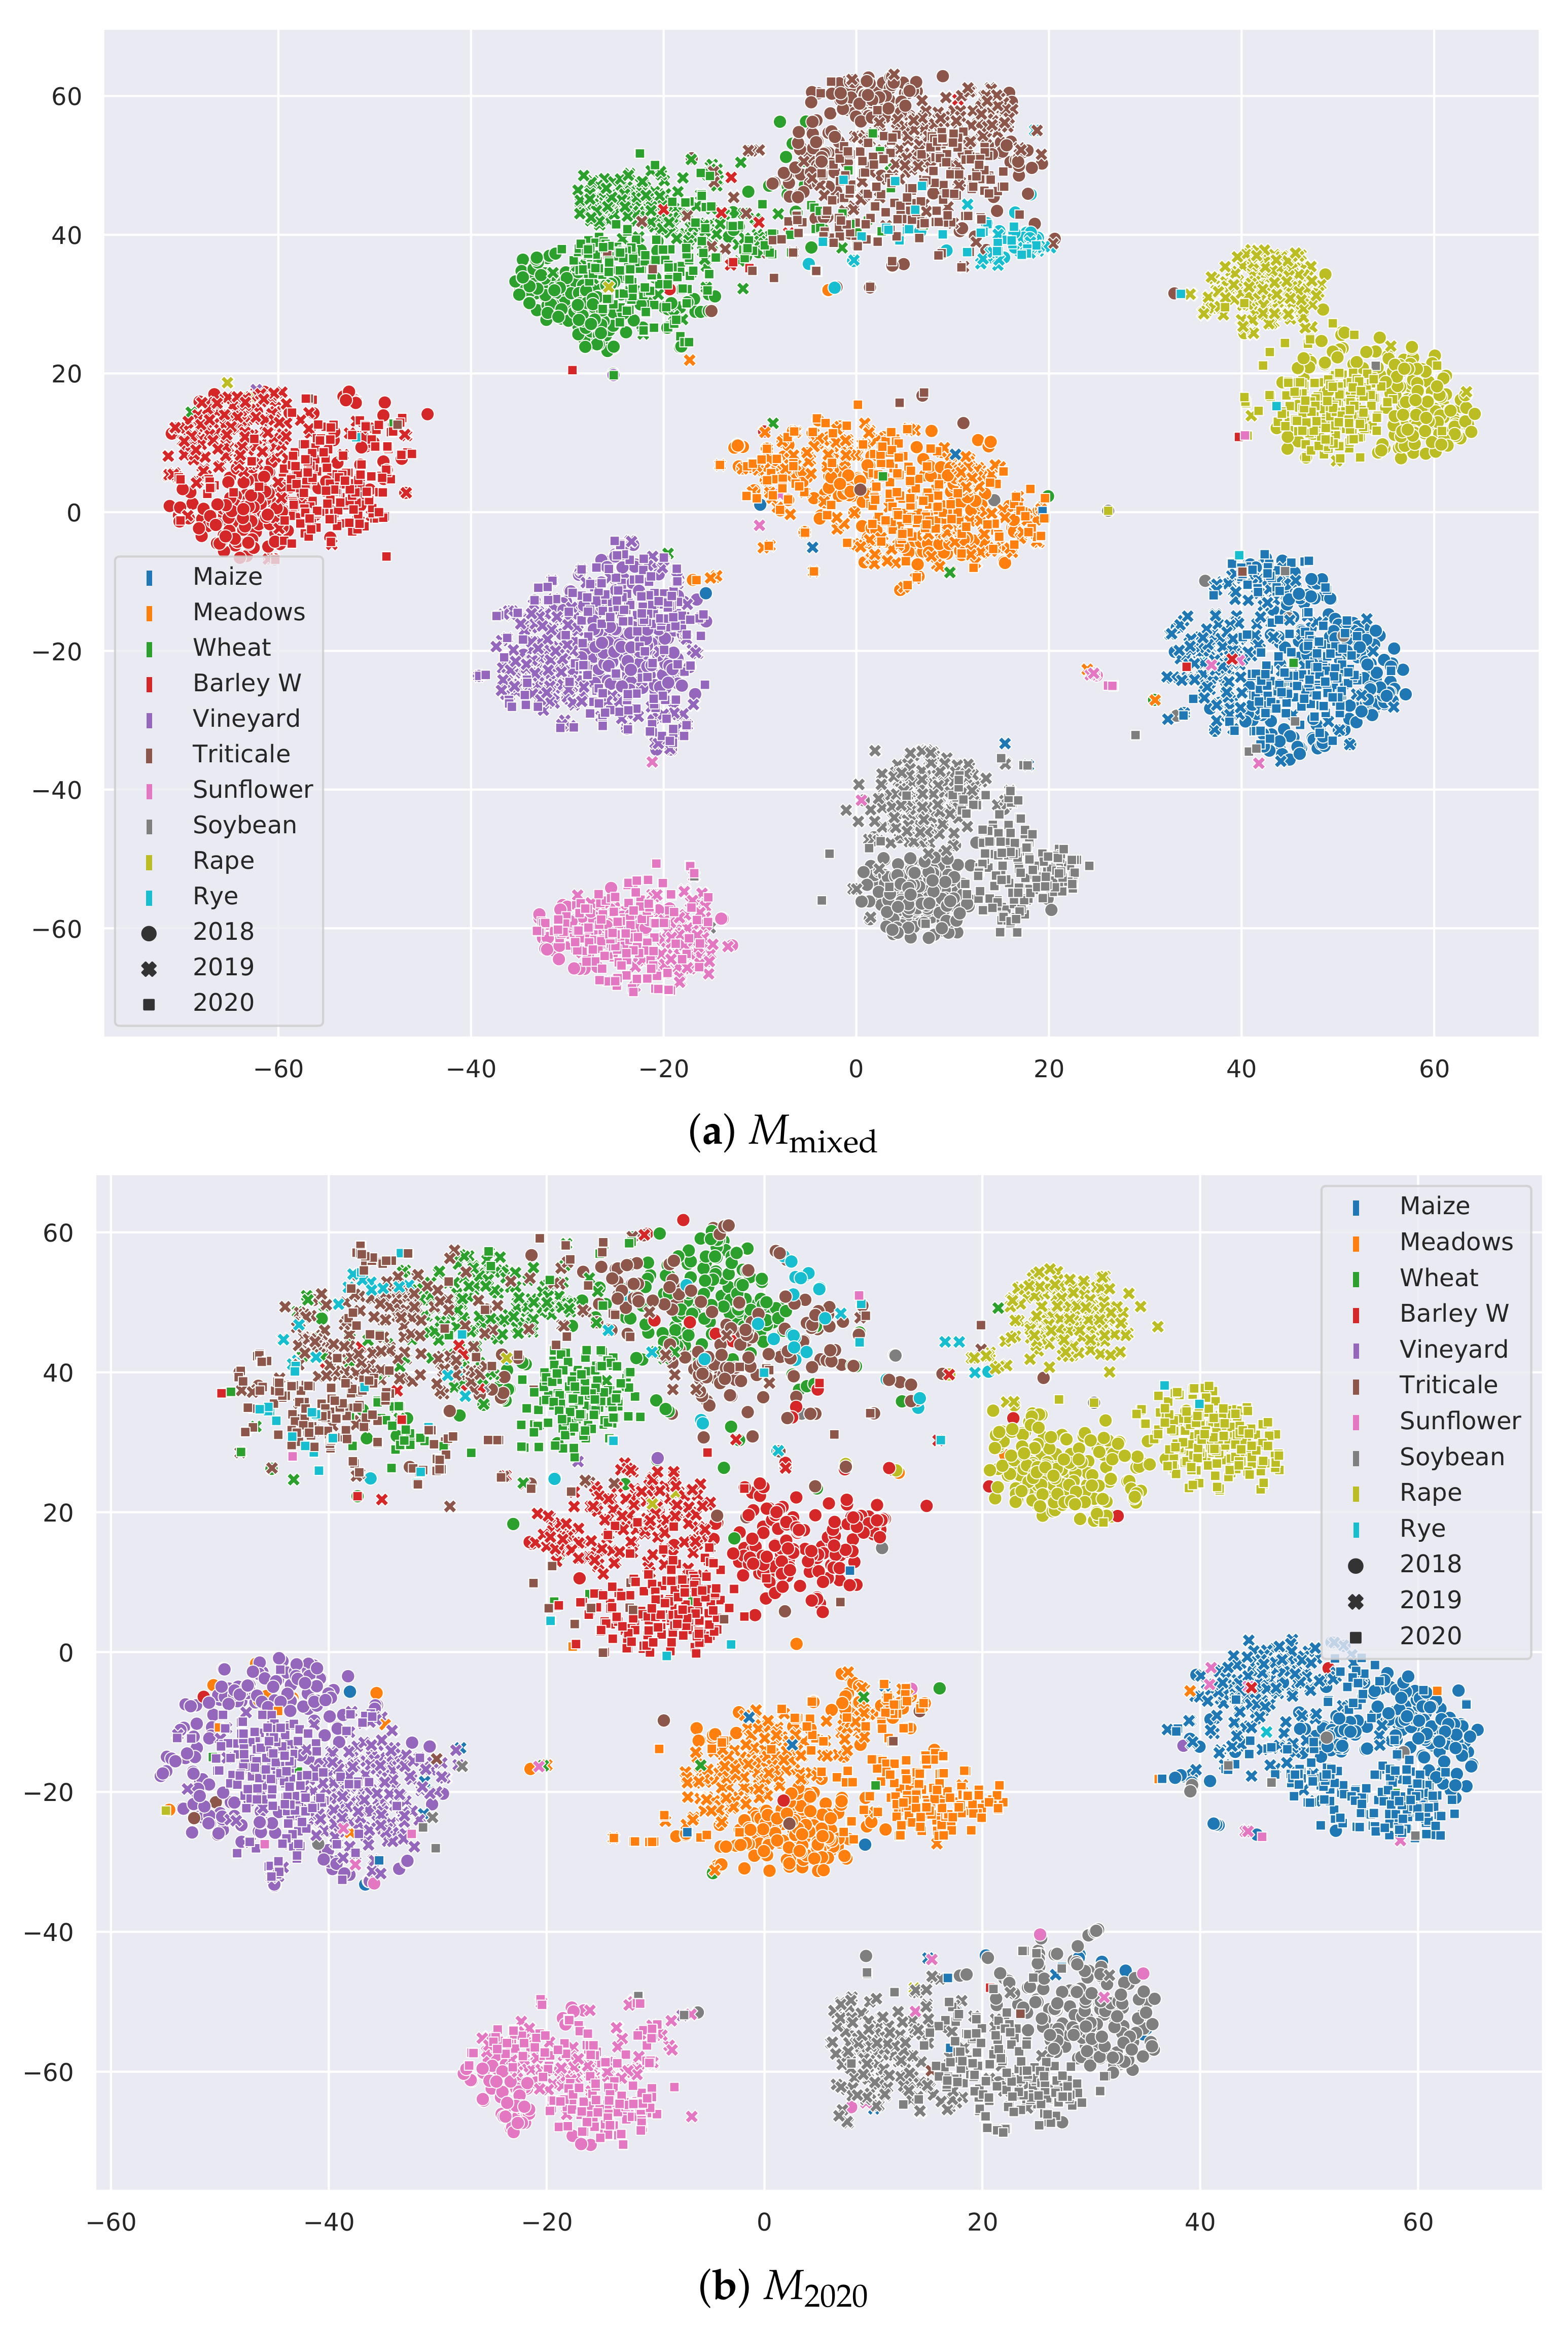
2.5.1. Mixed-Year Training
2.5.2. Cross-Validation
2.6. Evaluation Metrics
3. Results
3.1. Training Protocol
3.2. Influence of Crop Rotation Modeling
- Permanent Culture. Classes within this group are such that at least 90% of the observed successions are constant over three years. Contains Meadow, Vineyard, and Wood Pasture.
- Structured Culture. A crop is said to be structured if, when grown in 2018, over 75% of the observed three year successions fall into 10 different rotations or less, and is not permanent. Contains Rapeseed, Sunflower, Soybean, Alfalfa, Leguminous, Flowers/Fruits/vegetables, and Potato.
- Other. All other classes.
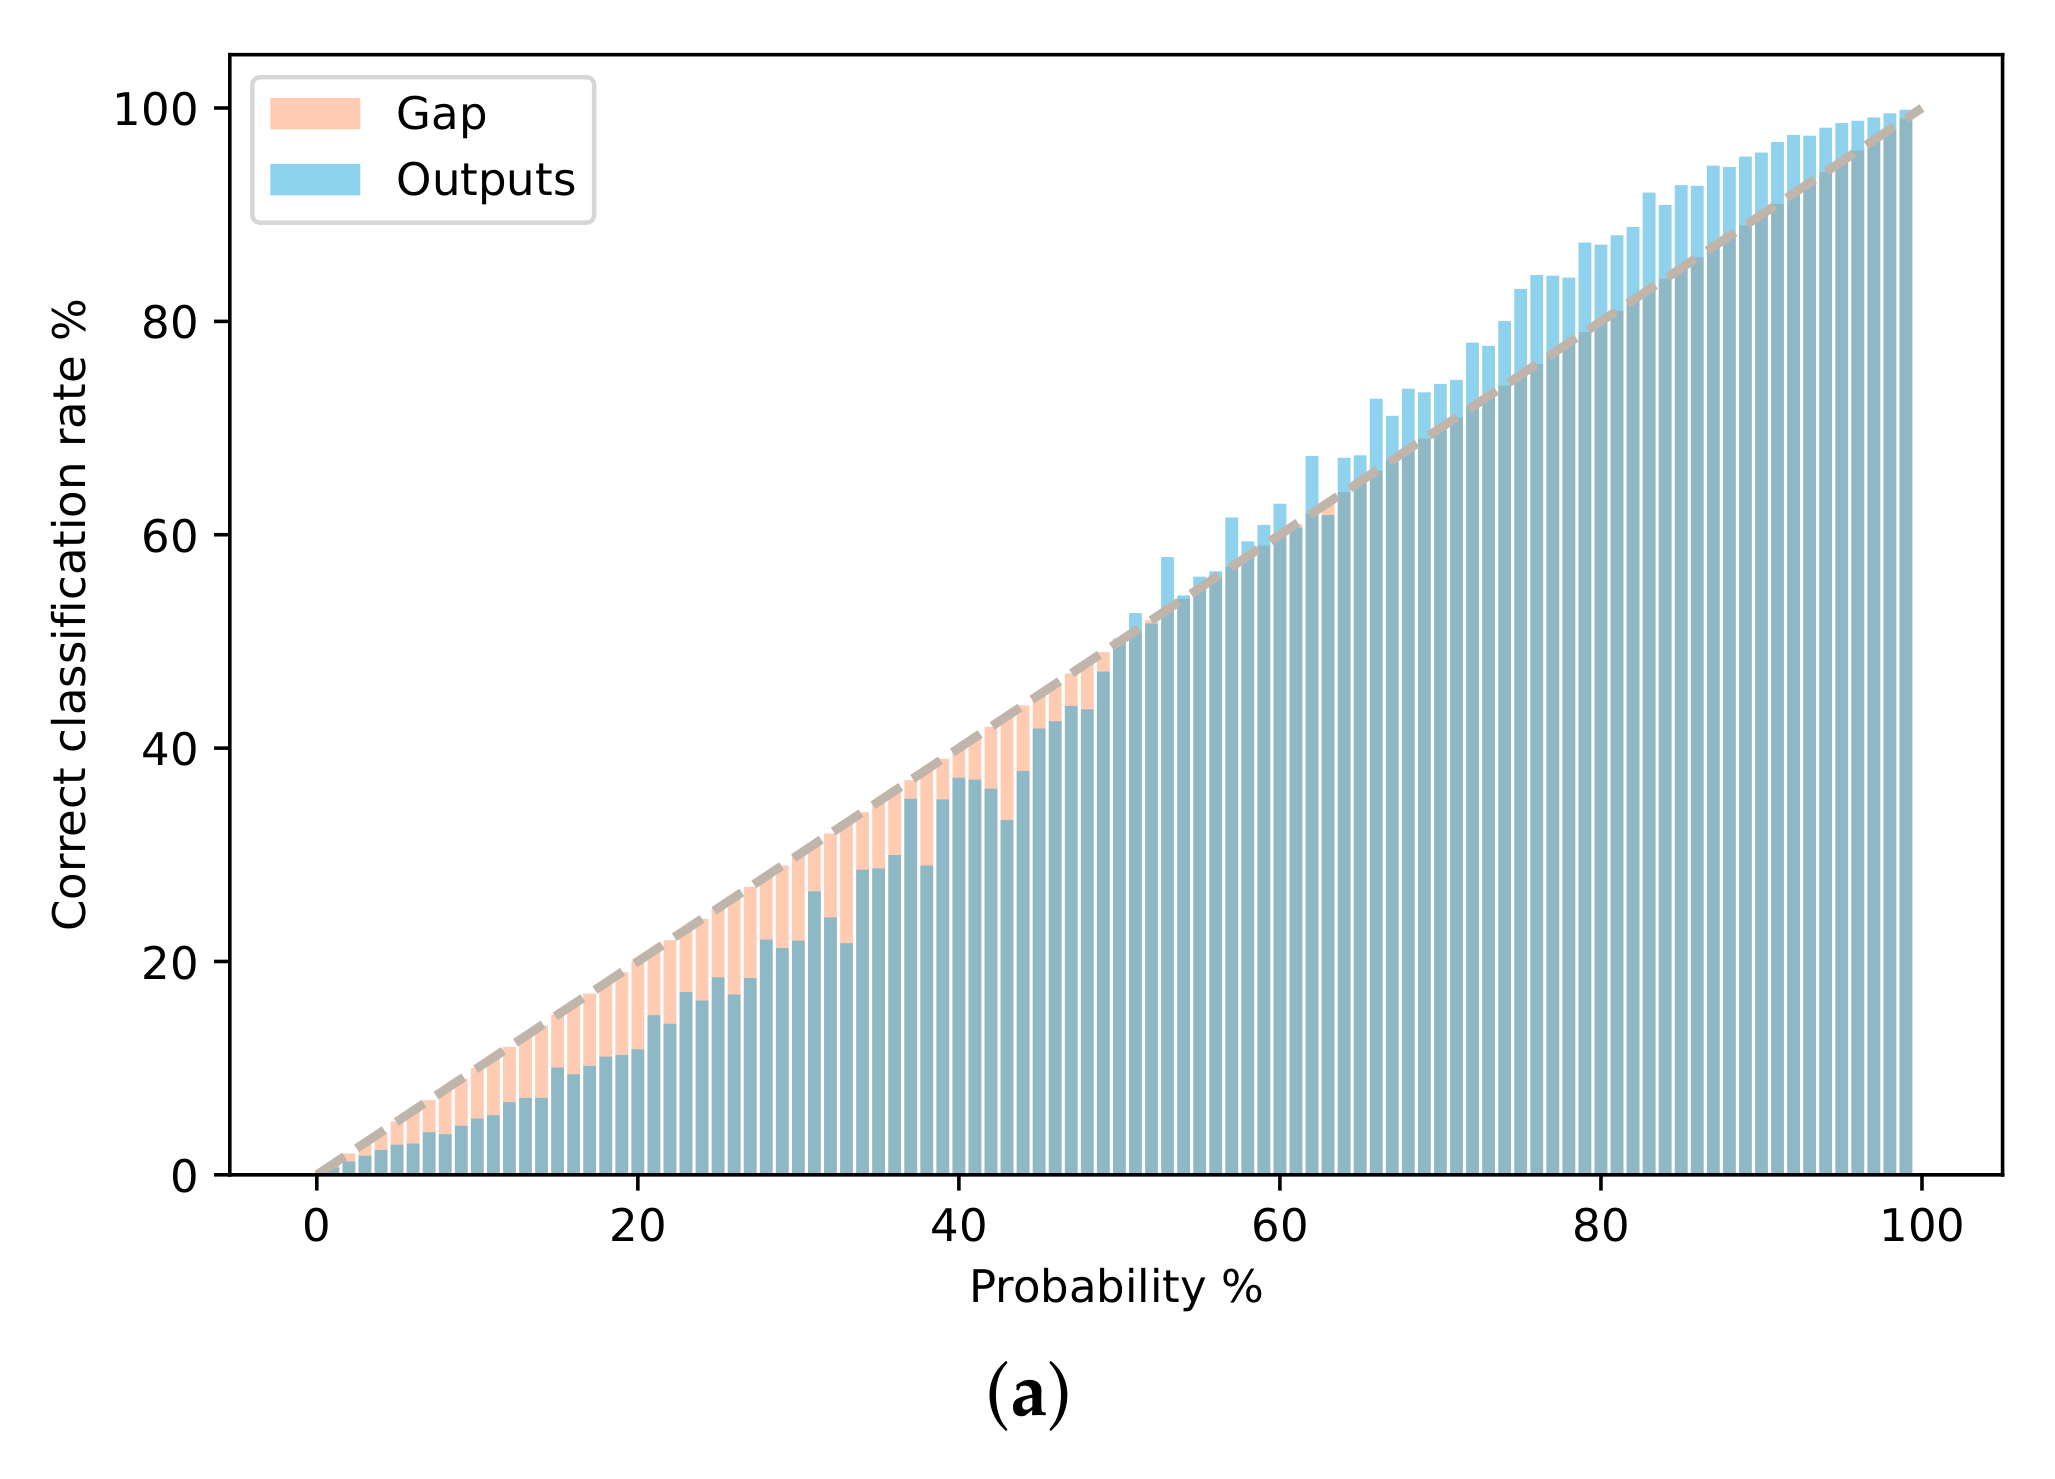
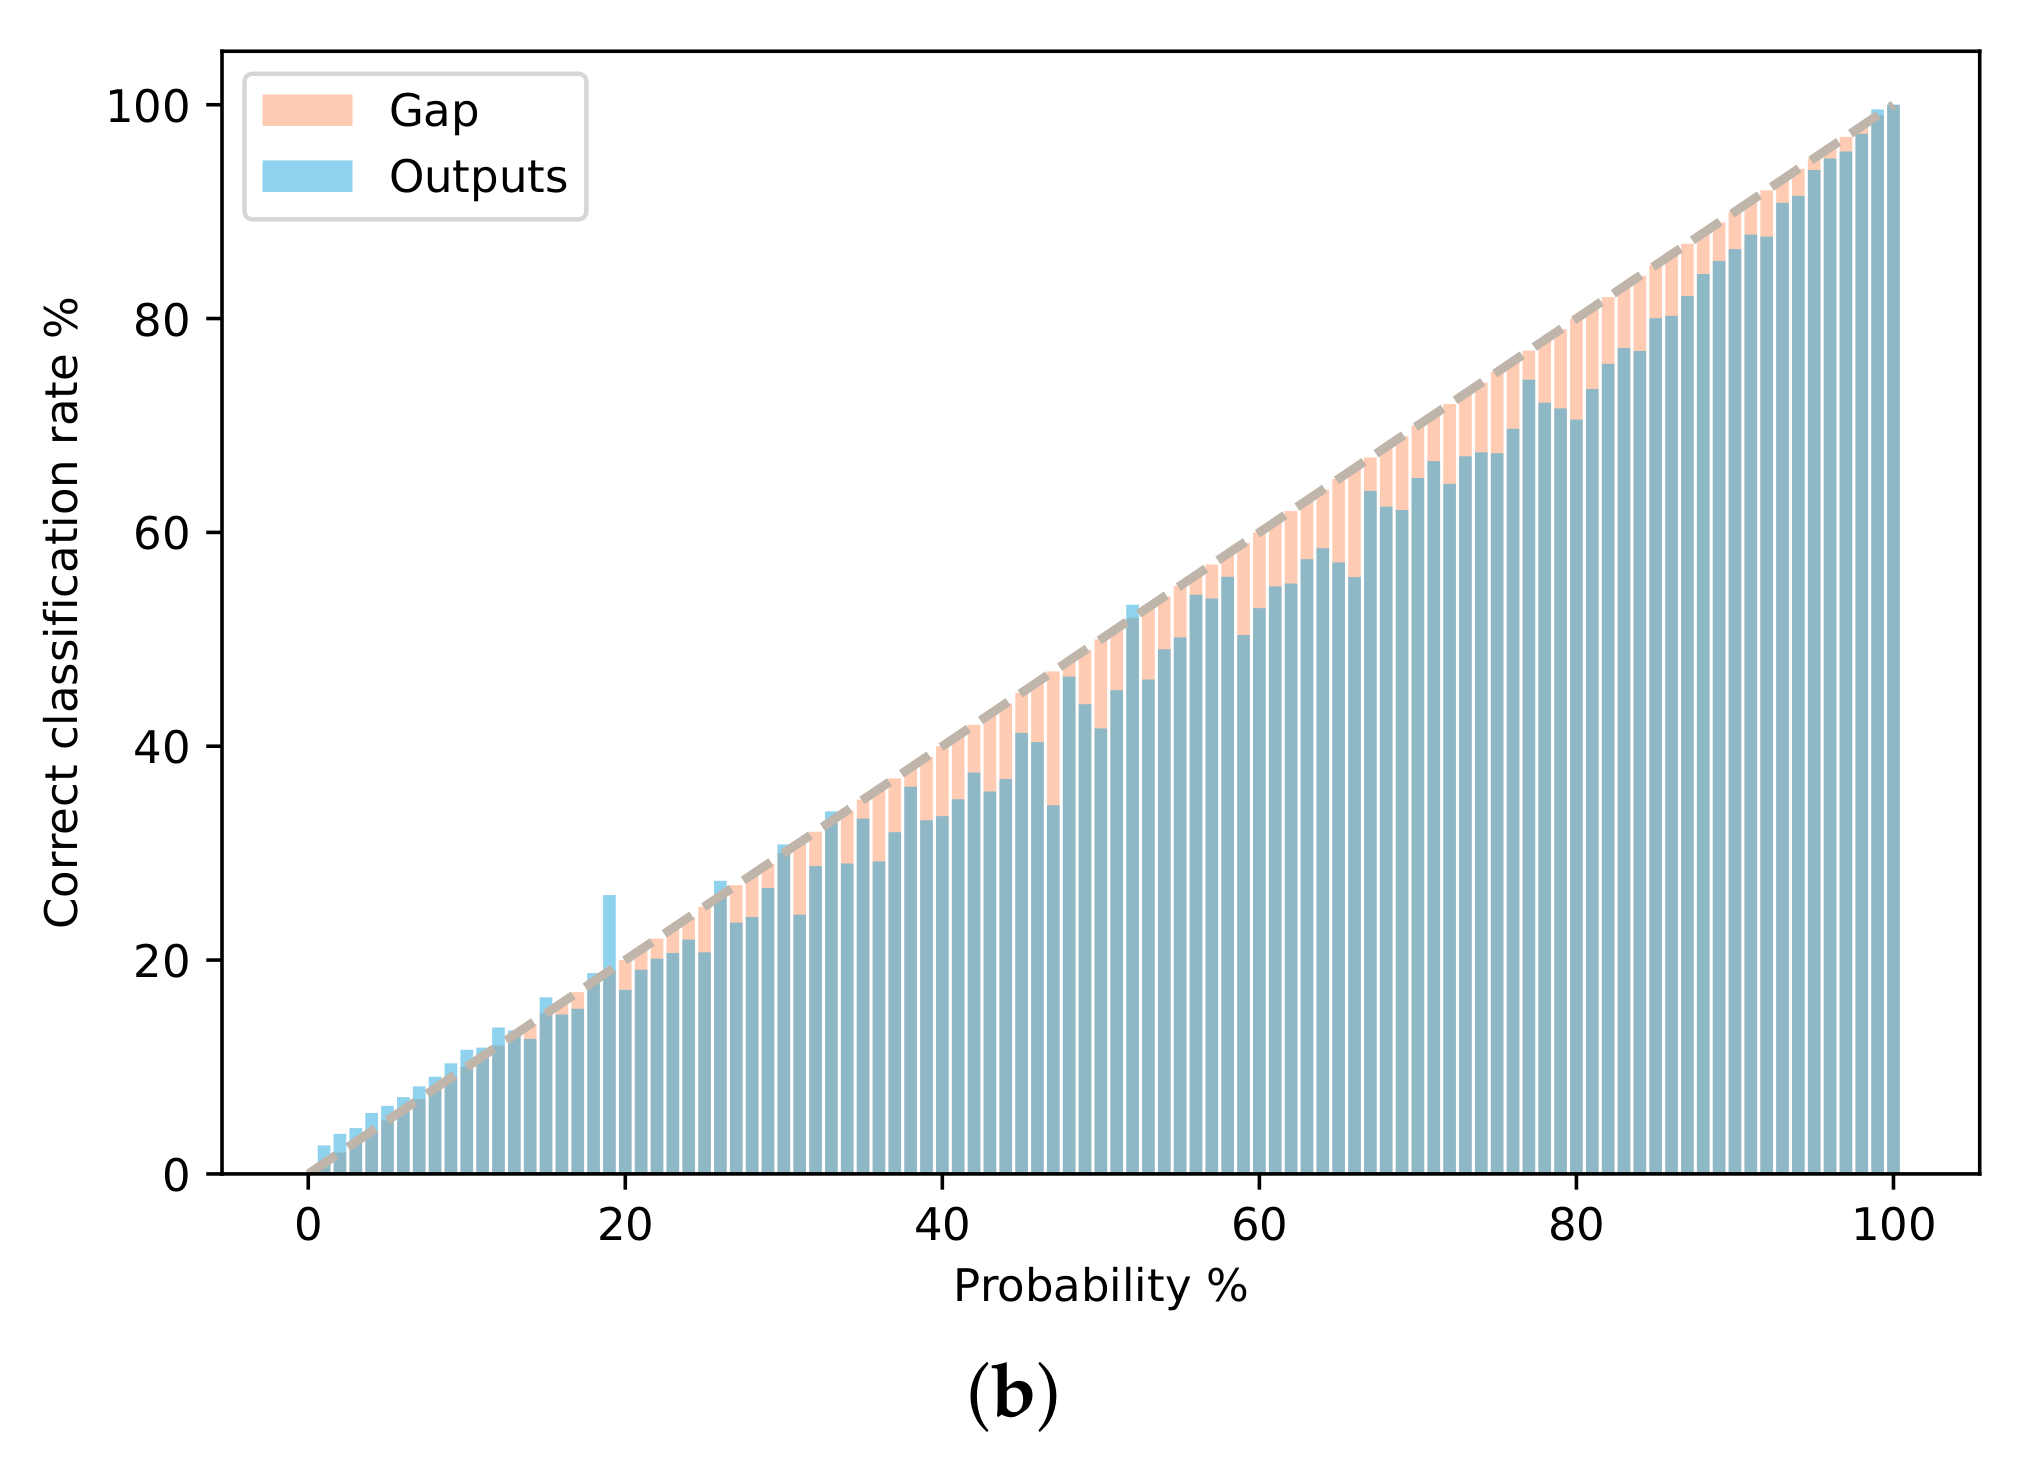
3.3. Model Calibration
4. Discussion
4.1. Choice of Backbone Network
4.2. Operational Setting
4.3. Scope of the Study
4.4. Applicability of Our Model
5. Conclusions
Author Contributions
Funding
Data Availability Statement
Acknowledgments
Conflicts of Interest
Abbreviations
| CNN | Convolutional Neural Network |
| MLP | Multi Layer Perceptron |
| RNN | Recurrent Neural Network |
| PSE | Pixel Set encoder |
| TAE | Temporal Attention Encoder |
| LTAE | Lightweight Temporal Attention Encodeur |
| ECE | Expected Calibration Error |
| CAP | Common Agricultural Policy |
| LPIS | Land-Parcel Identification System |
| SITS | Satellite Image Time Series |
| CRF | Conditional Random Fields |
References
- The Common Agricultural Policy at a Glance. Available online: https://ec.europa.eu/info/food-farming-fisheries/key-policies/common-agricultural-policy/cap-glance_en (accessed on 24 September 2021).
- Loudjani, P.; Devos, W.; Baruth, B.; Lemoine, G. Artificial Intelligence and EU Agriculture. 2020. Available online: https://marswiki.jrc.ec.europa.eu/wikicap/images/c/c8/JRC-Report_AIA_120221a.pdf (accessed on 10 October 2021).
- Koetz, B.; Defourny, P.; Bontemps, S.; Bajec, K.; Cara, C.; de Vendictis, L.; Kucera, L.; Malcorps, P.; Milcinski, G.; Nicola, L.; et al. SEN4CAP Sentinels for CAP monitoring approach. In Proceedings of the JRC IACS Workshop, Valladolid, Spain, 10–11 April 2019. [Google Scholar]
- Drusch, M.; Del Bello, U.; Carlier, S.; Colin, O.; Fernandez, V.; Gascon, F.; Hoersch, B.; Isola, C.; Laberinti, P.; Martimort, P.; et al. Sentinel-2: ESA’s optical high-resolution mission for GMES operational services. Remote Sens. Environ. 2012, 120, 25–36. [Google Scholar] [CrossRef]
- Registre Parcellaire Graphique (RPG): Contours des Parcelles et îlots Culturaux et Leur Groupe de Cultures Majoritaire. Available online: https://www.data.gouv.fr/en/datasets/registre-parcellaire-graphique-rpg-contours-des-parcelles-et-ilots-culturaux-et-leur-groupe-de-cultures-majoritaire/ (accessed on 24 September 2021).
- Garnot, V.S.F.; Landrieu, L.; Giordano, S.; Chehata, N. Satellite image time series classification with pixel-set encoders and temporal self-attention. In Proceedings of the IEEE/CVF Conference on Computer Vision and Pattern Recognition (CVPR), Seattle, WA, USA, 13–19 June 2020. [Google Scholar]
- Pelletier, C.; Webb, G.I.; Petitjean, F. Deep learning for the classification of Sentinel-2 image time series. In Proceedings of the IGARSS 2019—2019 IEEE International Geoscience and Remote Sensing Symposium, Yokohama, Japan, 28 July–2 August 2019. [Google Scholar]
- Rußwurm, M.; Körner, M. Self-attention for raw optical satellite time series classification. ISPRS J. Photogramm. Remote Sens. 2020, 169, 421–435. [Google Scholar] [CrossRef]
- Zheng, B.; Myint, S.W.; Thenkabail, P.S.; Aggarwal, R.M. A support vector machine to identify irrigated crop types using time-series Landsat NDVI data. Int. J. Appl. Earth Obs. Geoinf. 2015, 34, 103–112. [Google Scholar] [CrossRef]
- Vuolo, F.; Neuwirth, M.; Immitzer, M.; Atzberger, C.; Ng, W.T. How much does multi-temporal Sentinel-2 data improve crop type classification? Int. J. Appl. Earth Obs. Geoinf. 2018, 72, 122–130. [Google Scholar] [CrossRef]
- Siachalou, S.; Mallinis, G.; Tsakiri-Strati, M. A hidden Markov models approach for crop classification: Linking crop phenology to time series of multi-sensor remote sensing data. Remote Sens. 2015, 7, 3633–3650. [Google Scholar] [CrossRef] [Green Version]
- Belgiu, M.; Csillik, O. Sentinel-2 cropland mapping using pixel-based and object-based time-weighted dynamic time warping analysis. Remote Sens. Environ. 2018, 204, 509–523. [Google Scholar] [CrossRef]
- Kussul, N.; Lavreniuk, M.; Skakun, S.; Shelestov, A. Deep learning classification of land cover and crop types using remote sensing data. Geosci. Remote Sens. Lett. 2017, 14, 778–782. [Google Scholar] [CrossRef]
- Garnot, V.S.F.; Landrieu, L.; Giordano, S.; Chehata, N. Time-Space tradeoff in deep learning models for crop classification on satellite multi-spectral image time series. In Proceedings of the IGARSS 2019—2019 IEEE International Geoscience and Remote Sensing Symposium, Yokohama, Japan, 28 July–2 August 2019. [Google Scholar]
- Rußwurm, M.; Körner, M. Multi-temporal land cover classification with sequential recurrent encoders. ISPRS Int. J.-Geo-Inf. 2018, 7, 129. [Google Scholar] [CrossRef] [Green Version]
- Yuan, Y.; Lin, L. Self-Supervised Pretraining of Transformers for Satellite Image Time Series Classification. J. Sel. Top. Appl. Earth Obs. Remote Sens. 2020, 14, 474–487. [Google Scholar] [CrossRef]
- Kondmann, L.; Toker, A.; Rußwurm, M.; Unzueta, A.C.; Peressuti, D.; Milcinski, G.; Mathieu, P.P.; Longépé, N.; Davis, T.; Marchisio, G.; et al. DENETHOR: The DynamicEarthNET dataset for Harmonized, inter-Operable, analysis-Ready, daily crop monitoring from space. In Proceedings of the 35th Conference on Neural Information Processing Systems (NeurIPS 2021), Virtual, 6–14 December 2021. [Google Scholar]
- Garnot, V.S.F.; Landrieu, L. Lightweight temporal self-attention for classifying satellite images time series. In International Workshop on Advanced Analytics and Learning on Temporal Data; Springer: Berlin/Heidelberg, Germany, 2020. [Google Scholar]
- Schneider, M.; Körner, M. [Re] Satellite Image Time Series Classification with Pixel-Set Encoders and Temporal Self-Attention. In ML Reproducibility Challenge 2020; 2020; Available online: https://openreview.net/forum?id=r87dMGuauCl (accessed on 10 October 2021).
- Garnot, V.S.F.; Landrieu, L. Panoptic Segmentation of Satellite Image Time Series with Convolutional Temporal Attention Networks. In Proceedings of the IEEE/CVF International Conference on Computer Vision, Montreal, QC, Canada, 11–17 October 2021. [Google Scholar]
- Dury, J.; Schaller, N.; Garcia, F.; Reynaud, A.; Bergez, J.E. Models to support cropping plan and crop rotation decisions. A review. Agron. Sustain. Dev. 2012, 32, 567–580. [Google Scholar] [CrossRef] [Green Version]
- Dogliotti, S.; Rossing, W.; Van Ittersum, M. ROTAT, a tool for systematically generating crop rotations. Eur. J. Agron. 2003, 19, 239–250. [Google Scholar] [CrossRef]
- Myers, K.; Ferguson, V.; Voskoboynik, Y. Modeling Crop Rotation with Discrete Mathematics. One-Day Sustainability Modules for Undergraduate Mathematics Classes. DIMACS. Available online: http://dimacs.rutgers.edu/MPE/Sustmodule.html (accessed on 11 March 2015).
- Brankatschk, G.; Finkbeiner, M. Modeling crop rotation in agricultural LCAs—Challenges and potential solutions. Agric. Syst. 2015, 138, 66–76. [Google Scholar] [CrossRef]
- Detlefsen, N.K.; Jensen, A.L. Modelling optimal crop sequences using network flows. Agric. Syst. 2007, 94, 566–572. [Google Scholar] [CrossRef]
- Aurbacher, J.; Dabbert, S. Generating crop sequences in land-use models using maximum entropy and Markov chains. Agric. Syst. 2011, 104, 470–479. [Google Scholar] [CrossRef]
- Bachinger, J.; Zander, P. ROTOR, a tool for generating and evaluating crop rotations for organic farming systems. Eur. J. Agron. 2007, 26, 130–143. [Google Scholar] [CrossRef]
- Schönhart, M.; Schmid, E.; Schneider, U.A. CropRota—A crop rotation model to support integrated land use assessments. Eur. J. Agron. 2011, 34, 263–277. [Google Scholar] [CrossRef]
- Levavasseur, F.; Martin, P.; Bouty, C.; Barbottin, A.; Bretagnolle, V.; Thérond, O.; Scheurer, O.; Piskiewicz, N. RPG Explorer: A new tool to ease the analysis of agricultural landscape dynamics with the Land Parcel Identification System. Comput. Electron. Agric. 2016, 127, 541–552. [Google Scholar] [CrossRef]
- Kollas, C.; Kersebaum, K.C.; Nendel, C.; Manevski, K.; Müller, C.; Palosuo, T.; Armas-Herrera, C.M.; Beaudoin, N.; Bindi, M.; Charfeddine, M.; et al. Crop rotation modelling—A European model intercomparison. Eur. J. Agron. 2015, 70, 98–111. [Google Scholar] [CrossRef]
- Osman, J.; Inglada, J.; Dejoux, J.F. Assessment of a Markov logic model of crop rotations for early crop mapping. Comput. Electron. Agric. 2015, 113, 234–243. [Google Scholar] [CrossRef] [Green Version]
- Giordano, S.; Bailly, S.; Landrieu, L.; Chehata, N. Improved Crop Classification with Rotation Knowledge using Sentinel-1 and-2 Time Series. Photogramm. Eng. Remote Sens. 2018, 86, 431–441. [Google Scholar] [CrossRef]
- Bailly, S.; Giordano, S.; Landrieu, L.; Chehata, N. Crop-rotation structured classification using multi-source Sentinel images and lpis for crop type mapping. In Proceedings of the IGARSS 2018—2018 IEEE International Geoscience and Remote Sensing Symposium, Valencia, Spain, 22–27 July 2018. [Google Scholar]
- Yaramasu, R.; Bandaru, V.; Pnvr, K. Pre-season crop type mapping using deep neural networks. Comput. Electron. Agric. 2020, 176, 105664. [Google Scholar] [CrossRef]
- Multi-Year Dataset. Available online: https://zenodo.org/record/5535882 (accessed on 10 October 2021). [CrossRef]
- Baghdadi, N.; Leroy, M.; Maurel, P.; Cherchali, S.; Stoll, M.; Faure, J.F.; Desconnets, J.C.; Hagolle, O.; Gasperi, J.; Pacholczyk, P. The Theia land data centre. In Proceedings of the Remote Sensing Data Infrastructures (RSDI) International Workshop, La Grande Motte, France, 1 October 2015. [Google Scholar]
- Qi, C.R.; Su, H.; Mo, K.; Guibas, L.J. Pointnet: Deep learning on point sets for 3d classification and segmentation. In Proceedings of the IEEE Conference on Computer Vision and Pattern Recognition (CVPR), Honolulu, HI, USA, 21–26 July 2017; pp. 652–660. [Google Scholar]
- Vaswani, A.; Shazeer, N.; Parmar, N.; Uszkoreit, J.; Jones, L.; Gomez, A.N.; Kaiser, L.; Polosukhin, I. Attention is all you need. In Proceedings of the 31st Conference on Neural Information Processing Systems (NIPS 2017), Long Beach, CA, USA, 4–9 December 2017. [Google Scholar]
- Wainwright, M.J.; Jordan, M.I. Graphical Models, Exponential Families, and Variational Inference; Now Publishers Inc.: Norwell, MA, USA, 2008. [Google Scholar]
- Guo, C.; Pleiss, G.; Sun, Y.; Weinberger, K.Q. On calibration of modern neural networks. In Proceedings of the ICML International Conference on Machine Learning, Sydney, Australia, 6–11 August 2017. [Google Scholar]
- Schütze, H.; Manning, C.D.; Raghavan, P. Introduction to Information Retrieval; Cambridge University Press: Cambridge, UK, 2008; Volume 39. [Google Scholar]
- Bishop, C.M. Pattern Recognition and Machine Learning; Springer: Berlin/Heidelberg, Germany, 2006. [Google Scholar]


| Class | Count | Class | Count |
|---|---|---|---|
| Meadow | 184,489 | Triticale | 5114 |
| Maize | 42,006 | Rye | 569 |
| Wheat | 27,921 | Rapeseed | 7624 |
| Barley Winter | 10,516 | Sunflower | 1886 |
| Vineyard | 15,461 | Soybean | 6072 |
| Sorghum | 820 | Alfalfa | 2682 |
| Oat Winter | 529 | Leguminous | 1454 |
| Mixed cereal | 1061 | Flo./fru./veg. | 1079 |
| Oat Summer | 330 | Potato | 230 |
| Barley Summer | 538 | Wood pasture | 425 |
| Model | 2018 | 2019 | 2020 | 3 Years | ||||||||
|---|---|---|---|---|---|---|---|---|---|---|---|---|
| OA | mIoU | OA | mIoU | OA | mIoU | OA | mIoU | |||||
| 97.0 | 64.7 | 90.3 | 45.5 | 90.8 | 43.4 | 92.7 | 49.1 | |||||
| 88.9 | 39.5 | 97.2 | 70.1 | 88.7 | 40.1 | 91.6 | 48.0 | |||||
| 91.4 | 44.2 | 93.7 | 51.8 | 96.7 | 67.3 | 93.9 | 54.0 | |||||
| 97.3 | 69.2 | 97.4 | 72.2 | 96.8 | 68.7 | 97.2 | 70.4 | |||||
| Model | Description | OA | mIoU |
|---|---|---|---|
| single-year observation | 96.8 | 68.7 | |
| bypassing 2 years of observation | 96.8 | 69.3 | |
| using past 2 declarations in a CRF | 96.8 | 72.3 | |
| Mdec-one-year | concatenating last declaration only | 97.5 | 74.3 |
| Mdec-concat | concatenating past 2 declarations | 97.5 | 74.4 |
| proposed method | 97.5 | 75.0 |
| Class | IoU | Class | IoU | ||||
|---|---|---|---|---|---|---|---|
| Wood Pasture | 92.4 | +48.2 | 86.3 | Oat Summer | 52.8 | +3.6 | 7.0 |
| Vineyard | 99.3 | +1.4 | 68.7 | Rapeseed | 98.3 | +0.1 | 6.6 |
| Alfalfa | 68.7 | +23.9 | 49.9 | Maize | 95.7 | +0.2 | 6.3 |
| Flo./Fru./Veg. | 83.4 | +14.5 | 46.5 | Wheat | 91.9 | +0.3 | 3.9 |
| Meadow | 98.4 | +0.9 | 36.9 | Barley Summer | 64.3 | +1.1 | 3.1 |
| Leguminous | 45.2 | +14.6 | 21.1 | Potato | 57.1 | +0.5 | 1.2 |
| Rye | 54.7 | +6.4 | 12.4 | Sunflower | 92.2 | −0.1 | −0.3 |
| Oat Winter | 57.7 | +4.5 | 9.7 | Sorghum | 56.6 | −0.2 | −0.4 |
| Triticale | 68.7 | 2.6 | 7.8 | Soybean | 91.8 | −0.2 | −3.1 |
| Mix. Cereals | 31.0 | +5.1 | 6.8 | Barley Winter | 92.8 | −0.6 | −8.5 |
| Category | mIoU | Mean |
|---|---|---|
| Permanent | 97.3 | 16.9 |
| Structured | 77.7 | 7.6 |
| Other | 66.6 | 2.3 |
Publisher’s Note: MDPI stays neutral with regard to jurisdictional claims in published maps and institutional affiliations. |
© 2021 by the authors. Licensee MDPI, Basel, Switzerland. This article is an open access article distributed under the terms and conditions of the Creative Commons Attribution (CC BY) license (https://creativecommons.org/licenses/by/4.0/).
Share and Cite
Quinton, F.; Landrieu, L. Crop Rotation Modeling for Deep Learning-Based Parcel Classification from Satellite Time Series. Remote Sens. 2021, 13, 4599. https://doi.org/10.3390/rs13224599
Quinton F, Landrieu L. Crop Rotation Modeling for Deep Learning-Based Parcel Classification from Satellite Time Series. Remote Sensing. 2021; 13(22):4599. https://doi.org/10.3390/rs13224599
Chicago/Turabian StyleQuinton, Félix, and Loic Landrieu. 2021. "Crop Rotation Modeling for Deep Learning-Based Parcel Classification from Satellite Time Series" Remote Sensing 13, no. 22: 4599. https://doi.org/10.3390/rs13224599
APA StyleQuinton, F., & Landrieu, L. (2021). Crop Rotation Modeling for Deep Learning-Based Parcel Classification from Satellite Time Series. Remote Sensing, 13(22), 4599. https://doi.org/10.3390/rs13224599


