Abstract
Terrestrial evapotranspiration (ET) is a critical component of water and energy cycles, and improving global land evapotranspiration is one of the challenging works in the development of land surface models (LSMs). In this study, we apply a bias correction approach into the Community Land Model version 5.0 (CLM5) globally by utilizing the remote sensing-based ET dataset. Results reveal that the correction approach can alleviate both overestimation and underestimation of ET by CLM5 over the globe. The adjustment to overestimation is generally effective, whereas the effectiveness for underestimation is determined by the ET regime, namely water-limited or energy-limited. In the areas with abundant precipitation, the underestimation is effectively corrected by increasing ET without the water supply limit. In areas with rare precipitation, however, increasing ET is limited by water supply, which leads to an undesirable correction effect. Compared with the ET simulated by CLM5, the bias correction approach can reduce the global-averaged relative bias (RB) and the root mean square error (RMSE) by 51.8% and 65.9% against Global Land Evaporation Amsterdam Model (GLEAM) ET data, respectively. Meanwhile, the correlation coefficient (CC) can also be improved from 0.93 to 0.98. Continentally, the most substantial ET improvement occurs in Asia, with the RB and RMSE decreased by 69.7% (from 7.04% to 2.14%) and 70.2% (from 0.312 mm day−1 to 0.093 mm day−1, equivalent to from 114 mm year−1 to 34 mm year−1), and the CC increased from 0.92 to 0.99, respectively. Consequently, benefiting from the improvement of ET, the simulations of runoff and soil moisture are also improved over the globe and each of the six continents, and the improvement varies with region. This study demonstrates that the use of satellite-based ET products is beneficial to hydrological simulations in land surface models over the globe.
1. Introduction
Evapotranspiration (ET) is a critical component in the Earth’s system in linking the energy, water, carbon, and nitrogen cycles. Over half of precipitation on the land surface is returned to the atmosphere through ET [1,2]. There are two different concepts on ET: potential evapotranspiration and actual evapotranspiration. The former is the measure of the ability of the atmosphere to transfer water from the surface by evaporation and transpiration assuming no control on the water supply. In contrast, the latter is the amount of water evaporating from the terrestrial surface and transpiring from plants, which is limited by the amount of water stored in these reservoirs. ET here refers to actual ET, and it mainly consists of plant transpiration, soil evaporation and interception loss. Accurate quantification of global terrestrial ET is necessary for understanding variability in the global water cycle [3]. However, it is challenging to accurately measure and simulate ET, especially at a large scale, due to the highly heterogeneous land surface conditions. The conventional measures, such as lysimeter, eddy covariance, and the Bowen ratio method, are able to obtain ET estimates at point and local scales [4]. However, it is unrealistic to directly measure ET at the global scale due to the limited instrument coverage and complex spatial heterogeneity of the global land surface [5]. The development of the remote sensing technology enables large scale observations of E- related variables and becomes a promising tool to estimate ET. As a result, numerous remote sensing-based approaches and methods are developed [4,5,6], and a variety of ET products are generated [6,7,8,9,10,11,12,13]. Most of these products are applied at the regional and watershed scales. At the global scale, there are two primary remote-sensing based approaches. One is based on the Penman-Monteith (PM) equation [14,15], and the other is based on the Priestley-Taylor (PT) equation [16]. The PM-based approach estimates ET by combining the thermodynamic and aerodynamic aspects of the ET process, which is the weighted linear combination of the net available radiation on the land surface and the vapor pressure deficit between the land surface and the overlying air [17]. The PT-based approach simplified the PM method by proposing an empirical coefficient related to the surface environment, and the method is widely used in a variety of underlying surface conditions [18]. However, there are some weaknesses existing in the remote sensing-based methods. For instance, the methods only provide static ET estimations instead of depicting the dynamic process of ET. In addition, owing to the uncertainties of multiple input sources, the remote sensing data may lead to errors in the closure of the water balance [19]. Therefore, it is necessary to develop an approach which can not only describe the physical process of ET in detail but also consider the closure of the water balance. The emergence of the land surface models (LSMs) provides a powerful help towards the purpose. LSMs comprehensively simulate physical, biological and biogeochemical processes [6]. ET plays an important role in linking these processes [20,21]. Great efforts have been made to improve the model performance by upgrading the parameterization schemes of terrestrial processes and utilizing more accurate forcing and land surface data, of which the ET simulations are also improved in the meanwhile. For example, the Community Land Model (CLM) has been updated from the original version 2 to the latest version 5 [22,23,24,25,26,27], including more realistic parameterizations of land key physical processes and a more comprehensive and explicit representation of model data structure. To better simulate ET, the Community Land Model version 5 (CLM5) introduces a dry surface layer-based soil evaporation resistance parameterization and a revised canopy interception parameterization [28]. The continuous development of LSMs enhances confidence for a better understanding and simulation of global land ET.
Despite considerable progress [29,30,31,32,33,34], substantial differences in quantifying the magnitude of terrestrial ET and its temporal and spatial patterns still exist in LSMs. Since different LSMs usually adopt different parameterization schemes of the land surface process, they show diverse performances in ET simulations at different spatial scales [35]. The range of the model-based global land multi-year averaged ET is wide, which changes from 415 to 586 mm year−1 [36]. The Joint UK Land Environment Simulator (JULES), the coupled Canadian Land Surface Scheme-Canadian Terrestrial Ecosystem Model (CLASS-CTEM) usually overestimate ET while the Lund-Potsdam-Jena-Wald Schnee Landschaft (LPJ-wsl) and the Land surface Processes and eXchanges (LPX-Bern) is prone to underestimate ET over the global scale [37]. The large discrepancy among different models may result from the deficient model parameterization, the lack of observational constraint, the uncertainty in driven meteorological data, and the inconsistent spatial and temporal resolutions.
LSMs can be improved by taking advantages of the remote sensing-based ET products. Lu, et al. [38] improved the performance of soil moisture and energy flux simulations over the Tibetan Plateau (TP) by merging the remote sensing-based Microwave Scanning Radiometer for EOS (AMSR-E) brightness temperatures and the general circulation model (GCM) output into a LSM. The results demonstrated the improved LSM can simulate a more reasonable spatial distribution of the Bowen Ratio during the monsoon season. Che, et al. [39] developed a snow data assimilation system by applying an ensemble filter approach to assimilate remote sensing brightness temperature data into a snow model within the LSM framework, and the validation results indicated that snow depth estimations can be substantially ameliorated during the accumulation period. A novel lateral flow scheme using remote sensing data was proposed by Lee and Choi [40] to improve the runoff predictions in an LSM. The result showed that the improved lateral flow scheme outperforms the original scheme, and it can more effectively capture the seasonal variation in daily streamflow. As for the improvement to ET, Marshall, et al. [41] used a straight forward method to incorporate remote sensing products into the Laboratory at National Weather Service Land Surface Model (GNOAH) to improve ET estimates in sub-Saharan Africa. Results suggested that the hybrid model greatly improves ET simulations at humid sites with dense vegetation compared with the baseline model. Parr, et al. [42] proposed an approach to reduce model biases and applied this method into the Variable Infiltration Capacity (VIC) model over the Connecticut River Basin in America. Different from the previous methods, the approach of Parr, et al. [42] assumes that the relationship between the model ET and observational ET remains unchanged from one period to another. As such, the relationship calculated in the calibration period can be transferred to other periods to correct the biases in ET simulations or predictions. They reported that the systematic biases can be effectively reduced by using this correction approach, which promotes a reliable projection of future drought and flood risk. Wang, et al. [43] applied this approach and incorporated the remote sensing-based product into the CLM version 4.5 over the Continental United States (CONUS) to investigate the correction effectiveness of this method. The results demonstrate that this correction method can substantially ameliorate the model simulations over most of the CONUS and provide valuable guidance for the development of LSMs. In general, the aforementioned studies on improvements to LSMs via taking advantage of remote sensing data are mostly at the continental or watershed scale, while few are at the global scale.
Compared with CLM4.5 used in the previous study (Wang et al. 2017), CLM5 has been updated with substantial changes. In hydrology, a revised canopy interception parameterization is developed by considering the impact of wind and freezing temperatures, and a dry surface layer-based soil evaporation resistance parameterization is introduced to improve the simulation of the water budget on the land surface. To understand whether the correction approach used in Parr et al., (2015) and Wang et al., (2017) is transferable from one region to others and whether it is effective for a new land surface model, we apply the same approach to CLM5 at the global scale. In this study, the Global Land Evaporation Amsterdam Model (GLEAM) ET is taken as both the calibration data and the validation data. The other global ET data, runoff data, and soil data are used as the independent references for model assessments. The paper is structured as follows. In Section 2, the model and bias correction approach are briefly described. Section 3 introduces the reference data used in this study. The model evaluations are presented in Section 4. Section 5 provides the summary and conclusions of this study.
2. Materials and Methods
2.1. Model and Forcing Data
The CLM is the land component of the Community Earth System Model (CESM), which was developed through continuous updates and improvements by the National Center for Atmospheric Research (NCAR) of America. The model is structured as follows: each grid cell within CLM is classified into multiple subgrid land units, and each land unit consists of multiple snow/soil columns occupied with diverse plant functional types (PFTs). The land surface processes for each subgrid land unit, column, and PFT are simulated independently and each subgrid unit maintains its own prognostic variables.
CLM5 is the latest version of the CLM. Scientific justification and evaluation related to CLM5 have been conducted [28]. In this study, CLM5 in its offline mode with the prescribed vegetation phenology is used. The surface datasets required in the CLM5 were obtained from a variety of sources. Both the percent PFTs and the prescribed PFT leaf area index was derived from Moderate Resolution Imaging Spectroradiometer (MODIS) satellite data [44]. Prescribed canopy top and bottom heights were retrieved from Bonan [22] as described in Bonan et al. [23]. The soil color was obtained from Lawrence and Chase [45], and the soil texture was derived based on International Geosphere-Biosphere Programme (IGBP) soil dataset, which includes approximately 5000 soil mapping units. The maximum fractional saturated area, slope, and elevation were all retrieved from the USGS HYDRO1K 1-km dataset [46]. The description and model code of CLM5 are available from https://www.cesm.ucar.edu/models/clm, accessed on 20 May 2020.
In CLM, ET mainly consists of 3 major components, namely interception loss, plant transpiration, and soil evaporation in the vegetated areas. Snow sublimation is also a component of ET, but its magnitude is much smaller than the 3 major component in most areas of global land surface. Hence, the bias correction approach is applied to interception loss, plant transpiration, and soil evaporation only.
The forcing data used in this study is the WATCH Forcing Data methodology applied to ERA5 (WFDE5). It was generated by applying the sequential elevation and the monthly bias correction approach to half-degree aggregated ERA5 reanalysis products. Evaluations against meteorological observations at station sites show that WFDF5 perform better than the ERA interim-based WFDEI for all variables [47]. The application to an uncalibrated hydrological model (WaterGAP) over several large river basins indicates that the use of WFDF5 can lead to more plausible global hydrological water balance components compared with the raw ERA5 data for model forcing [47]. In this study, the WFDE5 data from 1980 to 2018 at the hourly temporal resolution and 0.5° spatial resolution are selected as the driving force for CLM5, as the 1979 data is not complete.
2.2. Methodology
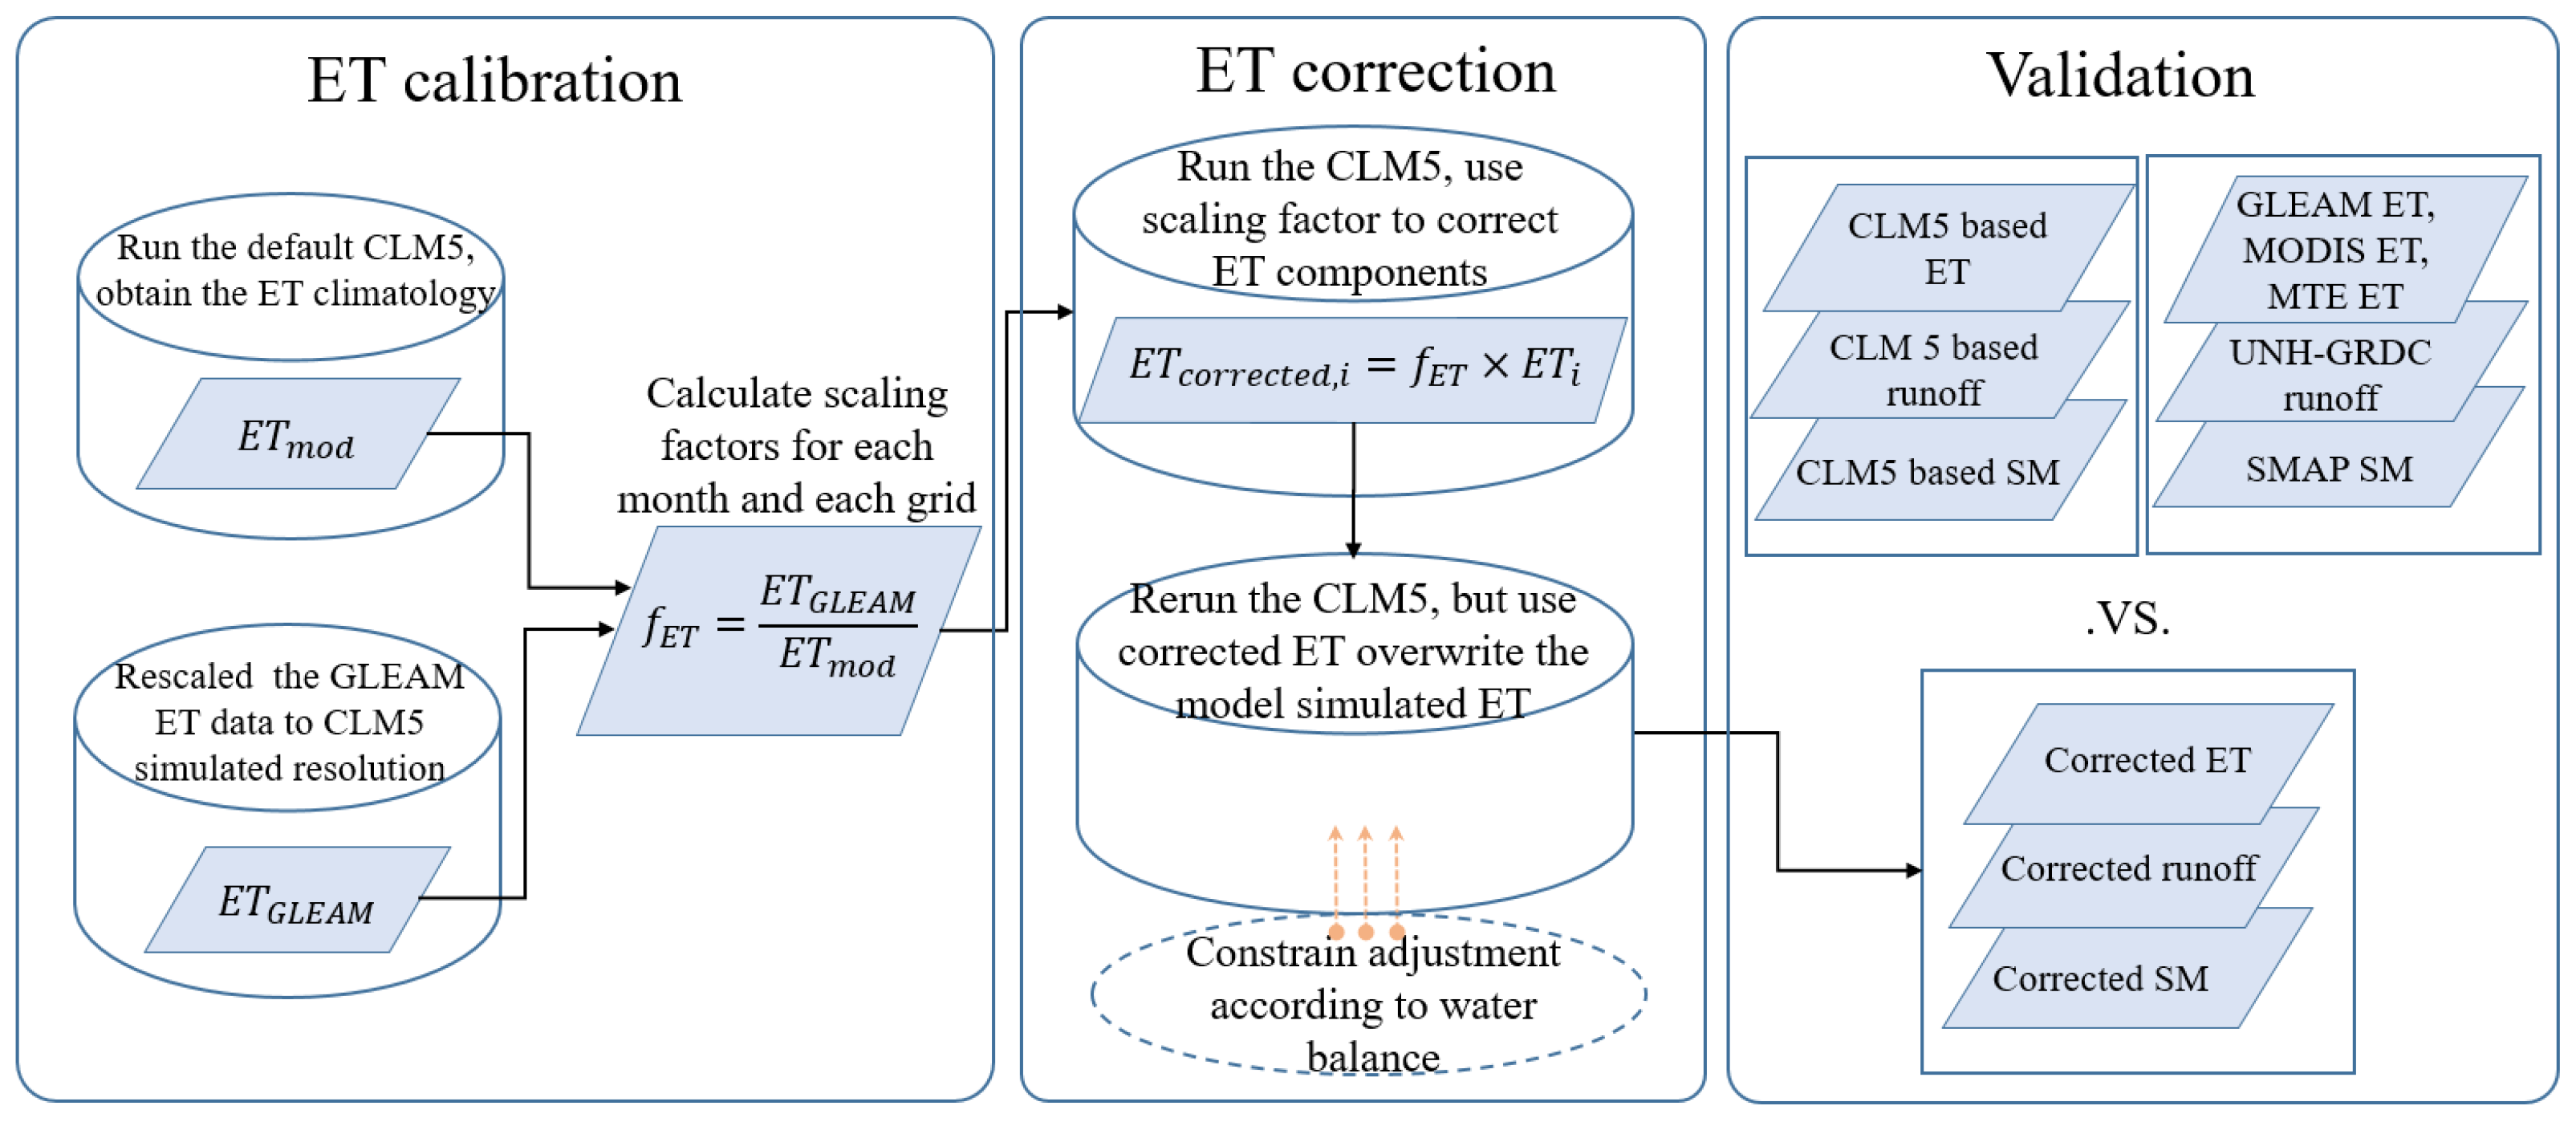
Land surface model is capable of capturing the general pattern of ET. However, the substantial biases still exist due to the uncertainties in meteorological forcing data, surface data, and model structure and parameters [42,43,48]. The bias in ET may further propagate to other variables through the terrestrial hydrothermal processes. Following Parr et al. [42] and Wang et al. [43], we improve the simulations of CLM5 by utilizing remote sensing-based ET over the globe. The technical process consists of 3 parts, as shown in Figure 1. In the first part, namely ET calibration, we simulate ET using the default CLM5 and obtain the ET climatology for an historical period. The GLEAM based ET is rescaled to match the resolution of model simulations. The ET scaling factor is then calculated as the ratio of the corresponding rescaled GLEAM-based ET to the modeled ET for the same historical period. This calculation is implemented for each month and each grid cell. In the second part, namely ET correction, we obtain a modeled ET for any other period (historical or future) by running the default CLM5 and a correct modeled ET by multiplying the scaling factor for each grid. Then, the corrected ET is fed into CLM5 to replace the modeled ET for the same period, and the simulated hydrological processes are adjusted accordingly. Subject to the physical mechanisms in the model, the ET and other hydrological variables are adjusted in the model automatically. In the third part, the corrected ET, corrected runoff, and soil moisture are output, which are validated against the reference data. The underlying assumption is that the relationship between GLEAM-based ET and modeled ET remain unchanged from one period to the other, but it has a unique seasonal cycle and spatial variability. To implement the method, we carry out 2 types of simulations, namely “CLM” and “CLMET”, respectively. The former denotes that simulation with the default CLM5 configuration, while the latter denotes that simulation in which the model-generated ET is replaced with the corrected ET. In the CLM, the modeled ET components, namely vegetation transpiration, soil evaporation, and interception loss, are recorded at the PFT level for every time step (1 h). Then, these 3 components are corrected by multiplying the scaling factor. In the CLMET simulation, the CLM5 is re-run for the same period as CLM, but the 3 ET components are overwritten by the corresponding corrected ones. Therefore, it should be noted that the correction method is actually applied to the calculation in every time step of CLM5. The hourly simulation is aggregated into the temporal averages at different time scales (namely monthly, seasonally, and annually), which are evaluated in the following analysis.
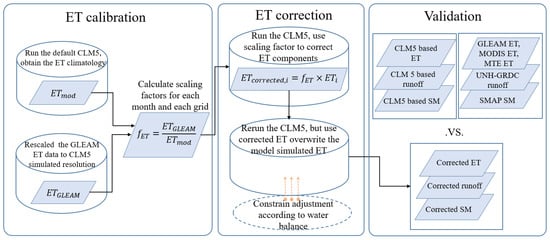
Figure 1.
The technical process of correction approach from Parr at al., (2015). Variable denotes the month- and grid-specific relationship (i.e., scaling factor) between model-based simulation and GLEAM-based observation, denotes the GLEAM-based ET value for specific time period, demotes the model-based value for the same time period with GLEAM-based ET, and denotes the simulated ET components for each time step in the default CLM5 over the time of ET correction. SM denotes soil moisture.
In this study, due to the span of the meteorological forcing data (1980–2018), we evenly divide the entire duration into 2 periods, namely 1980–1999 and 2000–2018. For each period, the first 6-year run is disregarded as spinup to ensure that the model reaches to the equilibrium state. The 1986–1999 is taken as the calibration period and 2006–2018 as the validation period. Firstly, the CLM type simulation is conducted in a 20-year (1980–1999) period with the first 6-year run disregarded as spinup. Then, we conduct both CLM type and CLMET type simulations during the validation period with the initial condition of 1st January 2000 recorded from the calibration period. It is worth noting that the overwriting process for ET may break the water balance. If that happens, we check whether the water stored in the vegetation canopy meets the demand for interception loss and whether the water stored in the soil meets the demand for soil evaporation and plant transpiration throughout the model time step. If not, the interception loss (soil evaporation and plant transpiration) rate is set to be equal to the available water stored in the vegetation canopy (soil) divided by the model time step. Figure 1 illustrates a schematic diagram describing the workflow of implementing the ET bias correction approach into CLM5.
Four statistics, namely bias, relative bias (RB), root-mean-square error (RMSE), and correlation coefficient (CC) are selected to evaluate the performance of the 2 types of simulations by comparing the modeled variables with the reference datasets. The statistics are calculated as follows:
where represents the total number of grid cells, and represent the spatial mean of the modeled and reference values for grid cell , respectively. represents the covariance between and , and represent the standard deviation of and , respectively. Meanwhile, RMSE and -CC are also used to evaluate the temporal performance of the two types of model simulations.
3. Data
Two remote sensing-based ET products, GLEAM ET and MODIS ET [7,10], and observation-based FLUXNET Multi-Tree Ensemble (MTE) ET [11,49] are used in this study for model calibration or validation. The GLEAM ET during 1980–1999 is used to derive ET scaling factors, and this data during 2000–2018 is used to assess the effectiveness of the correction method. MODIS ET and MTE ET are adopted as the independent data for model assessments. The observation-based runoff data University of New Hampshire—Global Runoff Data Centre (GRDC) and the Soil Moisture Active Passive (SMAP) are also taken as the reference data to assess the impact of the correction method on the hydrological processes. We upscale the finer resolution data to 1° grid cells to be in line with the model output by the simple arithmetic average.
3.1. Remote Sensing-Based ET Products
3.1.1. GLEAM ET
The GLEAM version 3.5a [6,50,51] is used to calculate the ET scaling factors and to validate the simulated ET in the two types of simulations. It was derived based on reanalysis radiation and air temperature, a combination of gauge-based reanalysis and satellite-based precipitation, and satellite-based vegetation optical depth, spanning the time period from 1980 to 2020. The potential evaporation in GLEAM 3.5a was calculated using the PT equation based on observations of surface net radiation and near-surface air temperature, and is converted into actual evaporation based on the evaporative stress factor [52,53]. Recent evaluations showed the GLEAM ET product performs better than other remote-sensed ET products in estimating land surface evapotranspiration [6,32]. The GLEAM dataset is provided at a spatial resolution of 0.25° and daily, monthly, and yearly time scale.
3.1.2. MODIS ET and FLUXNET-MTE ET
To evaluate the improvement effectiveness, MODIS ET and MTE ET are also used for independent assessments of the performance of the two types of simulations. The MODIS-based ET dataset used in this study was developed by the Numerical Terradynamic Simulation Group (NTSG), University of Montana. The monthly MODIS-based ET product is available from 2000 to 2014 with a spatial resolution of 0.5°. The MTE ET dataset was derived from upscaling eddy covariance measurements based on the global network of eddy covariance flux towers. It has been used to improve the simulation of soil evaporation, evaluate the performance of ecosystem models, and assess the evapotranspiration variability [28,54,55]. The monthly MTE ET product is available from 1982 to 2011 at the 0.5° resolution. In this study, both of the two ET datasets are applied to independently validate the model performance.
3.2. University of New Hampshire-GRDC Runoff
The climatological monthly runoff over the globe used in this study is the University of New Hampshire—Global Runoff Data Centre (GRDC) Composite Runoff Fields V1.0. It was derived by combining the observed gauge river discharge data from the GRDC with outputs of a water balance model driven by the observational forcing meteorology data. The combined runoff fields preserve the accuracy of the discharge measurements as well as the spatial and temporal distribution, and is considered “best estimate” of terrestrial runoff over the globe [56]. The GRDC runoff data provides multi-year averaged annual and monthly runoff with a spatial resolution of 0.5°.
3.3. SMAP Soil Moisture
The Soil Moisture Active Passive (SMAP) mission [57] was designed to provide a global-scale mapping of soil moisture measured by L-band (1.41 GHz) passive and active microwave sensors since 2015. Since the L-band is more sensitive to soil moisture and more easily penetrates vegetation layers than other bands, the SMAP dataset is considered one of the most promising products for soil moisture. SMAP generates a range of products and soil moisture retrievals [58]. In this study, the surface soil layer (0–5 cm) and root zone soil layer (0–100 cm) soil moisture data of SMAP L4 EASE-Grid (version 5) from April 2015 to December 2018 with a 9 km spatial resolution are adopted to evaluate the performance in simulating soil moisture in these two layers [59].
4. Results
4.1. ET Scaling Factor
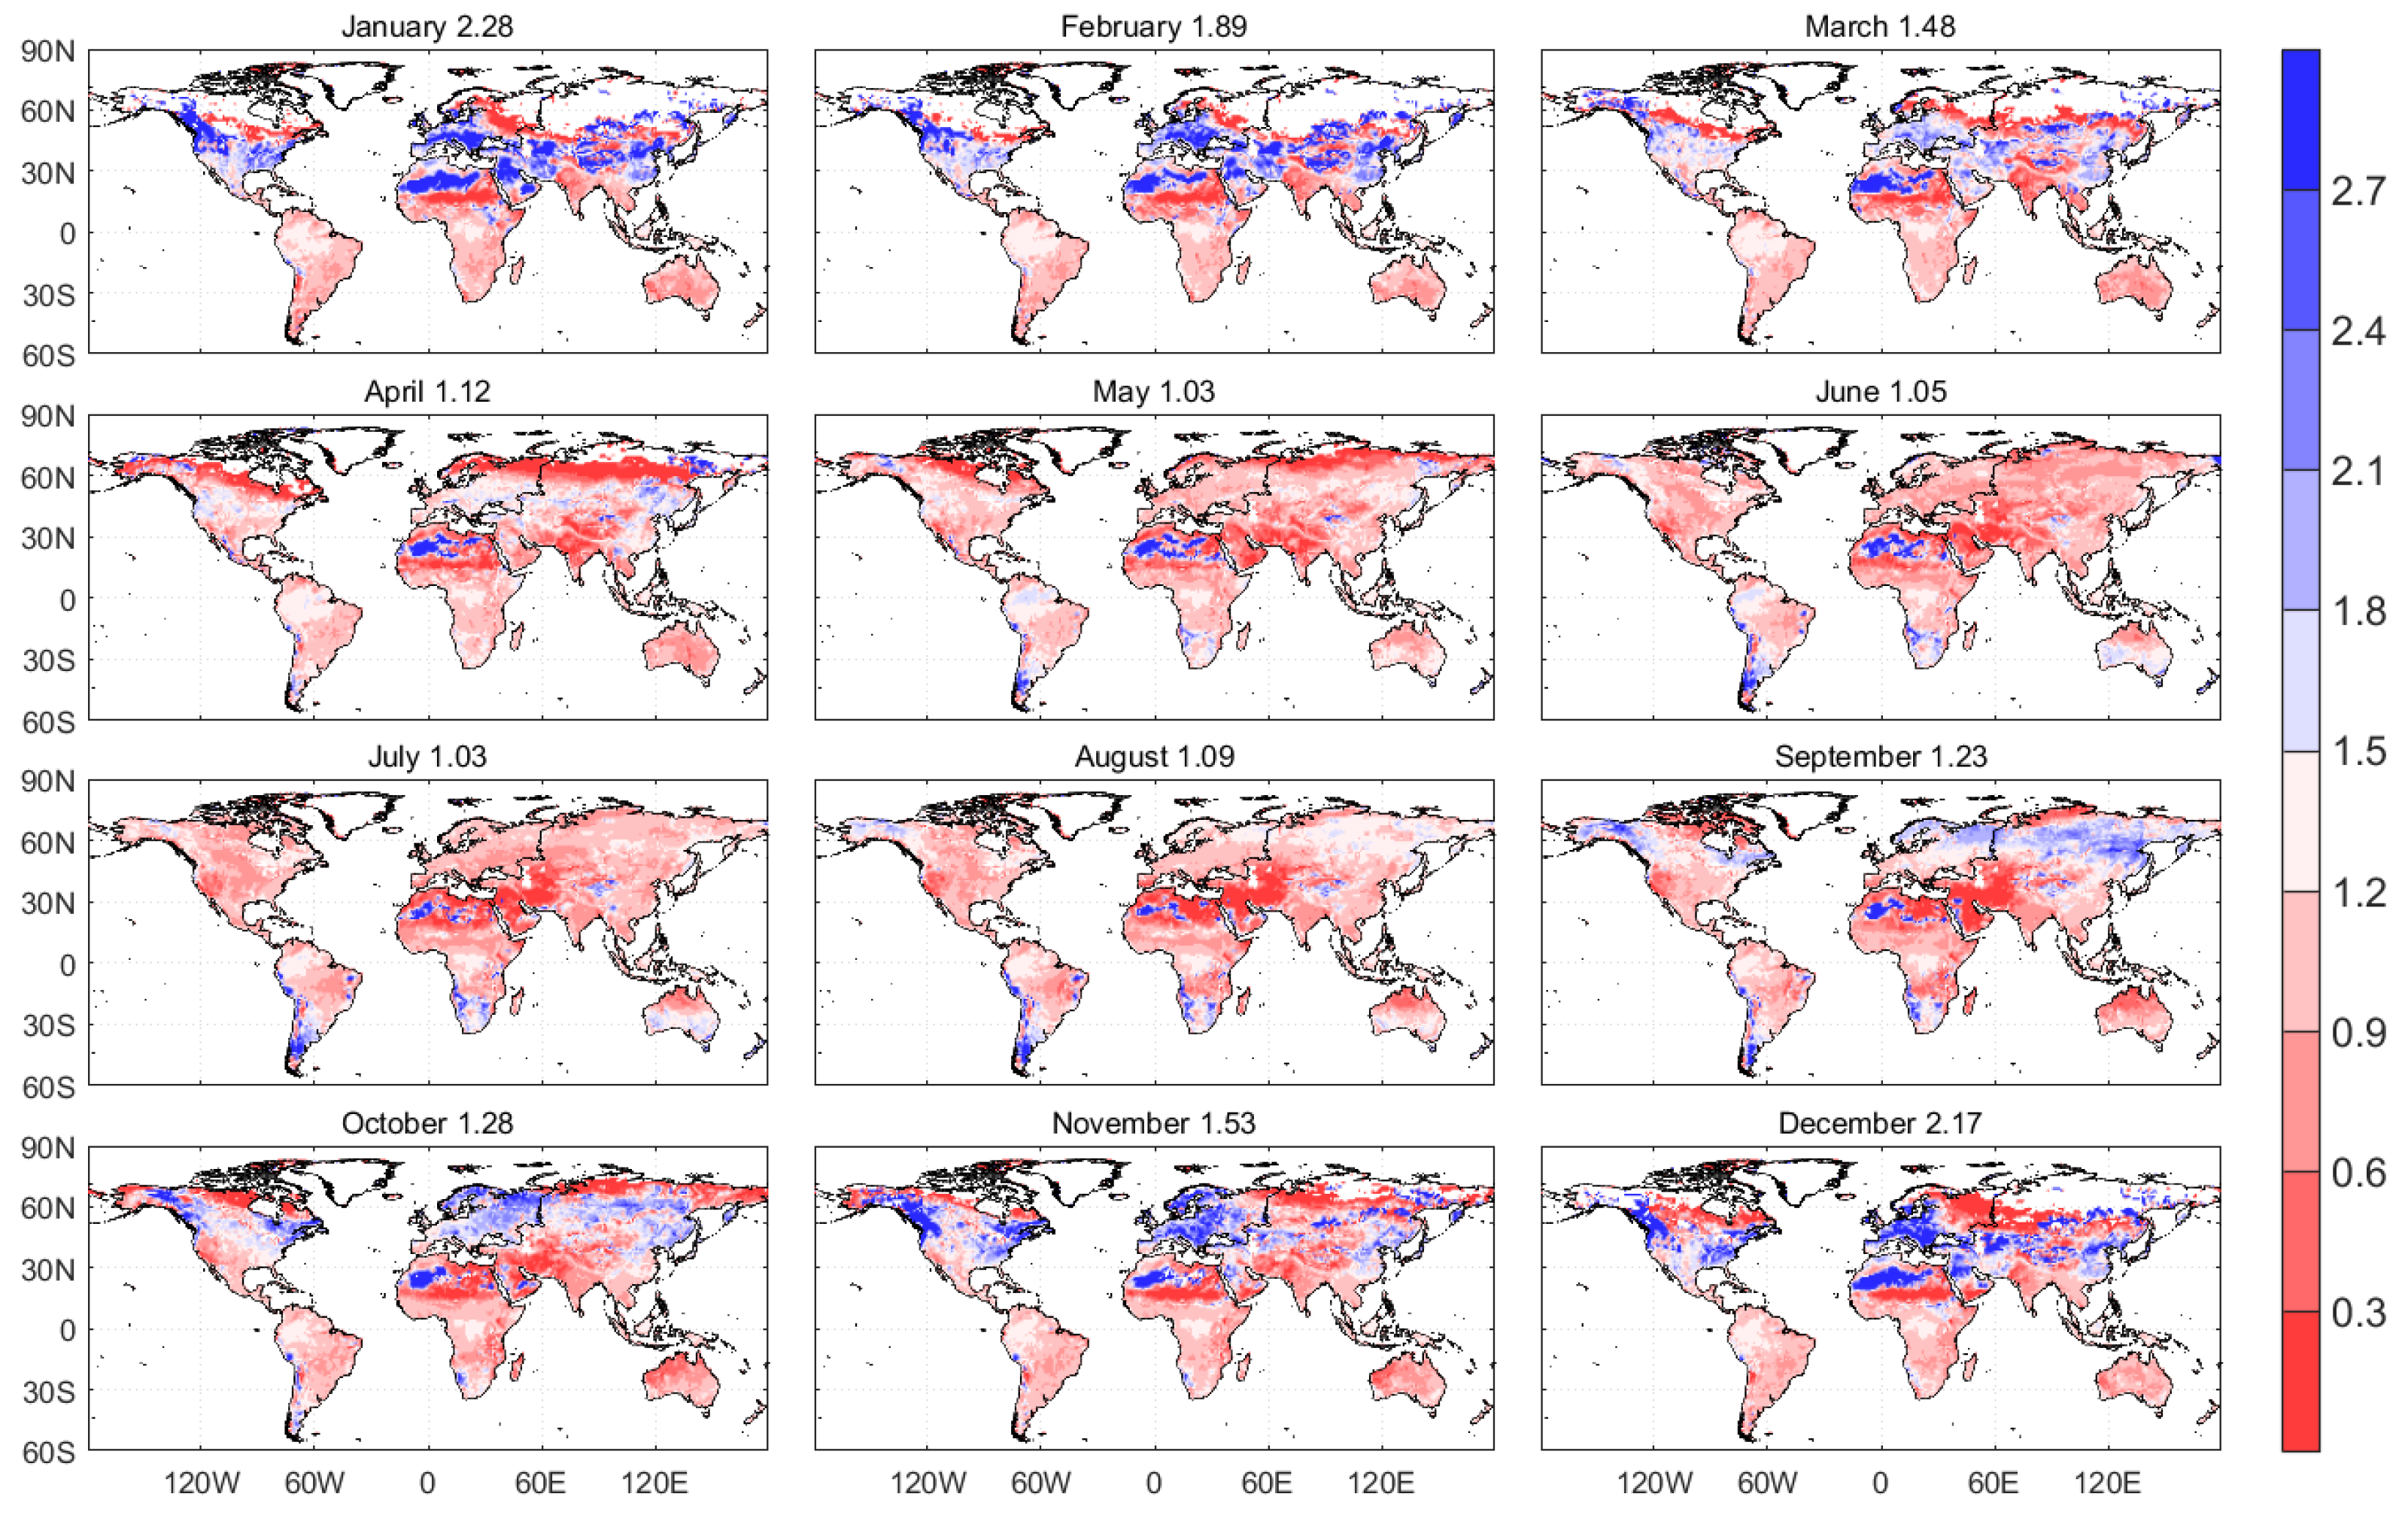
According to the methods described in Section 2, the ET scaling factors for each month over the global land are calculated based on the CLM simulation and the GLEAM data in the period 1986–1999, and their spatial patterns and continental averages are shown in Figure 2 and Table 1, respectively. It should be noted that the GLEAM-derived dew may not be consistent with the CLM-modeled dew in some areas of the high latitudes in the northern hemisphere, which results in a negative scaling factor. If that happens, we do not scale ET and mask these areas out in Figure 2. In general, during the boreal summer such as May, June, and July, the scaling factors are approximately 1.0, indicating the model simulations are in line with GLEAM estimations. By contrast, the differences between simulations and GLEAM estimations are large during the boreal winter, and the scaling factors are substantially larger than 1.0, especially for December and January. Overall, the global land averaged ET simulated by CLM are lower than GLEAM estimations, as the ET scaling factors are greater than 1.0 for all 12 months. Despite the overall underestimation on the global average, overestimations still occur in some months over several continents. For example, overestimations are pronounced during May, June, and July over Asia and Europe. The magnitudes of the scaling factors remarkably vary with continent and season. For instance, the area-averaged scaling factors for January are 1.50, 3.30, 0.90, 1.99, 3.50, and 1.04 for Africa, Asia, Australia, Europe, and North America and South America, respectively. For the same continent, the difference in the scaling factors among different months is large, for example, the maximum value in January is almost four times as large as the minimum value in May over Asia. Overall, the scaling factors vary greatly with month and continent, which indicates that the difference is evident between GLEAM ET and CLM-simulated ET. Therefore, there is a strong potential to improve CLM in simulating ET.
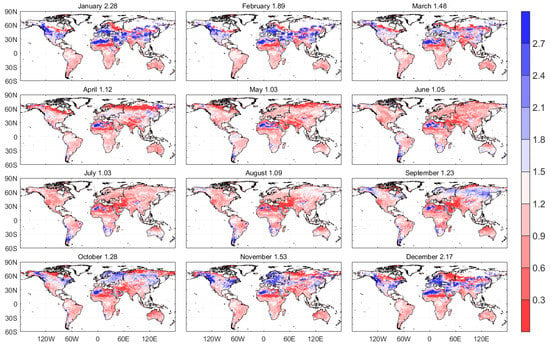
Figure 2.
Scaling factor (ratio of the GLEAM-estimated ET to the CLM-simulated ET for each month during 1986–1999) over global land except for main Greenland and Antarctica. The numbers in titles are the global-averaged values. The areas with negative scaling factor are masked out.

Table 1.
Scaling factor (ratio of the GLEAM-estimated ET to CLM-simulated ET for each month during 1986–1999) of area-averaged values over the globe except for main Greenland and Antarctica, and over six continents.
4.2. Evaluation
The performance of CLM and CLMET are evaluated based on various reference datasets described in Section 3. Four statistical metrics, namely bias, RB, RMSE, and CC are used as the quantitative criterion. In the following evaluations, Greenland, Antarctica, Sahara, Arabian Peninsula, and Taklimakan are excluded in the analysis and masked out in the following figures, as some of the reference data do not cover these areas.
4.2.1. ET
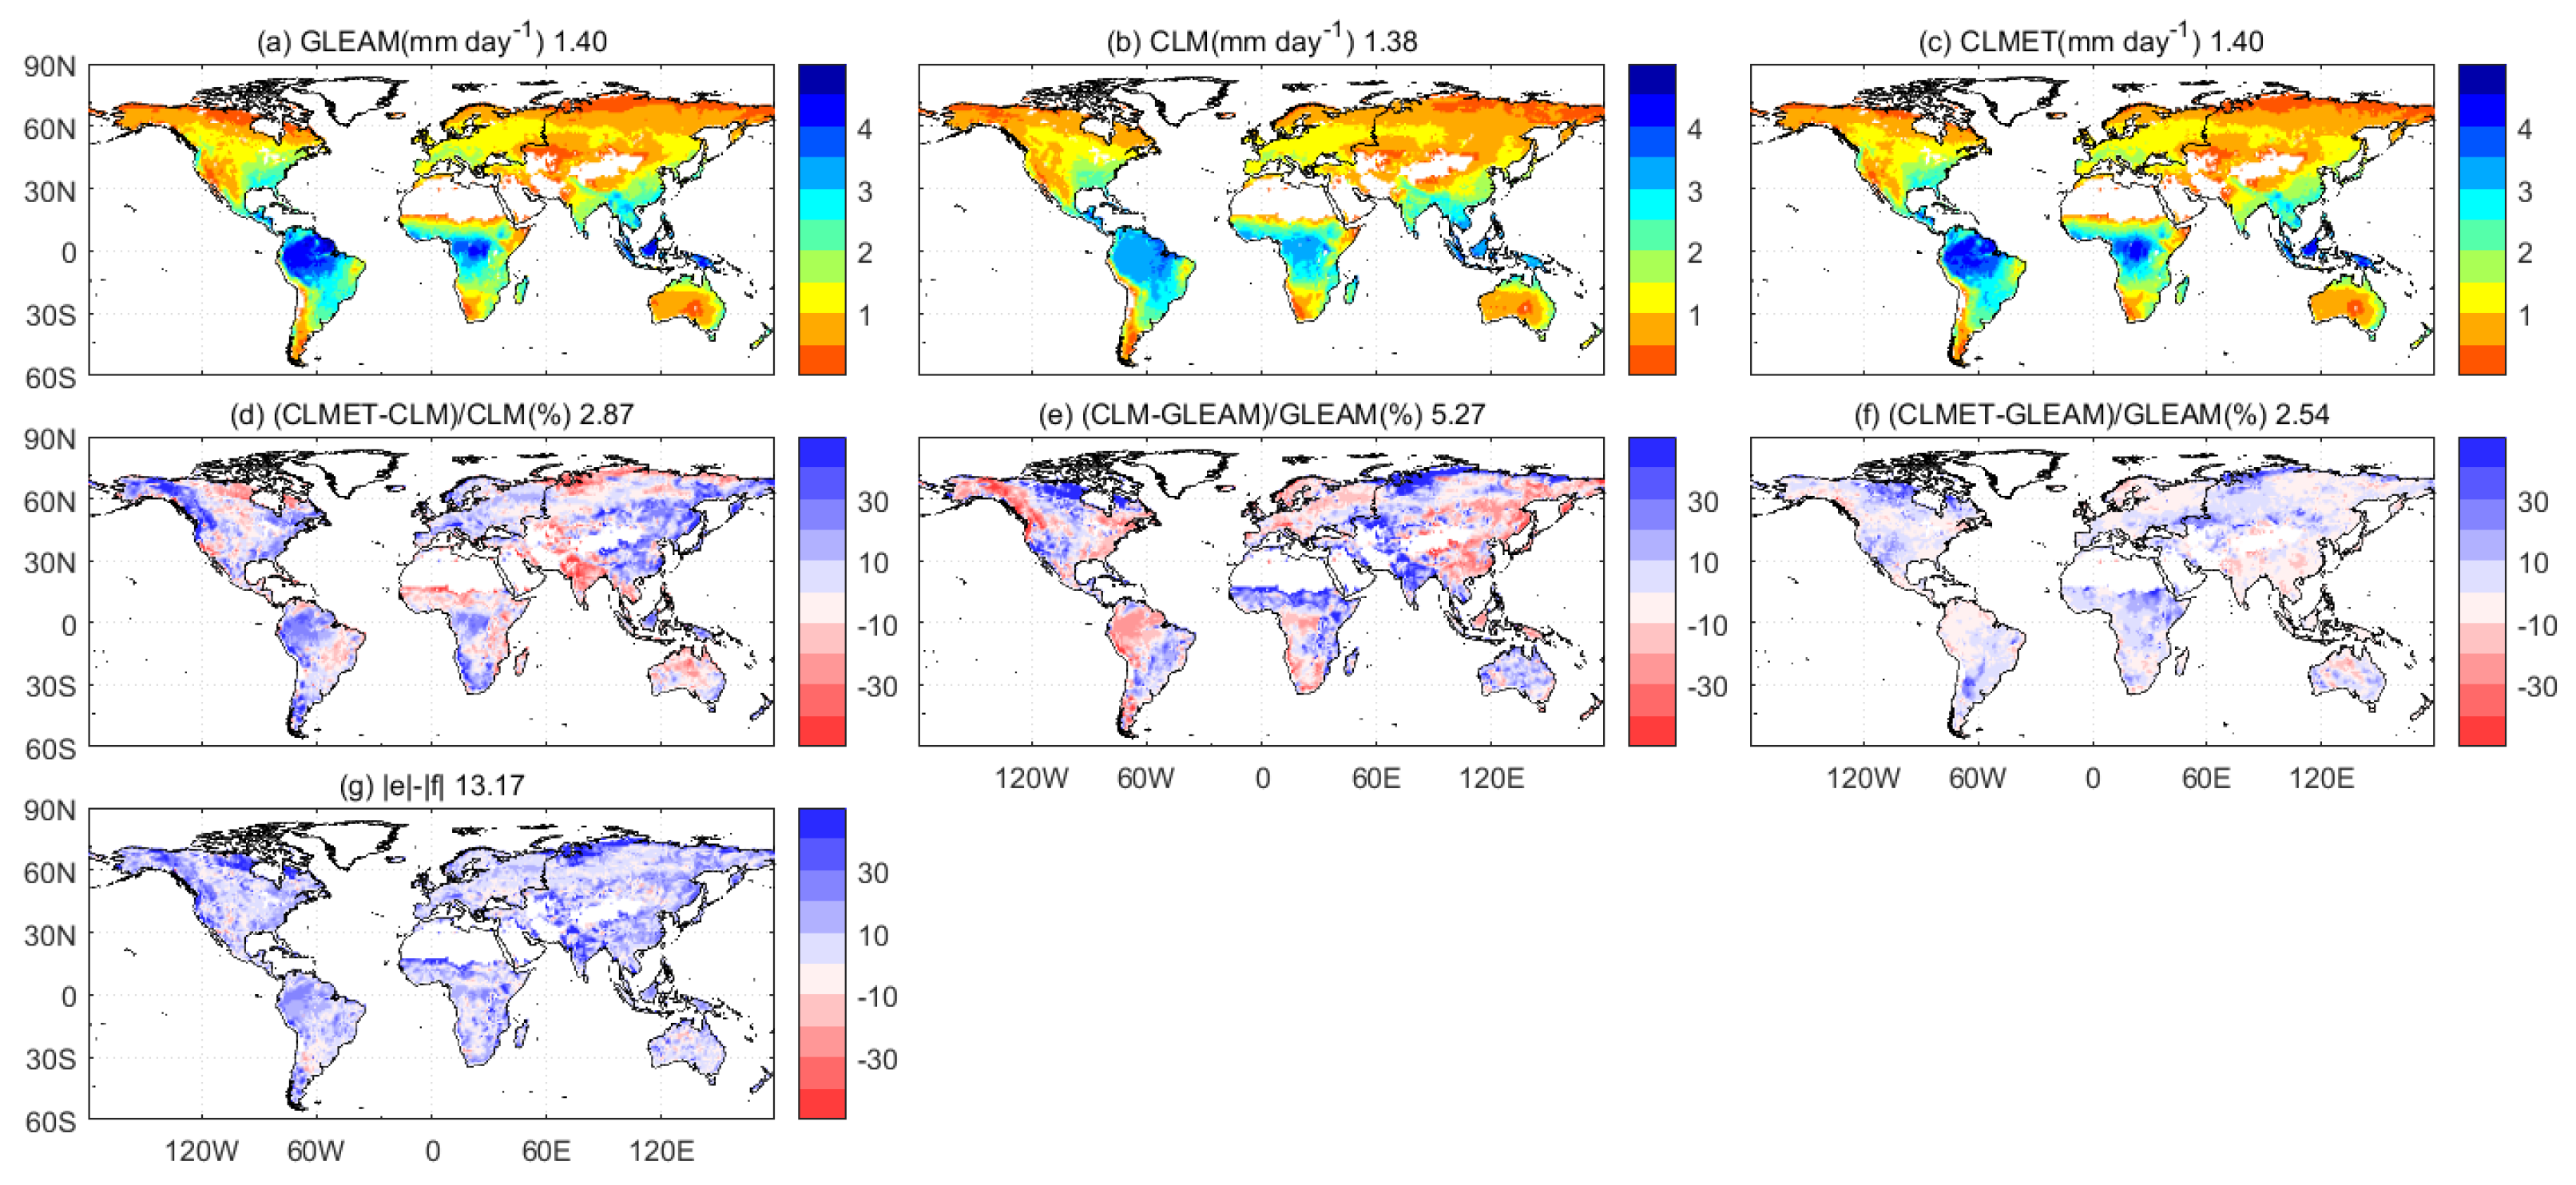
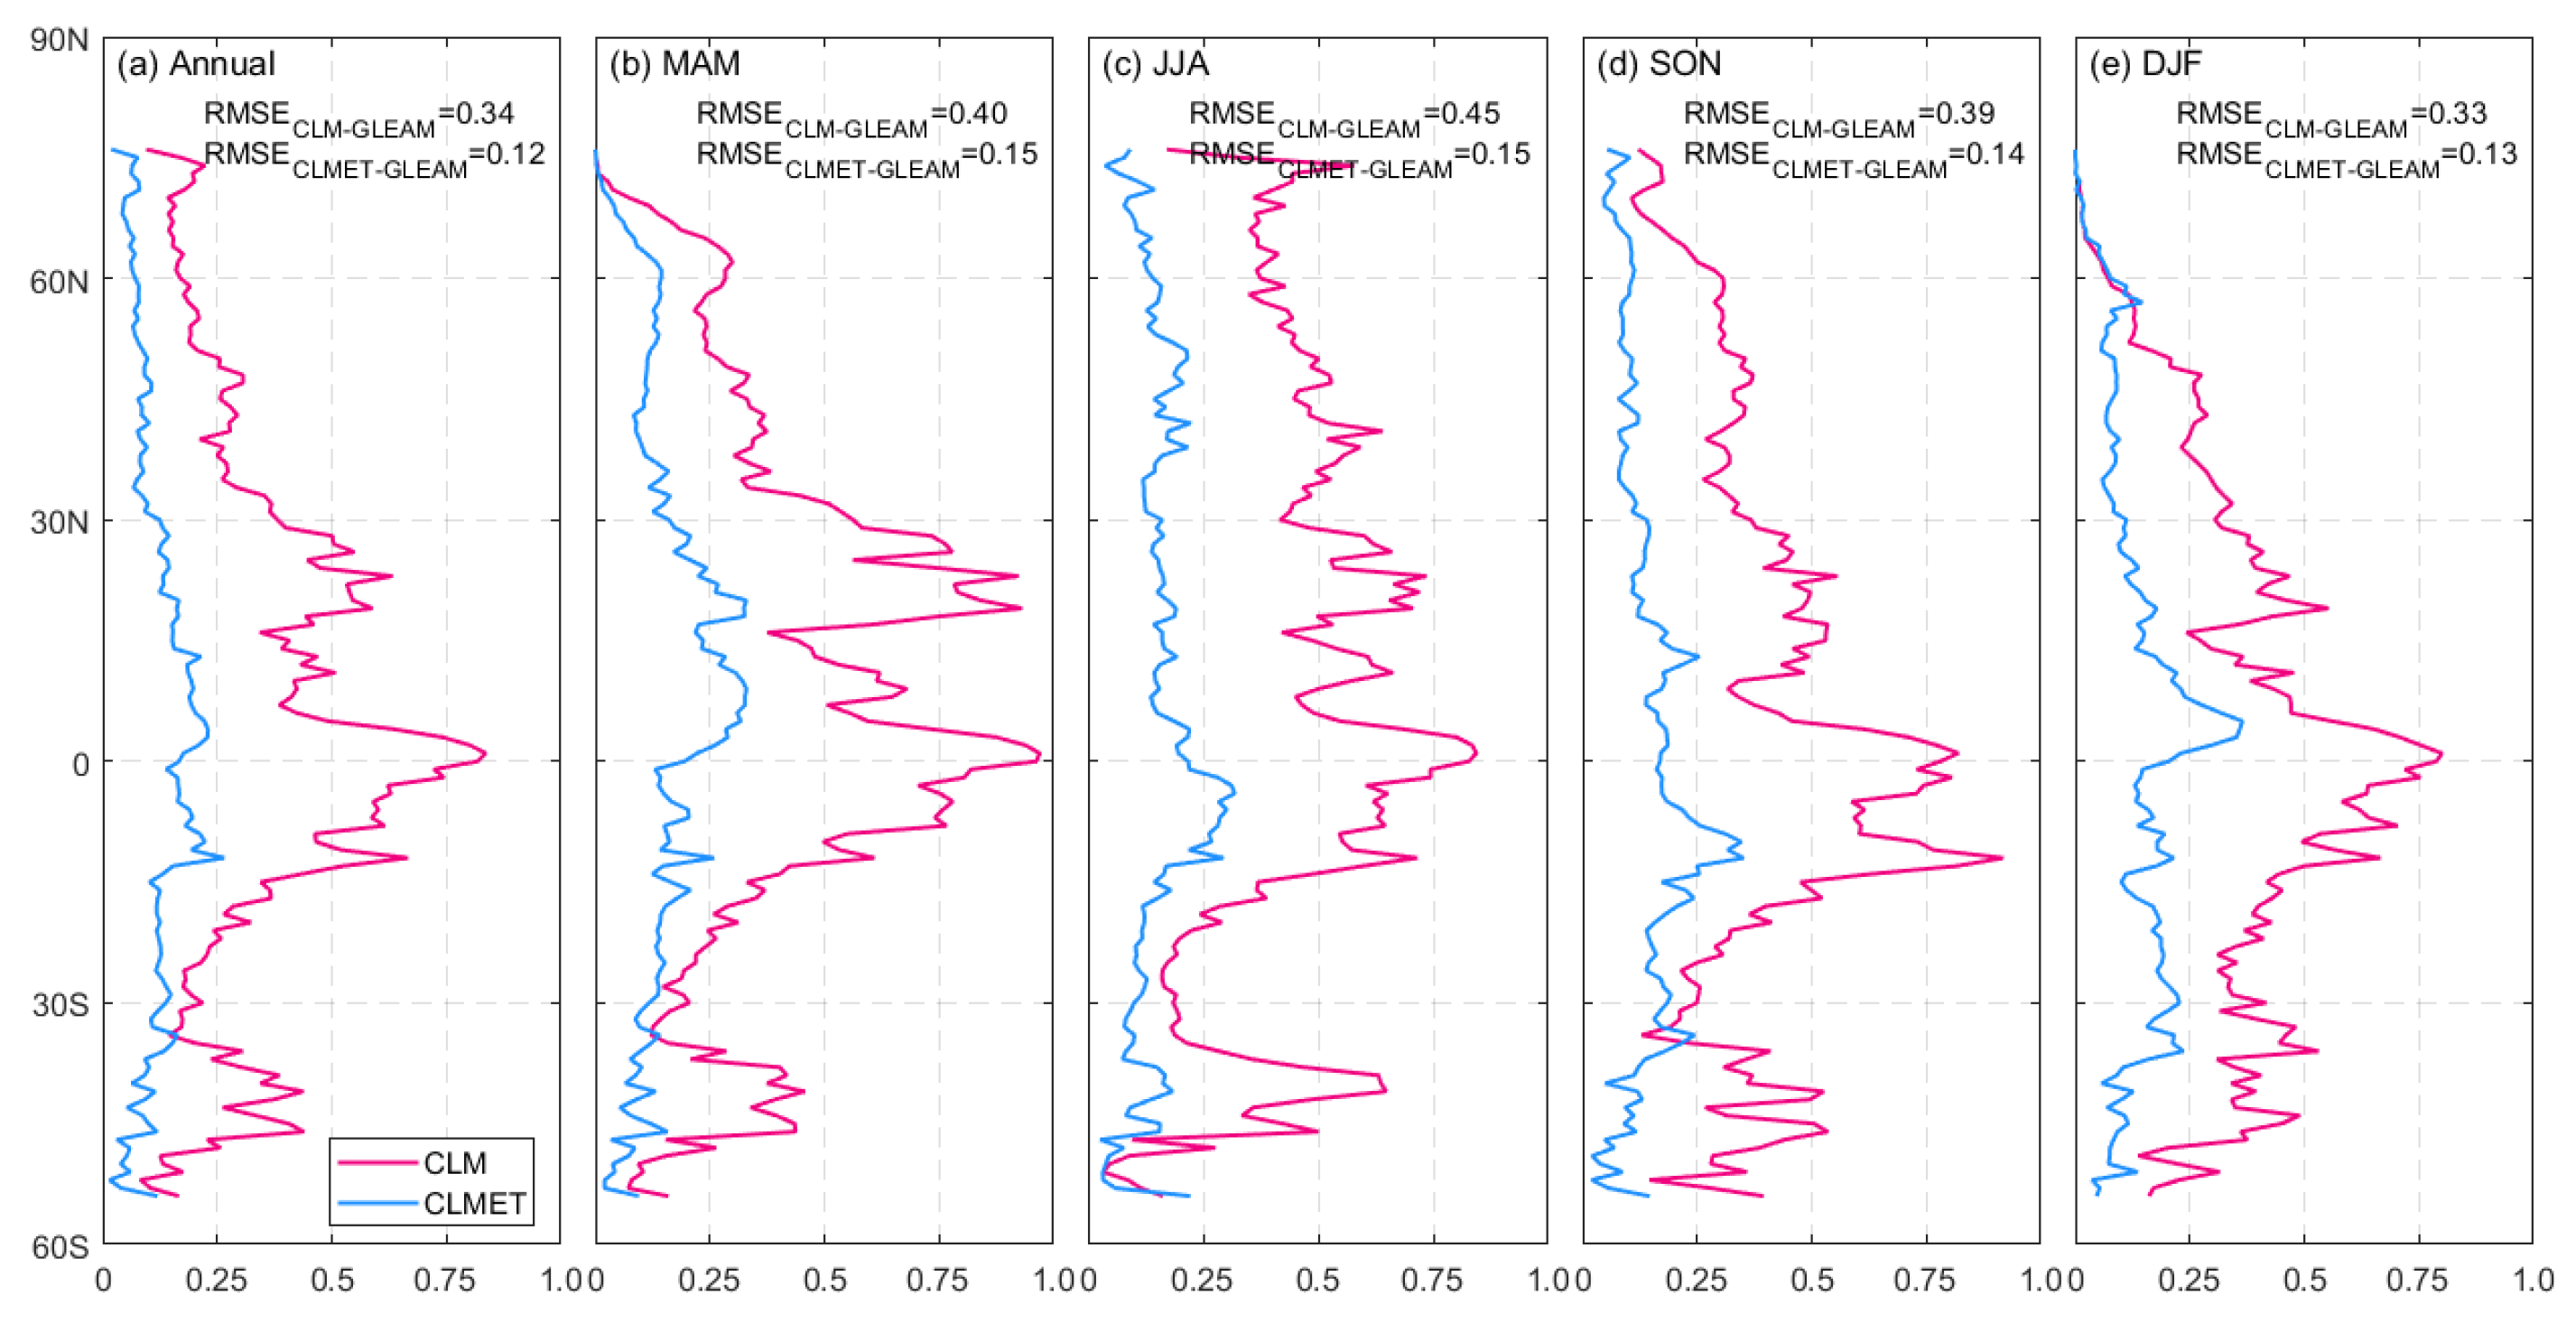
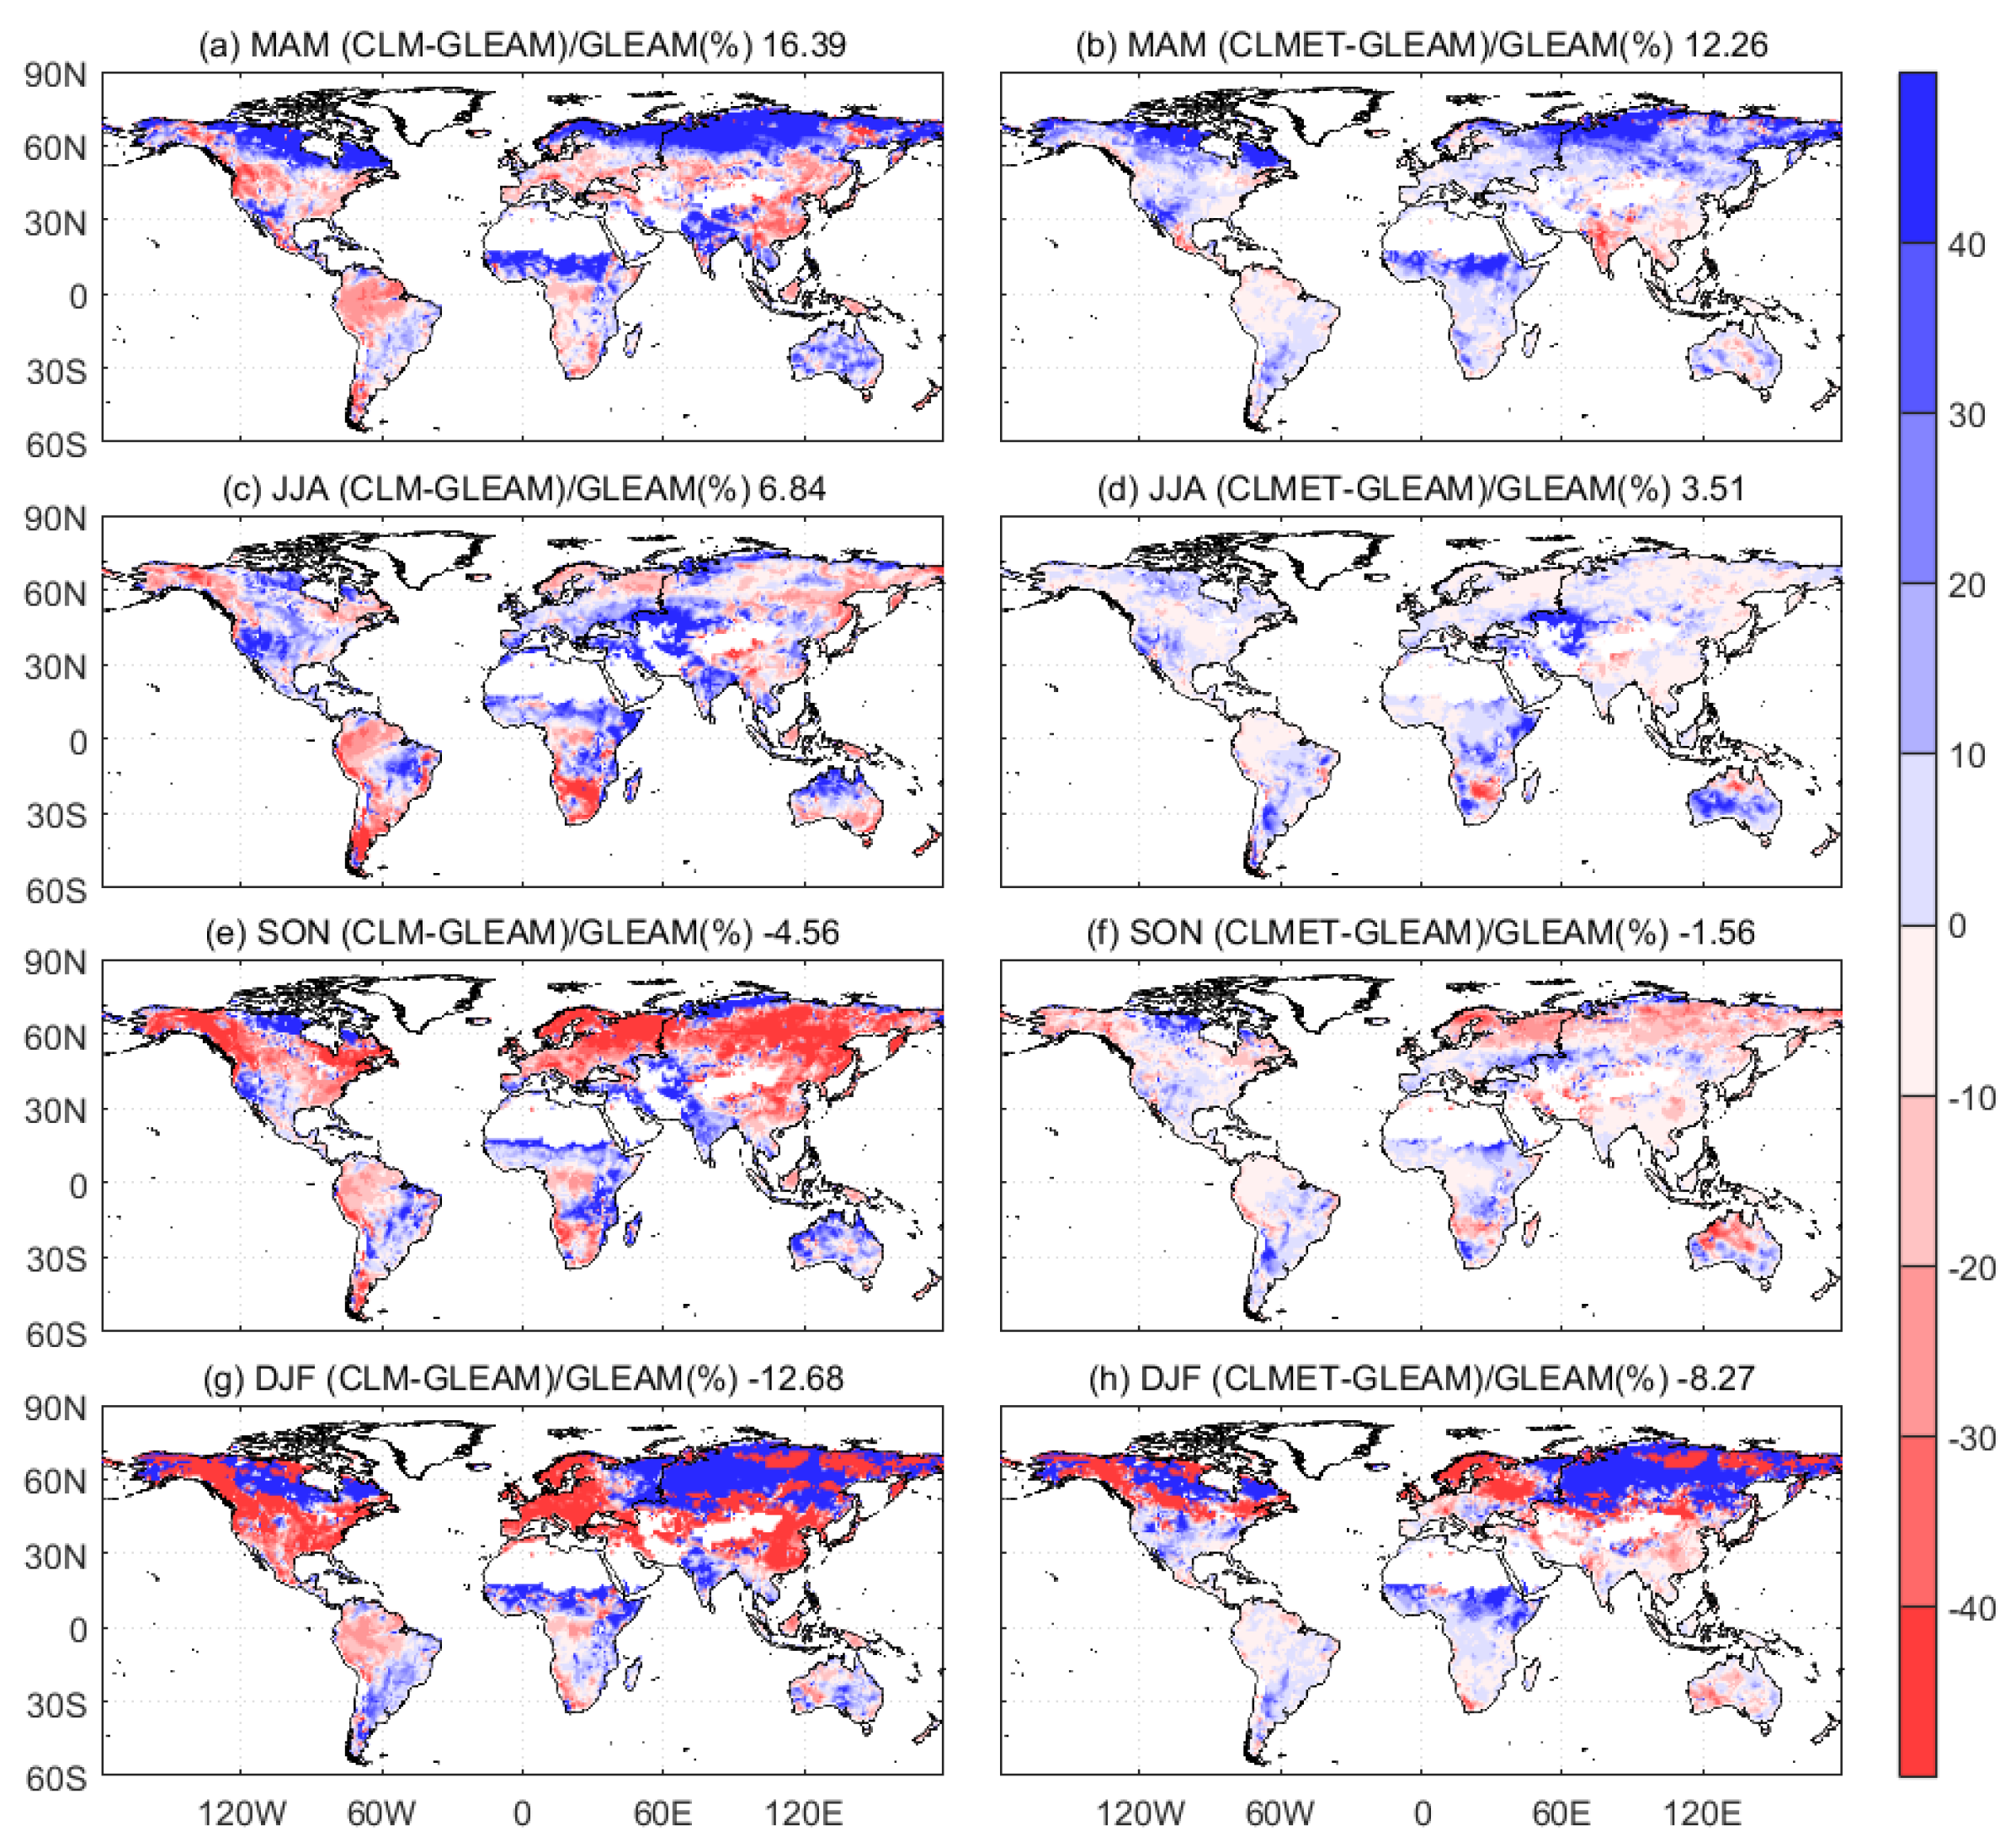
Table 2 presents the temporal evolution of simulated ET from types of simulations (CLM and CLMET) over the globe against GLEAM-based ET during the period of 2006–2018. It can be seen that the overestimations in CLM generally exist during this period, and the most notable overestimation occurs in 2018, with the RB of 9.3% (Table 2). CLMET effectively improve the performance in ET simulation by alleviating the general overestimations, and the RBs of most years are within 4%. The RMSE are also significantly reduced during this period. Spatially, Figure 3 illustrates the multi-year averages (2006–2018) of ET derived from GLEAM, simulated by the CLM and CLMET, and the RBs of these two simulations against GLEAM. Generally, both the CLM and CLMET reasonably capture the spatial patterns of ET compared with the GLEAM data, e.g., higher ET in Amazonia, central Africa, Indonesia islands, and lower ET in western America, Alaska, north Siberia, and southeast Australia, as shown in Figure 3a–c. In addition, the global-averaged ET are almost the same among GLEAM, CLM, and CLMET. However, both overestimation and underestimation do exist at the regional scale in CLM; the areas with overestimation and underestimation are nearly half and half (Figure 3e). CLMET effectively alleviates both the overestimation and underestimation, obtaining ET values closer to GLEAM. The global-averaged RB in CLM is 5.27%, with a substantial portion of areas where RBs exceed 10%. In CLMET, the global-averaged RB is reduced to 2.54%, and RBs are within 10% in most areas of the global land. The RMSE value in CLM is 0.346 mm day−1 (126 mm year−1), which is reduced to 0.118 mm day−1 (43 mm year−1) in CLMET. Likewise, the CC is improved from 0.93 in CLM to 0.98 in CLMET. The improvement is more remarkable over Asia and North America than other continents, with the RMSE reduced by 70.2% and 67.8%, respectively (Table 3). The latitudinal profiles of averaged RMSE values of CLM and CLMET against GLEAM on different temporal scales during the period 2006–2018 are presented in Figure 4. The largest RMSE value of CLM-simulated ET against GLEAM occurs near the equator where the magnitude of ET is relatively larger. The value gradually decreases with the latitude increasing towards the two poles. CLMET significantly reduces RMSE at almost all latitudes, with a greater improvement in low-latitude areas. The statistics of the two types of simulations during different seasons over six continents are shown in Table 3, and the relative difference of multi-year seasonal averaged ET is presented in Figure 5. It can be seen that the CLM overestimates the global-averaged ET in March–April–May (MAM) and June–July–August (JJA), while it underestimates ET in September–October–November (SON) and December–January–February (DJF). The RBs are 16.39%, 6.84%, −4.56% and −12.68% for MAM, JJA, SON, and DJF, respectively. At the continental scale, the largest overestimation occurs in Asia during MAM, with an RB as large as 23.95%, whereas the largest underestimation occurs in North America during DJF, with an RB of −39.87%. CLMET significantly ameliorates the model’s performance, as almost all the statistics in CLMET are superior to those in the CLM. The improvement from CLM to CLMET is more substantial for JJA and SON than DJF and MAM. The RB is reduced from 6.84% in CLM to 3.51% in CLMET during JJA, and from −4.56% in CLM to −1.56% in CLMET during SON. As for continents, the greatest improvement occurs over Asia, with the RB and RMSE reduced by 69.6% (from 7.04% in CLM to 2.14% in CLMET) and 70.2% (from 0.312 mm day−1 in CLM to 0.093 mm day−1 in CLMET, equivalent to from 114 mm year−1 to 34 mm year−1), respectively. Meanwhile, the CC over Asia is also significantly improved.

Table 2.
Temporal evolution of simulated ET from two types of simulations (CLM and CLMET) against GLEAM-based ET over the globe during the period of 2006–2018.
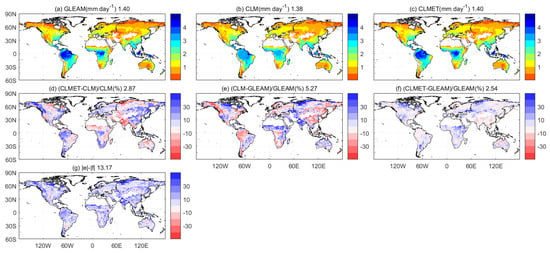
Figure 3.
Multi-year averaged ET derived from (a) GLEAM, (b) CLM, and (c) CLMET, the relative bias (RB) between (d) CLMET and CLM, (e) CLM and GLEAM, (f) CLMET and GLEAM, and (g) the difference between the absolute value of (e) and absolute value of (f) during the period of 2006–2018. The number in each title represents the global average.

Table 3.
Spatial evaluations of simulated ET from two types of simulations (CLM and CLMET) against GLEAM-based ET over the globe and six continents annually and seasonally during the period 2006–2018. March–April–May (MAM); June–July–August (JJA); September–October–November (SON); December–January–February (DJF).
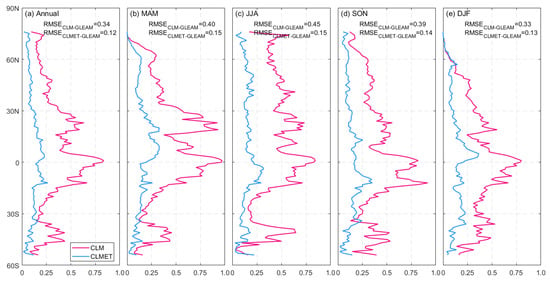
Figure 4.
The latitudinal profiles of RMSE values (mm day−1) during the period of 2006–2018 between CLM and GLEAM (magenta line) and between CLMET and GLEAM (blue line), for annual (a) and seasonal (b–e).
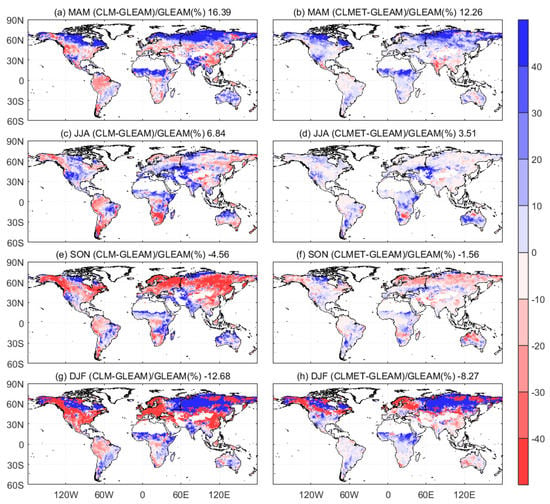
Figure 5.
The relative difference of multi-year seasonal averaged ET during the period 2006–2018, (a,c,e,g) between CLM and GLEAM (first column) and (b,d,f,h) between CLMET and GLEAM (second column) in four seasons (first to forth row). The number in each title represents the global average.
We also assess CLM and CLMET with two independent reference datasets of ET, MODIS-based, and MTE-based ET during the overlap period (2006–2011) between MODIS and MTE. Figure 6 shows the global map of the multi-year averaged ET in CLM and CLMET and their RBs against either MODIS- or MTE-based ET. In terms of global averaged ET, both CLM and CLMET perform similarly relative to the reference data, with the RBs less than 2%. However, it can be seen that the RBs in CLMET are smaller than those in CLM, and the CCs in the former are also higher than those in the latter, when comparing with MODIS or MTE in most continents (Table 4). For example, the evident ET underestimation occurs in Europe with an RB of −6.303% and an RMSE of 0.127 against MTE, and CLMET substantially reduces the RB and RMSE by 32.2% and 23.6%, respectively. Meanwhile, the CC is improved from 0.92 in CLM to 0.96 in CLMET. This is consistent with the result obtained from the validation against the GLEAM-based ET. Additionally, the latitudinal profiles of multi-year averaged RMSE values during the overlap period (2006–2018) between CLM-/CLMET-simulated ET and MODIS-/MTE-derived ET are provided in Figure A1. At the seasonal time scale, the CLM overestimates the global-averaged ET in MAM and JJA, while it underestimates ET in the other seasons compared to MODIS- and MTE-based ET (Figure A2 and Figure A3 and Table A1 and Table A2), which is also in line with the results obtained from the comparison with the GLEAM-based ET. CLMET reduces biases for all seasons except for MAM when the reference dataset is MTE. The difference between model-simulated ET and remote sensing-derived ET remains large during DJF, nevertheless, the improvement is still significant for most continents during this season.

Figure 6.
Multi-year averaged ET during the period 2006–2011, (a) MODIS and (d) MTE, the relative bias (b) between CLM and MODIS, (e) CLM and MTE, (c) CLMET and MODIS, and (f) CLMET and MTE. The number in each title represents the global average.

Table 4.
Spatial evaluations of simulated ET from two types of simulations (CLM and CLMET) against two reference data (MODIS- and MTE-based) over the globe and six continents annually during the time period 2006–2011.
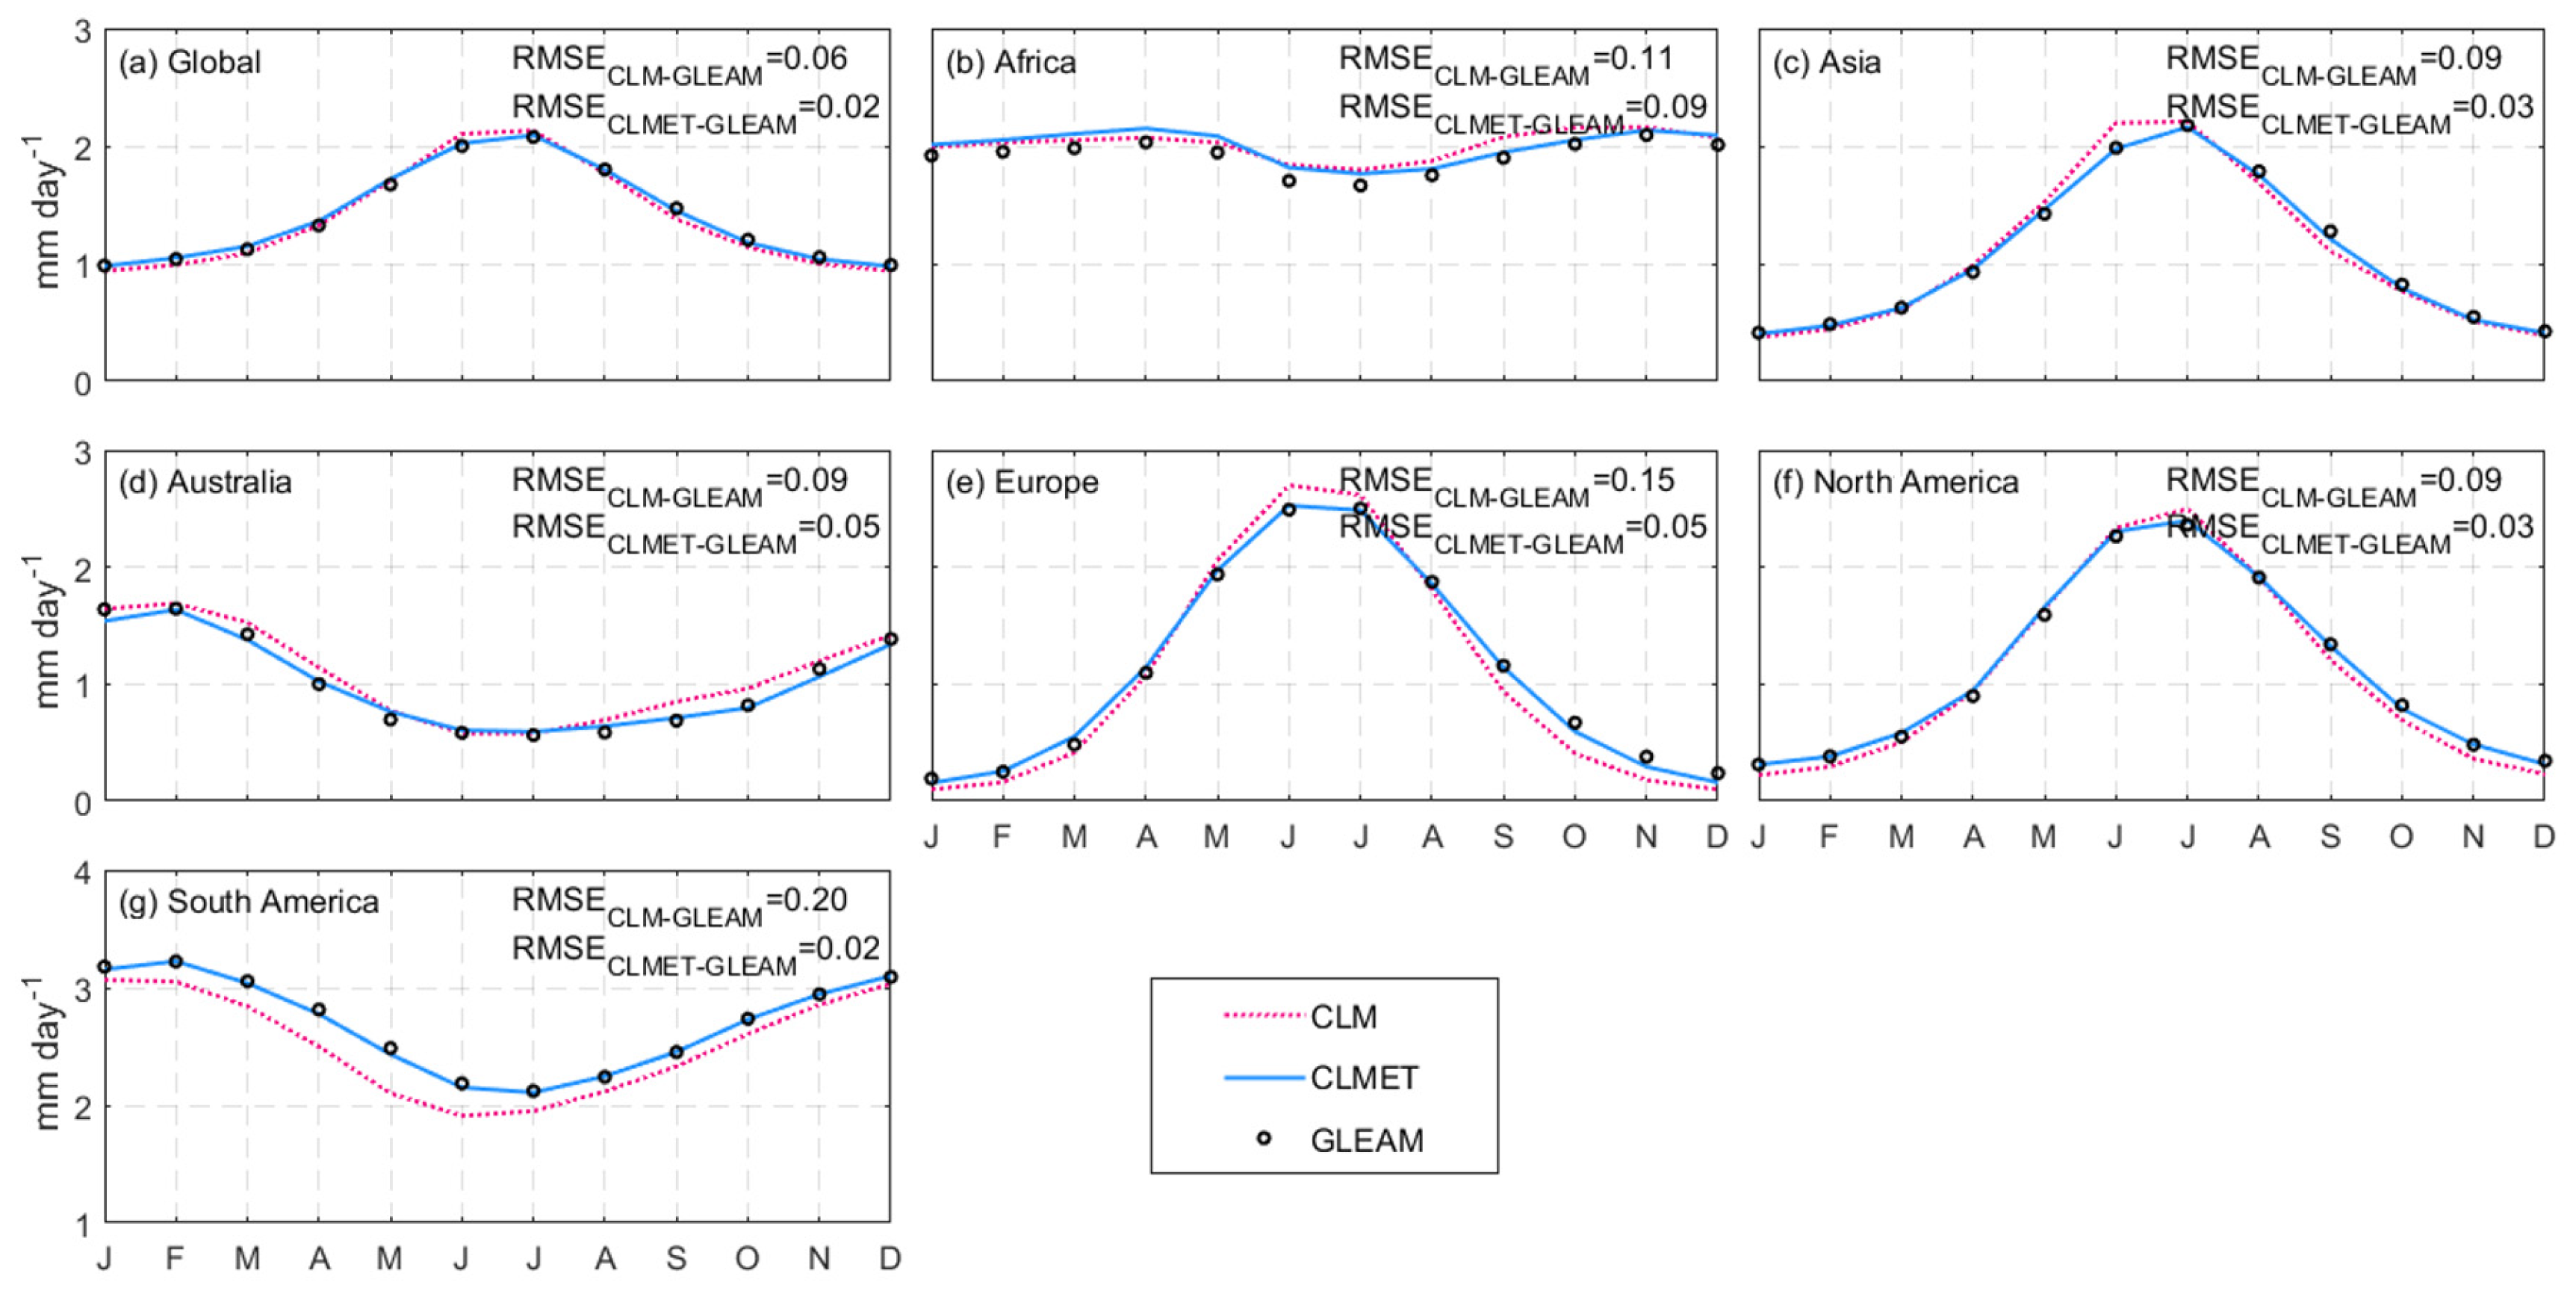
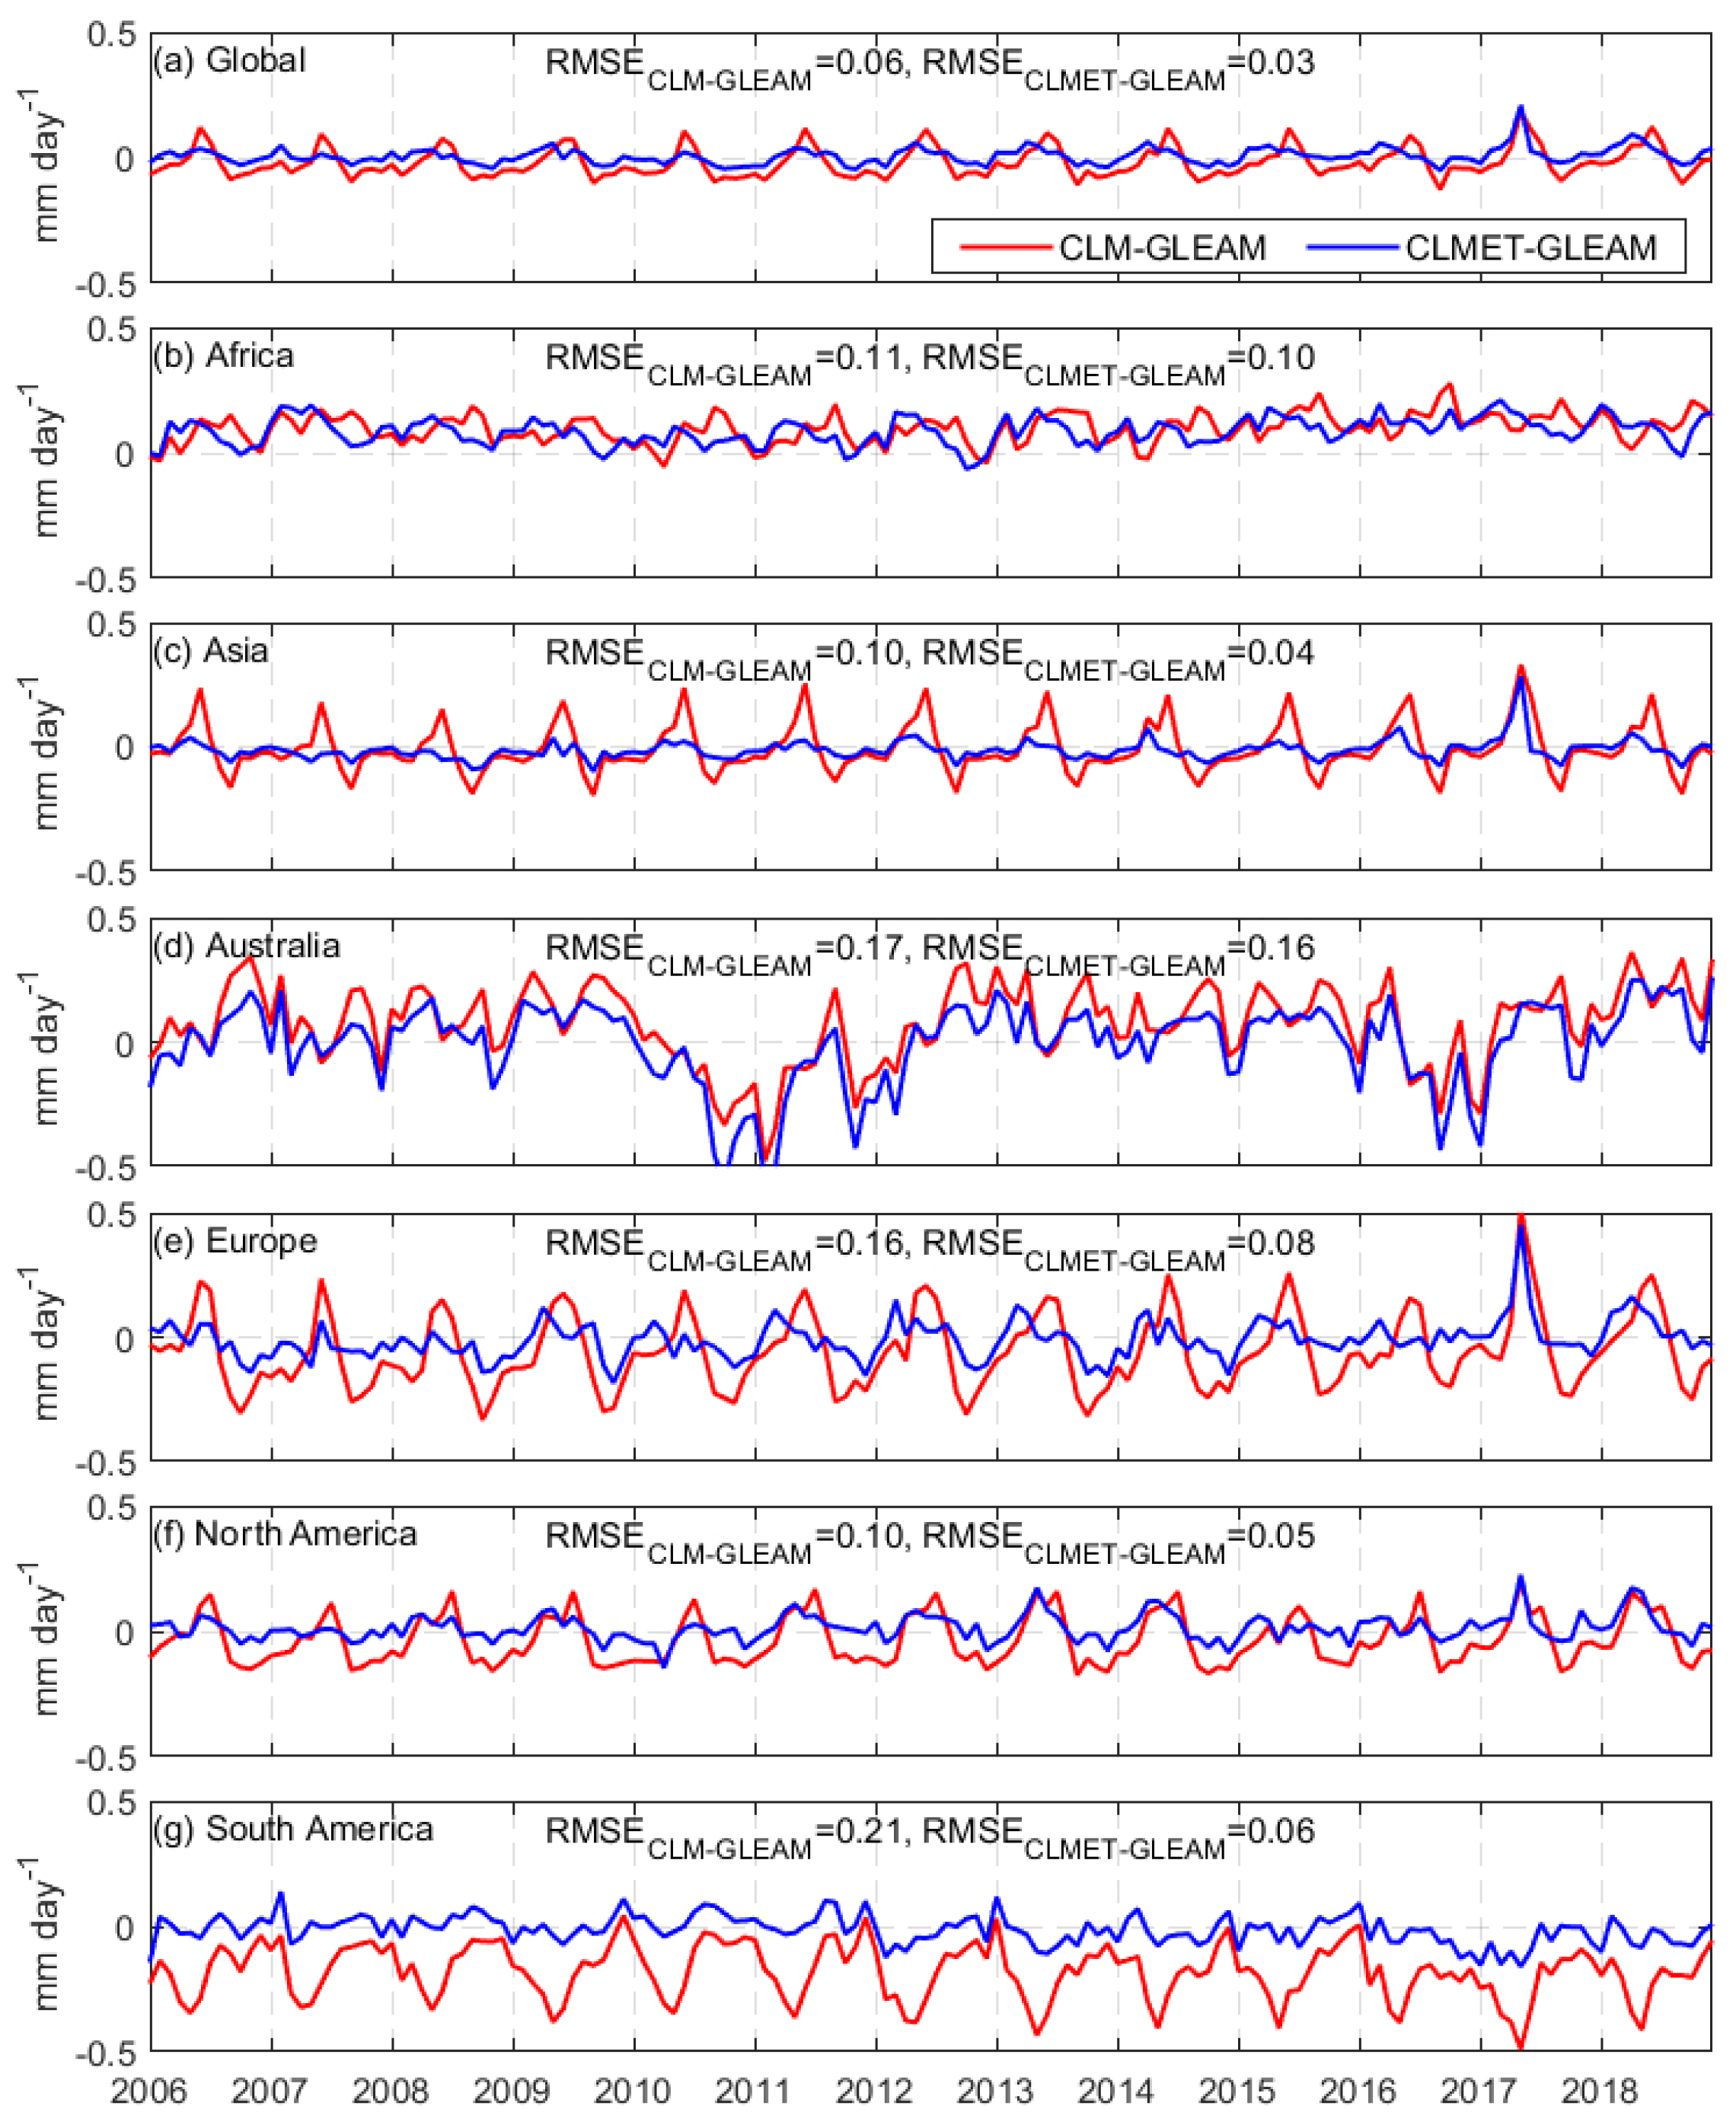
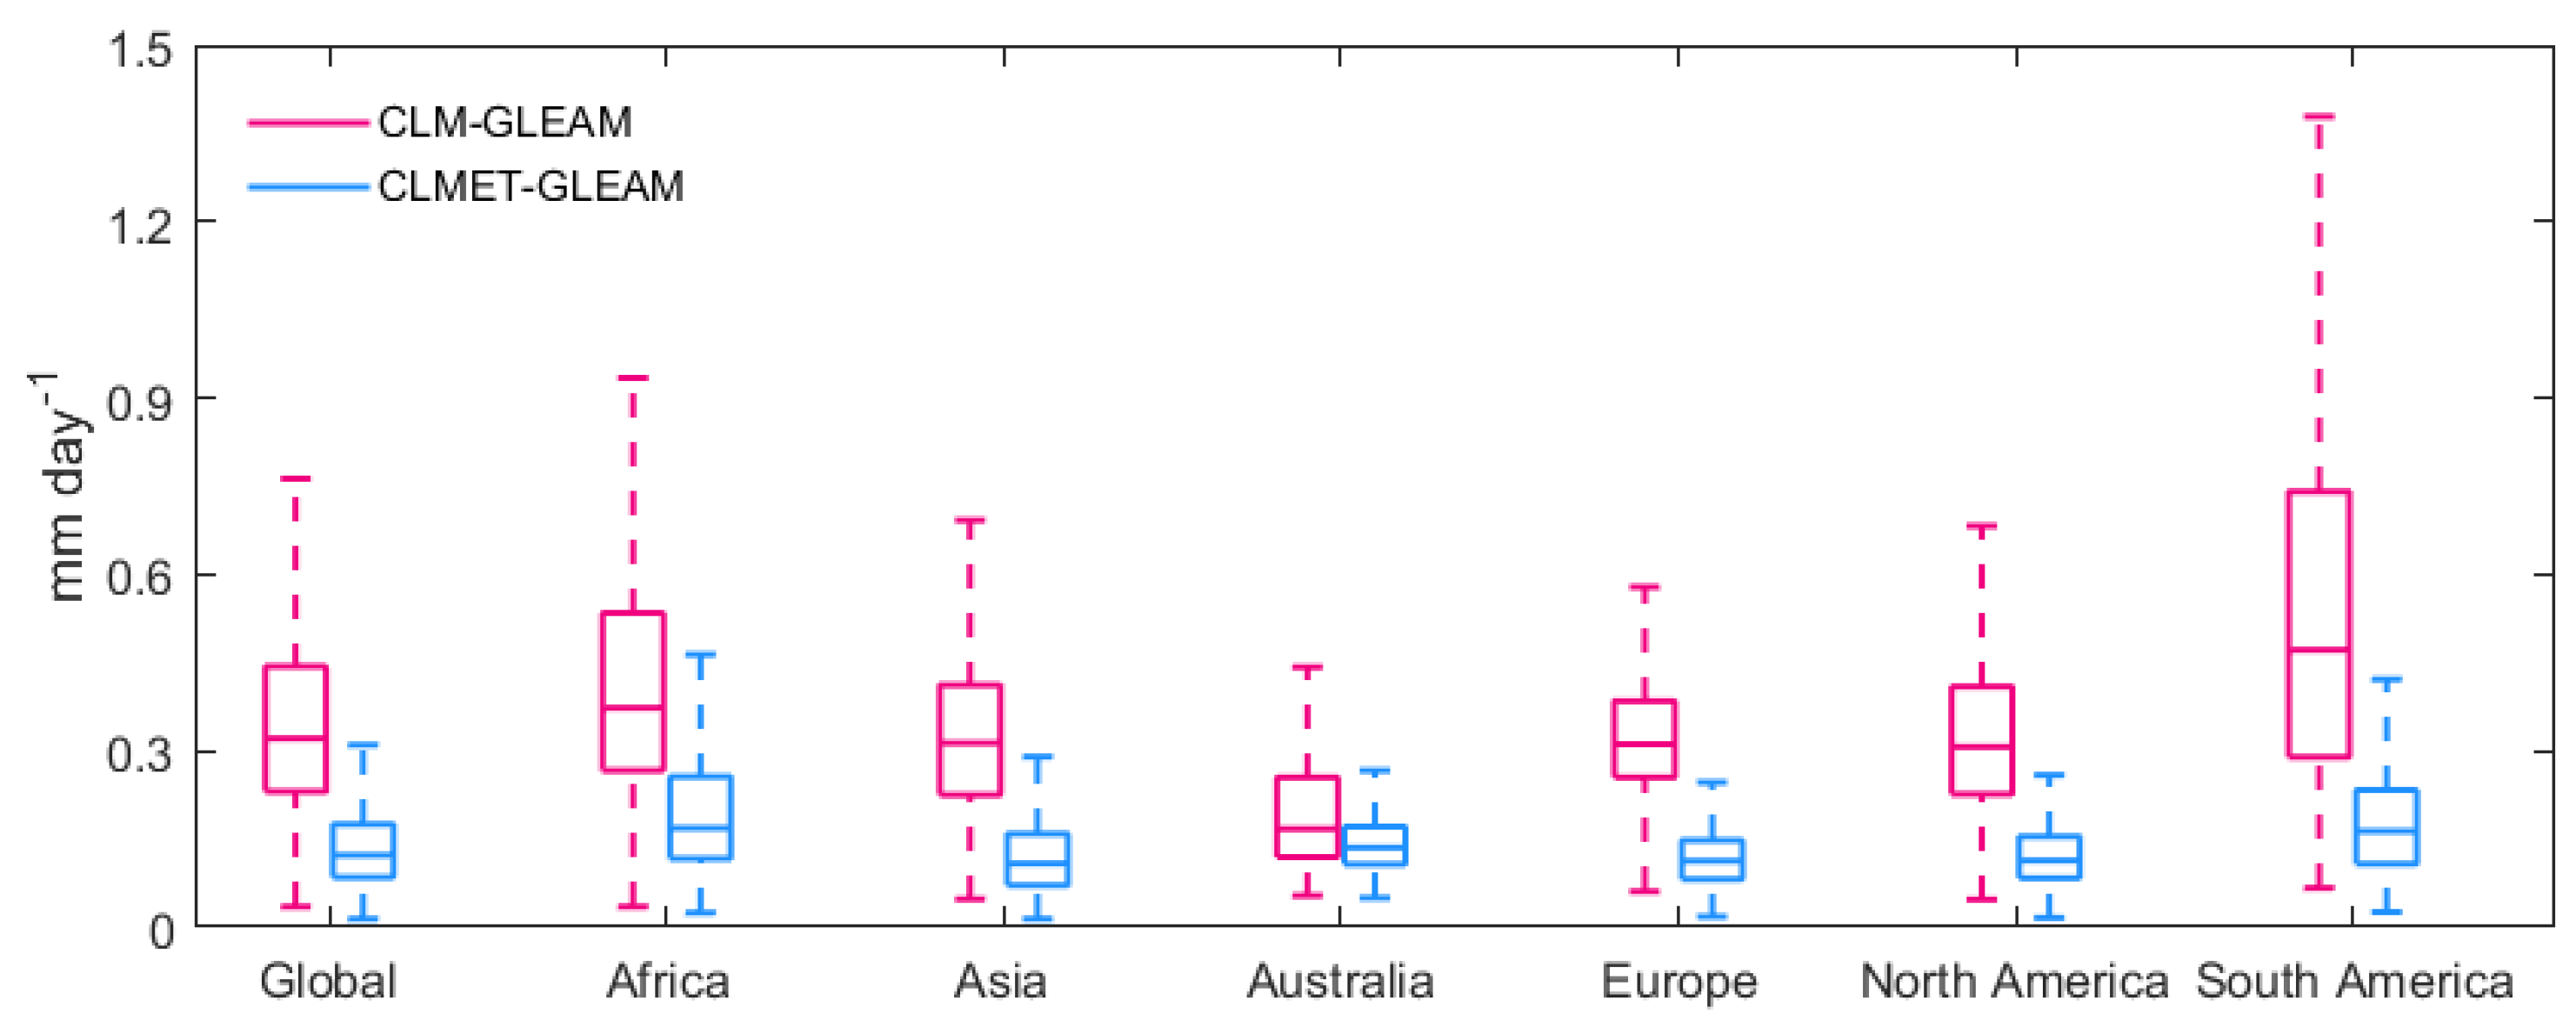
Furthermore, we analyze climatological seasonal cycles of ET from the two types of simulations and GLEAM over the global land and six continents to validate the improvement from CLM to CLMET, as shown in Figure 7. Globally, the CLMET simulation is closer to GLEAM compared with CLM, with an RMSE value reduced from 0.06 to 0.02 (Figure 7a), which demonstrates the efficient correction effect. The improvement can be attributed to CLMET’s ability in mitigating the underestimation for SON and overestimation for JJA in most continents in the CLM simulation. The model performance varies with the continent. For instance, the improvement effectiveness is relatively low in the areas where the seasonal ET variability is small, such as Africa and Australia, whereas the effectiveness is high in the areas where the ET seasonality is strong, such as Asia, Europe, and North America. The time series of the simulated ET in the CLM and CLMET against GLEAM and the corresponding spatial RMSE values over the globe and six continents is illustrated in Figure 8. The correction effectiveness of the proposed method for overestimation existing in CLM is usually efficient over most continents and most seasons, which is consistent with the finding of Wang et al., (2017). However, the effectiveness for underestimations depends on whether the area is dominated by water limit regime or not, which can be verified by the comparison between South America and Australia. In South America (Figure 8g), ET is high all year around with the value of greater than 2.0 mm day−1 (Figure 7g) because of the abundant rainfall and radiation. With sufficient water supply, ET can be increased in CLMET without water limit, which corrects the ET underestimation in CLM. However, the adjustment from lower values to higher values are restricted by the water supply in water-limited regimes in Australia (Figure 8d). When this adjustment is implemented, the model checks whether water stored in the soil layer and vegetation canopy can satisfy the demand for elevating ET. The extent of increasing ET relies on the availability of water stored in these reservoirs. As a result, the limited bias correction for underestimation in Australia may result from the limited water supply. The correction effectiveness is largely determined by the water supply-controlled mechanism and varies with continents. Figure 9 shows the boxplots of RMSE of monthly ET simulated from CLM and CLMET against GLEAM during the period 2006–2018 globally and over six continents. Both medians and ranges of RMSE in CLM over six continents are very different. The median in Australia is 0.16 mm day−1 (4.87 mm month−1), whereas the value in South America is as large as 0.47 mm day−1 (14.30 mm month−1). The ranges in these two continents are 0.39 mm day−1 (11.86 mm month−1) and 1.33 mm day−1 (40.45 mm month−1), respectively. The values of the medians and RMSE are greatly reduced by CLMET. For instance, the range of RMSE in South America becomes 0.40 mm day−1 (12.17 mm month−1), which is a 71% reduction from CLM to CLMET. The improvement in ET simulations from CLM to CLMET against the MODIS or MTE ET is similar to the improvement with GLEAM as the reference data (Figure A4, Figure A5 and Figure A6).
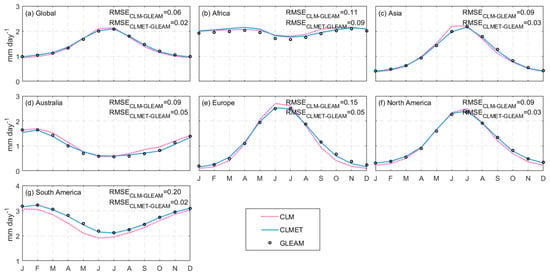
Figure 7.
Seasonal cycles of ET during the period of 2006–2018 from GLEAM, CLM, and CLMET over (a) the globe, (b) Africa, (c) Asia, (d) Australia, (e) Europe, (f) North America, and (g) South America.
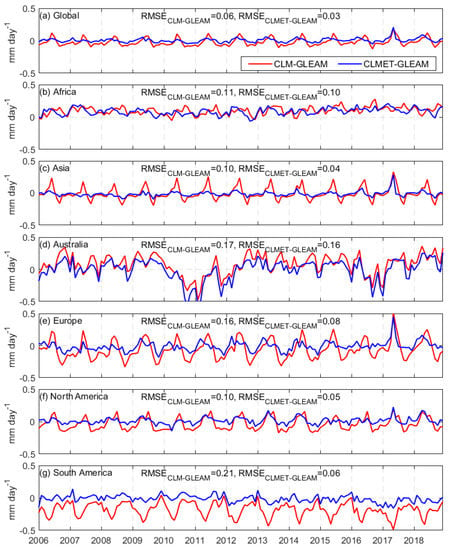
Figure 8.
Time series of ET differences between model (CLM and CLMET) and reference data (GLEAM) over (a) the globe, (b) Africa, (c) Asia, (d) Australia, (e) Europe, (f) North America, and (g) South America.
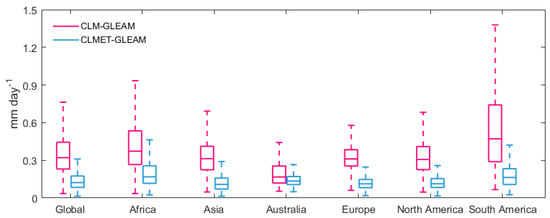
Figure 9.
Boxplot of RMSE values of CLM- and CLMET- based ET against the GLEAM data during the period 2006–2018 over the globe and six continents.
4.2.2. Runoff
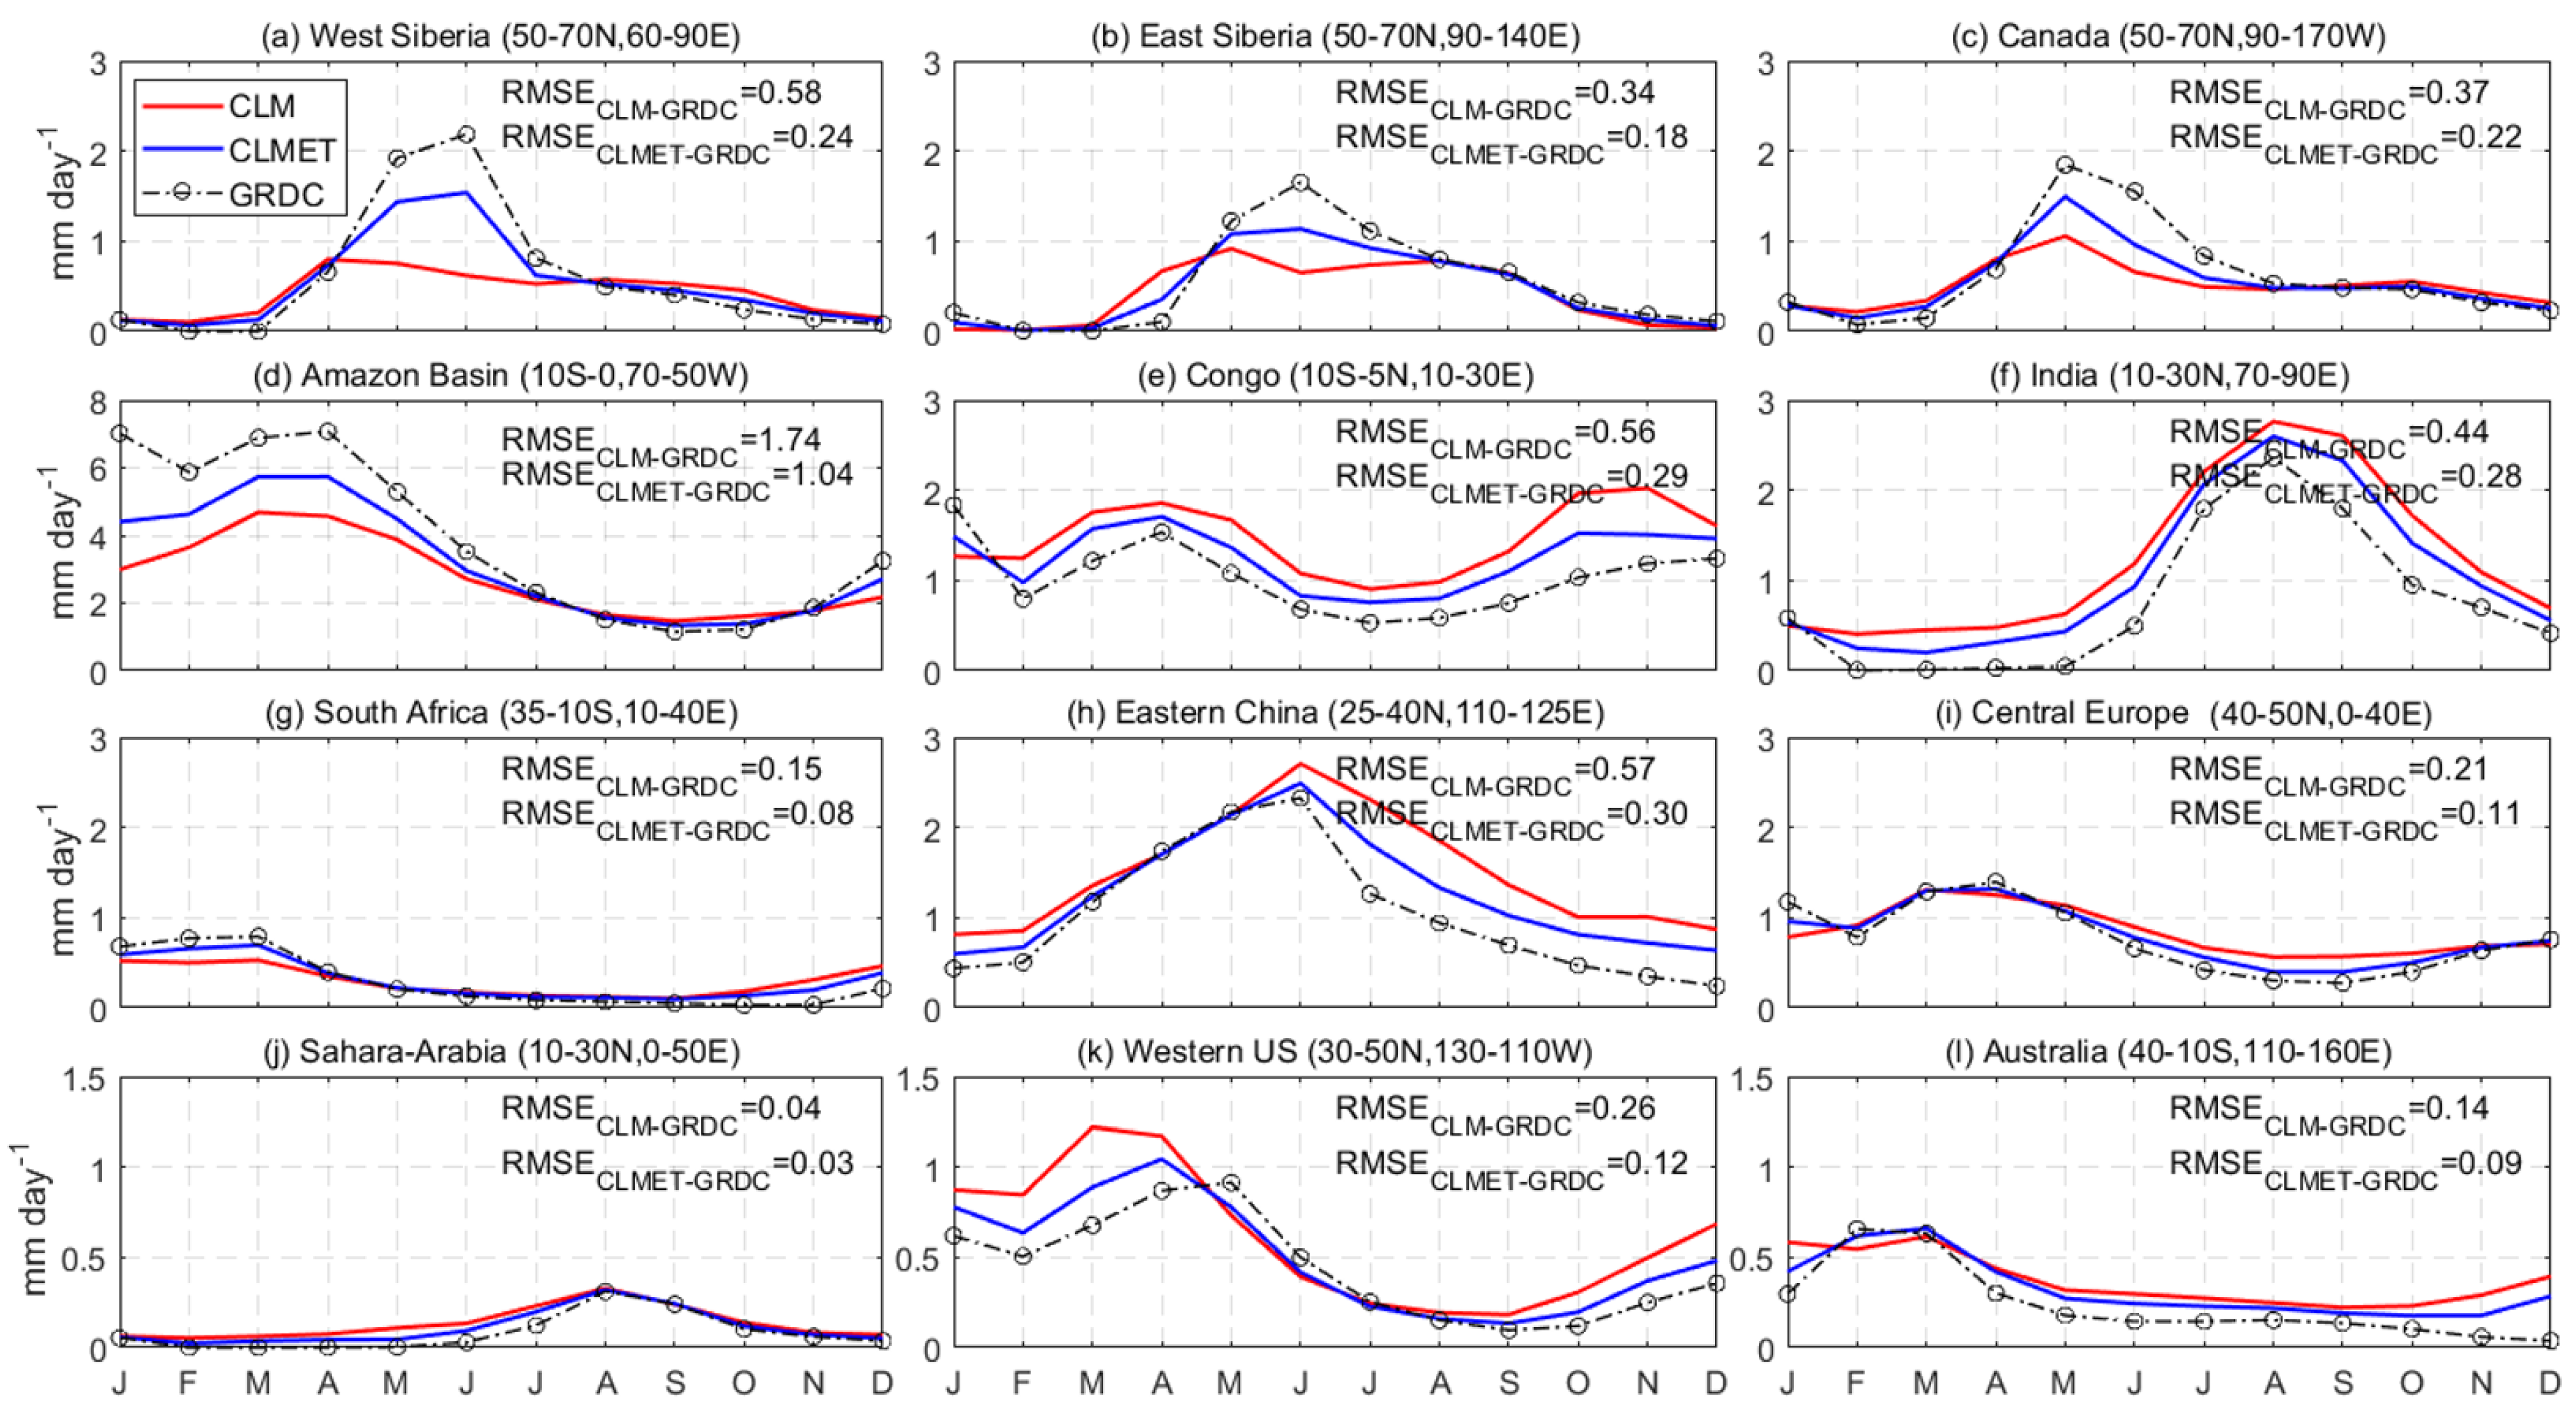
In this study, we use the total runoff retrieved from the University of New Hampshire-GRDC to assess the performance of CLM and CLMET in simulating runoff. The global-averaged total runoff simulated by CLM and CLMET is similar to the GRDC-based estimate, and the values are 0.88, 0.86, and 0.84 mm day−1 (321, 314, and 307 mm year−1) for CLM, CLEMT, and GRDC, respectively. Regionally, CLM evidently overestimates total runoff over more than half of the global land, such as central United States, Argentina, central Africa, Indian Peninsula, southern Europe, northeast China, and most areas of Australia, while underestimations occur over Alaska, central Amazon, south Africa, and northern Siberia (Figure 10e). CLMET effectively alleviates both the overestimations and underestimations, with a global average RB reduced from 18.66% to 16.77%, RMSE reduced from 0.661 mm day−1 (241 mm year−1) to 0.415 mm day−1 (151 mm year−1), and CC increased from 0.83 to 0.94. In terms of the continents, the effectiveness of improvement in CLMET varies with the continent, and a smaller RB and RMSE can be found in CLMET (Table 5). For example, in Europe, the substantial alleviation occurs where the value of RB and RMSE are reduced by 32.2% and 40.1% (from 25.52% in CLM to 17.30% in CLMET, and from 0.367 mm day−1 in CLM to 0.220 mm day−1 in CLMET, equivalent to from 134 mm year−1 to 80 mm year−1), respectively, and the value of CC is improved by 0.1 (from 0.85 to 0.95). Additionally, the evaluation result of runoff in Europe is consistent with the result of ET. The ET in CLM is underestimated over Europe, which leads to more runoff amount and overestimation of runoff. In contrast, CLMET alleviates the underestimation of ET by elevating the amount of ET, and consequently obtains more reasonable runoff. Because the in situ observed discharge data used in the University of New Hampshire (UNH)-GRDC do not have a consistent temporal coverage (most of them are from 1980–1999), only the multi-year mean annual and monthly runoff data are available for this runoff dataset. To show the difference of simulated runoff in CLM and CLMET, we select twelve regions with a variety of climate regimes, and investigate the seasonal cycles of runoff simulated by these two types of simulations (Figure 11). The GRDC-based data show that the runoff seasonality is strong in West Siberia, East Siberia, Canada, and the Amazon basin (Figure 11a–d). CLM substantially underestimates the seasonality by simulating much lower runoff values in the rainy season in these regions. The low runoff in CLM is increased by CLMET, resulting in more realistic seasonal cycles of runoff. CLM reasonably simulates the seasonal cycle of runoff in Congo and India, but overestimates runoff with a similar magnitude in all seasons compared with the GRDC-based data. This overestimation is reduced in CLMET, leading to a closer runoff magnitude to the reference data. In Central Europe, Sahara-Arabia, and Australia, CLMET alleviates the overestimation of runoff in the dry season existing in CLM.

Figure 10.
Multi-year averaged total runoff from (a) GRDC, (b) CLM, and (c) CLMET, the relative bias between (d) CLMET and CLM, (e) CLM and GRDC, (f) CLMET and GRDC. The number in each title represents the global average.

Table 5.
Statistics of CLM and CLMET simulated annual total runoff against GRDC-based observations over the globe and six continents.
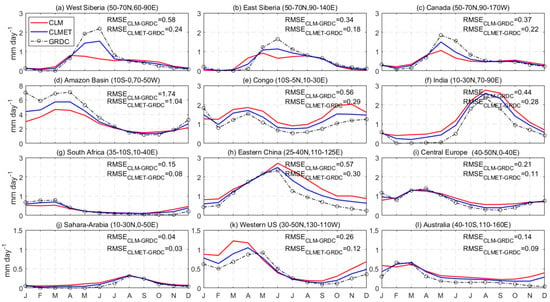
Figure 11.
Seasonal cycle of climatological total runoff from GRDC, CLM, and CLMET at twelve selected regions. RMSECLM-GRDC and RMSECLMET-GRDC represent RMSE of CLM and CLMET against GRDC, respectively.
4.2.3. Soil Moisture
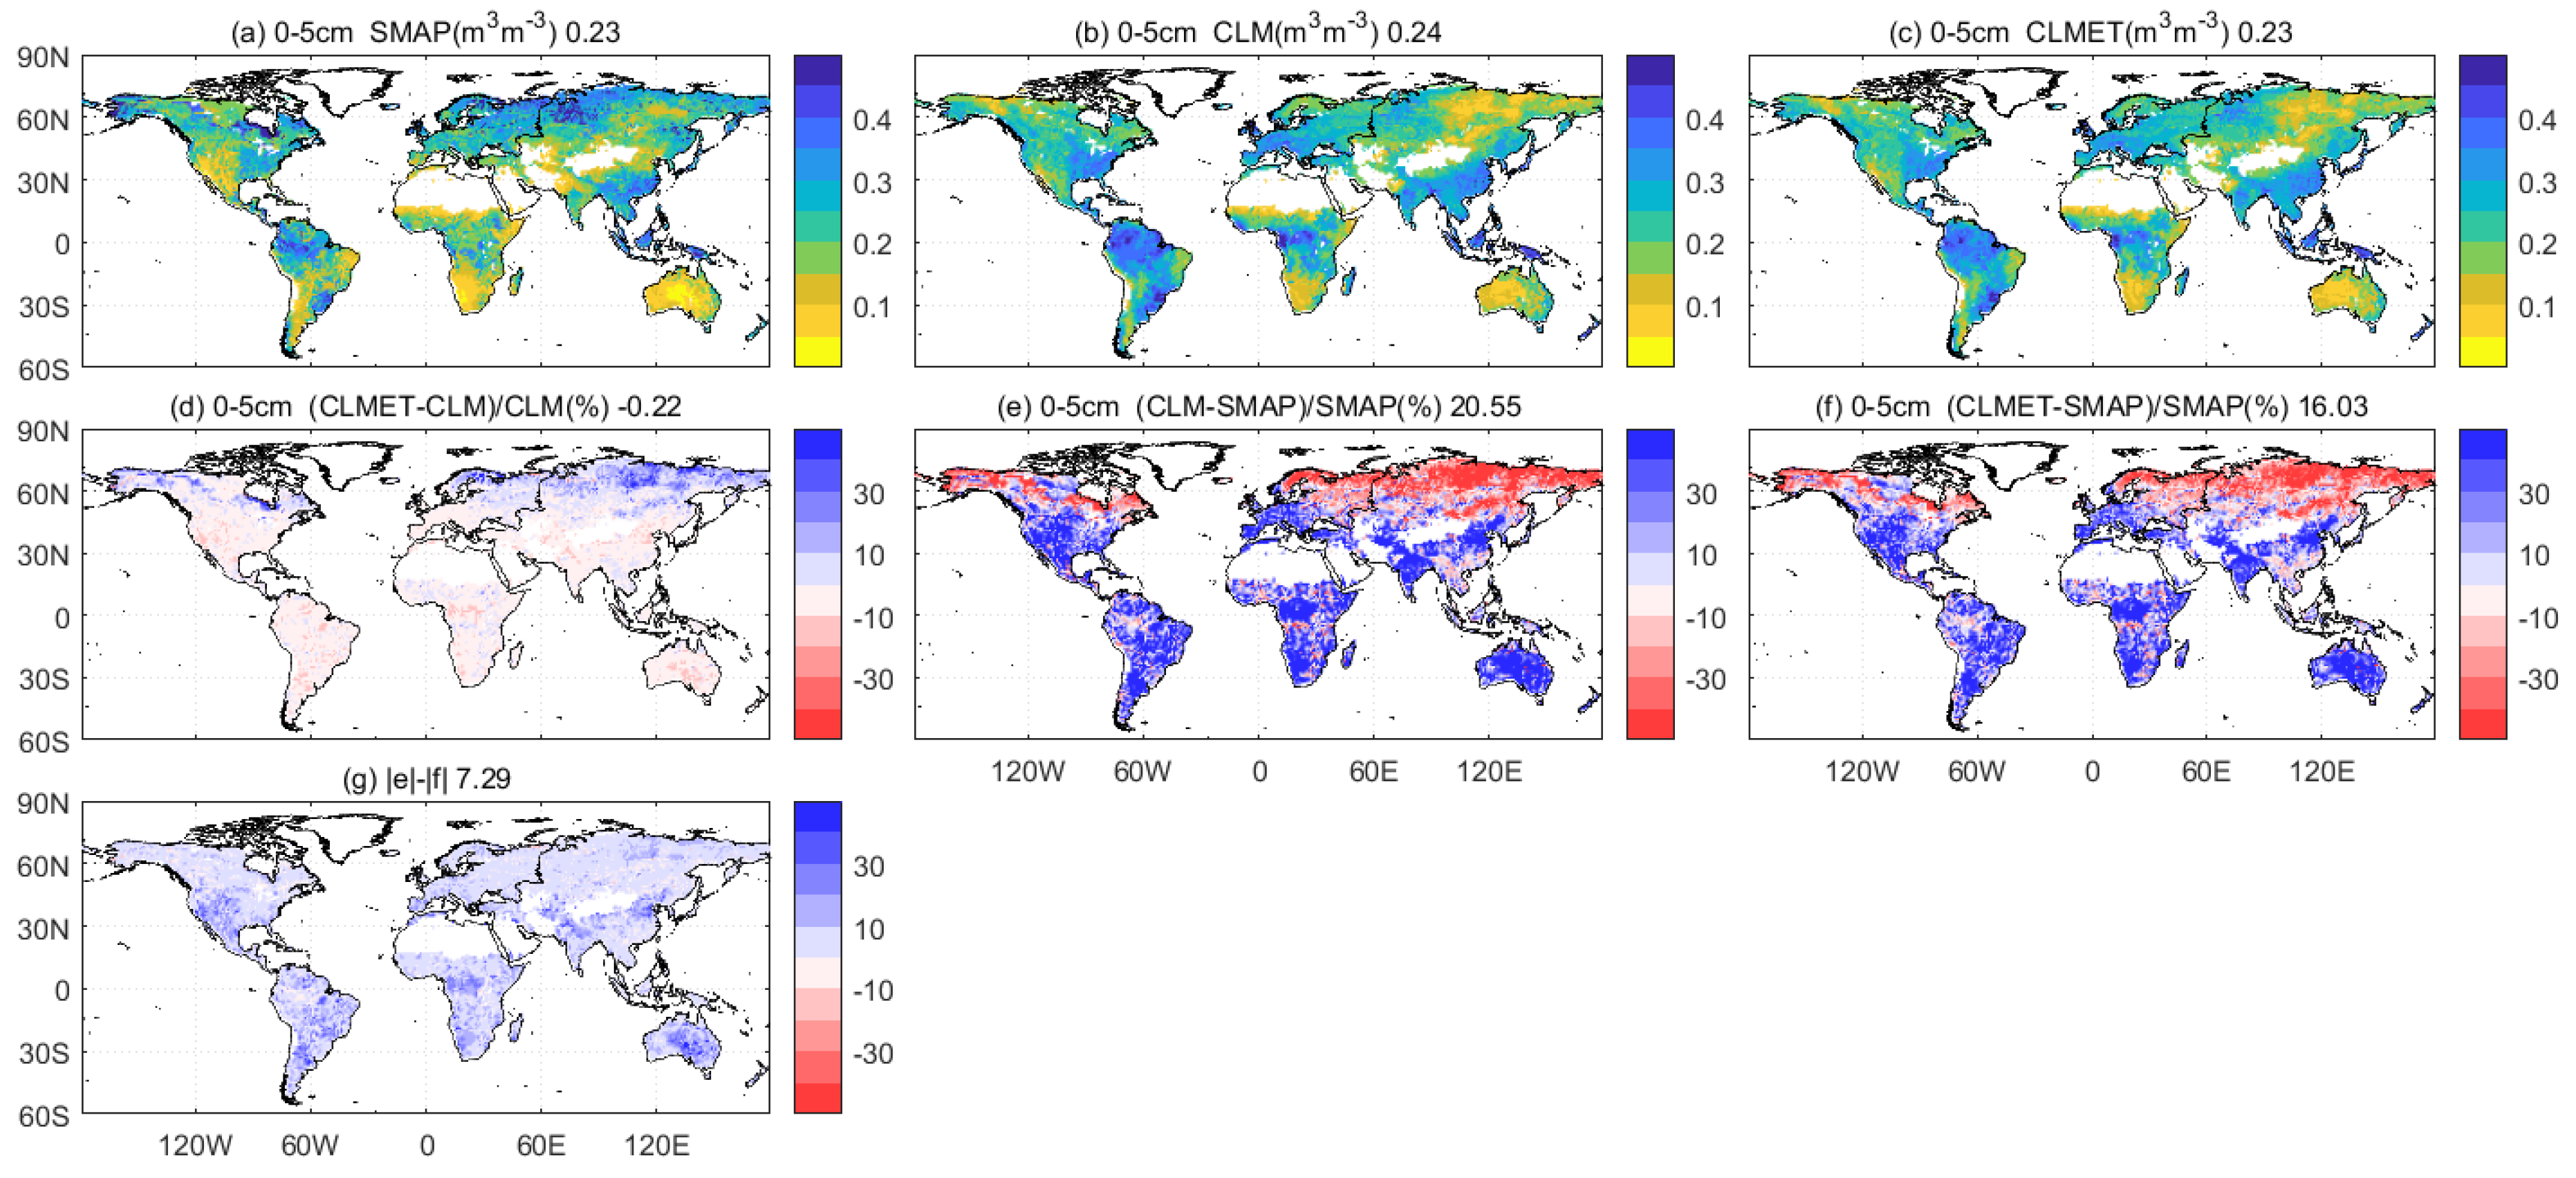
Changes in ET will inevitably influence the soil moisture. Using the SMAP-based soil moisture data as the reference, we compare the CLM- and CLMET-simulated soil moisture to assess the impact of the ET improvement on soil moisture. The comparisons of soil moisture within the surface layer (top 0–5 cm) during April 2015–December 2018 at the global and the continental scales are shown in Figure 12 and Table 6. Both CLM and CLMET realistically simulate the spatial pattern and the global average of surface soil moisture compared with the SMAP-based data (Figure 12a–c). However, substantial overestimation and underestimation at the regional scale do exist. Both two models overestimate surface soil moisture over the areas of the Southern Hemisphere, low-latitude, and most mid-latitude of the Northern Hemisphere, while underestimations occur over the high latitudes of the Northern Hemisphere. However, these biases are reduced from CLM to CLMET, which is supported by a smaller RB average over the globe compared with SMAP-based soil moisture (16.03% versus 20.55%), as shown in Figure 12e–f. The improvement in soil moisture resulting from corrected ET in CLMET can also be found over each continent (Table 6) and in all seasons (Table A3). Overall, the reduction of RB values is mostly about 20% over different continents, which is not as great as that in ET and runoff. According to the water balance budget, ET and runoff are balanced by total precipitation at a longer time scale. Since total precipitation is kept the same in the offline CLM5, the impact of the correction method on runoff has a similar magnitude as the impact on ET. In the term of soil moisture, its change is more complicated. From the respective of water balance, the change of water content in soil with respect to the time step SM/Δt is balanced by precipitation—(ET + runoff). The sum of ET and runoff does not change much between these two types of models, as their change directions are usually opposite. As a result, the impact of the correction method on soil moisture is smaller compared with the impact on ET and runoff.
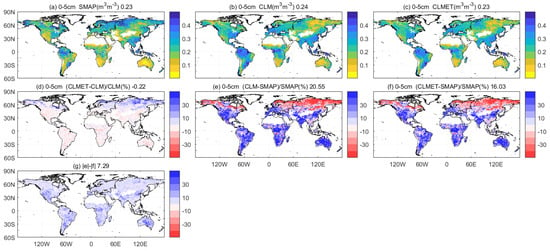
Figure 12.
Multi-year averaged soil moisture in the surface layer (top 0–5 cm) during the period of April 2015 to December 2018 from (a) SMAP, (b) CLM, and (c) CLMET, the relative bias between (d) CLMET and CLM, (e) CLM and SMAP, (f) CLMET and SMAP, and (g) |e|-|f|. The number in each title represents the global average.

Table 6.
Spatial evaluations of simulated soil moisture in top 0–5 cm and top 0–100 cm layer from two types of simulations (CLM and CLMET) against SMAP-based data over the globe and six continents annually during the period April 2015 to December 2018.
Soil moisture in the root zone soil layer (top 0–100 cm) derived from the SMAP data and simulated by two models, and the statistics of CLM and CLMET against the SMAP are shown in Figure A7, Table 6 and Table A4. CLMET improves the simulations of root zone soil moisture at the global and continental scales, but the improvements are relatively smaller compared with the improvements in surface layer soil moisture.
5. Discussion
In this study, we extend our previous study from CONUS to the globe. In our previous study (Wang et al. 2017), we found that the bias correction method reduces RMSE of CLM4.5 simulated annual ET by approximate 50% over CONUS with GLEAM ET as the reference data. This study reports a larger reduction in annual ET compared with GLEAM ET, which is as big as 65.9% from 0.346 to 0.116 mm day−1 (126 to 42 mm year−1) over the globe. The biggest improvement occurs in Asia where RMSE is reduced from 0.312 to 0.093 mm day−1 (114 to 34 mm year−1) for annual ET. Moreover, we found that the correction method is effective when underestimation in ET occurs in the areas with plenty of precipitation (e.g., Amazon) in this study, whereas the correction effectiveness for ET underestimation is undesirable due to the water limit in most CONUS areas in our previous study (Wang et al. 2017). This indicates that the effectiveness of the bias correction method is largely determined by the climate regime of the region, i.e., water limit regime or energy limit regime. Although the correction method significantly improves models in simulating ET in most areas over the globe, there are still several issues worth being discussed. Firstly, the scaling factor derived from GLEAM ET and CLM5 simulated ET is at the monthly scale instead of the daily or hourly scale. There are two reasons for this treatment. One is that the scaling factor at short time scales fluctuates very much, which may result in a poor correction effect. The other is that the long-term and high-quality remote sensing- based ET product at the daily or hourly scale is rare. Even for daily GLEAM ET data, further assessments are still needed. In contrast, the year-to-year variation of monthly ET is much smaller, and the remote-sensing data at the monthly scale is more reliable. Therefore, we decide to estimate the monthly scaling factors. When these factors are applied to the hourly simulation in CLM5, the corrected ET does not always become better due to the temporal scale mismatch between the scaling factor and the hourly simulation. However, the aggregated results at longer time scales (monthly or annually) with the correction method is superior to the original simulations. Secondly, we calculate the scaling factors by using the averaged ET over the entire calibration period, instead of decomposing averaged ET into the related terrestrial variables. ET is a complex hydrothermal process, which is in connection with many terrestrial variables (e.g., air temperature, air humidity, wind, runoff, soil moisture and LAI). The relationships between ET and these variables are usually nonlinear. Therefore, it is very challenging to deconvolute ET with these variables, which is worth being investigated in a future study. Thirdly, the entire period of 1980–2018 is evenly divided into the calibration period and the validation period, with 1980–1999 for the former and 2000–2018 for the latter. The assumption in applying this method is that the relationship between the model ET and observational ET remains unchanged from the calibration period to the validation period. This is a reasonable assumption, which is supported by the study of Wang et al., (2017) who found that changes in the scaling factor between two periods were within 10% over CONUS. However, under the increasingly intensified climate change and human activities in the future, further studies are needed to examine whether the time-invariant relationship can resonantly hold or not.
In this study, we select the GLEAM data as the remote sensing-based ET product to derive the ET scaling factor because of its relatively higher quality and longer record. Besides, the MODIS-based and MTE-based ET are also used as the reference data to validate the improvement effectiveness. All of these remote sensing-based ET products have a similar value to each other in terms of the global average. However, GLEAM-based ET shows an evidently higher ET than both MODIS-based and MTE-based ET over the Amazon region. This higher ET in GLEAM may introduce an “over-correction”, leading to CLM-based “underestimations” turning to CLMET-based “overestimations” over the Amazon region. It can be indicated by the statistical metric values of the model performance against GLEAM, MODIS, and MTE over South America. The RB values in CLM before correction against GLEAM, MODIS, and MTE ET are 3.875%, −1.023%, and −3.186%, but they become 0.756%, 5.163%, and 3.319% in CLMET after correction, respectively. Generating higher quality ET products by blending multiple datasets might help in obtaining a robust correction effect with the method, which can be explored in a future study. In addition, it should be noted that the temporal coverage of runoff from the CLM is different from that of the UNH-GRDC dataset. The inconsistency in the temporal coverage may have an impact on the evaluation of runoff. Therefore, up-to-date and high-quality reference datasets (e.g., runoff, soil moisture) are also required for the assessment of land surface models in a future study.
Accurate global hydrological simulations in CLM inevitably depend on the profound understanding of hydrology mechanisms and the realistic parameterizations of hydrological processes, which takes a long time to achieve the objective. The bias correction algorithm used in this study provides a simple alternative by taking advantage of high-quality remote sensing-ET products without considering the physical mechanisms of CLM. The prominent correction effectiveness indicates that there is a great potential for CLM to improve hydrological simulations. Admittedly, over regions where the correction method does not improve the estimates of ET and other related variables, great and continuous efforts should be taken to understand the physical processes and to develop the associated parameterizations.
6. Conclusions
We apply a bias correction approach to the Community Land Model version 5.0 (CLM5) globally by utilizing the remote sensing-based ET dataset. Results reveal that the correction approach can alleviate both the overestimation and underestimation of ET by CLM5 over the globe. The adjustment to overestimation is generally effective, whereas the effectiveness for underestimation is determined by the ET regime, namely water limited or energy limited. In areas with abundant precipitation, the underestimation is effectively corrected by increasing ET without the water supply limit. In the areas with rare precipitation, however, increasing ET is limited by water supply, which leads to an undesirable correction effect. Compared with the ET simulated by CLM5, the bias correction approach can reduce the global-averaged relative bias (RB) and the root mean square error (RMSE) by 51.8% and 65.9% against Global Land Evaporation Amsterdam Model (GLEAM) ET data, respectively. Meanwhile, the correlation coefficient (CC) can also be improved from 0.93 to 0.98. Continentally, the most substantial ET improvement occurs in Asia, with the RB and RMSE decreased by 69.7% (from 7.04% to 2.14%) and 70.2% (from 0.312 mm day−1 to 0.093 mm day−1, equivalent to from 114 mm year−1 to 34 mm year−1), and the CC increased from 0.92 to 0.99, respectively. Consequently, benefiting from the improvement of ET, the simulations of runoff and soil moisture are also improved over the globe and in each of six continents, and the improvement varies with region. This study highlights that the use of a satellite-based ET dataset is beneficial to hydrological simulations in land surface models over the globe, which will have a great impact on the development of earth system models in the future.
Author Contributions
Conceptualization, D.W. (Dagang Wang); methodology, D.W. (Dayang Wang); software, D.W. (Dayang Wang) and D.W. (Dagang Wang); validation, D.W. (Dayang Wang); formal analysis, D.W. (Dayang Wang) and D.W. (Dagang Wang); resources, D.W. (Dagang Wang); data curation, D.W. (Dayang Wang); writing—original draft preparation, D.W. (Dayang Wang); writing—review and editing, D.W. (Dayang Wang) and D.W. (Dagang Wang); visualization, D.W. (Dayang Wang); supervision, D.W. (Dagang Wang) and C.M.; project administration, D.W. (Dagang Wang) and C.M.; funding acquisition, D.W. (Dagang Wang) and C.M. All authors have read and agreed to the published version of the manuscript.
Funding
This research was funded by the National Key Research and Development Project, grant number 2017YFA0604300 and the National Natural Science Foundation of China, grant numbers 51779278 and 51969004.
Institutional Review Board Statement
Not applicable.
Informed Consent Statement
Not applicable.
Data Availability Statement
The forcing data (WFDE5) used in this study are available from https://cds.climate.copernicus.eu, accessed on 20 May 2021. The GLEAM ET data are available from https://www.gleam.eu, accessed on 20 May 2021. The MODIS ET data are from http://www.ntsg.umt.edu/project/mod16, accessed on 21 May 2021. The FLUXNET-MTE ET data are available from https://www.bgc-jena.mpg.de/geodb/projects/Data.php, accessed on 21 May 2021. The GRDC runoff data are available at the website https://www.compositerunoff.sr.unh.edu, accessed on 22 May 2021. The SMAP-based soil moisture data are available at the website https://nsidc.org/data, accessed on 3 June 2021.
Conflicts of Interest
The authors declare no conflict of interest.
Appendix A
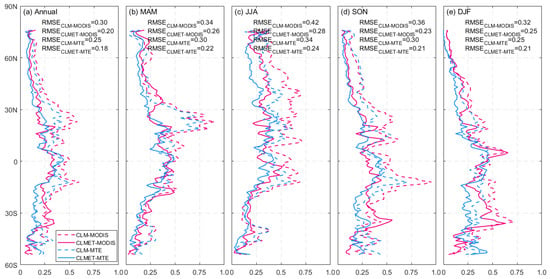
Figure A1.
The latitudinal profiles of RMSE values (mm day−1) during the period of 2006–2018 between CLM and MODIS (magenta dash line), CLMET and MODIS (magenta solid line), CLM and MTE (blue dash line) and CLMET and MTE (blue solid line) for annual (a) and seasonal (b–e).
Figure A1.
The latitudinal profiles of RMSE values (mm day−1) during the period of 2006–2018 between CLM and MODIS (magenta dash line), CLMET and MODIS (magenta solid line), CLM and MTE (blue dash line) and CLMET and MTE (blue solid line) for annual (a) and seasonal (b–e).
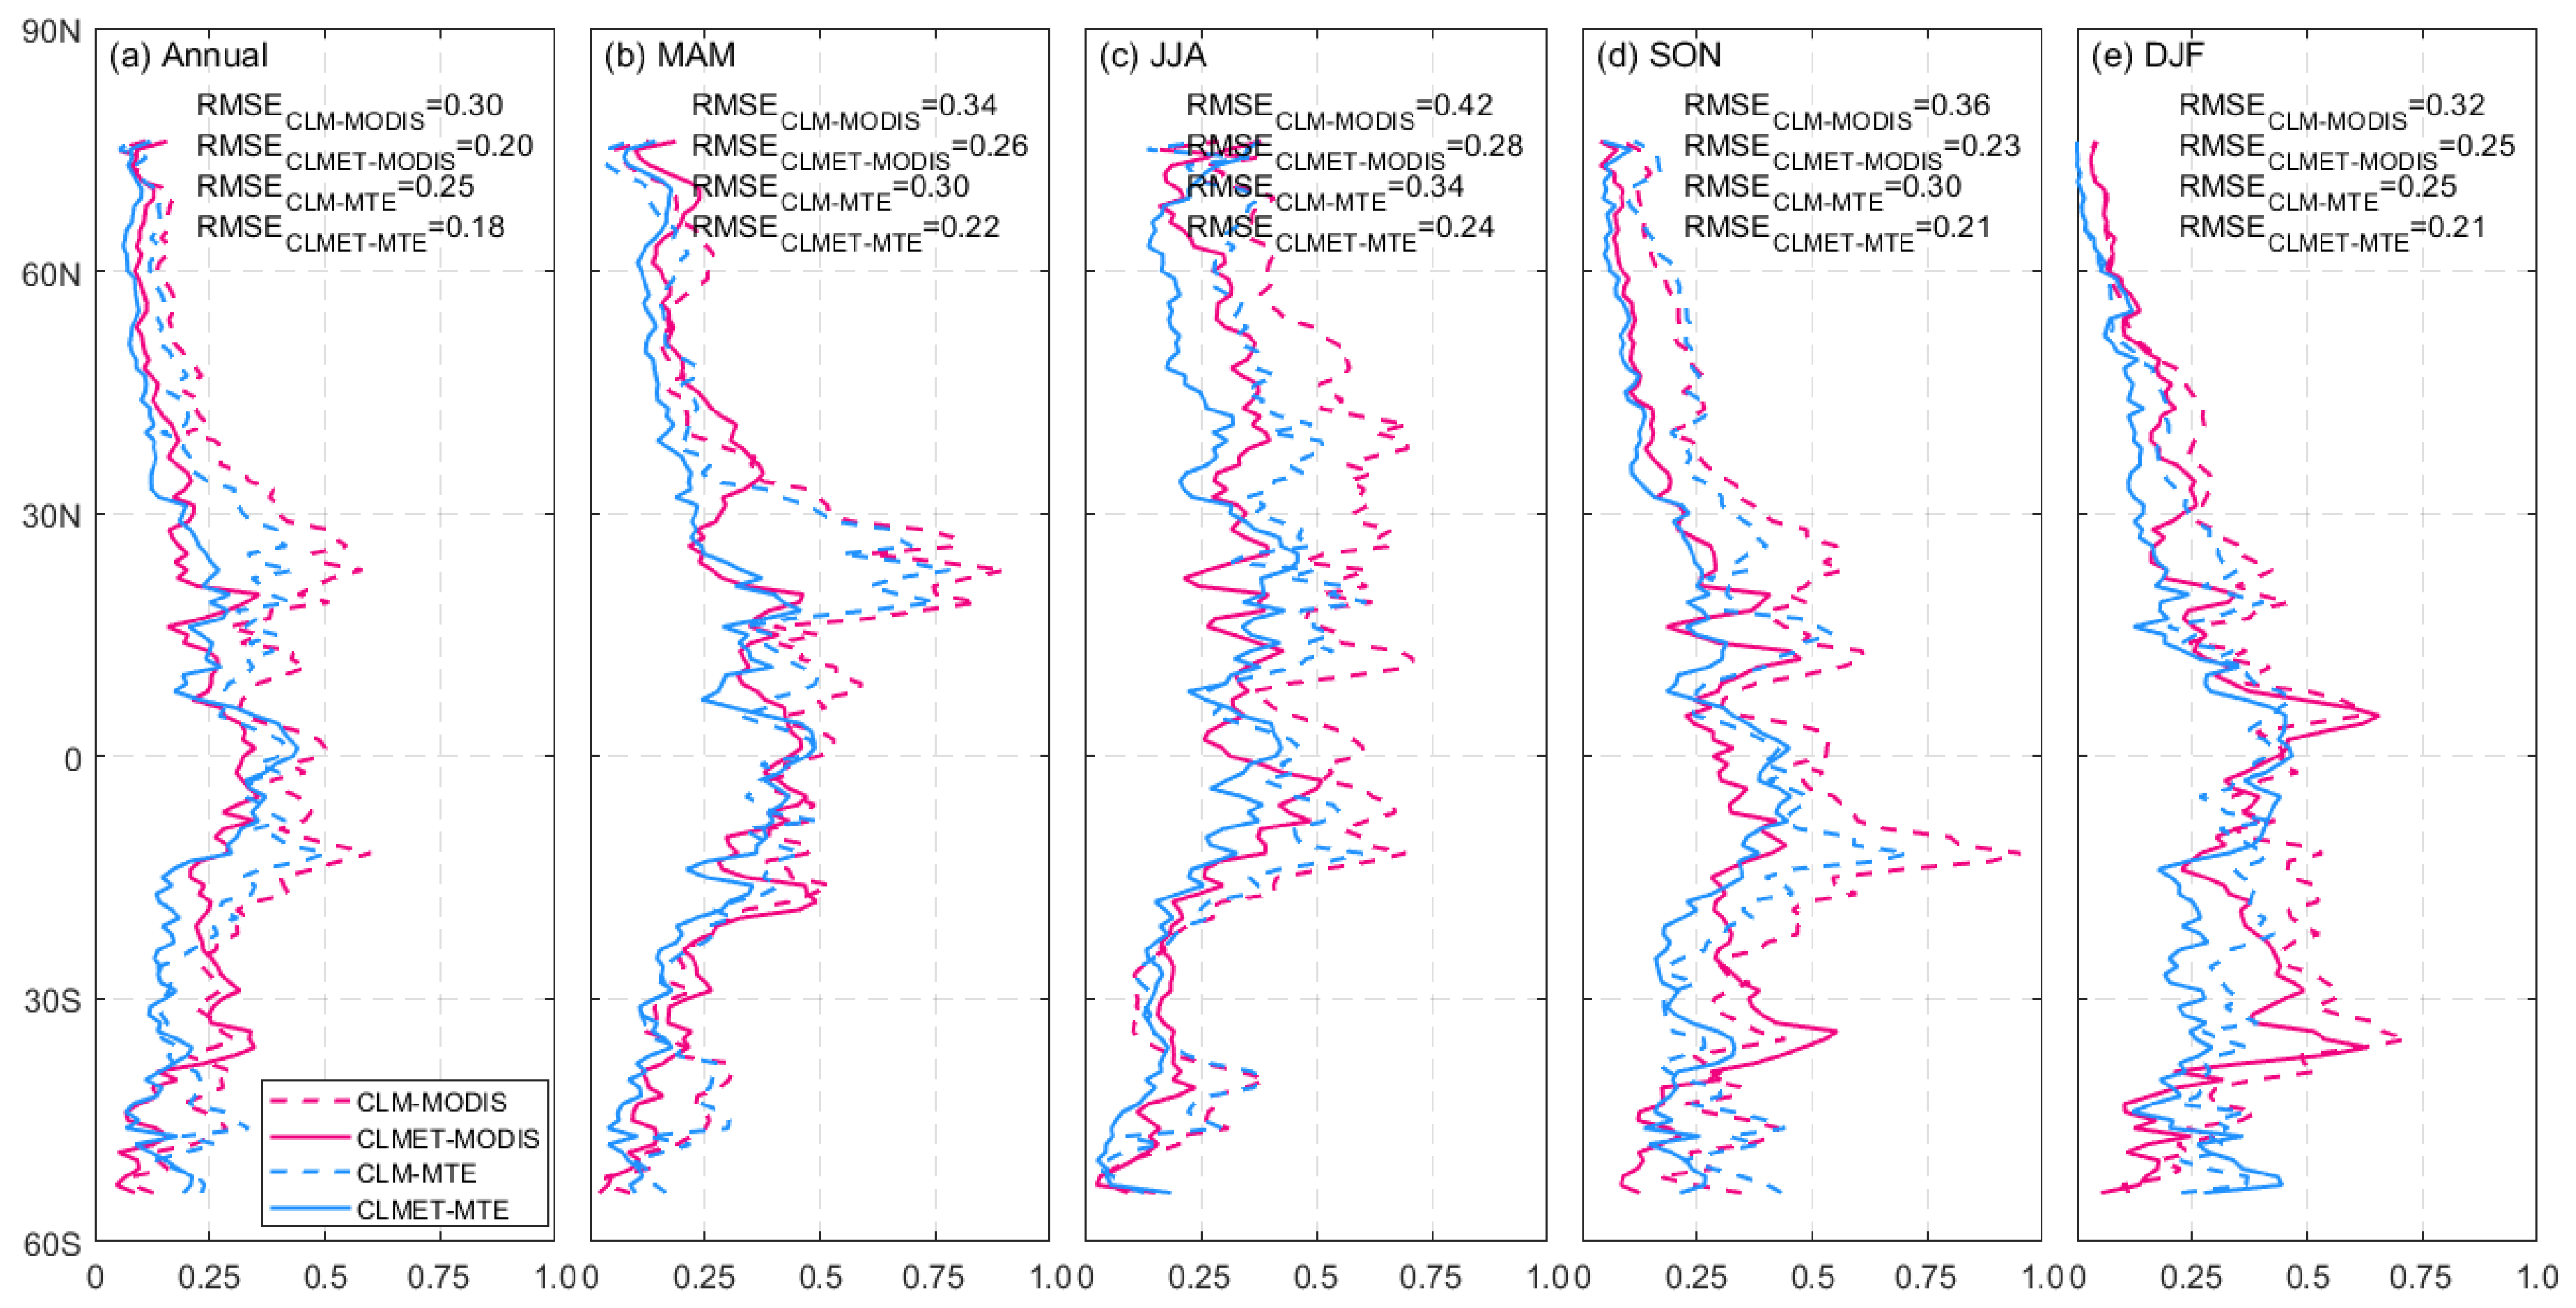
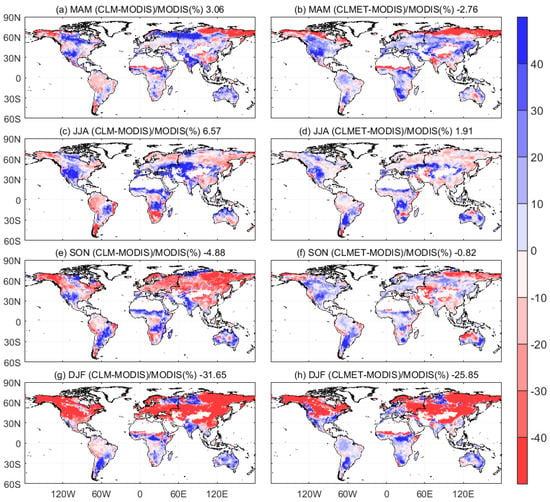
Figure A2.
The relative difference of multi-year seasonal averaged ET during the period of 2006–2011, (a,c,e,g) between CLM and MODIS (first column) and (b,d,f,h) between CLMET and MODIS (second column), for seasonal (first to forth row). The numbers in title represent global-domain averaged values.
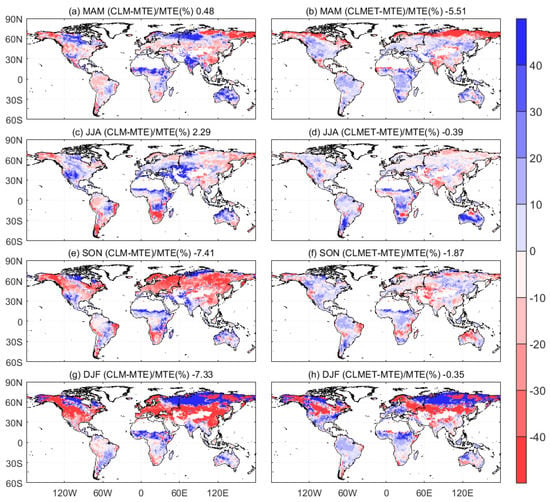
Figure A3.
Same as Figure A2, but for comparison with MTE.
Figure A3.
Same as Figure A2, but for comparison with MTE.
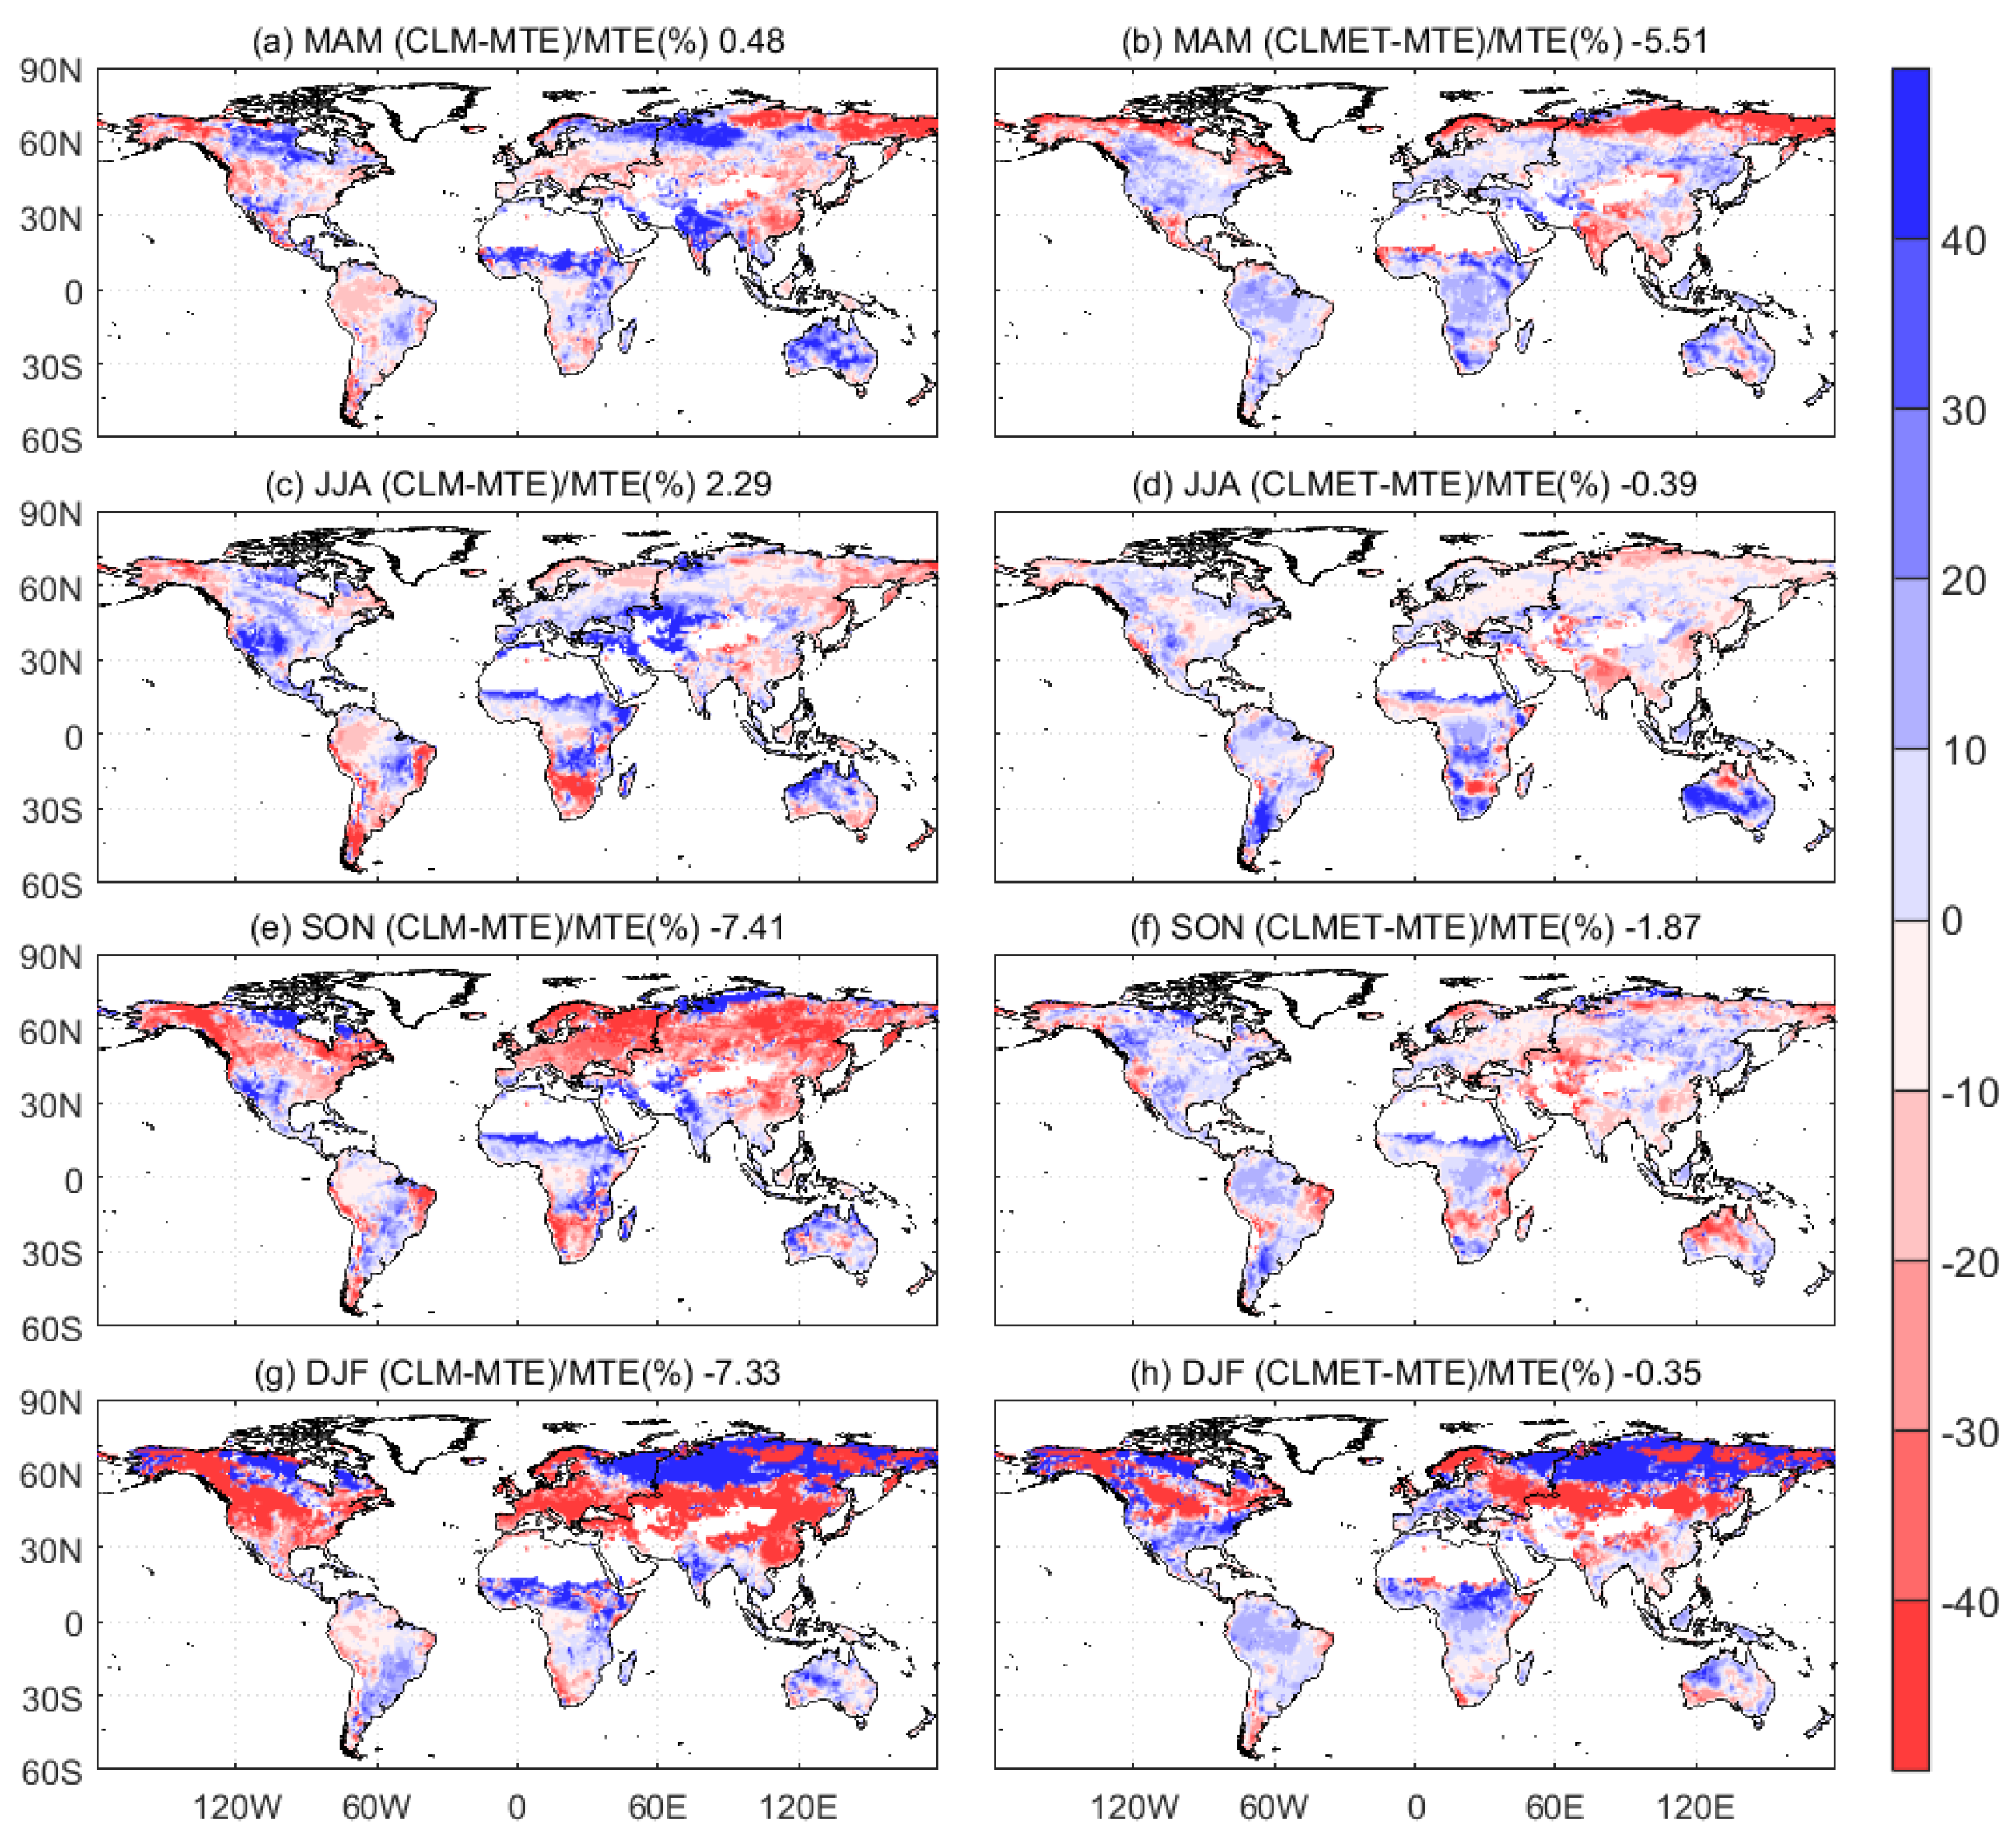
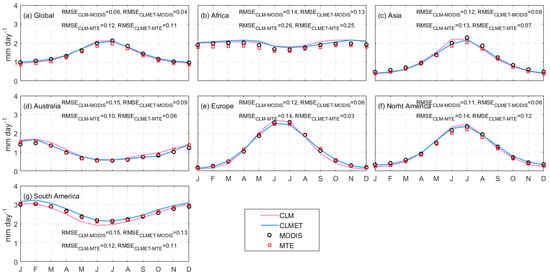
Figure A4.
Seasonal cycles of ET during the period of 2006–2011 from MODIS, MTE, CLM, and CLMET over (a) the Global, (b) Africa, (c) Asia, (d) Australia, (e) Europe, (f) North America, and (g) South America.
Figure A4.
Seasonal cycles of ET during the period of 2006–2011 from MODIS, MTE, CLM, and CLMET over (a) the Global, (b) Africa, (c) Asia, (d) Australia, (e) Europe, (f) North America, and (g) South America.
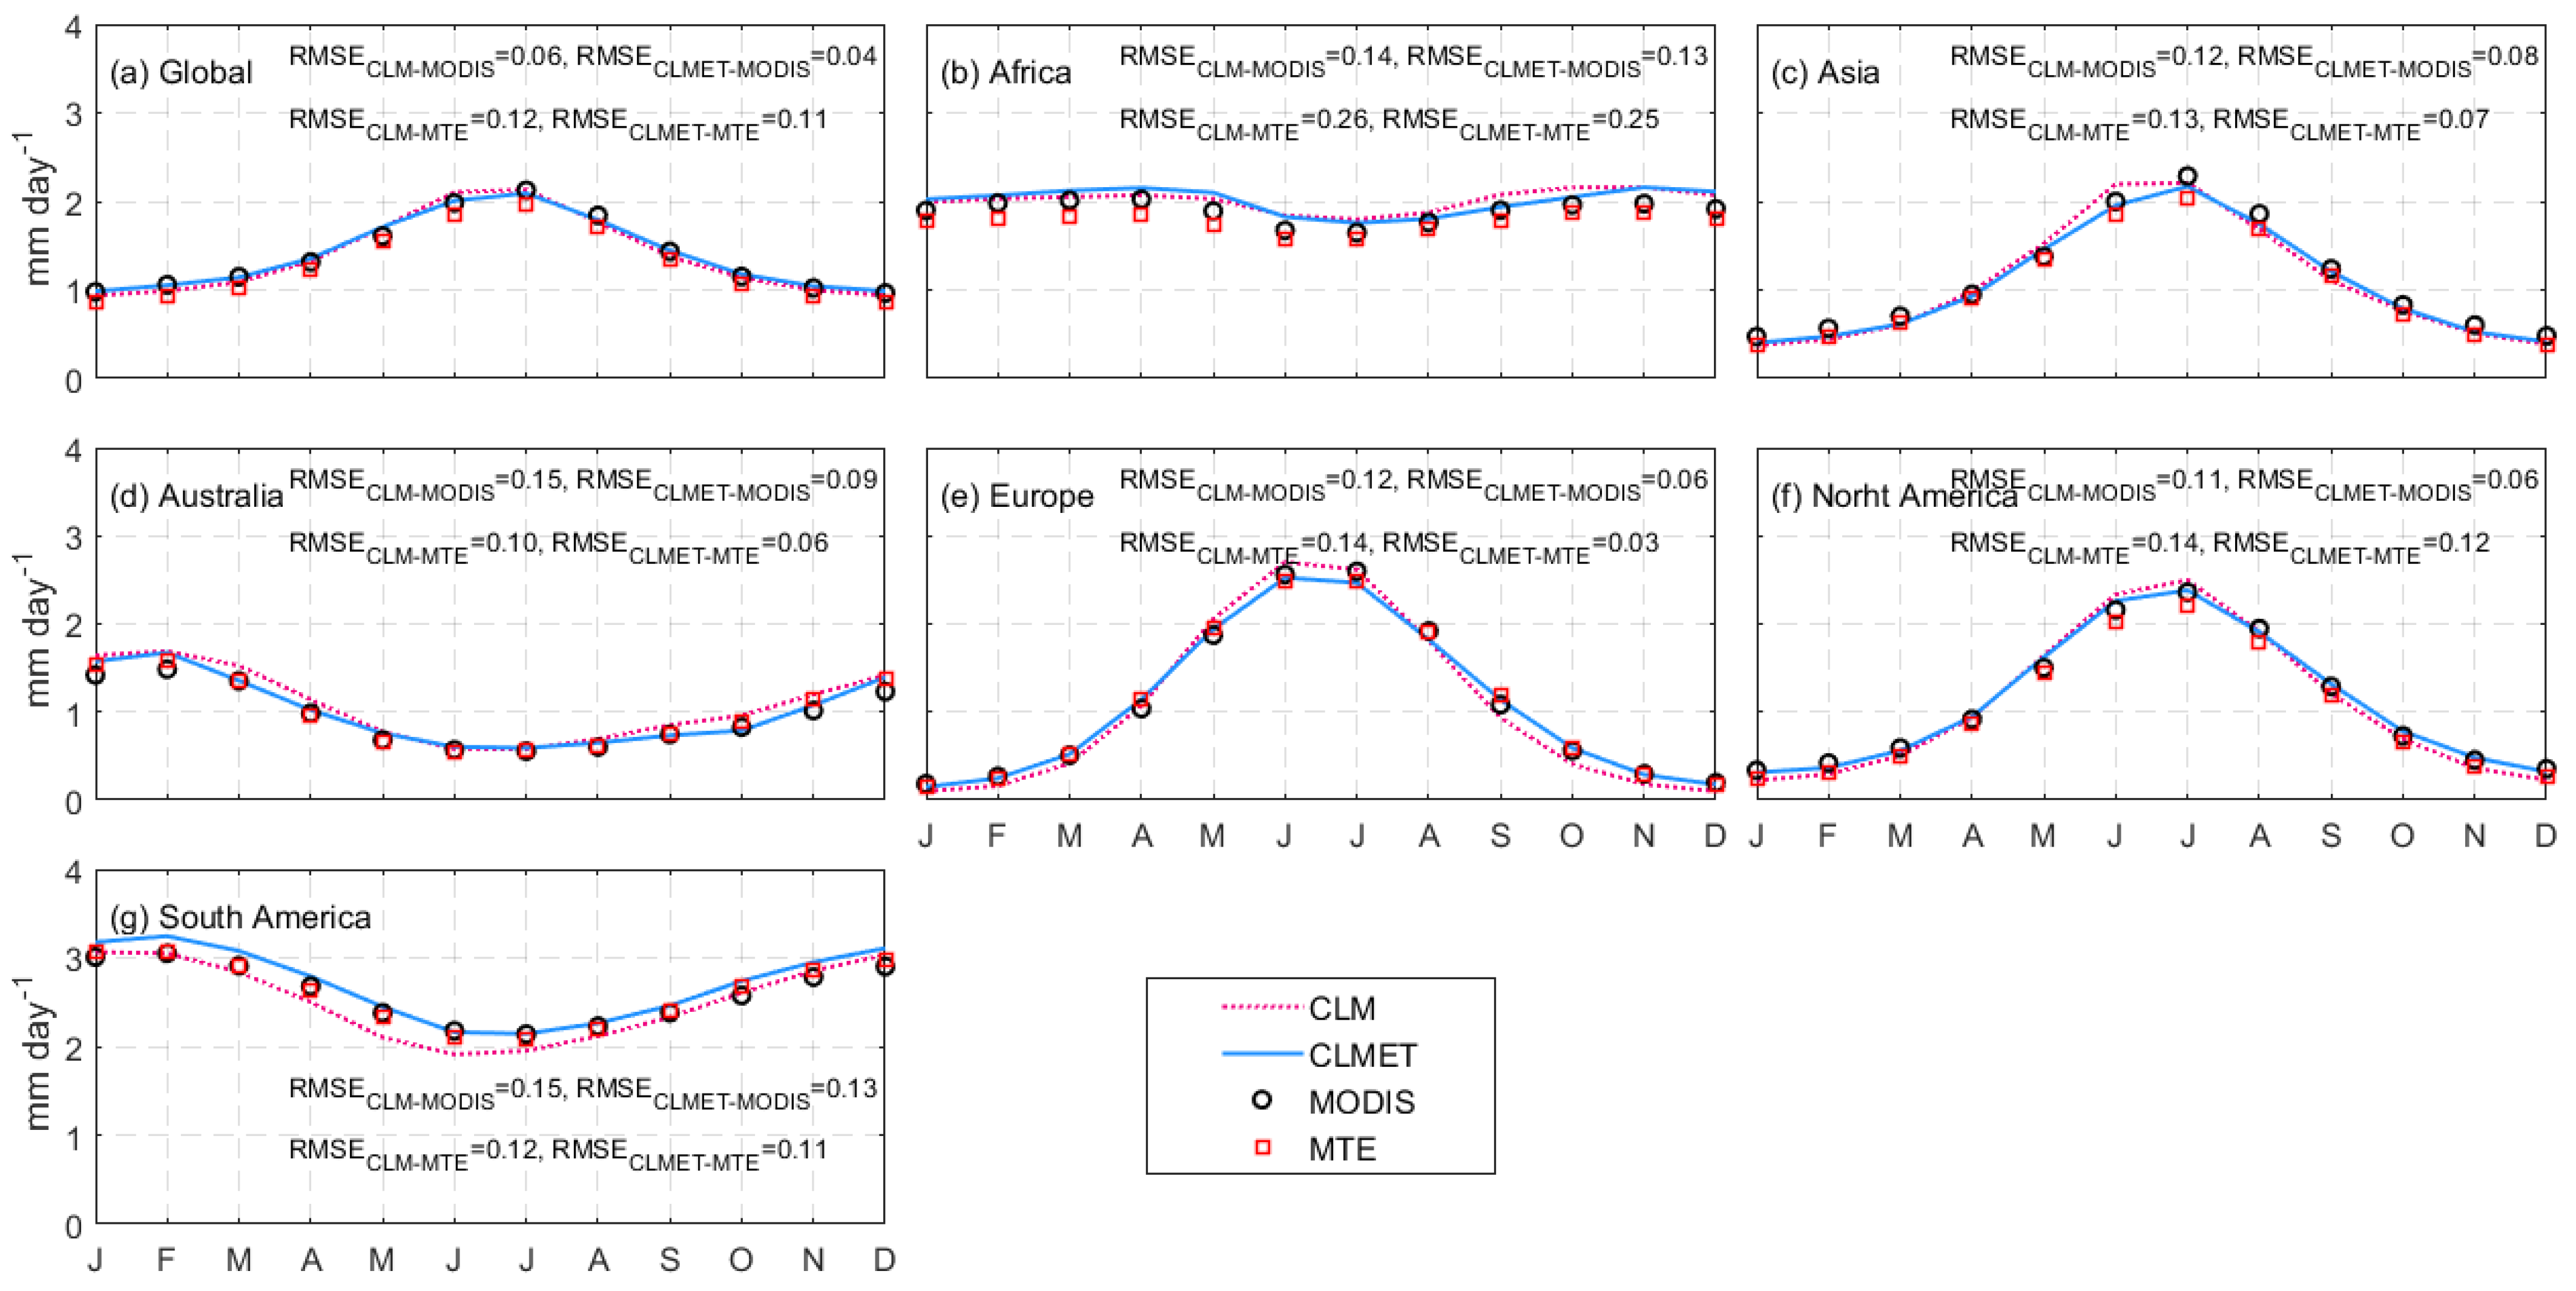
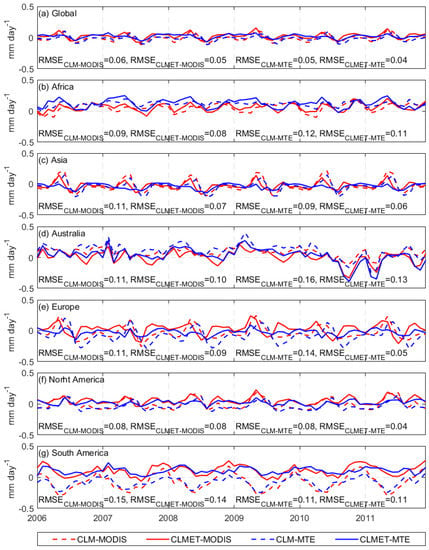
Figure A5.
Time series of ET differences between model (CLM and CLMET) and reference data (MODIS or MTE) over (a) the Global, (b) Africa, (c) Asia, (d) Australia, (e) Europe, (f) North America, and (g) South America.
Figure A5.
Time series of ET differences between model (CLM and CLMET) and reference data (MODIS or MTE) over (a) the Global, (b) Africa, (c) Asia, (d) Australia, (e) Europe, (f) North America, and (g) South America.
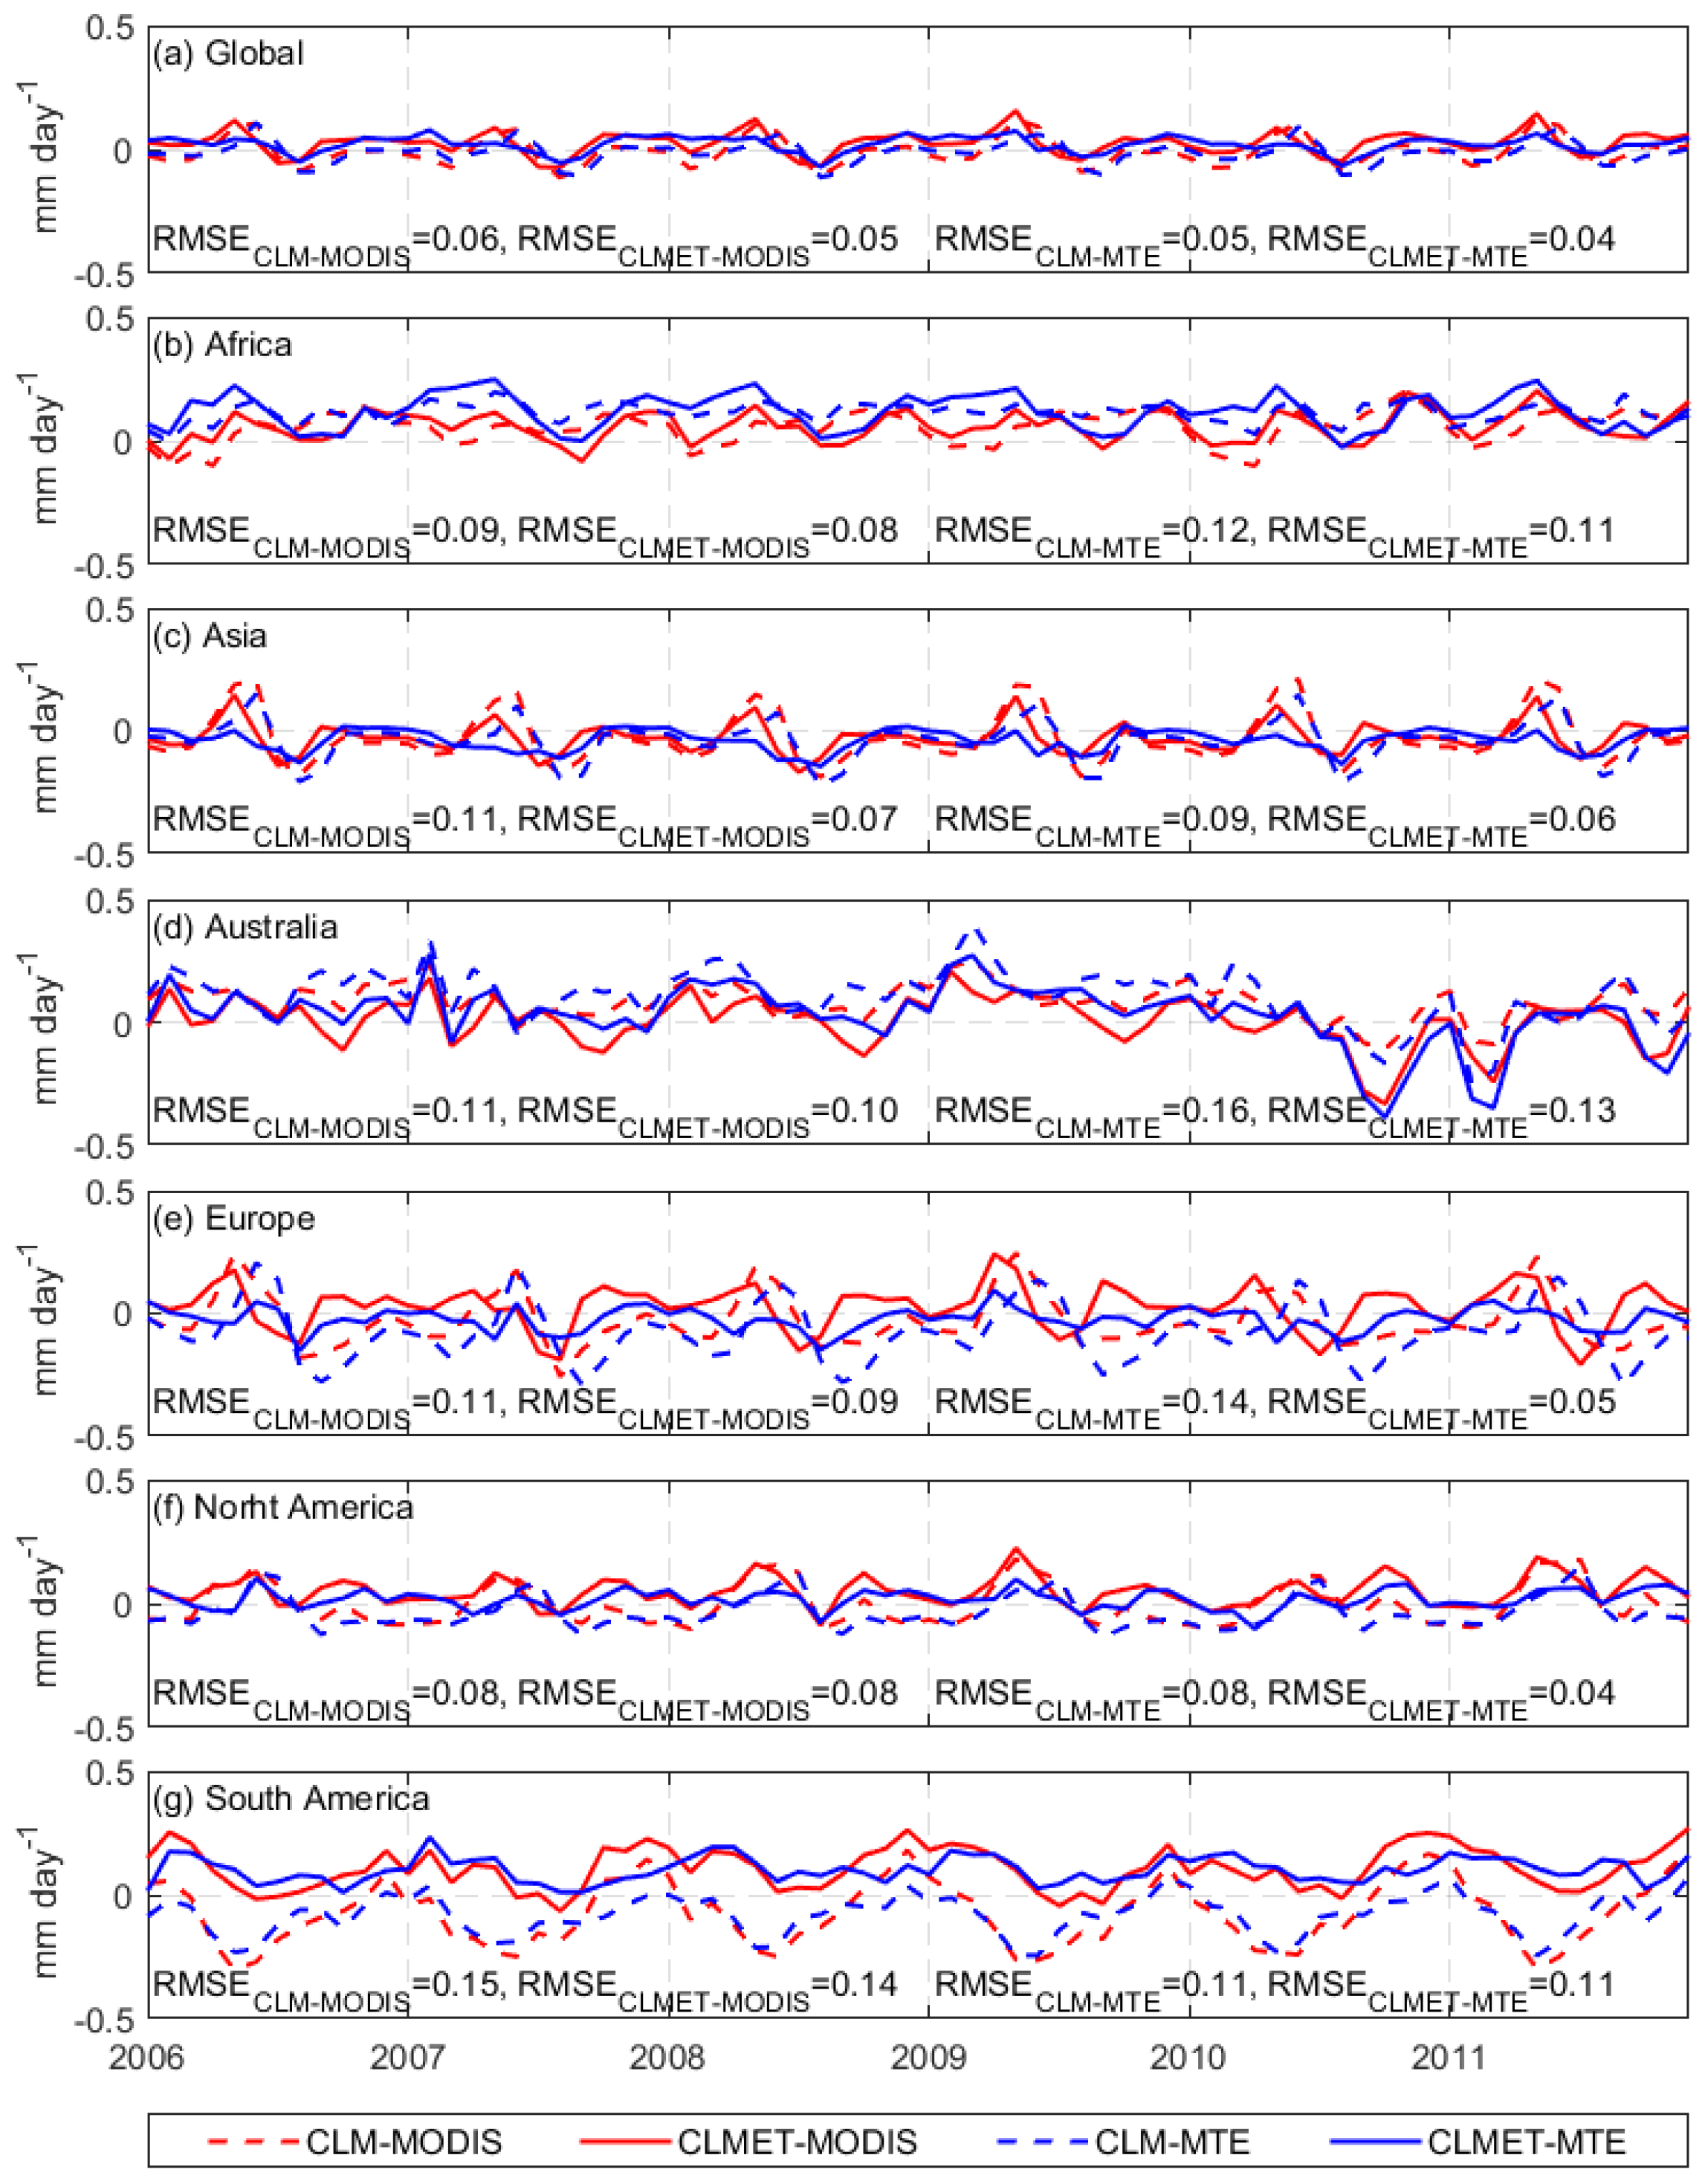
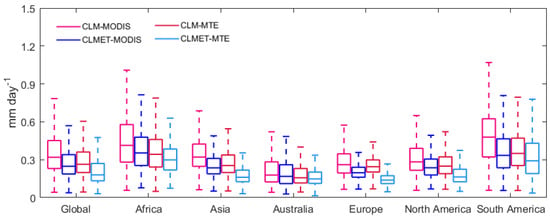
Figure A6.
Boxplot of RMSE values of CLM and CLMET based ET against the MODIS and MTE data during the period of 2006–2011 over the globe and six continents.
Figure A6.
Boxplot of RMSE values of CLM and CLMET based ET against the MODIS and MTE data during the period of 2006–2011 over the globe and six continents.
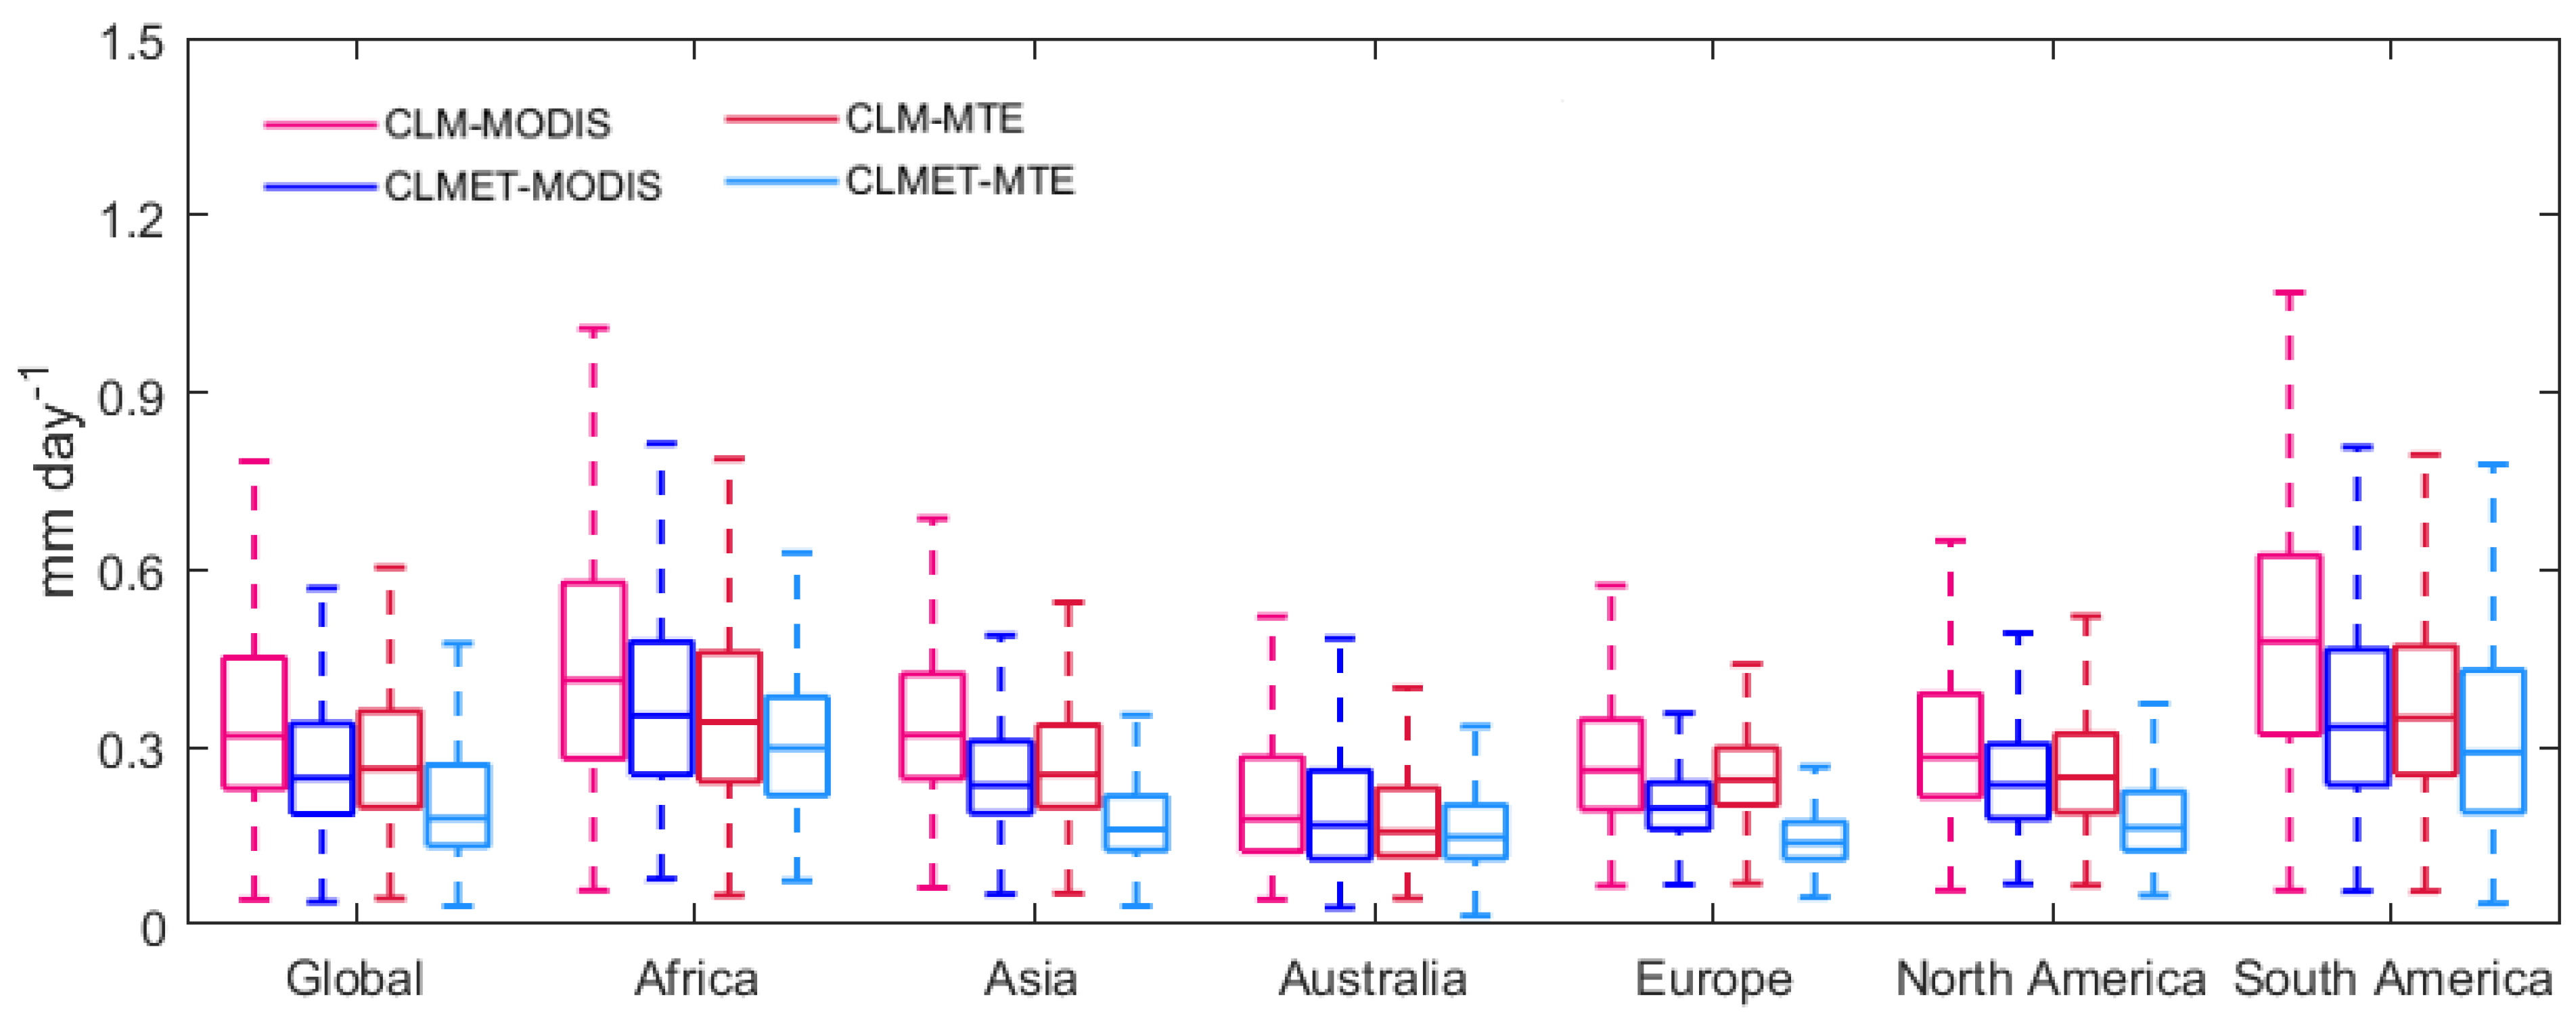
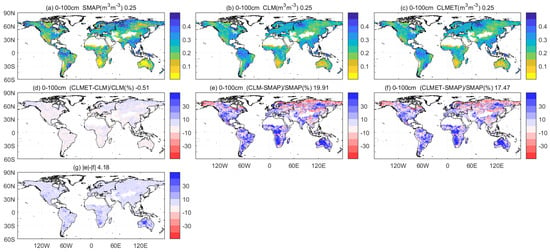
Figure A7.
Multi-year averaged soil moisture (m3 m−3) in the root zone layer (top 0–100 cm) during the period of April 2015 to December 2018 from (a) SMAP, (b) CLM, and (c) CLMET, the relative bias between (d) CLMET and CLM, (e) CLM and SMAP, (f) CLMET and SMAP, and (g) |e|-|f|. The numbers in title represent global-domain averaged values.

Table A1.
Spatial evaluations of simulated ET from two types of simulations (CLM and CLMET) against MODIS-based ET over the globe and each continent seasonally during the period of 2006–2011. March–April–May (MAM); June–July–August (JJA); September–October–November (SON); December–January–February (DJF).
| Season | Region | Bias (mm Day−1) | RB (%) | RMSE (mm Day−1) | CC | ||||
|---|---|---|---|---|---|---|---|---|---|
| CLM | CLMET | CLM | CLMET | CLM | CLMET | CLM | CLMET | ||
| MAM | Global | 0.018 | 0.048 | 3.06 | −2.76 | 0.352 | 0.278 | 0.94 | 0.96 |
| Africa | 0.074 | 0.149 | 6.28 | 5.80 | 0.422 | 0.393 | 0.91 | 0.94 | |
| Asia | 0.036 | −0.002 | 1.66 | −9.61 | 0.385 | 0.255 | 0.90 | 0.95 | |
| Australia | 0.138 | 0.036 | 13.91 | 2.07 | 0.244 | 0.176 | 0.93 | 0.93 | |
| Europe | 0.042 | 0.061 | 7.36 | −0.49 | 0.200 | 0.182 | 0.89 | 0.95 | |
| North America | 0.029 | 0.045 | 3.74 | −2.01 | 0.273 | 0.237 | 0.91 | 0.94 | |
| South America | −0.195 | 0.096 | −6.10 | 3.83 | 0.417 | 0.346 | 0.93 | 0.93 | |
| JJA | Global | 0.011 | −0.025 | 6.57 | 1.91 | 0.484 | 0.307 | 0.87 | 0.94 |
| Africa | 0.141 | 0.099 | 9.40 | 7.89 | 0.495 | 0.369 | 0.89 | 0.93 | |
| Asia | −0.020 | −0.091 | 9.85 | −1.94 | 0.506 | 0.308 | 0.80 | 0.92 | |
| Australia | 0.049 | 0.046 | 7.93 | 10.87 | 0.203 | 0.246 | 0.83 | 0.78 | |
| Europe | 0.013 | −0.090 | 4.08 | −1.87 | 0.440 | 0.285 | 0.70 | 0.87 | |
| North America | 0.093 | 0.028 | 8.83 | 3.12 | 0.502 | 0.304 | 0.84 | 0.92 | |
| South America | −0.207 | −0.012 | −8.56 | 5.23 | 0.500 | 0.291 | 0.94 | 0.96 | |
| SON | Global | −0.025 | 0.026 | −4.88 | −0.82 | 0.357 | 0.224 | 0.95 | 0.97 |
| Africa | 0.187 | 0.104 | 13.92 | 4.62 | 0.522 | 0.303 | 0.89 | 0.96 | |
| Asia | −0.089 | −0.041 | −12.93 | −8.88 | 0.287 | 0.166 | 0.95 | 0.98 | |
| Australia | 0.161 | 0.024 | 18.23 | −1.42 | 0.320 | 0.236 | 0.85 | 0.88 | |
| Europe | −0.139 | 0.026 | −21.42 | 3.56 | 0.191 | 0.082 | 0.84 | 0.93 | |
| North America | −0.062 | 0.044 | −5.83 | 3.36 | 0.233 | 0.149 | 0.94 | 0.97 | |
| South America | 0.005 | 0.124 | 3.18 | 7.16 | 0.560 | 0.384 | 0.88 | 0.94 | |
| DJF | Global | −0.037 | 0.017 | −31.65 | −25.85 | 0.310 | 0.258 | 0.97 | 0.98 |
| Africa | 0.105 | 0.143 | 4.29 | 3.80 | 0.413 | 0.390 | 0.92 | 0.94 | |
| Asia | −0.096 | −0.066 | −50.59 | −45.81 | 0.230 | 0.175 | 0.97 | 0.98 | |
| Australia | 0.211 | 0.174 | 16.39 | 11.35 | 0.342 | 0.299 | 0.91 | 0.94 | |
| Europe | −0.096 | −0.025 | −43.58 | −32.95 | 0.140 | 0.108 | 0.74 | 0.69 | |
| North America | −0.115 | −0.030 | −50.57 | −36.00 | 0.181 | 0.168 | 0.95 | 0.92 | |
| South America | 0.049 | 0.175 | 5.15 | 6.38 | 0.551 | 0.423 | 0.84 | 0.91 | |

Table A2.
Same as Table A1, but for comparison with MTE−based ET.
Table A2.
Same as Table A1, but for comparison with MTE−based ET.
| Season | Region | Bias (mm Day−1) | RB(%) | RMSE (mm Day−1) | CC | ||||
|---|---|---|---|---|---|---|---|---|---|
| CLM | CLMET | CLM | CLMET | CLM | CLMET | CLM | CLMET | ||
| MAM | Global | −0.003 | 0.026 | 0.48 | −5.51 | 0.305 | 0.232 | 0.95 | 0.97 |
| Africa | 0.107 | 0.182 | 10.23 | 8.08 | 0.359 | 0.314 | 0.94 | 0.97 | |
| Asia | −0.004 | −0.042 | −2.63 | −13.35 | 0.328 | 0.212 | 0.92 | 0.96 | |
| Australia | 0.159 | 0.058 | 18.95 | 6.14 | 0.254 | 0.179 | 0.93 | 0.93 | |
| Europe | −0.044 | −0.025 | −1.25 | −8.23 | 0.190 | 0.146 | 0.91 | 0.97 | |
| North America | −0.025 | −0.008 | −1.28 | −8.03 | 0.246 | 0.173 | 0.93 | 0.96 | |
| South America | −0.131 | 0.161 | −5.05 | 5.14 | 0.352 | 0.327 | 0.94 | 0.97 | |
| JJA | Global | 0.010 | −0.027 | 2.29 | −0.39 | 0.369 | 0.253 | 0.91 | 0.95 |
| Africa | 0.109 | 0.067 | 5.52 | 5.22 | 0.400 | 0.316 | 0.92 | 0.94 | |
| Asia | −0.036 | −0.108 | 2.68 | −5.53 | 0.374 | 0.259 | 0.87 | 0.94 | |
| Australia | 0.046 | 0.044 | 10.11 | 15.05 | 0.189 | 0.259 | 0.81 | 0.81 | |
| Europe | 0.037 | −0.066 | 1.80 | −3.14 | 0.306 | 0.178 | 0.81 | 0.92 | |
| North America | 0.067 | 0.001 | 4.24 | −0.31 | 0.396 | 0.230 | 0.89 | 0.94 | |
| South America | −0.110 | 0.085 | −8.99 | 5.17 | 0.380 | 0.269 | 0.95 | 0.97 | |
| SON | Global | −0.044 | 0.007 | −7.41 | −1.87 | 0.292 | 0.203 | 0.96 | 0.98 |
| Africa | 0.134 | 0.051 | 7.87 | 1.62 | 0.430 | 0.285 | 0.92 | 0.96 | |
| Asia | −0.071 | −0.023 | −10.44 | −3.65 | 0.233 | 0.147 | 0.97 | 0.98 | |
| Australia | 0.078 | −0.059 | 8.75 | −10.44 | 0.226 | 0.191 | 0.90 | 0.92 | |
| Europe | −0.200 | −0.034 | −29.10 | −6.68 | 0.234 | 0.089 | 0.86 | 0.93 | |
| North America | −0.076 | 0.030 | −7.58 | 2.56 | 0.230 | 0.120 | 0.94 | 0.98 | |
| South America | −0.036 | 0.084 | −3.77 | 0.96 | 0.396 | 0.356 | 0.93 | 0.95 | |
| DJF | Global | −0.014 | 0.040 | −7.33 | −0.35 | 0.242 | 0.203 | 0.98 | 0.98 |
| Africa | 0.083 | 0.120 | 9.29 | 6.49 | 0.358 | 0.300 | 0.95 | 0.96 | |
| Asia | −0.032 | −0.002 | −8.97 | 0.06 | 0.172 | 0.123 | 0.98 | 0.99 | |
| Australia | 0.078 | 0.041 | 5.94 | 1.71 | 0.240 | 0.233 | 0.93 | 0.93 | |
| Europe | −0.067 | 0.003 | −17.58 | −8.81 | 0.126 | 0.094 | 0.80 | 0.70 | |
| North America | −0.065 | 0.021 | −18.52 | −3.57 | 0.159 | 0.131 | 0.94 | 0.94 | |
| South America | 0.022 | 0.147 | 0.29 | 2.62 | 0.394 | 0.356 | 0.90 | 0.95 | |

Table A3.
Spatial evaluations of simulated soil moisture in top 0–5 cm layer from two types of simulations (CLM and CLMET) against SMAP-based data over the globe and each continent seasonally during the period of April 2015 to December 2018.
Table A3.
Spatial evaluations of simulated soil moisture in top 0–5 cm layer from two types of simulations (CLM and CLMET) against SMAP-based data over the globe and each continent seasonally during the period of April 2015 to December 2018.
| Season | Region | Soil moisture (m3 m−3) | RB(%) | RMSE(m3 m−3) | CC | |||||
|---|---|---|---|---|---|---|---|---|---|---|
| SMAP | CLM | CLMET | CLM | CLMET | CLM | CLMET | CLM | CLMET | ||
| MAM | Global | 0.241 | 0.242 | 0.237 | 22.53 | 17.66 | 0.142 | 0.121 | 0.27 | 0.44 |
| Africa | 0.169 | 0.223 | 0.211 | 47.91 | 41.01 | 0.095 | 0.078 | 0.70 | 0.76 | |
| Asia | 0.253 | 0.215 | 0.218 | 7.03 | 5.04 | 0.163 | 0.139 | 0.05 | 0.22 | |
| Australia | 0.111 | 0.156 | 0.146 | 70.06 | 57.64 | 0.067 | 0.056 | 0.73 | 0.79 | |
| Europe | 0.322 | 0.300 | 0.295 | 5.00 | 1.27 | 0.159 | 0.134 | −0.26 | 0.04 | |
| North America | 0.256 | 0.244 | 0.240 | 15.14 | 10.88 | 0.149 | 0.127 | 0.18 | 0.37 | |
| South America | 0.249 | 0.321 | 0.302 | 47.74 | 37.67 | 0.115 | 0.094 | 0.65 | 0.73 | |
| JJA | Global | 0.227 | 0.290 | 0.277 | 45.38 | 38.19 | 0.131 | 0.109 | 0.58 | 0.66 |
| Africa | 0.168 | 0.224 | 0.213 | 49.29 | 41.78 | 0.096 | 0.081 | 0.67 | 0.73 | |
| Asia | 0.252 | 0.319 | 0.306 | 38.52 | 32.16 | 0.136 | 0.113 | 0.60 | 0.68 | |
| Australia | 0.110 | 0.161 | 0.150 | 65.35 | 53.94 | 0.072 | 0.058 | 0.74 | 0.80 | |
| Europe | 0.265 | 0.285 | 0.283 | 24.80 | 22.79 | 0.135 | 0.116 | 0.31 | 0.50 | |
| North America | 0.233 | 0.310 | 0.295 | 54.09 | 44.93 | 0.157 | 0.132 | 0.35 | 0.47 | |
| South America | 0.227 | 0.298 | 0.283 | 57.21 | 48.28 | 0.112 | 0.095 | 0.69 | 0.76 | |
| SON | Global | 0.223 | 0.235 | 0.231 | 27.30 | 22.89 | 0.123 | 0.106 | 0.38 | 0.52 |
| Africa | 0.167 | 0.225 | 0.214 | 56.17 | 48.47 | 0.099 | 0.083 | 0.69 | 0.75 | |
| Asia | 0.250 | 0.223 | 0.224 | 2.19 | 0.69 | 0.126 | 0.108 | 0.36 | 0.50 | |
| Australia | 0.089 | 0.139 | 0.132 | 81.98 | 71.81 | 0.067 | 0.057 | 0.76 | 0.81 | |
| Europe | 0.266 | 0.272 | 0.270 | 20.54 | 17.54 | 0.147 | 0.129 | −0.17 | 0.12 | |
| North America | 0.237 | 0.239 | 0.235 | 20.08 | 15.88 | 0.133 | 0.116 | 0.17 | 0.38 | |
| South America | 0.201 | 0.283 | 0.271 | 64.08 | 55.52 | 0.113 | 0.097 | 0.69 | 0.76 | |
| DJF | Global | 0.232 | 0.177 | 0.183 | −3.04 | −3.32 | 0.174 | 0.148 | 0.07 | 0.23 |
| Africa | 0.155 | 0.216 | 0.206 | 55.54 | 48.94 | 0.102 | 0.086 | 0.67 | 0.73 | |
| Asia | 0.248 | 0.135 | 0.150 | −34.59 | −29.96 | 0.195 | 0.166 | 0.06 | 0.22 | |
| Australia | 0.108 | 0.165 | 0.154 | 84.87 | 70.04 | 0.072 | 0.061 | 0.73 | 0.79 | |
| Europe | 0.309 | 0.189 | 0.201 | −30.25 | −27.81 | 0.217 | 0.185 | −0.20 | −0.02 | |
| North America | 0.250 | 0.145 | 0.158 | −26.96 | −24.17 | 0.196 | 0.167 | −0.03 | 0.17 | |
| South America | 0.227 | 0.301 | 0.286 | 50.28 | 41.34 | 0.110 | 0.091 | 0.64 | 0.73 | |

Table A4.
Same as Table A3, but for soil moisture in top 0–100 cm layer.
Table A4.
Same as Table A3, but for soil moisture in top 0–100 cm layer.
| Season | Region | Soil Moisture (m3 m−3) | RB(%) | RMSE (m3 m−3) | CC | |||||
|---|---|---|---|---|---|---|---|---|---|---|
| SMAP | CLM | CLMET | CLM | CLMET | CLM | CLMET | CLM | CLMET | ||
| MAM | Global | 0.259 | 0.245 | 0.247 | 14.92 | 12.96 | 0.096 | 0.084 | 0.55 | 0.66 |
| Africa | 0.189 | 0.221 | 0.218 | 44.59 | 39.31 | 0.068 | 0.059 | 0.81 | 0.85 | |
| Asia | 0.273 | 0.234 | 0.238 | −4.67 | −4.26 | 0.100 | 0.088 | 0.36 | 0.50 | |
| Australia | 0.138 | 0.178 | 0.173 | 107.34 | 94.17 | 0.063 | 0.056 | 0.84 | 0.88 | |
| Europe | 0.327 | 0.294 | 0.298 | −0.08 | −0.39 | 0.114 | 0.100 | 0.24 | 0.50 | |
| North America | 0.271 | 0.242 | 0.245 | 2.44 | 1.95 | 0.108 | 0.095 | 0.50 | 0.63 | |
| South America | 0.262 | 0.299 | 0.294 | 33.55 | 29.30 | 0.079 | 0.069 | 0.80 | 0.85 | |
| JJA | Global | 0.249 | 0.274 | 0.272 | 30.40 | 26.90 | 0.079 | 0.069 | 0.73 | 0.79 |
| Africa | 0.190 | 0.223 | 0.220 | 42.48 | 37.59 | 0.067 | 0.059 | 0.79 | 0.83 | |
| Asia | 0.275 | 0.295 | 0.294 | 19.16 | 17.16 | 0.076 | 0.067 | 0.73 | 0.79 | |
| Australia | 0.133 | 0.174 | 0.169 | 106.35 | 93.73 | 0.060 | 0.054 | 0.83 | 0.87 | |
| Europe | 0.284 | 0.285 | 0.286 | 13.08 | 12.00 | 0.093 | 0.081 | 0.64 | 0.76 | |
| North America | 0.253 | 0.284 | 0.280 | 28.78 | 25.15 | 0.088 | 0.078 | 0.59 | 0.66 | |
| South America | 0.249 | 0.286 | 0.281 | 35.52 | 31.12 | 0.075 | 0.066 | 0.82 | 0.86 | |
| SON | Global | 0.243 | 0.263 | 0.261 | 30.44 | 26.75 | 0.076 | 0.067 | 0.64 | 0.72 |
| Africa | 0.191 | 0.226 | 0.222 | 49.82 | 44.10 | 0.068 | 0.060 | 0.80 | 0.84 | |
| Asia | 0.269 | 0.279 | 0.278 | 14.37 | 12.67 | 0.071 | 0.063 | 0.61 | 0.70 | |
| Australia | 0.123 | 0.162 | 0.157 | 120.15 | 105.66 | 0.057 | 0.051 | 0.84 | 0.88 | |
| Europe | 0.276 | 0.284 | 0.283 | 16.75 | 14.68 | 0.092 | 0.081 | 0.46 | 0.63 | |
| North America | 0.252 | 0.272 | 0.269 | 23.44 | 20.29 | 0.086 | 0.076 | 0.56 | 0.68 | |
| South America | 0.227 | 0.267 | 0.262 | 41.28 | 36.21 | 0.073 | 0.064 | 0.82 | 0.86 | |
| DJF | Global | 0.249 | 0.229 | 0.232 | 10.34 | 9.00 | 0.095 | 0.084 | 0.35 | 0.48 |
| Africa | 0.184 | 0.219 | 0.216 | 43.81 | 38.92 | 0.069 | 0.061 | 0.78 | 0.82 | |
| Asia | 0.266 | 0.215 | 0.221 | −11.92 | −10.58 | 0.100 | 0.088 | 0.33 | 0.46 | |
| Australia | 0.135 | 0.175 | 0.170 | 100.37 | 87.83 | 0.061 | 0.054 | 0.84 | 0.87 | |
| Europe | 0.309 | 0.270 | 0.274 | −2.83 | −2.77 | 0.114 | 0.100 | 0.12 | 0.29 | |
| North America | 0.263 | 0.222 | 0.227 | −4.04 | −3.76 | 0.109 | 0.095 | 0.32 | 0.48 | |
| South America | 0.243 | 0.282 | 0.277 | 35.15 | 30.79 | 0.075 | 0.066 | 0.79 | 0.84 | |
References
- Oki, T.; Kanae, S. Global hydrological cycles and world water resources. Science 2006, 313, 1068–1072. [Google Scholar] [CrossRef] [PubMed] [Green Version]
- Trenberth, K.E.; Fasullo, J.T.; Kiehl, J. Earth’s global energy budget. Bull. Am. Meteorol. Soc. 2009, 90, 311–323. [Google Scholar] [CrossRef]
- Pascolini-Campbell, M.; Reager, J.T.; Chandanpurkar, H.A.; Rodell, M. A 10 per cent increase in global land evapotranspiration from 2003 to 2019. Nature 2021, 593, 543–547. [Google Scholar] [CrossRef]
- Wang, K.; Dickinson, R.E. A review of global terrestrial evapotranspiration: Observation, modeling, climatology, and climatic variability. Rev. Geophys. 2012, 50, RG2005. [Google Scholar] [CrossRef]
- Jiménez, C.; Prigent, C.; Mueller, B.; Seneviratne, S.I.; McCabe, M.F.; Wood, E.F.; Rossow, W.B.; Balsamo, G.; Betts, A.K.; Dirmeyer, P.A.; et al. Global intercomparison of 12 land surface heat flux estimates. J. Geophys. Res. Atmos. 2011, 116, D02102. [Google Scholar] [CrossRef]
- Miralles, D.G.; Holmes, T.R.H.; De Jeu, R.A.M.; Gash, J.H.; Meesters, A.G.C.A.; Dolman, A.J. Global land-surface evaporation estimated from satellite-based observations. Hydrol. Earth Syst. Sci. 2011, 15, 453–469. [Google Scholar] [CrossRef] [Green Version]
- Mu, Q.; Heinsch, F.A.; Zhao, M.; Running, S.W. Development of a global evapotranspiration algorithm based on MODIS and global meteorology data. Remote Sens. Environ. 2007, 111, 519–536. [Google Scholar] [CrossRef]
- Cleugh, H.A.; Leuning, R.; Mu, Q.; Running, S.W. Regional evaporation estimates from flux tower and MODIS satellite data. Remote Sens. Environ. 2007, 106, 285–304. [Google Scholar] [CrossRef]
- Fisher, J.B.; Tu, K.P.; Baldocchi, D.D. Global estimates of the land-atmosphere water flux based on monthly AVHRR and ISLSCP-II data, validated at 16 FLUXNET sites. Remote Sens. Environ. 2008, 112, 901–919. [Google Scholar] [CrossRef]
- Mu, Q.; Zhao, M.; Running, S.W. Improvements to a MODIS global terrestrial evapotranspiration algorithm. Remote Sens. Environ. 2011, 115, 1781–1800. [Google Scholar] [CrossRef]
- Jung, M.; Reichstein, M.; Ciais, P.; Seneviratne, S.I.; Sheffield, J.; Goulden, M.L.; Bonan, G.; Cescatti, A.; Chen, J.; De Jeu, R.; et al. Recent decline in the global land evapotranspiration trend due to limited moisture supply. Nature 2010, 467, 951–954. [Google Scholar] [CrossRef]
- Zhang, K.; Kimball, J.S.; Nemani, R.R.; Running, S.W.; Hong, Y.; Gourley, J.J.; Yu, Z. Vegetation greening and climate change promote multidecadal rises of global land evapotranspiration. Sci. Rep. 2015, 5, 15956. [Google Scholar] [CrossRef] [PubMed]
- Zhang, K.; Kimball, J.S.; Running, S.W. A review of remote sensing based actual evapotranspiration estimation. Wires Water 2016, 3, 834–853. [Google Scholar] [CrossRef]
- Monteith, J.L. Evaporation and environment. Symp. Soc. Exp. Biol. 1965, 19, 205–234. [Google Scholar] [PubMed]
- Shuttleworth, W.J. Evaporation models in hydrology. In Land Surface Evaporation: Measurement and Parameterization; Schmugge, T.J., André, J.-C., Eds.; Springer: New York, NY, USA, 1991; pp. 93–120. [Google Scholar]
- Priestley, C.H.B.; Taylor, R.J. On the assessment of surface heat flux and evaporation using large-scale parameters. Mon. Weather Rev. 1972, 100, 81–92. [Google Scholar] [CrossRef]
- Li, Z.L.; Tang, R.; Wan, Z.; Bi, Y.; Zhou, C.; Tang, B.; Yan, G.; Zhang, X. A review of current methodologies for regional evapotranspiration estimation from remotely sensed data. Sensors 2009, 9, 3801–3853. [Google Scholar] [CrossRef] [Green Version]
- Wang, J.; Salvucci, G.D.; Bras, R.L. An extremum principle of evaporation. Water Resour. Res. 2004, 40, W09303. [Google Scholar] [CrossRef] [Green Version]
- Luo, Z.; Shao, Q.; Wan, W.; Li, H.; Chen, X.; Zhu, S.; Ding, X. A new method for assessing satellite-based hydrological data products using water budget closure. J. Hydrol. 2021, 594, 125927. [Google Scholar] [CrossRef]
- Huang, S.; Bartlett, P.; Arain, M.A. Assessing nitrogen controls on carbon, water and energy exchanges in major plant functional types across North America using a carbon and nitrogen coupled ecosystem model. Ecol. Model. 2016, 323, 12–27. [Google Scholar] [CrossRef]
- Lawrence, D.M.; Thornton, P.E.; Oleson, K.W.; Bonan, G.B. The partitioning of evapotranspiration into transpiration, soil evaporation, and canopy evaporation in a GCM: Impacts on land-atmosphere interaction. J. Hydrometeorol. 2007, 8, 862–880. [Google Scholar] [CrossRef]
- Bonan, G.B. Land–atmosphere interactions for climate system models: Coupling biophysical, biogeochemical, and ecosystem dynamical processes. Remote Sens. Environ. 1995, 51, 57–73. [Google Scholar] [CrossRef]
- Bonan, G.B.; Oleson, K.W.; Vertenstein, M.; Levis, S.; Zeng, X.; Dai, Y.; Dickinson, R.E.; Yang, Z.L. The land surface climatology of the community land model coupled to the NCAR community climate model. J. Clim. 2002, 15, 3123–3149. [Google Scholar] [CrossRef] [Green Version]
- Parajuli, K.; Jones, S.B.; Tarboton, D.G.; Flerchinger, G.N.; Hipps, L.E.; Allen, L.N.; Seyfried, M.S. Estimating actual evapotranspiration from stony-soils in montane ecosystems. Agric. For. Meteorol. 2019, 265, 183–194. [Google Scholar] [CrossRef] [Green Version]
- Oleson, K.W.; Niu, G.Y.; Yang, Z.L.; Lawrence, D.M.; Thornton, P.E.; Lawrence, P.J.; Stöckli, R.; Dickinson, R.E.; Bonan, G.B.; Levis, S.; et al. Improvements to the community land model and their impact on the hydrological cycle. J. Geophys. Res. Biogeosci. 2008, 113, G01021. [Google Scholar] [CrossRef]
- Oleson, K.; Lawrence, D.M.; Bonan, G.B.; Drewniak, B.; Huang, M.; Koven, C.D.; Levis, S.; Li, F.; Riley, W.J.; Subin, Z.M.; et al. Technical description of version 4.5 of the Community Land Model (CLM). NCAR Tech. Notes 2013. [Google Scholar] [CrossRef]
- Lawrence, D.; Fisher, R.; Koven, C.; Oleson, K.; Swenson, S.; Vertenstein, M. The Community Land Model version 5: Description of new features, benchmarking, and impact of forcing uncertainty. J. Adv. Model. Earth Syst. 2019, 11, 4245–4287. [Google Scholar] [CrossRef] [Green Version]
- Swenson, S.C.; Lawrence, D.M. Assessing a dry surface layer-based soil resistance parameterization for the Community Land Model using GRACE and FLUXNET-MTE data. J. Geophys. Res. Atmos. 2014, 119, 10,299–10,312. [Google Scholar] [CrossRef]
- Allen, R.G.; Pereira, L.S.; Raes, D.; Smith, M. Crop Evapotranspiration. Crop Evapotranspiration–Guidelines for Computing Crop Water Requirements; FAO Irrigation and Drainage Paper 56; FAO: Rome, Italy, 1998. [Google Scholar]
- Liu, M.; Tian, H.; Chen, G.; Ren, W.; Zhang, C.; Liu, J. Effects of land-use and land-cover change on evapotranspiration and water yield in China during 1900–2000. J. Am. Water Resour. Assoc. 2008, 44, 1193–1207. [Google Scholar] [CrossRef]
- Michel, D.; Jiménez, C.; Miralles, D.G.; Jung, M.; Hirschi, M.; Ershadi, A.; Martens, B.; McCabe, M.F.; Fisher, J.B.; Mu, Q.; et al. The WACMOS-ET project—Part 1: Tower-scale evaluation of four remote-sensing-based evapotranspiration algorithms. Hydrol. Earth Syst. Sci. 2016, 20, 803–822. [Google Scholar] [CrossRef] [Green Version]
- Miralles, D.G.; Jiménez, C.; Jung, M.; Michel, D.; Ershadi, A.; McCabe, M.F.; Hirschi, M.; Martens, B.; Dolman, A.J.; Fisher, J.B.; et al. The WACMOS-ET project—Part 2: Evaluation of global terrestrial evaporation data sets. Hydrol. Earth Syst. Sci. 2016, 20, 823–842. [Google Scholar] [CrossRef] [Green Version]
- Mueller, B.; Seneviratne, S.I.; Jimenez, C.; Corti, T.; Hirschi, M.; Balsamo, G.; Ciais, P.; Dirmeyer, P.; Fisher, J.B.; Guo, Z.; et al. Evaluation of global observations-based evapotranspiration datasets and IPCC AR4 simulations. Geophys. Res. Lett. 2011, 38, L06402. [Google Scholar] [CrossRef] [Green Version]
- Tian, H.; Chen, G.; Liu, M.; Zhang, C.; Sun, G.; Lu, C.; Xu, X.; Ren, W.; Pan, S.; Chappelka, A. Model estimates of net primary productivity, evapotranspiration, and water use efficiency in the terrestrial ecosystems of the southern United States during 1895–2007. For. Ecol. Manag. 2010, 259, 1311–1327. [Google Scholar] [CrossRef]
- Wartenburger, R.; Seneviratne, S.I.; Hirschi, M.; Chang, J.; Ciais, P.; Deryng, D.; Elliott, J.; Folberth, C.; Gosling, S.N.; Gudmundsson, L.; et al. Evapotranspiration simulations in ISIMIP2a—Evaluation of spatio-temporal characteristics with a comprehensive ensemble of independent datasets. Environ. Res. Lett. 2018, 13, 075001. [Google Scholar] [CrossRef]
- Haddeland, I.; Clark, D.B.; Franssen, W.; Ludwig, F.; Voß, F.; Arnell, N.W.; Bertrand, N.; Best, M.; Folwell, S.; Gerten, D.; et al. Multimodel estimate of the global terrestrial water balance: Setup and first results. J. Hydrometeorol. 2011, 12, 869–884. [Google Scholar] [CrossRef] [Green Version]
- Pan, S.; Pan, N.; Tian, H.; Friedlingstein, P.; Sitch, S.; Shi, H.; Arora, V.K.; Haverd, V.; Jain, A.K.; Kato, E.; et al. Evaluation of global terrestrial evapotranspiration using state-of-the-art approaches in remote sensing, machine learning and land surface modeling. Hydrol. Earth Syst. Sci. 2020, 24, 1485–1509. [Google Scholar] [CrossRef] [Green Version]
- Lu, H.; Koike, T.; Yang, K.; Hu, Z.; Xu, X.; Rasmy, M.; Kuria, D.; Tamagawa, K. Improving land surface soil moisture and energy flux simulations over the Tibetan plateau by the assimilation of the microwave remote sensing data and the GCM output into a land surface model. Int. J. Appl. Earth Obs. Geoinf. 2012, 17, 43–54. [Google Scholar] [CrossRef]
- Che, T.; Li, X.; Jin, R.; Huang, C. Assimilating passive microwave remote sensing data into a land surface model to improve the estimation of snow depth. Remote Sens. Environ. 2014, 143, 54–63. [Google Scholar] [CrossRef]
- Lee, J.S.; Choi, H.I. Improvements to runoff predictions from a land surface model with a lateral flow scheme using remote sensing and in situ observations. Water 2017, 9, 148. [Google Scholar] [CrossRef] [Green Version]
- Marshall, M.; Tu, K.; Funk, C.; Michaelsen, J.; Williams, P.; Williams, C.; Ardo, J.; Boucher, M.; Cappelaere, B.; de Grandcourt, A.; et al. Improving operational land surface model canopy evapotranspiration in Africa using a direct remote sensing approach. Hydrol. Earth Syst. Sci. 2013, 17, 1079–1091. [Google Scholar] [CrossRef] [Green Version]
- Parr, D.; Wang, G.; Bjerklie, D. Integrating remote sensing data on evapotranspiration and leaf area index with hydrological modeling: Impacts on model performance and future predictions. J. Hydrometeorol. 2015, 16, 2086–2100. [Google Scholar] [CrossRef]
- Wang, D.; Wang, G.; Parr, D.T.; Liao, W.; Xia, Y.; Fu, C. Incorporating remote sensing-based ET estimates into the Community Land Model version 4.5. Hydrol. Earth. Syst. Sci. 2017, 21, 3557–3577. [Google Scholar] [CrossRef] [Green Version]
- Lawrence, D.M.; Oleson, K.W.; Flanner, M.G.; Thornton, P.E.; Swenson, S.C.; Lawrence, P.J.; Zeng, X.B.; Yang, Z.L.; Levis, S.; Sakaguchi, K.; et al. Parameterization improvements and functional and structural advances in version 4 of the Community Land Model. J. Adv. Model. Earth Syst. 2011, 3, M03001. [Google Scholar] [CrossRef]
- Lawrence, P.J.; Chase, T.N. Representing a new MODIS consistent land surface in the Community Land Model (CLM 3.0). J. Geophys. Res. Biogeosci. 2007, 112, G01023. [Google Scholar] [CrossRef]
- Verdin, K.L.; Jenson, S.K. Development of continental scale digital elevation models and extraction of hydrographic features. In Proceedings of the Third International Conference/Workshop on Integrating GIS and Environmental Modeling, Santa Fe, NM, USA, 21–26 January 1996. [Google Scholar]
- Cucchi, M.; Weedon, G.P.; Amici, A.; Bellouin, N.; Lange, S.; Müller Schmied, H.; Hersbach, H.; Buontempo, C. WFDE5: Bias-adjusted ERA5 reanalysis data for impact studies. Earth Syst. Sci. Data 2020, 12, 2097–2120. [Google Scholar] [CrossRef]
- Parr, D.; Wang, G.; Fu, C. Understanding evapotranspiration trends and their driving mechanisms over the NLDAS domain based on numerical experiments using CLM4.5. J. Geophys. Res. 2016, 121, 7729–7745. [Google Scholar] [CrossRef] [Green Version]
- Jung, M.; Reichstein, M.; Bondeau, A. Towards global empirical upscaling of FLUXNET eddy covariance observations: Validation of a model tree ensemble approach using a biosphere model. Biogeosciences 2009, 6, 2001–2013. [Google Scholar] [CrossRef] [Green Version]
- Martens, B.; Miralles, D.G.; Lievens, H.; Van Der Schalie, R.; De Jeu, R.A.M.; Fernández-Prieto, D.; Beck, H.E.; Dorigo, W.A.; Verhoest, N.E.C. GLEAM v3: Satellite-based land evaporation and root-zone soil moisture. Geosci. Model Dev. 2017, 10, 1903–1925. [Google Scholar] [CrossRef] [Green Version]
- Martens, B.; Miralles, D.; Lievens, H.; Fernández-Prieto, D.; Verhoest, N.E.C. Improving terrestrial evaporation estimates over continental Australia through assimilation of SMOS soil moisture. Int. J. Appl. Earth Obs. Geoinf. 2016, 48, 146–162. [Google Scholar] [CrossRef]
- Miralles, D.G.; De Jeu, R.A.M.; Gash, J.H.; Holmes, T.R.H.; Dolman, A.J. Magnitude and variability of land evaporation and its components at the global scale. Hydrol. Earth Syst. Sci. 2011, 15, 967–981. [Google Scholar] [CrossRef] [Green Version]
- Miralles, D.G.; Gash, J.H.; Holmes, T.R.H.; de Jeu, R.A.M.; Dolman, A.J. Global canopy interception from satellite observations. J. Geophys. Res. Atmos. 2010, 115, D16122. [Google Scholar] [CrossRef]
- Vicente-Serrano, S.M.; Cabello, D.; Tomás-Burguera, M.; Martín-Hernández, N.; Beguería, S.; Azorin-Molina, C.; Kenawy, A.E. Drought variability and land degradation in semiarid regions: Assessment using remote sensing data and drought indices (1982–2011). Remote Sens. 2015, 7, 4391–4423. [Google Scholar] [CrossRef] [Green Version]
- Yang, S.; Zhang, J.; Zhang, S.; Wang, J.; Bai, Y.; Yao, F.; Guo, H. The potential of remote sensing-based models on global water-use efficiency estimation: An evaluation and intercomparison of an ecosystem model (BESS) and algorithm (MODIS) using site level and upscaled eddy covariance data. Agric. For. Meteorol. 2020, 287, 107959. [Google Scholar] [CrossRef]
- Fekete, B.M.; Vörösmarty, C.J.; Grabs, W. High-resolution fields of global runoff combining observed river discharge and simulated water balances. Glob. Biogeochem. Cycles 2002, 16, 15-1–15-10. [Google Scholar] [CrossRef]
- Entekhabi, D.; Njoku, E.G.; Neill, P.E.O.; Kellogg, K.H.; Crow, W.T.; Edelstein, W.N.; Entin, J.K.; Goodman, S.D.; Jackson, T.J.; Johnson, J.; et al. The Soil Moisture Active Passive (SMAP) Mission. Proc. IEEE 2010, 98, 704–716. [Google Scholar] [CrossRef]
- Entekhabi, D.; Yueh, S.; O’Neill, P.E.; Kellogg, K.H.; Allen, A.; Bindlish, R.; Brown, M.; Chan, S.; Colliander, A.; Crow, W.T.; et al. SMAP Handbook—Soil Moisture Active Passive: Mapping Soil Moisture and Freeze/Thaw from Space; NASA: Pasadena, CA, USA, 2014. [Google Scholar]
- Reichle, R.; De Lannoy, G.; Koster, R.D.; Crow, W.T.; Kimball., J.S.; Liu, Q. SMAP L4 Global 3-Hourly 9 km EASE-Grid Surface and Root Zone Soil Moisture Analysis Update, Version 5; NASA National Snow and Ice Data Center Distributed Active Archive Center: Boulder, CO, USA, 2020. [Google Scholar]
Publisher’s Note: MDPI stays neutral with regard to jurisdictional claims in published maps and institutional affiliations. |
© 2021 by the authors. Licensee MDPI, Basel, Switzerland. This article is an open access article distributed under the terms and conditions of the Creative Commons Attribution (CC BY) license (https://creativecommons.org/licenses/by/4.0/).

