Abstract
Satellite precipitation estimates are used as an alternative or as a supplement to the records of the in situ stations. Although some satellite precipitation products have reasonably consistent time series, they are often limited to specific geographic areas. The main objective of this study was to evaluate CHIRPS version 2, MSWEP version 2, and PERSIANN-CDR, compared to gridBR, as daily mean and extreme inputs represented on a monthly scale and their respective seasonal trends of rainfall in the Mearim River Drainage Basin (MDB), Maranhão state, Brazil. Estimates of errors were calculated (relative error, pbias; root mean square error, RMSE, and Willmott concordance index, d), and the chances of precipitation were estimated by remote sensing (RES). In addition, trends in precipitation were estimated by the two-sample Mann–Kendall test. Given the overall performance, the best products for estimating monthly mean daily rainfall in the MDB are CHIRPS and PERSIANN-CDR, especially for rainy months (December to May). For daily extremes on the monthly scale, the best RES is PERSIANN-CDR. There is no general agreement between gridBR and RES methods for the trend signal, even a nonsignificant one, much less a significant one. The use of MSWEP for the MDB region is discouraged by this study because it overestimates monthly averages and extremes. Finally, studies of this kind in drainage basins are essential to improve the information generated for managing territories and developing regionalized climate and hydrological models.
1. Introduction
Precipitation plays a key role in the hydrological cycle, especially in tropical regions, due to its abundance [1]. It is considered the main input into the water balance of drainage basins, so it is used as a primordial input in hydrological and climatological modeling [2,3,4,5]. Thus, knowing its quantity, intensity, frequency, and variation in time and space is essential to the management of drainage basins [6]. In the context of a drainage basin, analyzing satellite products is important for planning territorial development, flood and drought management, risk contingency plans, and adaptation to and mitigation of extreme events.
Although it is a challenge, there are different methods to estimate precipitation (especially the liquid phase) [2]. Precipitation can be obtained by in situ stations (e.g., meteorological stations, rain gauges, and automated) or by satellites and radars’ sensors. In situ stations are considered a reference data source [7,8,9,10] and are essential for reliable monitoring at ground level. Although there are between 150,000 and 250,000 such stations in the world [11], the spatial representation of these observations is scarce in some regions due to their variable spatial density, which compromises the dimensioning of the variability, intensity, and type of precipitation.
In South America, monitoring by surface stations is limited by infrastructure, maintenance, and the density and frequency of observations [12,13]. According to [14], Brazil has 12,325 rainfall surface stations, amounting to a mean density of one station per 691 km2, and the state of Maranhão has 230 rainfall stations [14], for a mean density of one station per 1143 km². Both densities are below the ideal limit recommended by the World Meteorological Organization of one station per 575 km2 [15]. In addition, there is great variability in the monitoring density throughout the country [16], with greater concentrations of surface stations located in the south, southeast, and parts of the northeast.
Given the difficulty of spatial representation and obtaining long enough series via in situ stations, precipitation data obtained by remote sensing are essential for monitoring and improving information about drainage regions. However, in tropical regions, due to the complexities of the processes that lead to rain formation and the low density of stations, the elucidation of rainfall volumes is not always a trivial task. Studies that use satellite-derived products as precipitation inputs are increasingly common worldwide, especially in Brazil. Although this type of monitoring allows the spatial evaluation of large areas [2,11], it often does not prioritize the drainage basin as a territorial management unit.
In this context, reliable rainfall data obtained from remote sensors can play an important role in the management of water resources in drainage basins, especially in regions with low in situ monitoring density. Evidence for this assertion comes from the Mearim River drainage basin (MDB), a region of Maranhão state (northeastern Brazil) that is of great economic interest in terms of agricultural and forestry activities due to the expansion of agricultural boundaries by the delimitation of the economic space known as MATOPIBA, which occupies a portion of Alto Mearim [17]. A management committee for the MDB was created by Ordinary Law No. 9.957 of 21 November 2013 [18], and the MDB has two important logistical points: the Carajás Railway and the Ponta da Madeira port terminal in São Luís do Maranhão [19].
Due to the lack of surface data that would help us delimit patterns of occurrence of mean and extreme rainfall and the socio-economic importance of the region, this study aims to evaluate satellite-derived products (remote sensing, RES), Climate Hazards Group Infrared Precipitation with Stations (CHIRPS), Multi-Source Weighted-Ensemble Precipitation (MSWEP), and Precipitation Estimation from Remotely Sensed Information Using Artificial Neural Networks Climate Data Record (PERSIANN-CDR) for their representativeness of daily and monthly mean and extremes of rainfall in the MDB. As a complement, seasonal trends between the means and extremes of the reference and the RES data were estimated by the Mann–Kendall test.
2. Methods
2.1. Study Area
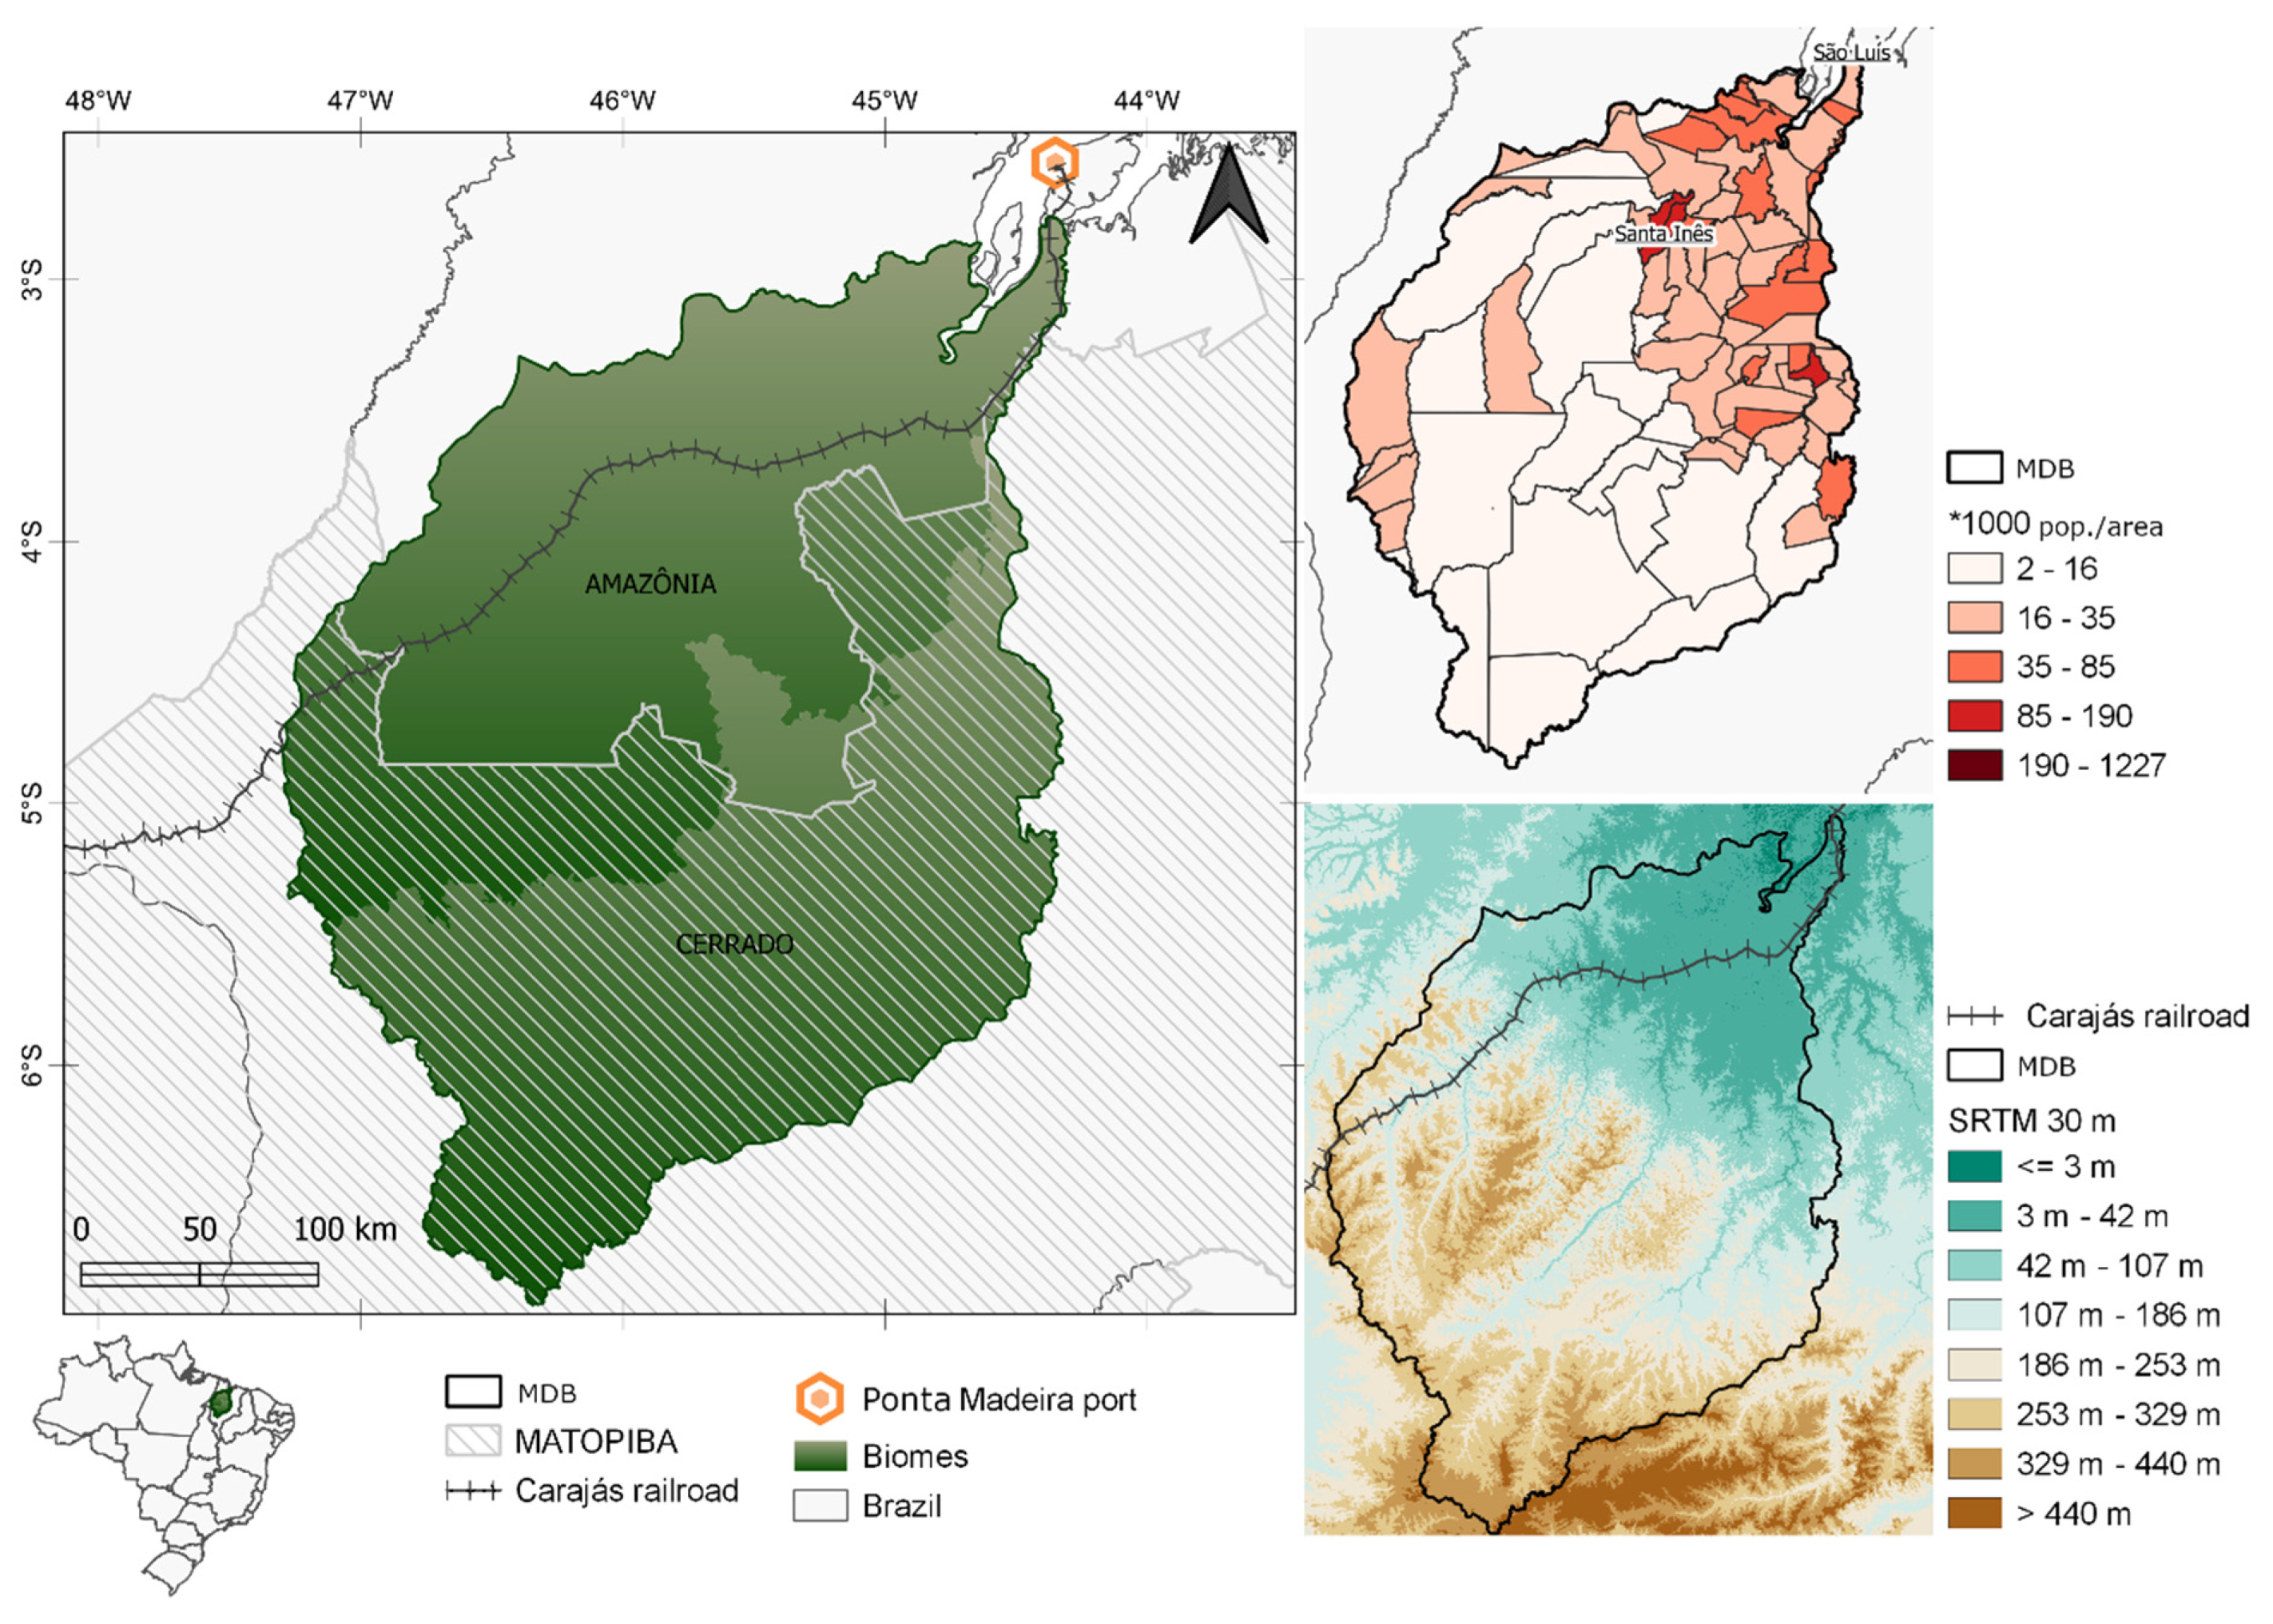
The MDB is located in the central part of Maranhão state in northeastern Brazil and runs south to north (Figure 1). It has an area of 98,289 km2. Approximately 83 municipalities are included in the MDB, of which 50 are fully inside the basin area. According to [20], 2,257,268 people live along the drainage area of the MDB, and the most densely populated municipalities are located downstream (north and northeast of the MDB), as shown in Figure 1 [21]. The state of Maranhão is the 10th most populous state in Brazil and has the lowest nominal monthly household income per capita out of the 26 federal units of Brazil [22].
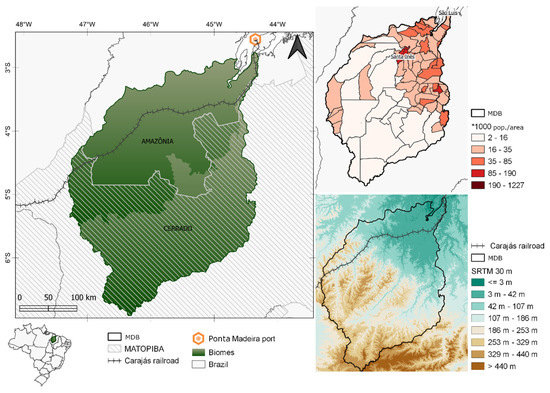
Figure 1.
Location of the Mearim Drainage Basin (MDB) in the Brazilian and Maranhão regions. Source: prepared by the first author with data from ANA, Mapbiomas (Collection 5), and Brazilian Institute of Geography and Statistics (IBGE).
In addition to its undeniable hydrological and socio-economic importance to the state of Maranhão, the MDB makes up approximately 30% of the state’s area (Figure 1) [23]. Of the entire spatial extent of the MDB, approximately 54% of its area is Amazon biome, and 46% Cerrado, for a total area almost 60% of the MATOPIBA productive region (a region formed by the Brazilian states of the Tocantins and some parts of the states of Maranhão, Piauí, and Bahia) (Figure 1). Thus, the area is a transition zone between two large Brazilian biomes, so it is located at a strategic point for the production and disposal of food and raw materials. Water resources, agroproductive structures, and logistics systems are highly vulnerable to climate changes, especially extreme events [24,25]. Low resilience to extreme events is common in tropical areas and developing countries [26].
According to [27], the Mearim River is 742 km long and originates in the municipality of Formosa da Serra Negra, a hillside region of the Serra da Menina [21] (Altitude above 440 m, Figure 1). The river flows northwards and flows into the Atlantic Ocean through São Marcos Bay between the cities of São Luís and Alcântara. The main tributaries on the right bank are the Corda River (130.8 km long) and the Flores River (569.2 km). The Pindaré River (569.2 km) and the Grajaú River (546.3 km) stand out on the left bank [21].
The annual mean air temperature in the MDB is above 26 °C [28]. The northwestern portion of the drainage basin, in the Amazon biome, is characterized as Am (tropical monsoon) by the Köppen–Geiger climate system, and the rest of the basin is characterized as Aw (tropical with a dry austral winter) [28]. The rainfall regimes in northeastern Brazil are influenced by the interannual variability in the Pacific Ocean temperature associated with the El Niño Southern Oscillation (ENSO) [29]. The driest periods occur during El Niño, and the wettest periods occur with La Niña [1]. Pacific Ocean temperature and its impacts on meteorological systems significantly affect the frequency, duration, and intensity of rainfall in northeastern Brazil, as is widely documented in the literature [30]. The Intertropical Convergence Zone [31,32], high-level cyclonic vortices [33,34], mesoscale convective systems [35,36], South Atlantic Convergence Zone, and frontal systems [34,35] are other phenomena that affect the rainfall regime of the region.
2.2. Databases
2.2.1. Reference Data
In this study, daily gridded precipitation data were used as a reference for comparisons with satellite data. These observed data were developed by [8]. The database named Daily Gridded Meteorological Variables in Brazil (gridBR) is available at https://utexas.app.box.com/v/Xavier-etal-IJOC-DATA (accessed on 20 March 2021). In this study, we used the grid of version 2. The spatial resolution of this database is 0.25 × 0.25° for daily precipitation (see map from gridBR in Supplementary material I), evapotranspiration, and five other variables estimated for Brazil. These data are calculated from surface information derived from automated and conventional stations of the National Water Agency (ANA, for its name in Portuguese), the National Institute of Meteorology (INMET, for its name in Portuguese), and the Department of Water and Electricity of São Paulo (DAEE, for its name in Portuguese), and they are available for the period from 1980 to 2013. In this study, we use the precipitation values from 1983 to 2013 daily. The surface data of this database—from approximately 4000 rainfall surface stations—were validated by six different interpolation methods, and according to the cross-validation analysis, the best method was inverse distance weighting [37,38].
Several studies have used this database as a comparative input against other data sources [39,40,41,42,43,44]. Other authors [8] have emphasized that the organization of Brazilian meteorological data in grid format—on a daily and monthly scale—significantly increases the ability to evaluate the reliability of satellite-based products and thereby evaluate the impacts of climate variability on water resources. In areas with a deficit in surface data that are of high enough quality and cover a long enough time to determine the climatological norms, this database can provide reference information.
2.2.2. Precipitation Data from Remote Sensing
The remote sensing data evaluated in this study were generated through different processes that use different satellite sensors, thus generating precipitation products with various spatial resolutions. It was necessary to allocate the data at a common spatial resolution, upscaled for CHIRPS and MSWEP, to compare values between databases. Thus, the RES data were extracted as a function of the spatial grid of the gridBR (0.25 × 0.25°). The method used to extract the values was bilinear interpolation between the four points closest to the selected pixel. For the RES extractions, the period from 1983 to 2013 and the use of the “Raster” package in R software were considered [45]. The metrics and indices subjected to comparison are given in the “Analysis (Section 2.3)” below.
Climate Hazards Group Infrared Precipitation with Station Data
The CHIRPS dataset has several temporal resolutions (every 3 h, daily, and monthly), which are available from January 1981 to the present. In this study, daily data for CHIRPS version 2.0 were obtained via the FTTP link ftp://ftp.chg.ucsb.edu/pub/org/chg/products/CHIRPS-2.0/ accessed on 12 July 2021. The daily database covers almost the entire planet (50°S—50°N and 180°W—180°E) and has a high spatial resolution of 0.05 × 0.05°. According to [46], the main sources of data from which the CHIRPS database is compiled are (1) monthly climatological precipitation data CHPClim; (2) observations of geostationary satellites with quasi-global coverage via an infrared thermal sensor (IR) of the National Oceanic and Atmospheric Administration (NOAA), products of the Climate Prediction Center, and B1 IR of the National Climatic Data Center; (3) precipitation estimates of the Tropical Rainfall Measuring Mission Multisatellite Precipitation Analysis version 7 (TMPA 3B42 v7); (4) atmospheric models of precipitation fields of the NOAA Climate Forecast System version 2, and (5) observations of in situ precipitation from various sources of the Global Historical Climate Network, Global Summary of the Day dataset, and the Global Telecommunications System of the World Meteorology Organization. For this study, daily data for the central grid points were extracted to calculate spatial and temporal associations.
Multi-Source Weighted-Ensemble Precipitation Version 2
The MSWEP database incorporates weighted averages with daily outputs from observations of surface stations and satellites, and reanalyzes to reduce temporal biases [47]. Diurnal variations in precipitation for regional evaluations are described by [48,49]. Version 2 of the MSWEP database has a spatial resolution of 0.1 × 0.1° and incorporates the products listed in Table 1. Further details can be found in [47]. The central grid points were extracted for spatial and temporal association.

Table 1.
Overview of datasets incorporated via grids in the MSWEP v2 database. Adapted from [47].
Table 1.
Overview of datasets incorporated via grids in the MSWEP v2 database. Adapted from [47].
| Name | Source | Spatial Res. | Temporal Res. | Temporal Coverage |
|---|---|---|---|---|
| CMORPH [47,50] | Satellite | 0.07 degrees | 30 min | 1998–present |
| Station daily data [47,51] | Station (GHCN-D and GSOD, other sources) | – – | Daily | 1979–2017 |
| ERA-Iterim [52] | Reanalysis | ~80 km | 3 h | 1979–present |
| GPCC FDR [49,53,54] | Station | 0.5/1 degrees | Monthly | 1951–present |
| GridSat [55] | Satellite | 0.1 degrees | 3 h | 1980–2016 |
| GPSMAP [56] | Satellite | 0.1 degrees | 1 h | 2000–present |
| JRA-55 [57] | Reanalysis | ~60 km | 3 h | 1959–present |
| TMPA 3B42RT [58] | Satellite | 0.25 degrees | 3 h | 2000–present |
| WorldClim [59] | Stations | ~1 km | Monthly | Climate |
Precipitation Estimation from Remotely Sensed Information Using Artificial Neural Networks Climate Data Records
PERSIANN-CDR is a daily database that extends from 60°S to 60°N and covers January 1983 to the present [60]. This product applies the basic PERSIANN algorithm [61] to estimate precipitation from satellite data every 3 h. The daily data have a spatial resolution of 0.25 × 0.25° and can be downloaded for specific coordinates or for a particular area of interest. PERSIANN-CDR covers more than 30 years of daily rainfall (1983 to the present) but was only made available to the website: ftp://eclipse.ncdc.noaa.gov/pub/cdr/persiann/arquivos/ accessed on 12 July 2021. The main source of satellite data used for product development is derived from IR Gridded Satellite (Grid Sat-B1) information. Next, the data from the Stage IV radar of the National Center for Environmental Prediction are used to create the nonlinear regression parameters of the neural network model. To improve the reliability of PERSIANN-CDR, it is calibrated using the monthly product Global Precipitation Climatology Project (GPCP) version 2.2 [60]. The GPCP product contains data from precipitation meters generated by the mission of the Global Precipitation Climatology Center [53].
2.3. Analysis
2.3.1. Mean and Extreme Indices
The characterizations of variables were evaluated according to the daily RES data (CHIRPS, MSWEP, and PERSIANN-CDR) extracted from 1983 to 2013 for the gridBR coordinates. The rainfall references were obtained from the central point of the spatial grid of the data provided by [8] on a daily and a monthly scale. Some authors [62] emphasize the importance of dividing historical series into periods and running analyses by period to reduce the influence of autocorrelated data. Thus, descriptive climatic indices of the variations in precipitation extremes were obtained according to the Expert Team on Climate Change Detection and Indices [63]: monthly mean and rx1day—maximum rainfall in 1 day (mm). These indices have been used and validated in other studies in several regions [6,64,65,66,67,68,69].
2.3.2. Evaluation of RES Products Versus gridBR
To validate the data extracted from RES, we calculated performance metrics commonly applied in the temporal comparison of observed data and RES data [70,71,72,73]: relative error (pbias): the closer to 0, the better the accuracy of RES against gridBR; root mean square error (RMSE): the closer to 0, the better the accuracy of RES against gridBR, and Willmott concordance index (d): the closer to 1, the better the accuracy of RES against gridBR. In addition to the metrics described above, false alarm (FAR)—ideally equal to 0—and probability of occurrence—ideally equal to 100%—were calculated for the thresholds greater than 1 mm/day for monthly mean and rx1day (mm/day) of the rainfall data of gridBR versus RES. FAR analysis tells us whether the occurrence of precipitation was detected in RES but not in gridBR. The probability of occurrence analysis indicates the percentage of hits in RES needed to estimate the occurrence of precipitation in gridBR.
As a complementary analysis, trends were also calculated by the nonparametric Mann–Kendall test [74,75,76] at 5% statistical significance for mean rainfall and the rx1day of gridBR and RES between the seasonal periods (DJF: December–January–February; MAM: March–April–May; JJA: June–July–August, and SON: September–October–November) from 1983 to 2013. The Mann–Kendall test was used to statistically verify the existence of monotonic, linear, and nonlinear trends. This test is widely used in studies with hydroclimatic variables [9,77,78,79]. It compares two hypotheses: the null hypothesis (H0)—there is no trend; and the alternative hypothesis (Ha)—there is an increasing or decreasing trend in the mean rainfall data or rx1day. If the p-value is less than 0.05, H0 is rejected, and there is statistical evidence to accept the alternative hypothesis of a statistically significant increase or decrease over a time series. The increment or decrement is given by the value of tau [74].
3. Results
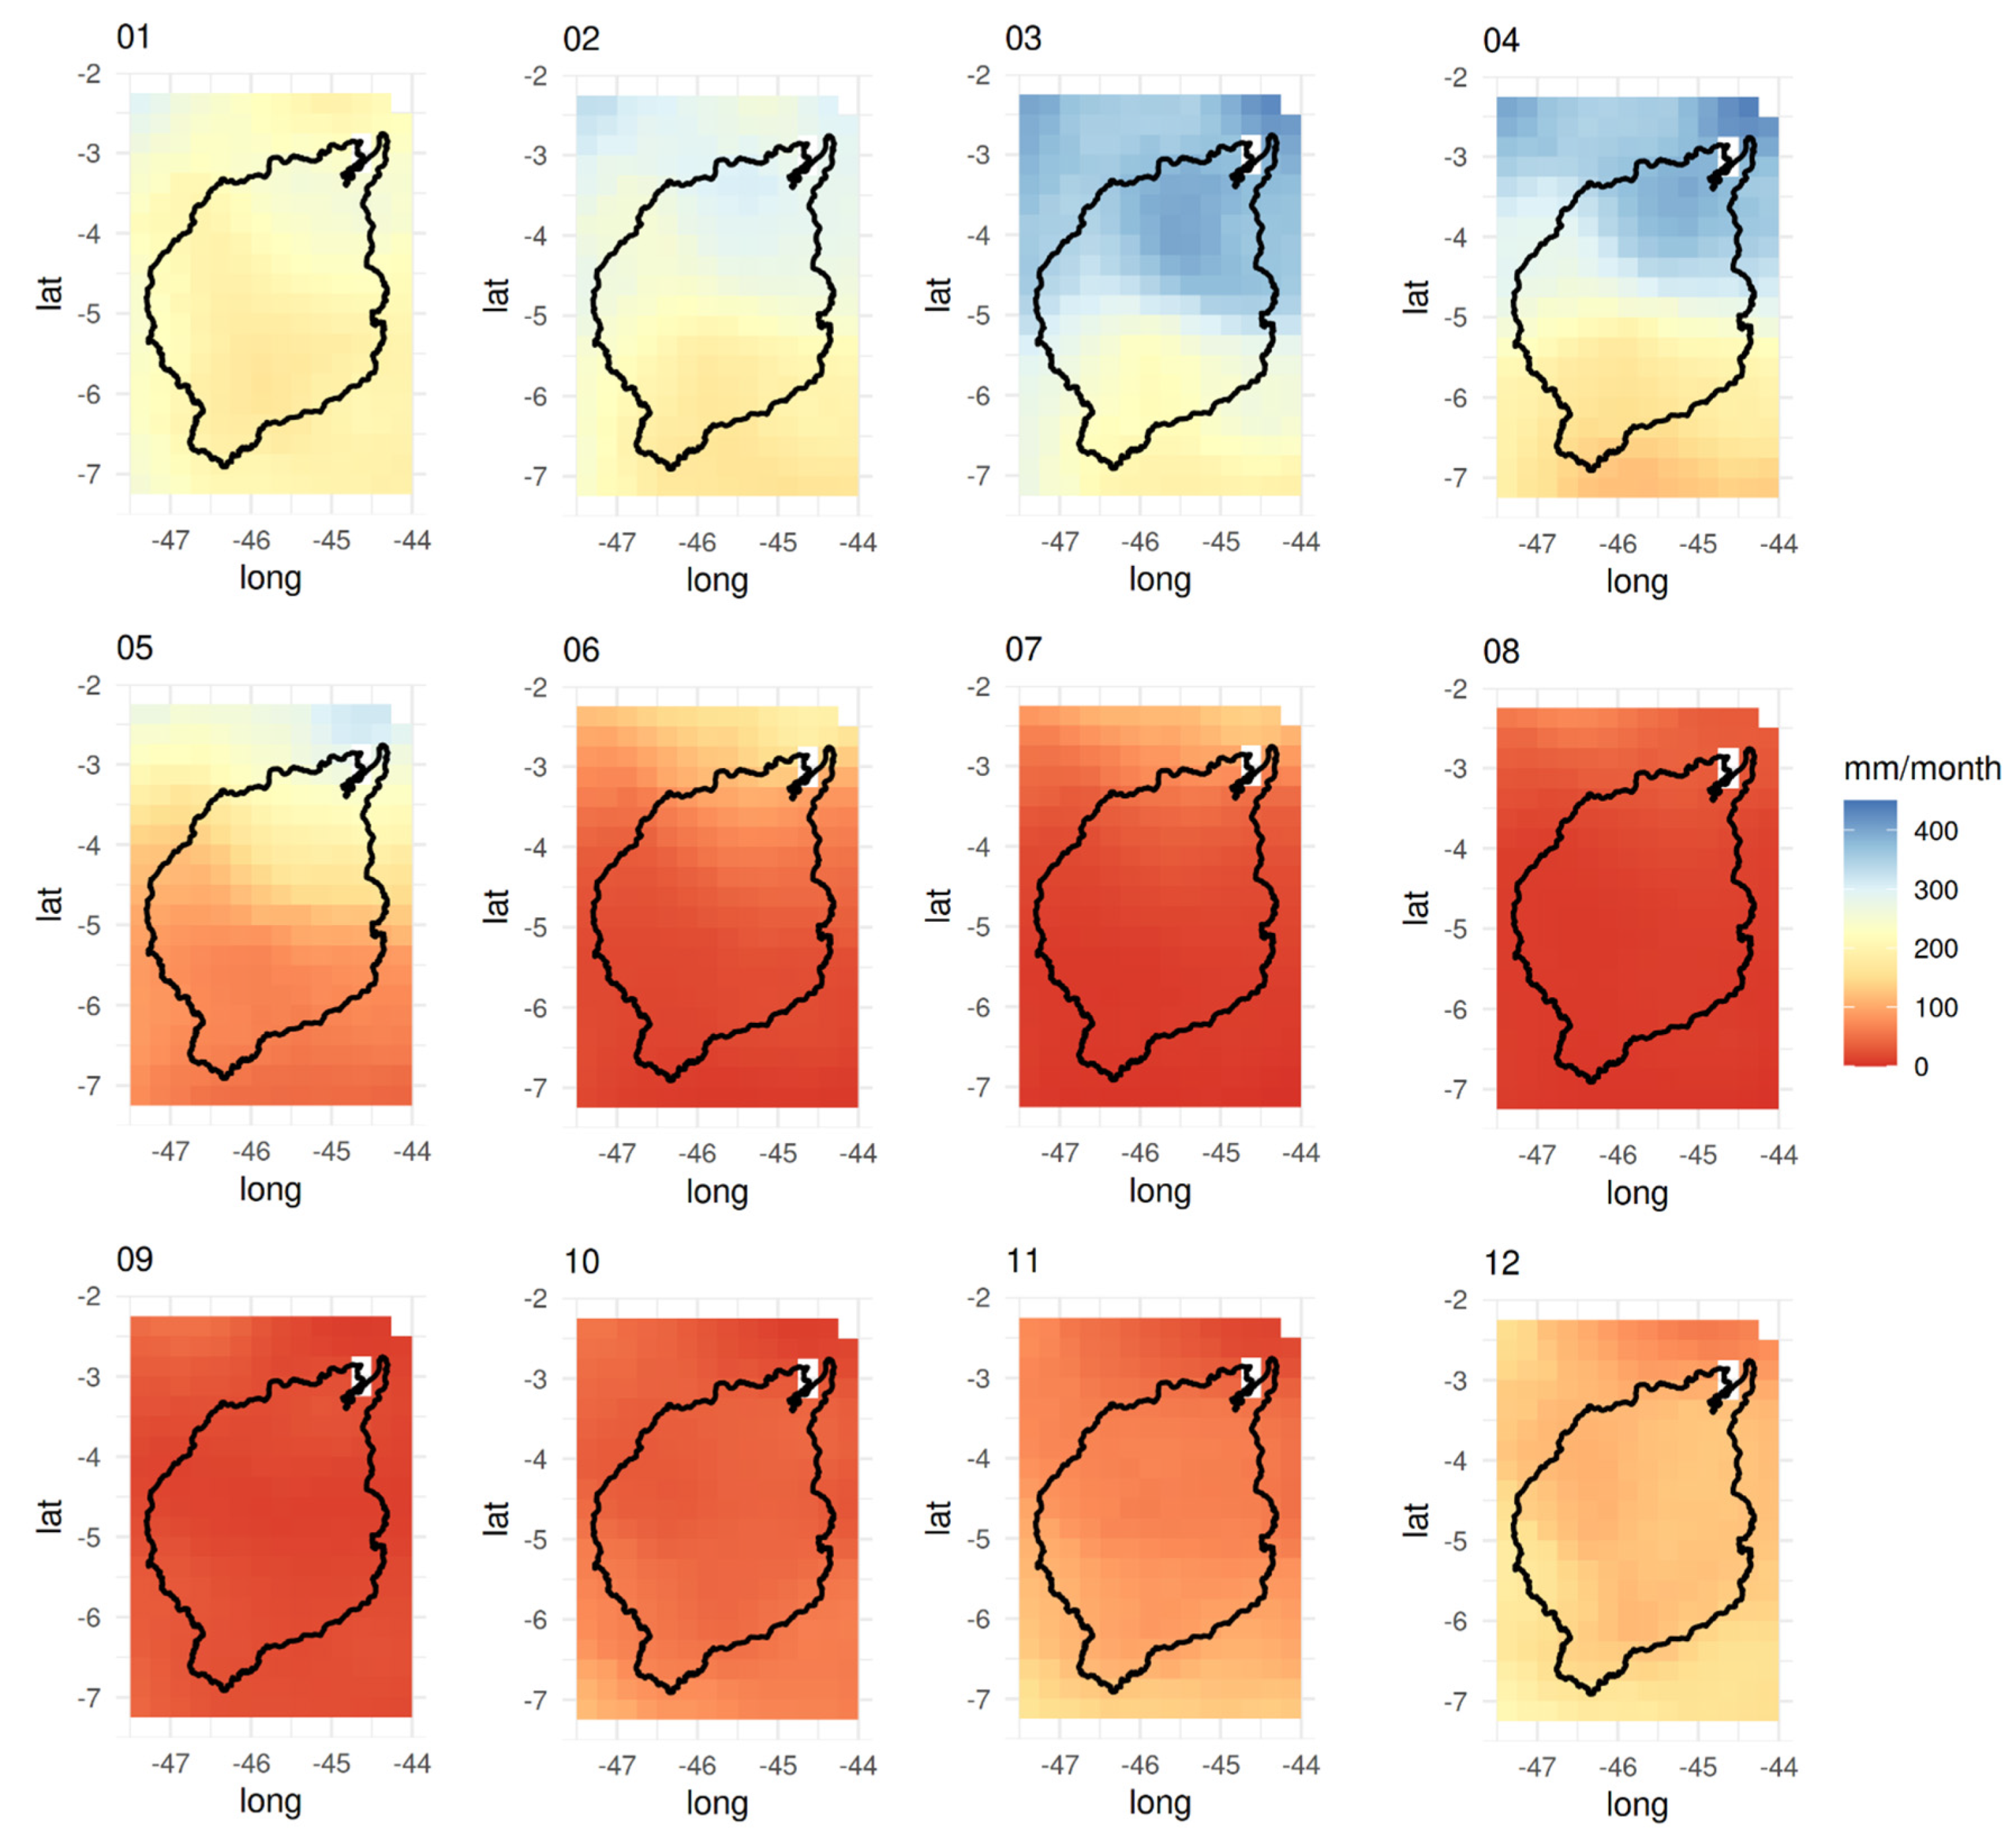
The following results and their respective discussions are divided between precipitation data from 1983 to 2013, data extracted for the comparison between gridBR and RES, and data on the climatological mean (mm/day), monthly means (mm/day), and extremes on the monthly scale (mm/day). Given the difficulty of accessing data in the region of the MDB, we had to characterize the monthly rainfall regime from 1983 to 2013 as shown in Figure 2.
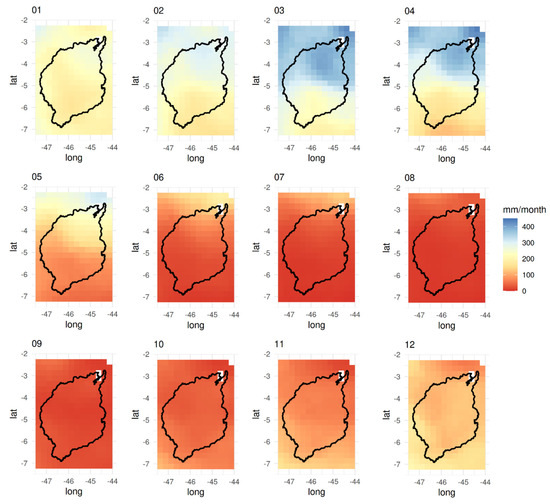
Figure 2.
Mean monthly rainfall from 1983 to 2013 from the gridBR reference outputs in the MDB region.
Figure 2 shows the strong seasonality of mean climatological precipitation in the basin, with a marked dry season between May and November and a wet season between December and April. The total mean precipitation ranges from 60 mm/month (JUL/AUG/SEP), covering almost the entire area of the basin, up to 400 mm/month (FEB/MAR/APR), occurring mainly in the northeastern portion, where the São Marcos Bay and the Ponta da Madeira port terminal are.
Regarding the spatial distribution, the central and southeastern regions of the basin have a lower precipitation volume (Figure 2), which coincides with the transition between the humid tropical and subhumid tropical climates in the MDB, caused by monsoon systems [28]. In the northwest and north, which are defined by a humid climate (Amazon biome), volumes of daily rainfall in the rainy periods are higher from December to May. The biome type can influence precipitation values. Rainfall in the MDB varies notably as a function of altitude. For the months of March and April (Figure 2), the values (which are greater than 300 mm) close to the outlet (close to the Ponta da Madeira Port) are greater than those upstream, the highest part of the MDB.
3.1. Climatological Mean
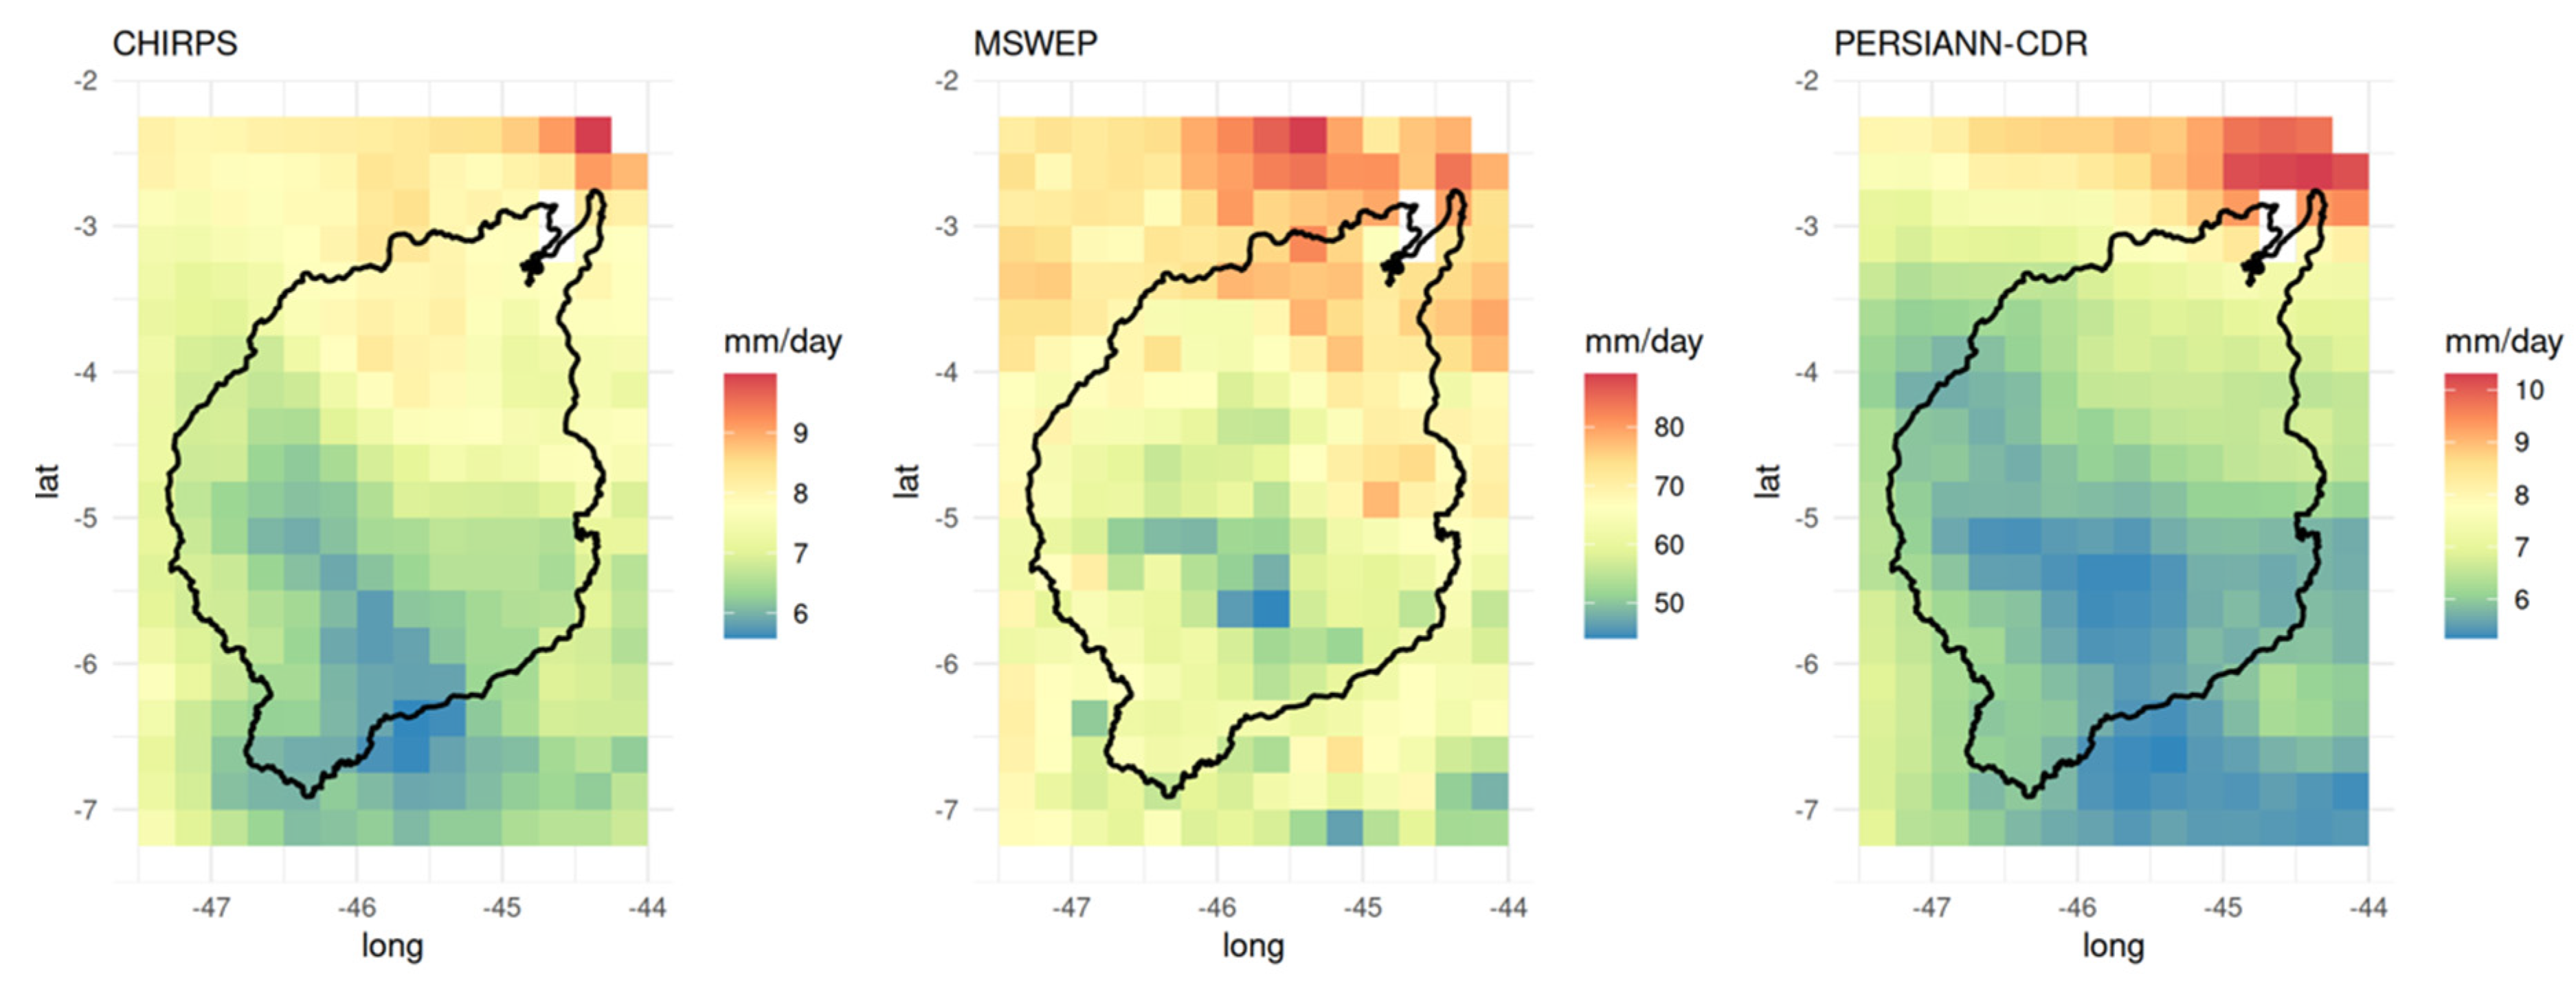
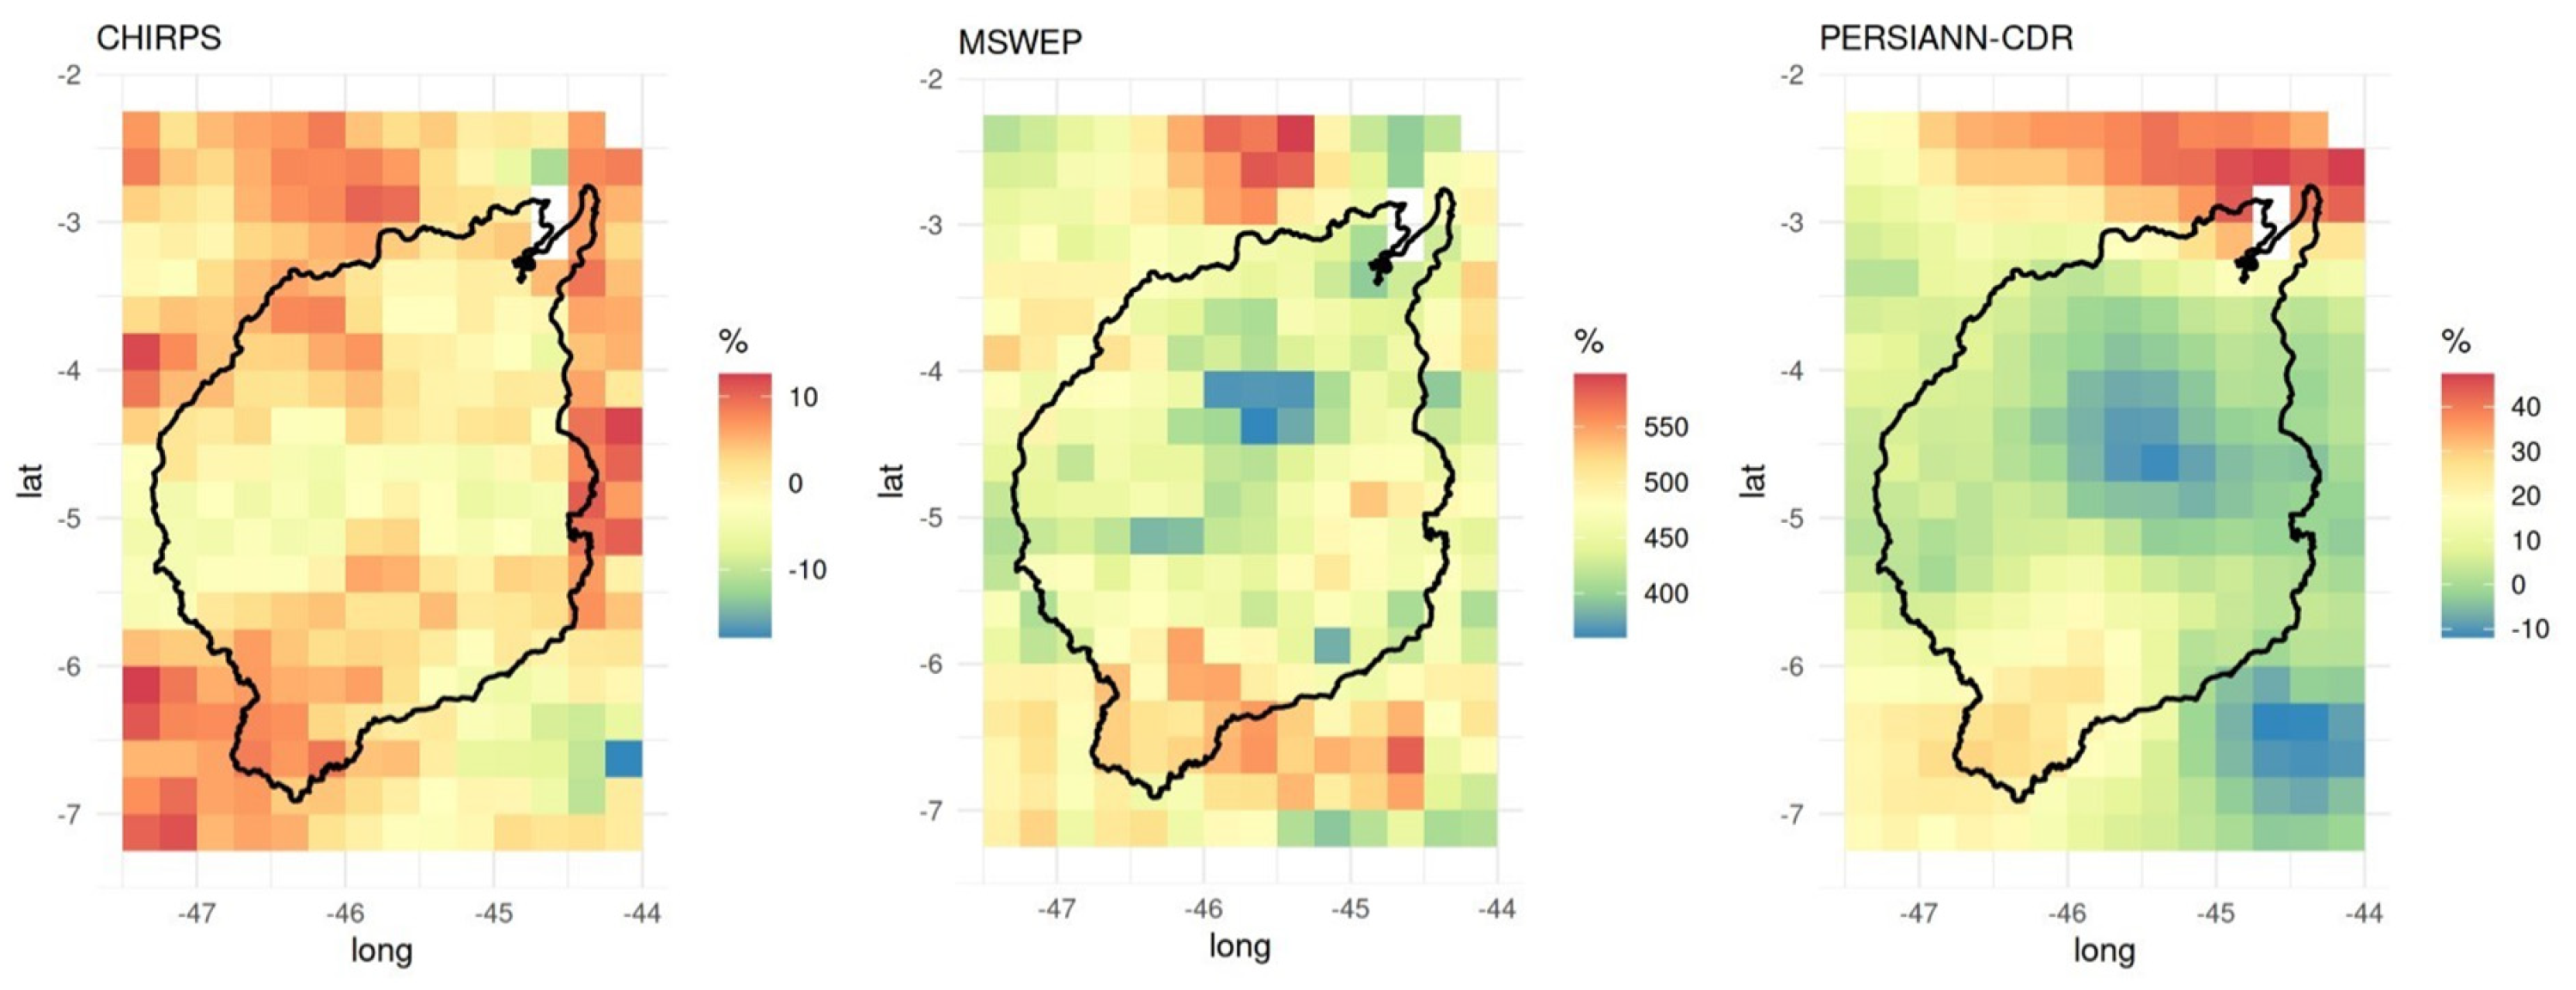
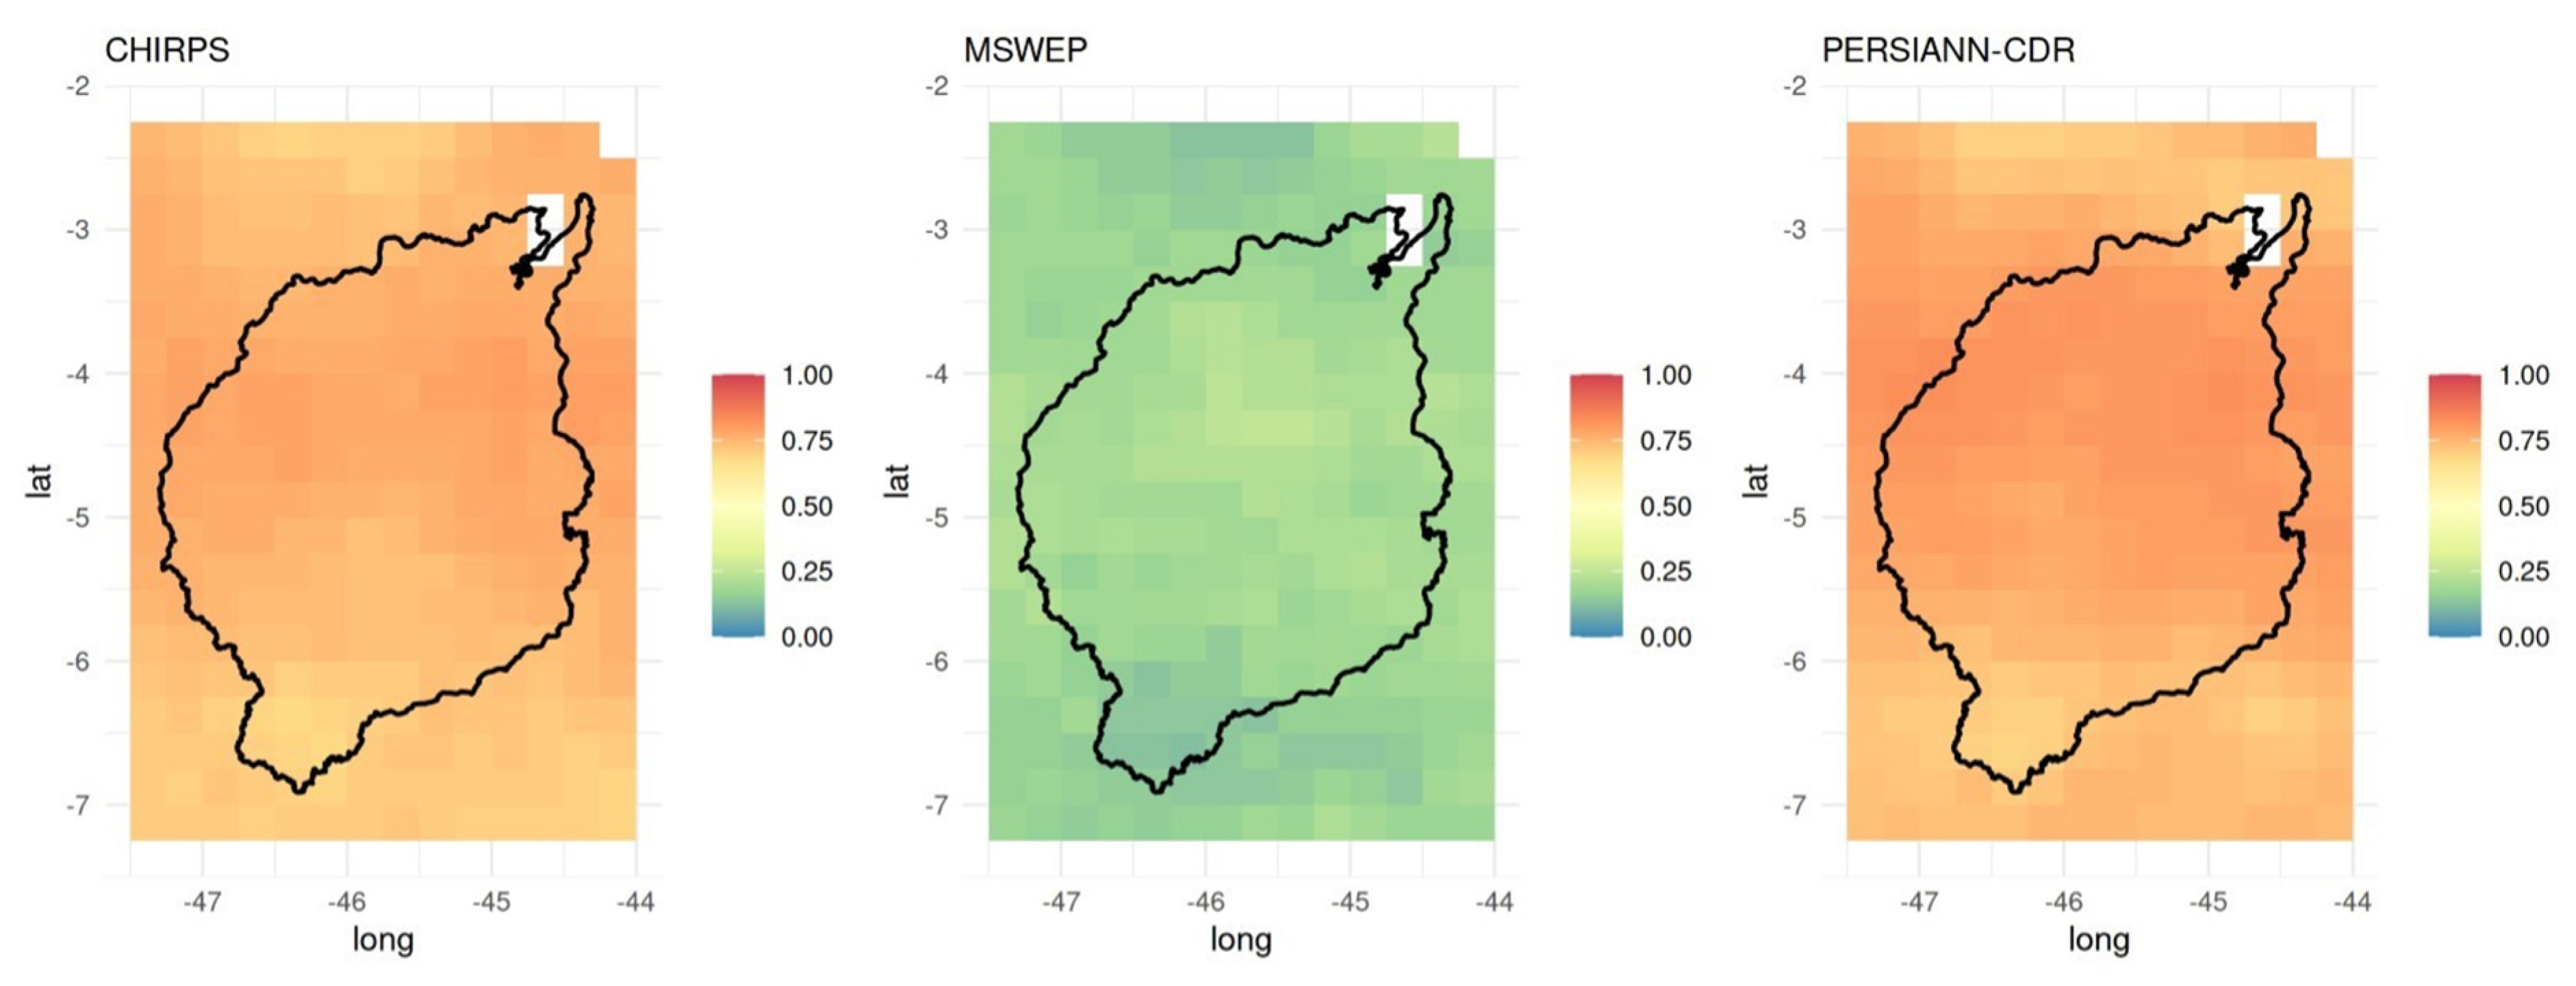
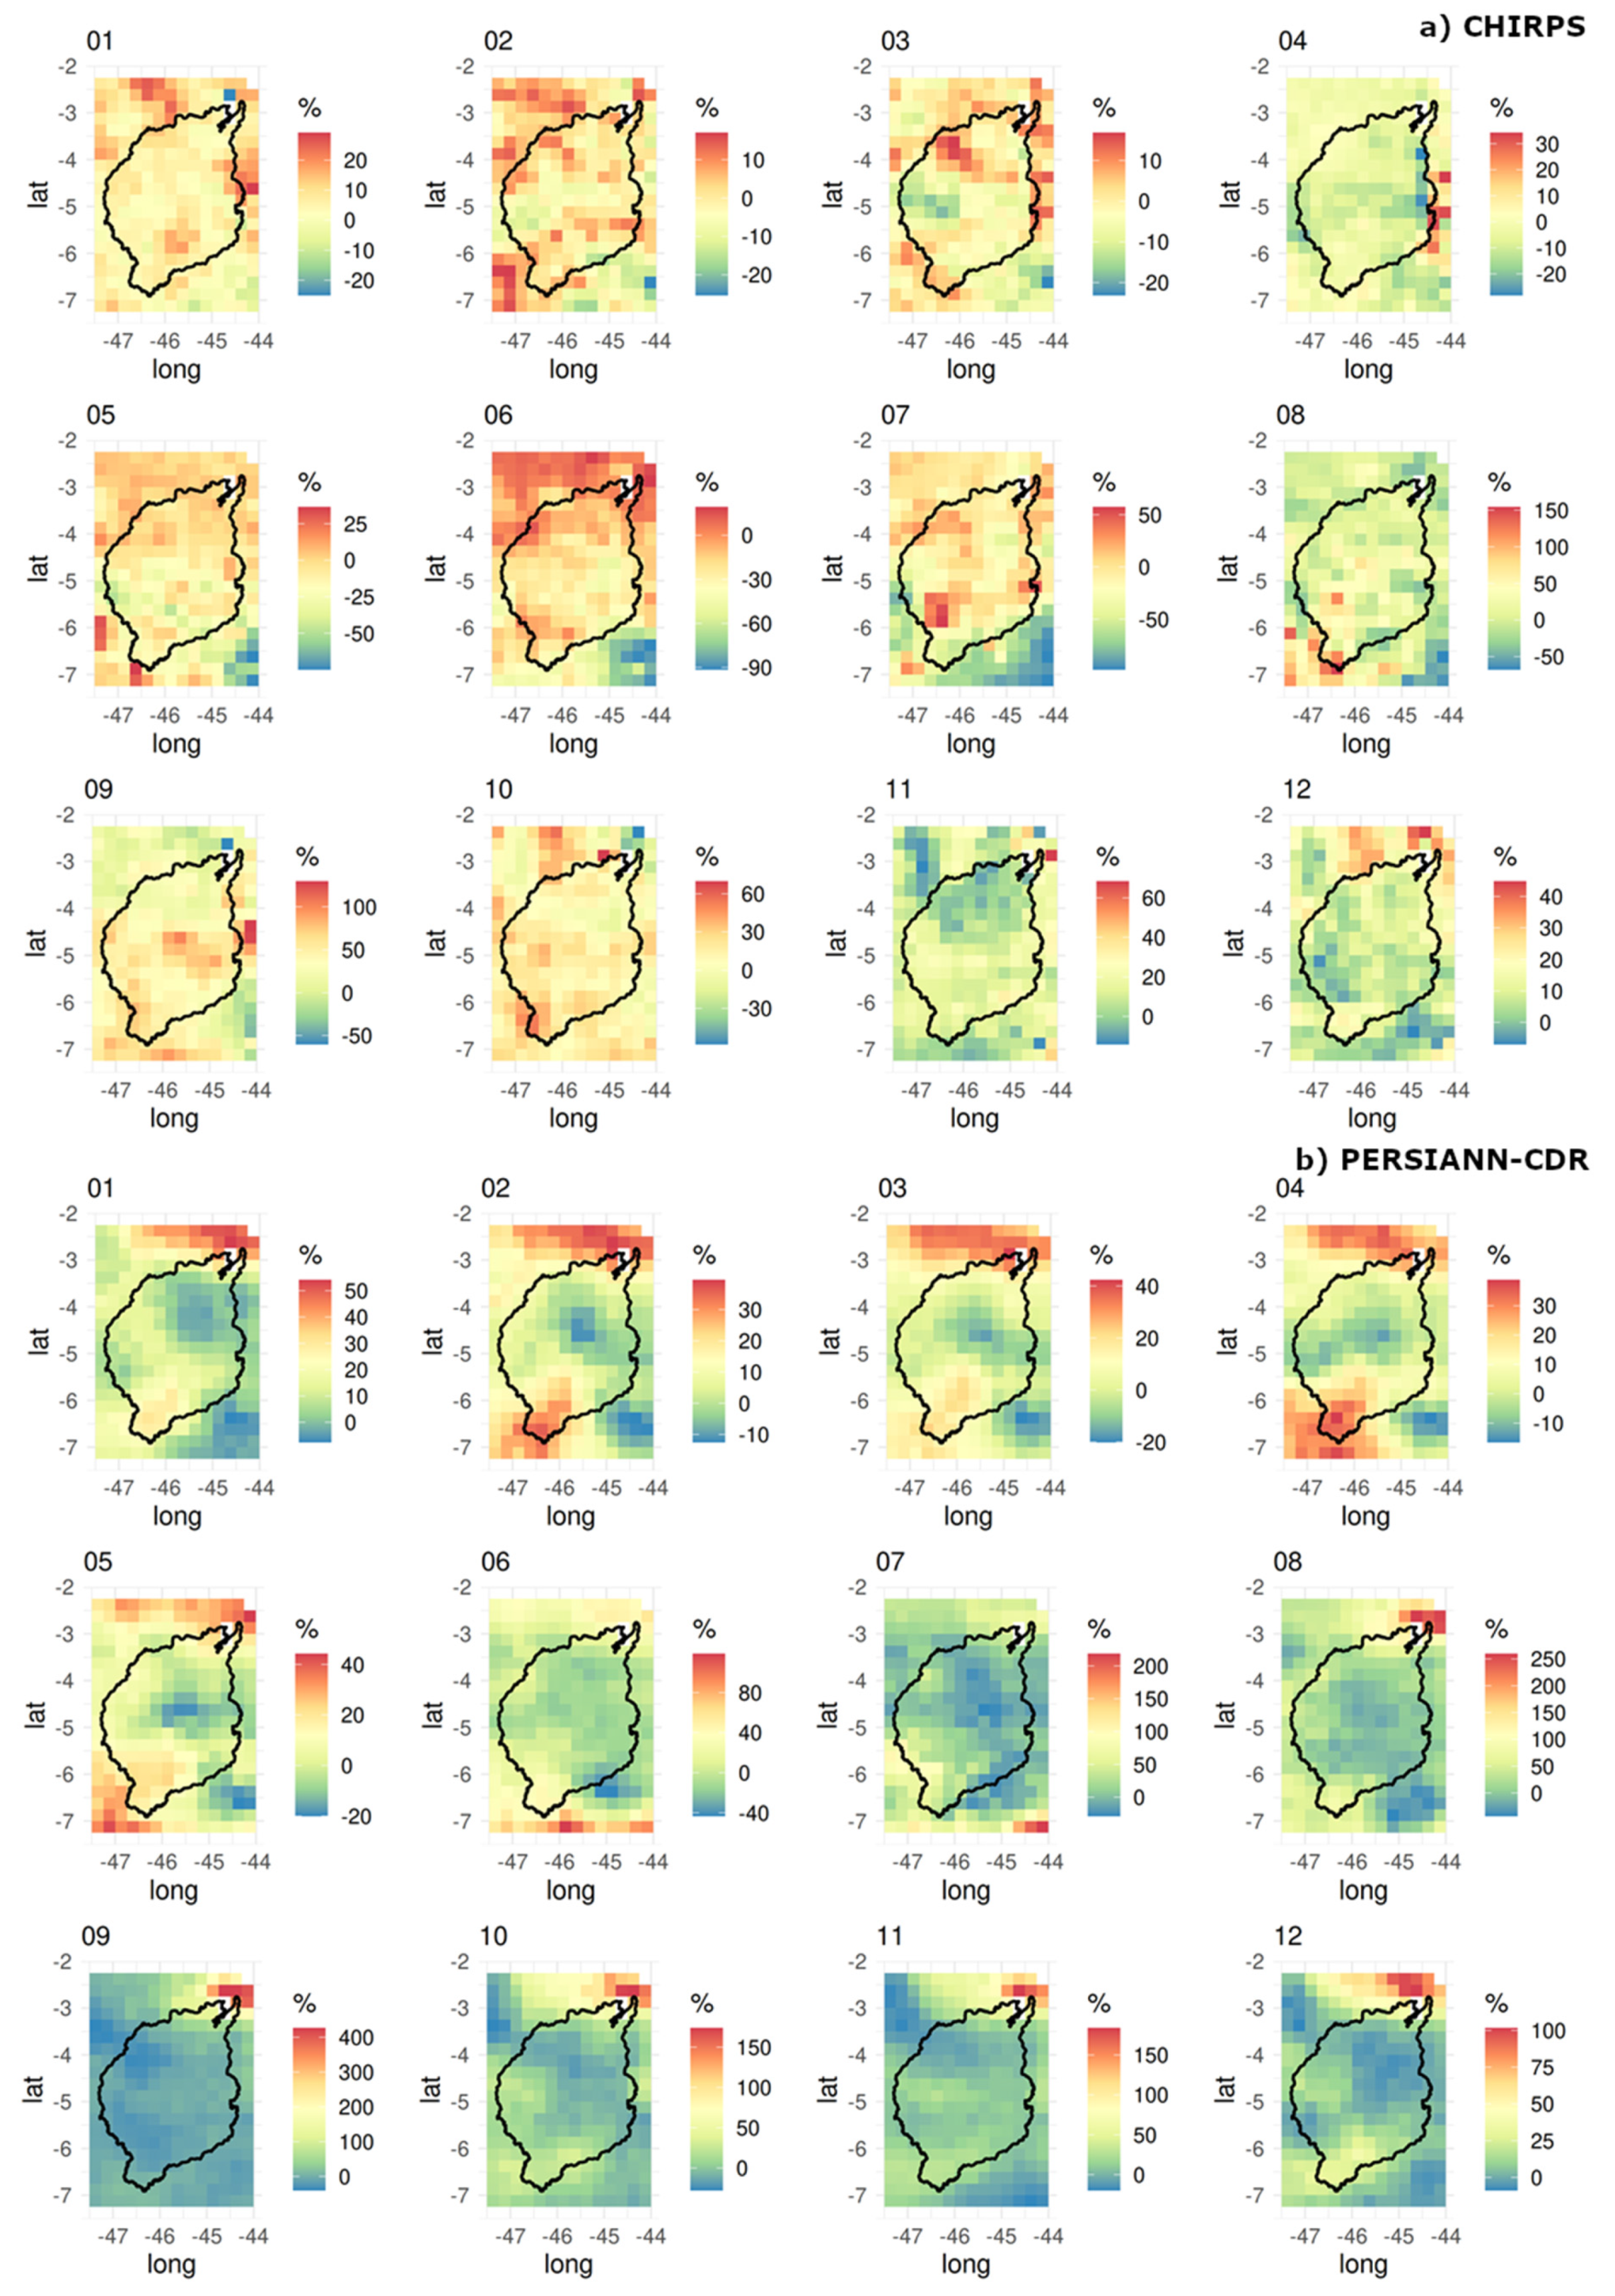
According to the comparison of the gridBR mean daily rainfall and values calculated from RES data, PERSIANN-CDR was the best database from 1983 to 2013 in the overall performance of the metrics (RMSE, Figure 3; pbias, Figure 4; Willmott’s d, Figure 5) as a function of the climatological mean. The values of MSWEP overestimated the mean values in the entire MDB for all the metrics (Figure 3, Figure 4 and Figure 5). In the RMSE evaluation (Figure 3), the CHIRPS and PERSIANN-CDR had error patterns that were similar in terms of the spatial pattern of the metric when compared to the mean rainfall pattern for each month (Figure 2). There was compatibility between smaller RMSE errors by both CHIRPS and the PERSIANN-CDR (both close to ~6 mm/day in Figure 3) for the central and southern regions of the MDB. In the evaluation of pbias, the PERSIANN-CDR (Figure 4) underestimated some means compared to the daily data from gridBR, especially in the central region of the MDB. The values for Willmott’s d (Figure 5) were higher than 0.75 by PERSIANN-CDR, between 0.6 and 0.75 by CHIRPS, and below 0.10 by MSWEP. Due to the high level of uncertainty of MSWEP, as shown by its pbias, RMSE, and d, the results of its RES calculations for the monthly means and monthly rx1day are presented in Supplementary material II.
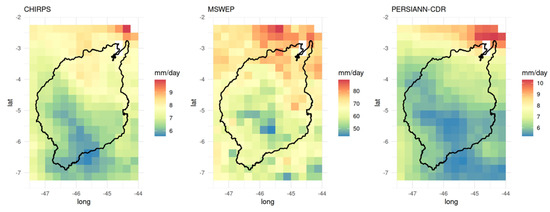
Figure 3.
RMSE between gridBR and RES products for the total daily mean from 1983 to 2013. Each SRE has different representative scales.
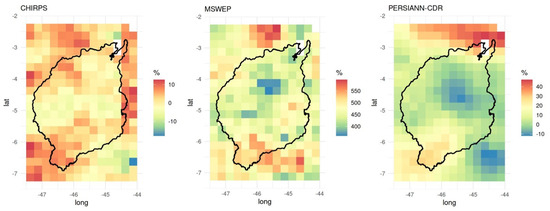
Figure 4.
pbias between gridBR and RES products for the total daily mean from 1983 to 2013. Each SRE has different representative scales.
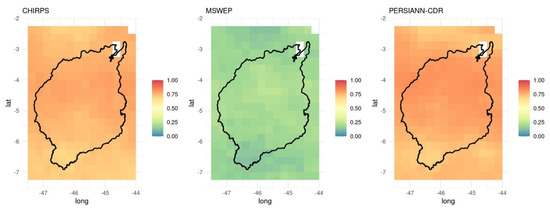
Figure 5.
Willmott’s d between gridBR and RES products for the total daily mean from 1983 to 2013.
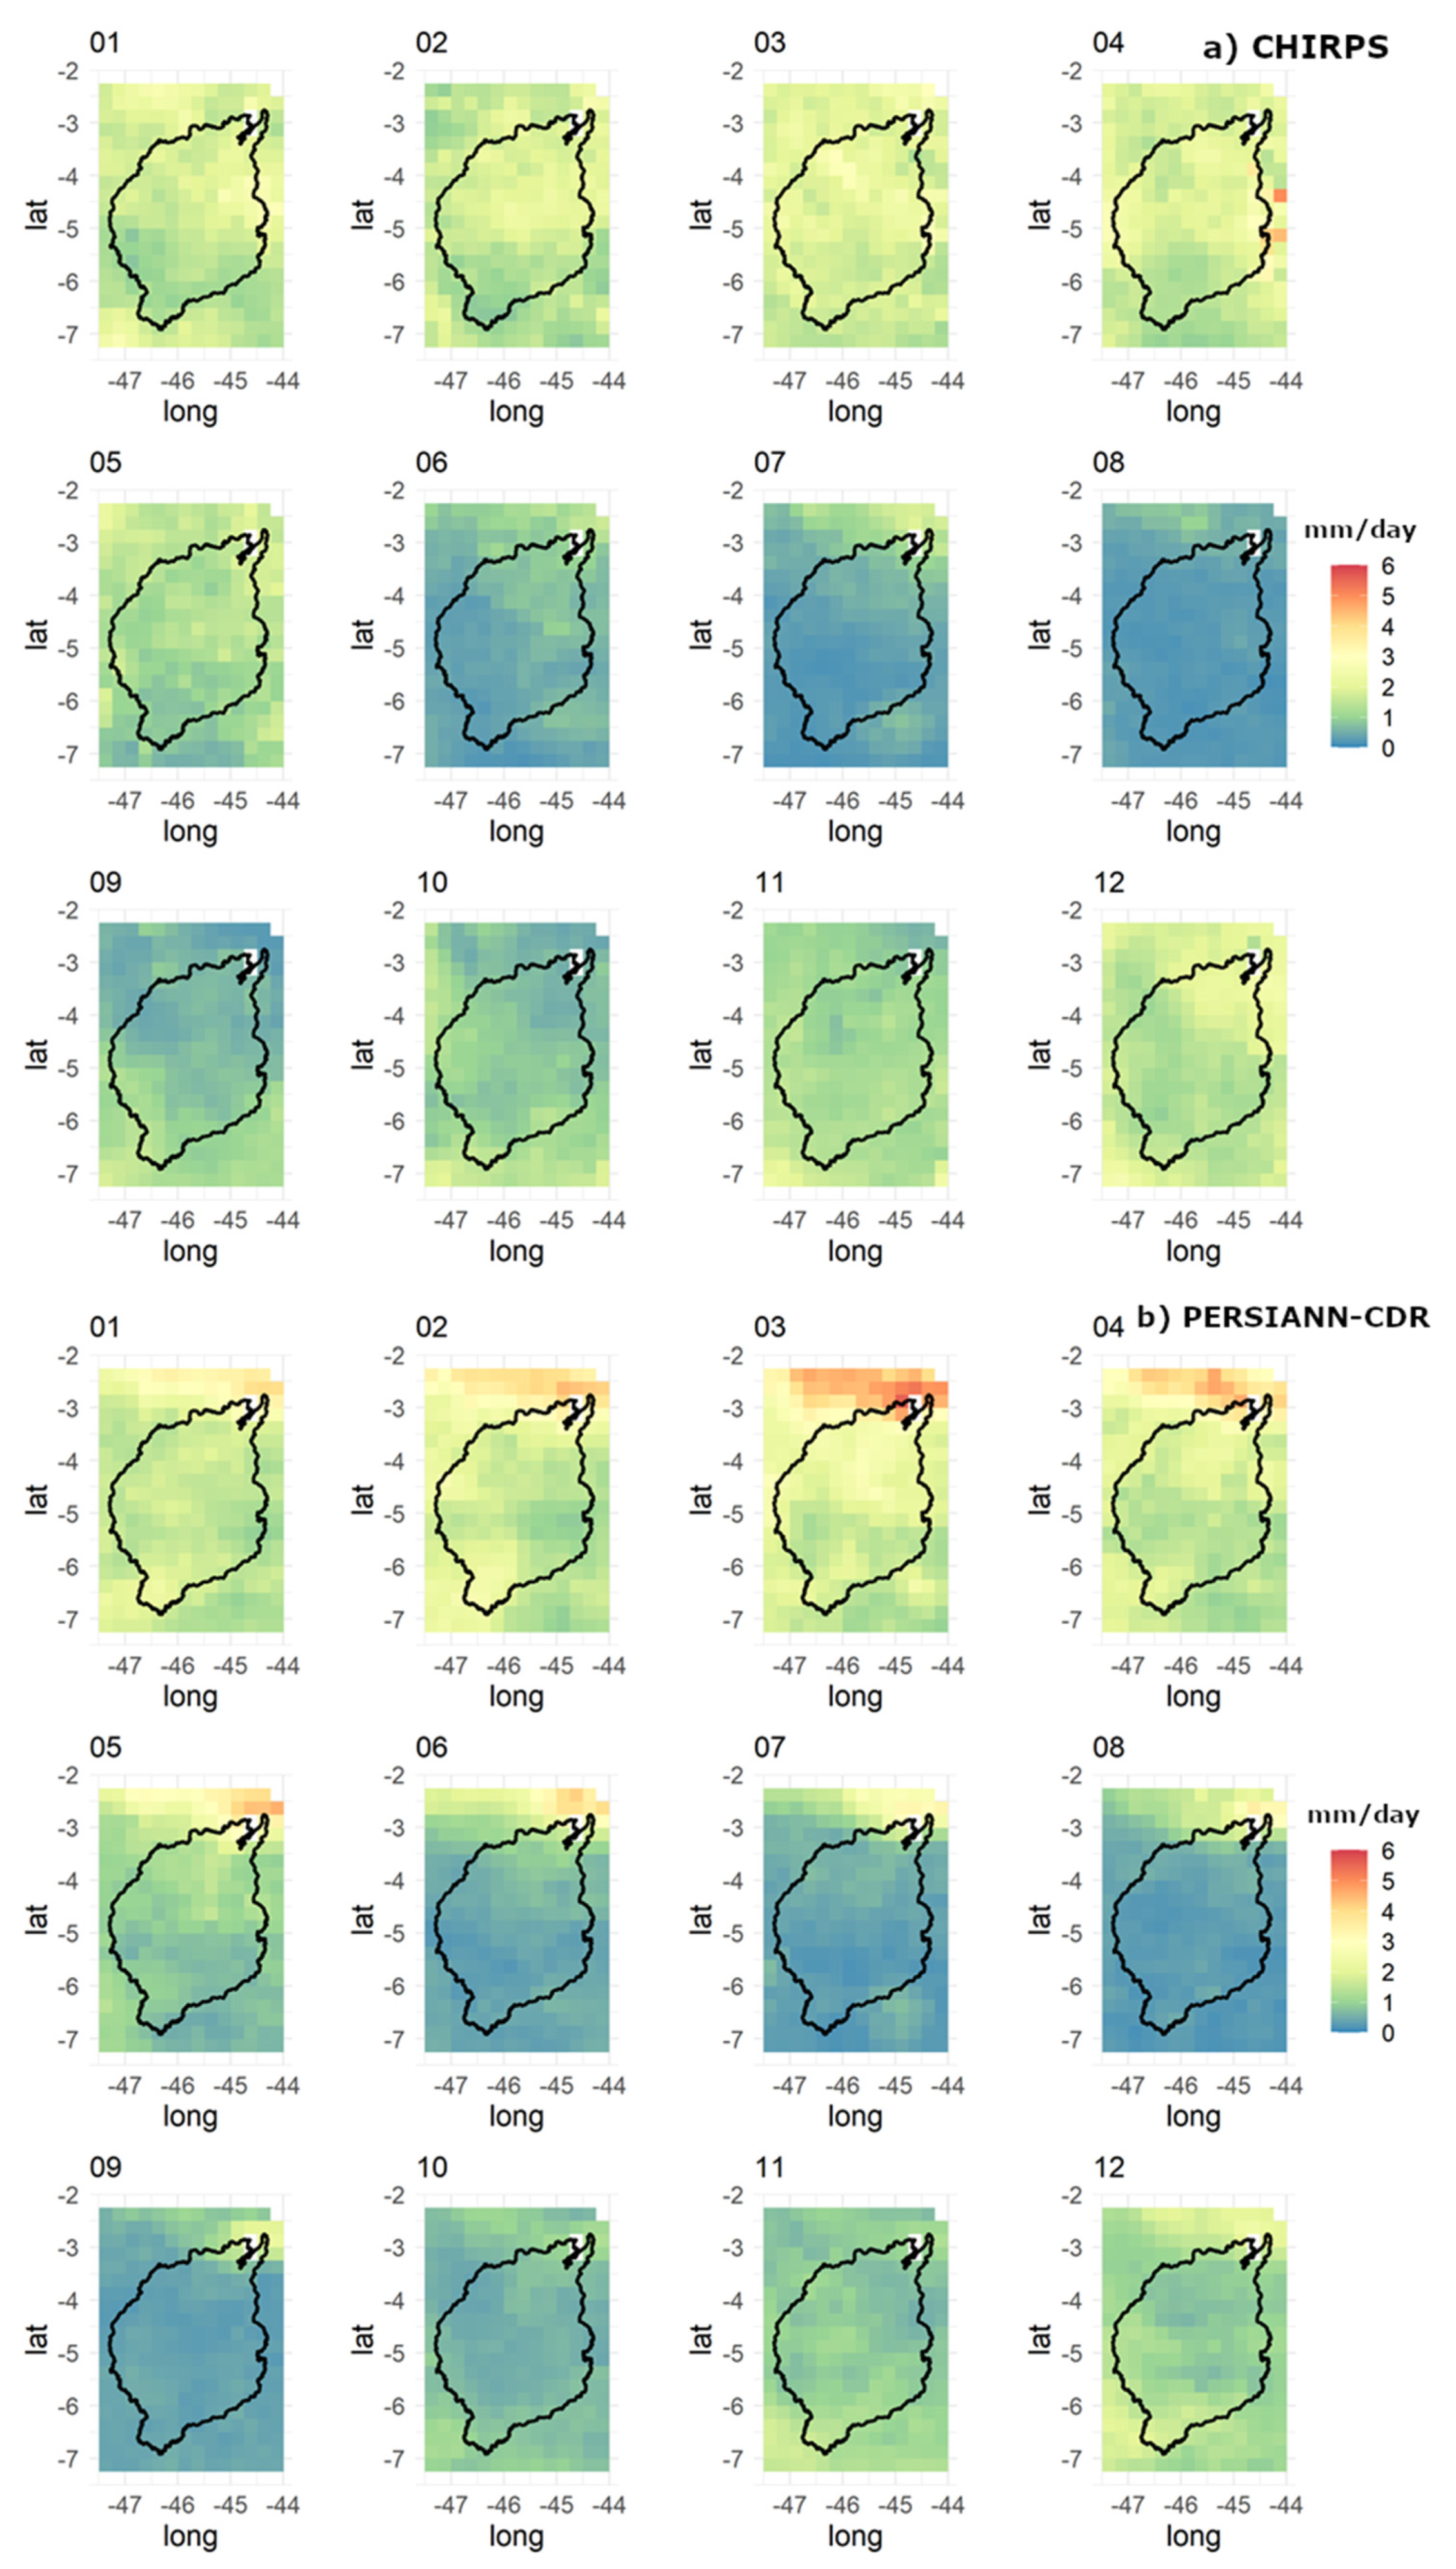
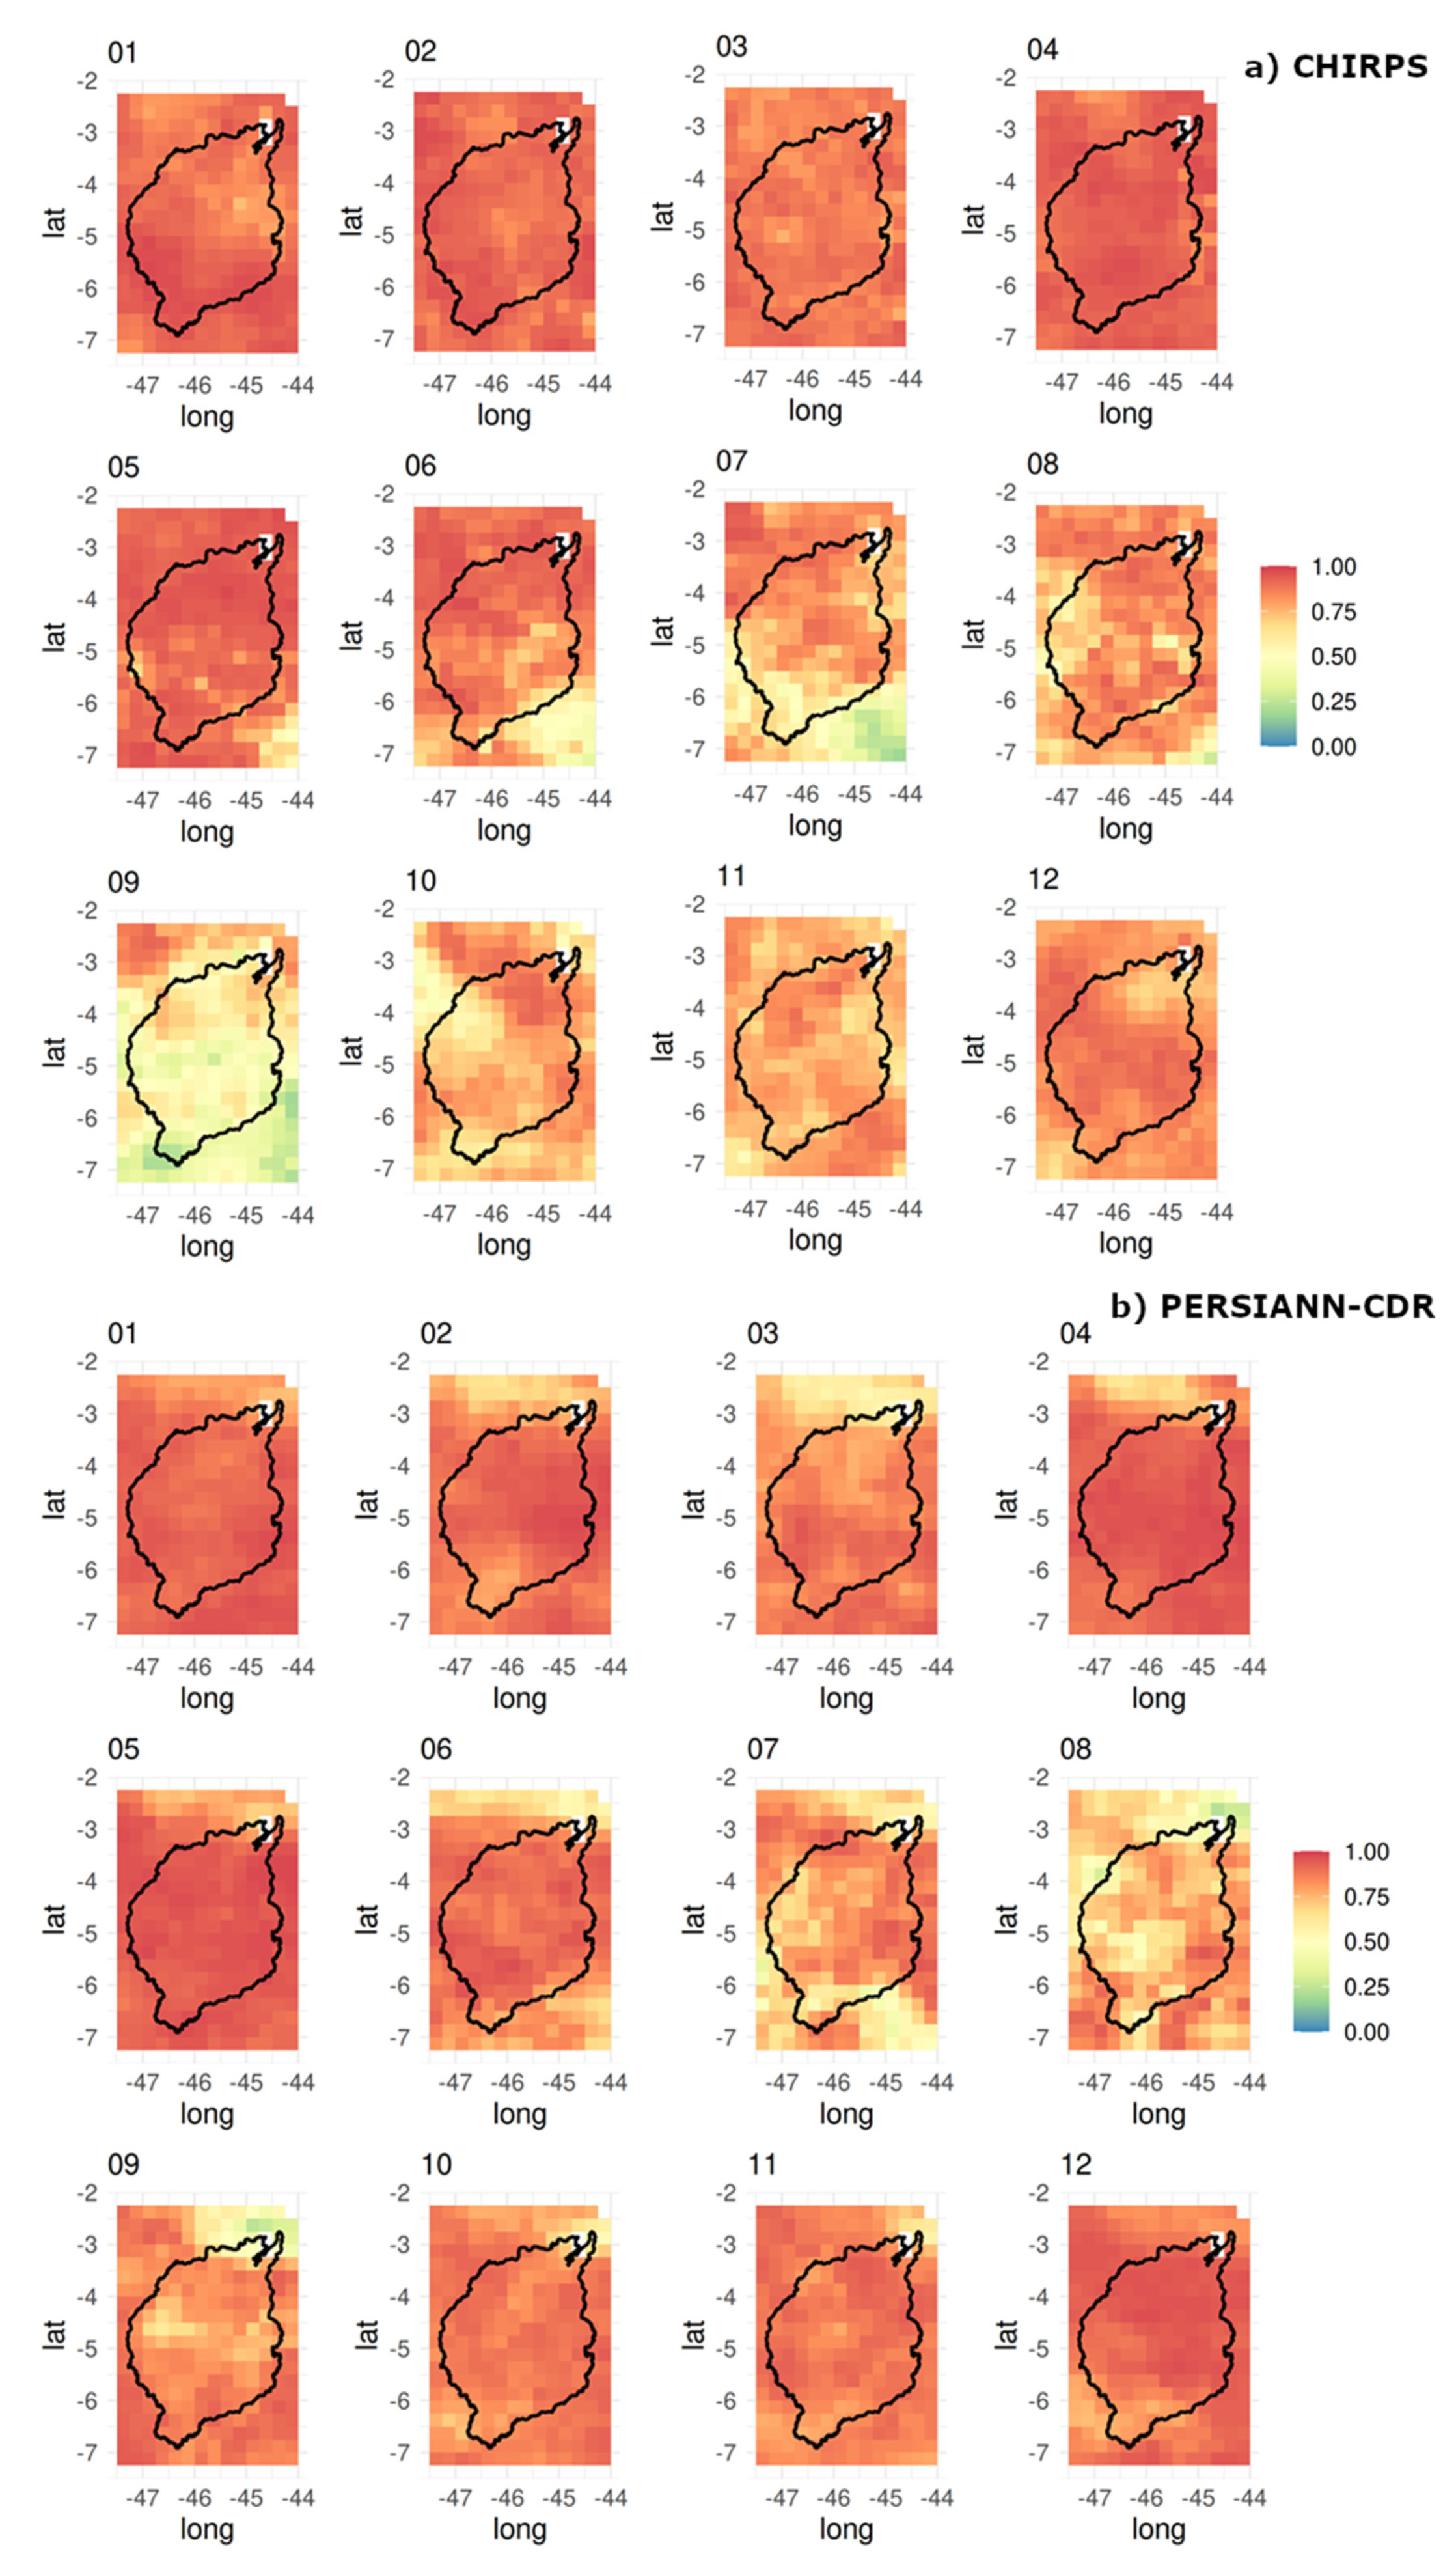
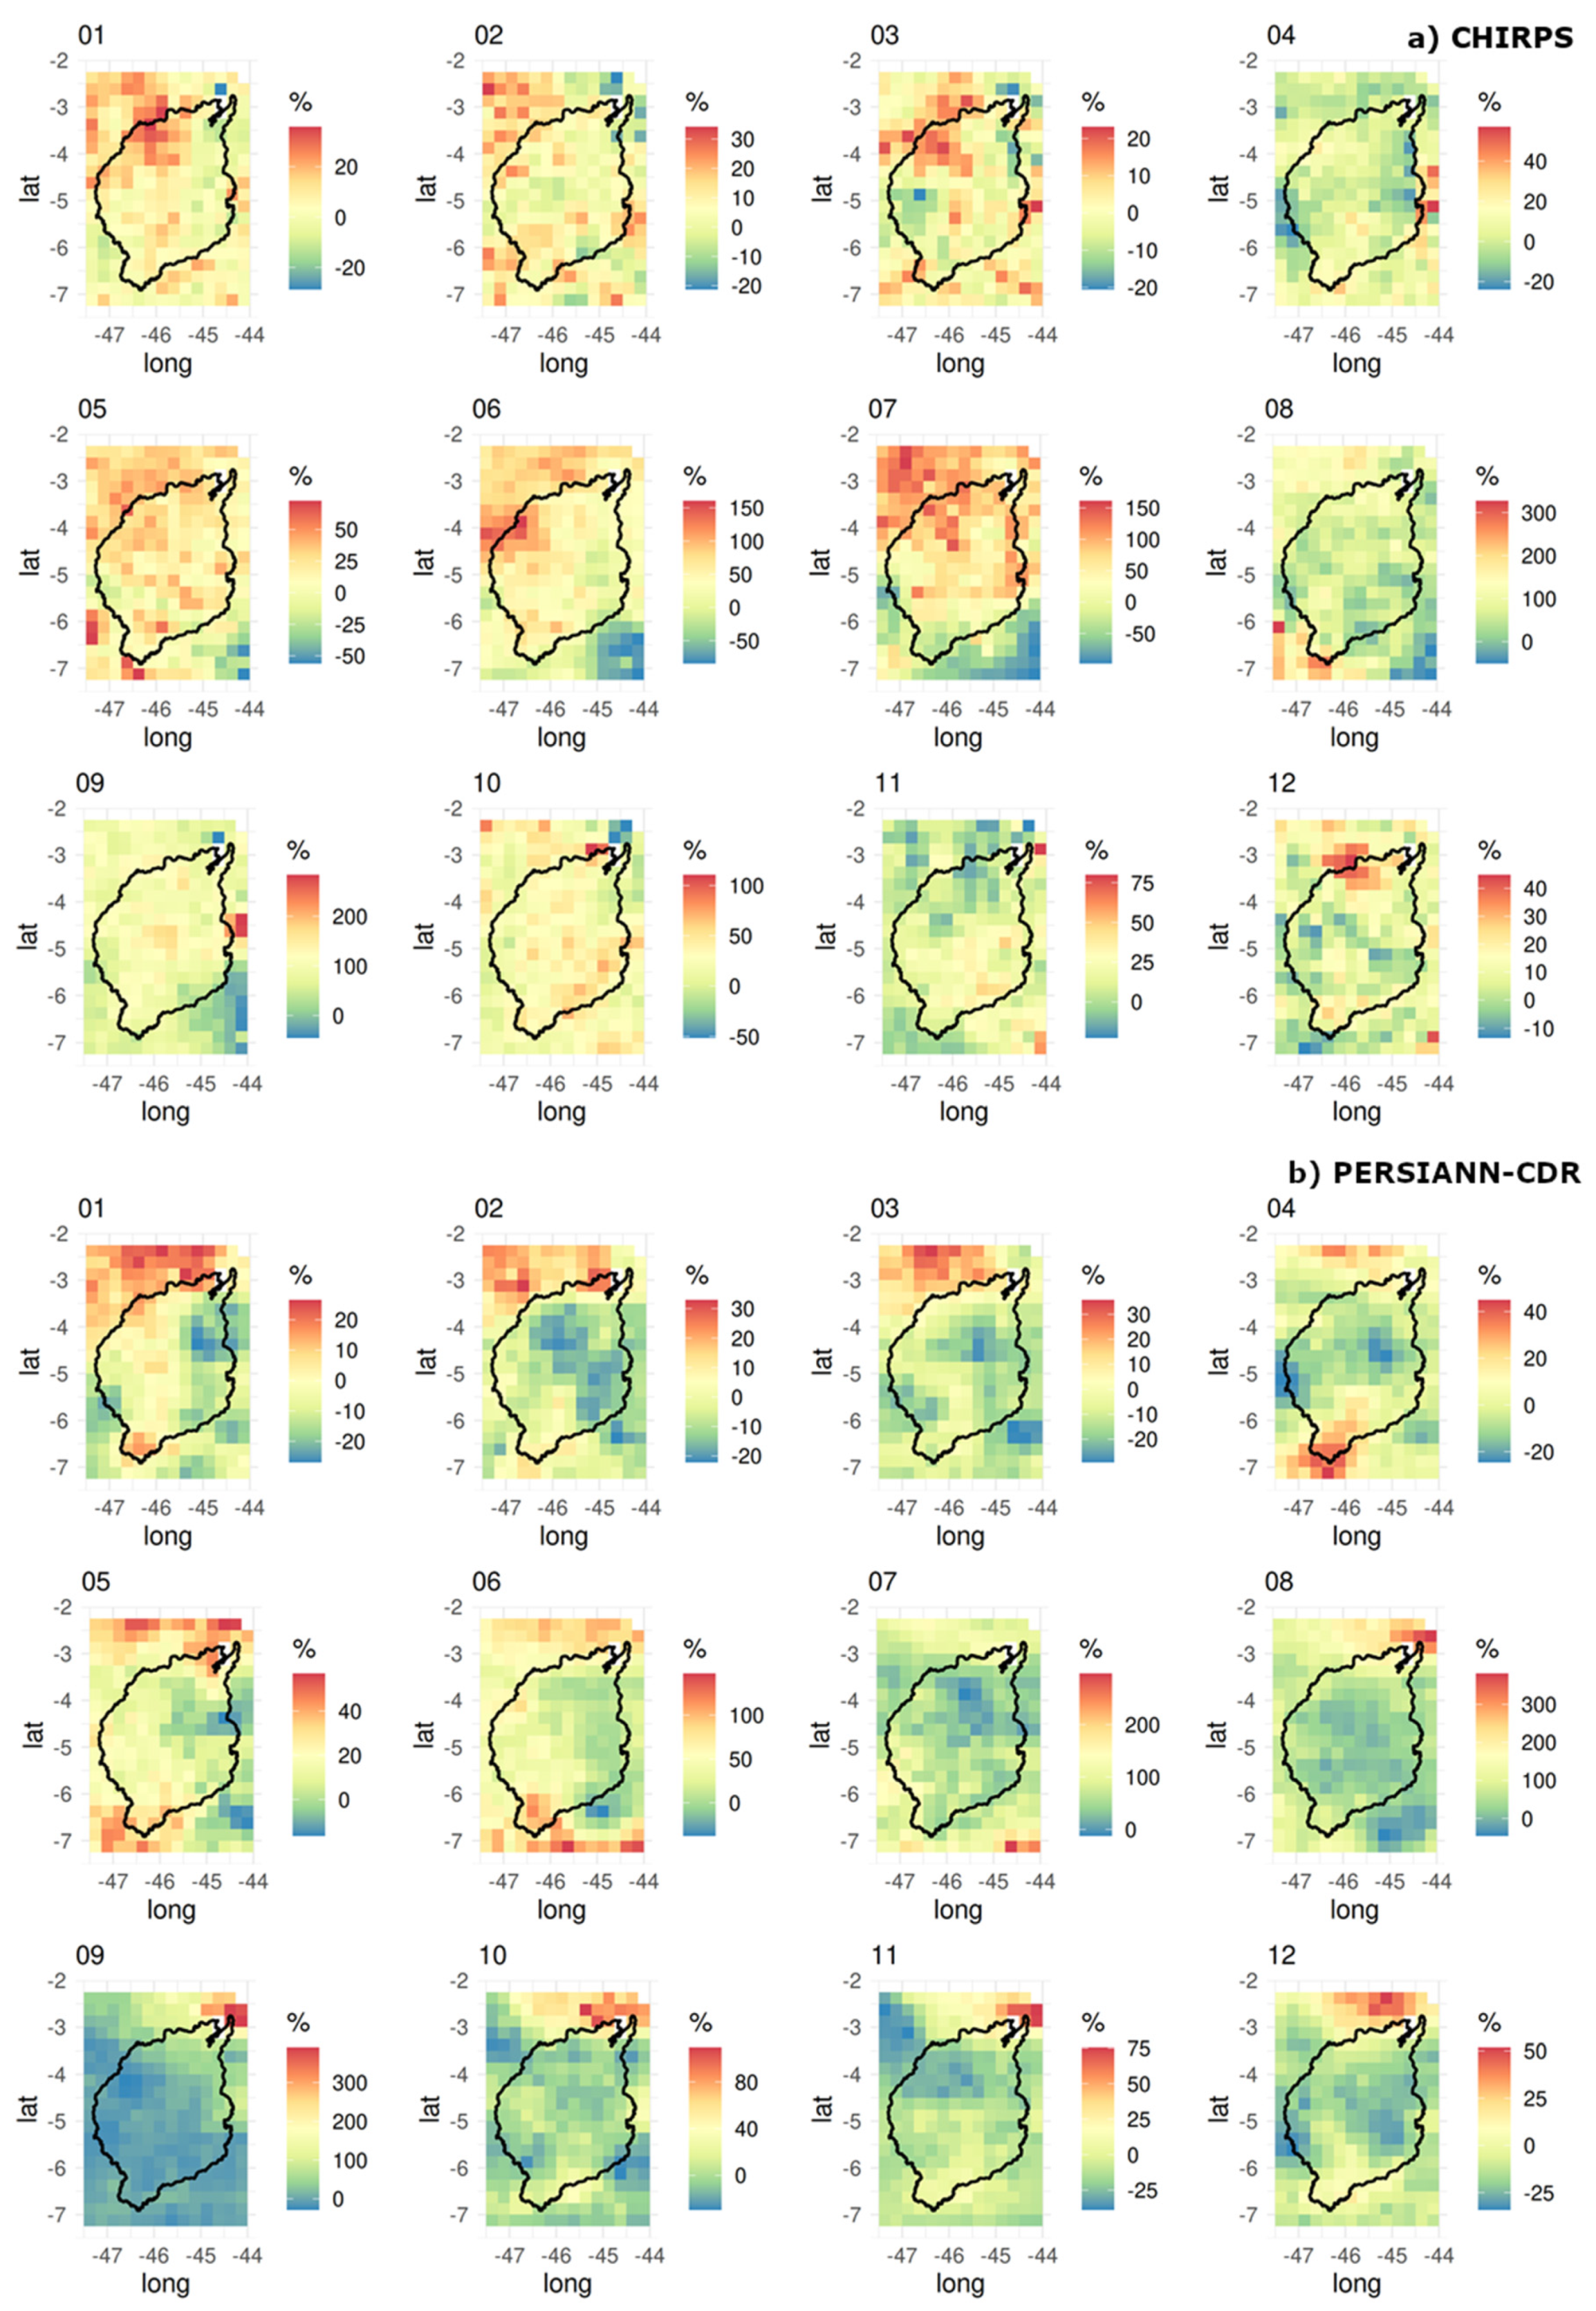
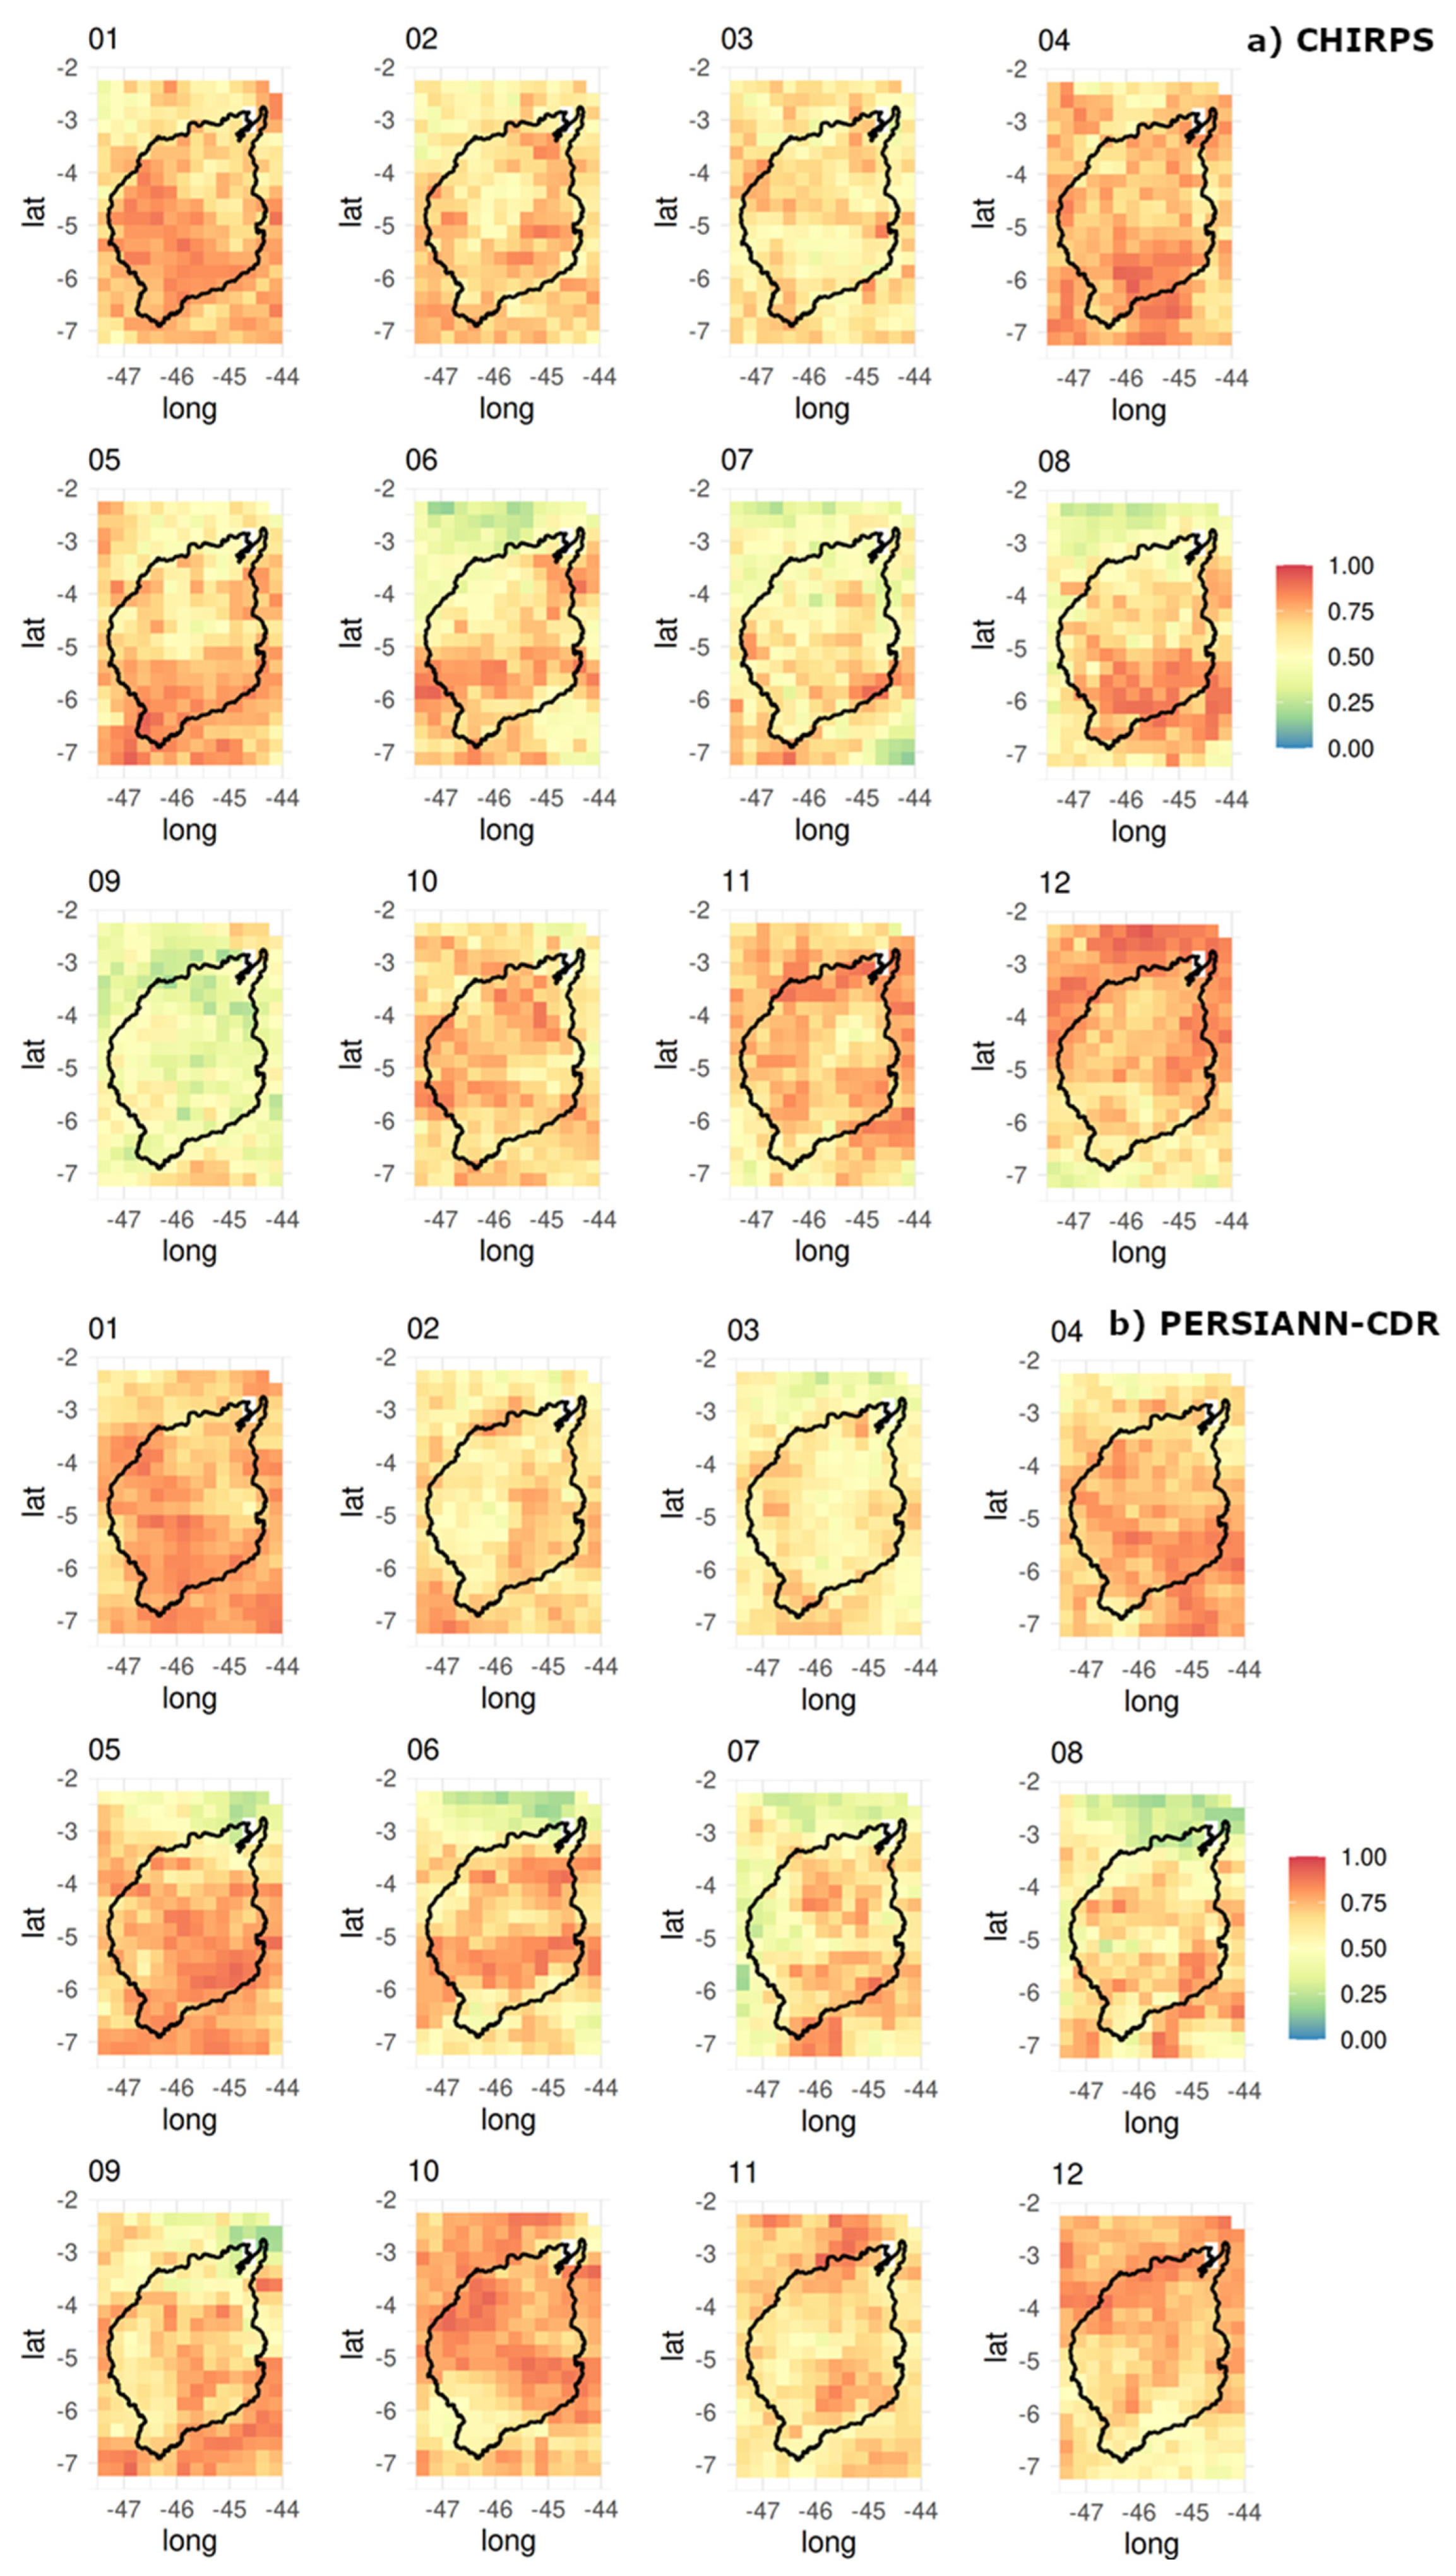
Given the comparison of the monthly mean between the gridBR and the RES products for the metrics pbias (Figure 6), RMSE (Figure 7), and Willmott’s d (Figure 8), the bests RES products were CHIRPS and PERSIANN-CDR in the representation of mean monthly rainfall in the MDB. In general, MSWEP (Supplementary material II) overestimated the MDB mean rainfall values. For the rainy months—December to May—CHIRPS (Figure 6) showed a relative error variation in mean rainfall values of up to 15%, except in April, when the pbias was negative (between 0 and −20%); this indicates a possible underestimation of the mean rainfall in one of the rainiest months in the MDB. The discrepancy between the pbias calculated from the gridBR and the PERSIANN-CDR data (Figure 6) was smaller for the rainy months, whereas this RES product did not represent well the mean of the days without rain in the dry months (June to November).
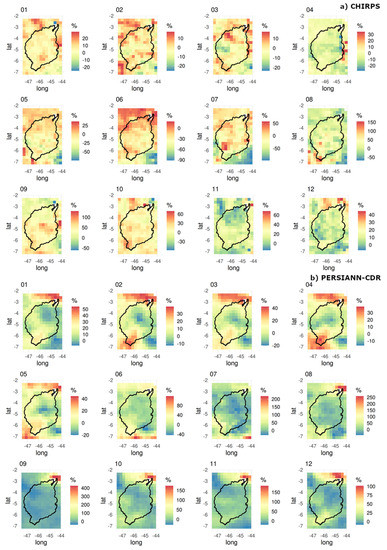
Figure 6.
Mean monthly pbias (%) (gridBR × CHIRPS (a) and gridBR × PERSIANN-CDR (b)) from January (01) to December (12) 1983 to 2013. Each SRE and each month for pbias (%) have different representative scales.
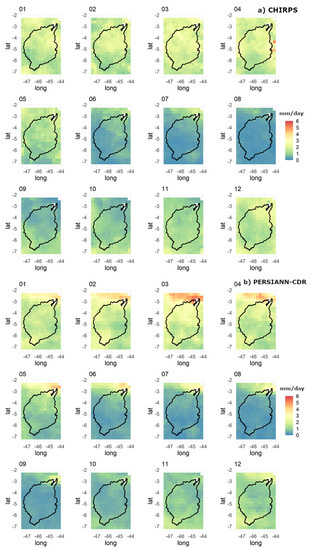
Figure 7.
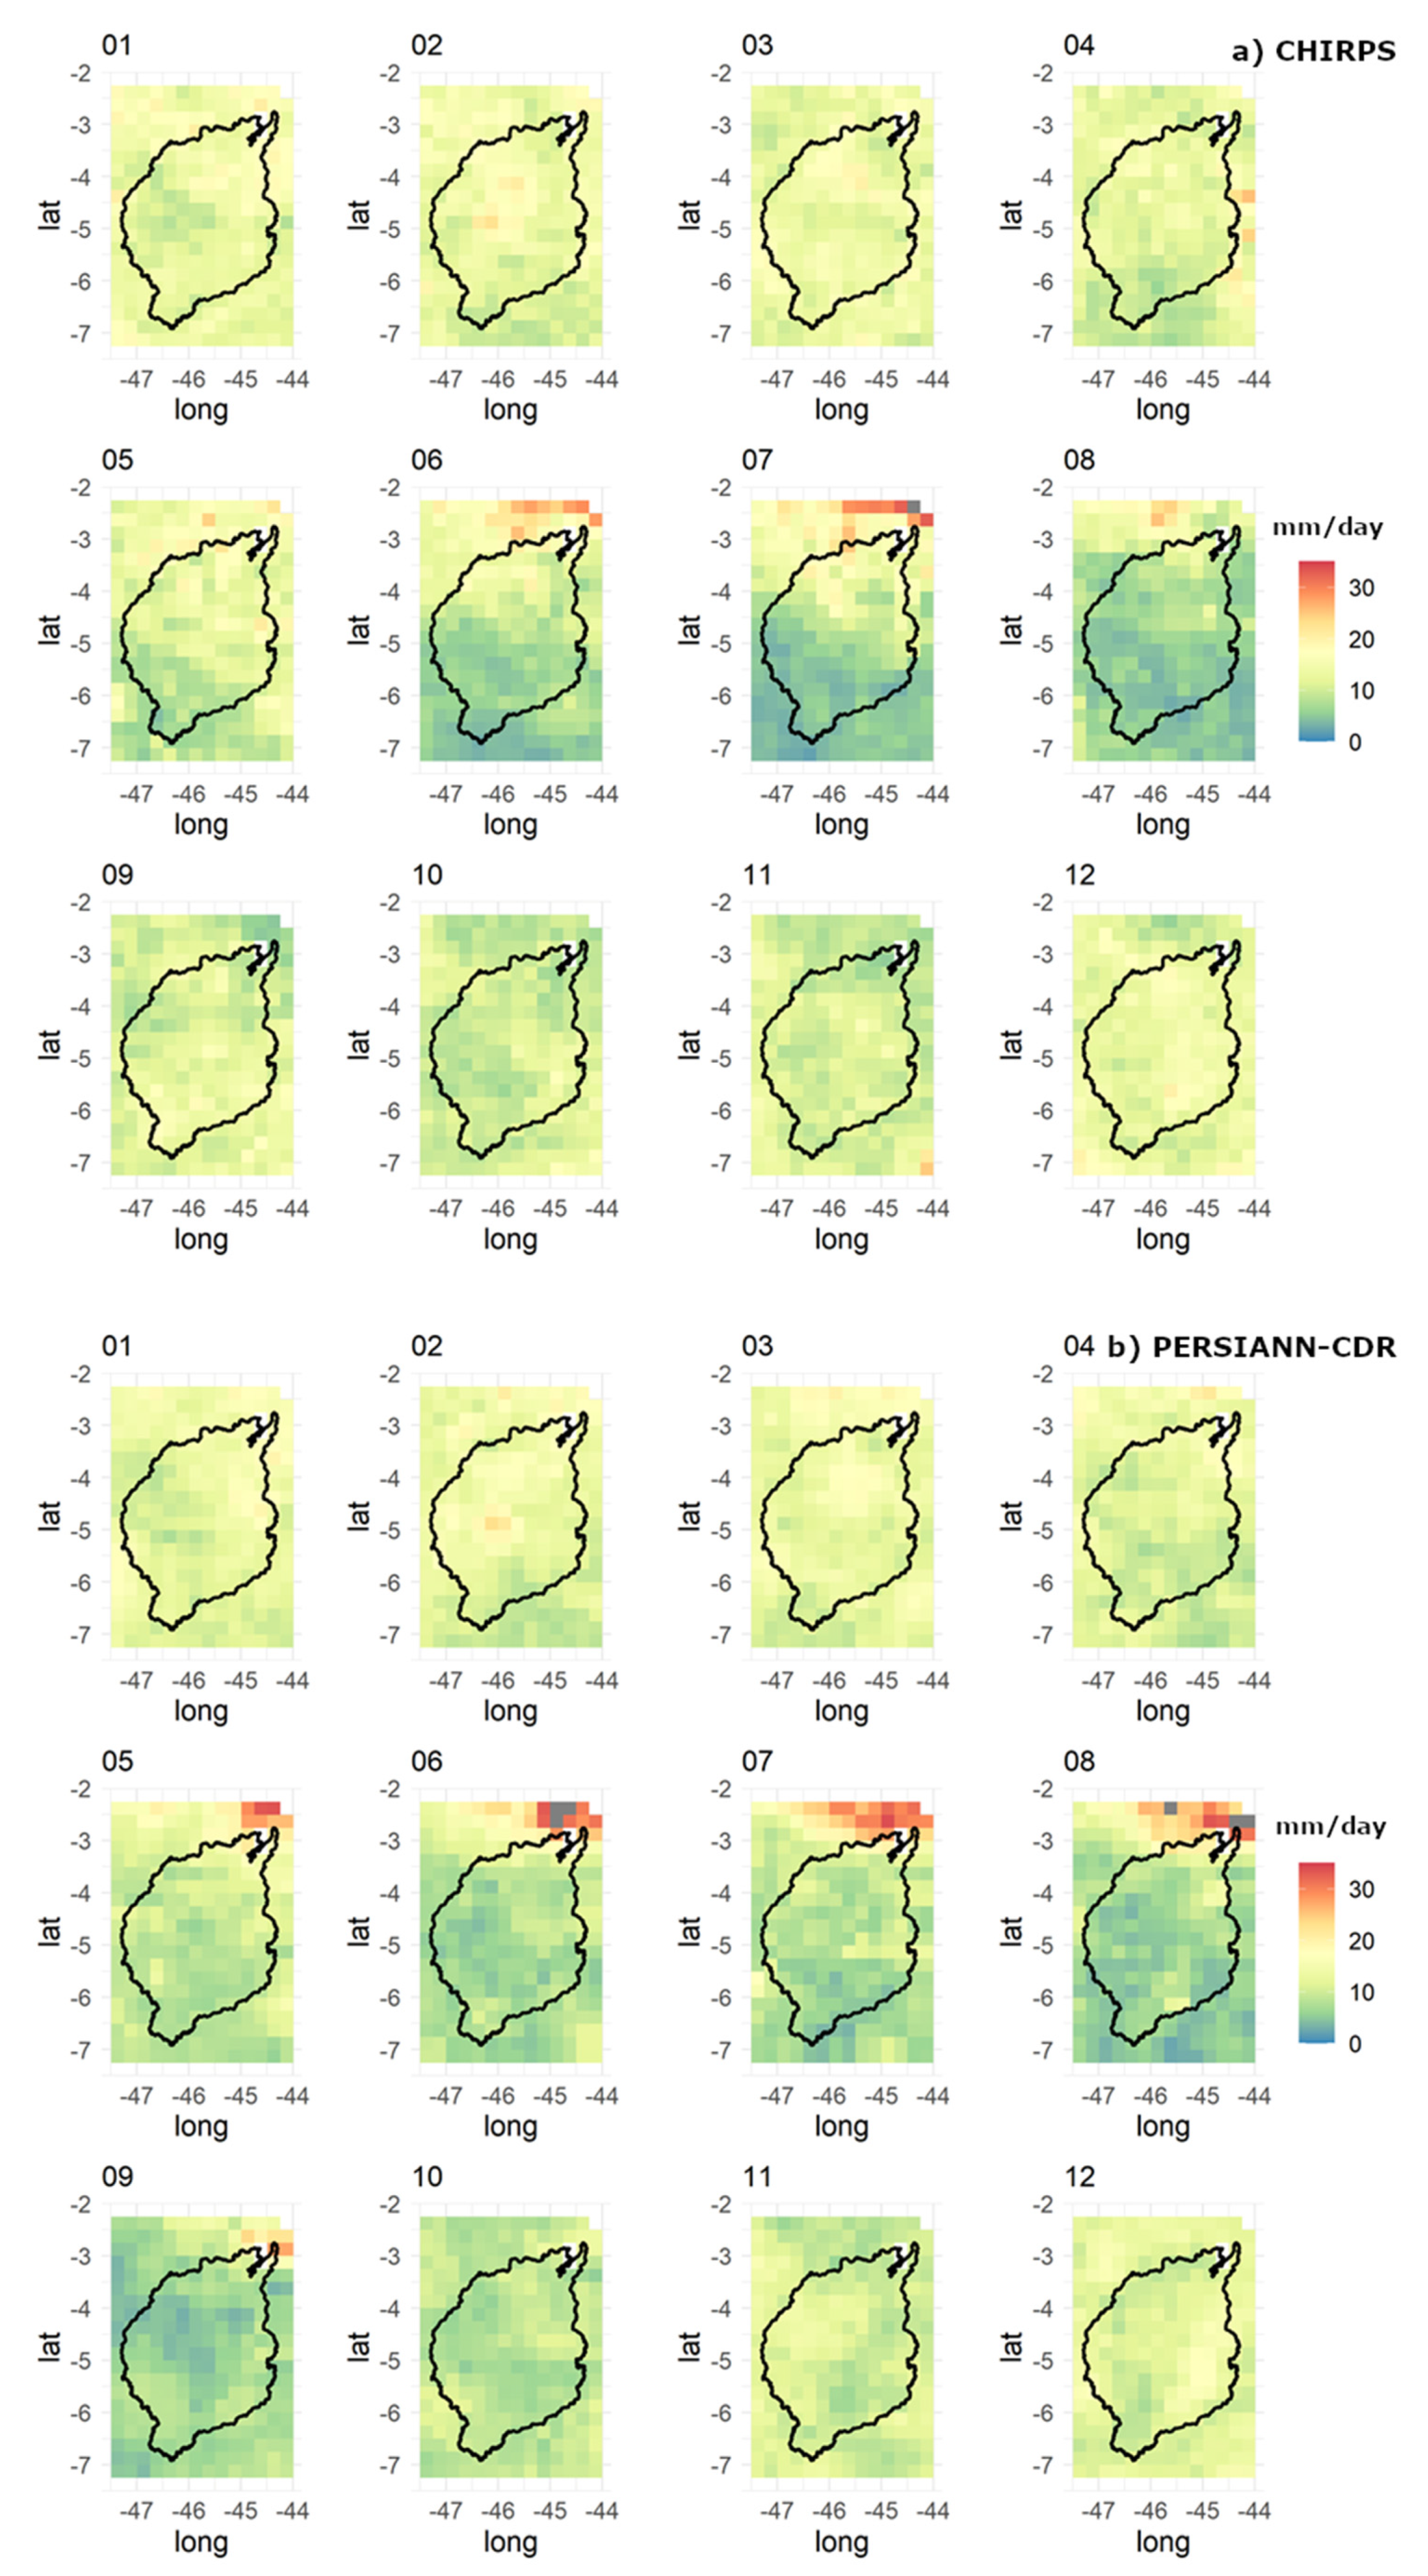
RMSE (mm/day) monthly mean (gridBR × CHIRPS (a) and gridBR × PERSIANN-CDR (b)) from January (01) to December (12) 1983 to 2013.
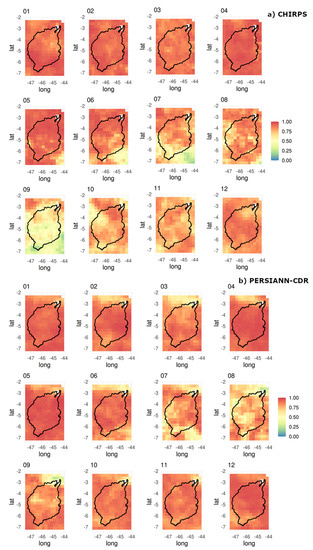
Figure 8.
Willmott’s d (without units) monthly mean (gridBR × CHIRPS (a) and gridBR × PERSIANN-CDR (b)) from January (01) to December (12) 1983 to 2013.
From the RMSE index (Figure 7), CHIRPS was the best product in general, for both rainy months (December to May) and drier months (June to November). The RMSE values from CHIRPS (Figure 8) did not exceed 3 mm/day for any month evaluated as a function of the mean rainfall in the MDB. The RMSE values with MSWEP (Supplementary material II) were only lower or close to 10 mm/day in the pixels located in the south and southeast of the MDB for June to October (dry season). PERSIANN-CDR (Figure 7) also showed satisfactory performance in RMSE, with errors smaller than 2 mm/day and more homogeneous regions of RMSE than the other products in relation to the mean rainfall.
In agreement with the other metrics, Willmott’s d (Figure 8) highlighted the quality of the representation of the mean monthly rainfall of CHIRPS and PERSIANN-CDR for all months, with values very close to one. MSWEP (Supplementary material II) yielded d values close to 0.25, which shows a low sensitivity representative of monthly means of precipitation values in the MDB. The products CHIRPS and PERSIANN-CDR represented precipitation well at points of interest, such as the region along the Carajás Railway and the Ponta da Madeira port terminal. The results in the wet months are noteworthy. Extreme rainfall can cause flooding problems, which impairs ore flow along the Carajás Railway and the logistical operations and has implications on water quality in the port terminal. In MATOPIBA, where rainfall in the dry season is equally well-represented by all three products, drought events can impact agricultural production in this region. The values of pbias are close to zero, and the RMSE does not exceed 4 mm/day with either RES calculation.
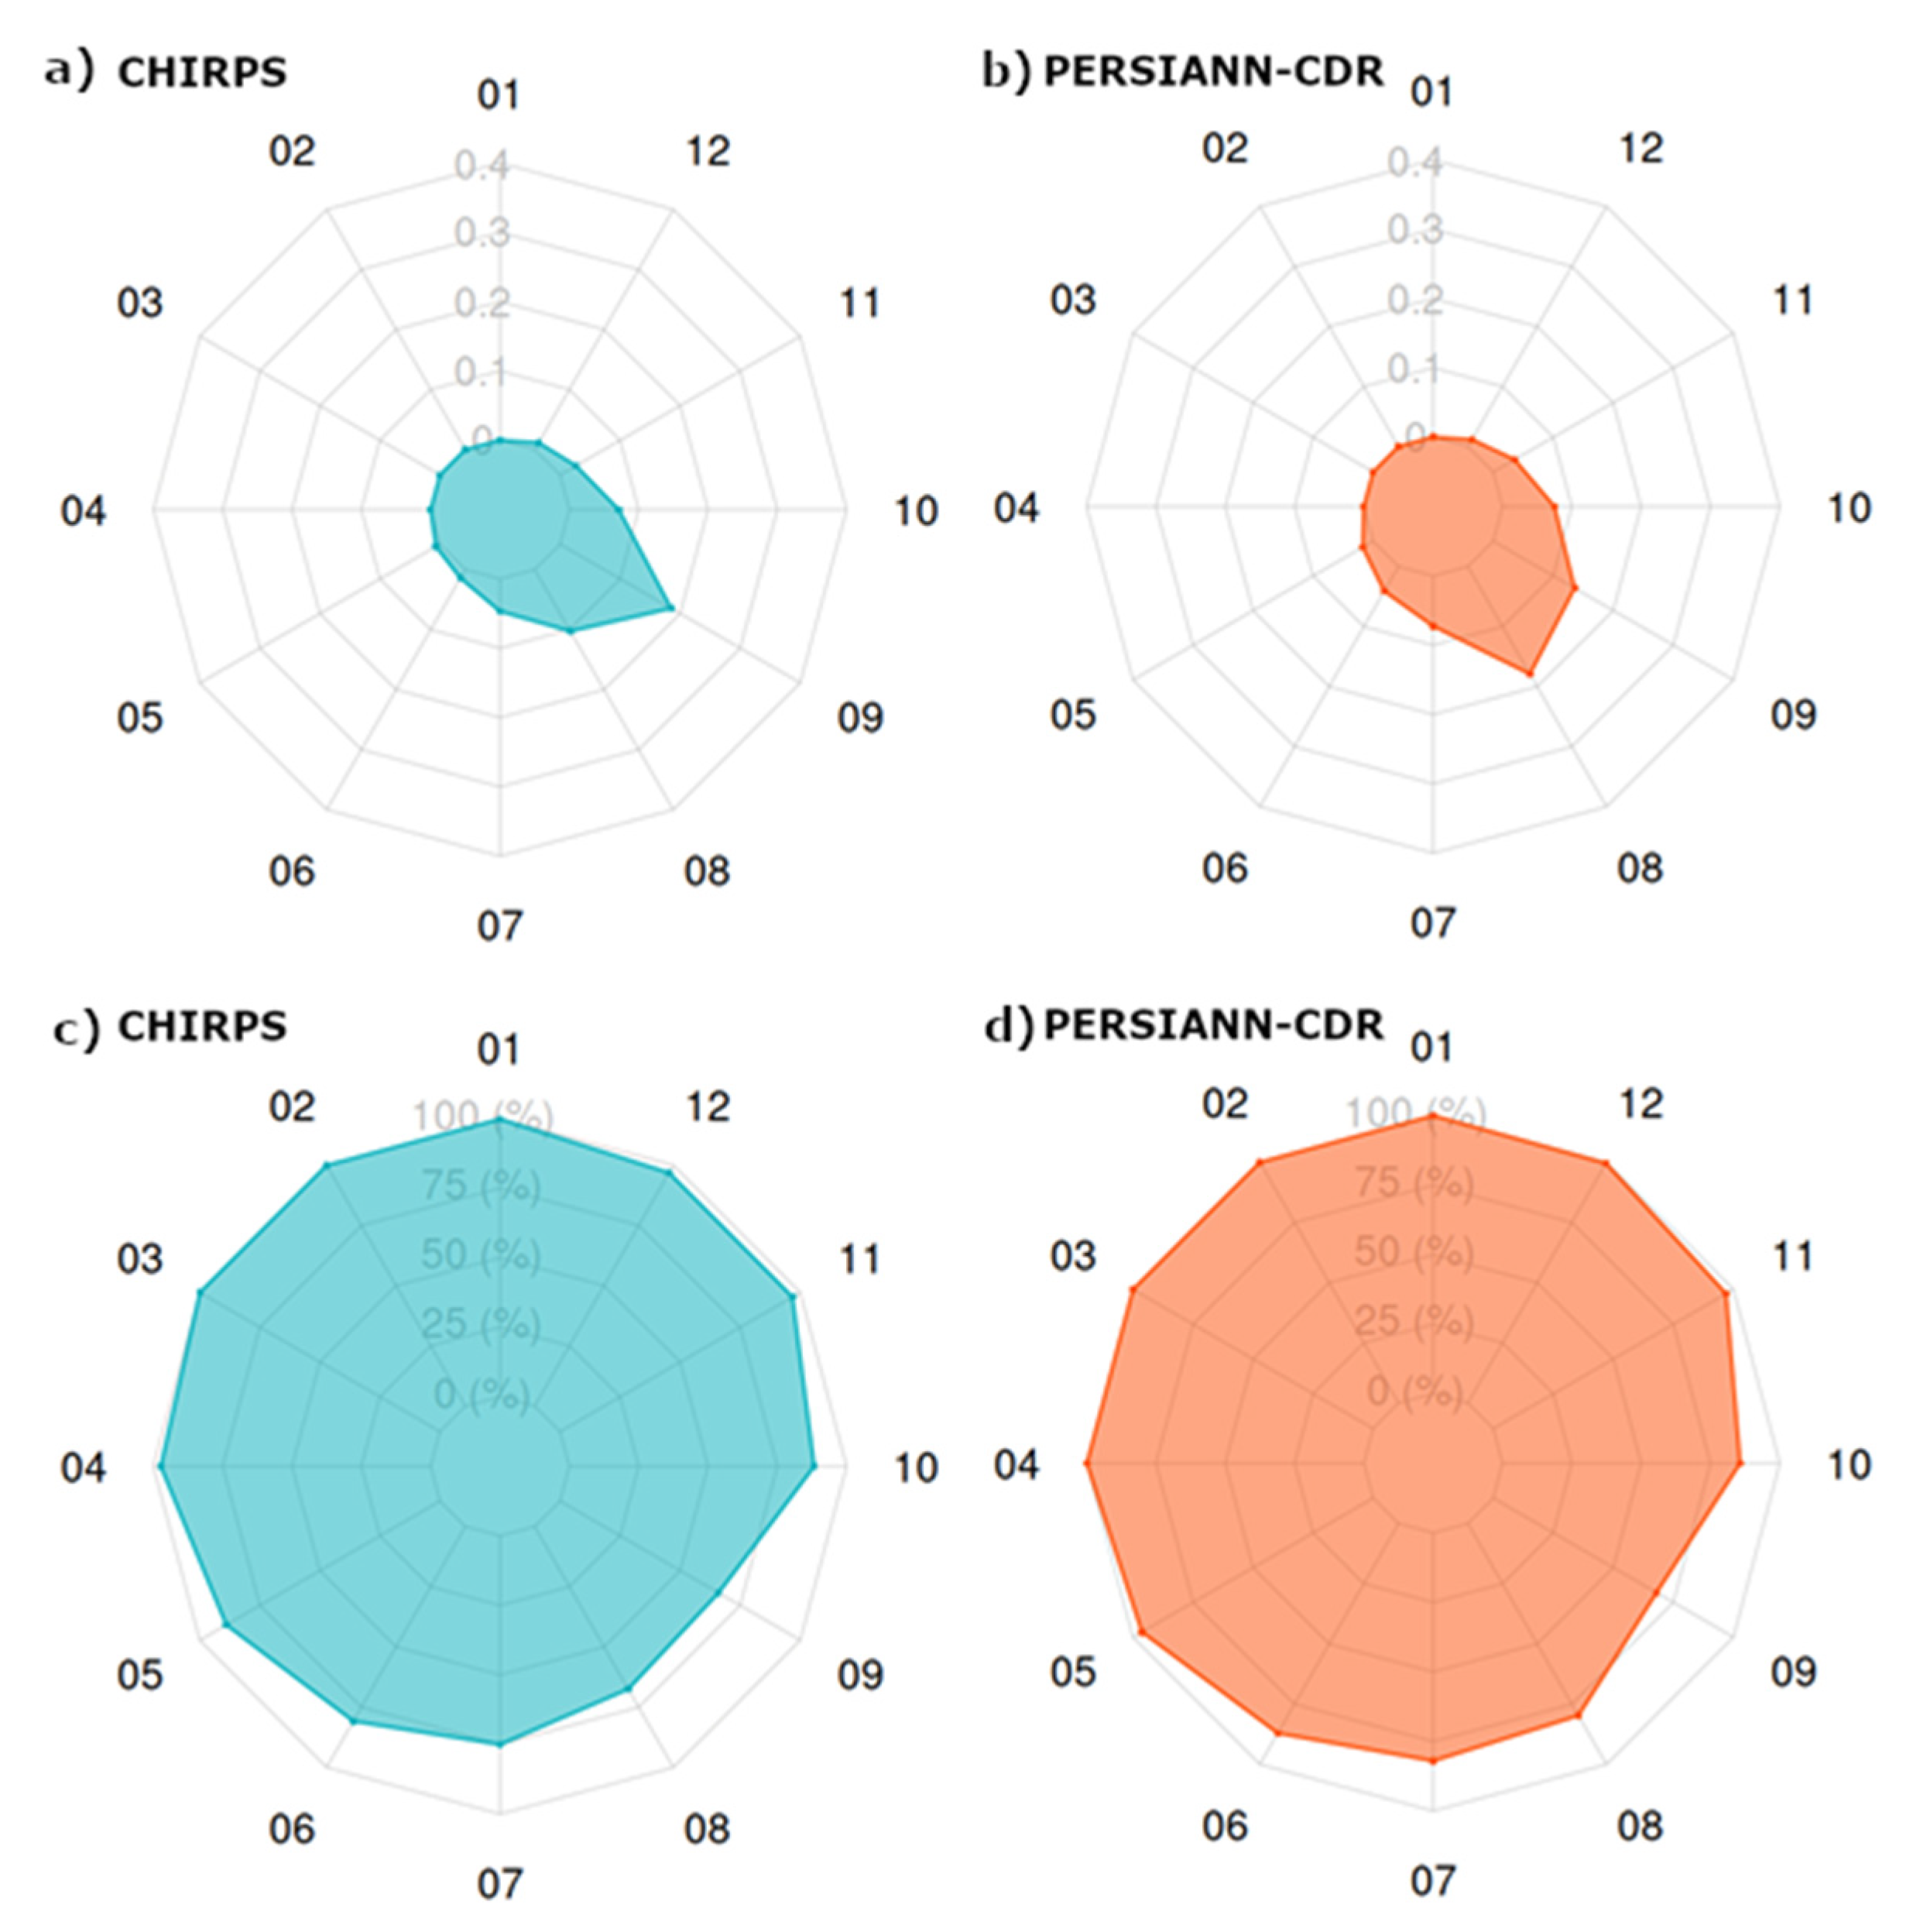
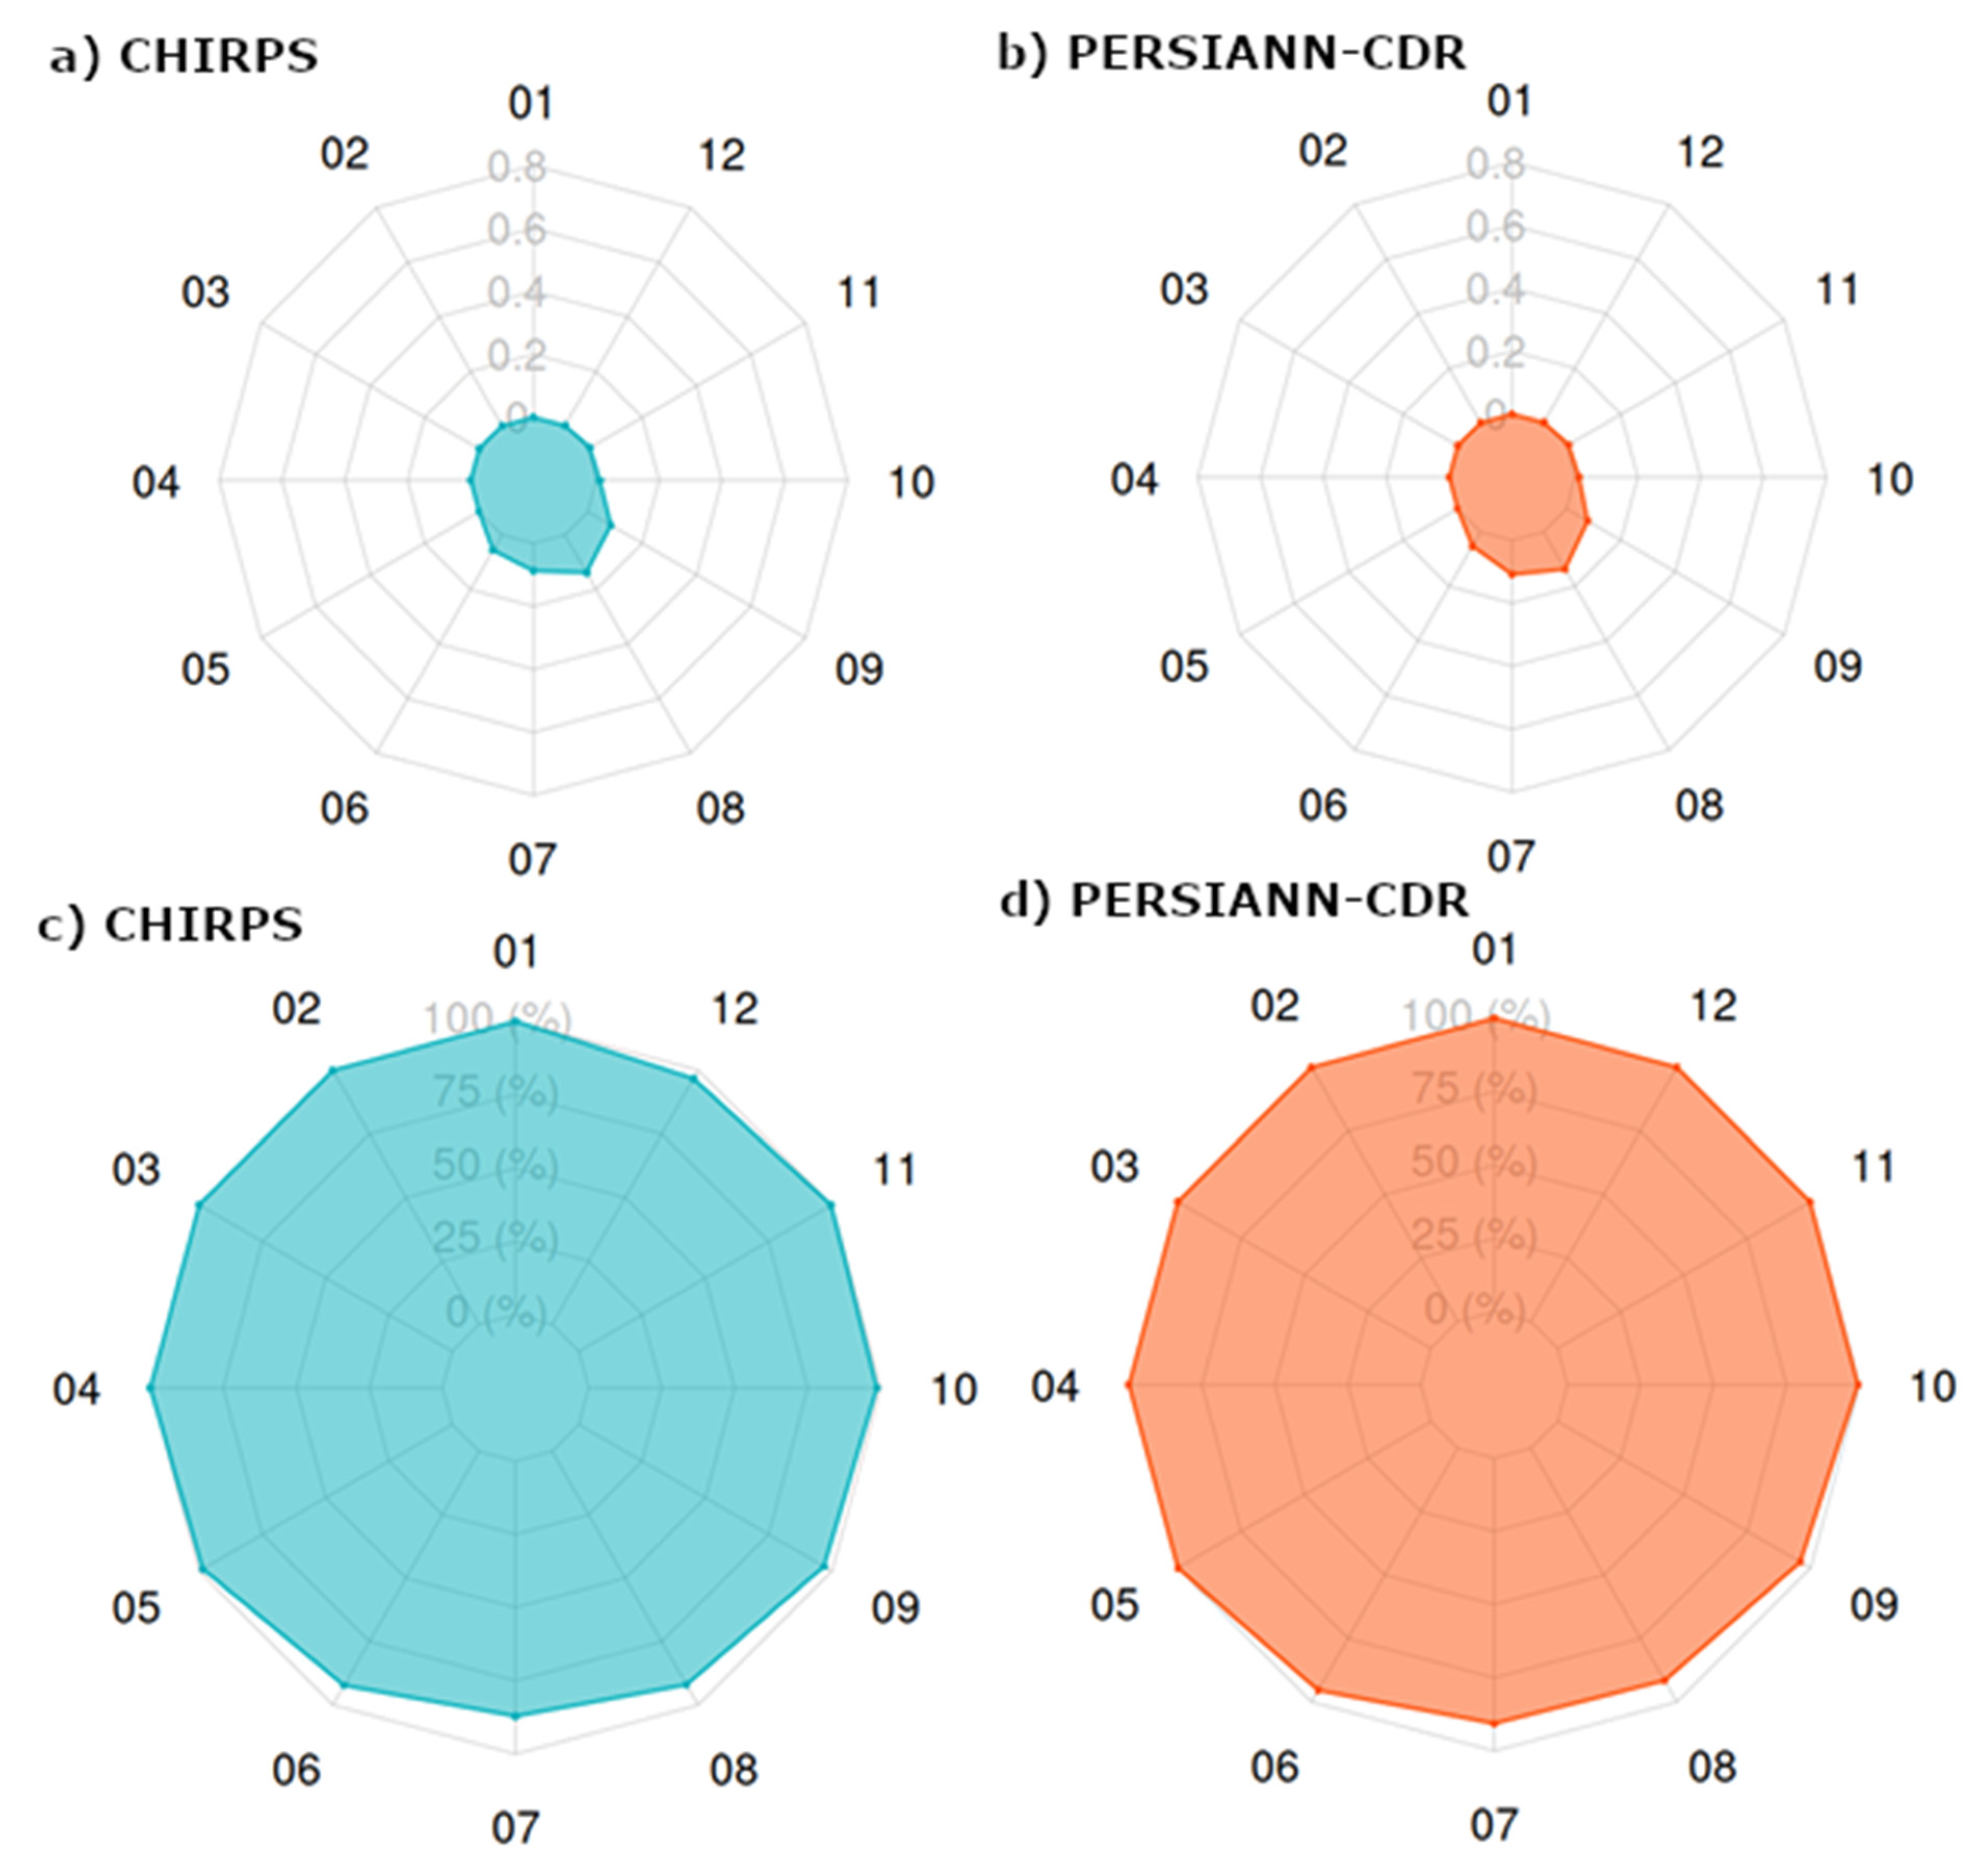
The estimated FAR (Figure 9a,b) and probability of occurrence (Figure 9c,d) between the gridBR and the RESs (CHIRPS and PERSIANN-CDR) corroborated the failure to reproduce the monthly mean precipitation data obtained via remote sensing in the driest periods of the year, from June to November. In general, a FAR equal to zero indicates that there was a mean monthly rainfall greater than 1 mm/day in the RES and gridBR products. Values other than zero indicate the estimated rainfall only for the RES and not for the gridBR. The MSWEP (Supplementary material II) yielded a greater range of values different from zero than CHIRPS and PERSIANN-CDR did.
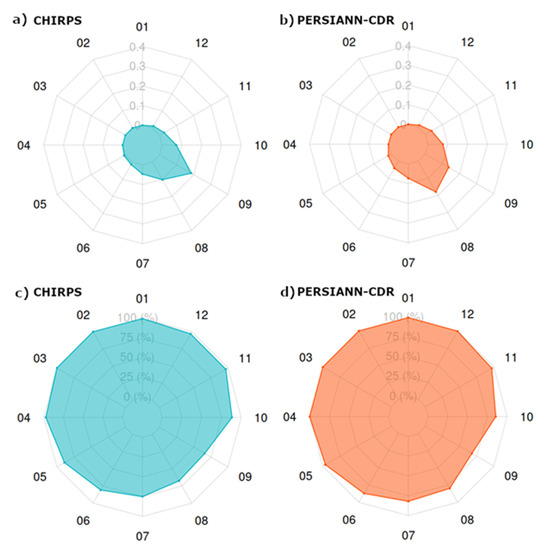
Figure 9.
False alarm (a—CHIRPS and b—PERSIANN-CDR) and probability of occurrence (c—CHIRPS, d—PERSIANN-CDR) of the monthly mean (gridBR × RES) from January (01) to December (12) 1983 to 2013.
Regarding the probability of occurrence of RES and gridBR values (Figure 9), MSWEP (Supplementary material II) was more compatible with monthly series for all months than CHIRPS and PERSIANN-CDR. However, when comparing the metrics that give an idea of the volumetric disparity in the daily mean of the monthly rainfall (pbias and RMSE), this product is not recommended because it overestimated the daily mean values for the MDB region. Due to the thermodynamic characteristics of precipitation and its occurrence, it was not possible to visualize any spatial pattern in the occurrence or intensity of the monthly mean daily rainfall volume from the instruments utilized in this study.
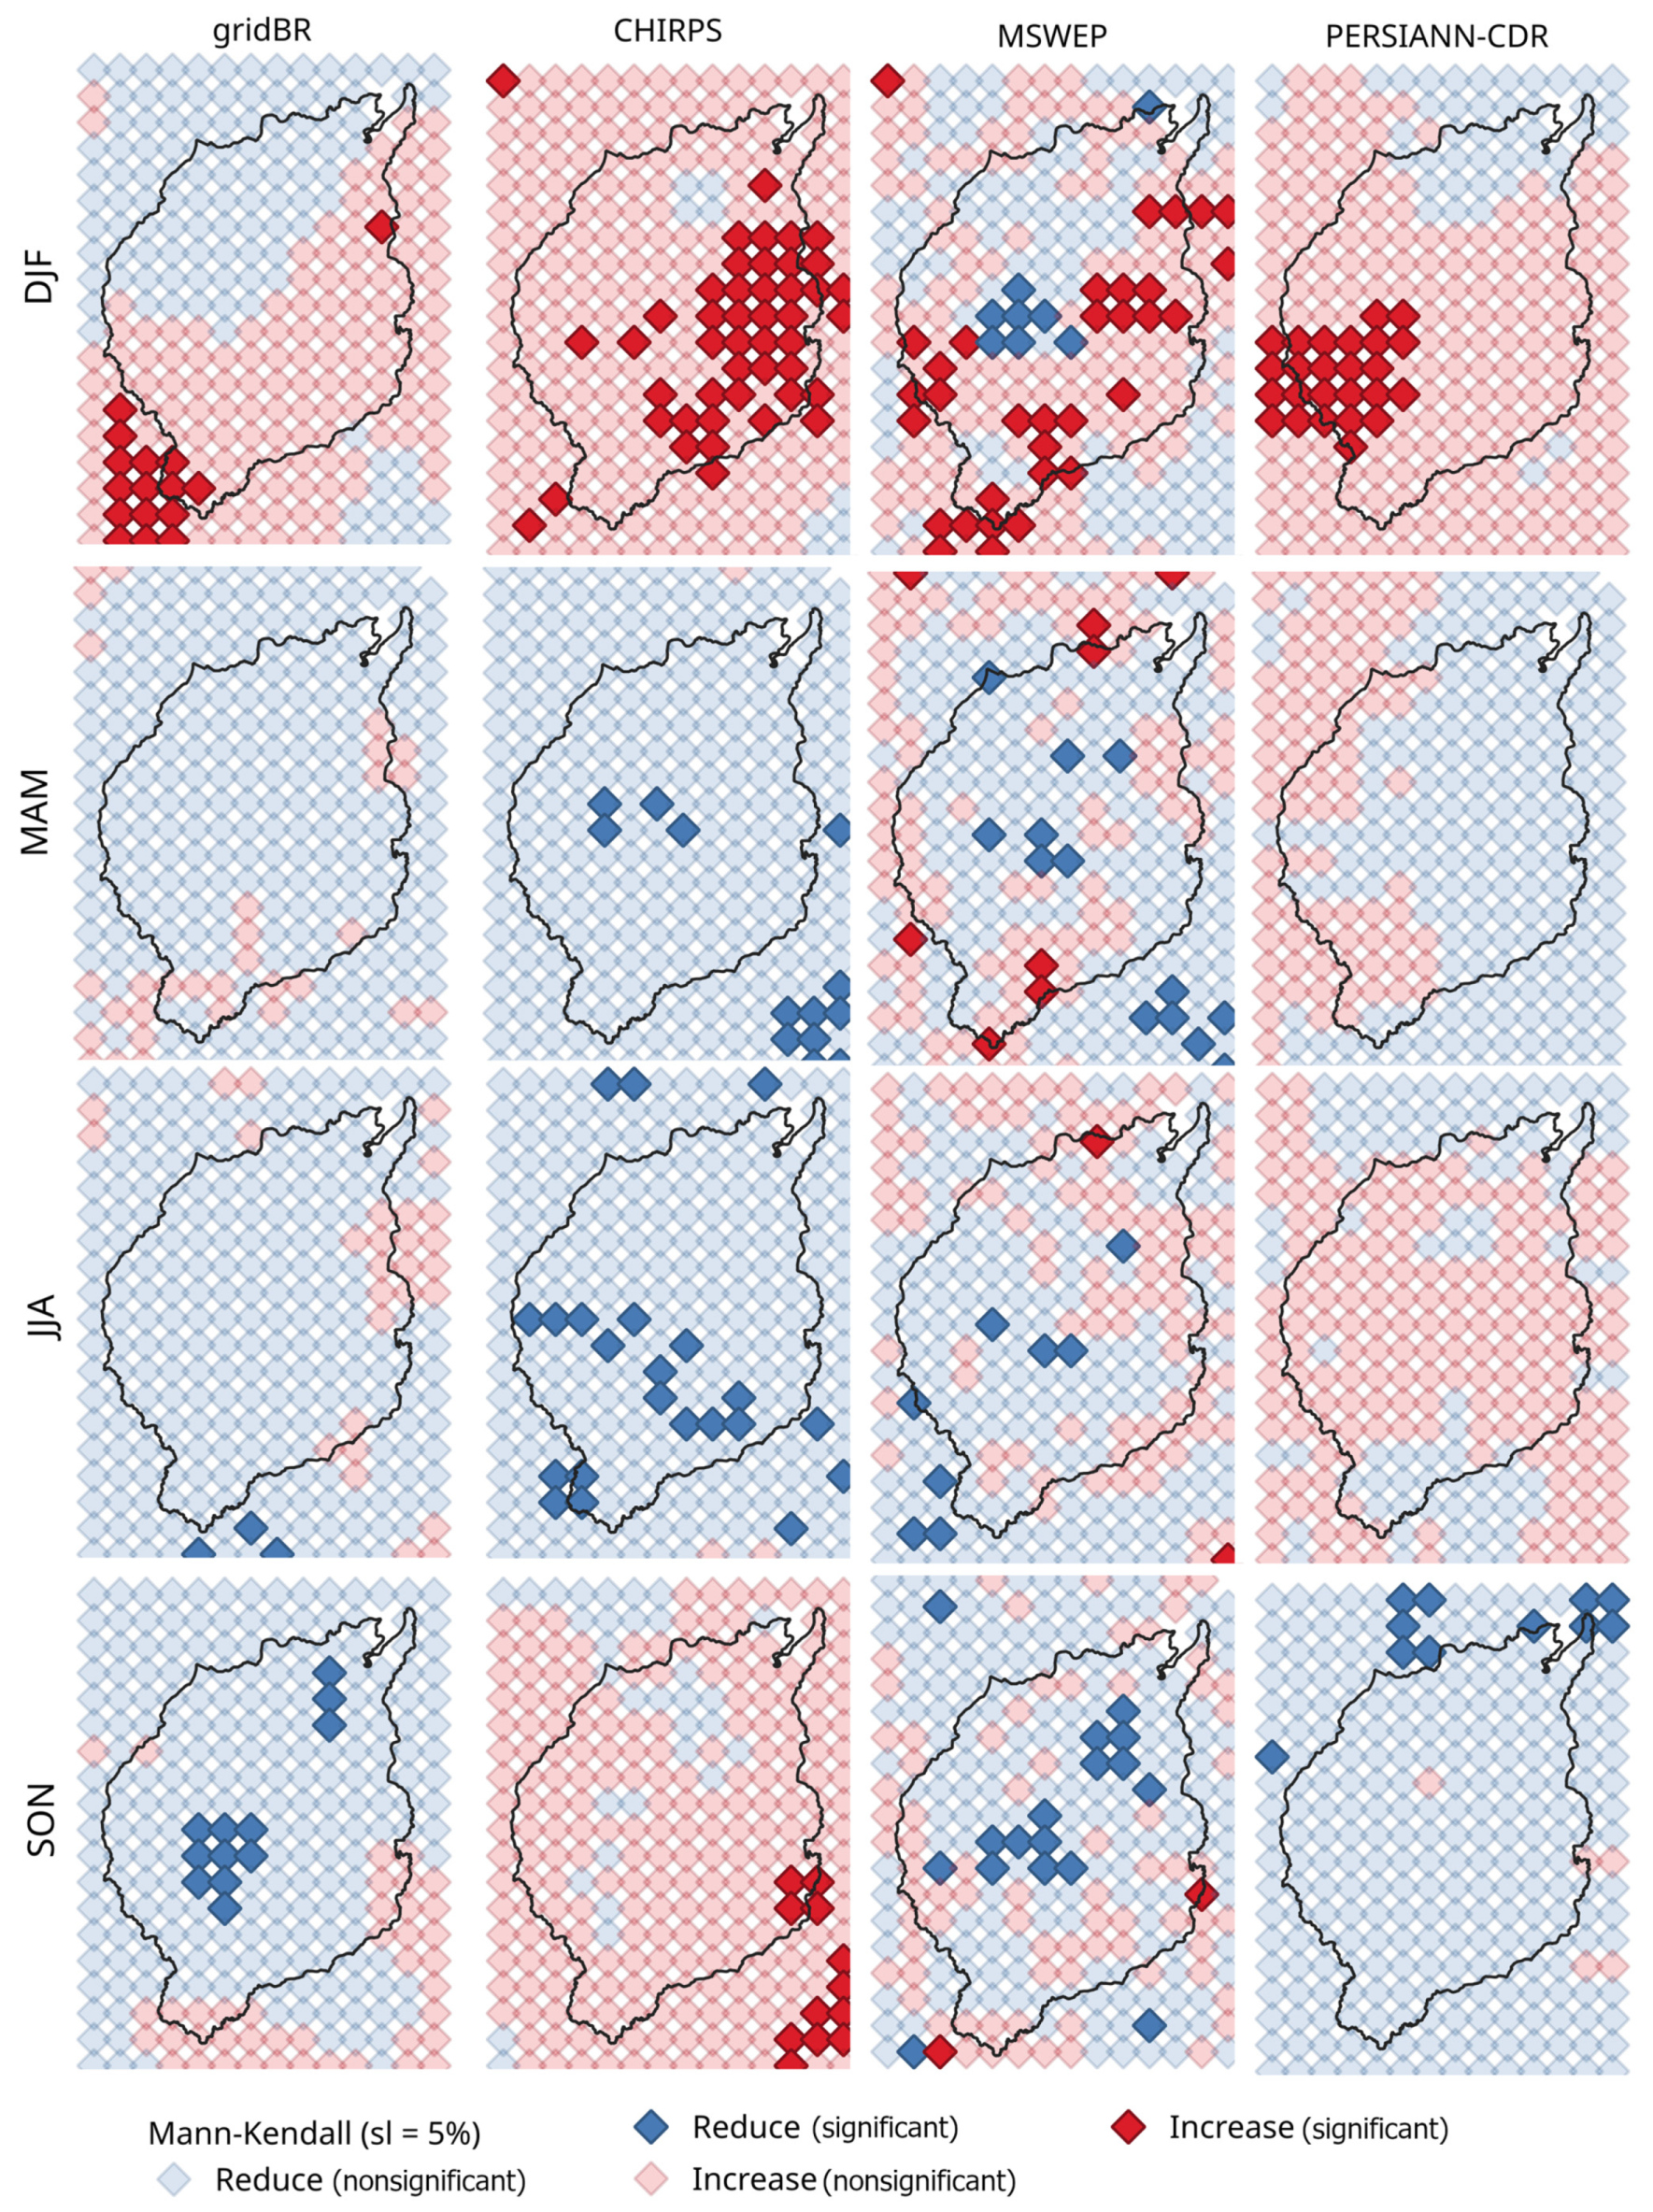
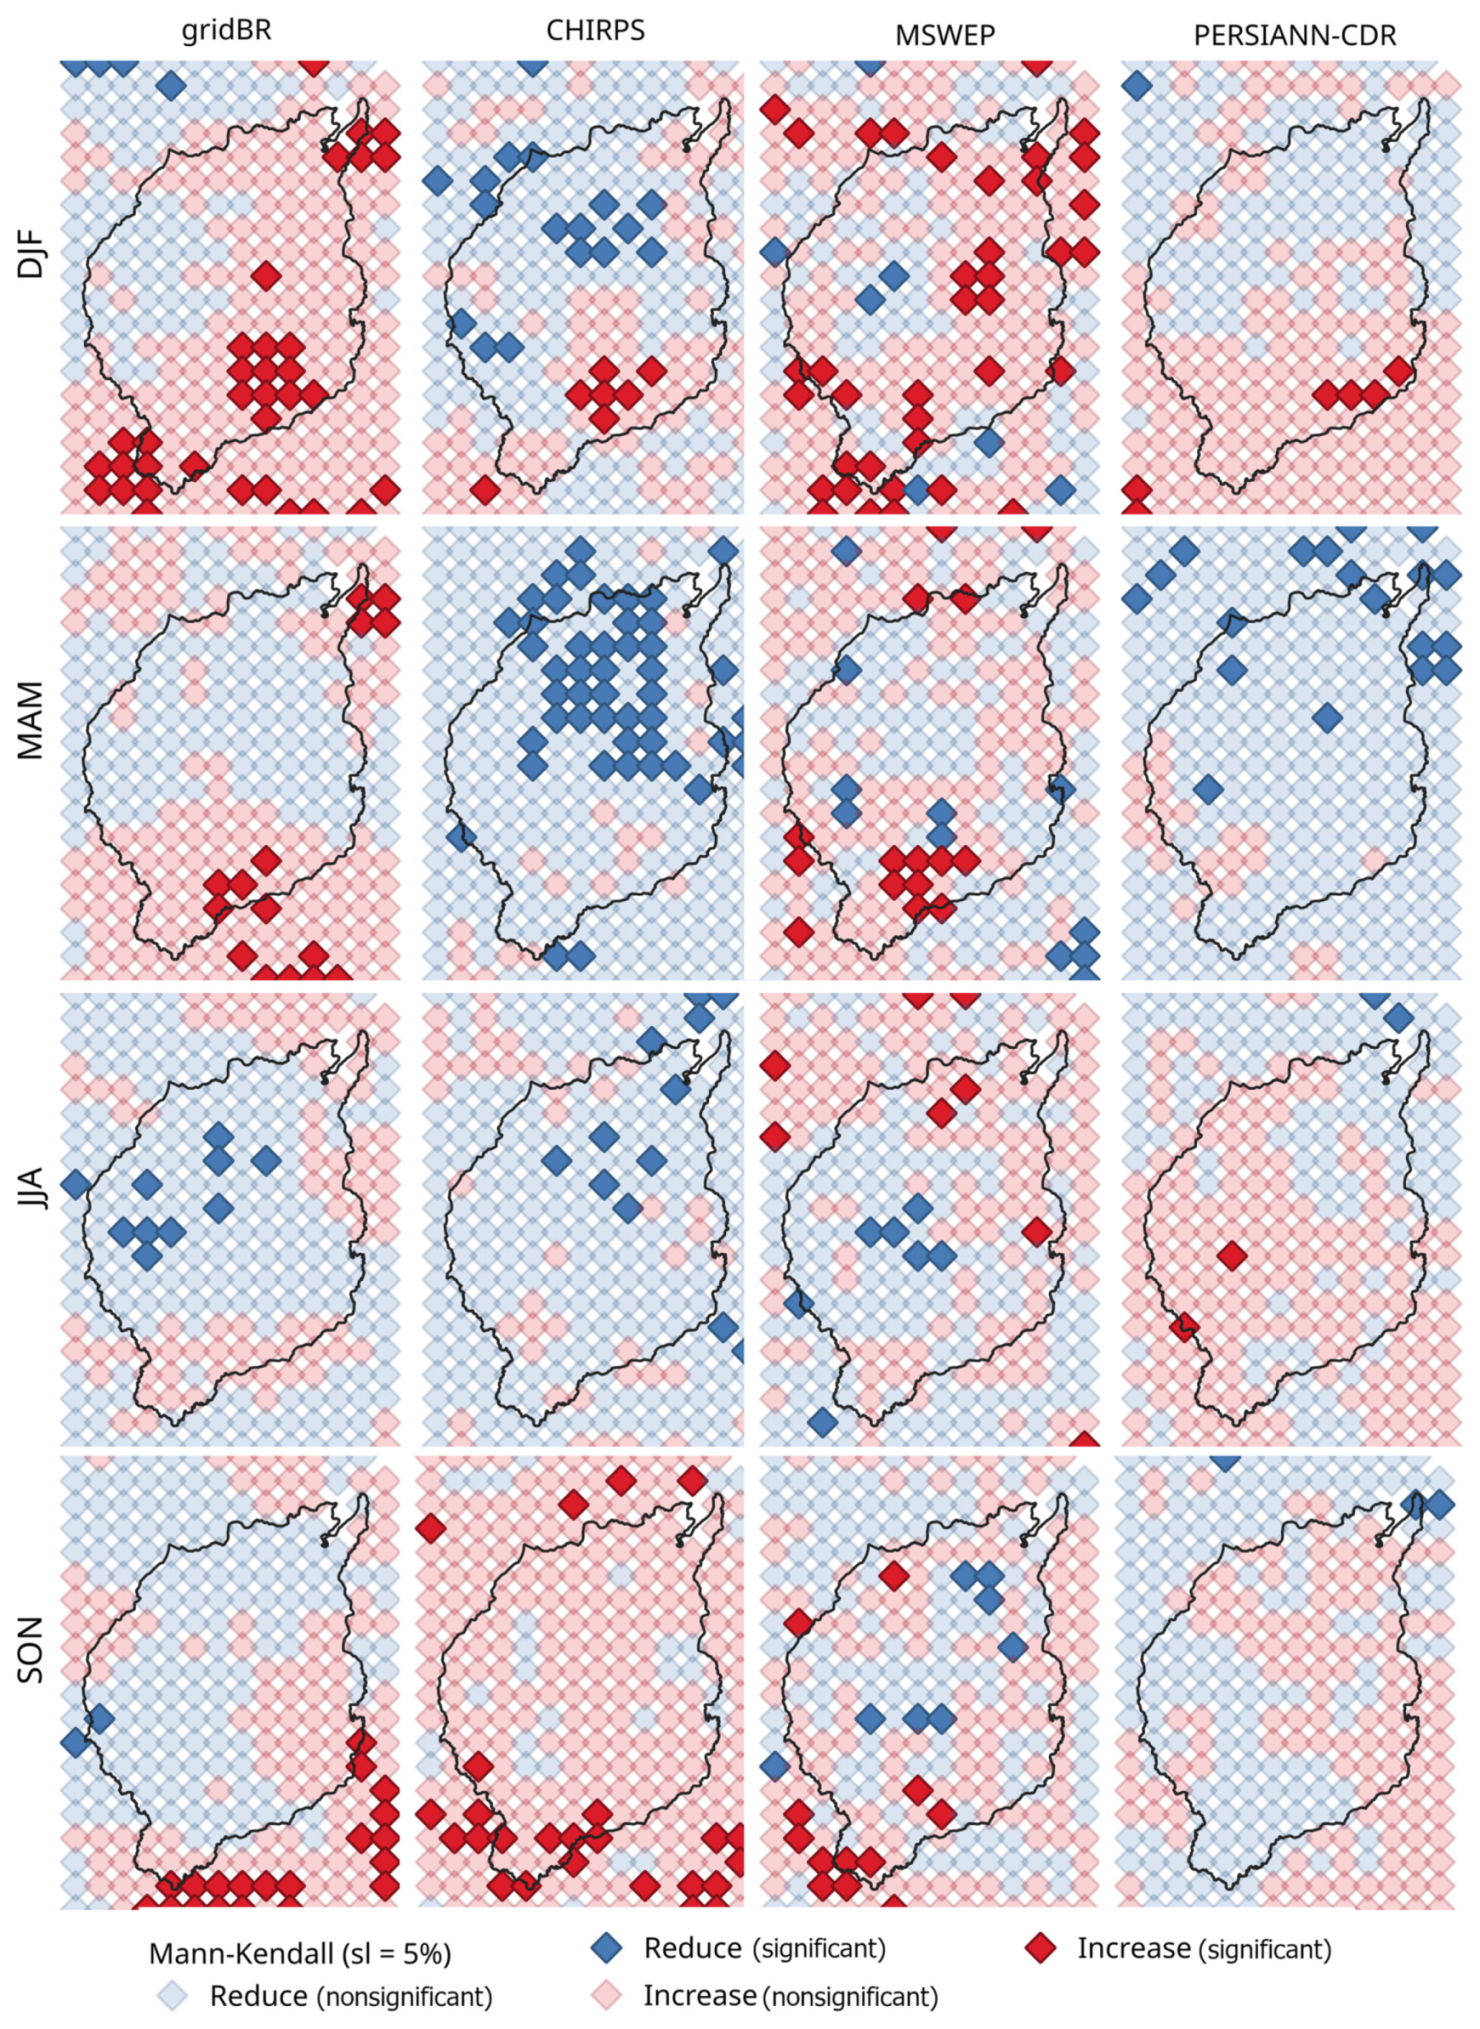
As seen in Figure 10, there was no spatial agreement between the trends estimated by the Mann–Kendall test (at the 5% significance level) for seasonal means of daily rainfall between gridBR and RES data. In the first three rainy months (DJF), all products showed an increasing trend in daily rainfall over almost the entire basin. This trend was significant especially for the RES calculations. CHIRPS and PERSIANN-CDR showed significant increases in different basin regions: east (CHIRPS) and southwest (PERSIANN-CDR). In the MAM and JJA months, there was a general trend of a lower daily rainfall. This trend was repeated in the SON months, except in CHIRPS, which indicated an increasing trend of daily rainfall. The increment and decrement of the trends yielded by the Mann–Kendall test for gridBR plus RES methods are presented in Supplementary material III.
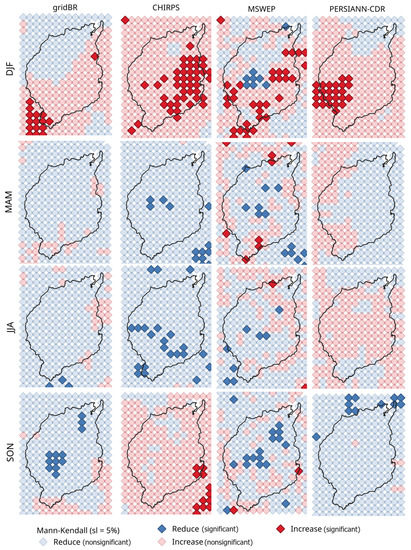
Figure 10.
Mann–Kendall decreasing and increasing trends (5% level of statistical significance) as a function of the seasonal mean daily rainfall in the MDB (gridBR × RES) from 1983 to 2013.
3.2. Extremes
The extreme events calculated according to rx1day showed behavior similar to that of the mean, i.e., better performance for months of the rainy period (December to May) for the whole MDB, in which daily rainfall was greater than or equal to 1 mm. The overall performance as seen through the pbias (Figure 11), RMSE (Figure 12), and d (Figure 13) indicated that PERSIANN-CDR and CHIRPS had a certain level of uncertainty in their evaluation of maximums in periods of higher rainfall volume (December to May). However, they were better than MSWEP at estimating maximum daily rainfall on the monthly scale from 1983 to 2013.
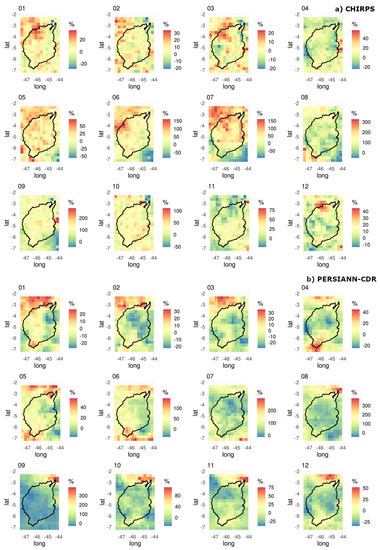
Figure 11.
pbias (%) monthly rx1day (gridBR × CHIRPS (a) and gridBR × PERSIANN-CDR (b)) from January (01) to December (12) 1983 to 2013. Each SRE and each month for pbias (%) have different representative scales.
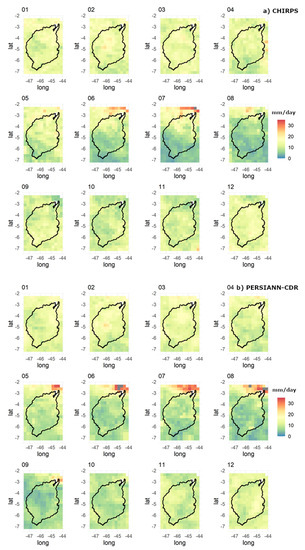
Figure 12.
RMSE (mm/day) monthly rx1day (gridBR × CHIRPS (a) and gridBR × PERSIANN-CDR (b)) from January (01) to December (12) 1983 to 2013. Values above 35 mm/day are colored by gray pixels.
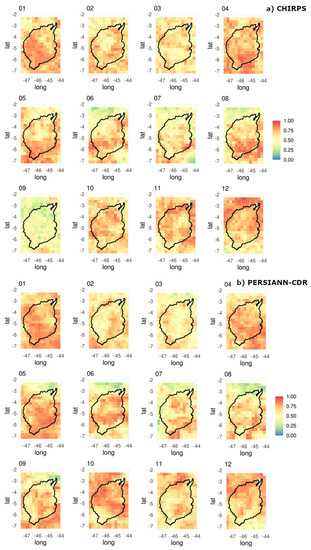
Figure 13.
d (without units) monthly rx1day (gridBR × CHIRPS (a) and gridBR × PERSIANN-CDR (b)) from January (01) to December (12) 1983 to 2013.
In the rainy season, CHIRPS and PERSIANN-CDR (Figure 11) tended to show spatial behavior of underestimating rx1day to the east (Cerrado biome) and overestimating rx1day values in the west region (Amazon biome). In Figure 11, pbias values overestimated rx1day by more than 20% in some pixels of the northwestern portion of the BHIR (Amazonian biome) by CHIRPS in January (beginning of the rainy season), and using the same RES, the same pattern of overestimation also occurred for May, which reached 50% pbias but without any spatial pattern. PERSIANN-CDR performed well in all metrics in the dry season, unlike that which was found for the monthly mean.
FAR (Figure 14) showed a result similar to that found by comparing the monthly means. The probability of monthly rx1day had a higher probability than the mean did. For the same metrics, MSWEP showed poor behavior in predicting rx1day values throughout the MDB.
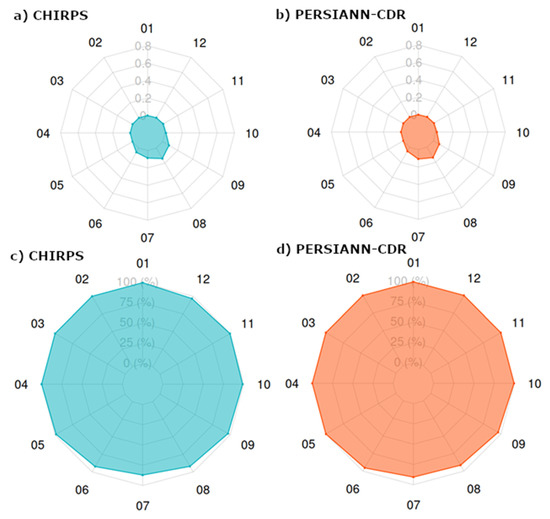
Figure 14.
False alarm (a—CHIRPS, b—PERSIANN-CDR) and probability of occurrence (c—CHIRPS, d—PERSIANN-CDR) of the monthly rx1day (gridBR × RES) from January (01) to December (12) 1983 to 2013.
Figure 15 shows spatial agreement between the trends estimated by the Mann–Kendall test (at the 5% significance level) for seasonal rx1day only for DFJ between gridBR and CHIPS—only six pixels from the southeast region of the MDB. For the other trend comparisons by Mann–Kendall for MDB, there is no spatial agreement between gridBR and RES in the analyzed case of rx1day. That is, the RES methods estimated the maximum daily rainfall with difficulty. During MAM, JJA, and SON in the delimitation of the MDB by gridBR (Figure 15), there were no pixels with a significant trend for either an increase or a decrease in precipitation rx1day. The Mann–Kendall test’s decreasing and increasing trend values for both gridBR and RES product are presented in Supplementary material III.
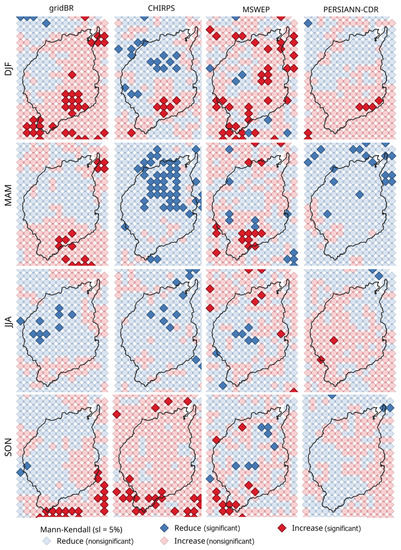
Figure 15.
Mann–Kendall decreasing and increasing trends (5% level of statistical significance) as Figure 1. Day of daily rainfall in the MDB (gridBR × RES) from 1983 to 2013.
4. Discussion
Higher values of total accumulated precipitation are expected in the marginal region of the Amazon biome [1]. During December and May, MDB typically receives moisture from air masses moving through the equatorial and tropical zones displaced from the Atlantic and Pacific Oceans [1,31,35], which influences the rainiest (December to May) and less rainy periods (June to November). The MDB is located in a spatial gradient between the wettest region (left margin of the MDB), represented by the Amazon biome, and subhumid (right margin of the MDB), represented by the Cerrado biome.
CHIRPS and PERSIANN-CDR provided good estimates for the mean and rx1day values for the rainy season, December to May, in the MDB. Similar results were found by [80], where the accuracy of products derived from CHIRPS from 1981 to 2019 at estimating rainfall in Rondônia (Brazilian Amazon) was analyzed. Other authors [81] emphasize that products of the PERSIANN series, especially PERSIANN-CDR, have had their biases corrected as a function of the bases of the surface stations. Even so, deviations are expected when comparing in situ data with those from satellite products. Even the most sophisticated technologies, such as radar, have difficulty quantifying precipitation values because precipitation has high thermodynamic and dynamic complexity, resulting in robust parametric processes [82].
For example, PERSIANN algorithms continue to improve, and some of them involve deep learning approaches and the addition of water vapor channels incorporated into MODIS and CloudSat data [83]. Similar results for the PERSIANN-CDR have been found [11] in tropical regions, when the interannual reference rainfall was based on surface station data from 2003 and 2010. General problems with estimating mean rainfall during droughts have also been reported [84], mainly for PERSIANN-CDR data and those derived from TRMM 3B42 v7 (one of the inputs of CHIRPS) and TRMM 3B43 v7.
MSWEP overestimated the mean and the rx1day in the BMH by up to 150 times the precipitation values provided by gridBR. In a study conducted in Iran, which has high relief complexity, MSWEP version 2 yielded pbias values above 100% for the mean when compared with in situ stations in a study of series from 2003 to 2012 for different classes of precipitation, altitude, and climate [84]. A comparative analysis between MSWEP and [84] also found overestimated precipitation values for both the wet and dry periods.
In the MDB region, inadequate monitoring of rainfall can lead to several practical problems. For example, extreme rainfall events (from the perspective of this study, heavy rains) can interrupt the loading/unloading operations on the Carajás railway line. The Carajás Railway transports ores and passengers from Pará state (Serra dos Carajás, Itacaiúnas River basin) to Ponta Madeira Port (São Luís, Maranhão state). Risks mapped in Vale’s operating areas are associated with above-average intense rainfall, lightning, strong winds, and temperature increases, bringing problems associated with product shipment and operation of the Carajás Railway [19]. Operational interruptions of railway systems have been widely documented around the world [85,86,87,88]. In the United Kingdom [85], it is emphasized that the interruption and safety of the railway system when extreme rainfall events occur are related to floods, increased risk of landslides, cargo falls, and low visibility.
Impacts caused by extreme rainfall and the difficulty of adaptation and resilience in port regions have been the object of research [89]. The low level of port regions relative to sea level exposes these systems to climate change. The increase in sea level (e.g., wave setup [90]) and changes in the pattern of storms are the main sources of natural disasters that can impair the performance of these structures, causing delays and disruptions in loading and unloading, damage to infrastructure, and increased regional economic losses [89].
Due to the strategic agroproductive importance of the MATOPIBA region to Brazil [77], partly under the domain of MDB, there is a need to plan based on a solid database and empirical research on climate and weather in the MDB. The increase in extreme rainfall events can negatively affect agricultural productivity, damage the environment, and harm society. An increasing number of consecutive dry days and a decreasing number of consecutive wet days directly affect agricultural crops’ development stage [91,92,93]. Increasing trends on consecutive dry days have been reported [77] in regions not unlike the MDB. It has also been described [77] that the significant annual increasing trend (at the 10% level of statistical significance) in rx1day was significant for the MDB region.
Studies in tropical regions show the importance of validating long-series in situ stations and RES algorithms, and they are essential for reliable trend estimates (decreases or increases in precipitation) because actions related to the deforestation of native vegetation can increase the flow of sensitive heat and atmospheric instability [94], causing impacts on the moisture flow in areas with land-use transitions and land cover [95].
In all RES methods, errors associated with estimates of high precipitation values may occur due to local precipitation formation processes and/or processes inherent to the dynamic and thermodynamic complexity of precipitation. Often, the instruments of these RES products cannot measure the local precipitation [96]. To overcome the difficulty of precipitation series obtained by remote sensing in providing quality information for drought estimates, some authors [97] have proposed using a combination of long-term databases with low spatial resolution and near-real-time databases with high spatial resolution. The application of Bayesian methods for this proposal, and bias correction from other satellite products, proved to be an effective deep learning tool in producing new products [97].
For the monitoring of short but intense events, such as those that cause flash floods, in addition to the quality of the RES, we need products that have latency and spatial grid refinement to capture such extreme events [11]. The main limitation of precipitation estimates derived from satellite products is their inevitably large spatial and temporal variability. Especially in regions with complex topography, precipitation is mostly due to the relief and is highly variable in space [98]. This study was restricted to long satellite products, as future perspectives of the application of others and recent developments are encouraged. For example, the use of RES to fill gaps in the surface stations applying CHIRPS demonstrated good performance for average rainfall in Legal Amazon [99].
New studies that have the improvement of information bases in tropical regions as a main objective are encouraged, especially those regions with a low density of surface stations and no long, consistent series. The use of products derived from satellites or coupled to radar with latency and good spatial resolution is encouraged for future analyses in the Mearim region. This is justified because the use of different data sources aggregates different parameterizations and thus can better describe rainfall processes under different aspects of cloud formation at a regional scale. The use of volumetric metrics, such as the volumetric false alarm, is suggested for future analyses [72] to yield better descriptions of the differences in rainfall in classes, such as low-intensity or high-intensity rainfall and, consequently, the rainfall volume.
5. Conclusions
The objective of this study was to provide a synthesis of the differences between observation data from previously interpolated in situ stations (gridBR) and satellite-derived products (RES): CHIRPS, MSWEP, and PERSIANN-CDR. Studies of the scope of exploration and improvement of rainfall data are essential management and research tools. Precipitation is a variable of intense dynamics, and often in situ stations cannot monitor its magnitude with consistent and sufficiently long series. Analyses performed with series older than 30 years are essential to unravel issues related to the standardization and interference of climate change in drainage basins, especially in tropical regions such as the MDB.
Despite the advantages of satellite-derived products of precipitation compared to in situ estimates, as the better spatial and temporal resolution, they may present errors regarding over or underestimation of rainfall and the difficulty of representing spatial patterns in the Mearim river basin.
In general, for the monthly mean, CHIRPS, MSWEP, and PERSIANN-CDR have difficulty estimating the mean rainfall in periods considered drier in the MDB, June to November. For the gridBR versus RES temporal performance between 1983 and 2013 on daily data, the best RES products are CHIRPS and PERSIANN-CDR. There is no spatial pattern in the inconsistency between the means or daily maximums found between RES methods and gridBR. There is also an inconsistency in the prediction of seasonal trends for mean and rx1day in the MDB. The pixels estimated as references in gridBR and the RES methods do not follow the same spatial pattern of significant trends under the Mann–Kendall test when compared within the same period or when comparing DJF, MAM, JJA, and SON.
According to the metrics analyzed by this study, the use of MSWEP as the input for climatological and hydrological analyses in the MDB region is discouraged for both the mean and rx1day. Overestimated values were found on both scales of representation, showing problems related to calibrations and bias correction in tropical regions. The other RES products should be encouraged to be used, but with caution, as they still have limitations. In particular, those related to rainfall may serve to delimit droughts in the MDB.
Investigations such as these to evaluate the products of adherent satellites over long-time series allow the improvement of regionalized databases. Future studies, such as on the associations with temperature anomalies of the Atlantic and Pacific Oceans and research and mitigation actions in drainage basins, are aided by these RES products. Studies on subdaily scales in the MDB should also be encouraged due to the area’s importance and flash floods.
Supplementary Materials
The following are available online at https://doi.org/10.5281/zenodo.5609021, Supplementary material I; https://doi.org/10.5281/zenodo.5510251, Supplementary material II; https://doi.org/10.5281/zenodo.5510230, Supplementary material III.
Author Contributions
Conceptualization, A.C.F.X., E.A.d.O.S. and P.R.M.P.; methodology, A.C.F.X.; formal analysis, A.C.F.X., E.A.d.O.S., A.P.R.; investigation, A.C.F.X., A.P.R., E.A.d.O.S., P.M.d.B.T., P.R.M.P.; resources, A.C.F.X., A.P.R., E.A.d.O.S., P.M.d.B.T., P.R.M.P.; data curation, A.C.F.X., A.P.R., E.A.d.O.S., P.M.d.B.T., P.R.M.P.; writing—original draft preparation, A.C.F.X., A.P.R., E.A.d.O.S., P.M.d.B.T., P.R.M.P.; writing—review and editing, A.C.F.X., A.P.R., E.A.d.O.S., P.M.d.B.T., P.R.M.P.; visualization, A.C.F.X.; supervision, P.R.M.P.; project administration, P.R.M.P.; funding acquisition, P.R.M.P. All authors have read and agreed to the published version of the manuscript.
Funding
This research was funded by Vale S.A/Instituto Tecnológico Vale, grant number R100603.MC (Project name: “Monitoramento de eventos críticos e subsídios para gestão de recursos hídricos da bacia hidrográfica do Rio Itacaiúnas”).
Acknowledgments
We would like to thank to Vale S.A and ITV (Instituto Tecnológico Vale/Vale Institute of Technology). This paper is a scientific product funding by VALE SA/ITV. A.P.R also thanks a doctorate scholarship from Coordenação de Aperfeiçoamento de Pessoal de Nível Superior—Brasil (CAPES)—Finance Code 001.
Conflicts of Interest
The authors declare no conflict of interest.
References
- Filho, W.L.F.C.; De Oliveira-Júnior, J.F.; Santiago, D.D.B.; Terassi, P.M.D.B.; Teodoro, P.E.; De Gois, G.; Blanco, C.J.C.; Souza, P.H.D.A.; da Silva Costa, M.; Gomes, H.B.; et al. Rainfall Variability in the Brazilian Northeast Biomes and Their Interactions with Meteorological Systems and ENSO via CHELSA Product. Big Earth Data 2019, 3, 315–337. [Google Scholar] [CrossRef]
- Beck, H.E.; Vergopolan, N.; Pan, M.; Levizzani, V.; van Dijk, A.I.J.M.; Weedon, G.P.; Brocca, L.; Pappenberger, F.; Huffman, G.J.; Wood, E.F. Global-Scale Evaluation of 22 Precipitation Datasets Using Gauge Observations and Hydrological Modeling. Hydrol. Earth Syst. Sci. 2017, 21, 6201–6217. [Google Scholar] [CrossRef]
- Pontes, P.R.M.; Cavalcante, R.; Sahoo, P.; da Silva Júnior, R.O.; da Silva, M.S.; Dall’Agnol, R.; Siqueira, J.O. The Role of Protected and Deforested Areas in the Hydrological Processes of Itacaiúnas River Basin, Eastern Amazonia. J. Environ. Manag. 2019, 235, 489–499. [Google Scholar] [CrossRef] [PubMed]
- De Oliveira Serrão, E.A.; Silva, M.T.; Ferreira, T.R.; de Paulo Rodrigues da Silva, V.; de Salviano de Sousa, F.; de Lima, A.M.M.; de Ataide, L.C.P.; Wanzeler, R.T.S. Land Use Change Scenarios and Their Effects on Hydropower Energy in the Amazon. Sci. Total Environ. 2020, 744, 140981. [Google Scholar] [CrossRef] [PubMed]
- De BodasTerassi, P.M.; de Oliveira-Júnior, J.F.; de Gois, G.; Júnior, A.C.O.; Sobral, B.; Biffi, V.H.R.; Blanco, C.J.C.; Filho, W.L.F.C.; Vijith, H. Rainfall and Erosivity in the Municipality of Rio de Janeiro—Brazil. Urban Clim. 2020, 33, 100637. [Google Scholar] [CrossRef]
- Cavalcante, R.B.L.; da SilvaFerreira, D.B.; Pontes, P.R.; Tedeschi, R.G.; da Costa, C.P.W.; de Souza, E. Evaluation of Extreme Rainfall Indices from CHIRPS Precipitation Estimates over the Brazilian Amazonia. Atmos. Res. 2020, 238, 104879. [Google Scholar] [CrossRef]
- Kidd, C.; Becker, A.; Huffman, G.J.; Muller, C.L.; Joe, P.; Skofronick-Jackson, G.; Kirschbaum, D.B. So, How Much of the Earth’s Surface Is Covered by Rain Gauges? Bull. Am. Meteorol. Soc. 2017, 98, 69–78. [Google Scholar] [CrossRef]
- Xavier, A.C.; King, C.W.; Scanlon, B.R. Daily Gridded Meteorological Variables in Brazil (1980–2013). Int. J. Climatol. 2016, 36, 2644–2659. [Google Scholar] [CrossRef]
- Xavier, A.C.F.; Rudke, A.P.; Fujita, T.; Blain, G.C.; De Morais, M.V.B.; De Almeida, D.S.; Rafee, S.A.A.; Martins, L.D.; De Souza, R.A.F.; De Freitas, E.D.; et al. Stationary and Non-Stationary Detection of Extreme Precipitation Events and Trends of Average Precipitation from 1980 to 2010 in the Paraná River Basin, Brazil. Int. J. Climatol. 2020, 40, 1197–1212. [Google Scholar] [CrossRef]
- Xavier, A.C.F.; Martins, L.L.; Rudke, A.P.; de Morais, M.V.B.; Martins, J.A.; Blain, G.C. Evaluation of Quantile Delta Mapping as a Bias-Correction Method in Maximum Rainfall Dataset from Downscaled Models in São Paulo State (Brazil). Int. J. Climatol. 2021. [Google Scholar] [CrossRef]
- Sun, Q.; Miao, C.; Duan, Q.; Ashouri, H.; Sorooshian, S.; Hsu, K.L. A Review of Global Precipitation Data Sets: Data Sources, Estimation, and Intercomparisons. Rev. Geophys. 2018, 56, 79–107. [Google Scholar] [CrossRef]
- Salio, P.; Hobouchian, M.P.; Skabar, Y.G.; Vila, D. Evaluation of High-Resolution Satellite Precipitation Estimates over Southern South America Using a Dense Rain Gauge Network. Atmos. Res. 2015, 163, 146–161. [Google Scholar] [CrossRef]
- Hobouchian, M.P.; Salio, P.; Skabar, Y.G.; Vila, D.; Garreaud, R. Assessment of Satellite Precipitation Estimates over the Slopes of the Subtropical Andes. Atmos. Res. 2017, 190, 43–54. [Google Scholar] [CrossRef]
- ANA Agência Nacional de Águas e Saneamento Básico: Rede Hidrometeorológica Nacional. Available online: https://dadosabertos.ana.gov.br/datasets/8014bf6e92144a9b871bb4136390f732_0/explore?filters=eyJFc3RhZG8iOlsiTUEiXSwiVGlwbyI6WyJQbHV2aW9t6XRyaWNhIl19&location=2.373885%2C-31.799803%2C4.94 (accessed on 10 July 2021).
- World Meteorological Organization. Guide to Hydrological Practices, Data Acquisition and Processing, Analysis, Forecasting and Other Applications; WMO: Geneva, Switzerland, 1994; p. 770. [Google Scholar]
- Gadelha, A.N.; Coelho, V.H.R.; Xavier, A.C.; Barbosa, L.R.; Melo, D.C.; Xuan, Y.; Huffman, G.J.; Petersen, W.A.; Almeida, d.N. Grid Box-Level Evaluation of IMERG over Brazil at Various Space and Time Scales. Atmos. Res. 2019, 218, 231–244. [Google Scholar] [CrossRef]
- Bolfe, É.L.; Victória, D.C.; Contini, E.; Bayma-Silva, G.; Spinelli-Araujo, L.; Gomes, D. Matopiba Em Crescimento Agrícola Aspectos Territoriais e Socioeconômicos. Rev. Política Agrícola 2017, 25, 38–62. [Google Scholar]
- Maranhão, G. do Estado do Lei Ordinária no 9.957, de 21 de Novembro de 2013; Palácio do Governo do Estado do Maranhão: São Luís, Brazil, 2013. [Google Scholar]
- Vale, S.A. Relato Int.egrado, Vale, Brazil. 2020. Available online: http://www.vale.com/brasil/pt/business/reports/siteassets/relato-integrado-2020/assets/docs/vale_relato_integrado_2020.pdf (accessed on 12 July 2021).
- IBGE Censo Demográfico. 2017. Available online: https://cidades.ibge.gov.br/brasil/ma/panorama (accessed on 31 May 2021).
- CODEVASF. Plano Nascente Mearim: Plano de Preservação e Recuperação de Nascentes da Bacia do rio Mearim; Evolução do Conhecimento Científico na Engenharia Ambiental e Sanitária: Brasília, Brazil, 2019; p. 190. [Google Scholar]
- IBGE Censo. 2010. Available online: https://cidades.ibge.gov.br/brasil/ma/pesquisa/48/48986?tipo=ranking&indicador=48986 (accessed on 12 July 2021).
- Mearim, P.N. Plano de Recuperação de Nascentes Do Rio Mearim; Codevasf Sede: Brasília, Brazil, 2019; p. 190. [Google Scholar]
- Castells-Quintana, D.; del PilarLopez-Uribe, M.; McDermott, T.K. Adaptation to Climate Change: A Review through a Development Economics Lens. World Dev. 2018, 104, 183–196. [Google Scholar] [CrossRef]
- Yuan, X.-C.; Wei, Y.-M.; Wang, B.; Mi, Z. Risk Management of Extreme Events under Climate Change. J. Clean. Prod. 2017, 166, 1169–1174. [Google Scholar] [CrossRef]
- Soares, M.O.; Campos, C.C.; Carneiro, P.B.M.; Barroso, H.S.; Marins, R.V.; Teixeira, C.E.P.; Menezes, M.O.B.; Pinheiro, L.S.; Viana, M.B.; Feitosa, C.V.; et al. Challenges and Perspectives for the Brazilian Semi-Arid Coast under Global Environmental Changes. Perspect. Ecol. Conserv. 2021. [Google Scholar] [CrossRef]
- IBGE Downloads: Geociências, Organização Territorial. Available online: https://www.ibge.gov.br/geociencias/downloads-geociencias.html (accessed on 9 June 2021).
- Alvares, C.A.; Stape, J.L.; Sentelhas, P.C.; Gonçalves, J.L.D.M.; Sparovek, G. Köppen’s Climate Classification Map for Brazil. Meteorol. Z. 2013, 22, 711–728. [Google Scholar] [CrossRef]
- Rodrigues, D.T.; Gonçalves, W.A.; Spyrides, M.H.C.; Silva, C.M.S. e Spatial and Temporal Assessment of the Extreme and Daily Precipitation of the Tropical Rainfall Measuring Mission Satellite in Northeast Brazil. Int. J. Remote Sens. 2020, 41, 549–572. [Google Scholar] [CrossRef]
- Cavalcante, R.B.L.; Pontes, P.R.M.; Souza-Filho, P.W.M.; de Souza, E. Opposite Effects of Climate and Land Use Changes on the Annual Water Balance in the Amazon Arc of Deforestation. Water Resour. Res. 2019, 55, 3092–3106. [Google Scholar] [CrossRef]
- Hastenrath, S.; Heller, L. Dynamics of Climatic Hazards in Northeast Brazil. Q. J. R. Meteorol. Soc. 1977, 103, 77–92. [Google Scholar] [CrossRef]
- Bombardi, R.J.; Trenary, L.; Pegion, K.; Cash, B.; Delsole, T.; Kinter, J.L., III. Seasonal Predictability of Summer Rainfall over South America Seasonal Predictability of Summer Rainfall over South America. J. Clim. 2018, 31, 8181–8195. [Google Scholar] [CrossRef]
- Fedorova, N.; dos Santos, D.M.B.; Segundo, M.M.L.; Levit, V. Middle Tropospheric Cyclonic Vortex in Northeastern Brazil and the Tropical Atlantic. Pure Appl. Geophys. 2017, 174, 397. [Google Scholar] [CrossRef]
- Fedorova, N.; Levit, V.; Campos, A.M.V. Brazilian Northeast Jet Stream: Association with Synoptic-scale Systems. Meteorol. Appl. 2018, 25, 261–268. [Google Scholar] [CrossRef]
- Kousky, V.E.; Kagano, M.T.; Cavalcanti, I.F.A. A Review of the Southern Oscillation: Oceanic-atmospheric Circulation Changes and Related Rainfall Anomalies. Tellus 1984, 36A, 490–504. [Google Scholar] [CrossRef]
- Silva, M.T.; Alcântara, C.R.; de Souza, E.P.; de Olinda, R.A.; Gonçalves, W.A. Influência Da Temperatura Da Superfície Do Mar Na Ocorrência de Linhas de Instabilidade Na Costa Norte e Nordeste Do Brasil. Rev. Bras. Meteorol. 2017, 32, 260–268. [Google Scholar] [CrossRef]
- Lam, N.S.-N. Spatial Interpolation Methods: A Review. Am. Cartogr. 1983, 10, 129–150. [Google Scholar] [CrossRef]
- Grain, I.K. Computer Interpolation and Contouring of Two-Dimensional Data: A Review. Geoexploration 1970, 8, 71–86. [Google Scholar] [CrossRef]
- Paredes-Trejo, F.J.; Barbosa, H.A.; Kumar, T.V.L. Validating CHIRPS-Based Satellite Precipitation Estimates in Northeast Brazil. J. Arid. Environ. 2017, 139, 26–40. [Google Scholar] [CrossRef]
- Almagro, A.; Oliveira, P.T.S.; Nearing, M.A.; Hagemann, S. Projected Climate Change Impacts in Rainfall Erosivity over Brazil. Sci. Rep.-UK 2017, 7, 8130. [Google Scholar] [CrossRef]
- Pousa, R.; Costa, M.H.; Pimenta, F.; Fontes, V.C.; de Brito, V.F.A.; Castro, M. Climate Change and Intense Irrigation Growth in Western Bahia, Brazil: The Urgent Need for Hydroclimatic Monitoring. Water-Sui 2019, 11, 933. [Google Scholar] [CrossRef]
- Avila-Diaz, A.; Abrahão, G.; Justino, F.; Torres, R.; Wilson, A. Extreme Climate Indices in Brazil: Evaluation of Downscaled Earth System Models at High Horizontal Resolution. Clim. Dynam. 2020, 54, 5065–5088. [Google Scholar] [CrossRef]
- Avila-Diaz, A.; Benezoli, V.; Justino, F.; Torres, R.; Wilson, A. Assessing Current and Future Trends of Climate Extremes across Brazil Based on Reanalyses and Earth System Model Projections. Clim. Dynam. 2020, 55, 1403–1426. [Google Scholar] [CrossRef]
- Lucas, E.W.M.; de Assis Salviano de Souza, F.; Daneil, F.; Júnior, R.; Duarte, D.; de Paulo Rodrigues da Silva, V. Trends in Climate Extreme Indices Assessed in the Xingu River Basin—Brazilian Amazon. Weather Clim. Extrem. 2021, 31, 100306. [Google Scholar] [CrossRef]
- Hijmans, R.J. Raster: Geographic Data Analysis and Modeling [R package raster version 3.4-10]. 2021. Available online: http://cran.stat.unipd.it/web/packages/raster/ (accessed on 9 June 2021).
- Funk, C.; Peterson, P.; Landsfeld, M.; Pedreros, D.; Verdin, J.; Shukla, S.; Husak, G.; Rowland, J.; Harrison, L.; Hoell, A.; et al. The Climate Hazards Infrared Precipitation with Stations—a New Environmental Record for Monitoring Extremes. Sci. Data 2015, 2, 150066. [Google Scholar] [CrossRef]
- Beck, H.E.; Wood, E.F.; Pan, M.; Fisher, C.K.; Miralles, D.G.; Van Dijk, A.; McVicar, T.R.; Adler, R.F. MSWep v2 Global 3-Hourly 0.1° Precipitation: Methodology and Quantitative Assessment. Bull. Am. Meteorol. Soc. 2019, 100, 473–500. [Google Scholar] [CrossRef]
- Chen, L.; Dirmeyer, P.A.; Tawfik, A.; Lawrence, D.M. Sensitivities of Land Cover–Precipitation Feedback to Convective Triggering. J. Hydrometeorol. 2017, 18, 2265–2283. [Google Scholar] [CrossRef]
- Chen, L.; Dirmeyer, P.A. Impacts of Land-Use/Land-Cover Change on Afternoon Precipitation over North America. J. Clim. 2017, 30, 2121–2140. [Google Scholar] [CrossRef]
- Joyce, R.J.; Janowiak, J.E.; Arkin, P.A.; Xie, P. CMORPH: A Method That Produces Global Precipitation Estimates from Passive Microwave and Infrared Data at High Spatial and Temporal Resolution. J. Hydrometeorol. 2004, 5, 487–503. [Google Scholar] [CrossRef]
- Costa, R.L.; de Mello Baptista, G.M.; Gomes, H.B.; dos Santos Silva, F.D.; da Rocha Júnior, R.L.; de Araújo Salvador, M.; Herdies, D.L. Analysis of Climate Extremes Indices over Northeast Brazil from 1961 to 2014. Weather Clim. Extrem. 2020, 28, 100254. [Google Scholar] [CrossRef]
- Dee, D.P.; Uppala, S.M.; Simmons, A.J.; Berrisford, P.; Poli, P.; Kobayashi, S.; Andrae, U.; Balmaseda, M.A.; Balsamo, G.; Bauer, P.; et al. The ERA-Interim Reanalysis: Configuration and Performance of the Data Assimilation System. Q. J. R. Meteorol. Soc. 2011, 137, 553–597. [Google Scholar] [CrossRef]
- Schneider, U.; Finger, P.; Meyer-Christoffer, A.; Rustemeier, E.; Ziese, M.; Becker, A. Evaluating the Hydrological Cycle over Land Using the Newly-Corrected Precipitation Climatology from the Global Precipitation Climatology Centre (GPCC). Atmosphere 2017, 8, 52. [Google Scholar] [CrossRef]
- Schneider, U.; Becker, A.; Finger, P.; Meyer-Christoffer, A.; Ziese, M.; Rudolf, B. GPCC’s New Land Surface Precipitation Climatology Based on Quality-Controlled in Situ Data and Its Role in Quantifying the Global Water Cycle. Theor. Appl. Climatol. 2014, 115, 15–40. [Google Scholar] [CrossRef]
- Knapp, K.R.; Ansari, S.; Bain, C.L.; Bourassa, M.A.; Dickinson, M.J.; Funk, C.; Helms, C.N.; Hennon, C.C.; Holmes, C.D.; Huffman, G.J.; et al. Globally Gridded Satellite Observations for Climate Studies. Bull. Am. Meteorol. Soc. 2011, 92, 893–907. [Google Scholar] [CrossRef]
- Ushio, T.; Sasashige, K.; Kubota, T.; Shige, S.; Okamoto, K.; Aonashi, K.; Inoue, T.; Takahashi, N.; Iguchi, T.; Kachi, M.; et al. A Kalman Filter Approach to the Global Satellite Mapping of Precipitation (GSMaP) from Combined Passive Microwave and Infrared Radiometric Data. J. Meteorol. Soc. Jpn. Ser. II 2009, 87A, 137–151. [Google Scholar] [CrossRef]
- Kobayashi, S.; Ota, Y.; Harada, Y.; Ebita, A.; Moriya, M.; Onoda, H.; Onogi, K.; Kamahori, H.; Kobayashi, C.; Endo, H.; et al. The JRA-55 Reanalysis: General Specifications and Basic Characteristics. J. Meteorol. Soc. Jpn. Ser. II 2015, 93, 5–48. [Google Scholar] [CrossRef]
- Huffman, G.J.; Bolvin, D.T.; Nelkin, E.J.; Wolff, D.B.; Adler, R.F.; Gu, G.; Hong, Y.; Bowman, K.P.; Stocker, E.F. The TRMM Multisatellite Precipitation Analysis (TMPA): Quasi-Global, Multiyear, Combined-Sensor Precipitation Estimates at Fine Scales. J. Hydrometeorol. 2007, 8, 38–55. [Google Scholar] [CrossRef]
- Fick, S.E.; Hijmans, R.J. WorldClim 2: New 1-km Spatial Resolution Climate Surfaces for Global Land Areas. Int. J. Climatol. 2017, 37, 4302–4315. [Google Scholar] [CrossRef]
- Ashouri, H.; Hsu, K.-L.; Sorooshian, S.; Braithwaite, D.K.; Knapp, K.R.; Cecil, L.D.; Nelson, B.R.; Prat, O.P. PERSIANN-CDR: Daily Precipitation Climate Data Record from Multisatellite Observations for Hydrological and Climate Studies. Bull. Am. Meteorol. Soc. 2015, 96, 69–83. [Google Scholar] [CrossRef]
- Sorooshian, S.; Hsu, K.-L.; Gao, X.; Gupta, H.V.; Imam, B.; Braithwaite, D. Evaluation of PERSIANN System Satellite–Based Estimates of Tropical Rainfall. Bull. Am. Meteorol. Soc. 2000, 81, 2035–2046. [Google Scholar] [CrossRef]
- Uvo, C.B.; Foster, K.; Olsson, J. The Spatio-Temporal Influence of Atmospheric Teleconnection Patterns on Hydrology in Sweden. J. Hydrol. Reg. Stud. 2021, 34, 100782. [Google Scholar] [CrossRef]
- Karl, T. Overview. In Weather and Climate Extremes; Karl, T.R., Nicholls, N., Ghazi, A., Eds.; Springer: Dordrecht, The Netherlands, 1999; pp. 1–2. [Google Scholar] [CrossRef]
- Das Amorim, J.; Viola, M.; Junqueira, R.; Oliveira, V.; Mello, C. Evaluation of Satellite Precipitation Products for Hydrological Modeling in the Brazilian Cerrado Biome. Water 2020, 12, 2571. [Google Scholar] [CrossRef]
- Gnitou, G.T.; Tan, G.; Niu, R.; Nooni, I.K. Assessing Past Climate Biases and the Added Value of CORDEX-CORE Precipitation Simulations over Africa. Remote Sens. 2021, 13, 2058. [Google Scholar] [CrossRef]
- Rougé, C.; Ge, Y.; Cai, X. Detecting Gradual and Abrupt Changes in Hydrological Records. Adv. Water Resour. 2013, 53, 33–44. [Google Scholar] [CrossRef]
- Schellander, H.; Lieb, A.; Hell, T. Error Structure of Metastatistical and Generalized Extreme Value Distributions for Modeling Extreme Rainfall in Austria. Earth Space Sci. 2019, 6, 1616–1632. [Google Scholar] [CrossRef]
- Nascimento, J.G.; Althoff, D.; Bazame, H.C.; Neale, C.M.U.; Duarte, S.N.; Ruhoff, A.L.; Gonçalves, I.Z. Evaluating the Latest Imerg Products in a Subtropical Climate: The Case of Paraná State, Brazil. Remote Sens. 2021, 13, 906. [Google Scholar] [CrossRef]
- Al-Falahi, A.H.; Saddique, N.; Spank, U.; Gebrechorkos, S.H.; Bernhofer, C. Evaluation the Performance of Several Gridded Precipitation Products over the Highland Region of Yemen for Water Resources Management. Remote Sens. 2020, 12, 2984. [Google Scholar] [CrossRef]
- Wilks, D.S. Statistical Methods in the Atmospheric Sciences, 3rd ed.; Academic Press: Cambridge, MA, USA, 2011; Volume 10, ISBN 978-0-12-385022-5. [Google Scholar]
- AghaKouchak, A.; Behrangi, A.; Sorooshian, S.; Hsu, K.; Amitai, E. Evaluation of Satellite-retrieved Extreme Precipitation Rates across the Central United States. J. Geophys. Res. Atmos. 2011, 116. [Google Scholar] [CrossRef]
- AghaKouchak, A.; Mehran, A. Extended Contingency Table: Performance Metrics for Satellite Observations and Climate Model Simulations. Water Resour. Res. 2013, 49, 7144–7149. [Google Scholar] [CrossRef]
- Islam, A. Statistical Comparison of Satellite-Retrieved Precipitation Products with Rain Gauge Observations over Bangladesh. Int. J. Remote Sens. 2018, 39, 2906–2936. [Google Scholar] [CrossRef]
- Hamed, K.H.; Rao, A.R. A Modified Mann-Kendall Trend Test for Autocorrelated Data. J. Hydrol. 1998, 204, 182–196. [Google Scholar] [CrossRef]
- Hamed, K.H. Trend Detection in Hydrologic Data: The Mann-Kendall Trend Test under the Scaling Hypothesis. J. Hydrol. 2008, 349, 350–363. [Google Scholar] [CrossRef]
- Yagbasan, O.; Demir, V.; Yazicigil, H. Trend Analyses of Meteorological Variables and Lake Levels for Two Shallow Lakes in Central Turkey. Water 2020, 12, 414. [Google Scholar] [CrossRef]
- Dos Reis, L.C.; Santos e Silva, C.M.; Bezerra, B.; Mutti, P.R.; Spyrides, M.H.C.; da Silva, P.E. Analysis of Climate Extreme Indices in the MATOPIBA Region, Brazil. Pure Appl. Geophys. 2020, 177, 4457–4478. [Google Scholar] [CrossRef]
- Regoto, P.; Dereczynski, C.; Chou, S.C.; Bazzanela, A.C. Observed Changes in Air Temperature and Precipitation Extremes over Brazil. Int. J. Climatol. 2021. [Google Scholar] [CrossRef]
- Sousa, P.M.; Trigo, R.M.; Aizpurua, P.; Nieto, R.; Gimeno, L. Trends and Extremes of Drought Indices throughout the 20th Century in the Mediterranean. Nat. Hazard. Earth Sys. 2011, 11, 33–51. [Google Scholar] [CrossRef]
- Mu, Y.; Biggs, T.; Shen, S.S.P. Satellite-Based Precipitation Estimates Using a Dense Rain Gauge Network over the Southwestern Brazilian Amazon: Implication for Identifying Trends in Dry Season Rainfall. Atmos. Res. 2021, 105741. [Google Scholar] [CrossRef]
- Nguyen, P.; Ombadi, M.; Sorooshian, S.; Hsu, K.; AghaKouchak, A.; Brathwaite, D.; Ashouri, H.; Thorstensen, A.R. The PERSIANN Family of Global Satellite Precipitation Data: A Review and Evaluation of Products. Hydrol. Earth Syst. Sci. Discuss. 2018, 1–34. [Google Scholar] [CrossRef]
- Pfeifroth, U.; Mueller, R.; Ahrens, B. Evaluation of Satellite-Based and Reanalysis Precipitation Data in the Tropical Pacific. J. Appl. Meteorol. Clim. 2013, 52, 634–644. [Google Scholar] [CrossRef]
- Nasrollahi, N.; Hsu, K.; Sorooshian, S. An Artificial Neural Network Model to Reduce False Alarms in Satellite Precipitation Products Using MODIS and CloudSat Observations. J. Hydrometeorol. 2013, 14, 1872–1883. [Google Scholar] [CrossRef]
- Alijanian, M.; Rakhshandehroo, G.R.; Mishra, A.K.; Dehghani, M. Evaluation of Satellite Rainfall Climatology Using CMORPH, PERSIANN-CDR, PERSIANN, TRMM, MSWEP over Iran. Int. J. Climatol. 2017, 37, 4896–4914. [Google Scholar] [CrossRef]
- Hooper, E.; Chapman, L. The Impacts of Climate Change on National Road and Rail Networks. In Transport and Climate Change; Transport and Sustainability; Europe Union: Luxembourg, 2012; pp. 105–136. ISBN 9781780524405. [Google Scholar]
- Ilalokhoin, O.; Pant, R.; Hall, J.W. A Multi-Track Rail Model for Estimating Journey Impacts from Extreme Weather Events: A Case Study of Great Britain’s Rail Network. Int. J. Rail Transp. 2021, 1–26. [Google Scholar] [CrossRef]
- Trinks, C.; Hiete, M.; Comes, T.; Schultmann, F. Extreme Weather Events and Road and Rail Transportation in Germany. Int. J. Emerg. Manag. 2012, 8, 207. [Google Scholar] [CrossRef]
- Klenzendorf, J.B.; Barrett, M.E.; Charbeneau, R.J. Impact of Bridge Rail Geometry on Floodplain Analysis. J. Hydrol. Eng. 2010, 15, 1016–1022. [Google Scholar] [CrossRef]
- Izaguirre, C.; Losada, I.J.; Camus, P.; Vigh, J.L.; Stenek, V. Climate Change Risk to Global Port Operations. Nat. Clim. Chang. 2021, 11, 14–20. [Google Scholar] [CrossRef]
- Gourlay, M.R. Wave Set-Up. In Encyclopedia of Earth Sciences Series; Springer Netherlands: Dordrecht, The Netherlands, 2011; p. 1144. ISBN 978-90-481-2639-2. [Google Scholar]
- Konisky, D.M.; Hughes, L.; Kaylor, C.H. Extreme Weather Events and Climate Change Concern. Clim. Chang. 2016, 134, 533–547. [Google Scholar] [CrossRef]
- Zhao, W. Extreme Weather and Climate Events in China under Changing Climate. Natl. Sci. Rev. 2020, 7, 938–943. [Google Scholar] [CrossRef]
- Tubiello, F.N.; Soussana, J.-F.; Howden, S.M. Crop and Pasture Response to Climate Change. Proc. Natl. Acad. Sci. USA 2007, 104, 19686–19690. [Google Scholar] [CrossRef]
- Khanna, J.; Medvigy, D.; Fueglistaler, S.; Walko, R. Regional Dry-Season Climate Changes Due to Three Decades of Amazonian Deforestation. Nat. Clim. Chang. 2017, 7, 200–204. [Google Scholar] [CrossRef]
- Sales, F.D.; Santiago, T.; Biggs, T.W.; Mullan, K.; Sills, E.O.; Monteverde, C. Impacts of Protected Area Deforestation on Dry-Season Regional Climate in the Brazilian Amazon. J. Geophys. Res. Atmos. 2020, 125. [Google Scholar] [CrossRef]
- Saeidizand, R.; Sabetghadam, S.; Tarnavsky, E.; Pierleoni, A. Evaluation of CHIRPS Rainfall Estimates over Iran. Q. J. R. Meteorol. Soc. 2018, 144, 282–291. [Google Scholar] [CrossRef]
- AghaKouchak, A.; Nakhjiri, N. A near Real-Time Satellite-Based Global Drought Climate Data Record. Environ. Res. Lett. 2012, 7, 044037. [Google Scholar] [CrossRef]
- Derin, Y.; Yilmaz, K.K. Evaluation of Multiple Satellite-Based Precipitation Products over Complex Topography. J. Hydrometeorol. 2014, 15, 1498–1516. [Google Scholar] [CrossRef]
- De Moraes Cordeiro, A.L.; Blanco, C.J.C. Assessment of Satellite Products for Filling Rainfall Data Gaps in the Amazon Region. Nat. Resour. Model. 2021, 34. [Google Scholar] [CrossRef]
Publisher’s Note: MDPI stays neutral with regard to jurisdictional claims in published maps and institutional affiliations. |
© 2021 by the authors. Licensee MDPI, Basel, Switzerland. This article is an open access article distributed under the terms and conditions of the Creative Commons Attribution (CC BY) license (https://creativecommons.org/licenses/by/4.0/).

