
Spatiotemporal Distribution of Total Suspended Matter Concentration in Changdang Lake Based on In Situ Hyperspectral Data and Sentinel-2 Images

 ,
,
Abstract
:1. Introduction
2. Data and Methods
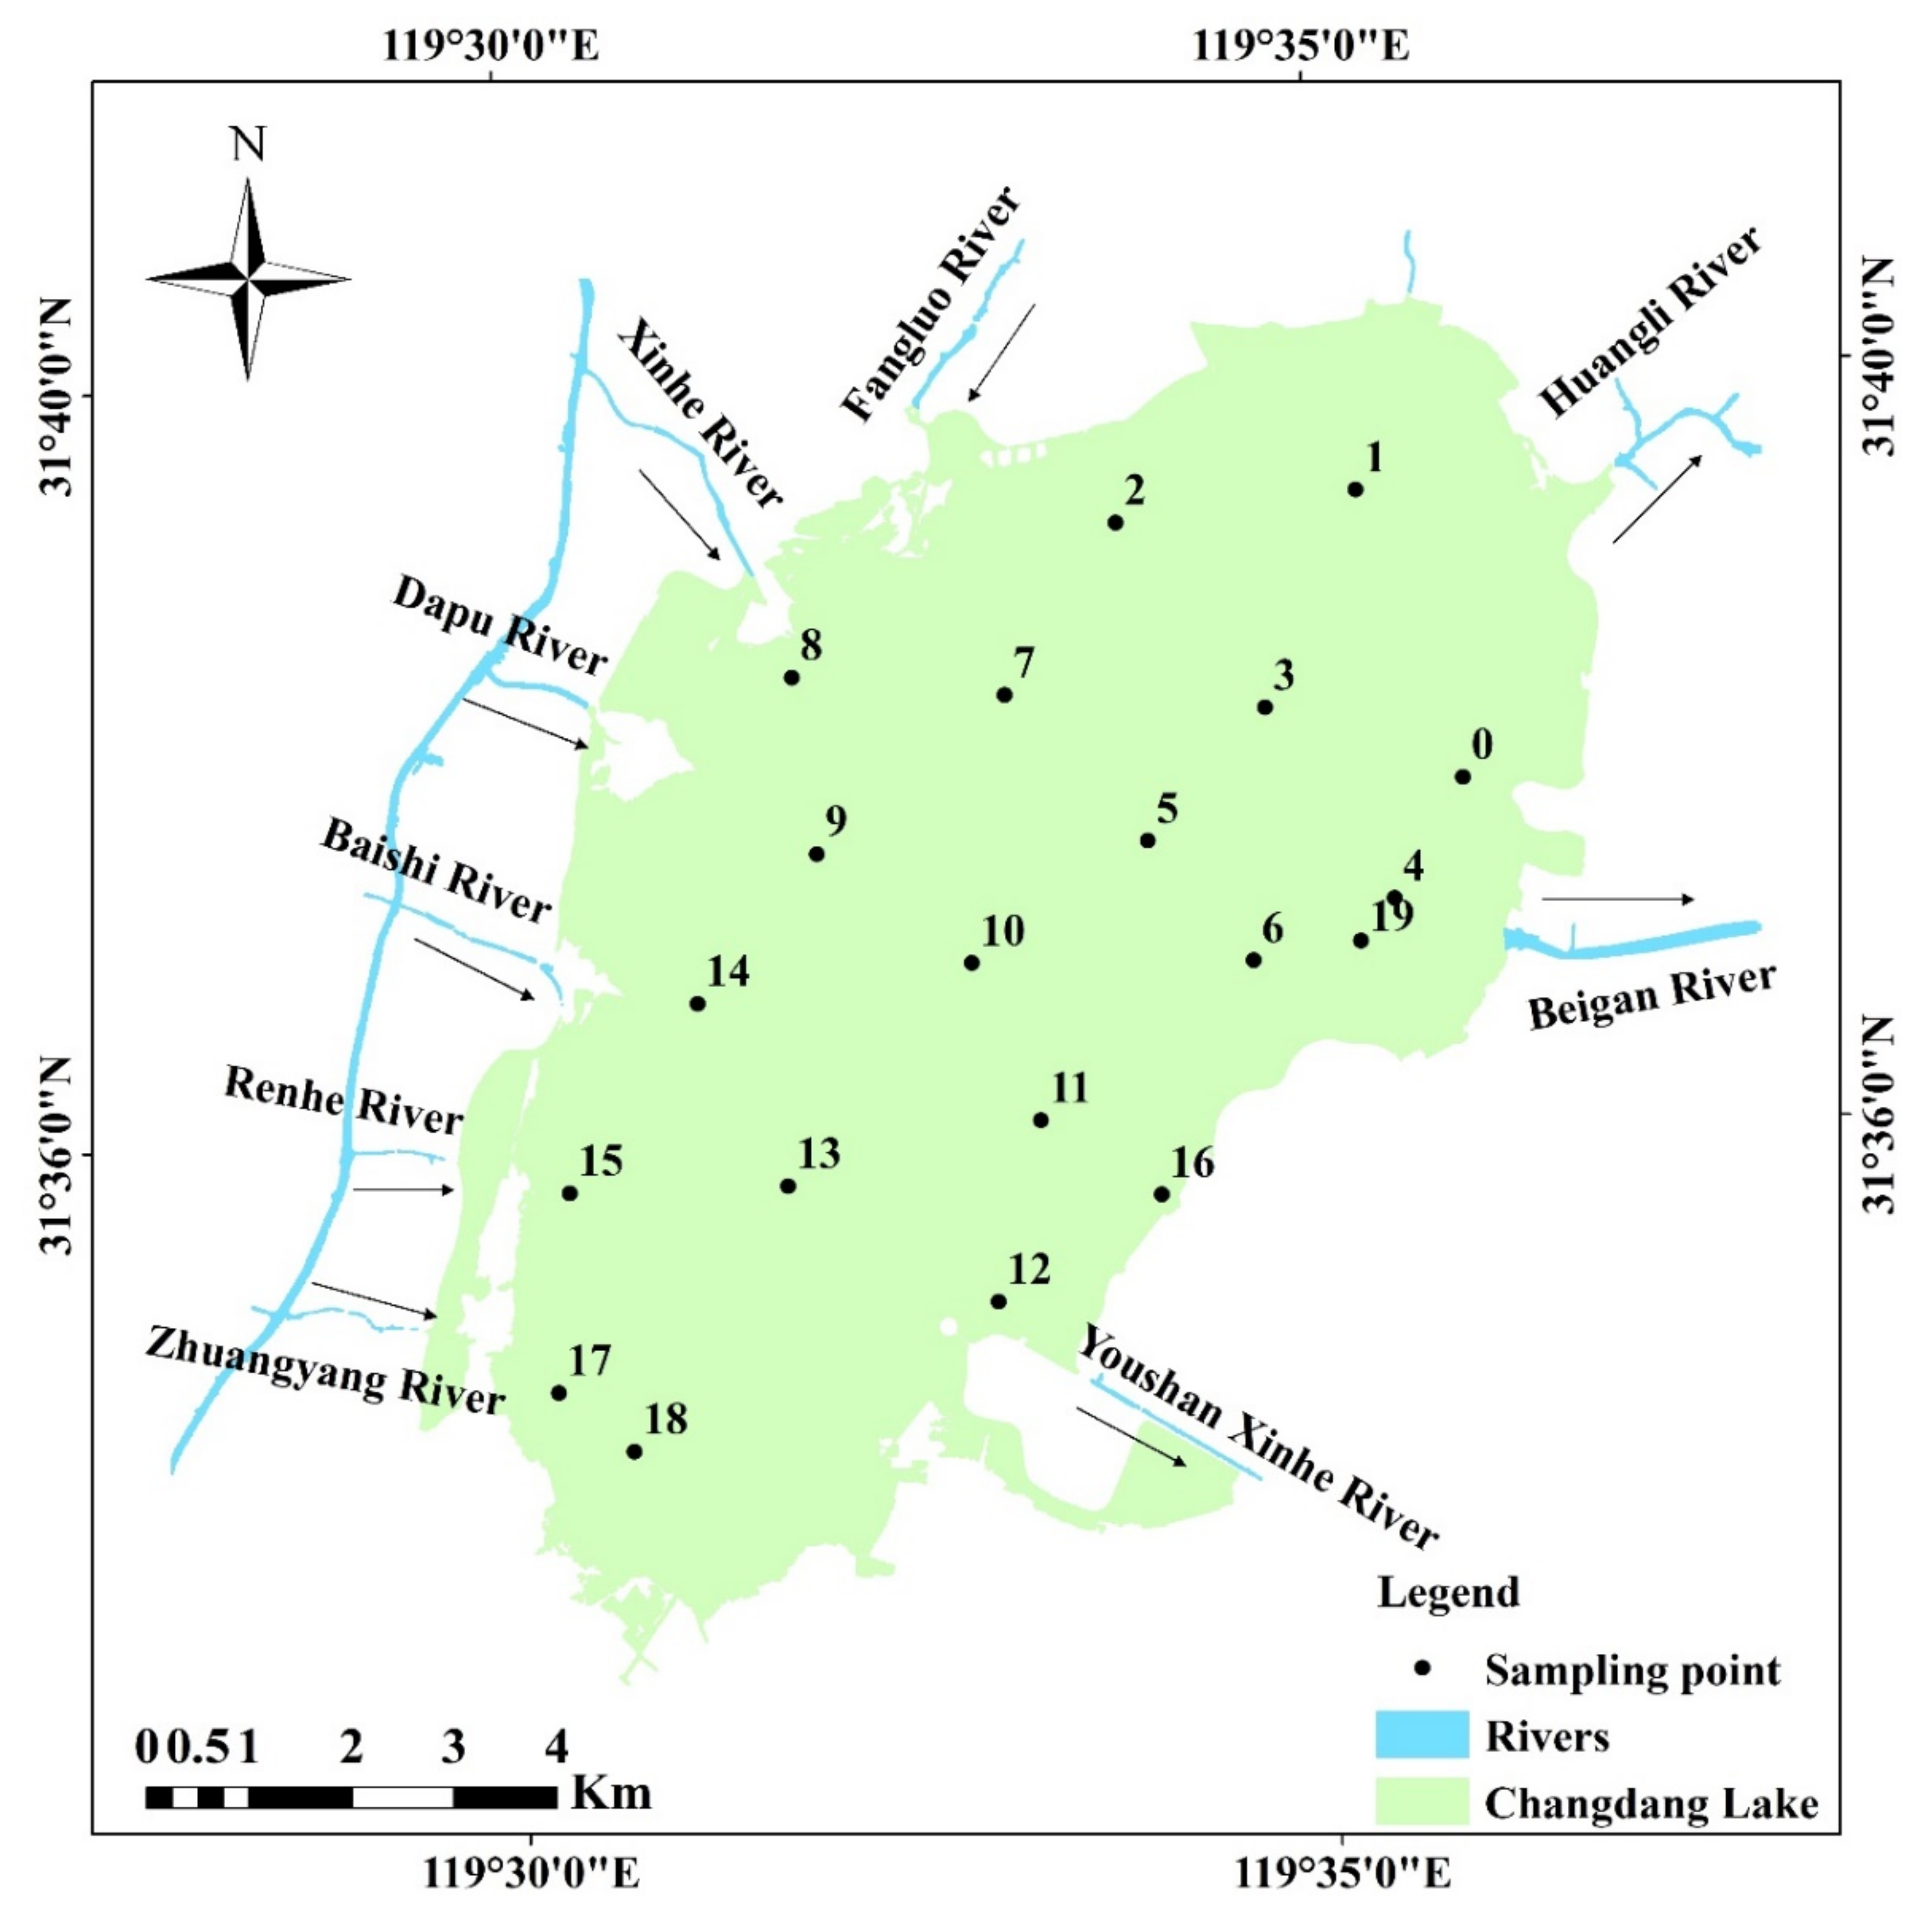
2.1. Study Area
2.2. Data Sources
2.2.1. Measured Data
2.2.2. Remote Sensing and Meteorological Data
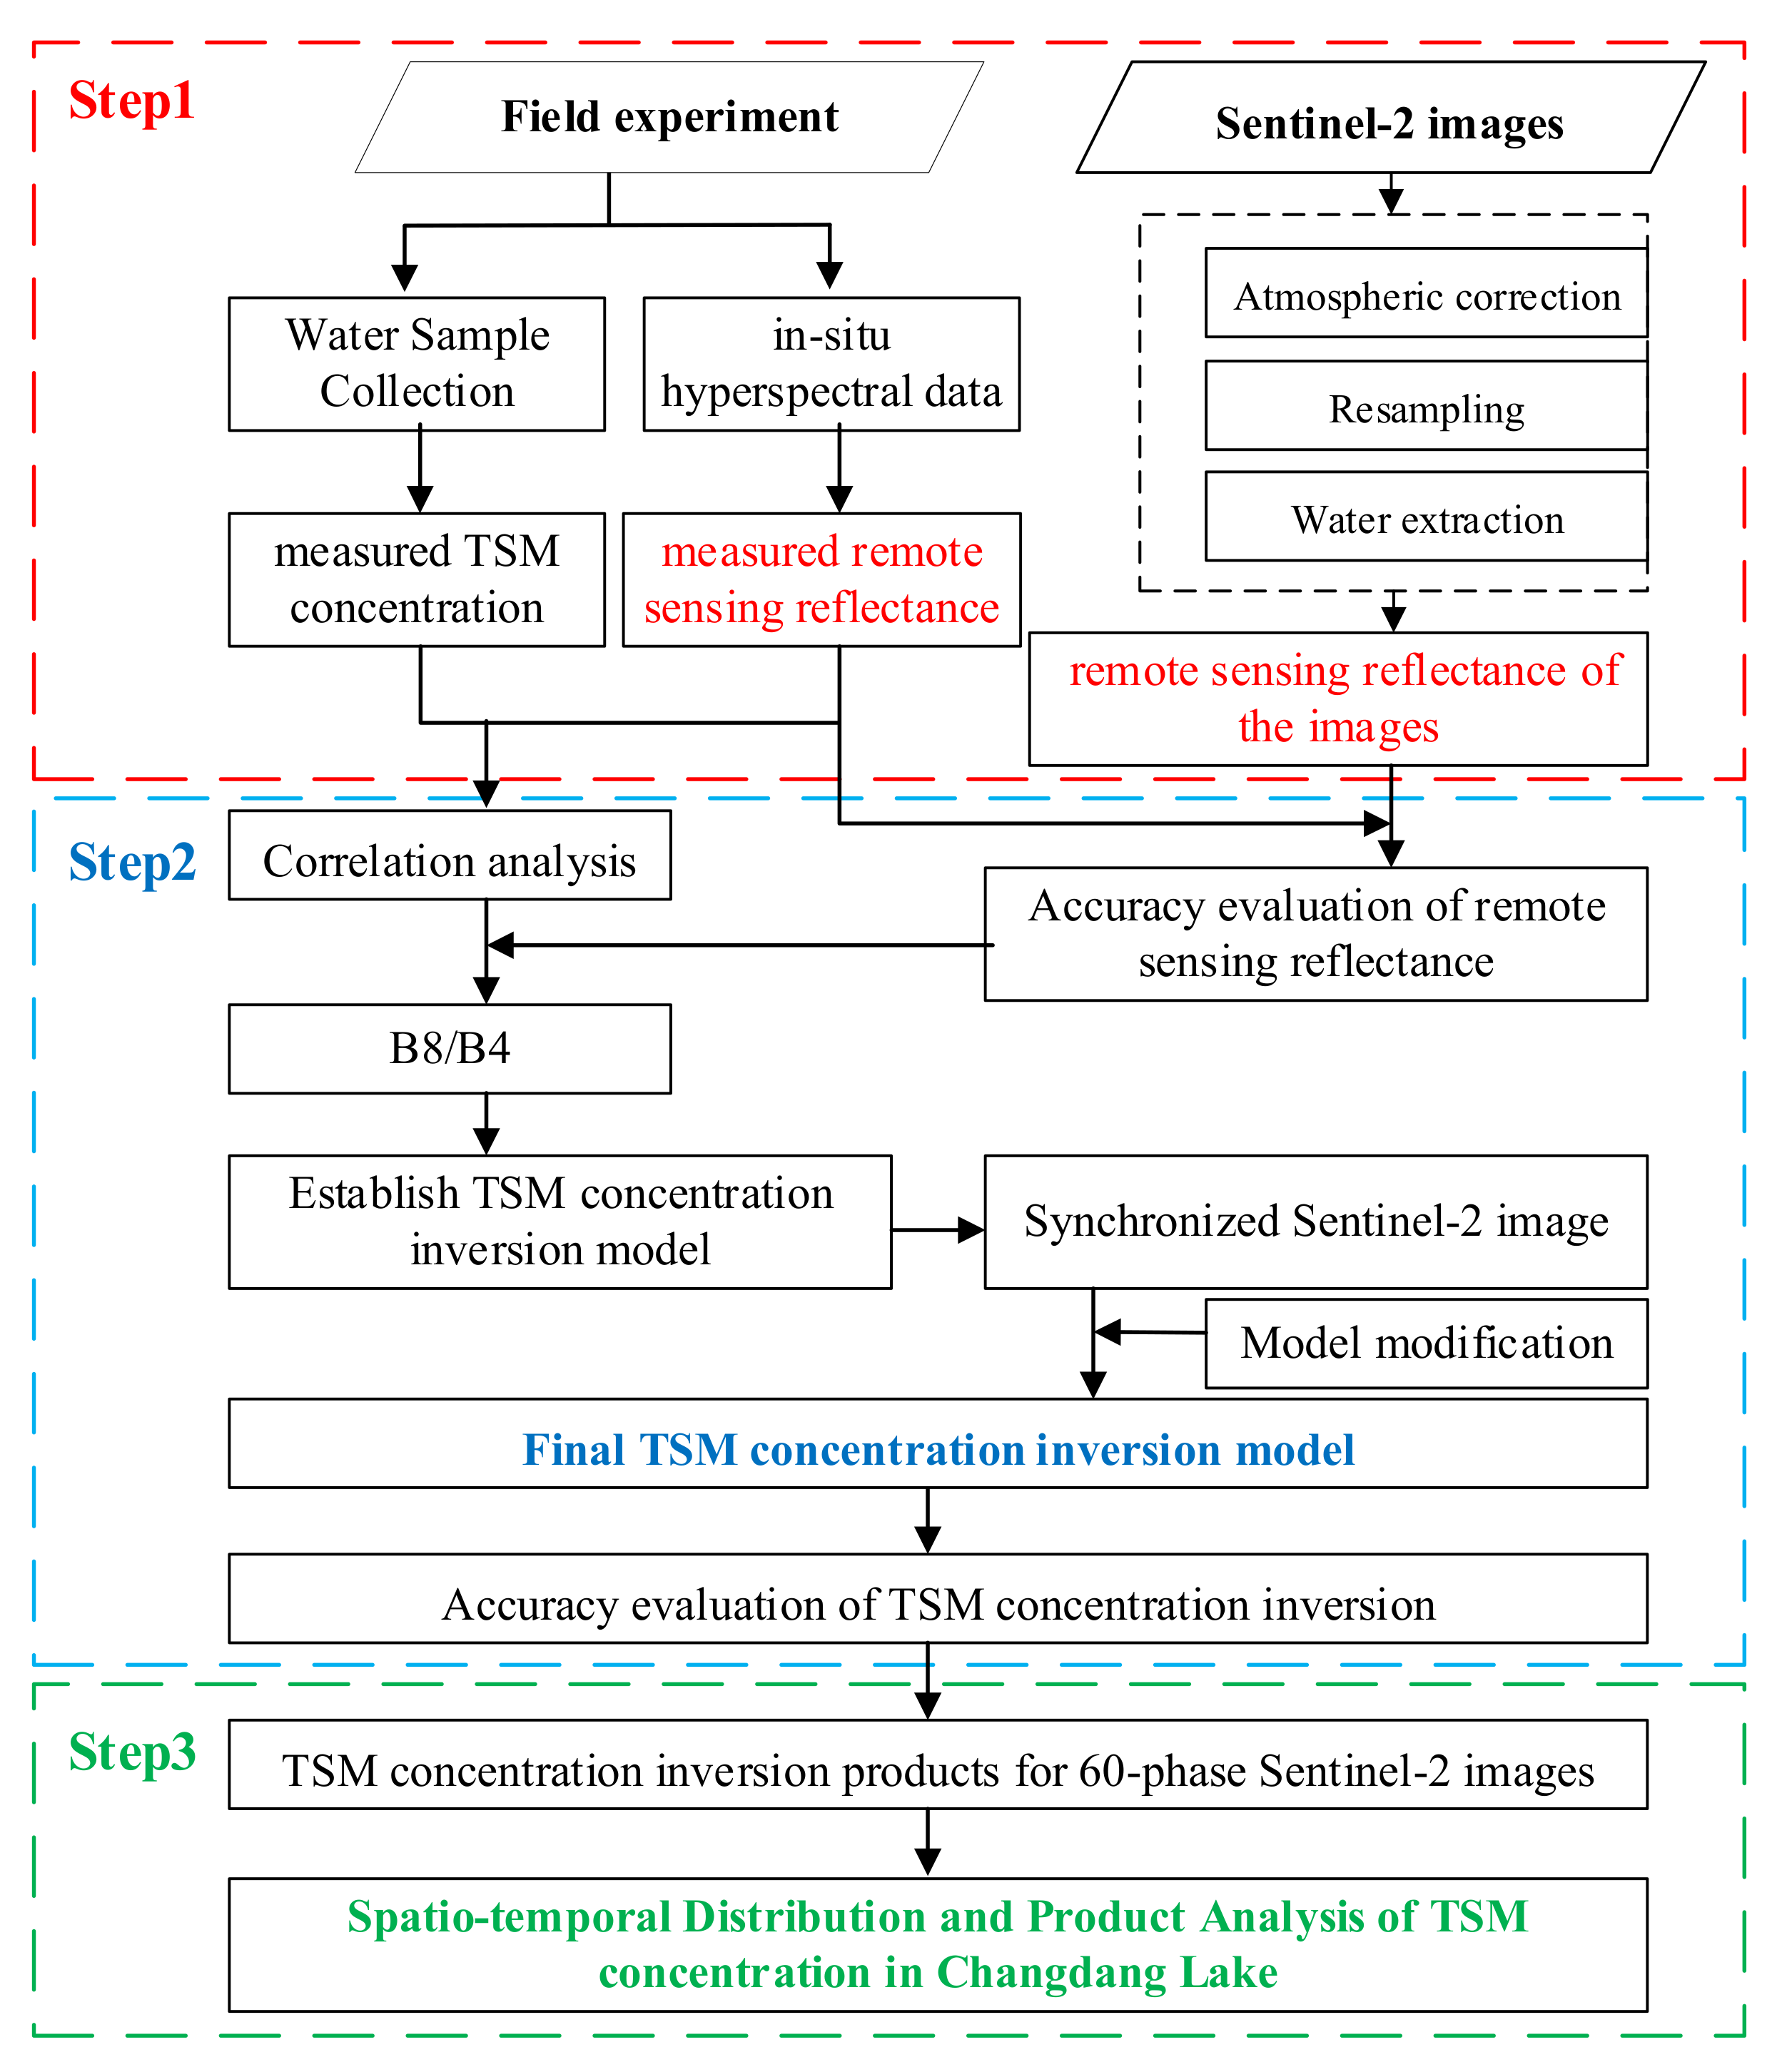
2.3. Research Methods
2.3.1. Sentinel-2 Image Recorrection
2.3.2. Accuracy Evaluation Index
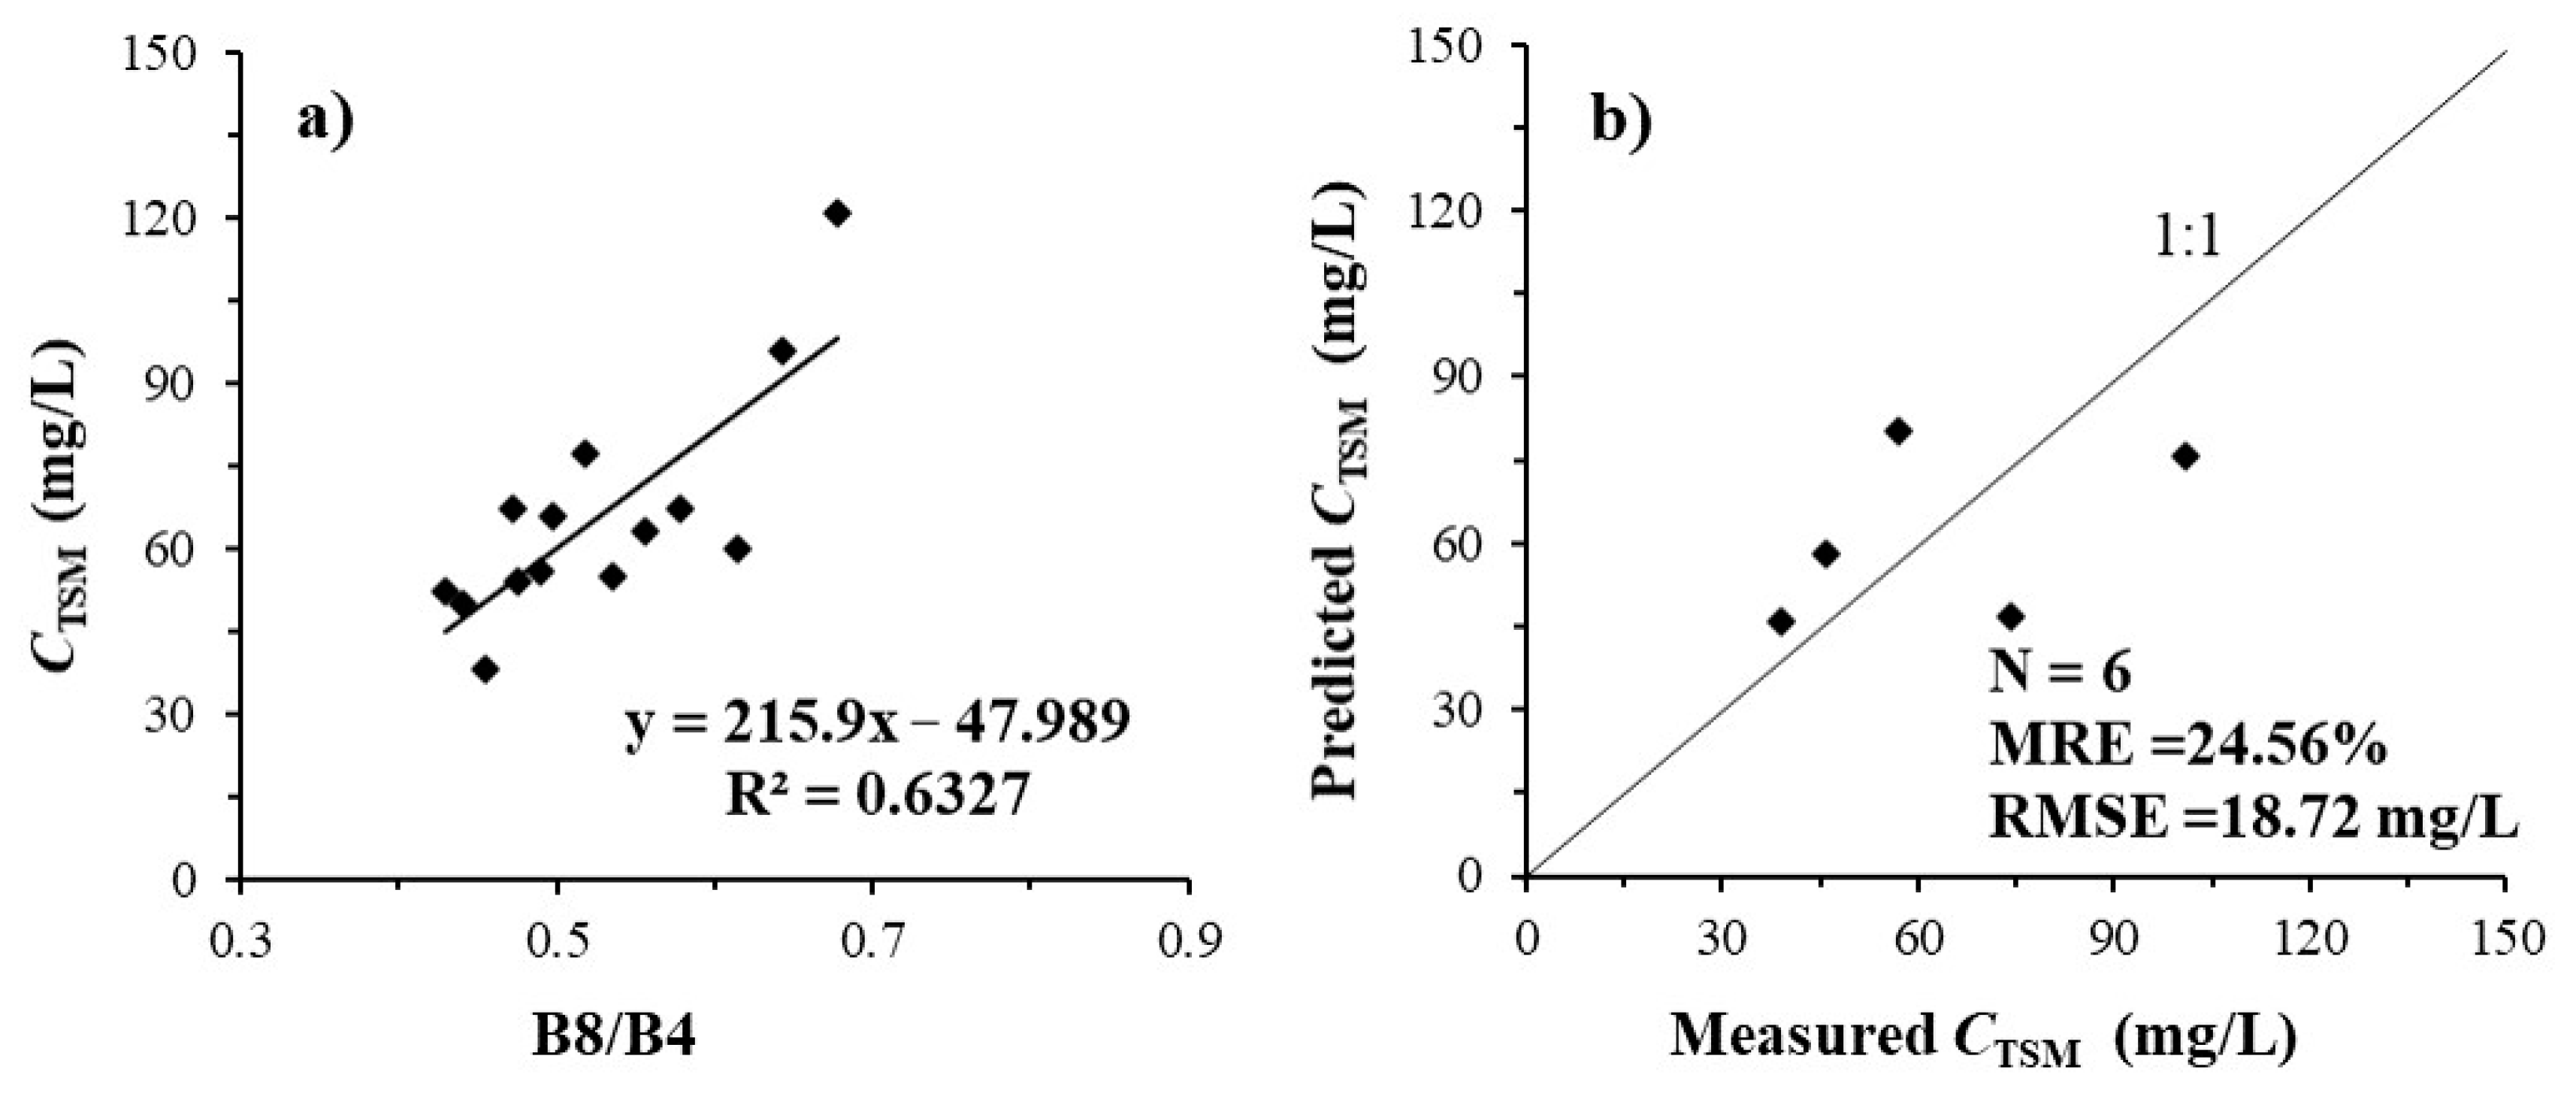
2.3.3. Construction of the TSM Concentration Inversion Model
- (1)
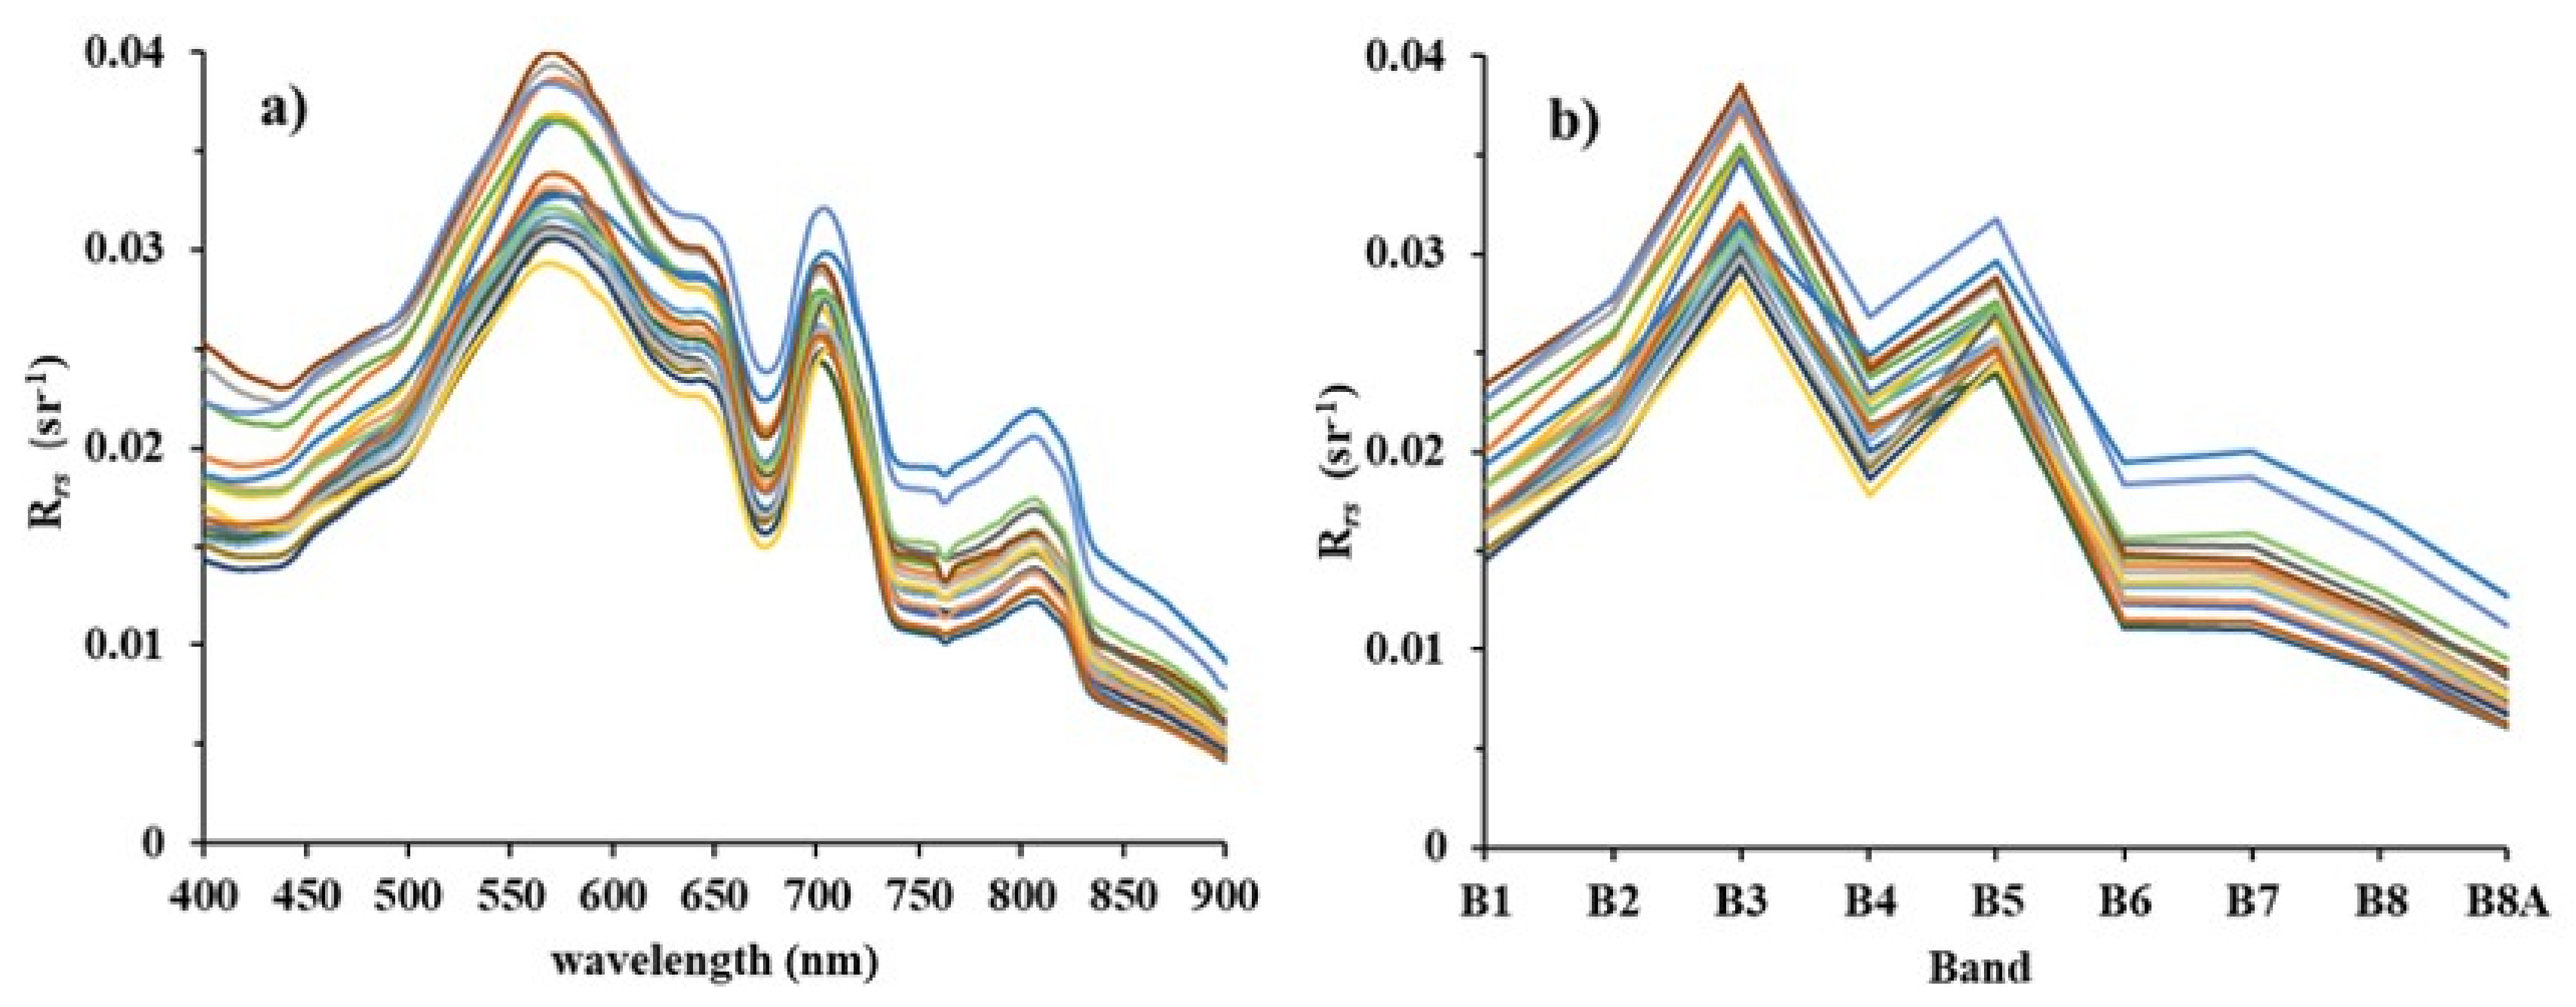
- Remote sensing reflectance simulation
- (2)
- TSM concentration inversion model of Changdang Lake
- (a)
- 2/3 sample modeling
- (b)
- Five-fold cross-validation approach
- (c)
- Modification of TSM concentration inversion model based on synchronous Sentinel-2 Image
3. Results
3.1. Accuracy Evaluation
3.1.1. Evaluation of Sentinel-2 Image Recorrection Results
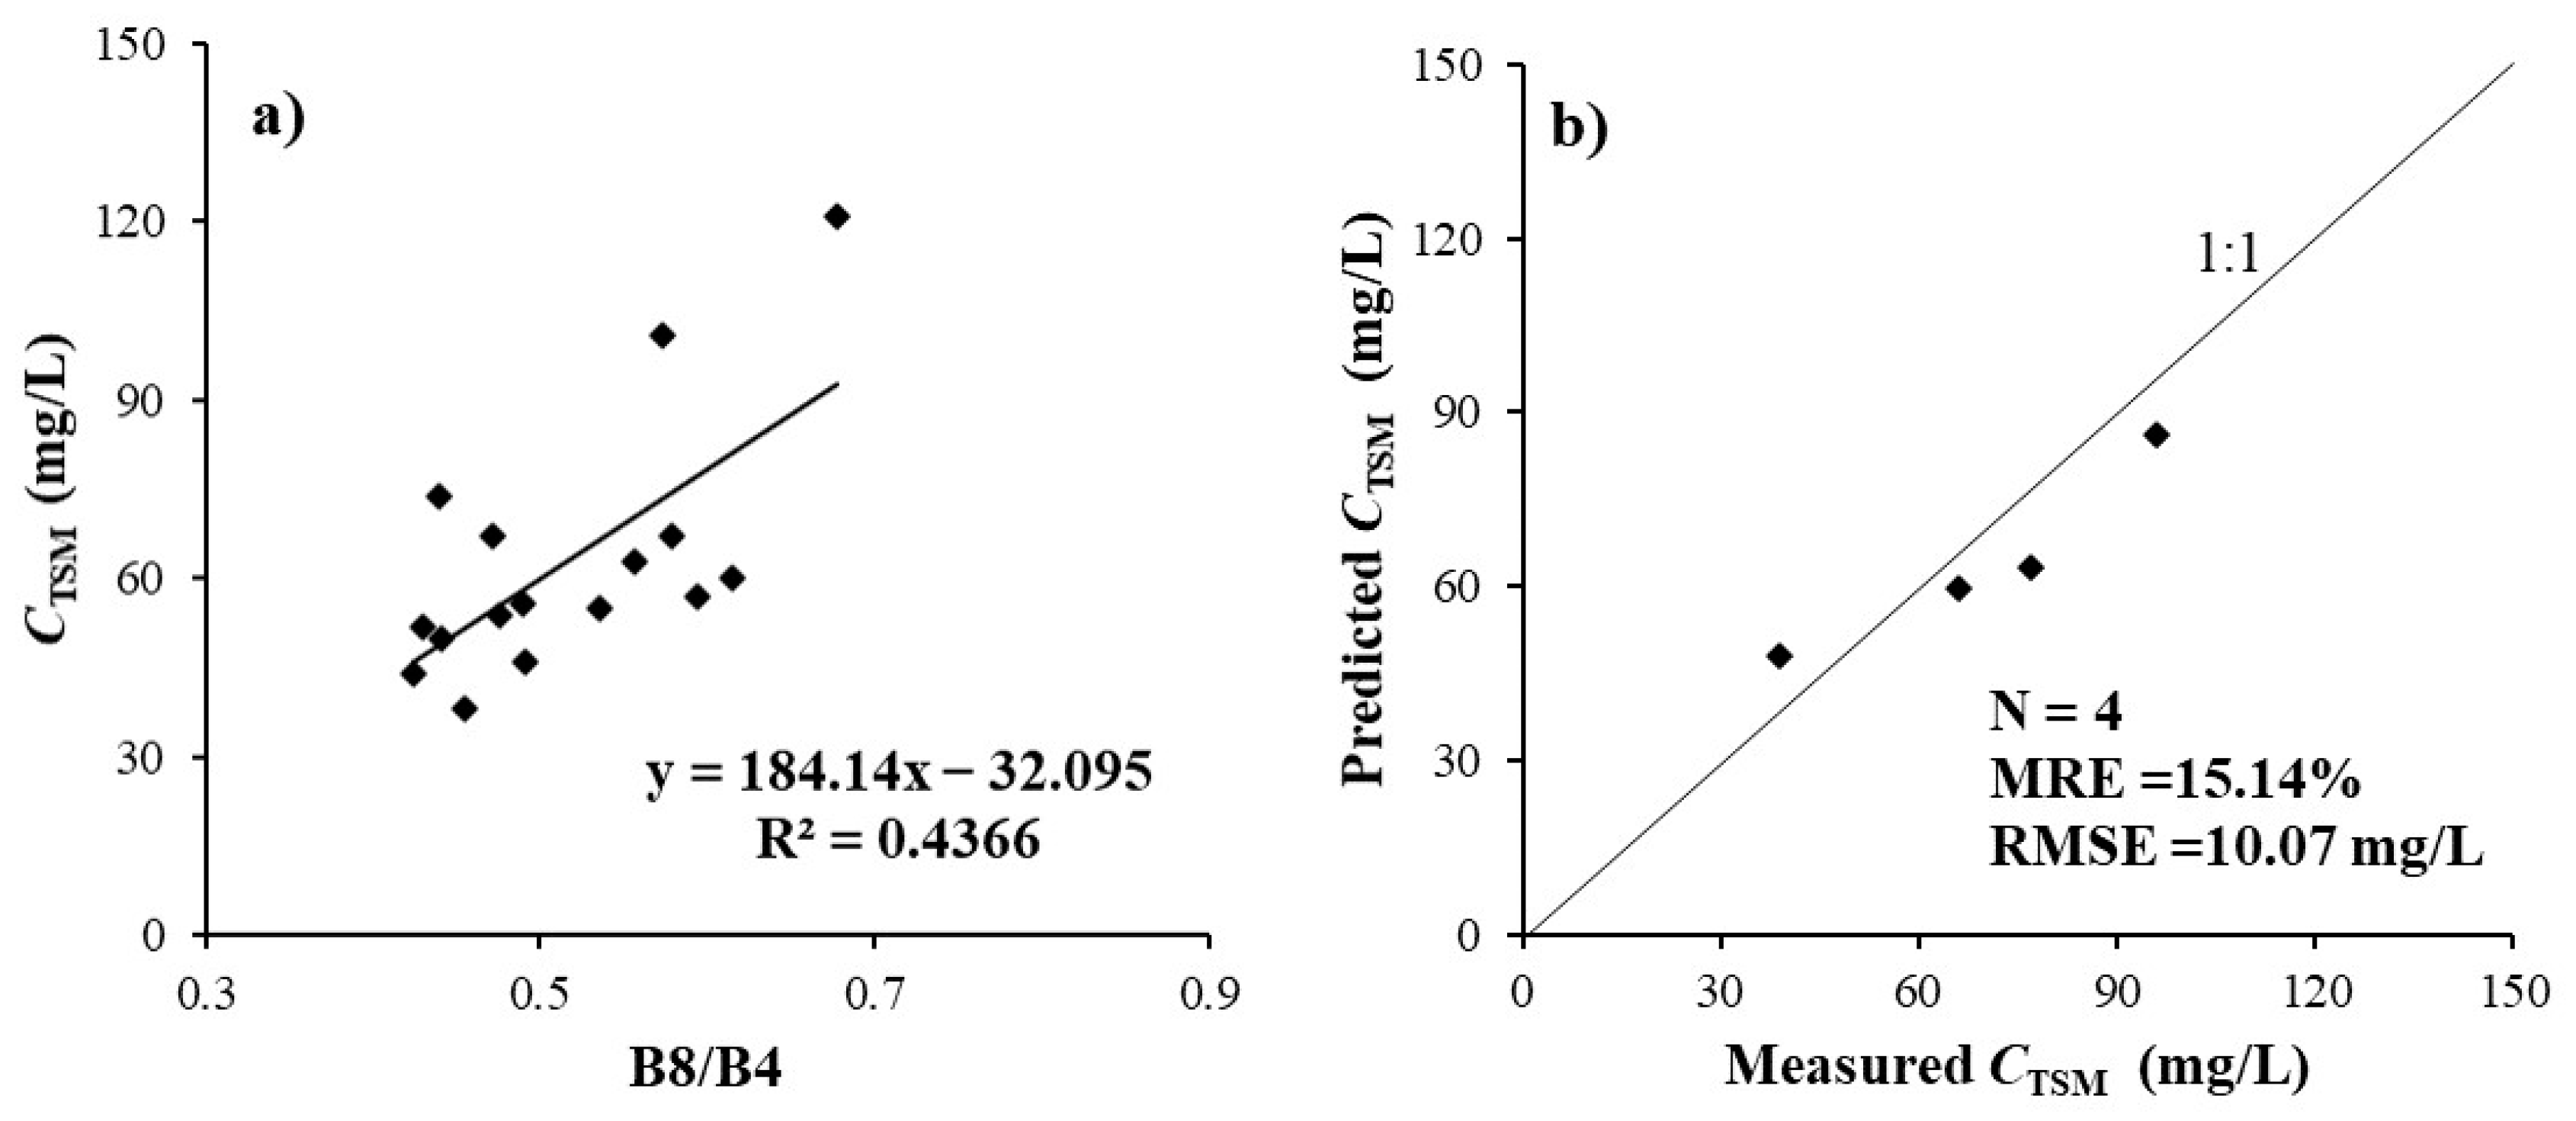
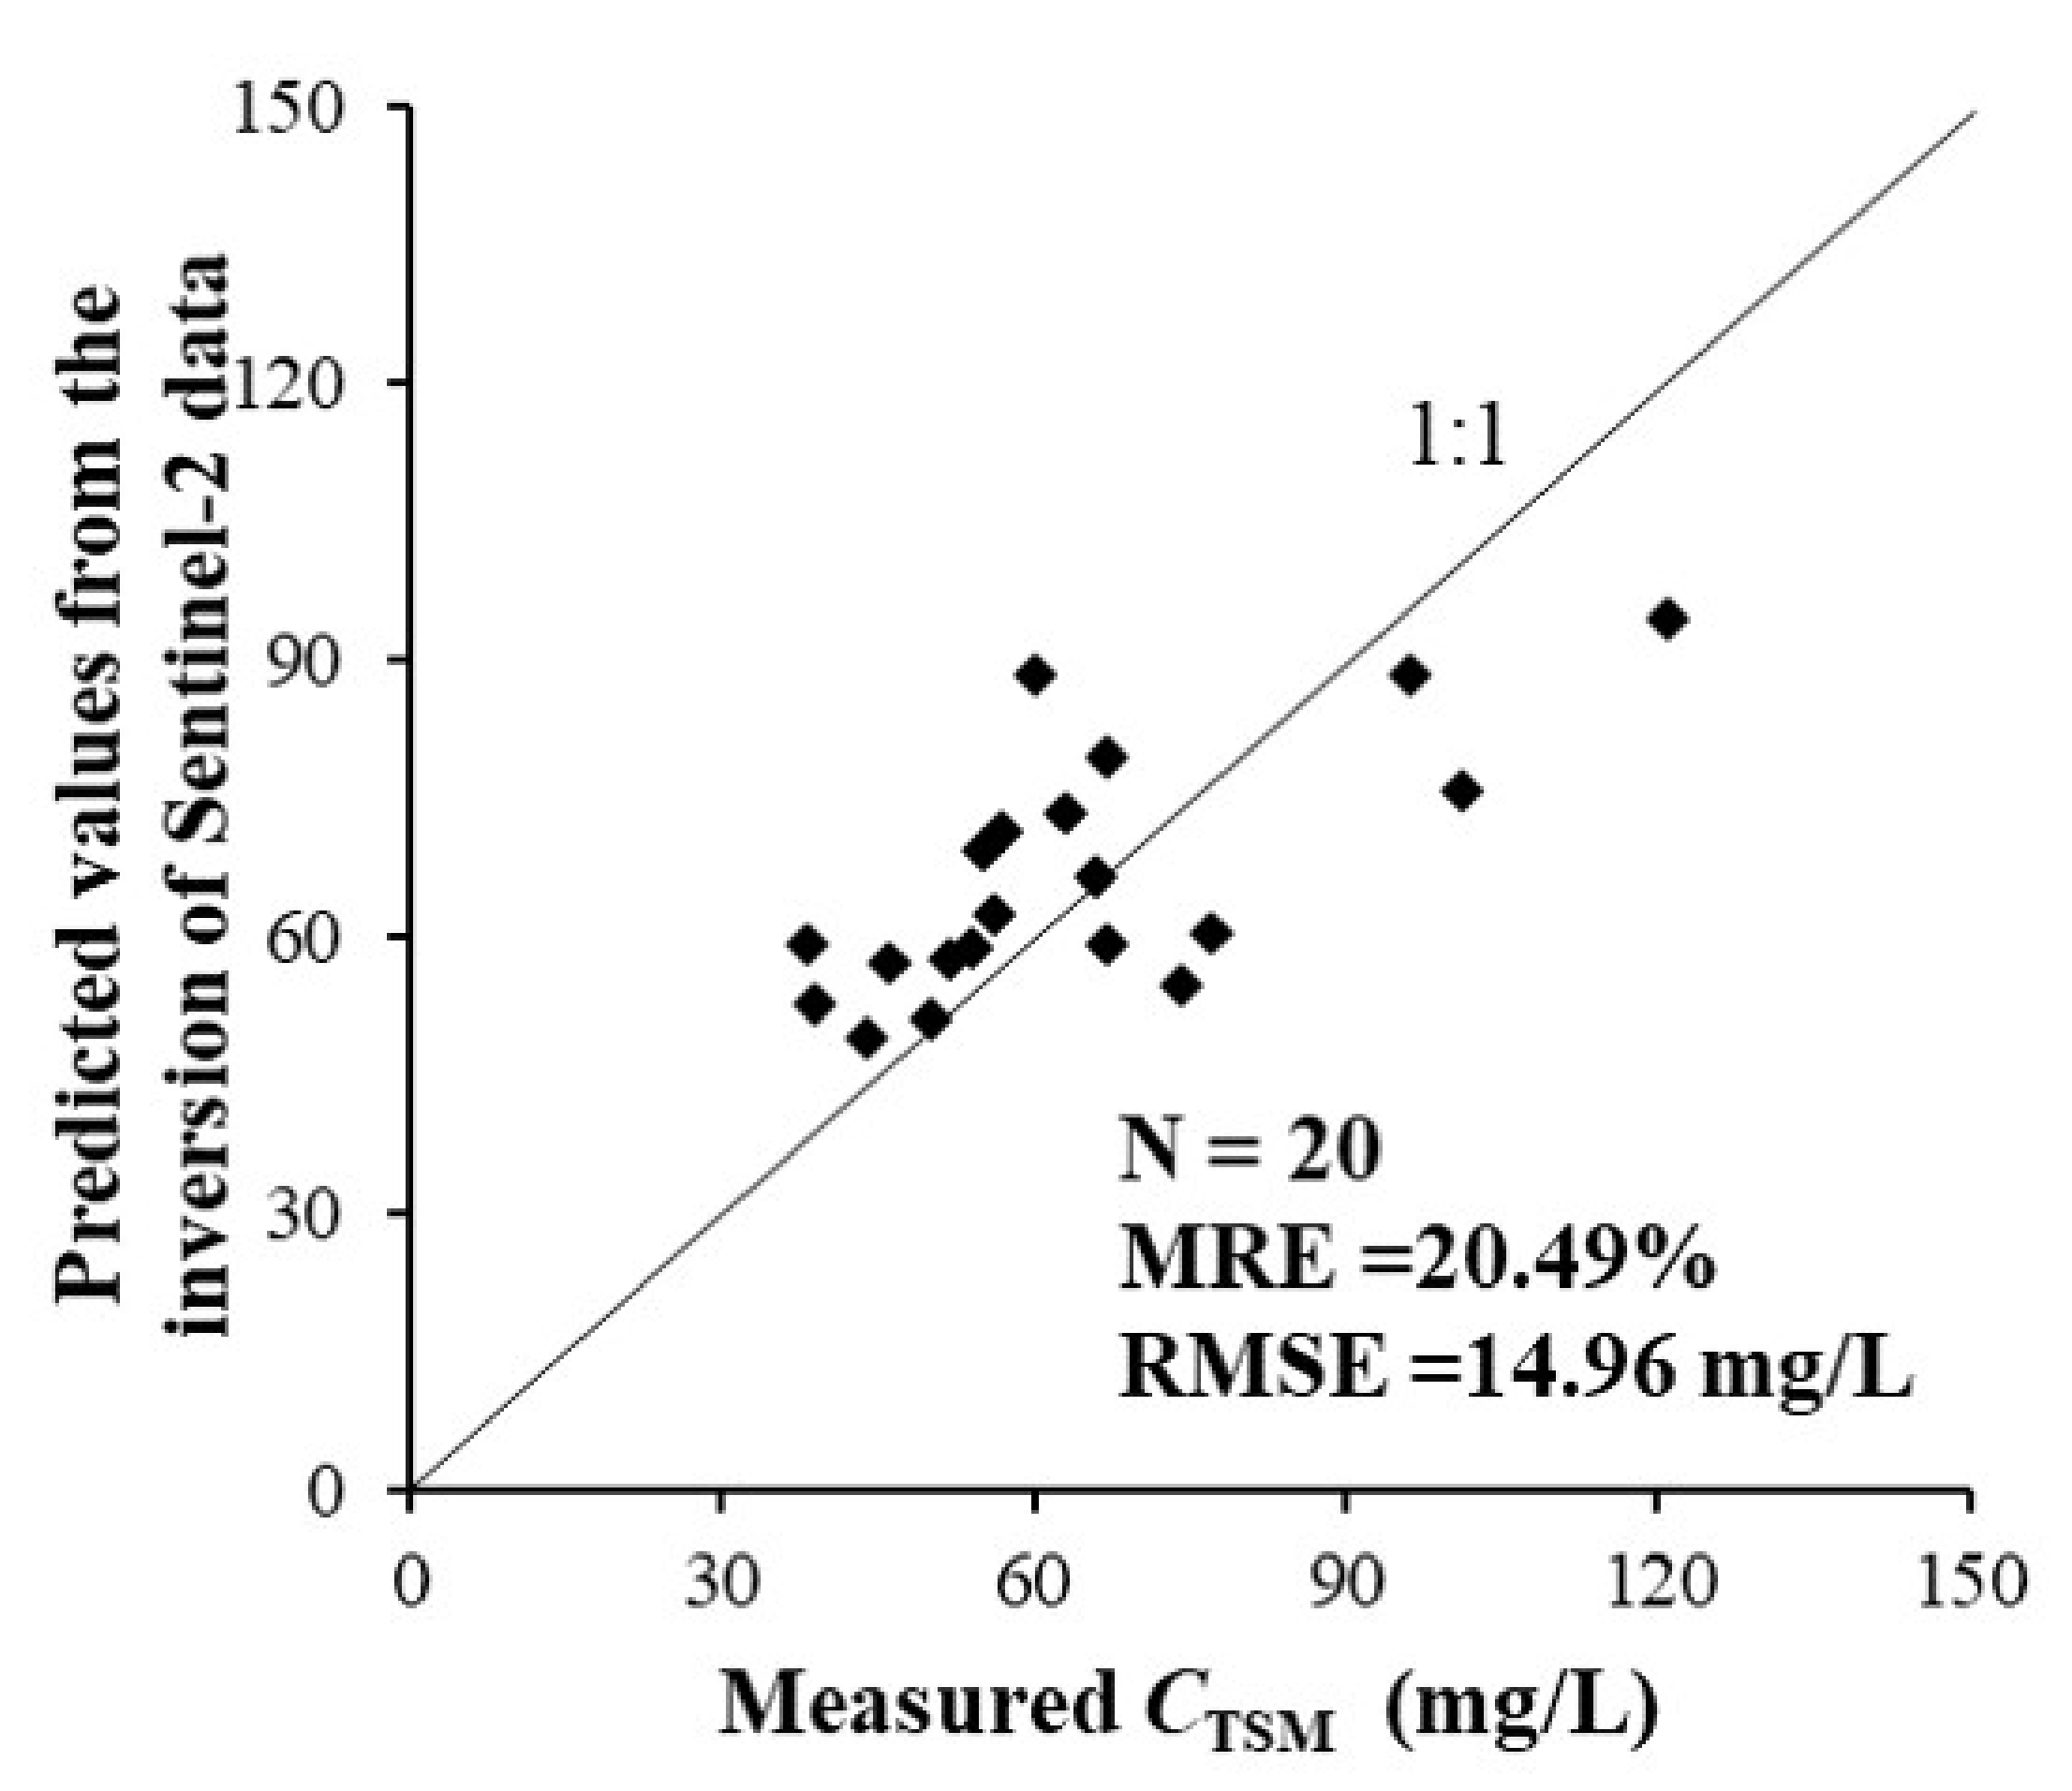
3.1.2. Accuracy of Inversion Results Based on Synchronized Transit Images
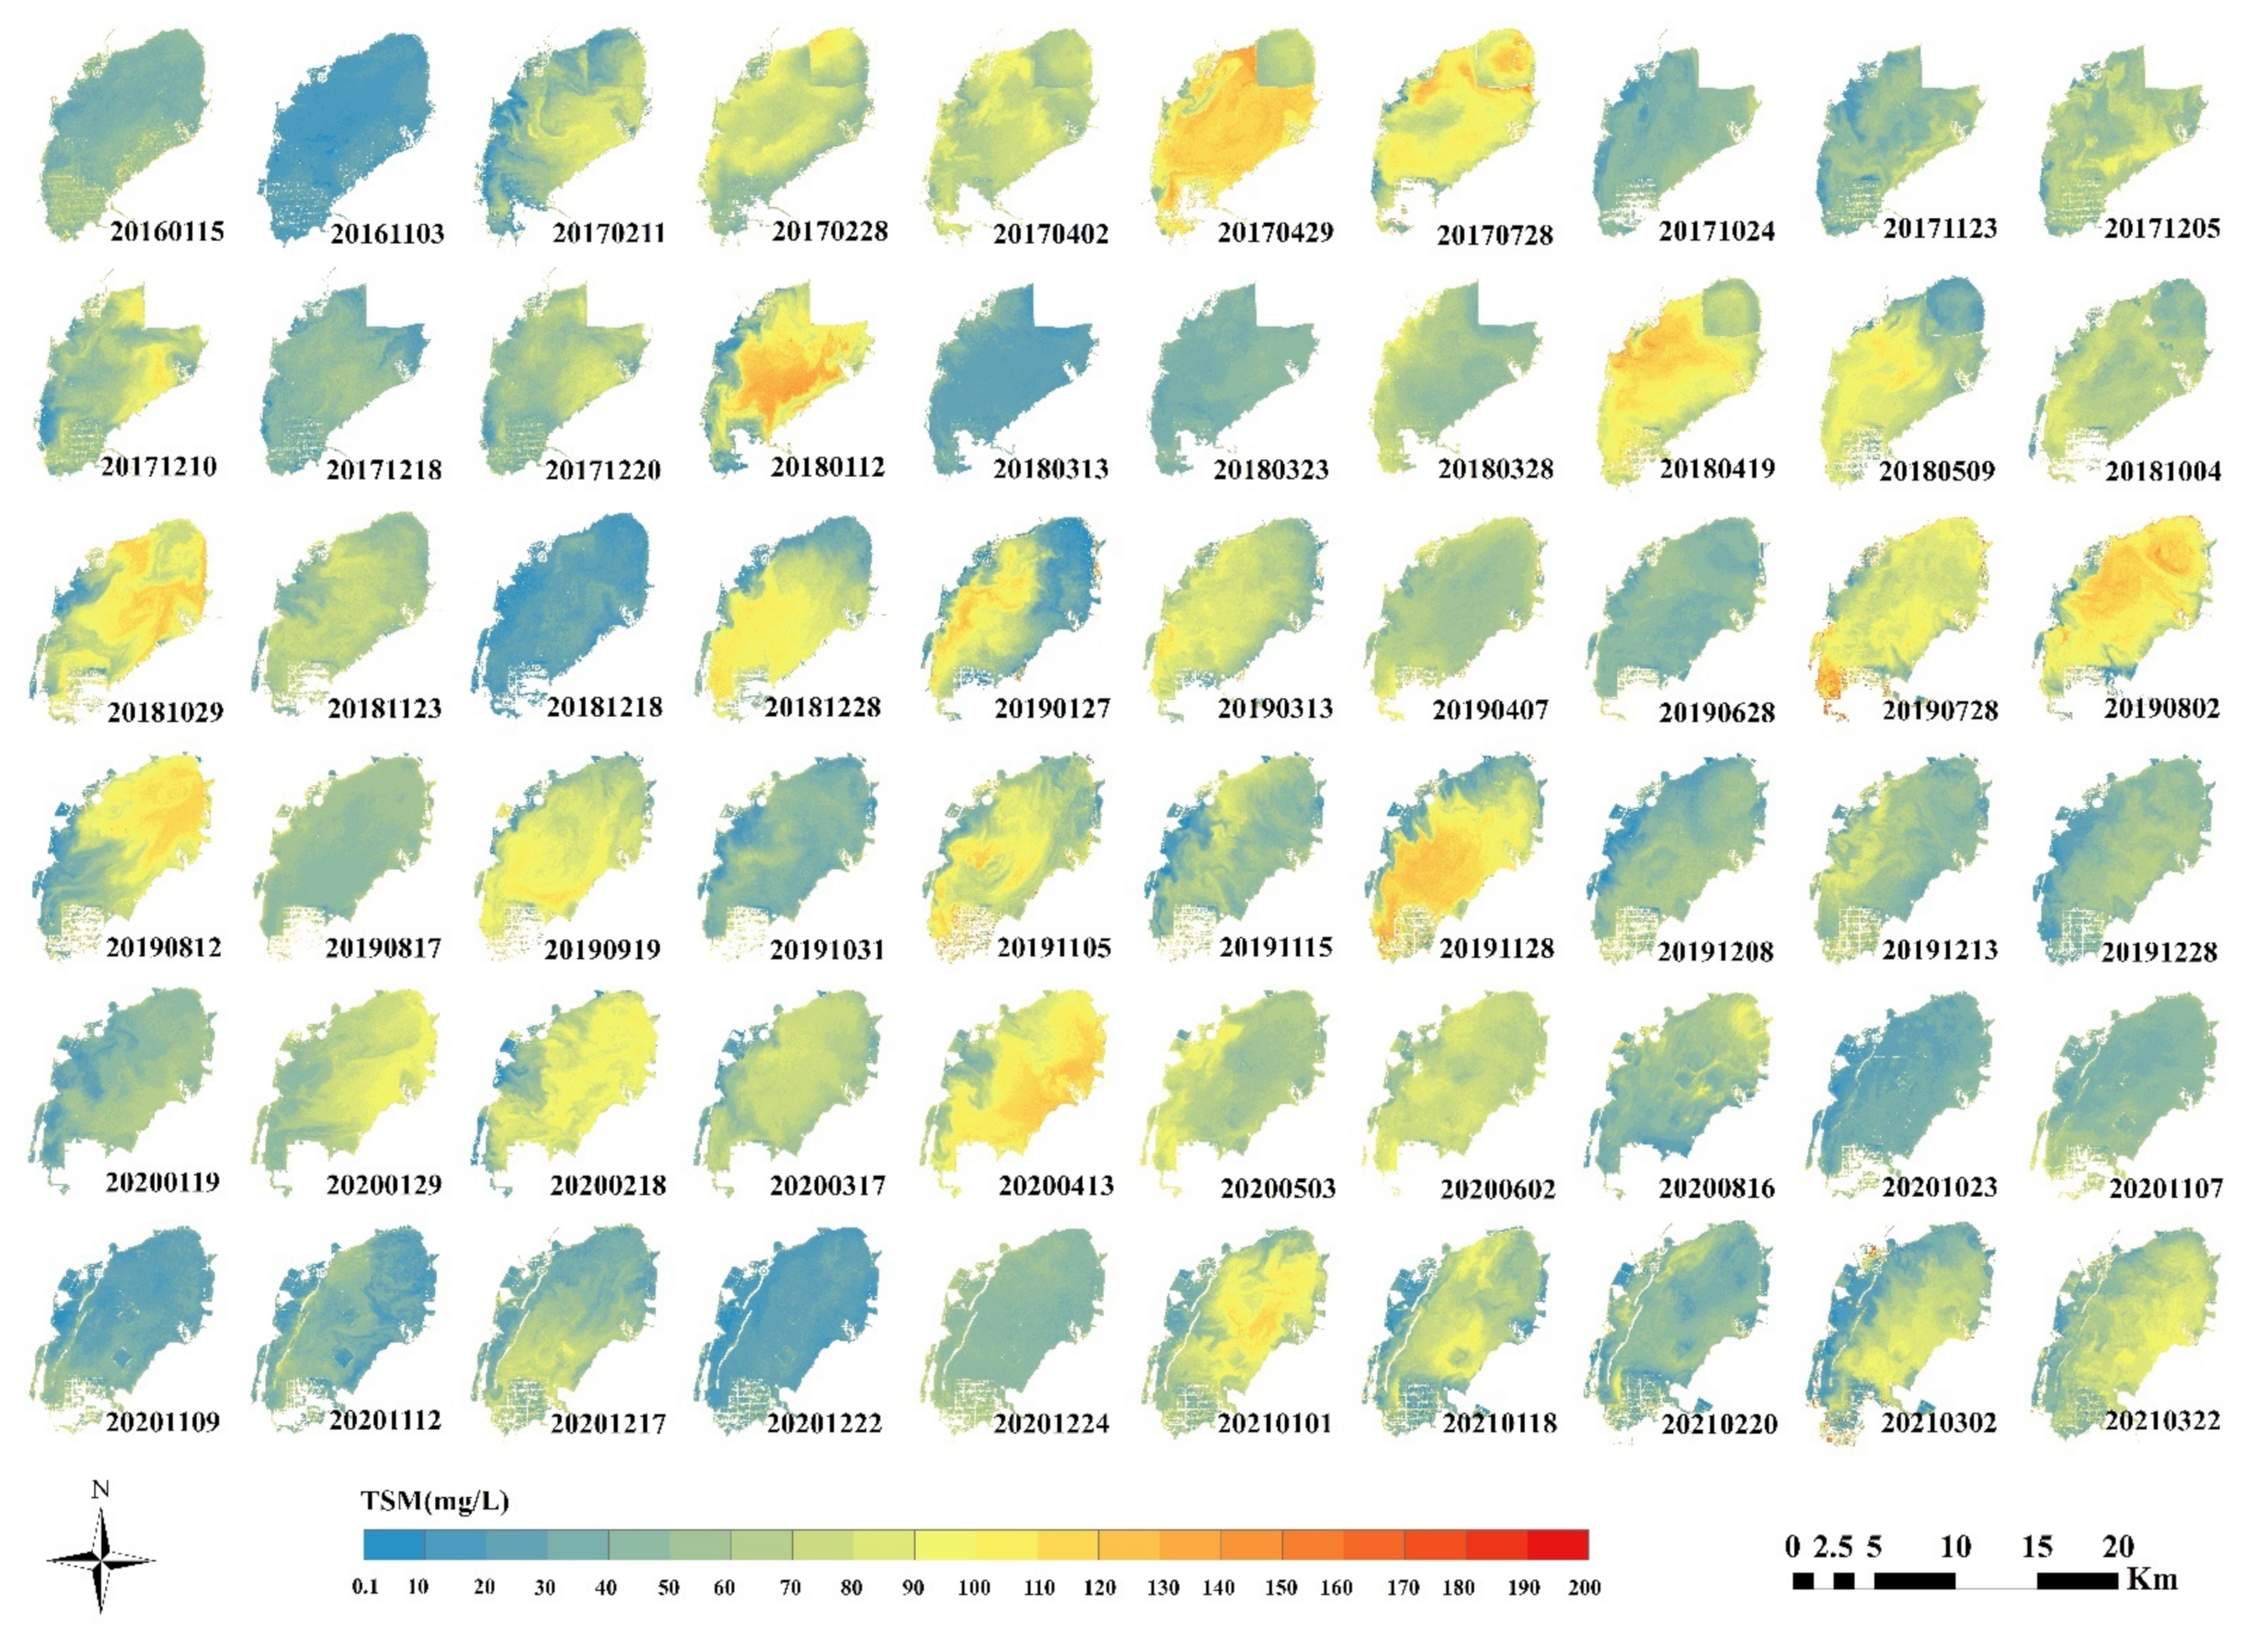
3.2. Temporal and Spatial Distribution of TSM Concentration
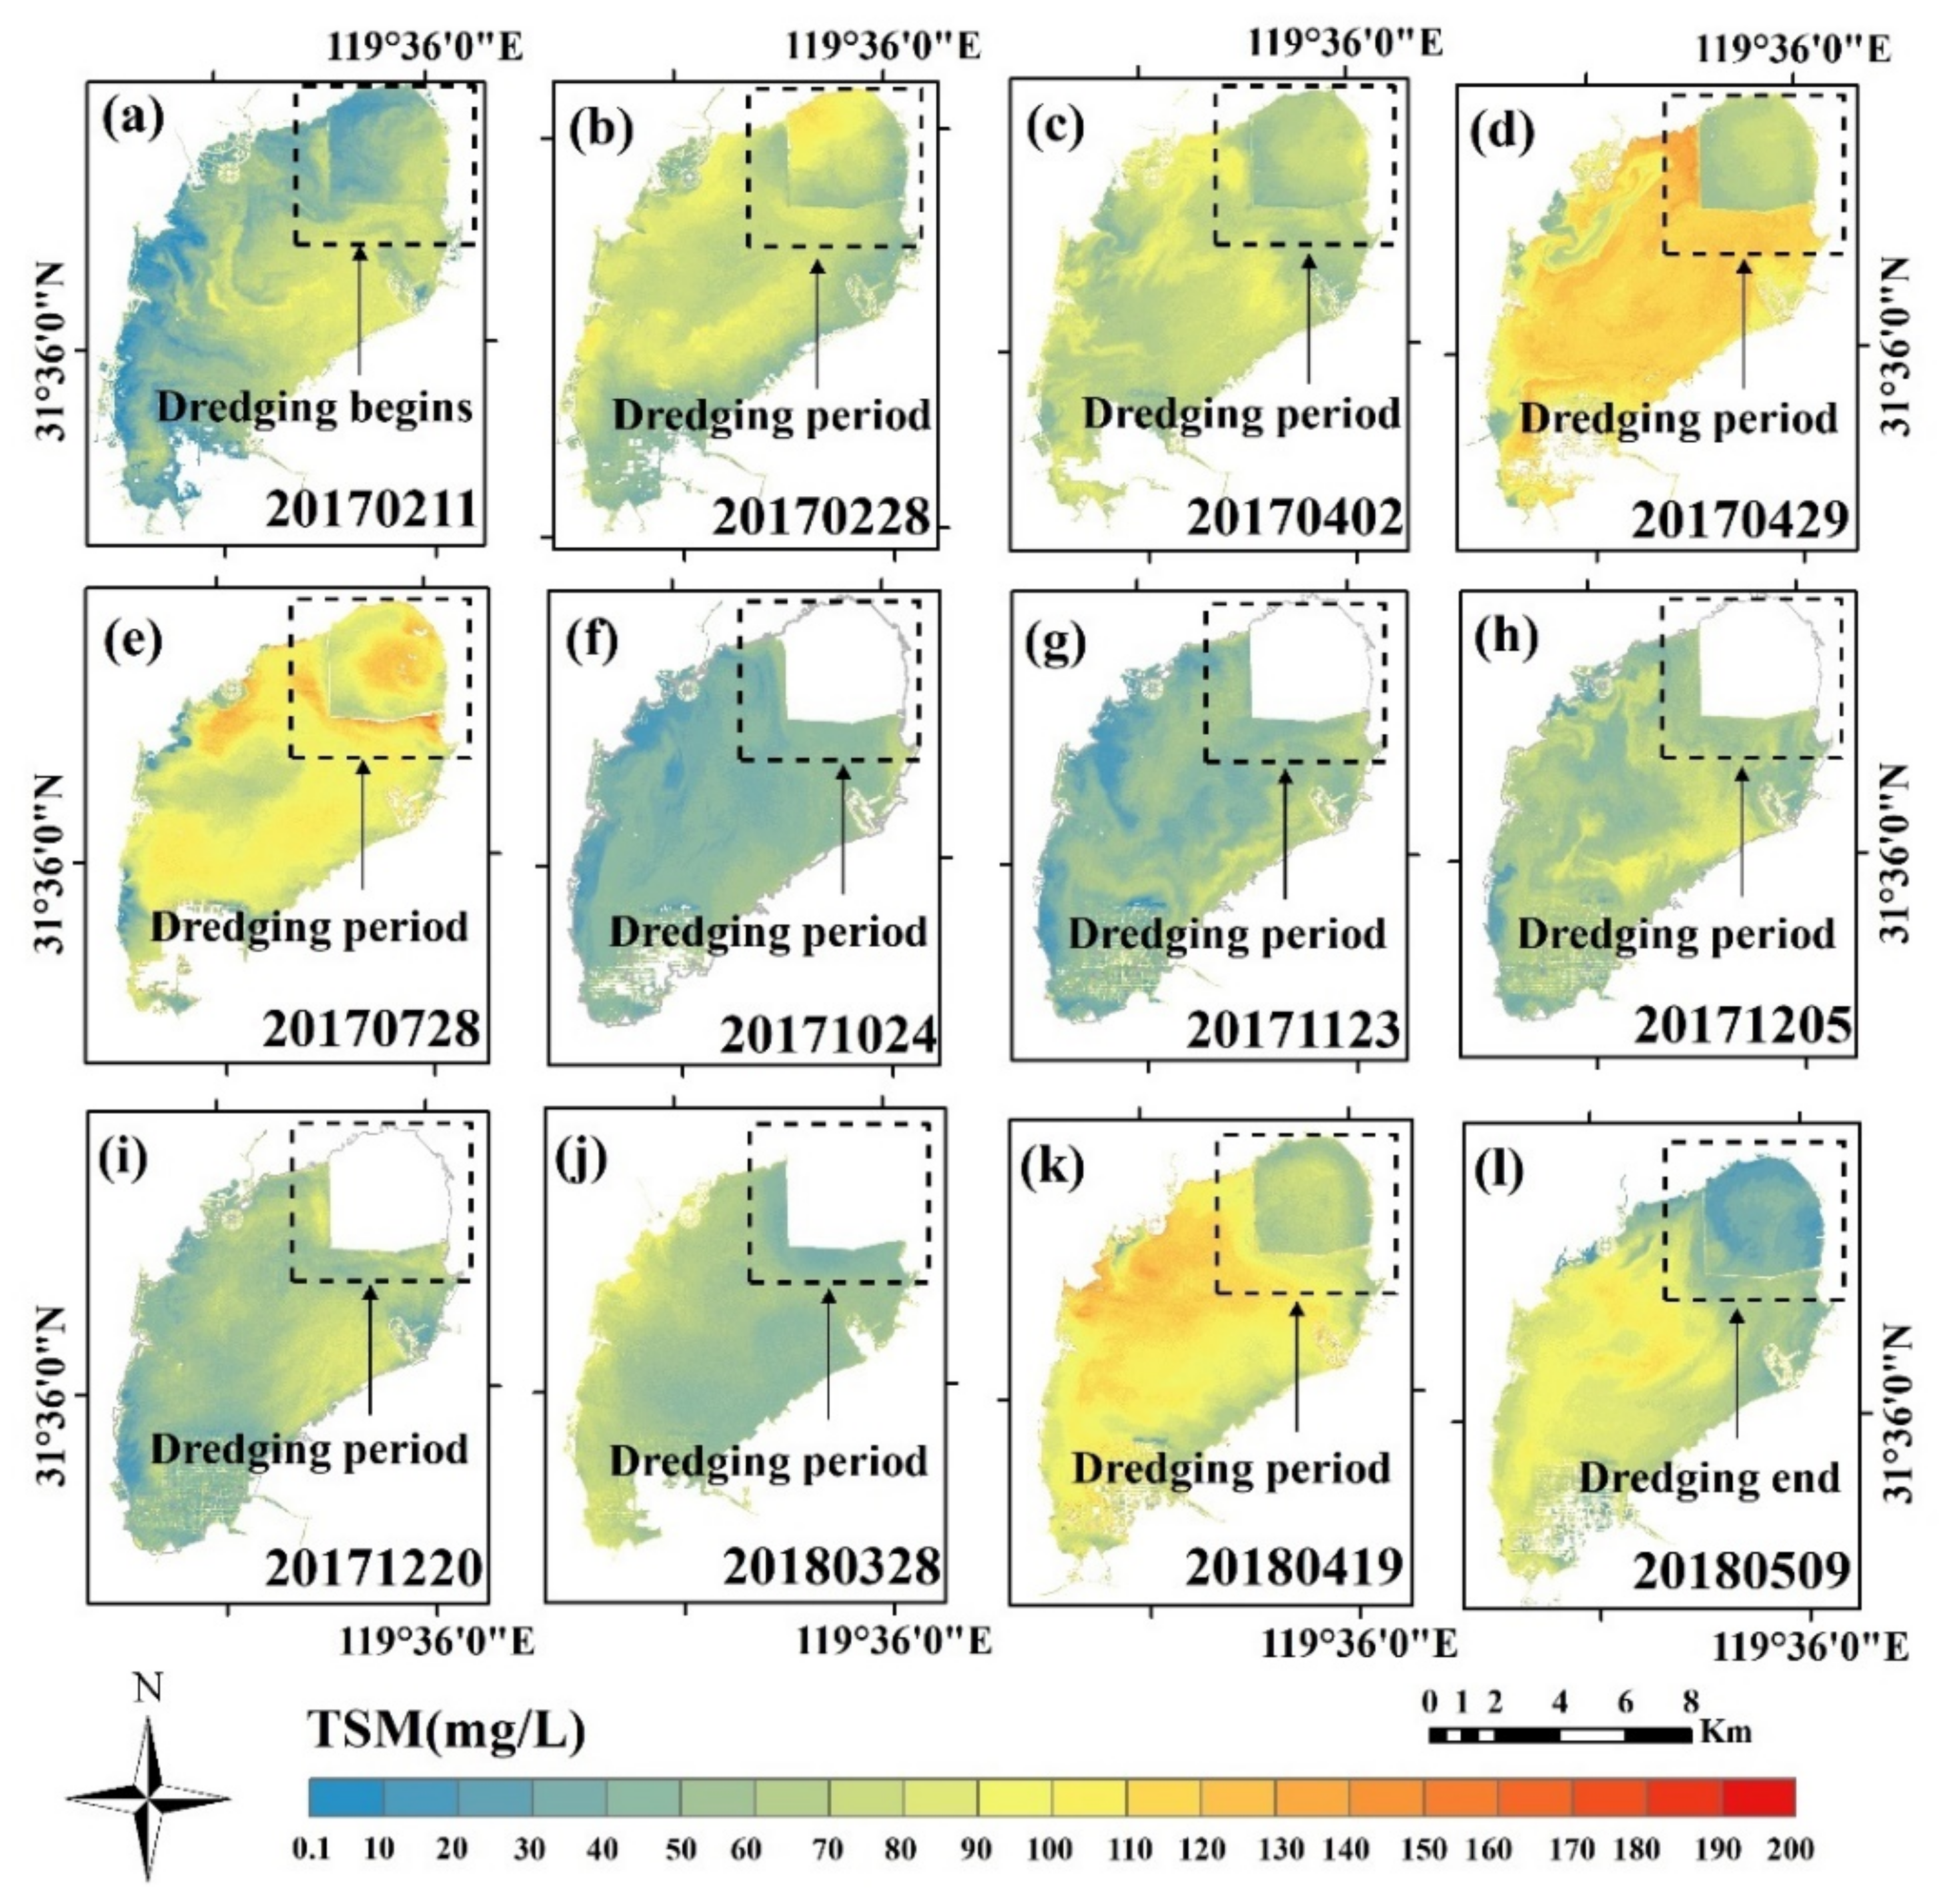
3.3. Relationship between Ecological Dredging and Spatiotemporal Variations of TSM Concentration
3.3.1. First Stage of Ecological Dredging
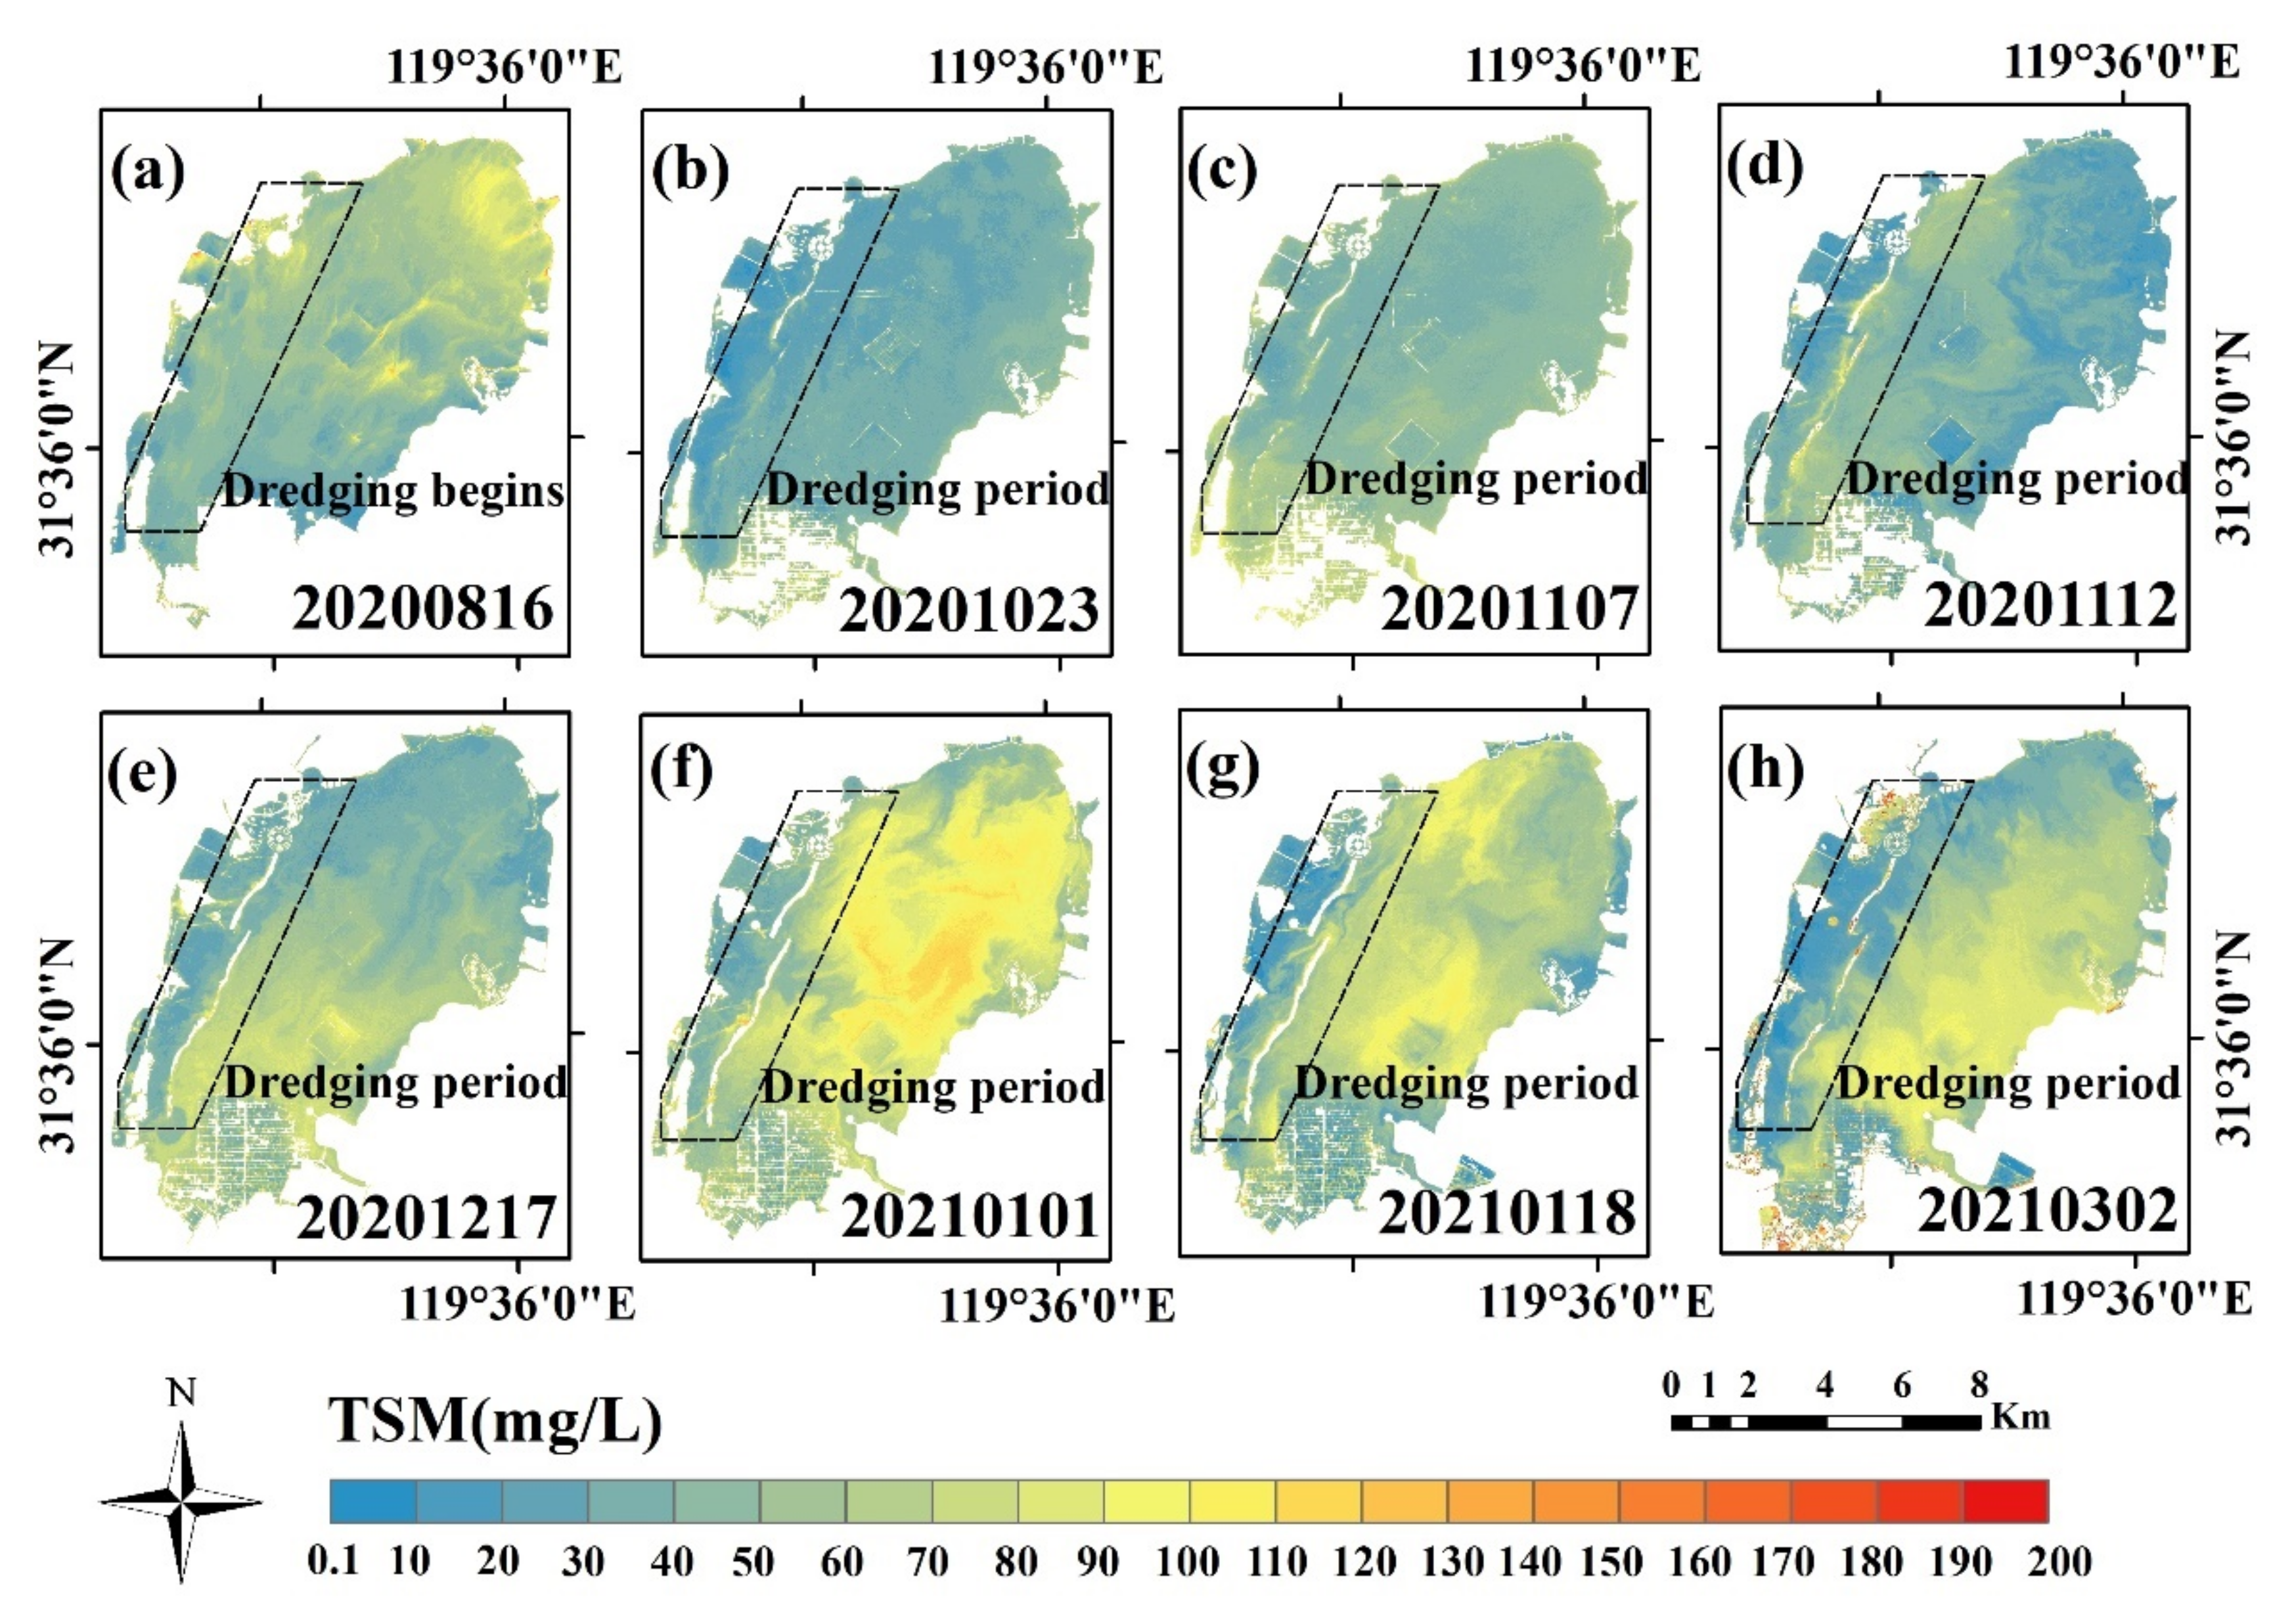
3.3.2. Second Stage of Ecological Dredging
4. Discussion
4.1. Comparison of TSM Concentration Models
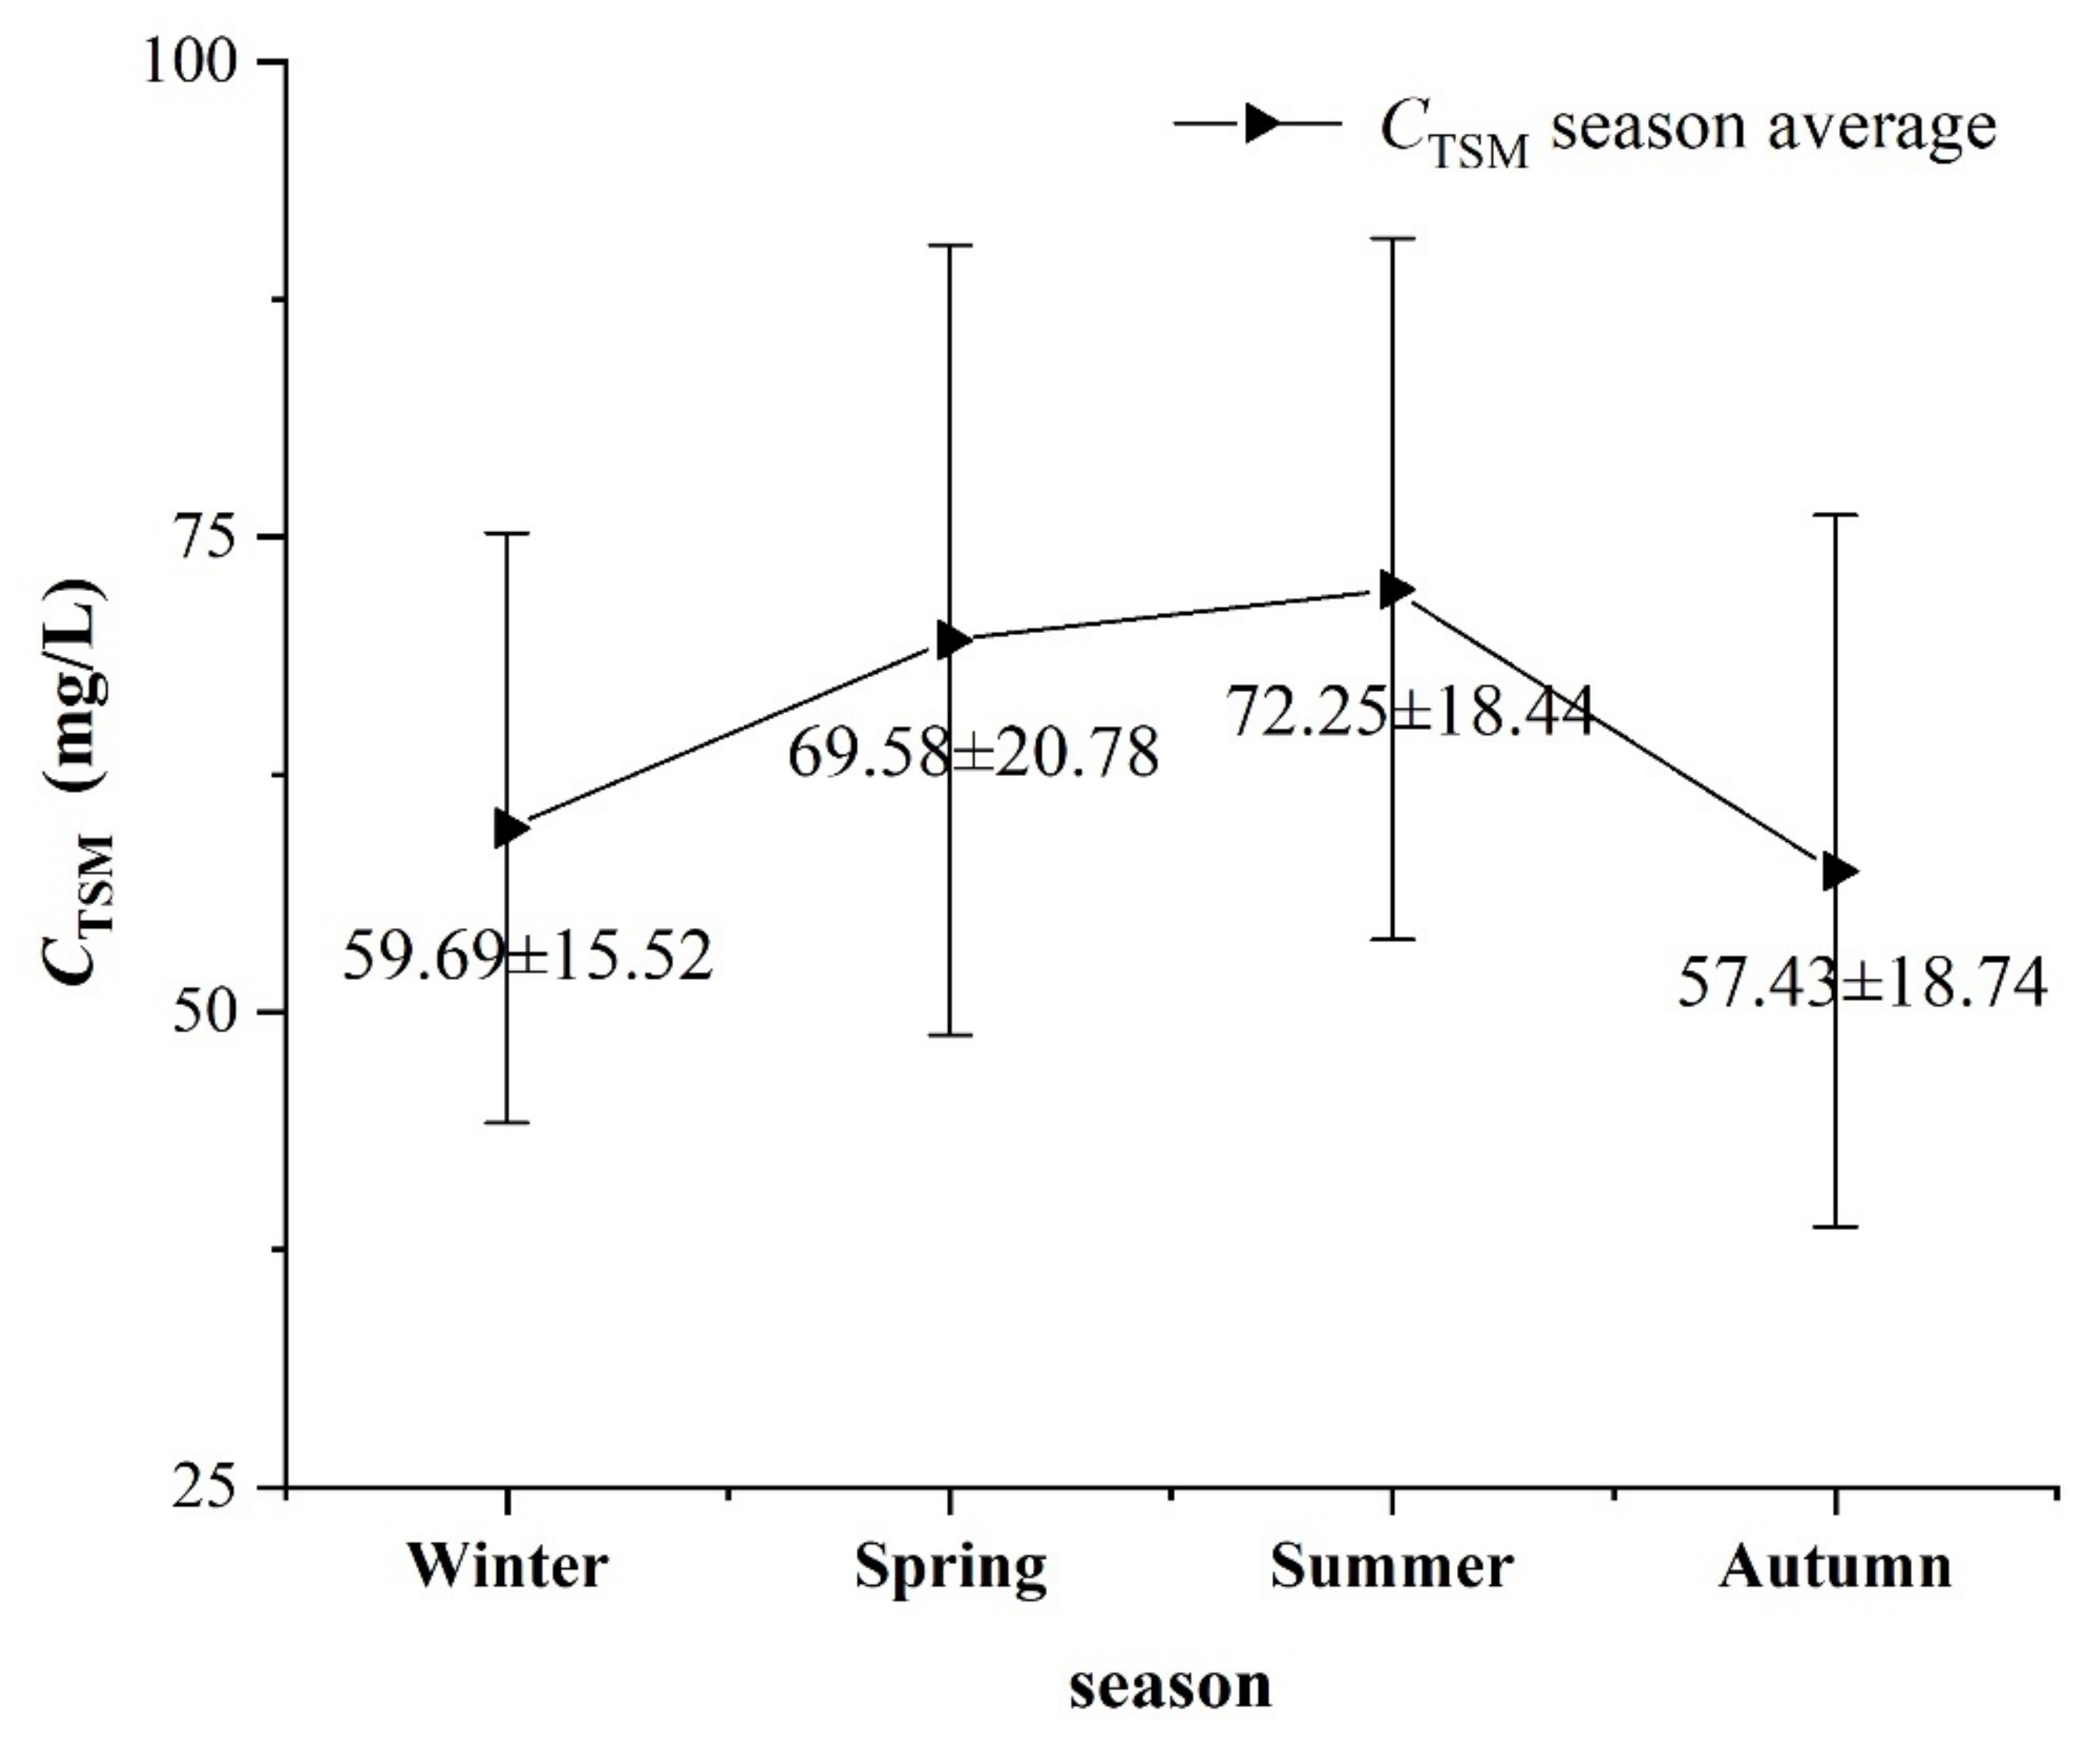
4.2. Seasonal Variations of TSM Concentration in Changdang Lake
4.3. Influence of Meteorological Factors on TSM Concentration in Changdang Lake
5. Conclusions
- (1)
- The accuracy of the TSM concentration inversion model based on ground-measured data and synchronous Sentinel-2 image data was high, with MRE and RMSE values of 15.14% and 10.07 mg/L, and 20.49% and 14.96 mg/L being obtained, respectively.
- (2)
- The TSM concentration in Changdang Lake exhibited evident seasonal variations, exhibiting higher values in spring and summer and lower values in autumn and winter. By monitoring the ecological dredging process of Changdang Lake, it was found that the ecological dredging project might improve the water quality in Changdang Lake to some extent.
- (3)
- The inversion results clearly revealed the temporal and spatial distributions of TSM concentration in Changdang Lake, confirming the application potential of Sentinel-2 images for the long-term monitoring of water quality changes in small- and medium-sized lakes.
Author Contributions
Funding
Institutional Review Board Statement
Informed Consent Statement
Data Availability Statement
Acknowledgments
Conflicts of Interest
References
- Shi, K.; Li, Y.; Li, L.H. Absorption characteristics of optically complex inland waters: Implications for water optical classification. J. Geophys. Res. Biogeosci. 2013, 118, 2169–8953. [Google Scholar] [CrossRef]
- Pozdnyakov, D.; Shuchman, R.; Korosov, A.; Hatt, C. Operational algorithm for the retrieval of water quality in the Great Lakes. Remote Sens. Environ. 2005, 97, 352–370. [Google Scholar] [CrossRef]
- Montanher, O.C.; Novo, E.M.L.M.; Barbosa, C.C.F.; Rennó, C.D.; Silva, T.S.F. Empirical models for estimating the suspended sediment concentration in Amazonian white water rivers using Landsat 5/TM. Int. J. Appl. Earth Obs. Geoinf. 2014, 29, 67–77. [Google Scholar] [CrossRef]
- Pang, S.; Zhu, W.; Cheng, J.; Sun, N.; Huang, L.; Zhang, Y.; Zhang, Z. Using Landsat-8 to remotely estimate and observe spatiotemporal variations of total suspended matter in Zhoushan coastal regions. Spectrosc. Spectr. Anal. 2019, 39, 3826–3832. [Google Scholar]
- Ritchie, J.C.; Cooper, C.M.; Yongqing, J. Using landsat multispectral scanner data to estimate suspended sediments in Moon Lake, Mississippi. Remote Sens. Environ. 1987, 23, 65–81. [Google Scholar] [CrossRef]
- Du, Y.; Song, K.; Liu, G.; Wen, Z.; Fang, C.; Shang, Y.; Zhao, F.; Wang, Q.; Du, J.; Zhang, B. Quantifying total suspended matter (TSM) in waters using Landsat images during 1984–2018 across the Songnen Plain, Northeast China. J. Environ. Manag. 2020, 262, 110334. [Google Scholar] [CrossRef]
- Miller, R.L.; McKee, B.A. Using MODIS Terra 250 m imagery to map concentrations of total suspended matter in coastal waters. Remote Sens. Environ. 2004, 93, 259–266. [Google Scholar] [CrossRef]
- Sun, D.; Li, Y.; Le, C.; Shi, K.; Huang, C.; Gong, S.; Yin, B. A semi-analytical approach for detecting suspended particulate composition in complex turbid inland waters (China). Remote Sens. Environ. 2013, 134, 92–99. [Google Scholar] [CrossRef]
- Petus, C.; Marieu, V.; Novoa, S.; Chust, G.; Bruneau, N.; Froidefond, J.-M. Monitoring spatio-temporal variability of the Adour River turbid plume (Bay of Biscay, France) with MODIS 250-m imagery. Cont. Shelf Res. 2014, 74, 35–49. [Google Scholar] [CrossRef] [Green Version]
- Gernez, P.; Lafon, V.; Lerouxel, A.; Curti, C.; Lubac, B.; Cerisier, S.; Barillé, L. Toward Sentinel-2 high resolution remote sensing of suspended particulate matter in very turbid waters: SPOT4 (Take5) experiment in the Loire and Gironde estuaries. Remote Sens. 2015, 7, 9507–9528. [Google Scholar] [CrossRef] [Green Version]
- Kallio, K.; Koponen, S.; Ylöstalo, P.; Kervinen, M.; Pyhälahti, T.; Attila, J. Validation of MERIS spectral inversion processors using reflectance, IOP and water quality measurements in boreal lakes. Remote Sens. Environ. 2015, 157, 147–157. [Google Scholar] [CrossRef]
- Shi, K.; Zhang, Y.; Zhu, G.; Liu, X.; Zhou, Y.; Xu, H.; Qin, B.; Liu, G.; Li, Y. Long-term remote monitoring of total suspended matter concentration in Lake Taihu using 250m MODIS-Aqua data. Remote Sens. Environ. 2015, 164, 43–56. [Google Scholar] [CrossRef]
- Cao, Z.; Duan, H.; Cui, H.; Ma, R. Remote estimation of suspended matters concentrations using VIIRS in Lake Hongze. China J. Infrared Millim. Waves 2016, 35, 462–469. [Google Scholar]
- Toming, K.; Kutser, T.; Laas, A.; Sepp, M.; Paavel, B.; Nõges, T. First experiences in mapping lake water quality parameters with Sentinel-2 MSI imagery. Remote Sens. 2016, 8, 640. [Google Scholar] [CrossRef] [Green Version]
- Liu, H.; Li, Q.; Shi, T.; Hu, S.; Wu, G.; Zhou, Q. Application of Sentinel 2 MSI images to retrieve suspended particulate matter concentrations in Poyang lake. Remote Sens. 2017, 9, 761. [Google Scholar] [CrossRef] [Green Version]
- Shi, W.; Zhang, Y.; Wang, M. Deriving total suspended matter concentration from the near-infrared-based inherent optical properties over turbid waters: A case study in Lake Taihu. Remote Sens. 2018, 10, 333. [Google Scholar] [CrossRef] [Green Version]
- Cao, H.; Han, L.; Li, W.; Liu, Z.; Li, L. Inversion and distribution of total suspended matter in water based on remote sensing images—A case study on Yuqiao Reservoir, China. Water Environ. Res. 2021, 93, 582–595. [Google Scholar] [CrossRef]
- Zhang, M.; Tang, J.; Dong, Q.; Song, Q.; Ding, J. Retrieval of total suspended matter concentration in the Yellow and East China Seas from MODIS imagery. Remote Sens. Environ. 2010, 114, 392–403. [Google Scholar] [CrossRef]
- Wang, H.H.; Wang, J.; Cui, Y.H. Remote sensing monitoring on spatial differentiation of suspended sediment concentration in a river-lake system based on Sentinel-2 MSI imaging: A case for Shengjin Lake and connected Yangtze River section in Anhui Province. Huan Jing Ke Xue 2020, 41, 1207–1216. [Google Scholar] [CrossRef] [PubMed]
- Liu, Z.; Li, Y.; Tan, J.; Guo, Y.; Zhou, L.; Liu, G. Construction of semi–analytical model for inversing total suspended matter in Lake Taihu and Chaohu and assessment of its applicability. Environ. Sci. 2012, 33, 3000–3008. [Google Scholar] [CrossRef]
- Lee, Z.; Carder, K.L.; Mobley, C.D.; Steward, R.G.; Patch, J.S. Hyperspectral remote sensing for shallow waters. I. A semianalytical model. Appl. Opt. 1998, 37, 6329–6338. [Google Scholar] [CrossRef]
- Lee, Z.; Carder, K.L.; Mobley, C.D.; Steward, R.G.; Patch, J.S. Hyperspectral remote sensing for shallow waters: 2. Deriving bottom depths and water properties by optimization. Appl. Opt. 1999, 38, 3831–3843. [Google Scholar] [CrossRef] [Green Version]
- Xie, X.; Chen, Y. Retrieval of total suspended matter in the lower of Minjiang River based on PSO–RBF. Remote Sens. Technol. Appl. 2018, 33, 900–907. [Google Scholar] [CrossRef]
- Wang, H.; Zhao, D.; Wang, L.; Huang, F. Advance in remote sensing of water quality. Mar. Environ. Sci. 2012, 31, 285–288. [Google Scholar]
- Tian, L.; Wai, O.W.H.; Chen, X.; Li, W.; Li, J.; Li, W.; Zhang, H. Retrieval of total suspended matter concentration from Gaofen-1 Wide Field Imager (WFI) multispectral imagery with the assistance of Terra MODIS in turbid water—Case in Deep Bay. Int. J. Remote Sens. 2016, 37, 3400–3413. [Google Scholar] [CrossRef]
- Qi, F.; Wang, X. Application of remote sensing techniques in monitoring and assessing inland water. Qual. Adv. Environ. Sci. 1999, 7, 91–100. [Google Scholar]
- Volpe, V.; Silvestri, S.; Marani, M. Remote sensing retrieval of suspended sediment concentration in shallow waters. Remote Sens. Environ. 2011, 115, 44–54. [Google Scholar] [CrossRef]
- Kuchinke, C.P.; Gordon, H.R.; Franz, B.A. Spectral optimization for constituent retrieval in Case 2 waters I: Implementation and performance. Remote Sens. Environ. 2009, 113, 571–587. [Google Scholar] [CrossRef]
- Kuchinke, C.P.; Gordon, H.R.; Harding, L.W.; Voss, K.J. Spectral optimization for constituent retrieval in Case 2 waters II: Validation study in the Chesapeake Bay. Remote Sens. Environ. 2009, 113, 610–621. [Google Scholar] [CrossRef]
- Neil, C.; Cunningham, A.; McKee, D. Relationships between suspended mineral concentrations and red-wave band reflectances in moderately turbid shelf seas. Remote Sens. Environ. 2011, 115, 3719–3730. [Google Scholar] [CrossRef]
- Wen, X.; Xu, H. Quantitative estimation of suspended solid concentration in the Lower Min River based on multi-source synchronal data. Environ. Sci. 2008, 29, 2441–2447. [Google Scholar]
- Song, Q.J.; Ma, R.H.; Tang, J.W.; Wang, X.M. Models of estimated total suspend matter concentration base on hyper-spectrum in Lake Taihu, in autumn. J. Lake Sci. 2008, 20, 196–202. [Google Scholar]
- Chen, J.; Xu, H. Modeling of the suspended solid concentration of the Jin River based on high spectral resolution data. Remote Sens. Technol. Appl. 2008, 23, 653–657. [Google Scholar]
- Zheng, Z.; Li, Y.; Guo, Y.; Xu, Y.; Liu, G.; Du, C. Landsat-based long-term monitoring of total suspended matter concentration pattern change in the wet season for Dongting Lake, China. Remote Sens. 2015, 7, 13975–13999. [Google Scholar] [CrossRef] [Green Version]
- Sun, D.; Li, Y.; Wang, Q.; Le, C.; Huang, C.; Shi, K.; Wang, L. Study on remote sensing estimation of suspended matter concentrations based on in situ hyperspectral data in lake tai waters. J. Infrared Millim. Waves 2009, 28, 124–128. [Google Scholar] [CrossRef]
- Li, S.; Wan, X. Relationship between suspended matter concentration and spectral reflectance of Chao Lake. Urban Environ. Urban Ecol. 2003, 16, 66–68. [Google Scholar]
- Lu, X.; Su, H. Retrieving total suspended matter concentration in Fujian coastal waters using OLCI data. Acta Sci. Circumstantiae 2020, 40, 2819–2827. [Google Scholar] [CrossRef]
- Gao, C.; Xu, J.; Gao, D.; Wang, L.; Wang, Y. Retrieval of concentration of total suspended matter from GF-1 satellite and field measured spectral data during flood period in Poyang Lake. Remote Sens. Land Resour. 2019, 31, 101–109. [Google Scholar] [CrossRef]
- Wang, X. Analysis of Changdang lake water quality change and pollution control countermeasures. Yangtze River 2009, 40, 20–22. [Google Scholar] [CrossRef]
- Jiang, Y. Thoughts on protecting the water environment of Changdang Lake. Jiangsu Water Resour. 2007, 43. [Google Scholar] [CrossRef]
- Chen, Q.; Shen, Q.; Li, J.; Zhang, M.; Guan, Y. Improved methods for measuring suspended matter concentration in water based on the analysis of loss on ignition. J. Ocean. Technol. 2014, 33, 14–23. [Google Scholar]
- Tang, J.; Tian, G.; Wang, X.; Wang, X.; Song, Q. The methods of water spectra measurement and analysis I: Above-water method. J. Remote Sens. 2004, 8, 37–44. [Google Scholar]
- Wang, X.; Li, T.; Tang, J.; Yang, A. Measurement and analysis of AOPs in case II waters with above-water method. Ocean Technol. 2004, 2, 1–6. [Google Scholar]
- Shi, W.; Wang, M. Detection of turbid waters and absorbing aerosols for the MODIS ocean color data processing. Remote Sens. Environ. 2007, 110, 149–161. [Google Scholar] [CrossRef]
- Shi, W.; Wang, M. An assessment of the black ocean pixel assumption for MODIS SWIR bands. Remote Sens. Environ. 2009, 113, 1587–1597. [Google Scholar] [CrossRef]
- Shenglei, W.; Junsheng, L.; Bing, Z.; Qian, S.; Fangfang, Z.; Zhaoyi, L. A simple correction method for the MODIS surface reflectance product over typical inland waters in China. Int. J. Remote Sens. 2016, 37, 6076–6096. [Google Scholar] [CrossRef]
- Wong, T.T. Performance evaluation of classification algorithms by k-fold and leave-one-out cross validation. Pattern Recognit. 2015, 48, 2839–2846. [Google Scholar] [CrossRef]
- Jiang, W.; Yang, J.; Chen, Y. New environmental dredging and sludge harmless treatment technology—Taking Changzhou Changdang Lake comprehensive treatment project as an example. Jiangsu Water Resour. 2020, 9, 11–14. [Google Scholar]
- Sara, G.; Leonardi, M.; Mazzola, A. Spatial and temporal changes of suspended matter in relation to wind and vegetation cover in A Mediterranean shallow coastal environment. Chem. Ecol. 1999, 16, 151–173. [Google Scholar] [CrossRef]
- Zhang, Y.; Shi, K.; Liu, X.; Zhou, Y.; Qin, B. Lake topography and wind waves determining seasonal-spatial dynamics of total suspended matter in turbid Lake Taihu, China: Assessment using long-term high-resolution MERIS data. PLoS ONE 2014, 9, e98055. [Google Scholar] [CrossRef]


| Year | Image Quantity | |||
|---|---|---|---|---|
| Winter | Spring | Summer | Autumn | |
| 2016 | 1 | - | - | 1 |
| 2017 | 2 | 2 | 1 | 2 |
| 2018 | 5 | 5 | - | 3 |
| 2019 | 3 | 2 | 5 | 5 |
| 2020 | 6 | 3 | 2 | 4 |
| 2021 | 6 | 2 | - | - |
| Band/Band Combination | Before and after Image Recorrection | MRE (%) | RMSE (sr−1) |
|---|---|---|---|
| B4 (665 nm) | Before recorrection | 25.57 | 0.0056 |
| After recorrection | 8.51 | 0.0020 | |
| B8 (842 nm) | Before recorrection | 80.31 | 0.0088 |
| After recorrection | 40.81 | 0.0045 | |
| B8/B4 | Before recorrection | 43.67 | 0.2200 |
| After recorrection | 33.51 | 0.1700 |
| Reference | Model | MRE (%) | RMSE (mg/L) |
|---|---|---|---|
| Petus et al. [9] | y = 2 × 10⁶ × R2 − 87,342 × R + 972.04 | 60.19 | 44.43 |
| Gernez et al. [10] | y = 17.127 × exp [(NIR/G) × 3.7221] | 95.27 | 59.09 |
| Shi et al. [12] | y = 38.921 × exp (22.924 × R) | 25.55 | 20.31 |
| Zheng et al. [34] | y = 2448.6 × NIR + 39.919 | 37.20 | 22.43 |
| This study | y = 184.14 × (NIR/R) − 59.716 | 20.49 | 14.96 |
Publisher’s Note: MDPI stays neutral with regard to jurisdictional claims in published maps and institutional affiliations. |
© 2021 by the authors. Licensee MDPI, Basel, Switzerland. This article is an open access article distributed under the terms and conditions of the Creative Commons Attribution (CC BY) license (https://creativecommons.org/licenses/by/4.0/).
Share and Cite
Gao, Z.; Shen, Q.; Wang, X.; Peng, H.; Yao, Y.; Wang, M.; Wang, L.; Wang, R.; Shi, J.; Shi, D.; et al. Spatiotemporal Distribution of Total Suspended Matter Concentration in Changdang Lake Based on In Situ Hyperspectral Data and Sentinel-2 Images. Remote Sens. 2021, 13, 4230. https://doi.org/10.3390/rs13214230
Gao Z, Shen Q, Wang X, Peng H, Yao Y, Wang M, Wang L, Wang R, Shi J, Shi D, et al. Spatiotemporal Distribution of Total Suspended Matter Concentration in Changdang Lake Based on In Situ Hyperspectral Data and Sentinel-2 Images. Remote Sensing. 2021; 13(21):4230. https://doi.org/10.3390/rs13214230
Chicago/Turabian StyleGao, Zuoyan, Qian Shen, Xuelei Wang, Hongchun Peng, Yue Yao, Mingxiu Wang, Libing Wang, Ru Wang, Jiarui Shi, Dawei Shi, and et al. 2021. "Spatiotemporal Distribution of Total Suspended Matter Concentration in Changdang Lake Based on In Situ Hyperspectral Data and Sentinel-2 Images" Remote Sensing 13, no. 21: 4230. https://doi.org/10.3390/rs13214230
APA StyleGao, Z., Shen, Q., Wang, X., Peng, H., Yao, Y., Wang, M., Wang, L., Wang, R., Shi, J., Shi, D., & Liang, W. (2021). Spatiotemporal Distribution of Total Suspended Matter Concentration in Changdang Lake Based on In Situ Hyperspectral Data and Sentinel-2 Images. Remote Sensing, 13(21), 4230. https://doi.org/10.3390/rs13214230