Article

Regional High-Resolution Benthic Habitat Data from Planet Dove Imagery for Conservation Decision-Making and Marine Planning

1
The Nature Conservancy, Caribbean Division, Coral Gables, FL 33134, USA
2
The Nature Conservancy, Hawaiʻi & Palmyra Programs, Honolulu, HI 96817, USA
3
Tama Group, Lochhamer Strasse 1, DE-82166 Gräfelfing, Germany
4
Center for Global Discovery and Conservation Science, Arizona State University, Tempe, AZ 85281, USA
5
Planet, San Francisco, CA 94107, USA
6
School of Biological, Environmental, and Earth Sciences, University of Southern Mississippi, Hattiesburg, MS 39406, USA
*
Author to whom correspondence should be addressed.
Remote Sens. 2021, 13(21), 4215; https://doi.org/10.3390/rs13214215
Submission received: 16 July 2021 / Revised: 5 October 2021 / Accepted: 18 October 2021 / Published: 21 October 2021

Abstract

:
High-resolution benthic habitat data fill an important knowledge gap for many areas of the world and are essential for strategic marine conservation planning and implementing effective resource management. Many countries lack the resources and capacity to create these products, which has hindered the development of accurate ecological baselines for assessing protection needs for coastal and marine habitats and monitoring change to guide adaptive management actions. The PlanetScope (PS) Dove Classic SmallSat constellation delivers high-resolution imagery (4 m) and near-daily global coverage that facilitates the compilation of a cloud-free and optimal water column image composite of the Caribbean’s nearshore environment. These data were used to develop a first-of-its-kind regional thirteen-class benthic habitat map to 30 m water depth using an object-based image analysis (OBIA) approach. A total of 203,676 km2 of shallow benthic habitat across the Insular Caribbean was mapped, representing 5% coral reef, 43% seagrass, 15% hardbottom, and 37% other habitats. Results from a combined major class accuracy assessment yielded an overall accuracy of 80% with a standard error of less than 1% yielding a confidence interval of 78–82%. Of the total area mapped, 15% of these habitats (31,311.7 km2) are within a marine protected or managed area. This information provides a baseline of ecological data for developing and executing more strategic conservation actions, including implementing more effective marine spatial plans, prioritizing and improving marine protected area design, monitoring condition and change for post-storm damage assessments, and providing more accurate habitat data for ecosystem service models.

1. Introduction

Tropical benthic habitats, such as coral reefs and seagrass, harbor immense biodiversity and are an economic engine of goods and services that benefit the coastal communities that depend on them. Coral reefs not only provide essential habitat for one-quarter of all known marine species [1], but they also provide billions of dollars of economic value and direct benefits to at least 500 million people who live in close proximity to them [2,3]. These benefits include the support of fisheries valued at US$6.8B per year [4], the delivery of an estimated US$26B in global tourism benefits [5], and the reduction of annual expected damages from storms by more than US$4B, which protects some of the world’s most vulnerable communities against the devastating impacts of climate change [6,7]. Similarly, seagrass beds provide a wealth of ecosystem services and ecological benefits valued at over US$600/ha/year [8], fostering high biodiversity, filtering the water column, increasing sediment stability, sequestering carbon, and serving as breeding and nursery areas for important species [9,10].
Despite their immense ecological and economic value, these irreplaceable ecosystems are experiencing rapid global decline [11,12,13]. Coral reefs are suffering from the combined impacts of unsustainable coastal development, overfishing, land-based pollution, coastal runoff, ocean-warming, and acidification [14,15,16]. Seagrass habitats are threatened by dredging, coastal development, and runoff [17]. Given the increasing threats facing these habitats and their resulting deterioration, accurate maps are essential for carrying out spatial prioritization models that provide insight into the most important areas to protect and manage in terms of biodiversity value and ecosystem service benefits [18,19,20]. Over the past several decades, marine resource managers have routinely relied upon satellite-derived benthic habitat maps to provide baseline estimates at a variety of scales [21]. Producing detailed benthic habitat maps over broad spatial scales has been challenging, often requiring significant investments and the deployment of highly skilled practitioners to often remote geographies where the majority of coral reefs are located. Many small island nations lack the resources and technical capacity to develop accurate ecological baselines to assess protection needs and monitor change to inform adaptive management actions. For countries that do not have benthic habitat maps, global products are the best available option for marine resource planning. While undoubtedly useful for achieving global consistency, global models alone have been reported to be insufficient for national or local-scale conservation design or marine spatial planning [22]. While these products cover broad geographic areas, their spatial resolution is often inadequate for local actions, and benthic cover estimates are often underrepresented. For example, narrow fringing or linear habitats and benthic features that are less than 60 m in their smallest dimension are largely missed by publicly available 30 m resolution global datasets. Conversely, higher spatial resolution imagery from private satellite companies can be expensive to acquire and process; hence, these products are typically used for mapping smaller geographic areas. Though there has been some success in other geographies using acoustic methods to map benthic habitats (e.g., side scan and multibeam sonar) [23,24,25], these data are not readily available in the Caribbean and would be time-consuming and expensive to procure for very large areas. However, as remote sensing technologies and classification methods continue to improve, the ability to map larger areas and quantify finer-scale parameters that integrate ancillary datasets, such as geomorphic zones, bathymetry, and benthic composition, has increased [26,27,28,29,30].
To fill the data gap and address the need for more consistently mapped, detailed benthic habitat products across broader scales, a first-of-its-kind high-resolution (4 m) thirteen-class regional benthic habitat map was developed for 203,676 km2 of shallow habitat (<30 m depth) across the Insular Caribbean using an object-based classification approach. The map was created using the PlanetScope (PS) Dove Classic satellite constellation and utilized a standardized benthic habitat classification scheme that was performed on a composite of 38,642 scenes. Each scene was selected for water clarity and optimal water column properties with low sunglint and water surface roughness. When compared to global benthic datasets, the object-based method using the PS imagery captured more detailed, ecologically meaningful shapes and classes that were derived from both spectral and non-spectral attributes of the imagery, including bathymetry, geomorphic zones, and corresponding spatial and contextual information (Figure 1). Thousands of GPS-referenced field video transects, drone imagery, and scuba diver data collected throughout the region were used to train the classification algorithm and assess the accuracy. Local experts throughout the region were consulted to manually adjust and refine the final product. Compared to global products, this innovative, scalable approach to coastal ecosystem mapping and monitoring delivers a much higher spatial resolution and regionally consistent map product and ecological baseline. For many Caribbean countries that lack these data, this product represents the basis for more strategic and targeted conservation spatial actions, such as the improved design and implementation of more effective marine protected area networks and marine spatial plans, a baseline for monitoring biophysical conditions and system changes, such as post-storm damage assessments, and the provision of more accurate input data for ecosystem service models and benefit calculations.

2. Materials and Methods

2.1. PlanetScope Imagery

The foundation for successful image feature extraction is based on the selection of optimal imagery [31]. With 150+ SmallSats (4-kg) in a 475 km altitude sun-synchronous orbit (~98° inclination), the PS Dove constellation provides four-band multispectral coverage over major landmasses and coastal areas at ~3.7 m ground sample distance and a geolocation accuracy of ~10 m [32] (Table 1; Figure 2). Two limitations identified with PS imagery include the radiometric differences between the different PS Dove “flocks” and the low signal-to-noise ratio for high-accuracy detection and mapping of the coastal benthos [33]. Despite lower spectral fidelity and variable radiometric quality, PS data provide higher spatial resolution over publicly available image datasets and a much higher temporal resolution (near-daily) over existing imagery providers. The collection capacity of the Dove constellation is 340 million km2/day. This is particularly useful in marine and coastal applications when cloud-free and clear water column conditions are needed for continuous monitoring for detecting changes in benthic cover, tracking sediment plumes and water quality, or assessing post-storm damage. Obtaining a cloud-free observation with calm, clear water conditions and minimal sunglint and turbidity is critical for achieving accuracy in benthic habitat classification. Therefore, the high temporal cadence makes PS imagery well-suited to this task, as daily observations dramatically increase the likelihood of capturing scenes with optimal water column clarity, which has been successfully applied to similar use cases [30,34,35,36]. However, each PS scene has a relatively small footprint (i.e., swath) (~20 × 12 km), and therefore, to cover a large area, numerous individual scenes acquired at different times must be selected and mosaicked together. Comparing or combining observations from different times is often challenging due to the highly variable nature of the ocean surface and atmospheric conditions. To partially mitigate this, a compositing and normalization method was developed that seamlessly combined the suite of scenes that were chosen based on optimal water clarity and atmospheric conditions.

2.2. Composite Processing

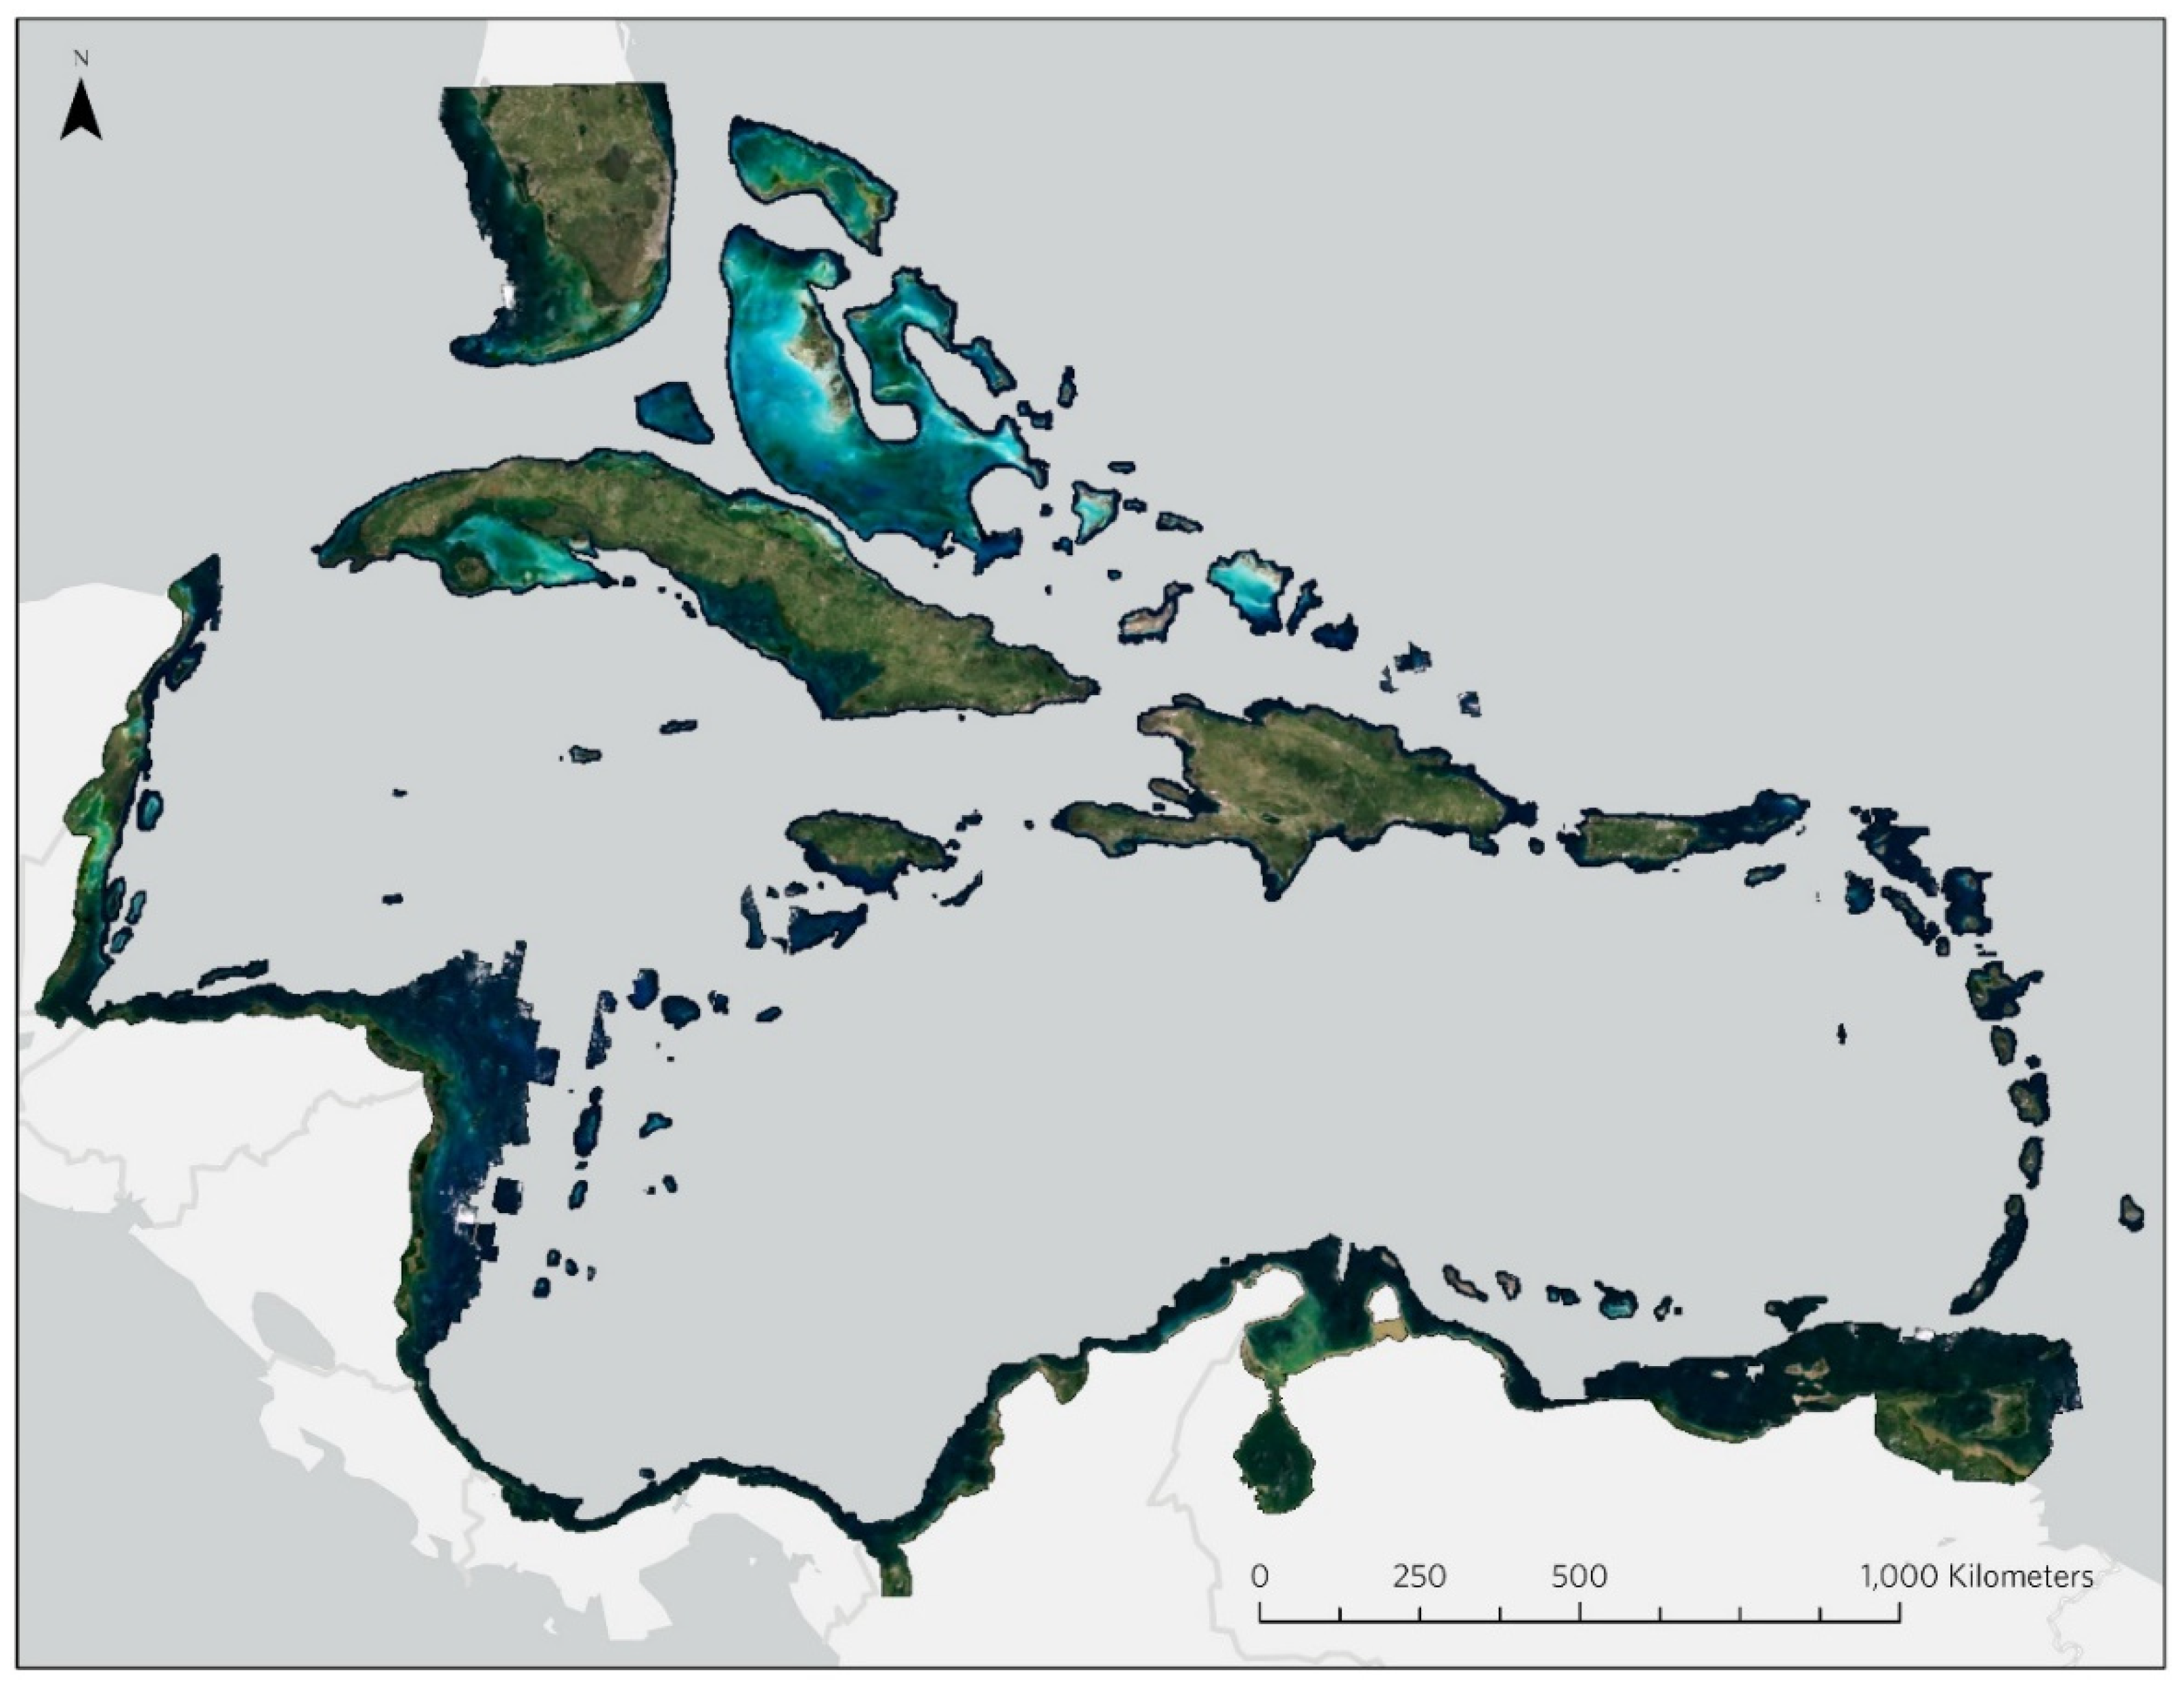
A four-band (blue, green, red, near infrared) surface reflectance composite combining over two years of observations from PS images was created for the Caribbean Basin using 38,642 scenes that were acquired between 1 October 2017 and 15 September 2019 and mosaicked using a Mercator projection. A multi-year timeframe was necessary to reduce cloud contamination and ensure adequate coverage. A best-scene compositing method was used instead of traditional pixel-based methods, since PS data do not have sub-pixel geolocation accuracy, which can cause problems when using pixel-based compositing methods [38]. Planet’s best-scene approach operates by ranking all available scenes, using all valid pixels from the best scene, then filling any unfilled areas by pixels from the next best scenes in ranked order. This ensures that adjacent pixels are highly likely to have come from the same scene, mitigating geolocation differences while reducing the likelihood of artifacts due to changing sea conditions between scenes. However, this method also necessitates additional processing to remove scene edges from the final composite and requires an accurate scene ranking algorithm to avoid undesirable effects, such as waves and sunglint.
To avoid atmospheric (e.g., haze, cloud cover) and oceanographic effects (e.g., sunglint, wave patterns, surf, and turbidity) during the compositing process, scenes were ranked based on a variety of metrics that are sensitive to these conditions. A linear model combining three independent cloud estimates and average gaussian gradient magnitude and brightness was used to find scenes most likely to yield clear seabed observations. Two of the cloud estimates incorrectly classified surf and sunglint as clouds and were, therefore, used to identify poor quality scenes. Scenes yielding a low average gaussian gradient magnitude were likely to have been acquired on calm days with low surface roughness (i.e., waves). Darker scenes were more likely to be less turbid with low atmospheric haze. The model was trained on hand-ranked lists of overlapping scenes in a variety of coastal and open water areas to find optimal weights for each of these input parameters. Due to the relatively low tidal amplitude in the Caribbean (~0.5 m), scenes were not filtered based on the tidal stage, since differences in water depth and exposed area are minimal.
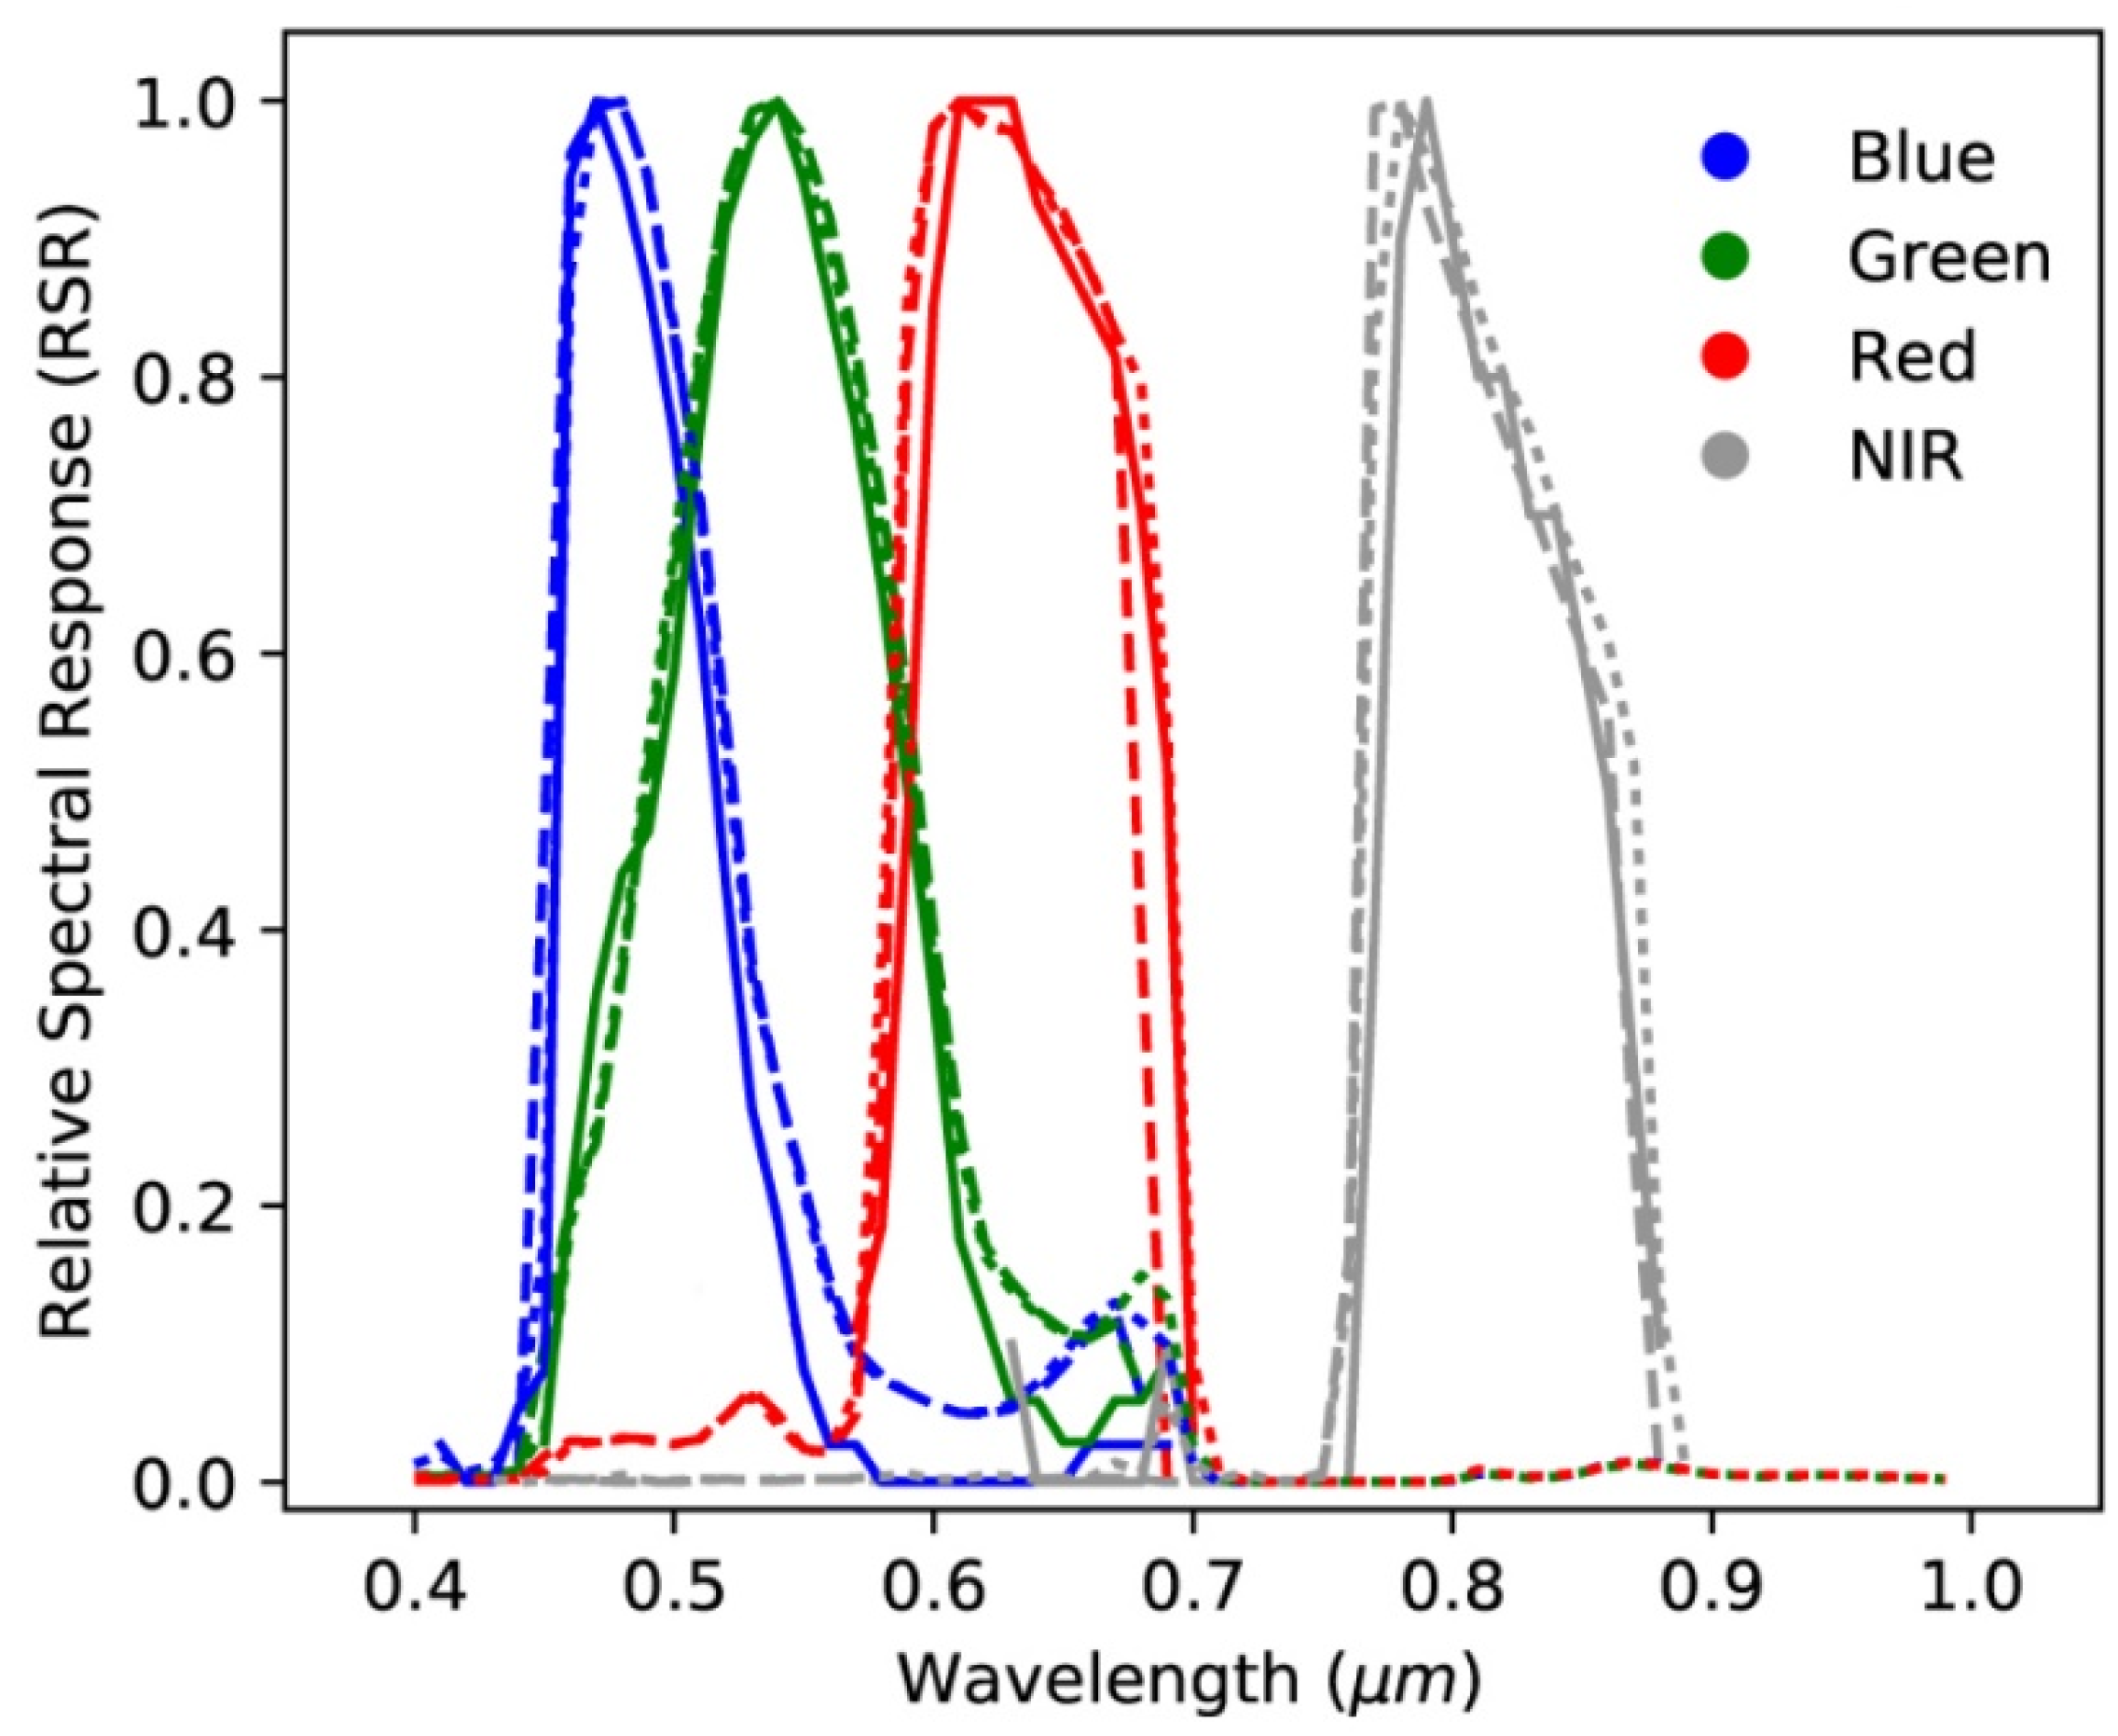
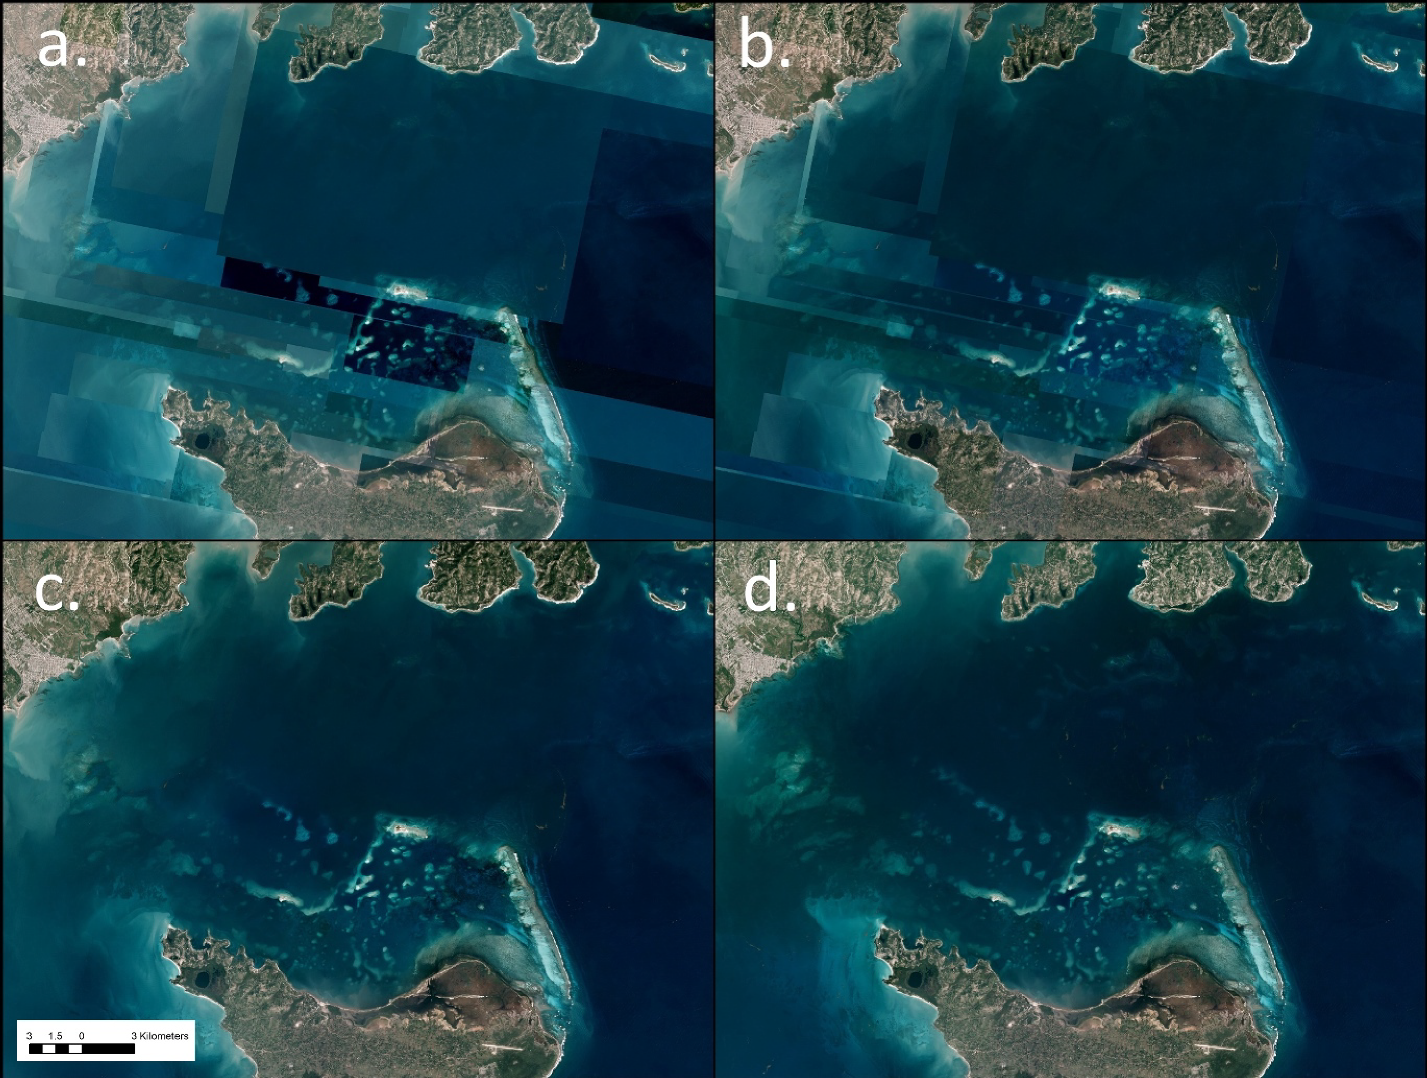
PS surface reflectance data contain a high degree of scene-to-scene variability, since the process relies on Moderate Resolution Imaging Spectroradiometer (MODIS)-based atmospheric optical depth estimates collected at a different time and at a lower spatial resolution [39]. Additionally, PS data have a significantly different spectral response than MODIS or other common imaging platforms (Figure 3a). Therefore, each PS scene was empirically normalized to MODIS MOD09A1 reference data in addition to the physics-based atmospheric correction approach used in the PS surface reflectance scene product. The normalization takes the form of a linear Spatial Band Adjustment Factor (SBAF) for each band and is applied uniformly to the entire scene (Figure 3b) [40]. However, the SBAFs are calculated independently for each scene, rather than on a per-satellite or per-constellation basis. As a result, a variety of constraints were applied to ensure stability in the presence of sunglint. Rather than a least square fit, which is sensitive to outliers and insensitive to small changes in dark features, the absolute value (L1 norm) of percentage difference between co-located, non-cloudy pixels of the reference data and scene were minimized. Pixels over land were excluded during the fitting to ensure consistency over water at the expense of accuracy and consistency over land. To avoid overfitting of sunglint, clouds, or surf, the SBAFs are constrained such that they always preserve a reflectance of 1.0 in the input data and cannot have an unrealistic slope. Furthermore, major changes in band ratios were minimized by including a metric that measures changes in band ratios during the normalization, in addition to the misfit to the reference data. Therefore, the resulting SBAFs avoid overfitting sunglint or waves and are constrained to produce physically plausible models in all cases.
The MODIS reference dataset used for normalization is a darkest-pixel composite made from MODIS MOD09A1 surface reflectance data [41]. The MODIS data were composited based on the 20th percentile of brightness in each band for cloud free pixels collected between 1 January 2014 and 31 January 2019. MODIS was chosen over Landsat 8 or Sentinel-2 as a reference dataset for several reasons: (a) the wide swath width of MODIS reduces systematic row/path artifacts compared to Landsat 8 and Sentinel-2; (b) the daily cadence of MODIS allows for fully cloud-free reference composite; and (c) Landsat 8 and Sentinel-2 surface reflectance data produced with LaSRC have significant across-track artifacts over open water [42]. However, MOD09A1 allows negative reflectance as valid data values and often produces negative reflectance over open water due to slight over-corrections. The MODIS reference composite tends to select over-corrected pixels, and as a result, has uniformly negative surface reflectance values in most bands over water. To compensate for this, a constant shift of 0.01 reflectance was applied in each band to the MODIS reference composite such that the lowest possible value represented in MOD09A1 has a reflectance of 0 instead of −0.01. This preserves relative color information that is lost over all water pixels if reflectance values below zero are clipped to 0.
Normalization reduces major differences in scene-to-scene brightness, but small differences between scenes may create scene edges (Figure 3b). Consequently, a seamline removal method was applied to reduce the effect of scene edges on the final composite (Figure 3c) [43]. Traditional blending or feathering methods operate on a spatially varying weighted average between multiple scenes. However, due to the rapidly varying nature of the ocean surface, as well as the ~10-m geolocation accuracy of PS imagery, blending different scenes often introduces more artifacts than it removes. Therefore, seamlines were removed via a surface reconstruction method that never blends or averages pixels from different scenes, but rather, it smoothly shifts values near scene edges such that the values are equal at the boundary between scenes. This is accomplished with a variant of Poisson surface reconstruction [44], where the gradient of the composite is set to 0 along scene boundaries, and the Poisson’s equation is solved for values that honor the modified gradient, while preserving the original values at the edges of each composite tile. While this approach avoids blending multiple scenes, it can shift band ratios significantly in some scenarios. Seamline removal is applied after normalization; however, the changes are minimal, and therefore, major changes in band ratios are avoided. When differences between adjacent scenes are large (e.g., due to sunglint, clouds, or surf), seamline removal is only applied when the values along a scene edge differ by less than 0.1 in reflectance. If adjacent pixels along the edge vary by more than this amount, the original “hard” seamline at the scene boundary will be left intact.
Since automatically selecting clear and non-turbid scenes is not always accurate, an additional manual quality control step was added to identify cases where sub-optimal scenes were selected in key areas. This resulted in the manual identification and replacement of 860 scenes out of the 38,642 used in the composite, mostly along the coast of Cuba and Jamaica. In most cases, the automated approach struggled to detect turbidity, so the hand selection of scenes significantly reduced turbidity in near-coastal waters (Figure 3d). The final composite resulted in ~300 GB of seamless, non-cloudy, four-band dataset covering one million square kilometers with a spectral response approximately similar to MODIS (Figure 4). This composite reduced the need for scene-level corrections and served as the input for all subsequent processing steps and classification.

2.3. Extraction of Depth and Surface Reflectance

Using the PS surface reflectance composite, a normalized difference water index (NDWI) was applied to mask out terrestrial regions (i.e., [45]):
N D W I = ρ ( G r e e n ) ρ ( N I R ) ρ ( G r e e n ) + ρ ( N I R )
The NIR band was then used to remove sunglint effects in the visible bands (blue, green, and red) to estimate sea surface reflectance ( ρ m ( λ ) ) [30,46]:
ρ m ( λ ) = ρ ( λ )   ρ ( N I R )
Below-surface remote sensing reflectance ( r r s ( λ ) ) was derived from sea surface reflectance ( ρ m ( λ ) ) as [47]:
r r s ( λ ) = ρ m ( λ ) / π 0.52 + 1.7 ( ρ m ( λ ) / π )
Finally, satellite-derived bathymetry ( H ) was calculated from below-surface remote sensing reflectance ( r r s ( λ ) ) using an adaptive bathymetry estimation algorithm developed for PS imagery [36]:
H = m 0 ln ( 1000 r r s b l u e ) ln ( 1000 r r s g r e e n ) m 1
This algorithm measures water attenuation differences between green and blue bands to quantify the bathymetry. Both m 0 and m 1 were determined based on water column conditions. Previous studies using this method to create satellite-derived bathymetry have reported accuracies of RMSE = 1.22 − 1.86 m [36].

2.4. Mapping of Geomorphic Zones

Geomorphic zones correspond to biological and geomorphic structures and processes which make up coral reefs and other benthic communities [48]. These zones were image interpreted and manually digitized using the PS image composite and complemented with other high-resolution imagery databases from Esri, Google Earth, and Microsoft Bing, where increased detail was needed. Multiple image base maps were used to overcome issues in sunglint or limited visibility through the water column that facilitated accurate zone identification. The seven class geomorphic zones that were mapped include intertidal, lagoon, back reef (inner flat), reef crest, fore reef (outer flat), spur and groove, and bank/shelf. Reef crests were identified by recognizing breaking wave patterns in the imagery and the corresponding back (inner) and fore (outer) reef were mapped along each reef crest formation (Figure 5). Spur and groove zones were digitized based on image interpretation and represent reef types with distinct high coral ridges and low sand channel patterns generally found perpendicular to the shore beyond the fore reef. Dredged areas and coastal inland lagoons were also identified and mapped for later integration into the final classification. These geomorphic zones provided important guidance for developing the rules used in the classification, for example, selection of seagrass beds within lagoon zones.

2.5. Developing the Classification Scheme

Effective maps follow clear and transparent rationale for developing thematic classes, employing meaningful and well-described classes that are beneficial to the people that utilize them [49]. A consultation with regional coral reef experts was conducted to determine the benthic habitat classification scheme that would be most useful to marine resource managers throughout the Caribbean [50]. Potential classes were filtered and ultimately chosen based on a close examination of each classes’ spectral separability using available field reference data. While PS imagery has higher spatial resolution, one of the constraints of using SmallSat technology is a low signal-to-noise ratio and the limited number of broad spectral bands [51], which can make it more challenging to successfully separate detailed classes, which appear very similar in spectral response, especially underwater features where the reflectance signal is greatly reduced. Consequently, a pre-selected list of detailed classes was collapsed into a smaller number of more general benthic classes, based on the likelihood that these classes would achieve greater mapping accuracy. Based on an initial round of testing, the final classification scheme was reduced to thirteen benthic classes (Table 2). The reef crest, including the back and fore reef features, as digitized in the geomorphic zones, were added as individual benthic classes, since they are recognized as important reef types for focused management and monitoring actions. A description for each of these classes with corresponding field photo examples can be found in the Supplemental Materials.

2.6. In Situ Data

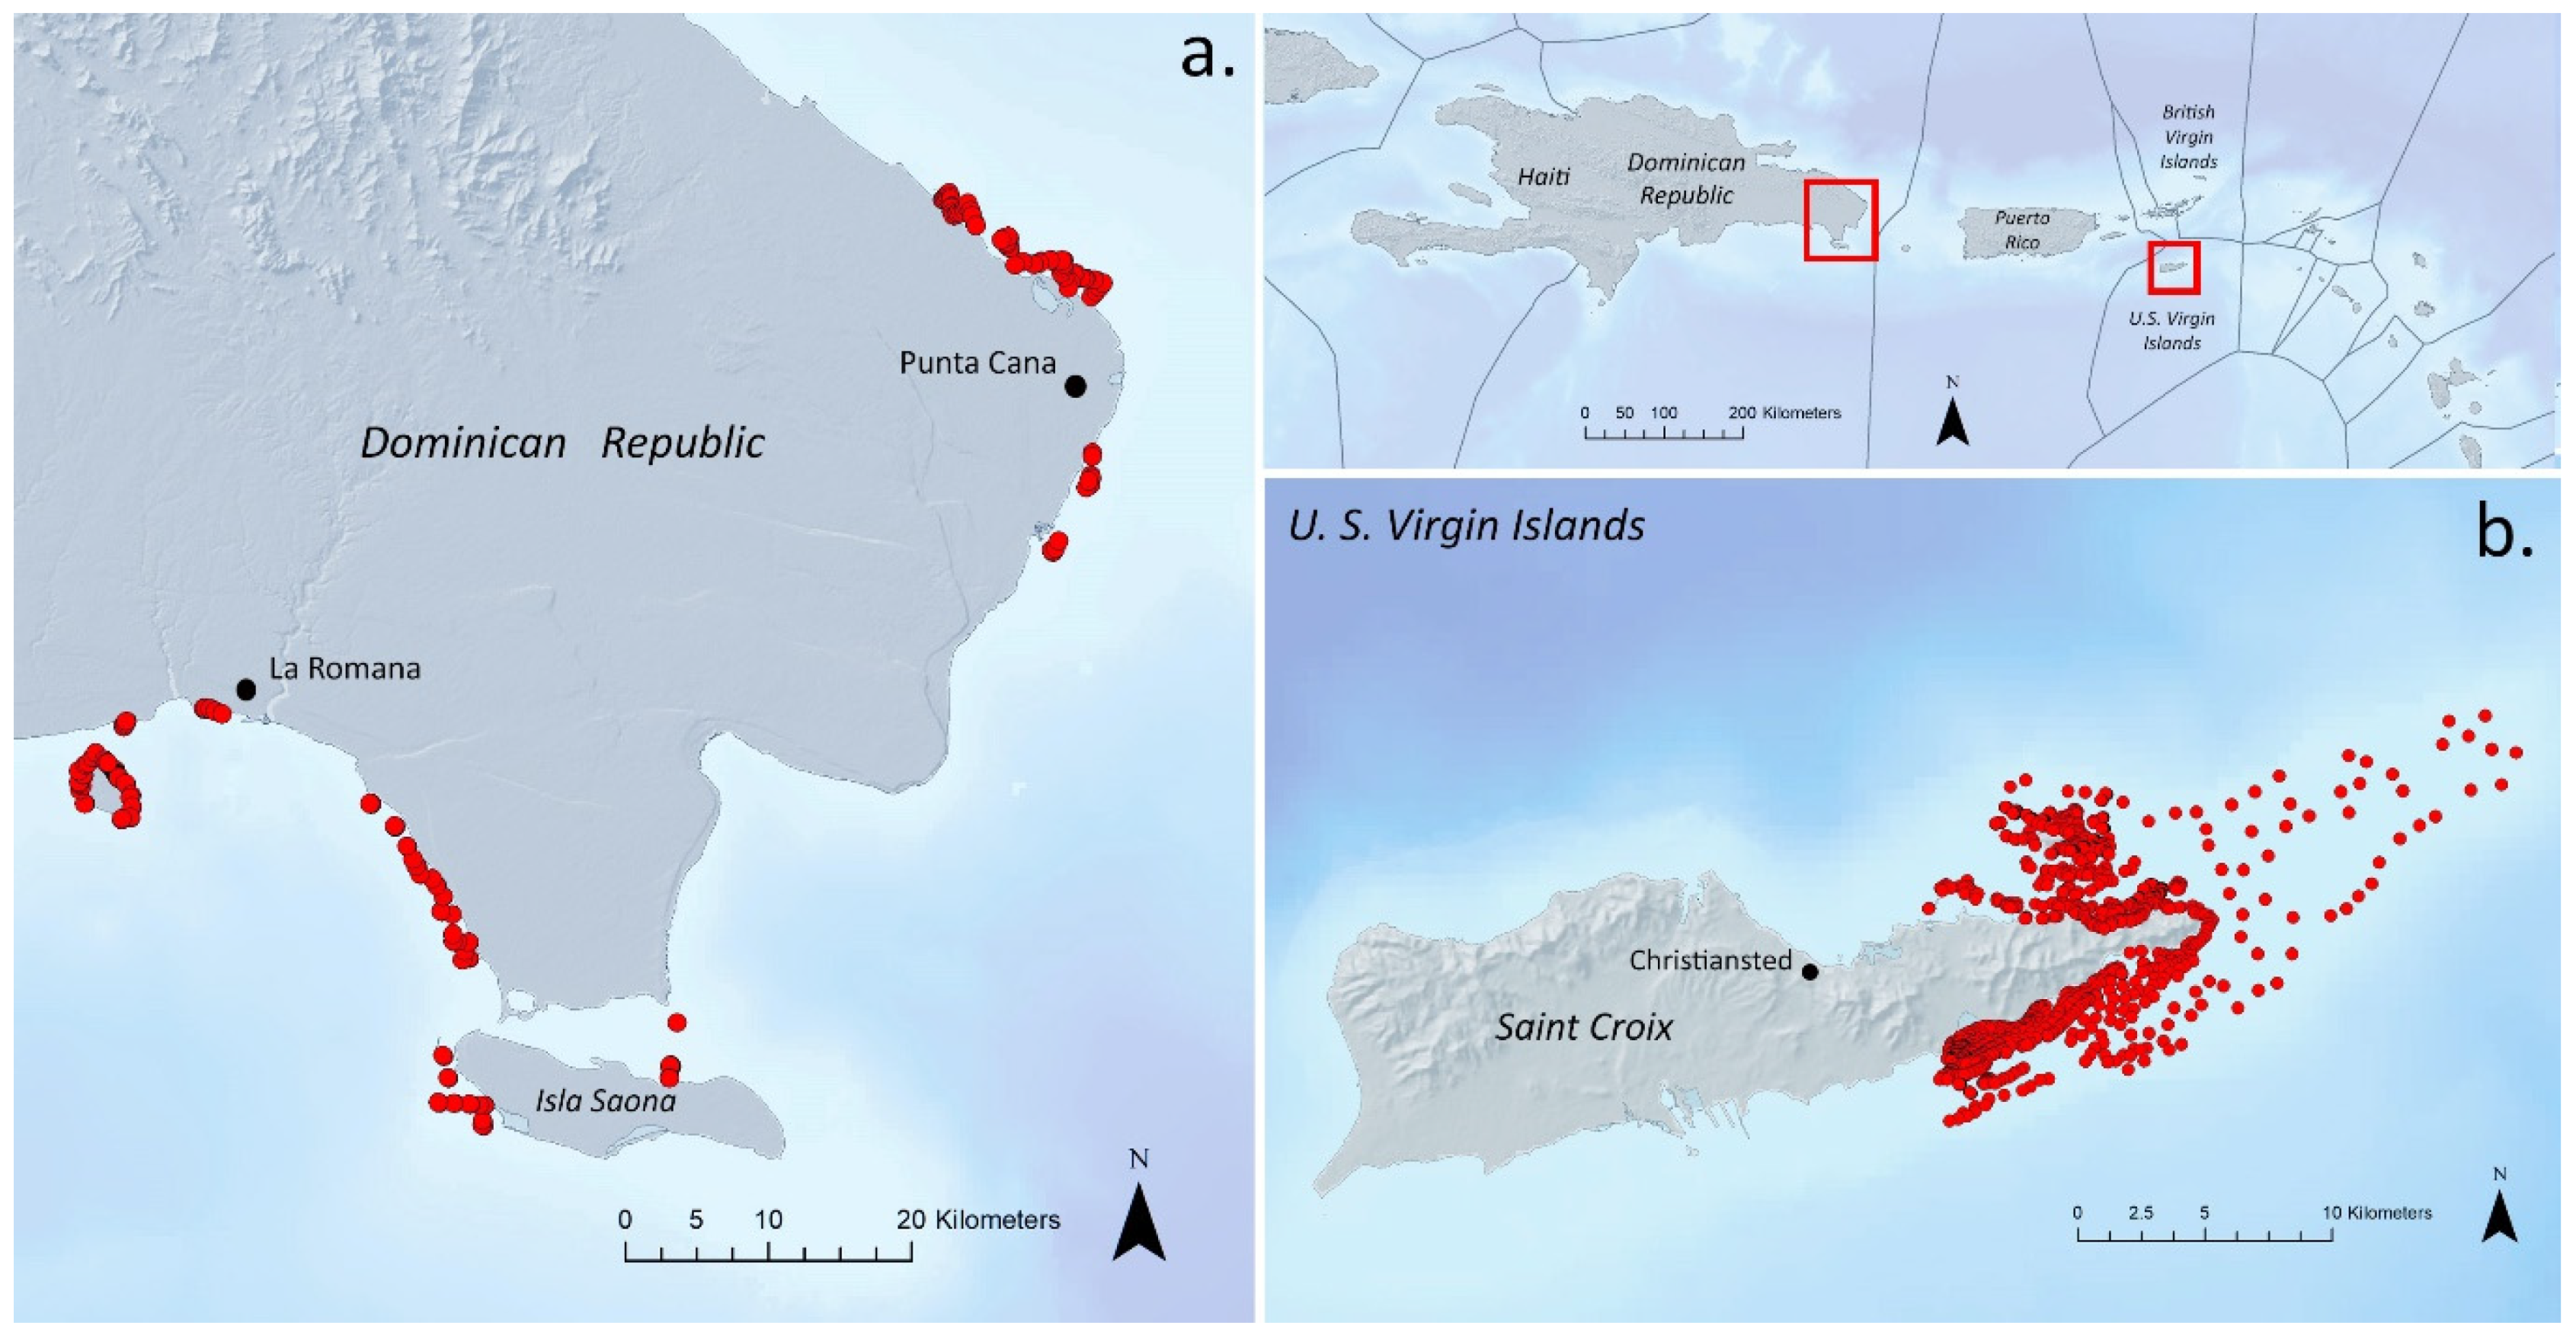
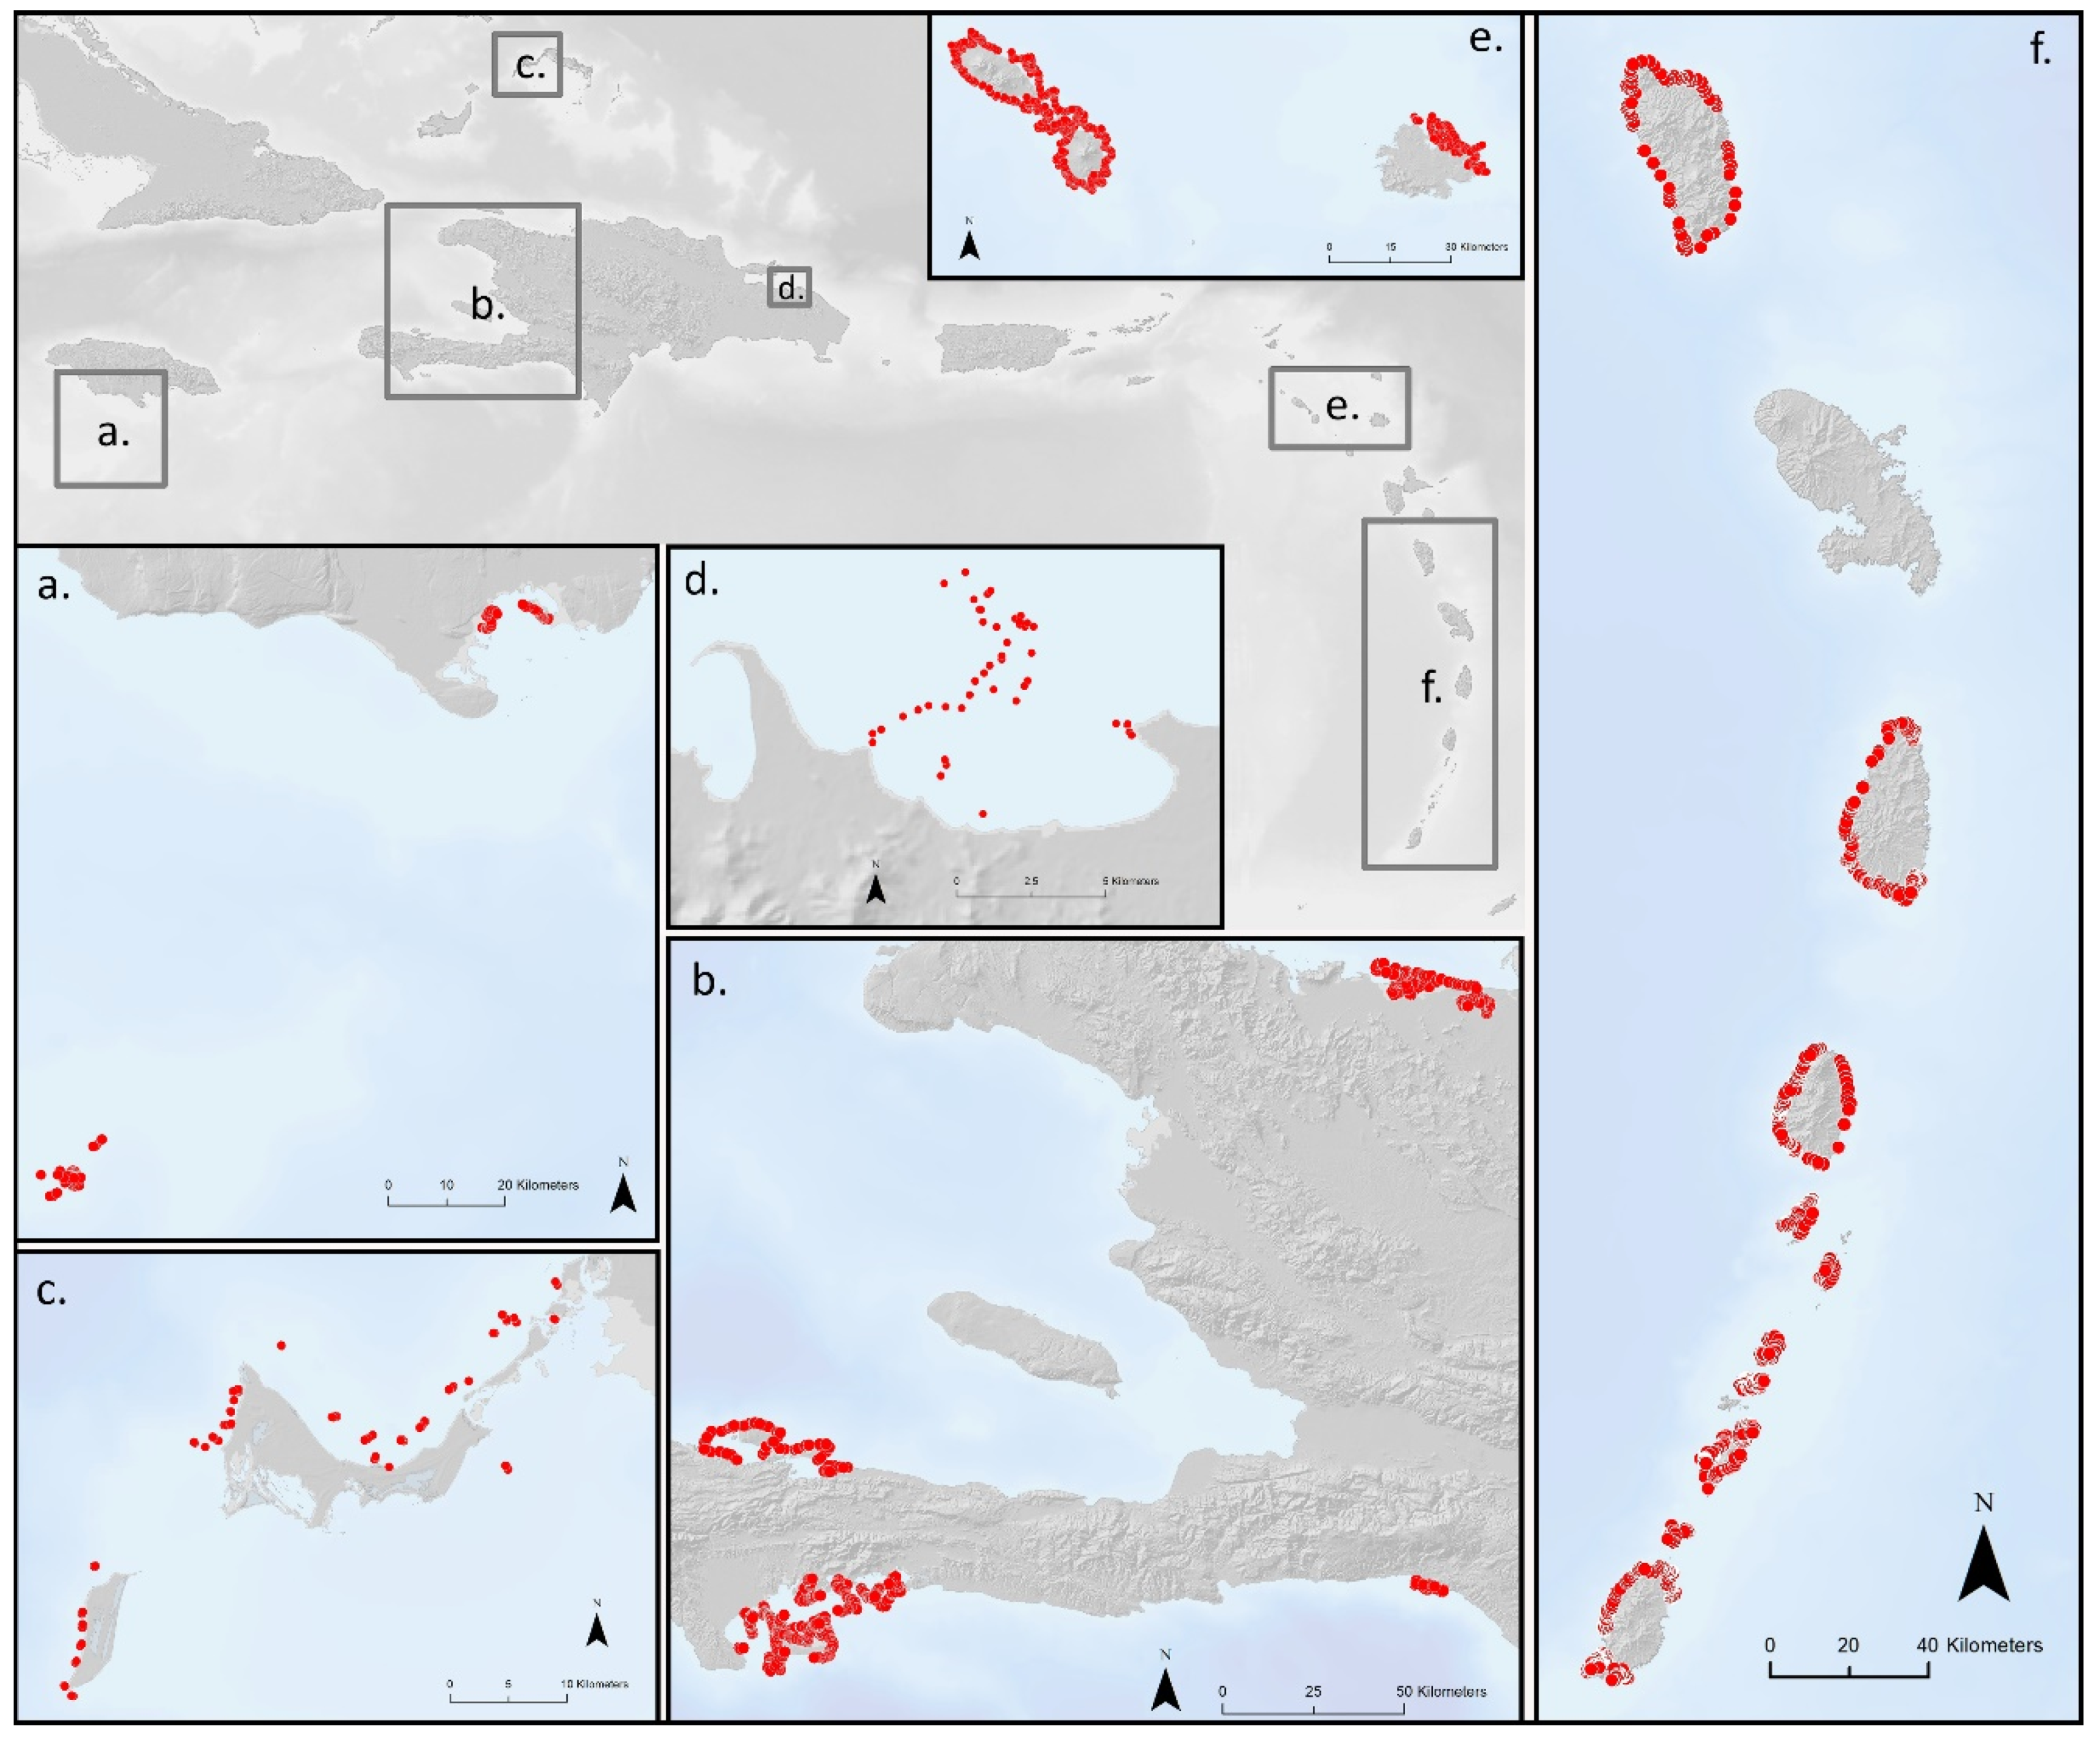
In order to train the classification algorithm, a variety of in situ field reference data were used within selected test areas. The primary information came from a database of 1653 GPS-referenced underwater video surveys collected in the Dominican Republic and Saint Croix, USVI (Figure 6) between 2017–2019, corresponding to the date range of the PS image composite. Each of these field transects was collected as part of a local scale mapping project in collaboration with the Global Airborne Observatory (GAO) and designed to assess a diverse array of benthic compositions. Transect locations were selected based on a strategic image interpretation sample of each benthic class and a SeaViewer Sea-Drop 6000 HD (Tampa, FL, USA) underwater video camera with 30 m vertical cable was used to collect the video. Corresponding bathymetric field measurements were simultaneously collected using a Lowrance Elite7Ti ® (Tulsa, OK, USA) system with a xSonic P319 (50/200 kHz) transducer and 10 Hz GPS receiver that collected continuous depth readings at 3 pts/s along each transect. These measurements were previously used to develop a new adaptive bathymetry estimation algorithm for PS imagery and adaptively tunes a depth estimator according to water column attenuation conditions with reported accuracies of RMSE = 1.22 − 1.86 m [36]. For each field transect, the benthic habitat type was interpreted from the videos and matched to the habitat class used in the regional classification scheme (boulders and rocks, coral/algae, hardbottom with dense algae, hardbottom with sparse algae, muddy bottom, sand, dense seagrass, sparse seagrass, and spur and groove). These survey point data were also used to train and validate respective development steps within the classification method. For example, when developing the classification approach for the different reef types, half of the georeferenced survey points were used in the classification, while the other half were used for post-classification validation. In addition to the video transects, supplemental field data, including high resolution drone data, snorkel surveys, and local knowledge were used to refine the classification results within the test areas of the Dominican Republic and Saint Croix, USVI.

2.7. Classification Method

The Caribbean benthic habitat classification was conducted using Trimble eCognition v9.5 software [52], which is composed of a front-end development environment called eCognition Developer and a background processing environment, eCognition Server, which allows for batch and parallel processing of data. The RuleSet for classifying the benthic habitat classes was developed and tested in eCognition Developer using the intrinsic Object-based Image Analysis (OBIA) approach. RuleSets are developed as the means to transfer the way a human interprets and understands an image into a machine-interpretable language called Cognition Network Language (CNL). Objects represent pixels of similar value ranges and are created through image segmentation, which treats objects as entities, providing topological relationships and access to the underlying pixel values [53,54]. With multiple object scales and different levels of segmentations contained under one hierarchy, the OBIA model can consistently and accurately represent real-world objects [55]. Ye et al. [56] suggested OBIA minimizes within-class spectral variability by assigning all pixels in the object to the same class, makes better use of spatial information such as size, shape, and texture of objects, and facilitates integration of contextual and semantic relationships among geographic objects.
The RuleSet was designed in blocks, with each block responsible for a certain step in the analysis. When creating a RuleSet, especially for projects with large amounts of data and considerable development time, an orderly and clean workflow is important to back-trace any routines. The extraction of each class and its analyses steps were hierarchically placed under descriptive parent processes, which allowed for toggling blocks on and off as well as running single blocks separately, which facilitated the detection of back-tracing errors. The image adaptive RuleSet items were implemented using variables which hold calculated values from local operations. When compared to a global threshold that would not take into account fine-scale local variations, local operations ensure that local variations of the image data as well as from derived layers are considered.
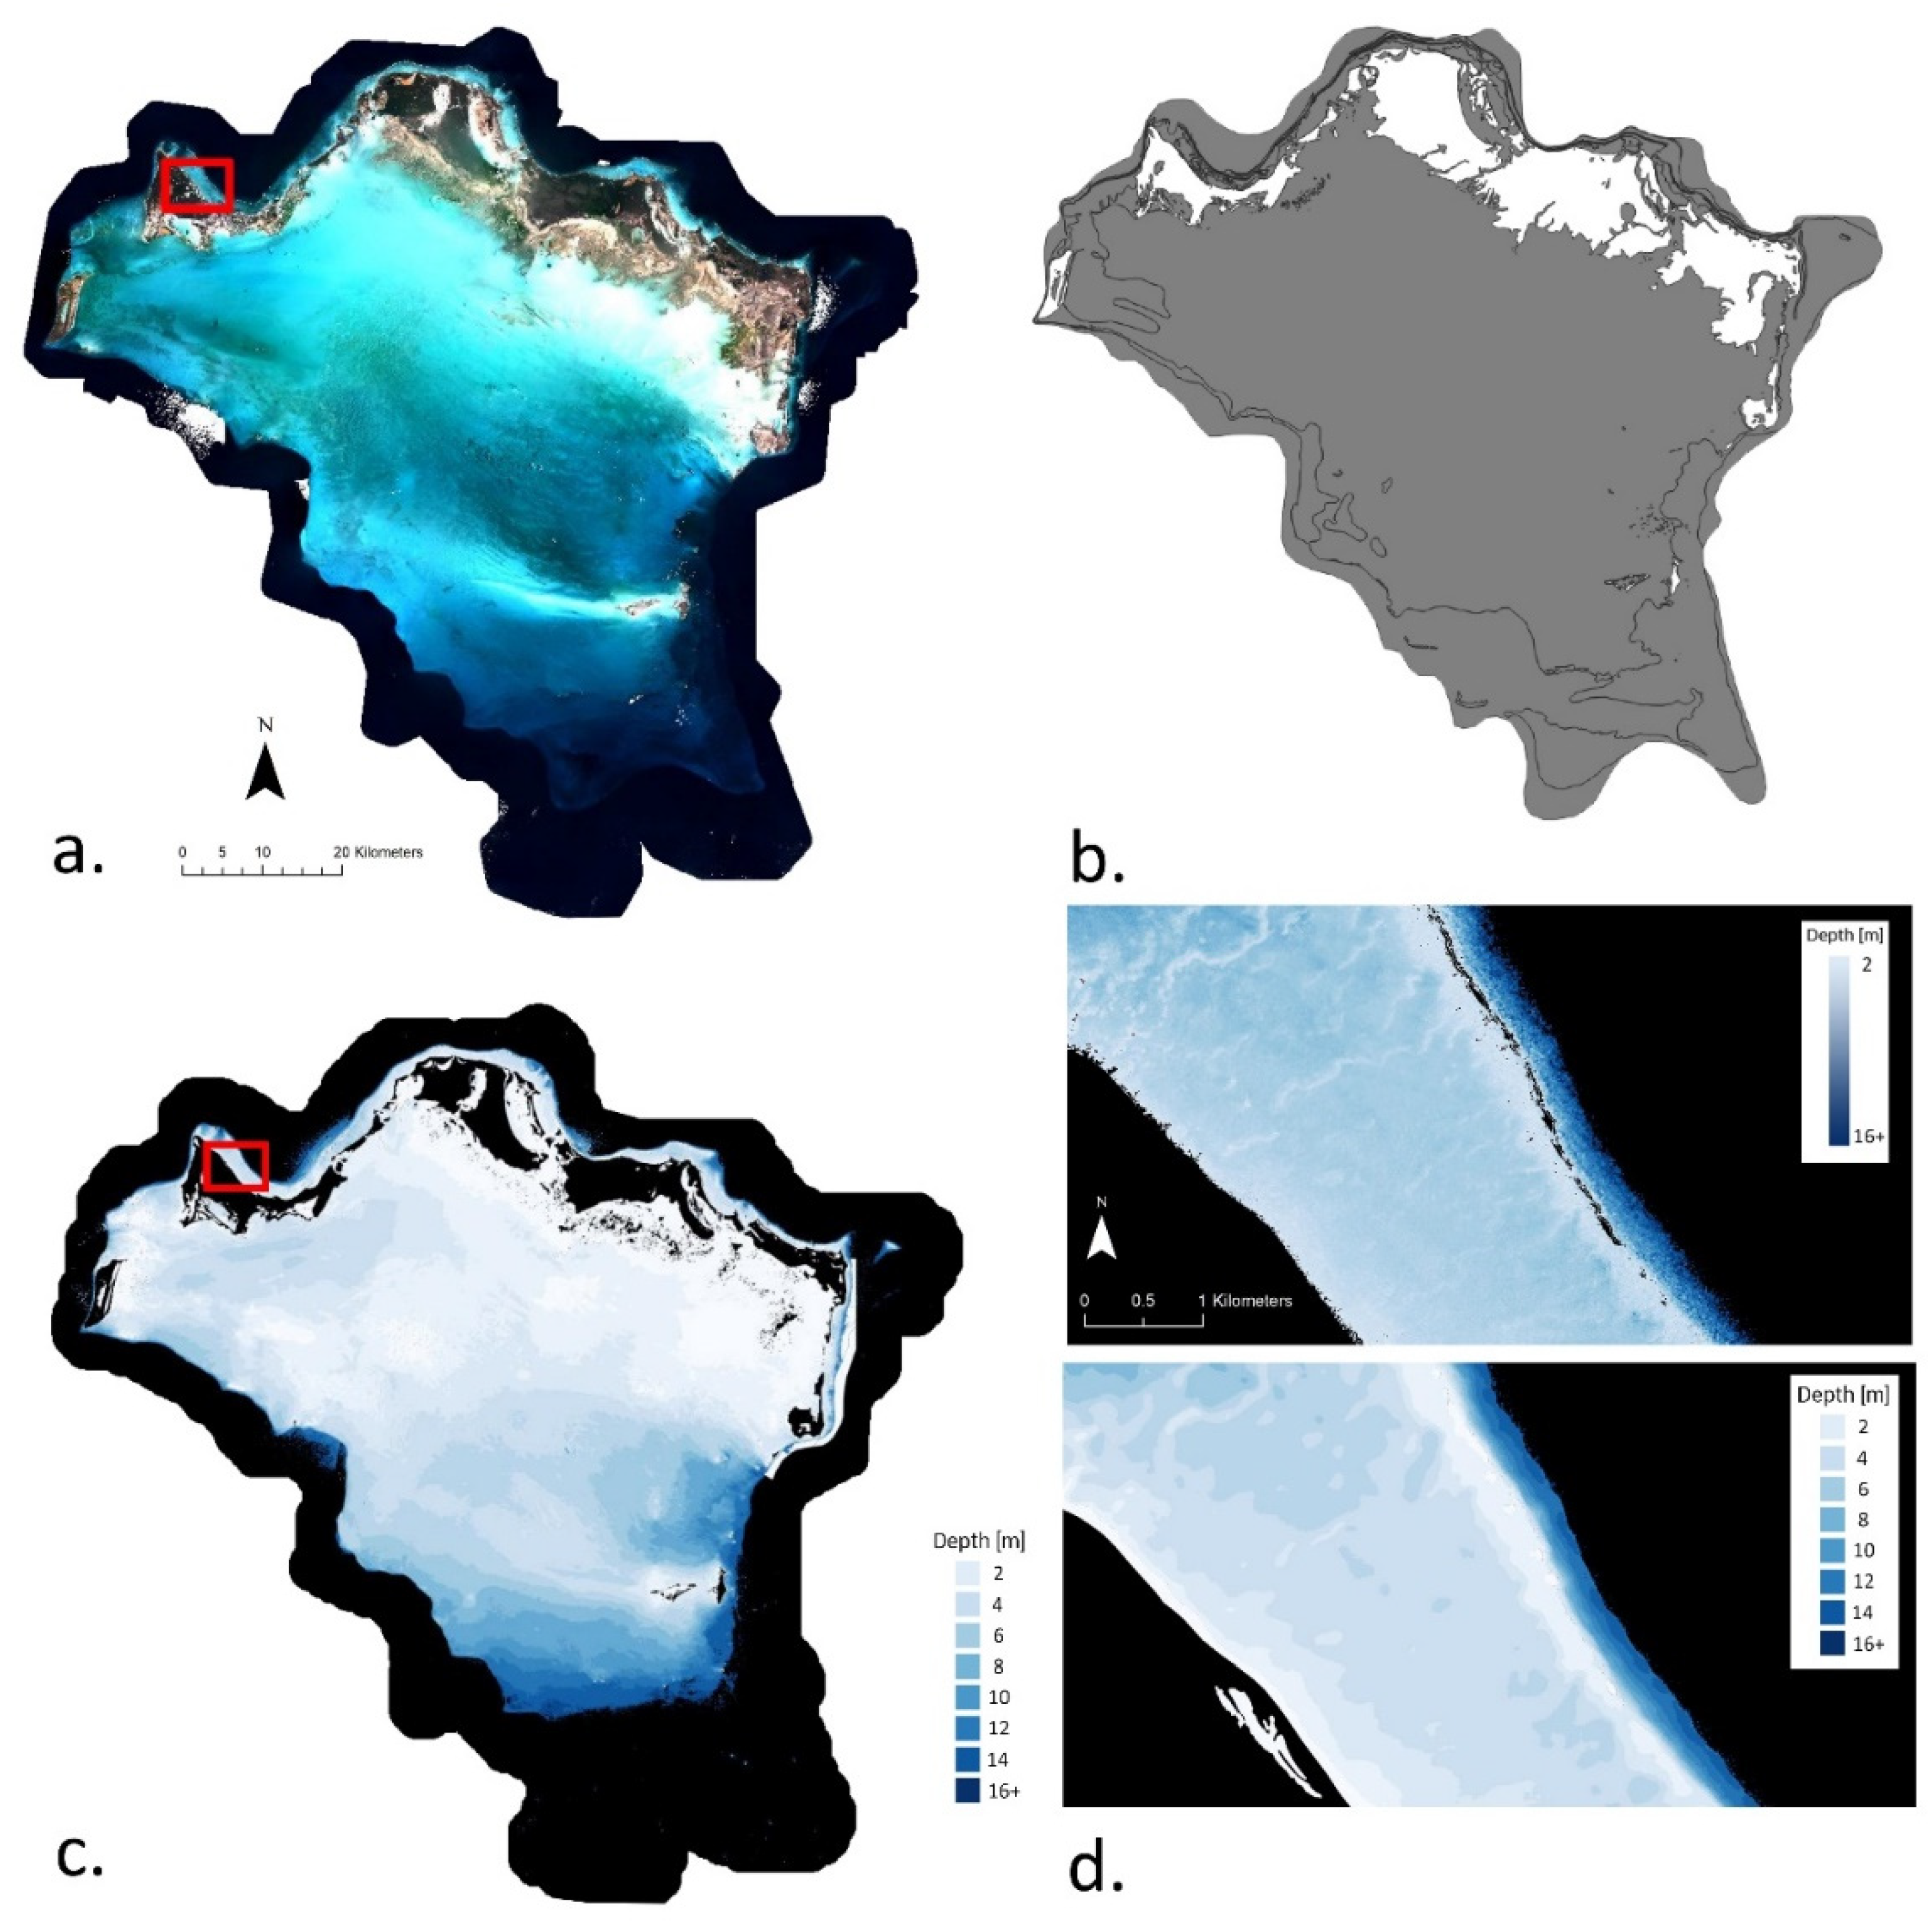
The first step, a vector-based segmentation and classification, was implemented to create a land-sea-mask using the digitized geomorphic zones, which separated land, shallow water (<30 m), and deep ocean areas (Figure 7a,b). This provided the geographic boundaries upon which any further step of the classification ruleset acted. To take advantage of the depth information and spatial relationship of benthic communities, the second step was to create a depth classification, dividing up the bathymetry into 1-m increments for depths between 0–10 m, and 2-m increments for areas >10 m depth (up to 20 m depth) (Figure 7c,d). The depth classification was done using a raster-value segmentation that aggregates areas of similar depth values into single objects. The third step was to identify the deeper areas in the imagery that were beyond the bathymetry model range but were still included in the extent of the geomorphic zones layer. These areas did not use depth to classify the objects but relied solely on the RGB (red, green, blue) spectral values to assign the benthic habitat class.
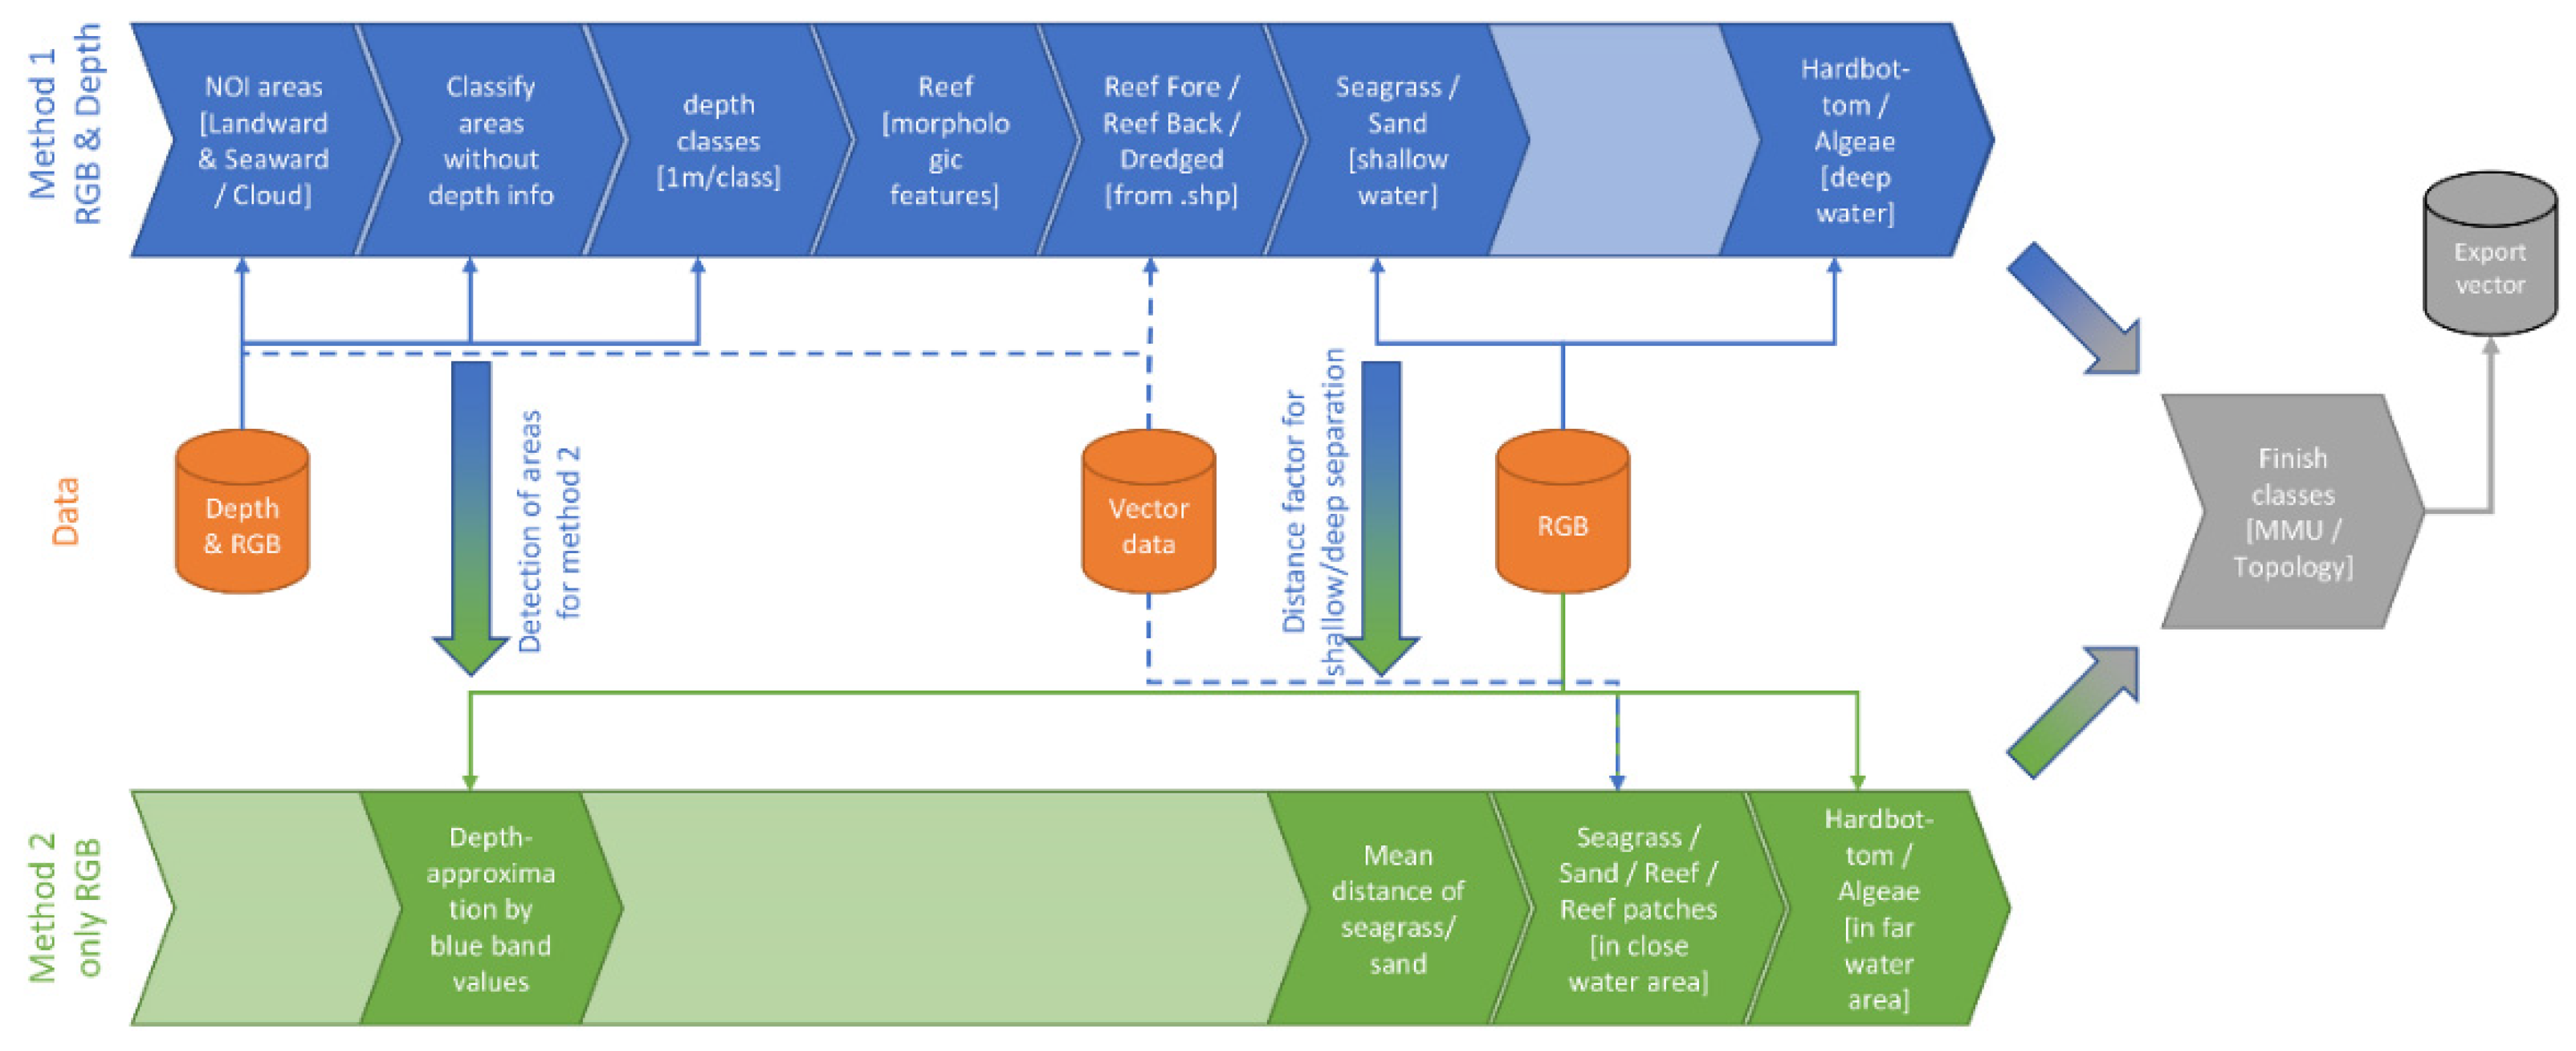
Figure 8 shows an overview of the classification workflow, which implements two parallel tracks of classifying (a) RGB values and depth (blue path) in areas where underlying depth information was available (<20 m depth); and (b) only RGB values (green path) where depth information was absent (~20–30 m depth). Although depth and RGB values workflow increased the likelihood of correctly classifying the objects, the RGB-only approach was used to distinguish deeper habitats such as sandy bottom and distinguishing between dense and sparse algae hardbottom areas. Spur and groove corals were manually identified and mapped in the imagery, since these areas were easily distinguished with their distinct coral ridges and sand channel patterns. When intersected with the geomorphic zone layer, objects beyond depths greater than 30 m were removed and the resulting outline provided a shelf boundary line.
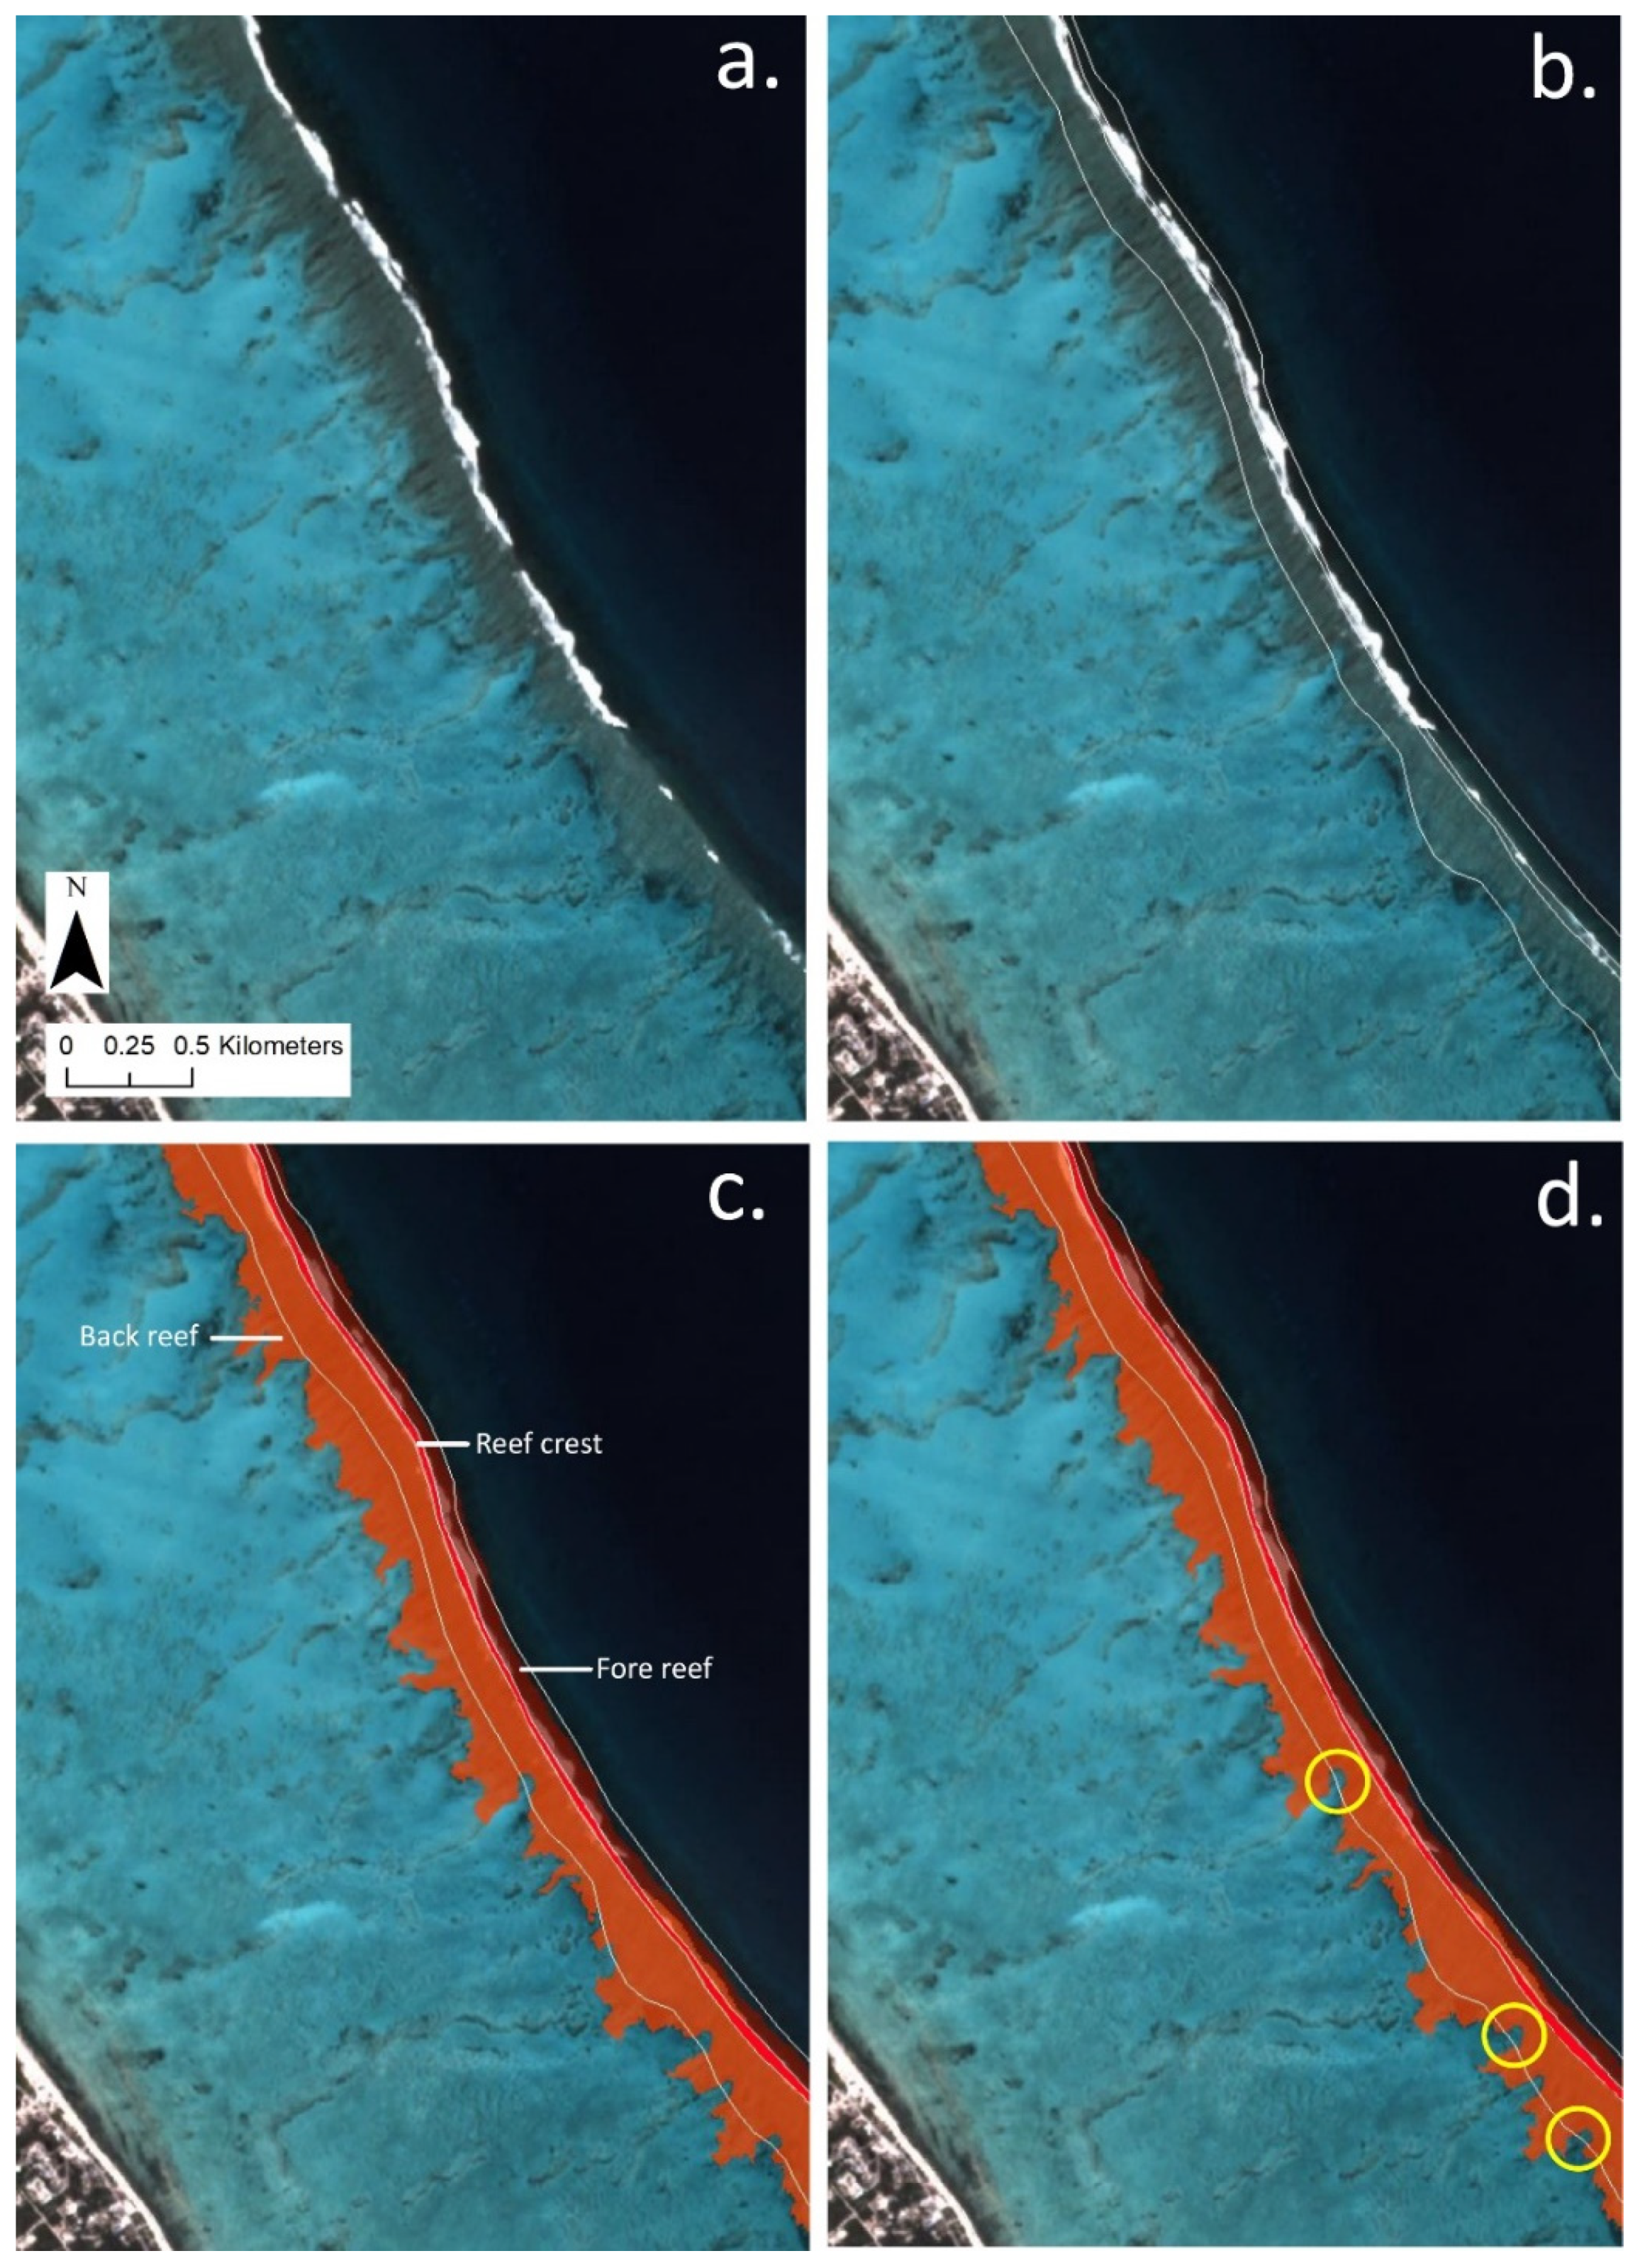
The majority of reef habitat classes were mapped using both RGB and depth, where the depth classification was used in combination with the geomorphic zones to identify and refine the different reef types (i.e., reef crest, fore reef, back reef, and other patch and fringing reefs that were assigned to the “Coral/Algae” class) (Figure 9a,b). An innovative spatial approximation routine in eCognition was developed that takes advantage of the image object hierarchy and data fusion abilities. The routine used the geomorphic zone polygons to provide spectral ‘parental guidance’ restraints in the classification, focusing the identification of objects within the polygon boundaries based on spectral value thresholds. Using this parental guidance routine within the polygon outline, the predominant spectral response was calculated, and an object was formed around it. This new segment was then allowed to expand beyond the polygon extent, essentially seeding new areas as long as the spectral response remains within the defined narrow range of the predominant values (Figure 9c). Additionally, the objects within the polygon that were outside the defined rules of the spectral response range were merged using a best-fitting technique (Figure 9d), allowing outside objects to intrude inside the polygon, refining the original object boundary. Hence, the method for coral reef classification took advantage of existing knowledge from the geomorphic zones, using this information for seeding areas and expanding throughout these boundaries. Smaller reef patches were detected using the depth classification, scanning the model with a kernel to identify distinct elevated humps within a certain elevation threshold based on neighborhood values. Narrow fringing reefs were detected using the same spectral parental guidance approach, searching for specified range thresholds of the red-blue ratio within objects that were identified within the geomorphic zones.
Within lagoon areas, the classifier separated sand and seagrass beds by investigating the full spectral response of the respective lagoon zone to calculate an object-specific range and subsequent threshold between bright sand and the darker seagrass objects. Objects identified as seagrass were then split into dense and sparse seagrass areas using the same object-specific approach and threshold within selected objects. Seagrass beds are typically not found at depths exceeding 12 m and this was used as a rule to further guide the classification. When considering inland coastal lagoons, these features were identified, since they are cut off from open water. Estuaries and inland bays were classified between sand, seagrass, or muddy bottom based on a spectral threshold of the object. Objects created over deeper areas of the shelf (>12 m depth), often located beyond the fore reef, were the last to be classified. Benthic communities found at these depths include coral, hardbottom with algae, and sandy bottoms. Since the spectral response is greatly diminished in deep water, the classification within those areas had to be highly fine-tuned. This is especially true for detecting the deep ocean edge boundary (areas >30 m depth), where bottom reflectance from the seafloor is no longer recorded by the sensor. At these depths, the object-specific range and subsequent threshold method was less accurate when trying to distinguish between coral/algae and hardbottom. The automated results often required extensive manual corrections based on image interpretation using other high-resolution satellite image databases such as Esri, Google Earth, and Microsoft Bing. Table 3 presents several of the issues and problems that were encountered during the testing of the classification and the corresponding solutions that were employed.
Once all objects were classified, the last step was to remove any objects that were less than an adaptively set minimum mapping unit. This was done using an area threshold that varied depending on the respective class with broad-scale classes (e.g., sand, seagrass, hardbottom), having a larger minimum mapping area compared to fine-scale classes (e.g., reef classes) in order to better preserve these smaller class occurrences. Objects with less or equal to the area were dissolved by majority length of the common border of the neighboring objects. This process ensured a clean dissolve of any object that was too small and considerably reduced the overall number of objects.
Due to the large amount of data, eCognition Server was used to process all image tiles, which were structured into workspaces, based on geographically defined areas. An import routine was defined to create an automatic workflow which imported and processed each dataset within a specified folder structure. A custom import routine was used to ensure the spectral images, depth data, and auxiliary vector layers had the same data structure and alias names used throughout the workflow. The PS image composite was divided into 314 individual tiles from which the eCognition Server engine created 602 projects. Based on an average processing time of 15-min per project, the regular processing time on one engine would have taken 150 h (~6 days and 6 h). To speed up the time of processing, a total of three eCognition Server engines were run in parallel, reducing the real production time to approximately 2 days and 2 h.
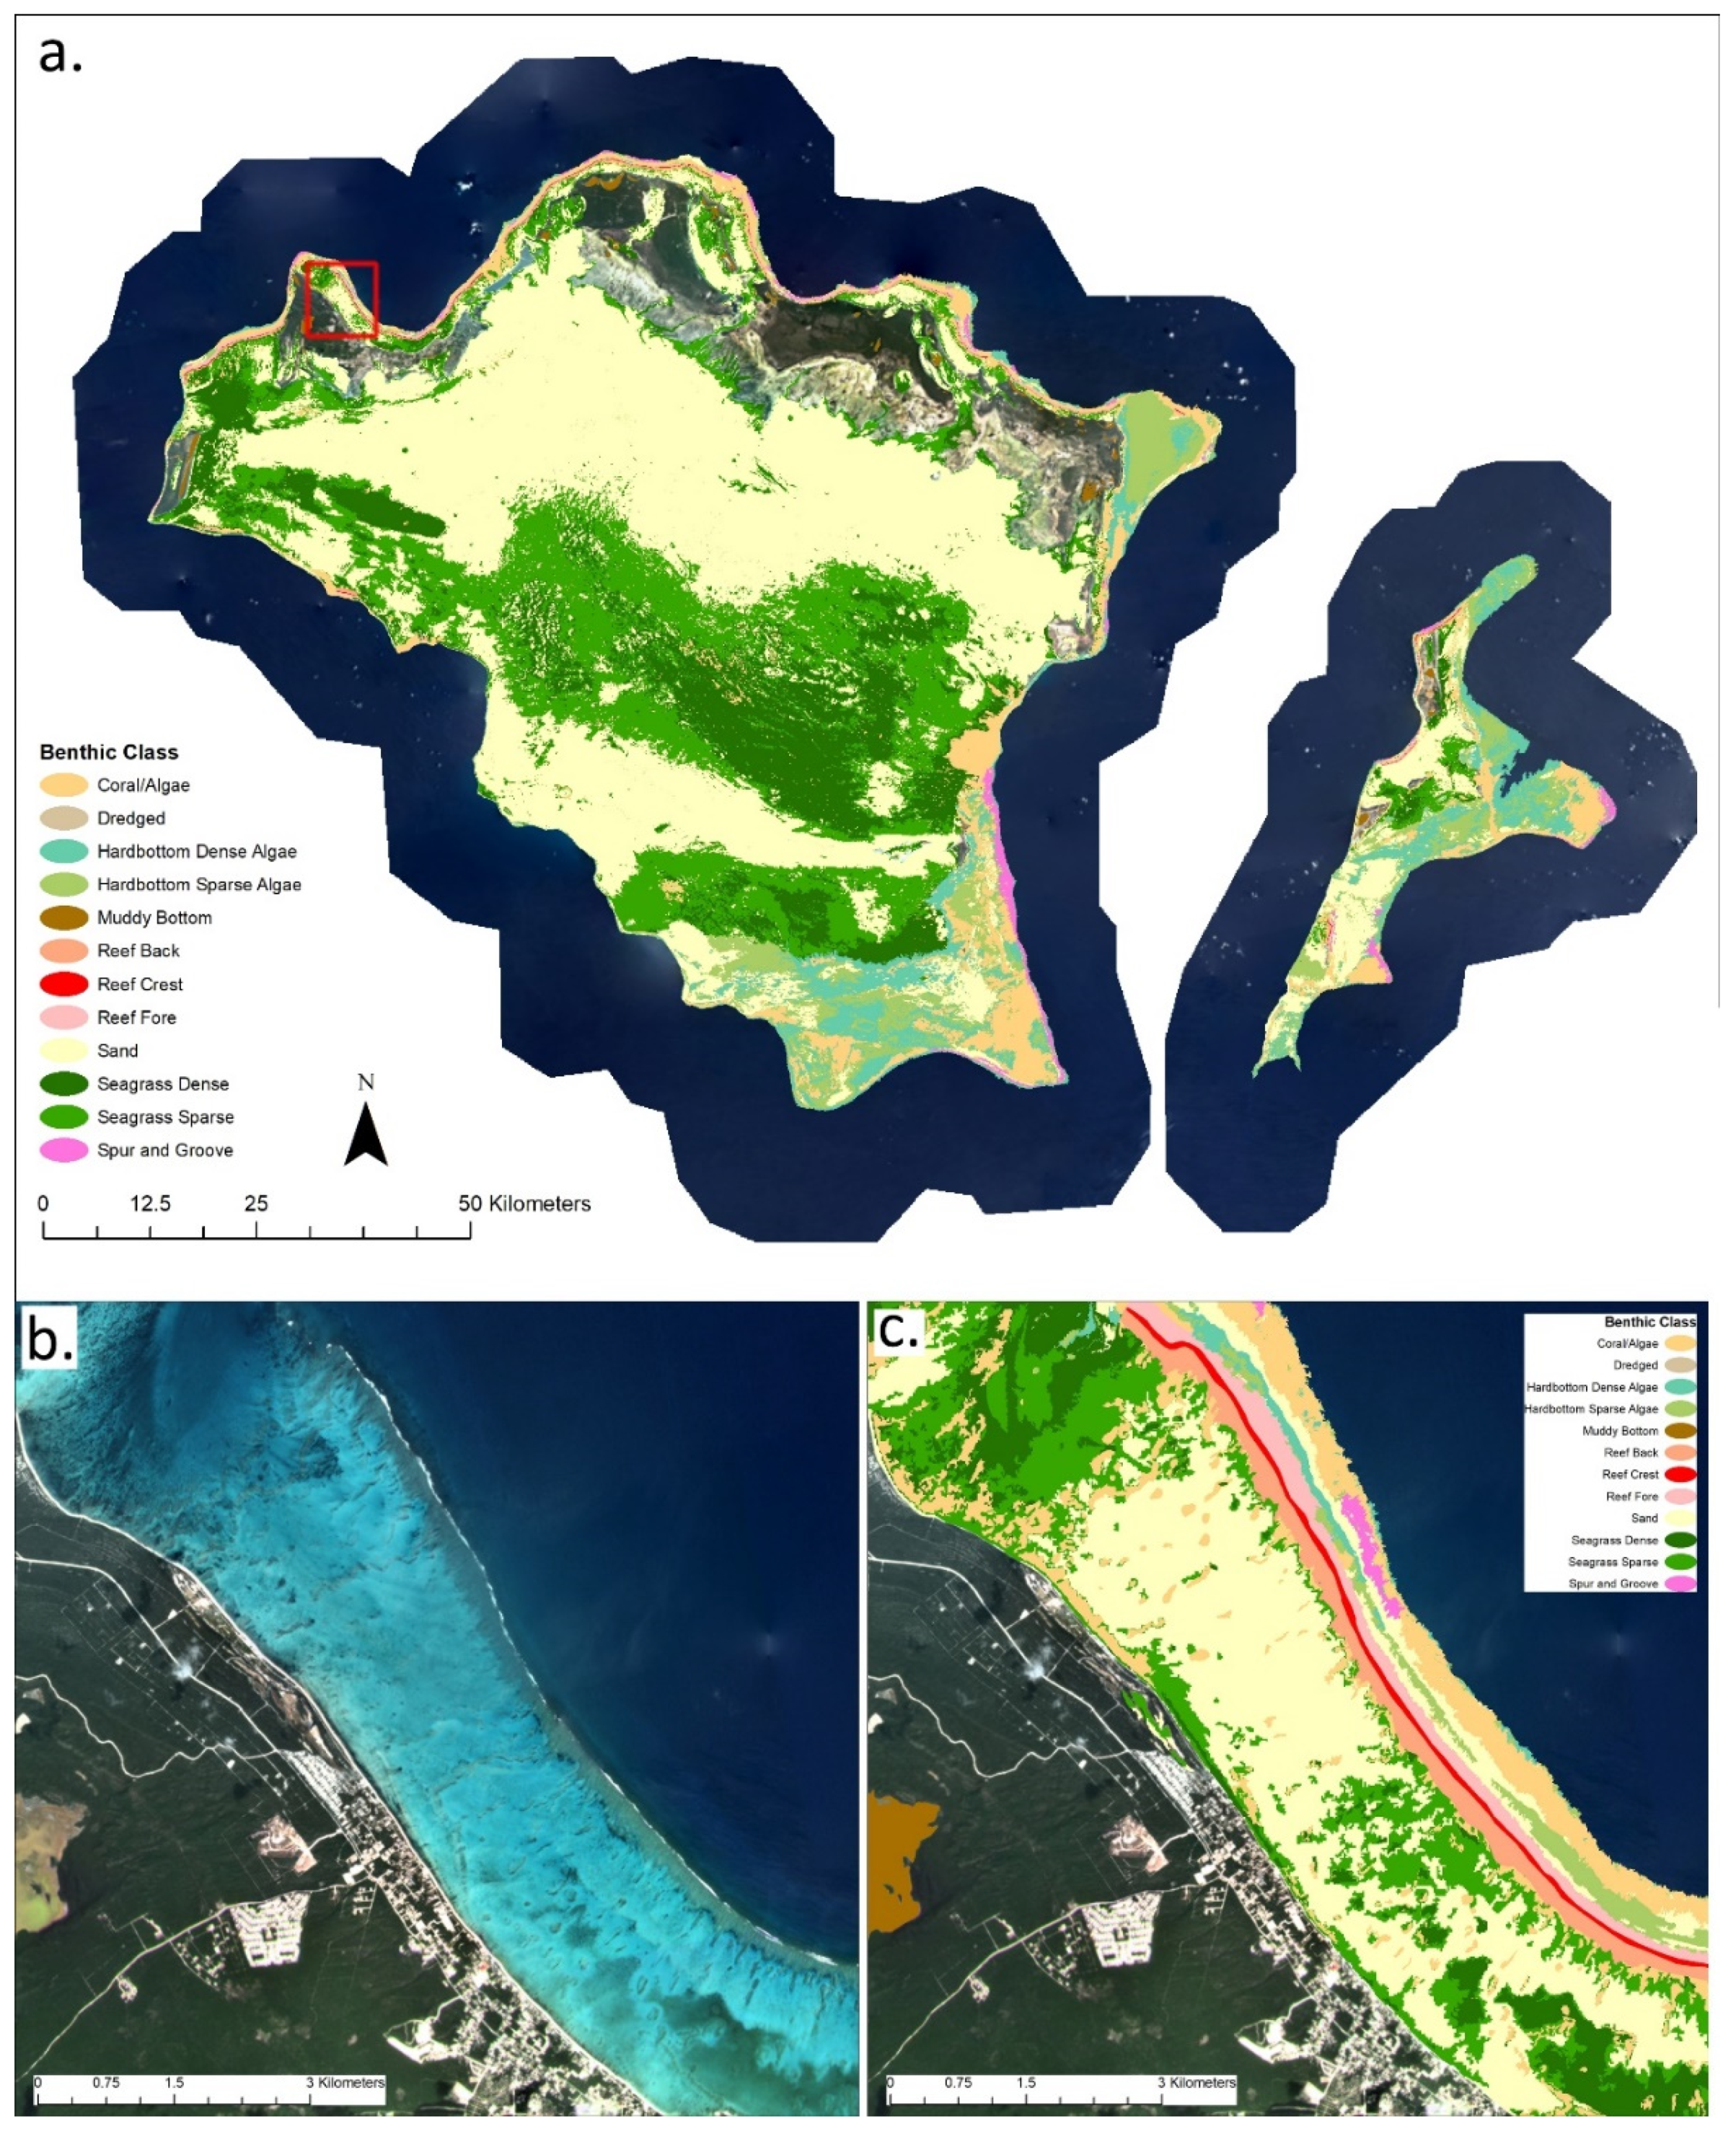
After the automated classification was completed, a quality control review identified several issues that were manually corrected. These errors included: (1) straight line boundaries caused by remnant seamlines between scenes; (2) overestimation of coral reef area, particularly in nearshore fringing reefs; (3) coral reefs that had been missed in the classification; (4) seagrass beds classified in areas that were too deep or exposed; (5) data gaps along the shoreline; and (6) incorrectly classified areas caused by cloud interference. The manual correction process focused on improving the location of coral reefs, using available global reef maps, such as the UNEP-WCMC Global Distribution of Coral Reefs v.4 [57,58,59] and existing national coral reef maps where available as guiding references. High resolution satellite imagery base maps from Esri, Google Earth, and Microsoft Bing also served as important references when fine-tuning and correcting these data. Seagrass beds were also reviewed, and incorrect boundaries were adjusted based on expert feedback and image interpretation. An example of the final PS image-derived benthic habitat classification for the Turks and Caicos Islands can be seen in Figure 10.

3. Results

The total area (km2) for each benthic habitat class within the shallow marine zone (<30 m depth) of the Insular Caribbean and corresponding area and percentage within declared marine protected or managed areas can be found in Table 4. A custom Lambert equal area projection centered on the Caribbean was used to calculate the area of each benthic habitat class. Seagrass (dense and sparse) has the greatest area coverage in the region (88, 170 km2), followed by sand (74,274 km2), hardbottom (dense and sparse algae) (29,869 km2), and coral (all classes) (10,373 km2). Of the coral subclasses, the coral/algae class has the greatest area coverage (9075 km2), followed by spur and groove reef (667 km2), fore reef (295 km2), back reef (265 km2), and finally reef crest (70 km2). Based on the 203,676 km2 of shallow marine habitat mapped, 5% is coral reef, 43% seagrass, 15% hardbottom, and 37% other benthic habitats. When considering percentage of each habitat class within the current declared marine protected or managed areas from The Nature Conservancy’s database, 20% of coral, 13% of seagrass, 22% of hardbottom, and 15% other benthic classes exist within marine protected or managed boundaries.
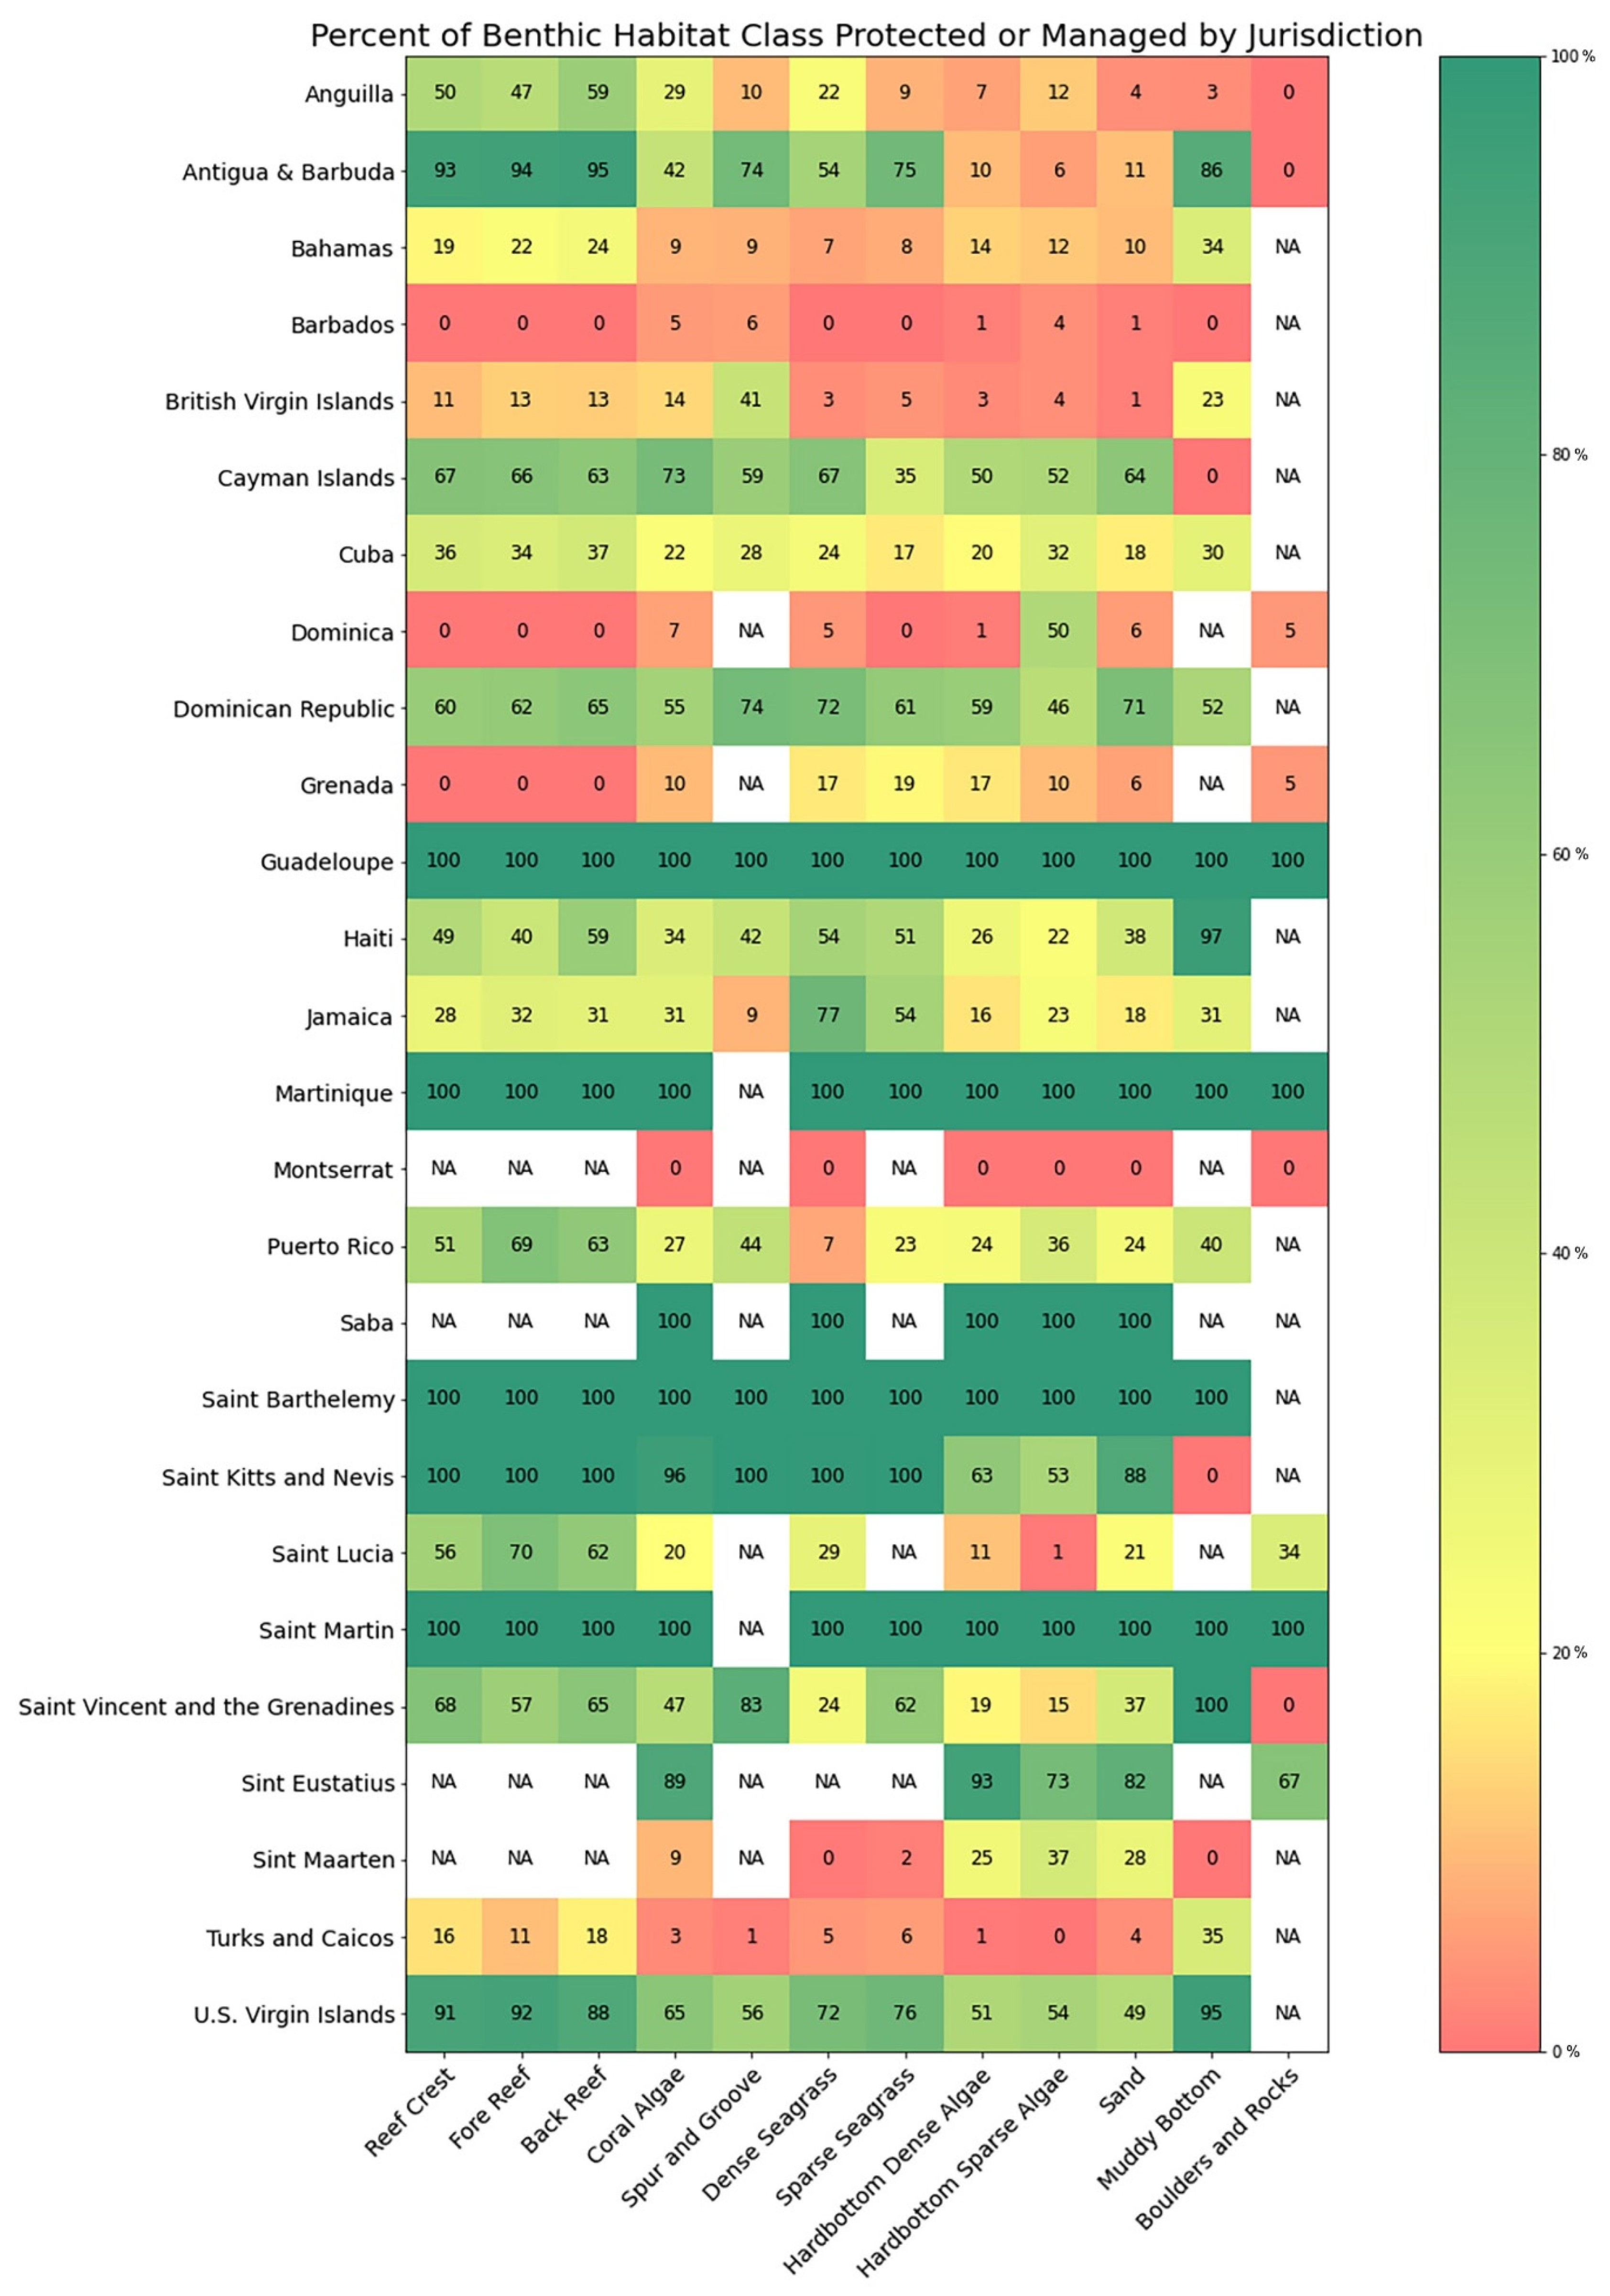
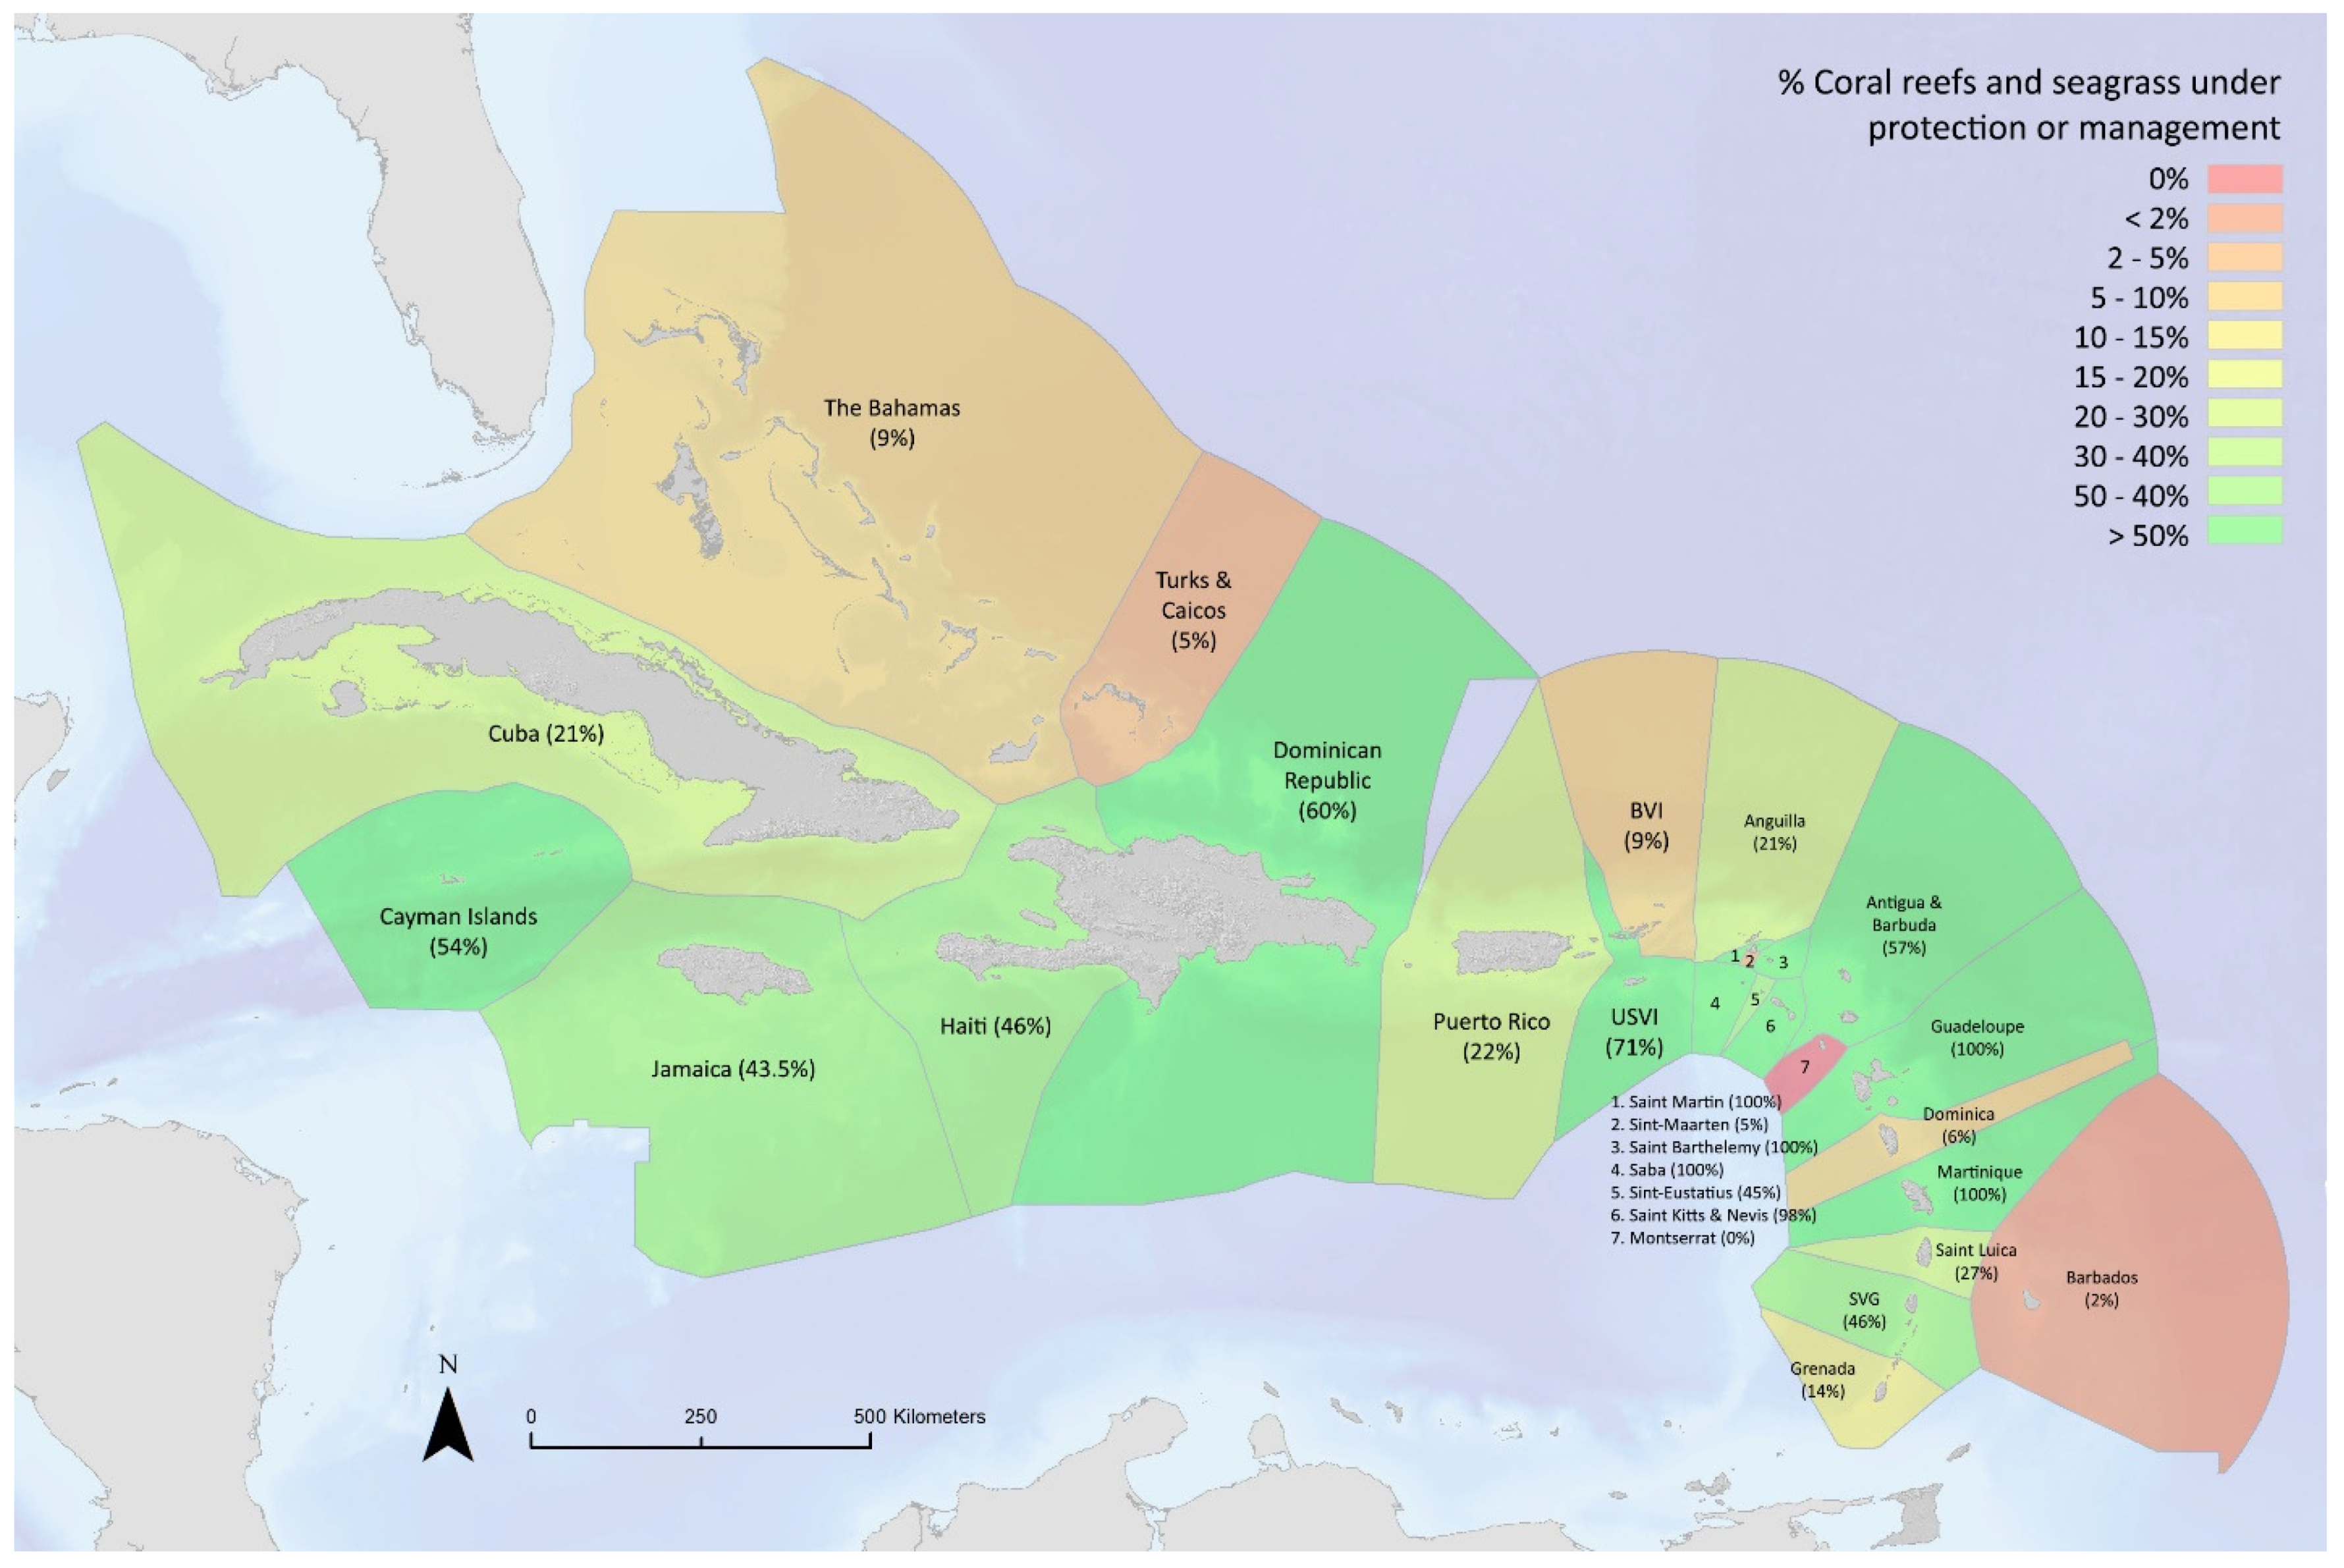
Area totals for coral, seagrass, hardbottom, and other benthic habitat classes within each jurisdiction’s Exclusive Economic Zone (EEZ) boundary (based on the 2018 VLIZ layer [60]) and corresponding percentage within marine protected or managed areas are listed in Table 5, Table 6, Table 7 and Table 8. When interpreting the tables, it is important to recognize that the marine protected or managed area database used in the analysis includes all types of legally declared marine protected or managed areas collected by The Nature Conservancy’s Caribbean Division (updated as of May 2021), regardless of management objective or level of protection or enforcement. For example, the Agoa Sanctuary is a marine managed area under French sovereignty declared in 2010, with the specific objective to improve the management and protection of marine mammals. Since this management declaration is across all French EEZ jurisdictions, the islands of Guadeloupe, Martinique, Saint Martin, and Saint Barthelemy have 100% management status of all benthic habitats. Similarly, the Caribbean Netherland islands of Saba and Bonaire’s Yarari Sanctuary is a marine mammal and shark sanctuary encompassing both EEZs. Additional research is needed to determine if this type of management objective has a positive influence on the health of coral reefs or seagrass beds. However, a large area of Saba’s waters is also managed within the Saba Bank, an Ecologically or Biologically Significant Area (EBSA) established in 2010, designed to protect biodiversity and limit shipping and anchoring. Saint Kitts and Nevis had a Marine Spatial Plan (MSP) declared in 2016 out to the 200 m depth contour [61], achieving management levels of coral at 96%, seagrass at 57%, and hardbottom at 57%. In March 2021, the Cayman Islands finalized an expanded marine protected area network that includes a no-take regulation for 50% of the shelf, boosting management levels to 65% coral, 43% seagrass, and 52% hardbottom. Other countries with notably high protection of coral, seagrass, and hardbottom include Sint Eustatius (89%; N/A; 84%), the U.S. Virgin Islands (66%; 75%; 52%), and the Dominican Republic (57%; 63%; 52%). Jurisdictions with high levels of coral and seagrass protection include Saint Vincent and the Grenadines (50%; 41%) and Antigua and Barbuda (48%; 66%), though they have lower protection of hardbottom. Jamaica and Haiti have high protection levels for seagrass (60% and 52%, respectively), but lower protection levels of coral and hardbottom.
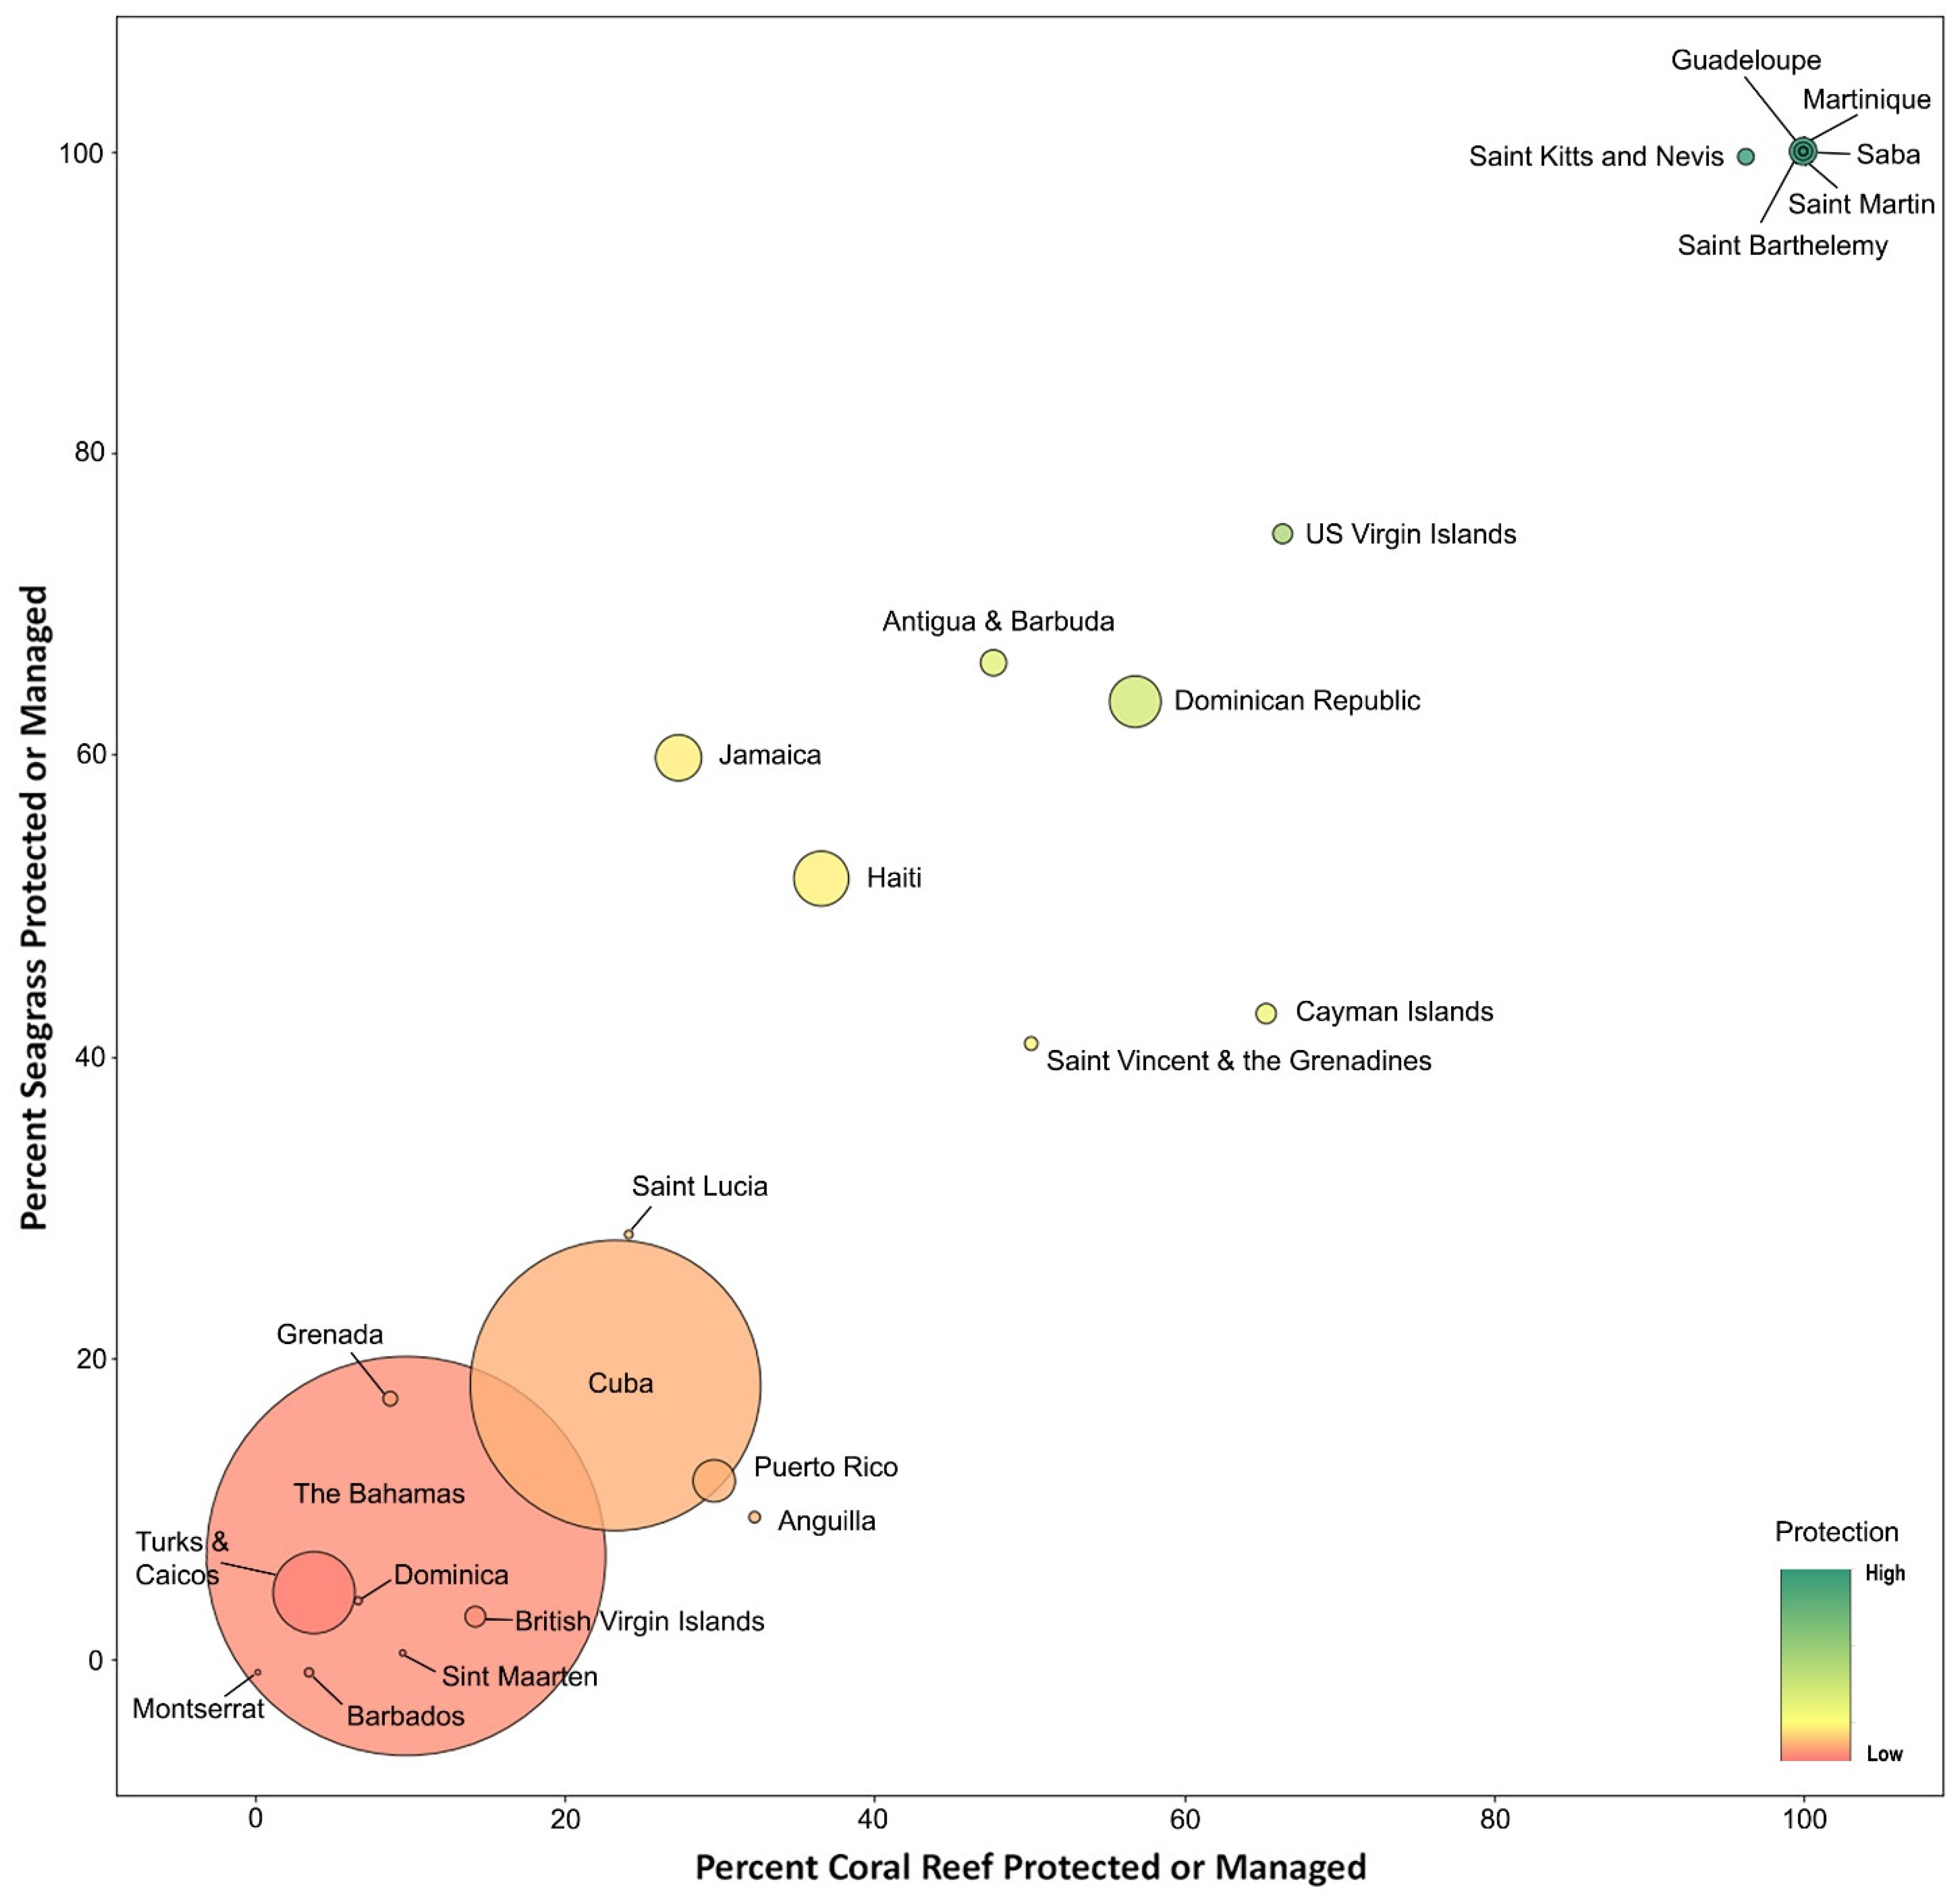
Figure 11 is a color-coded version that shows the percent of each benthic habitat class protected or managed by jurisdiction, and Figure 12 shows the percentage grouped by major benthic habitat class (coral reef, seagrass, and hardbottom). Figure 13 is a different way to visualize the data, showing the percent of seagrass protected against the percentage of reef protected per jurisdiction. The size of the circle is relative to the total area of seagrass and coral within each jurisdiction. Figure 14 shows the average percentage of coral reef and seagrass within the shallow zone (<30 m) under protection or management regardless of management objectives by jurisdiction. The shaded areas represent the Exclusive Economic Zone (EEZ), and percentages are calculated not on total marine space for each jurisdiction, but the total area of shallow coral reef and seagrass area within each jurisdiction’s declared protected or managed area boundaries.

3.1. Data Portal

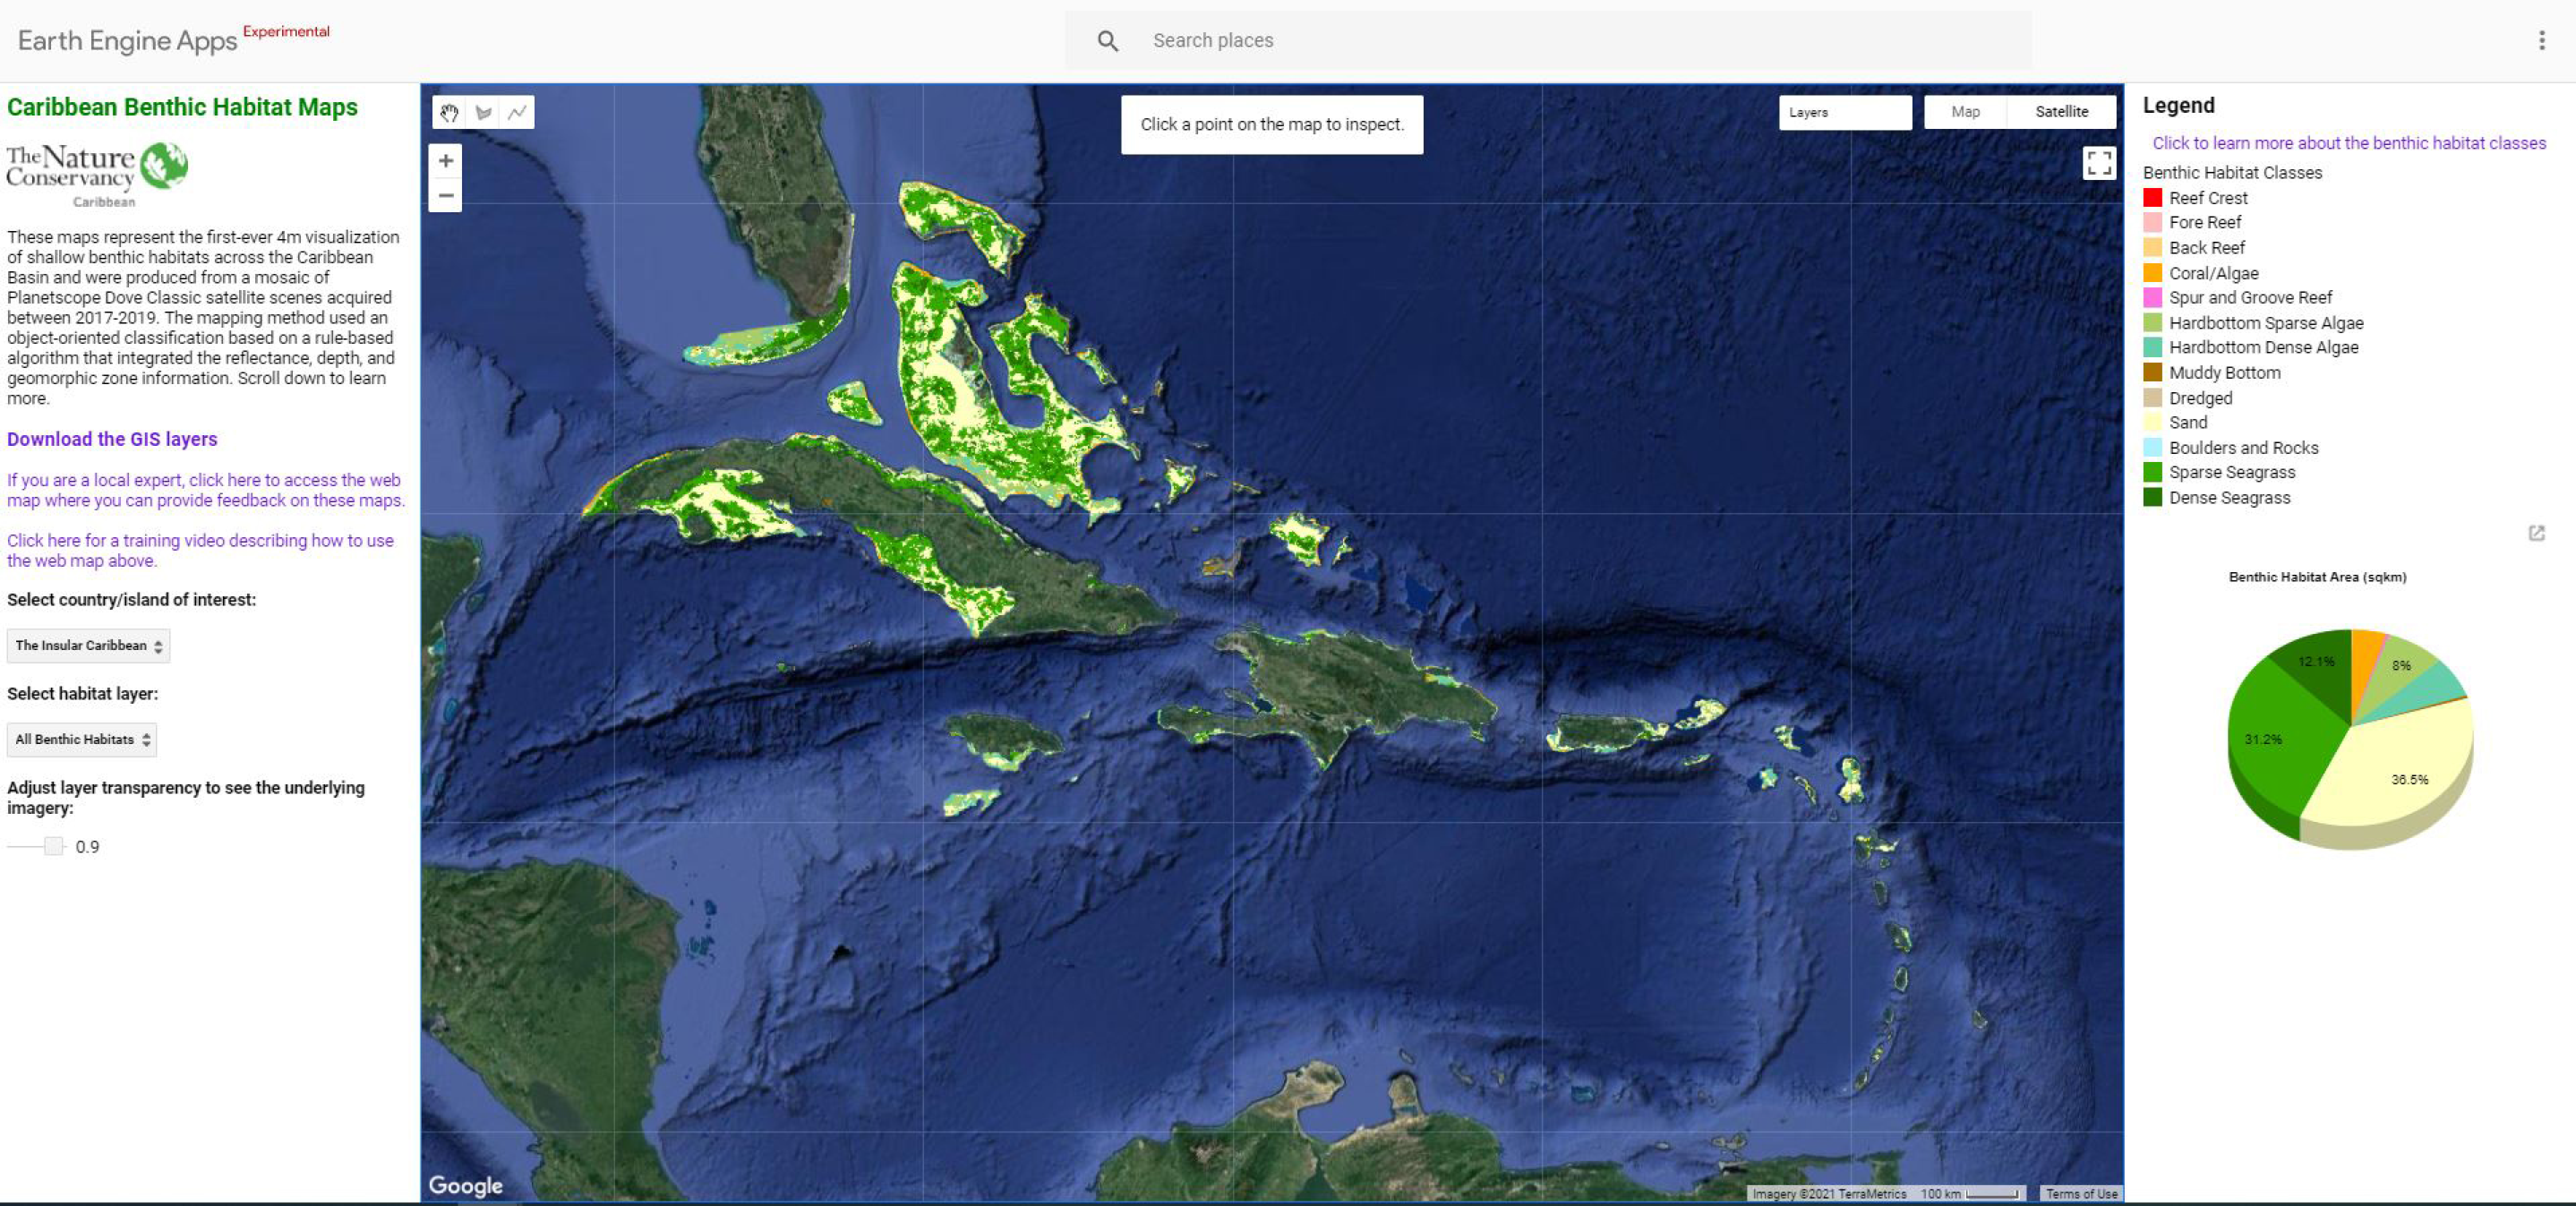
All regional datasets can be viewed and downloaded using a customized web application found at http://caribbeanmarinemaps.tnc.org/ (accessed on 19 October 2021; Figure 15). This Google Earth Engine app was developed as a tool for sharing the resulting map layers to non-technical stakeholders. Google Earth Engine (GEE) is an open-source remote sensing tool that provides free access to satellite imagery and analysis and allows geospatial developers to run complex geoprocessing and remote sensing functions [62]. GEE apps provide users with the ability to query, filter, visualize, and download datasets without technical expertise, software licenses, or extensive storage capacity. It also allows for exploration of habitat composition statistics developed from this map. For example, pie charts can be automatically generated that show the area totals for each benthic habitat class by selected geography. This app was embedded into the Caribbean Marine Maps site (CaribbeanMarineMaps.tnc.org, accessed on 19 October 2021), an ArcGIS Online StoryMap, that facilitates easy access to The Nature Conservancy’s suite of coral and marine data resources in the Caribbean. The site includes data visualization tools, access to data downloads, training videos, and scientific information explaining the development process and utility as well as limitations of various datasets.
Recognizing the need for additional refinement to the accuracy of these maps, an online tool was developed and can be accessed at the above site that permits expert feedback to be collected using both the ‘Public Data Collection’ feature in an ArcGIS Online web map and the Survey123 form. Experts can locate errors and suggested geolocated corrections to the habitat classes throughout the region. This feedback is critical to adjust and fine-tune the accuracy of the benthic habitat classes and is being shared with local experts, such as marine park managers, coral reef researchers, and divers, to collect iterative feedback on the accuracy of the map at specific locations. The collection of expert knowledge is an on-going effort, and all spatial feedback is compiled and used to manually adjust and improve future versions of the product. These datasets will also be used to train future benthic habitat class mapping algorithms.

3.2. Accuracy Assessment

An accuracy assessment was conducted on the thirteen-class benthic habitat product using 2686 field data points that were excluded from the training of the classification algorithm (Figure 16). These points were collected in the same manner, at a variety of locations between 2010–2017 based on interpretation of GPS-referenced underwater video transects. Each of these points were cross-walked to the regional benthic habitat classification scheme. Once cross-walked, these points represented 8 of the 13 classes, as coral subclasses (e.g., reef fore, reef crest, reef back, as well as spur and groove) could not be distinguished from video footage and were collapsed into the coral/algae class. Results yielded an overall accuracy of 72% with a standard error of 1.3%, yielding a 3% confidence interval of 69–75%. This overall accuracy is calculated as the stratified (area-weighted) percentage of correctly classified sites in each sample drawn from the classified map [63]. It is an estimate of the percent of the total mapped area that classified/mapped correctly based on the comparison of the final map with the field gathered reference data. Table 9 shows the error matrix of the accuracy assessment. Producer’s accuracy (errors of omission) and user’s accuracy (errors of commission) are calculated and reported for each class. Producer’s accuracy is a measure of how well real-world cover types can be classified. We calculated the area weighted proportion of correctly classified reference locations divided by the estimated proportion of area for the reference class (derived from the classification) and multiplied by 100 to express as a percent. User’s accuracy reflects the reliability of the classification to the user and is the more relevant measure of the classification’s actual utility in the field [64]. We calculated the area weighted proportion of correctly classified reference locations divided by the area weighted proportion of reference locations determined to be in each class, multiplied by 100.
Classes that exhibited the most confusion include sparse and dense seagrass as well as sparse and dense hardbottom algae. This confusion is not surprising as these classes can be very difficult to distinguish, particularly in deeper waters. Some classes, such as boulders and rocks, coral/algae, and muddy bottom, were accurately classified when considering a user’s accuracy (i.e., objects were assigned to the correct class); however, these same classes reported a lower producer’s accuracy (i.e., objects were left out of the class being evaluated). The large time range between when the field data was collected and changed in the benthic habitat composition could account for failure to observe and note differences in density between field data collection and satellite imaging. Another accuracy assessment was created after combining these pairs of classes, yielding six remaining classes. The estimate of the overall accuracy of this second assessment was 80% with a standard error of less than 1% yielding 2% confidence interval of 78–82%. The user’s and producer’s accuracy for this six-class accuracy assessment are reported in Table 10. Radoux and Bogaert [65] provided several best practices for OBIA accuracy assessments, which they argue can be more complex than pixel-based accuracy assessment and provides more information, such as area-dependent classification accuracy or class-specific boundary errors. They recommend serious consideration into (i) the type of sampling unit (pixel or polygon), (ii) the types of accuracy indices (count-based or area-based), and (iii) the relevance of geometric quality assessment.

4. Discussion

As increasing threats continue to degrade coastal habitats around the world, governments and conservationists greatly benefit from more accurate maps that can strategically guide decision making, such as adopting new policies, expanding protected areas, increasing resilience, and restoring habitats at broad scales [66]. For years, many countries and territories across the Caribbean have relied on coarser global-scale marine datasets to inform conservation and management decisions, which are often not appropriate for small-island scale planning. These regional-scale benthic maps fill a data void and provide the first seamless and consistently mapped high-resolution (4 m) spatial database of benthic habitats for the shallow waters of the Insular Caribbean, a place identified as a high global biodiversity area and priority for coral reef protection [67]. This baseline will be fundamental to shaping policies on the sustainable use and protection of these critical habitats, enabling resource managers to have a much-improved characterization and understanding of their marine resources.
When compared to existing global databases, these maps provide updated area numbers for each benthic habitat class. For example, current UNEP-WCMC Global Distribution of Coral Reefs (Version 4.1) [58,68] data estimate 7409 km2 of coral reef habitat throughout the Insular Caribbean compared to the 10,373 km2 total area calculated using the new regional maps (using a Lambert Azimuthal Equal Area projection). This represents a coral reef area difference of 2964 km2. The area discrepancies are variable by Exclusive Economic Zone (EEZ). The difference in area were not consistent between geographies. The PS image-derived maps estimate an additional 3637 km2 of coral reef area across the Bahama and the Turks and Caicos Banks and 546 km2 fewer coral reef area across the Greater Antilles (Cuba, Jamaica, Cayman Islands, Haiti, Dominican Republic, and Puerto Rico). Cuba had 467 km2 less coral reef area, 115 km2 less in the Cayman Islands, and 75 km2 less in Jamaica. When compared to the global datasets, the new maps estimate 11 km2 more coral reef area in the Dominican Republic, 12 km2 more in Haiti, and 111 km2 more in Puerto Rico. Within the Virgin Islands and Eastern Caribbean, the maps estimate 127 km2 less coral reef area. The global data appear to largely overestimate coral reef area within the Greater Antilles and Eastern Caribbean. This may be due to the coarse pixel size and aggregation of reef areas. Based on the accuracy assessment, the 4 m PS imagery performs better at capturing the intricate detail of the coral reef extent. Contrastingly, in the Bahamian Bank, much of the reef areas along the edges of the shelf and sloping deeper areas (20–30 m depth); additionally, the patch reefs within the interior of the shallow banks in The Bahamas are missing in the global reef datasets. The finer resolution of the PS imagery and classification RuleSet lends itself well to discriminating the smaller patch and narrow fringing reefs that are largely missed at the 30 m resolution. For a visual comparison, Figure 17 shows the coral reef extent using the current UNEP-WCMC Global Distribution of Coral Reefs (Version 4.1) (left side) and the PS image-derived coral reef maps (right side) for areas in Cuba, The Bahamas, and the Turks and Caicos Islands.
A primary application of these maps will be to inform regional habitat protection gaps and to ensure benthic habitat classes are adequately represented across the current and expanding Marine Protected Area (MPA) and Marine Managed Area (MMA) networks. These regional maps indicate that 5% of the Insular Caribbean’s shallow marine area is composed of coral reef, of which 20% of that area is within some form of marine protected or managed area boundary. In terms of seagrass beds, this habitat covers approximately 43% of the shallow marine area and has 13% inclusion within the current marine protected or managed area. Hardbottom covers 15% of the area mapped, with 22% protection. In terms of the Caribbean’s marine ecoregions [69]—Bahamian (The Bahamas and Turks and Caicos Islands), the Greater Antilles (Cuba, Cayman Islands, Dominican Republic, Haiti, Jamaica, and Puerto Rico), and the Eastern Caribbean (Virgin Islands through Grenada)—the Eastern Caribbean ecoregion has the highest levels of protection or management, with 41% of the shallow area protected, followed by the Greater Antilles ecoregion at 23% and the Bahamian ecoregion at 9%. More specifically, the Eastern Caribbean, Greater Antilles, and Bahamian ecoregions have protected 60%, 29%, and 9% of coral, 67%, 21%, and 8% of seagrass, and 41%, 29%, and 12% of hardbottom, respectively.
Work to expand marine protection and management is currently underway in many jurisdictions identified at low percentages. Designation of new proposed areas as described in the recent Bahamas Protected Plan [70] would advance The Bahamas to achieve protection of 24% coral, 19% seagrass, and 39% hardbottom habitats (current values are 10%, 8%, and 13%). The Bahamian marine ecoregion would reach protection of 30% coral, 21% seagrass, and 42% hardbottom. Within the Eastern Caribbean, Barbados, Dominica, Grenada, Montserrat, and Sint Maarten have low percentages of marine protected and managed areas. Barbados is currently engaged in a marine spatial planning (MSP) process that will identify and declare new MPAs across 30% of their territorial sea and EEZ. In 2015, Montserrat launched a Blue Halo Initiative as a partnership to develop and implement solutions for sustainable ocean management through marine spatial planning, fisheries management, and community stewardship [71]. Grenada has drafted management plans for all declared marine managed areas (MMAs) and is in the process of designating new MMAs. Other jurisdictions that would benefit from increased protection include British Virgin Islands and Turks and Caicos.
Recent conservation successes across the Caribbean include the Cayman Islands that finalized an expanded MPA network in March 2021 that includes a no-take regulation for 50% of the marine shelf. In 2010, Saint Kitts and Nevis completed an MSP, which was the basis for the creation of a 2-mile radius Saint Kitts and Nevis Marine Management Area (SKNMMA) that was declared in 2016, being the first Caribbean country to design a national MSP [61,72]. The management plan for SKNMMA has been drafted and the country is currently pilot testing management actions in a few zones. The island of Barbuda began a comprehensive Blue Halo Initiative marine spatial planning process in 2012 and regulations were adopted in 2014 [73]. A number of other Caribbean countries have engaged in the MSP process, such as Pedro Bank, Jamaica [74] and the Grenadine Islands [75]; however, adoption of recommendations or zoning plans is still pending. An MSP design conducted in Samaná Bay, Dominican Republic [76], in 2012 has resulted in the declaration of six fish reserve (no take zones) and mangrove restoration efforts. In 2008, the Caribbean Challenge Initiative was launched, an ambitious and multi-country effort to declare 20% protection of marine space by 2020 and implement sustainable financing for maintaining revenue streams to carry out management activities. There are currently eleven countries and territories that have made the commitment, including The Bahamas, British Virgin Islands, Dominican Republic, Grenada, Haiti, Jamaica, Puerto Rico, Saint Lucia, Saint Kitts and Nevis, and Saint Vincent and the Grenadines. To date, five of the eleven members have reached the 20% goal and the remaining members continue make progress. The current status of these protection goals can be explored at http://caribbeanchallenge.tnc.org (accessed on 19 October 2021).
While declaration of marine protected and managed areas is a critical first step, the actual management objective activities that are carried out and enforcement implemented within these areas is what promotes and fosters ecological health and resilience of these habitats. While many jurisdictions have MPA declarations, the reality is that management actions across many of these areas may not be directed at specific habitat protection or may be completely absent while stresses to these habitats continue unabated. The area calculations presented are based on all types of protected and managed areas across the Caribbean, regardless of management objectives, enforcement, or effectiveness of management practices implemented. For this reason, these reported levels of benthic habitat protection are likely an overestimate of actual management conditions with low levels of implementation. For example, EEZ-wide declarations on marine mammal and shark sanctuaries encompass very large areas to accounts for life-cycle requirements and transboundary issues; however, the sanctuary objectives are often not focused on the management and monitoring of marine habitats. Additionally, many MPA spatial boundaries are derived from lower resolution or older shoreline data, so these GIS boundaries may slightly impact calculated management percentages of shallow benthic habitats. Furthermore, many of these MPAs are ineffectively managed ‘paper parks’ [77], meaning that although they are legally established, they are not well enforced. In addition to continued MPA expansion in strategic areas, management effectiveness surveys on a regular basis are needed to accurately track protection, health status, and management levels of specific habitats. These surveys provide critical input on required resources and steps needed to improve management actions.
Despite these limitations, these recent and freely available datasets will catalyze more effective conservation actions and provide support to government decision makers seeking to embark on a variety of marine and coastal projects, including MSP and site prioritization for coral reef restoration and climate change adaptation projects that utilize nature-based solutions. These data serve to identify the extent and location of ecosystems that can be used in models to maximize climate resilience benefits. Benthic habitats, such as coral reefs, are highly important to local economies, and these data will facilitate more accurate ecosystem service models that highlight potential value and revenue attributed to these habitats in a spatial context. In addition, the new habitat baseline will provide an improved ability to monitor and evaluate management effectiveness and habitat degradation, as well as to detect and quantify habitat changes that can guide the management of habitat resiliency for recovery and rehabilitation efforts following natural disasters, such as storms and hurricanes. In addition to protection assessments, another important use is to help. Users who have already downloaded these data have indicated their intended use in a variety of applications including GIS trainings, printed atlas-style maps, environmental and climate change education, public engagement efforts, habitat area calculations, diver awareness, dive research planning, and navigation planning. Others have proposed more complex modeling applications, including blue carbon storage analyses, calibration and validation of global benthic habitat products, natural capital assessments, prioritization of climate-resilient reefs, coastal protection modeling, research on shark ecology and habitat uses, and identification of critical habitats, species distribution modeling, and connectivity assessments for fish and sea turtles. Finally, these data will facilitate management planning and produce more effect monitoring and evaluation frameworks through a variety of avenues including watershed management planning, conservation project plans, studies on the impacts of pollution on benthic habitats, environmental impact assessments for planned developments, national reef and sea surface temperature monitoring plans, development of humanitarian aid products, and national ecosystem assessments.
A critical part of data delivery is also ensuring easy access and building local technical capacity so conservation managers and practitioners can maximize full utility of the dataset. Trainings are being offered to instruct potential users in the methods used and understand data limitations. Furthermore, consultation meetings are being held with stakeholders and partners across the region to continue validating data and explore different ways in which these map products can potentially be used. Through specialized channels, such as the Reef Resilience Network (RRN), a global network of over 180,000 reef managers, an online course has been developed to train marine managers, conservation practitioners, scientists, and decision makers on how to utilize these mapping products as a toolkit for guiding marine conservation and management decisions. In an effort to improve these maps over time, local experts, partners, and stakeholders are being trained to use an accompanying ArcGIS Online web map (accessible at CaribbeanMarineMaps.tnc.org), in which errors can be identified and accuracy improved through local knowledge where field data do not exist. These corrections will be implemented on a regular basis, so the product will become a dynamic database that improves with each version. These data will also be housed in the Allen Coral Atlas (ACA) (https://allencoralatlas.org/, accessed on 19 October 2021), an online data portal that is working to map the world’s coral reefs. The ACA is also using PS imagery and is the first effort to provide a consistent automated approach to mapping coral reefs at the global scale. Considering automated global approaches have limitations at the local scale, the primary difference between the ACA global maps and these Caribbean regional maps is that a more manual approach was taken to fine-tune and adjust the automated output at the local scale based on the integration of expert knowledge and image interpretation.
The next decade of operational coastal mapping and monitoring will see improved image datasets (i.e., higher signal-to-noise ratios and more spectral bands in the visible wavelengths) and increased efficiencies [78]. The growing SuperDove constellation will provide access to higher and more stable radiometric quality imagery that will overcome the aforementioned technological limitations, providing progress towards a more accurate and near real-time monitoring system for inland/coastal waters. When cloud cover and sea state conditions permit, systems will be developed to enable rapid mapping of benthic changes on a daily to weekly basis. The improvement in fidelity and spectral sensitivity (eight multispectral bands) will enhance our ability to map and discriminate between features. With improved mapping ability, additional benthic habitat classes can be identified. For example, the coral/algae class can be further divided into different reef classes based on species composition, rugosity, or geomorphic zones (e.g., Acropora dominated reef crests, patch reef and fringing reef composition, gorgonian/Orbicella, and mixed assemblages). Distinction between reef types could guide and improve management decisions. Key challenges remain, including the development of more accurate satellite-derived bathymetry (SDB) models and the ability to sense at greater depths, dealing with turbid water, improving the accuracy of training and validation data integration, and making change detection systems more stable and accurate [22,27,33,36]. Techniques for mapping benthic habitats will also continue to improve with more powerful machine learning classifiers, such as Support Vector Machines and Convolution Neural Networks (CNN) [79,80]. Recent advances that will enhance benthic mapping in the future include the development of a spectral database for corals [20] and the deployment of large-scale operational mapping of live coral [66]. New products, such as Reef Cover, will improve our ability to more accurately represent benthic types, blending what can be mapped remotely with the geo-ecological understanding of reef formation, growth, and functioning [49]. Future methods will more readily integrate field data and real-time ocean conditions, which will increase accuracy and improve feature discrimination between different types (e.g., shallow coral reef, coral rubble cover, seagrass beds) and more reliable bathymetric estimates.

5. Conclusions

The rich and diverse marine ecosystems of the Caribbean unite the countries and cultures in a binding common link of dependence in both an economic and ecological perspective. While marine health has declined over the years from a variety of pressures, these maps serve as powerful tool for directing conservation and management actions more effectively. They are intended to inform a diverse array of conservation and policy decisions to protect and restore these essential benthic habitats that people depend on. Decision makers across the Caribbean region now have free access to these data, which provide a common baseline to identify optimal sites for coral restoration activities, guide the selection of climate change adaptation projects, prioritize the protection and restoration of ecosystem services, and determine the best locations for establishing marine protected areas that successfully balance protection and diverse uses. As future technologies unfold, such as the next generation SuperDove SmallSat constellation, new techniques will evolve that will continue to enhance our ability to monitor and measure environmental changes at far greater spatial and temporal resolutions. This will facilitate more effective and efficient adaptive management actions in a world where the threat of climate change continues to advance. In the meantime, these data will serve as a common database to foster communication and coordination for the protection and management of shallow benthic habitats across the Caribbean region.

Supplementary Materials

The following are available online at https://www.mdpi.com/article/10.3390/rs13214215/s1.

Author Contributions

Conceptualization, S.R.S., G.P.A. and F.J.P. Methodology, S.R.S., F.L., T.M., J.D.K., J.L., D.E.K. and V.P.M. Software, F.L. Validation, S.R.S., V.P.M., F.J.P. and X.E.-F. Formal Analysis, S.R.S., V.P.M. and G.T.R. Visualization V.P.M. and S.R.S. Writing—original draft preparation, S.R.S., V.P.M., F.L., T.M., J.D.K., J.L., F.J.P., X.E.-F. and G.T.R. Writing—review and editing, V.P.M., S.R.S. and X.E.-F. All authors have read and agreed to the published version of the manuscript.

Funding

This research was funded by Daniel C. Chung, The Kowalski Family Foundation, The Tiffany & Co. Foundation, The Community Foundation of the Virgin Islands, The J.A. Woollam Foundation, The John D. and Catherine T. MacArthur Foundation, and The Paul G. Allen Family Foundation.

Data Availability Statement

All datasets can be found at http://CaribbeanMarineMaps.tnc.org/ accessed on 19 October 2021.

Acknowledgments

We would like to acknowledge the support of Judy Lang, Patricia Kramer, Helen Fox; Elizabeth McLeod, Luis Solórzano, Lisa Price, Robyn McGuinness, Zach Horton, Giselle Hall, Montserrat Acosta-Morel, Aldo Croquer, and Robert Brumbaugh from The Nature Conservancy; Nick Vaughn and Paulina Gerstner from Arizona State University; Chris Roelfsema and Stuart Phinn from the University of Queensland; Kirk Larsen, Kyle Rice, and Charlie Whiton from Vulcan; and the mapping services of Deven Lilani and Ajay Parker from Toyo Computers, Ltd.

Conflicts of Interest

The authors declare no conflict of interest.

References

  1. Burke, L.; Reytar, K.; Spalding, M.; Perry, A. Reefs at Risk Revisited; World Resources Institute: Washington, DC, USA, 2011. [Google Scholar]
  2. Costanza, R.; Folke, C. Valuing ecosystem services with efficiency, fairness and sustainability as goals. In Nature’s Services: Societal Dependence on Natural Ecosystems; Daily, G.C., Ed.; Island Press: Washington, DC, USA, 1997; pp. 49–70. [Google Scholar]
  3. Hoegh-Guldberg, O.; Pendleton, L.; Kaup, A. People and the changing nature of coral reefs. Reg. Stud. Mar. Sci. 2019, 30, 100699. [Google Scholar] [CrossRef]
  4. U.S. Commission on Ocean Policy. An Ocean Blueprint for the 21st Century. U.S.; Commission on Ocean Policy: Washington, DC, USA, 2004. [Google Scholar]
  5. Spalding, M.; Burke, L.; Wood, S.A.; Ashpole, J.; Hutchison, J.; zu Ermgassen, P. Mapping the global value and distribution of coral reef tourism. Mar. Policy 2017, 82, 104–113. [Google Scholar] [CrossRef]
  6. Beck, M.W.; Losada, I.J.; Menéndez, P.; Reguero, B.; Díaz-Simal, P.; Fernández, F. The global flood protection savings provided by coral reefs. Nat. Commun. 2018, 9, 2186. [Google Scholar] [CrossRef] [Green Version]
  7. Ferrario, F.; Beck, M.W.; Storlazzi, C.D.; Micheli, F.; Shepard, C.C.; Airoldi, L. The effectiveness of coral reefs for coastal hazard risk reduction and adaptation. Nat. Commun. 2014, 5, 3794. [Google Scholar] [CrossRef] [PubMed]
  8. Campagne, C.S.; Salles, J.-M.; Boissery, P.; Deter, J. The seagrass Posidonia oceanica: Ecosystem services identification and economic evaluation of goods and benefits. Mar. Pollut. Bull. 2015, 97, 391–400. [Google Scholar] [CrossRef] [PubMed]
  9. Tuya, F.; Haroun, R.; Espino, F. Economic assessment of ecosystem services: Monetary value of seagrass meadows for coastal fisheries. Ocean Coast. Manag. 2014, 96, 181–187. [Google Scholar] [CrossRef]
  10. Dewsbury, B.M.; Bhat, M.; Fourqurean, J. A review of seagrass economic valuations: Gaps and progress in valuation approaches. Ecosyst. Serv. 2016, 18, 68–77. [Google Scholar] [CrossRef]
  11. Van Hooidonk, R.; Maynard, J.; Tamelander, J.; Gove, J.; Ahmadia, G.; Raymundo, L.; Williams, G.; Heron, S.; Planes, S. Local-scale projections of coral reef futures and implications of the Paris Agreement. Sci. Rep. 2016, 6, 39666. [Google Scholar] [CrossRef] [PubMed]
  12. Hughes, T.P.; Anderson, K.D.; Connolly, S.R.; Heron, S.F.; Kerry, J.T.; Lough, J.M.; Baird, A.H.; Baum, J.K.; Berumen, M.L.; Bridge, T.C.; et al. Spatial and temporal patterns of mass bleaching of corals in the Anthropocene. Science 2018, 359, 80–83. [Google Scholar] [CrossRef] [PubMed] [Green Version]
  13. Waycott, M.; Duarte, C.M.; Carruthers, T.J.B.; Orth, R.J.; Dennison, W.C.; Olyarnik, S.; Calladine, A.; Fourqurean, J.W.; Heck, K.L.; Hughes, A.R.; et al. Accelerating loss of seagrasses across the globe threatens coastal ecosystems. Proc. Natl. Acad. Sci. USA 2009, 106, 12377–12381. [Google Scholar] [CrossRef] [PubMed] [Green Version]
  14. Kennedy, E.; Perry, C.T.; Halloran, P.; Iglesias-Prieto, R.; Schönberg, C.H.L.; Wisshak, M.; Form, A.U.; Carricart-Ganivet, J.P.; Fine, M.; Eakin, C.M.; et al. Avoiding Coral Reef Functional Collapse Requires Local and Global Action. Curr. Biol. 2013, 23, 912–918. [Google Scholar] [CrossRef] [PubMed] [Green Version]
  15. Wear, S.L.; Thurber, R.V. Sewage pollution: Mitigation is key for coral reef stewardship. Ann. N. Y. Acad. Sci. 2015, 1355, 15–30. [Google Scholar] [CrossRef] [PubMed]
  16. Zaneveld, J.R.; Burkepile, D.E.; Shantz, A.; Pritchard, C.E.; McMinds, R.; Payet, J.P.; Welsh, R.; Correa, A.M.S.; Lemoine, N.P.; Rosales, S.; et al. Overfishing and nutrient pollution interact with temperature to disrupt coral reefs down to microbial scales. Nat. Commun. 2016, 7, 11833. [Google Scholar] [CrossRef] [PubMed]
  17. Grech, A.; Chartrand, K.; Erftemeijer, P.; Fonseca, M.; McKenzie, L.; Rasheed, M.; Taylor, H.; Coles, R. A comparison of threats, vulnerabilities and management approaches in global seagrass bioregions. Environ. Res. Lett. 2012, 7. [Google Scholar] [CrossRef]
  18. Woodhead, A.J.; Hicks, C.C.; Norström, A.V.; Williams, G.J.; Graham, N.A.J. Coral reef ecosystem services in the Anthropocene. Funct. Ecol. 2019. [Google Scholar] [CrossRef] [Green Version]
  19. Giakoumi, S.; Brown, C.; Katsanevakis, S.; Saunders, M.; Possingham, H. Using threat maps for cost-effective prioritization of actions to conserve coastal habitats. Mar. Policy 2015, 61, 95–102. [Google Scholar] [CrossRef] [Green Version]
  20. Foo, S.; Asner, G.P. Scaling Up Coral Reef Restoration Using Remote Sensing Technology. Front. Mar. Sci. 2019, 6. [Google Scholar] [CrossRef] [Green Version]
  21. Purkis, S.J. Remote Sensing Tropical Coral Reefs: The View from Above. Annu. Rev. Mar. Sci. 2018, 10, 149–168. [Google Scholar] [CrossRef] [PubMed]
  22. Lyons, M.B.; Roelfsema, C.M.; Kennedy, E.V.; Kovacs, E.M.; Borrego-Acevedo, R.; Markey, K.; Roe, M.; Yuwono, D.M.; Harris, D.L.; Phinn, S.R.; et al. Mapping the world’s coral reefs using a global multiscale earth observation framework. Remote Sens. Ecol. Conserv. 2020, 6, 557–568. [Google Scholar] [CrossRef] [Green Version]
  23. Prampolini, M.; Angeletti, L.; Castellan, G.; Grande, V.; Le Bas, T.; Taviani, M.; Foglini, F. Benthic Habitat Map of the Southern Adriatic Sea (Mediterranean Sea) from Object-Based Image Analysis of Multi-Source Acoustic Backscatter Data. Remote Sens. 2021, 13, 2913. [Google Scholar] [CrossRef]
  24. Rende, S.F.; Bosman, A.; Di Mento, R.; Bruno, F.; Lagudi, A.; Irving, A.D.; Dattola, L.; Giambattista, L.D.; Lanera, P.; Proietti, R.; et al. Ultra-High-Resolution Mapping of Posidonia oceanica (L.) Delile Meadows through Acoustic, Optical Data and Object-based Image Classification. J. Mar. Sci. Eng. 2020, 8, 647. [Google Scholar] [CrossRef]
  25. Janowski, L.; Madricardo, F.; Fogarin, S.; Kruss, A.; Molinaroli, E.; Kubowicz-Grajewska, A.; Tegowski, J. Spatial and Temporal Changes of Tidal Inlet Using Object-Based Image Analysis of Multibeam Echosounder Measurements: A Case from the Lagoon of Venice, Italy. Remote Sens. 2020, 12, 2117. [Google Scholar] [CrossRef]
  26. Kutser, T.; Hedley, J.; Giardino, C.; Roelfsema, C.; Brando, V.E. Remote sensing of shallow waters—A 50 year retrospective and future directions. Remote Sens. Environ. 2020, 240, 111619. [Google Scholar] [CrossRef]
  27. Li, J.; Knapp, D.E.; Fabina, N.S.; Kennedy, E.V.; Larsen, K.; Lyons, M.B.; Murray, N.J.; Phinn, S.R.; Roelfsema, C.M.; Asner, G.P. A global coral reef probability map generated using convolutional neural networks. Coral Reefs 2020, 39, 1805–1815. [Google Scholar] [CrossRef]
  28. Roelfsema, C.; Kovacs, E.; Ortiz, J.C.; Wolff, N.H.; Callaghan, D.; Wettle, M.; Ronan, M.; Hamylton, S.M.; Mumby, P.J.; Phinn, S. Coral reef habitat mapping: A combination of object-based image analysis and eco-logical modelling. Remote Sens. Environ. 2018, 208, 27–41. [Google Scholar] [CrossRef]
  29. Roelfsema, C.; Kovacs, E.; Roos, P.; Terzano, D.; Lyons, M.; Phinn, S. Use of a semi-automated object-based analysis to map benthic composition, Heron Reef, Southern Great Barrier Reef. Remote Sens. Lett. 2018, 9, 324–333. [Google Scholar] [CrossRef]
  30. Li, J.; Schill, S.R.; Knapp, D.E.; Asner, G.P. Object-Based Mapping of Coral Reef Habitats Using Planet Dove Satellites. Remote Sens. 2019, 11, 1445. [Google Scholar] [CrossRef] [Green Version]
  31. Purkis, S.J. Remote sensing coral reefs. In Encyclopedia of Ocean Sciences; Elsevier: Amsterdam, The Netherlands, 2019; pp. 389–396. [Google Scholar]
  32. Planet Labs. Available online: https://www.planet.com/products/satellite-imagery/files/Planet_Combined_Imagery_Product_Specs_December2017.pdf (accessed on 7 May 2021).
  33. Poursanidis, D.; Traganos, D.; Chrysoulakis, N.; Reinartz, P. Cubesats Allow High Spatiotemporal Estimates of Satellite-Derived Bathymetry. Remote Sens. 2019, 11, 1299. [Google Scholar] [CrossRef] [Green Version]
  34. Wicaksono, P.; Lazuardi, W. Assessment of PlanetScope images for benthic habitat and seagrass species mapping in a complex optically shallow water environment. Int. J. Remote Sens. 2018, 39, 5739–5765. [Google Scholar] [CrossRef]
  35. Asner, G.P.; Martin, R.E.; Mascaro, J. Coral reef atoll assessment in the South China Sea using Planet Dove satellites. Remote Sens. Ecol. Conserv. 2017, 3, 57–65. [Google Scholar] [CrossRef]
  36. Li, J.; Knapp, D.E.; Schill, S.R.; Roelfsema, C.; Phinn, S.; Silman, M.; Mascaro, J.; Asner, G.P. Adaptive bathymetry estimation for shallow coastal waters using Planet Dove satellites. Remote Sens. Environ. 2019, 232. [Google Scholar] [CrossRef]
  37. Vanhellemont, Q. Daily metre-scale mapping of water turbidity using CubeSat imagery. Opt. Express 2019, 27, A1372–A1399. [Google Scholar] [CrossRef] [PubMed]
  38. Cihlar, J.; Manak, D.; D’Iorio, M. Evaluation of compositing algorithms for AVHRR data over land. IEEE Trans. Geosci. Remote Sens. 1994, 32, 427–437. [Google Scholar] [CrossRef]
  39. Planet Surface Reflectance Version 2.0. Available online: https://assets.planet.com/marketing/PDF/Planet_Surface_Reflectance_Technical_White_Paper.pdf (accessed on 7 May 2021).
  40. Teillet, P.; Fedosejevs, G.; Thome, K.; Barker, J.L. Impacts of spectral band difference effects on radiometric cross-calibration between satellite sensors in the solar-reflective spectral domain. Remote Sens. Environ. 2007, 110, 393–409. [Google Scholar] [CrossRef]
  41. Vermote, E. MOD09A1 MODIS/Terra Surface Reflectance 8-Day L3 Global 500 m SIN Grid V006. 2015, Distributed by NASA EOSDIS Land Processes DAAC. Available online: https://doi.org/10.5067/MODIS/MOD09A1.006 (accessed on 19 October 2021).
  42. Vermote, E.; Justice, C.; Claverie, M.; Franch, B. Preliminary analysis of the performance of the Landsat 8/OLI land surface reflectance product. Remote Sens. Environ. 2016, 185, 46–56. [Google Scholar] [CrossRef]
  43. Kington IV, J.D.; Jordahl, K.A.; Kanwar, A.N.; Kapadia, A.; Schönert, M.; Wurster, K. Spatially and Temporally Consistent Smallsat-Derived Basemaps for Analytic Applications. In AGU Fall Meeting Abstracts 2019; Volume 2019, pp. IN13B-0716. Available online: https://hello.planet.com/data/s/MeXxDJfkgMciEEn (accessed on 19 October 2021).
  44. Kazhdan, M.; Bolitho, M.; Hoppe, H. Poisson surface reconstruction. In Proceedings of the Fourth Eurographics Symposium on Geometry Processing (SGP’06) 2006, Eurographics Association, Aire-la-Ville, Switzerland, 26–28 June 2006; pp. 61–70, ISBN 3-905673-36-3. [Google Scholar]
  45. Gao, B.-C. NDWI—A normalized difference water index for remote sensing of vegetation liquid water from space. Remote Sens. Environ. 1996, 58, 257–266. [Google Scholar] [CrossRef]
  46. Thompson, D.R.; Hochberg, E.; Asner, G.P.; Green, R.O.; Knapp, D.E.; Gao, B.-C.; Garcia, R.; Gierach, M.; Lee, Z.; Maritorena, S.; et al. Airborne mapping of benthic reflectance spectra with Bayesian linear mixtures. Remote Sens. Environ. 2017, 200, 18–30. [Google Scholar] [CrossRef]
  47. Li, J.; Fabina, N.S.; Knapp, D.E.; Asner, G.P. The Sensitivity of Multi-spectral Satellite Sensors to Benthic Habitat Change. Remote Sens. 2020, 12, 532. [Google Scholar] [CrossRef] [Green Version]
  48. Phinn, S.R.; Roelfsema, C.; Mumby, P. Multi-scale, object-based image analysis for mapping geomorphic and ecological zones on coral reefs. Int. J. Remote Sens. 2011, 33, 3768–3797. [Google Scholar] [CrossRef]
  49. Kennedy, E.V.; Roelfsema, C.; Lyons, M.; Kovacs, E.; Borrego-Acevedo, R.; Roe, M.; Phinn, S.; Larsen, K.; Murray, N.; Yuwono, D.; et al. Reef Cover: A coral reef classification for global habitat mapping from biophysical remote sensing. bioRxiv 2020. [Google Scholar] [CrossRef]
  50. Strong, J.A.; Clements, A.; Lillis, H.; Galparsoro, I.; Bildstein, T.; Pesch, R. A review of the influence of marine habitat classification schemes on mapping studies: Inherent assumptions, influence on end products, and suggestions for future developments. ICES J. Mar. Sci. 2018, 76, 10–22. [Google Scholar] [CrossRef] [Green Version]
  51. Nagel, G.W.; Novo, E.M.L.D.M.; Kampel, M. Nanosatellites applied to optical Earth observation: A review. Ambient. Agua—Interdiscip. J. Appl. Sci. 2020, 15. [Google Scholar] [CrossRef]
  52. eCognition. Available online: www.ecognition.com (accessed on 20 August 2020).
  53. Baatz, M. Multi resolution segmentation: An optimum approach for high quality multi scale image segmentation. In Proceedings of the Beutrage zum AGIT-Symposium, Salzburg, Heidelberg, 2000; pp. 12–23. [Google Scholar]
  54. Blaschke, T. Object based image analysis for remote sensing. ISPRS J. Photogramm. Remote Sens. 2010, 65, 2–16. [Google Scholar] [CrossRef] [Green Version]
  55. Tiede, D. A new geospatial overlay method for the analysis and visualization of spatial change patterns using object-oriented data modeling concepts. Cartogr. Geogr. Inf. Sci. 2014, 41, 227–234. [Google Scholar] [CrossRef] [PubMed]
  56. Ye, S.; Pontius, R.G., Jr.; Rakshit, R. A review of accuracy assessment for object-based image analysis: From per-pixel to per-polygon approaches. ISPRS J. Photogramm. Remote Sens. 2018, 141, 137–147. [Google Scholar] [CrossRef]
  57. Andrefouet, S.; Muller-Karger, F.E.; Robinson, J.A.; Kranenburg, C.J.; Torres-Pulliza, D.; Spraggins, S.A.; Murch, B. Global assessment of modern coral reef extent and diversity for regional science and management applications: A view from space. Proc. 10th Int. Coral Reef Symp. 2006, 2, 1732–1745. [Google Scholar]
  58. IMaRS-USF, IRD (Institut de Recherche pour le Developpement). Millennium Coral Reef Mapping Project. Validated Maps; UNEP World Conservation Monitoring Centre: Cambridge, UK, 2005. [Google Scholar]
  59. Spalding, M.D.; Ravilious, C.; Green, E.P. World Atlas of Coral Reefs; The University of California Press: Berkeley, CA, USA, 2001; 436p. [Google Scholar]
  60. Flanders Marine Institute. Polygons Representing Maritime Boundaries of Exclusive Economic Zones. Available online: http://www.marineregions.org (accessed on 1 September 2018).
  61. Agostini, V.N.; Margles, S.W.; Knowles, J.K.; Schill, S.R.; Bovino, R.J.; Blyther, R.J. Marine zoning in St. Kitts and Nevis: A design for sustainable management in the Caribbean. Ocean Coast. Manag. 2015, 104, 1–10. [Google Scholar] [CrossRef]
  62. Gorelick, N.; Hancher, M.; Dixon, M.; Ilyushchenko, S.; Thau, D.; Moore, R. Google Earth Engine: Planetary-scale geospatial analysis for everyone. Remote Sens. Environ. 2017, 202, 18–27. [Google Scholar] [CrossRef]
  63. Stehman, S.V.; Foody, G.M. Key issues in rigorous accuracy assessment of land cover products. Remote Sens. Environ. 2019, 231, 111199. [Google Scholar] [CrossRef]
  64. Rwanga, S.S.; Ndambuki, J.M. Accuracy Assessment of Land Use/Land Cover Classification Using Remote Sensing and GIS. Int. J. Geosci. 2017, 08, 611–622. [Google Scholar] [CrossRef] [Green Version]
  65. Radoux, J.; Bogaert, P. Good Practices for Object-Based Accuracy Assessment. Remote Sens. 2017, 9, 646. [Google Scholar] [CrossRef] [Green Version]
  66. Asner, G.P.; Vaughn, N.R.; Heckler, J.; Knapp, D.E.; Balzotti, C.; Shafron, E.; Martin, R.E.; Neilson, B.J.; Gove, J.M. Large-scale mapping of live corals to guide reef conservation. Proc. Natl. Acad. Sci. USA 2020, 117, 33711–33718. [Google Scholar] [CrossRef] [PubMed]
  67. Beyer, H.L.; Kennedy, E.V.; Beger, M.; Chen, C.A.; Cinner, J.E.; Darling, E.S.; Eakin, C.M.; Gates, R.D.; Heron, S.F.; Knowlton, N.; et al. Risk-sensitive planning for conserving coral reefs under rapid climate change. Conserv. Lett. 2018, 11, e12587. [Google Scholar] [CrossRef]
  68. UNEP-WCMC, WorldFish Centre, WRI, TNC. Global Distribution of Warm-Water Coral Reefs, Compiled from Multiple Sources Including the Millennium Coral Reef Mapping Project. Version 4.0. Includes Contributions from IMaRS-USF and IRD (2005), IMaRS-USF (2005) and Spalding et al. 2001. UN Environment World Conservation Monitoring Centre: Cambridge, UK. 2018. Available online: http://data.unep-wcmc.org/datasets/1 (accessed on 7 May 2021).
  69. Spalding, M.D.; Fox, H.; Allen, G.R.; Davidson, N.; Ferdaña, Z.A.; Finlayson, C.; Halpern, B.S.; Jorge, M.A.; Lombana, A.; Lourie, S.A.; et al. Marine Ecoregions of the World: A Bioregionalization of Coastal and Shelf Areas. BioScience 2007, 57, 573–583. [Google Scholar] [CrossRef] [Green Version]
  70. Anderson, L.; Dahlgren, C.; Knowles, L.; Jupp, L.; Cant-Woodside, S.; Albury-Smith, S.; McKinney-Lambert, C.; Lundy, A. Bahamas Protected Marine Protection Plan for Expanding the Bahamas Marine Protected Areas Network to Meet the Bahamas 2020 Declaration; Bahamas National Trust, Perry Institute for Marine Science, The Nature Conservancy, Bahamas Reef Environmental Educational Foundation: Nassau, Bahamas, 2018; Available online: https://bahamasprotected.com/wp-content/uploads/2018/02/Bahamas-Protected-Marine-Protection-Plan-Exec.-Summary.pdf (accessed on 7 May 2021).
  71. Flower, J.; Ramdeen, R.; Estep, A.; Thomas, L.R.; Francis, S.; Goldberg, G.; Johnson, A.E.; McClintock, W.; Mendes, S.R.; Mengerink, K.; et al. Marine spatial planning on the Caribbean island of Montserrat: Lessons for data-limited small islands. Conserv. Sci. Pract. 2020, 2. [Google Scholar] [CrossRef]
  72. Government of Saint Kitts and Nevis. National Maritime Policy and Action Plan. Ministry of Tourism and International Transport. 2015. Available online: https://chm.cbd.int/api/v2013/documents/C0A7116F-F642-2089-08C4-81605C16F1BC/attachments/SKN%20MARITIME%20POLICY%202015.pdf (accessed on 21 May 2021).
  73. Johnson, A.E.; McClintock, W.; Burton, O.; Burton, W.; Estep, A.; Mengerink, K.; Porter, R.; Tate, S. Marine spatial planning in Barbuda: A social, ecological, geographic, and legal case study. Mar. Policy 2019, 113, 103793. [Google Scholar] [CrossRef]
  74. Baldwin, K.; Schill, S.; Zenny, N.; Blake, D. Developing ecosystem-based information for marine spatial planning on the Pedro Bank, Jamaica. In Proceedings of the 67th Gulf and Caribbean Fisheries Institute, Bridgetown, Barbados, 3–7 November 2014; pp. 3–7. [Google Scholar]
  75. SusGren. Developing a Framework for a Comprehensive Marine Multiuse Zoning Plan for the Grenadine Islands. Clifton, Union Island, St. Vincent and the Grenadines. Sustainable Grenadines. 2012. Available online: https://www.ncei.noaa.gov/data/oceans/coris/library/NOAA/CRCP/other/grants/International_FY10_Products/NA10NOS4630054_Multi-use_Zoning_Plan.pdf (accessed on 19 October 2021).
  76. Romero, T.D.; Tejo, E.D.; Schill, S.R. Zonificación Basada en Ecosistemas en la Bahía de Samaná, República Dominicana. In Proceedings of the 65th Gulf and Caribbean Fisheries Institute, Santa Marta, Colombia, 5–9 November 2012; pp. 128–135. [Google Scholar]
  77. Bustamante, G.; Canals, P.; Di Carlo, G.; Gomei, M.; Romani, M.; Souan, H.; Vanzella-Khouri, A. Marine protected areas management in the Caribbean and Mediterranean seas: Making them more than paper parks. Aquat. Conserv. Mar. Freshw. Ecosyst. 2014, 24, 153–165. [Google Scholar] [CrossRef]
  78. Niroumand-Jadidi, M.; Bovolo, F.; Bruzzone, L.; Gege, P. Physics-based Bathymetry and Water Quality Retrieval Using PlanetScope Imagery: Impacts of 2020 COVID-19 Lockdown and 2019 Extreme Flood in the Venice Lagoon. Remote Sens. 2020, 12, 2381. [Google Scholar] [CrossRef]
  79. Mohamed, H.; Nadaoka, K.; Nakamura, T. Semiautomated Mapping of Benthic Habitats and Seagrass Species Using a Convolutional Neural Network Framework in Shallow Water Environments. Remote Sens. 2020, 12, 4002. [Google Scholar] [CrossRef]
  80. Traganos, D.; Aggarwal, B.; Poursanidis, D.; Topouzelis, K.; Chrysoulakis, N.; Reinartz, P. Towards Global-Scale Seagrass Mapping and Monitoring Using Sentinel-2 on Google Earth Engine: The Case Study of the Aegean and Ionian Seas. Remote Sens. 2018, 10, 1227. [Google Scholar] [CrossRef] [Green Version]
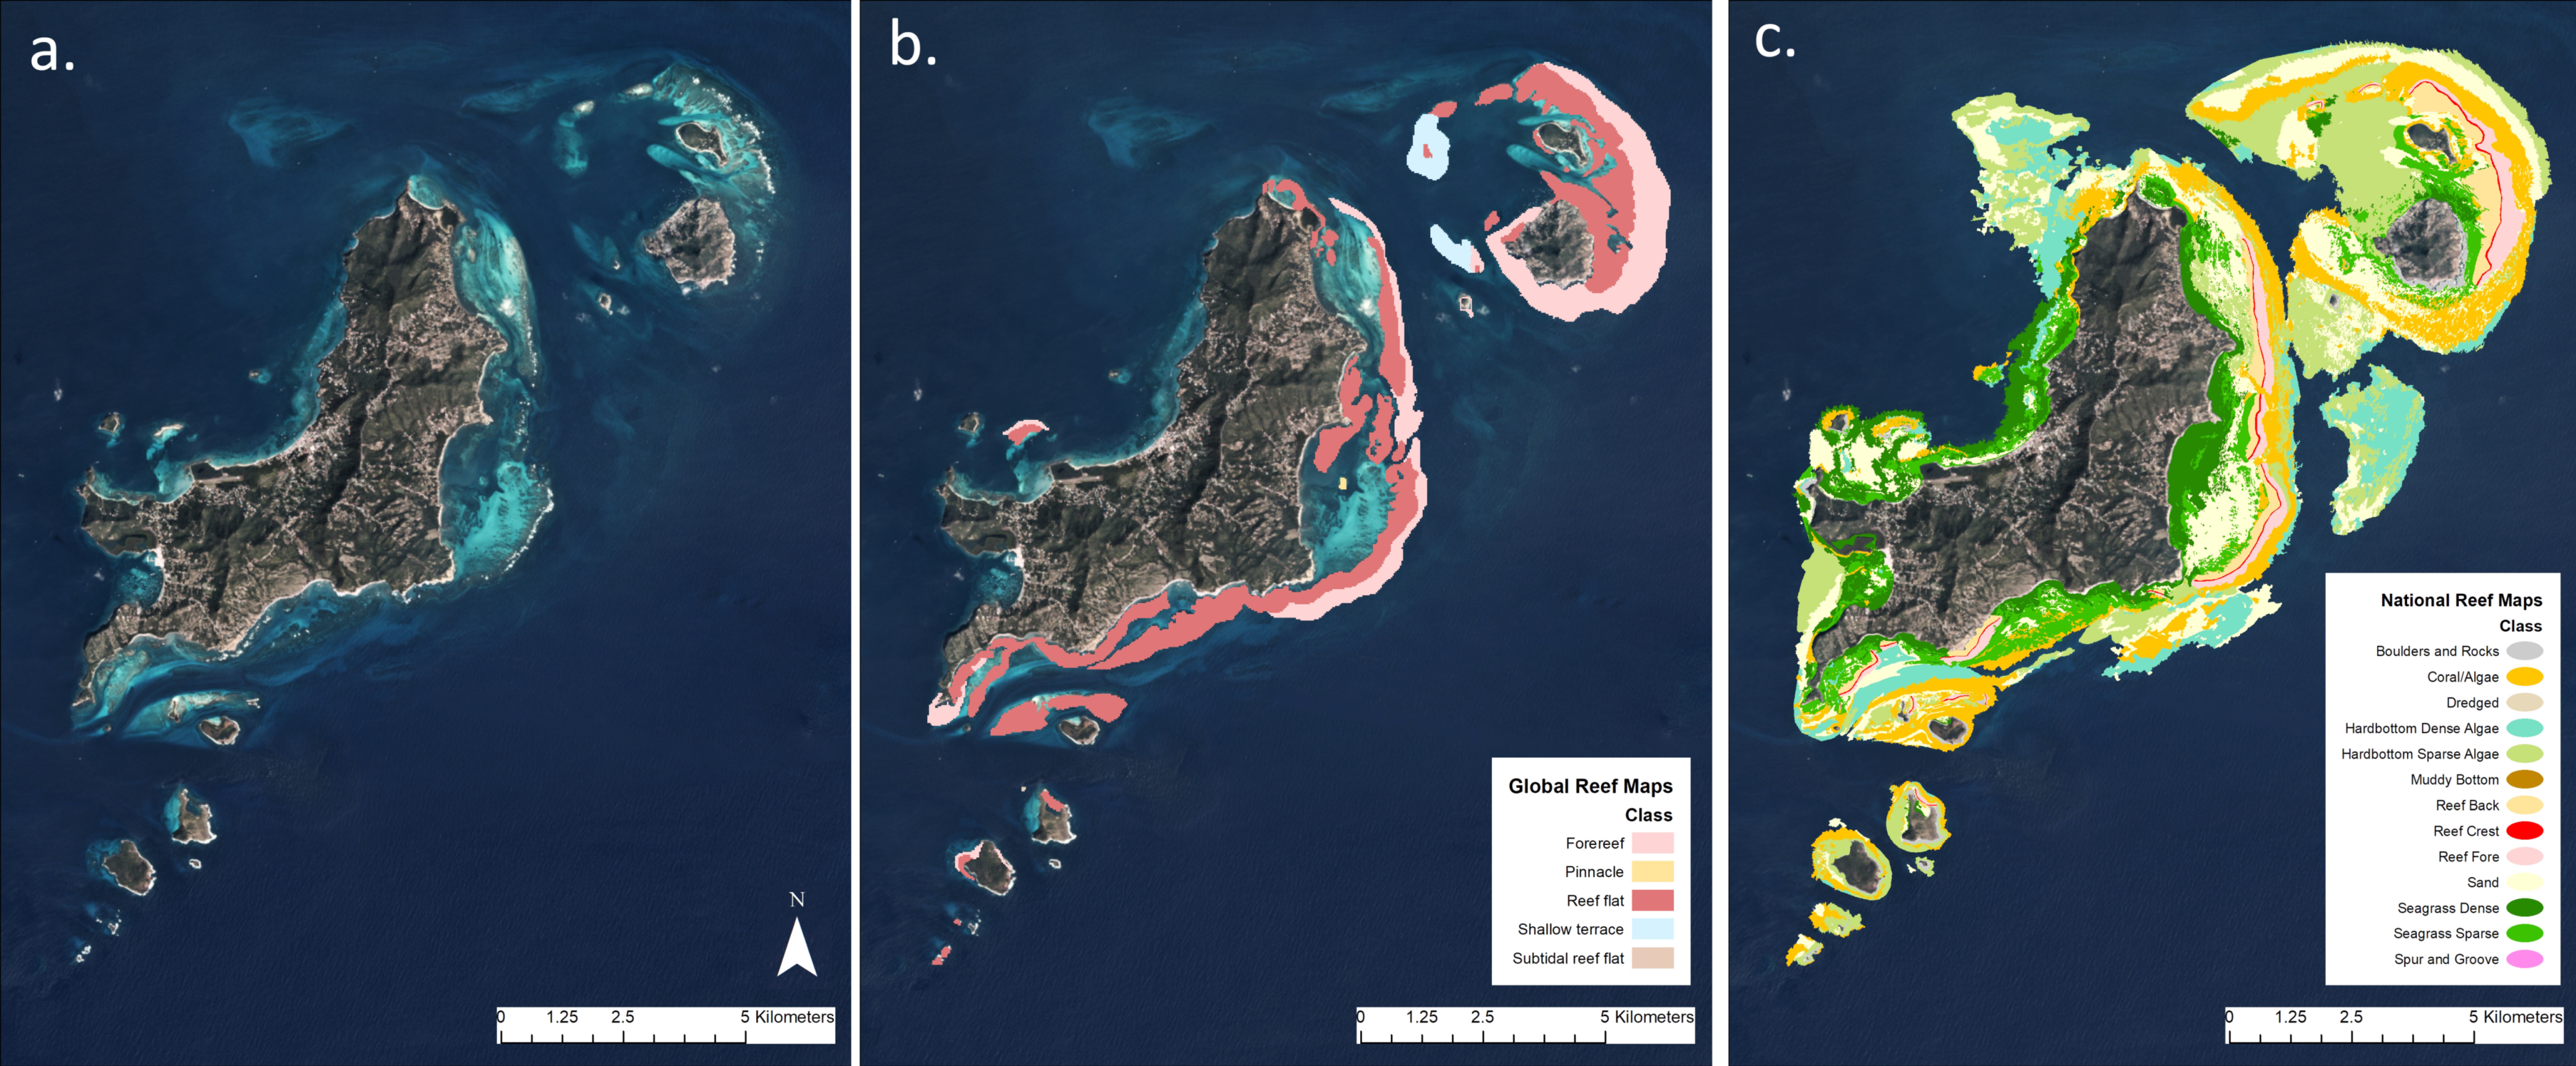
Figure 1. Comparison of multiple scale benthic habitat data around the island of Carriacou, Grenada: (a) PlanetScope Dove Classic imagery (4 m); (b) Global-scale Landsat-derived (30 m) five-class coral reef map; (c) National-scale PlanetScope-derived (4 m) thirteen-class benthic habitat map.
Remotesensing 13 04215 g001
Figure 2. Relative Spectral Response (RSR) of the PlanetScope (PS) Dove four multispectral bands (adapted from [37]).
Remotesensing 13 04215 g002
Figure 3. Example of corrections applied during image compositing in Île-à-Vache, Haiti: (a) Input surface reflectance data based on best quality scenes; (b) Normalization applied using MODIS reference data in addition to the physics-based atmospheric correction approach used in the PS surface reflectance scene product; (c) Seamline removal via a surface reconstruction method that smoothly shifts values near scene edges to match values at the boundary between scenes; (d) Manual quality control where the hand selection of scenes significantly reduced turbidity in near-coastal waters in the final composite.
Remotesensing 13 04215 g003
Figure 4. Final shallow area (<30 m depth) seamless, non-cloudy, four-band image composite of 38,642 PS Dove scenes for the Caribbean Basin that were acquired between 1 October 2017 and 15 September 2019 and normalized using a MODIS color target with seamlines removed.
Remotesensing 13 04215 g004
Figure 5. Example of manually digitized geomorphic zones based on image interpretation of PS imagery in East end, Grand Cayman: (a) PlanetScope Dove imagery surface reflectance; (b) derived geomorphic zones showing the shallow lagoon separated from the deeper shelf by the reef crest formation with the back (inner) and fore (outer) reefs.
Remotesensing 13 04215 g005
Figure 6. A total of 1653 GPS-referenced field data points representing locations of underwater video transects were used to train the algorithm within (a) eastern Dominican Republic (281 points); and (b) Saint Croix, USVI (1372 points).
Remotesensing 13 04215 g006
Figure 7. (a) True color surface reflectance image composite of Turks and Caicos Islands. Red rectangle shows the location of Grace Bay in Figure 3d; (b) masking of land, shallow (<30 m), and deep ocean (>30 m) areas using the geomorphic zone polygons; (c) Shallow bathymetry model (<20 m depth) based on PS surface reflectance; (d) Detailed view of the depth classification using 1-m increments for depths between 0–10 m and 2-m increments for areas >10 m depth, highlighting the shallow lagoons, reef crest, and steep slope beyond the fore reef leading to the deep ocean.
Remotesensing 13 04215 g007
Figure 8. The eCognition classification workflow that integrates RGB spectral data, bathymetry, and geomorphic zone vector data. This method employs two parallel tracks for mapping areas with and without bathymetric data.
Remotesensing 13 04215 g008
Figure 9. Mapping of the reef crest and back and fore reefs: (a) PS imagery showing the lagoon area and reef crest separating the deep ocean boundary; (b) Polygon boundary of the geomorphic zone overlaid onto the imagery that identifies the reef crest area and is used in the parental guidance technique to refine the reef type boundaries; (c) Classification of reef crest (red), fore reef (brown), and back reef (orange) using the parental guidance approach; (d) Comparison to the polygon boundary differences indicating the improvement of reef type mapping using the parental guidance technique. Yellow circles highlight areas where the back reef has expanded and where sandy areas have contracted.
Remotesensing 13 04215 g009
Figure 10. (a) An example area of the final PS image-derived benthic habitat classification for the Turks and Caicos Islands; (b) Zoomed-in area on the west side of Grace Bay in the northwest corner of Caicos Island showing the detail of the PS imagery; (c) Subsequent benthic habitat classification of the same area.
Remotesensing 13 04215 g010
Figure 11. Percentage of benthic habitat class protected or managed by jurisdiction, based on The Nature Conservancy’s declared Caribbean marine protected or managed area database.
Remotesensing 13 04215 g011
Figure 12. Percentage of major benthic habitat class (coral reef, seagrass, hardbottom) protected or managed by jurisdiction, based on The Nature Conservancy’s declared Caribbean marine protected or managed area database.
Remotesensing 13 04215 g012
Figure 13. Percentage of seagrass protected against the percentage of coral reef protected per jurisdiction, based on The Nature Conservancy’s Caribbean’s declared marine protected or managed area database. The size of the circle is relative to the total area of seagrass and coral reef habitat within each jurisdiction (i.e., Exclusive Economic Zone (EEZ)). The French jurisdictions of Guadeloupe, Martinique, Saint Martin, and Saint Barthelemy all maintain 100% protection because the entire EEZ is declared as a marine mammal sanctuary.
Remotesensing 13 04215 g013
Figure 14. Percentage of coral reef and seagrass within the shallow zone (<30 m) under protection or management regardless of management objectives by jurisdiction. The shaded areas represent the Exclusive Economic Zone (EEZ), and percentages are calculated not on total marine space for each jurisdiction, but the total area of shallow coral reef and seagrass area within each jurisdiction’s declared protected or managed area boundaries.
Remotesensing 13 04215 g014
Figure 15. Final classification for 203,676 km2 of shallow benthic habitat across the Insular Caribbean. These data are hosted at an online data portal found at CaribbeanMarineMaps.tnc.org (accessed on 19 October 2021), where data can be viewed and downloaded for advancing conservation actions throughout the Caribbean.
Remotesensing 13 04215 g015
Figure 16. A total of 2686 GPS-referenced field data points collected between 2010–2017, representing locations of underwater video transects, were excluded from the training of the classification algorithm and cross-walked to the regional benthic habitat classification scheme for use in the accuracy assessment.
Remotesensing 13 04215 g016
Figure 17. Comparison of mapped coral reef extent using the current UNEP-WCMC Global Distribution of Coral Reefs (Version 4.1) data (left side) and the PS-derived coral reef maps for three areas in (a) Cuba; (b) The Bahamas; and (c) Turks and Caicos Islands. Reef area in Cuba is overrepresented in the global maps and underrepresented in The Bahamas and Turks and Caicos.
Remotesensing 13 04215 g017
Table 1. Technical specifications of PlanetScope (PS) Dove Classic imagery (adapted from [37]).
Spectral bands (nm)
(Full width at half maximum (FWHM) and range)
Blue: 470 (455–515)
Green: 540 (500–590)
Red: 610 (590–670)
NIR: 790 (780–860)
Ground sampling distance 3.5–4.1 m
Camera dynamic range12-bit
Signal-to-noise ratio (SNR)~80
Scene dimension (frame size) ~20 km × 12 km
Geometric accuracy (horizontal) ~10 m
Table 2. Final thirteen-class benthic habitat classification scheme selected for use in the Caribbean-wide mapping. Classifications and accuracy assessments were performed on both Level 1 and 2.
StructureBenthic Cover
TypeLevel 1Level 2
Hardbottom ReefReefCoral/Algae (Fringing and Patch)
Reef Crest
Reef Back (Inner flat)
Reef Fore (Outer flat)
Spur and Groove
Boulders and Rocks
Hardbottom (Non-reef)HardbottomHardbottom with Dense Algae
Hardbottom with Sparse Algae
Unconsolidated sedimentSeagrassDense Seagrass
Sparse Seagrass
SandSand
Muddy bottomMuddy Bottom/Estuarine
Dredged
Table 3. Issues/problems encountered during the development of the eCognition classification approach and corresponding solutions employed.
Issue/ProblemSolution
Areas > 20 m depth did not have accurate bathymetry data, only RGB spectral values.Employ a classification approach using only RGB values and subsequent manual editing where needed.
Shallow reef features around the reef crest needed more detail and accuracy.Use geomorphic zones as “parental guidance” and object-specific range and thresholding to refine and improve the boundaries for reef crest, fore reef, and back reef features.
Seagrass features classified into dense and sparse beds.Use object-specific range and thresholding of RGB values within lagoon areas to separate sparse and dense seagrass beds.
Hardbottom features in deeper areas needed more detail and accuracy.Use object-specific range and thresholding of RGB values to separate sparse and dense algae hardbottom.
Removing objects that were less than the minimum mapping unit.Objects with less or equal to area threshold were dissolved by majority length of the common border of the neighboring objects.
Missing reef areas.Search for missing reefs using an object-specific range and thresholding detection method to refine and improve reef boundaries.
Table 4. Total area (km2) for each benthic habitat class within the shallow marine zone (<30 m depth) of the Insular Caribbean and corresponding area and percentage within declared marine protected or managed areas.
Benthic Habitat ClassTotal Area (km2)Within Protected/Managed Area (km2)
Coral ReefsReef Crest70.2323.86 (34%)
Fore Reef295.27102.93 (35%)
Back Reef265.18103.35 (39%)
Coral/Algae9075.271662.10 (18%)
Spur and Groove Reef666.88146.66 (22%)
Total Coral10,372.82 (5%)2038.89 (20%)
SeagrassDense Seagrass24,673.023593.69 (15%)
Sparse Seagrass63,497.277853.34 (12%)
Total Seagrass88,170.29 (43%)11,447.03 (13%)
HardbottomHardbottom Dense Algae13,670.713222.88 (24%)
Hardbottom Sparse Algae16,198.263436.14 (21%)
Total Hardbottom29,868.97 (15%)6659.02 (22%)
OtherSand74,273.7510,807.40 (15%)
Muddy Bottom930.90353.85 (38%)
Boulders and Rocks13.060.99 (8%)
Dredged46.434.53 (10%)
Total Other75,264.13 (37%)11,116.78 (15%)
Table 5. Total area (km2) of coral reef benthic habitat classes within the shallow marine zone (<30 m depth) of the Insular Caribbean per EEZ and corresponding area and percentage within declared marine protected or managed areas (P/M %). The total coral reef protection percentages in bold indicate attainment of at least 30%.
Reef CrestFore ReefBack ReefCoral/AlgaeSpur and GrooveCoral Reef Totals
Country/
Territory
Total
km2
P/M %Total
km2
P/M %Total
km2
P/M %Total
km2
P/M %Total
km2
P/M %Total
km2
P/M %
Anguilla0.280.14 (49%)1.440.68 (47%)1.310.77 (59%)10.283.02 (29%)1.540.16 (11%)14.854.77 (32%)
Antigua and Barbuda0.750.70 (93%)3.693.47 (94%)3.993.78 (95%)100.4742.65 (42%)5.053.74 (74%)113.9554.34 (48%)
The Bahamas27.265.14 (19%)104.6522.61 (22%)95.9123.40 (24%)5035.50457.95 (9%)267.9023.66 (9%)5531.22532.76 (10%)
Barbados1.240.00 (0%)4.720.00 (0%)4.500.00 (0%)17.990.93 (5%)1.430.08 (6%)29.881.00 (3%)
British Virgin Islands0.950.10 (11%)2.610.34 (13%)2.420.31 (13%)88.2812.44 (14%)0.410.17 (42%)94.6613.36 (14%)
Cayman Islands1.380.93 (67%)6.774.50 (66%)5.053.20 (63%)22.8416.68 (73%)27.9416.47 (59%)63.9841.77 (65%)
Cuba13.434.83 (36%)71.7024.41 (34%)59.2722.09 (37%)1890.02411.23 (22%)191.8953.05 (28%)2226.32515.62 (23%)
Dominica0.010.00 (0%)0.060.00 (0%)0.050.00 (0%)11.420.75 (7%)0.00N/A11.540.75 (7%)
Dominican Republic4.822.87 (60%)19.9312.30 (62%)17.5811.38 (65%)308.76171.21 (55%)10.437.73 (74%)361.52205.50 (57%)
Grenada0.610.00 (0%)2.700.00 (0%)2.430.00 (0%)38.113.78 (10%)0.00N/A43.853.78 (9%)
Guadeloupe1.681.68 (100%)7.807.80 (100%)6.746.74 (100%)85.7585.75 (100%)16.2116.21 (100%)118.18118.18 (100%)
Haiti *5.052.49 (49%)14.936.01 (40%)17.3710.26 (59%)250.7085.08 (34%)28.0711.74 (42%)316.12115.59 (37%)
Jamaica3.020.84 (28%)13.624.38 (32%)10.853.34 (31%)277.9585.30 (31%)56.915.22 (9%)362.3599.07 (27%)
Martinique0.970.97 (100%)3.443.44 (100%)4.774.77 (100%)43.9043.90 (100%)0.00N/A53.0753.07 (100%)
Montserrat0.00N/A0.00N/A0.00N/A0.920.00 (0%)0.00N/A0.920.00 (0%)
Puerto Rico1.710.88 (51%)6.654.56 (69%)5.543.50 (63%)247.5067.18 (27%)7.263.23 (44%)268.6779.36 (30%)
Saba0.00N/A0.00N/A0.00N/A31.9031.90 (100%)0.00N/A31.9031.90 (100%)
Saint Barthelemy0.030.03 (100%)0.0580.06 (100%)0.090.09 (100%)4.774.77 (100%)0.040.04 (100%)4.984.98 (100%)
Saint Kitts and Nevis0.140.14 (100%)1.001.00 (100%)1.401.40 (100%)62.0659.57 (96%)2.862.85 (100%)67.4664.96 (96%)
Saint Lucia0.180.10 (55%)0.470.33 (70%)0.530.33 (63%)11.982.40 (20%)0.00N/A13.163.16 (24%)
Saint Martin0.100.10 (100%)0.770.77 (100%)0.410.41 (100%)7.157.15 (100%)0.00N/A8.448.44 (100%)
Saint Vincent
and the Grenadines
0.590.40 (68%)2.941.69 (58%)3.352.19 (65%)29.8914.13 (47%)0.0640.049 (77%)36.8418.46 (50%)
Sint Eustatius0.00N/A0.00N/A0.0020.002 (100%)1.161.03 (89%)0.00N/A1.161.03 (89%)
Sint Maarten0.0030.0005 (16%)0.0030.00 (0%)0.0050.003 (63%)2.340.22 (9%)0.00N/A2.350.22 (9%)
Turks and Caicos5.240.82 (16%)23.012.44 (11%)19.543.54 (18%)430.2611.97 (3%)45.850.55 (1%)523.8919.32 (4%)
U.S. Virgin Islands0.780.71 (91%)2.312.13 (92%)2.091.84 (88%)63.3741.13 (65%)3.021.69 (56%)71.5747.49 (66%)
* Haiti statistics include Navassa Island, which is a disputed area between Haiti, the U.S., and Jamaica.
Table 6. Total area (km2) of seagrass benthic habitat classes within the shallow marine zone (<30 m depth) of the Insular Caribbean per EEZ and corresponding area and percentage within declared marine protected and managed areas (P/M %). The total seagrass protection percentages in bold indicate attainment of at least 30%.
Dense SeagrassSparse SeagrassSeagrass Totals
Country/TerritoryTotal
km2
P/M %Total
km2
P/M %Total
km2
P/M %
Anguilla3.330.74 (22%)29.402.63 (9%)32.733.37 (10%)
Antigua and Barbuda59.3732.33 (54%)78.4558.73 (75%)137.8291.06 (66%)
The Bahamas13,976.29938.68 (7%)39,953.613228.70 (8%)53,929.904167.38 (8%)
Barbados0.0060.00 (0%)0.080.00 (0%)0.090.00 (0%)
British Virgin Islands40.291.29 (3%)20.870.97 (5%)61.162.26 (4%)
Cayman Islands21.3814.25 (67%)64.0422.31 (35%)85.4236.56 (43%)
Cuba8863.092089.41 (24%)20,387.093479.97 (17%)29,250.195569.39 (19%)
Dominica10.060.48 (5%)0.120.00 (0%)10.180.48 (5%)
Dominican Republic128.3091.92 (72%)494.35303.43 (61%)622.65395.35 (63%)
Grenada16.162.76 (17%)16.993.26 (19%)33.156.02 (18%)
Guadeloupe93.3793.37 (100%)66.2066.20 (100%)159.57159.57 (100%)
Haiti *229.76125.01 (54%)575.15291.60 (51%)804.91416.61 (52%)
Jamaica102.7178.95 (77%)322.76175.35 (54%)425.47254.30 (60%)
Martinique8.908.90 (100%)63.4763.47 (100%)72.3772.37 (100%)
Montserrat0.310.00 (0%)0.00N/A0.310.00 (0%)
Puerto Rico254.9217.99 (7%)139.8532.18 (23%)394.7750.17 (13%)
Saba0.020.02 (100%)0.00N/A0.020.02 (100%)
Saint Barthelemy0.450.45 (100%)1.911.91 (100%)2.362.36 (100%)
Saint Kitts and Nevis27.4927.38 (100%)2.912.91 (100%)30.4030.29 (100%)
Saint Lucia13.623.96 (29%)0.00N/A13.623.96 (29%)
Saint Martin6.596.59 (100%)11.0811.08 (100%)17.6717.67 (100%)
Saint Vincent and the Grenadines14.643.56 (24%)11.697.19 (62%)26.3310.75 (41%)
Sint Eustatius0.00N/A0.00N/A0.00N/A
Sint Maarten2.360.01 (0.3%)9.100.14 (2%)11.460.15 (1%)
Turks and Caicos773.5336.84 (5%)1204.3467.96 (6%)1977.88104.80 (5%)
U.S. Virgin Islands26.1018.81 (72%)43.7833.34 (76%)69.8852.14 (75%)
* Haiti statistics include Navassa Island, which is a disputed area between Haiti, the U.S., and Jamaica.
Table 7. Total area (km2) of hardbottom benthic habitat classes within the shallow marine zone (<30 m depth) of the Insular Caribbean per EEZ and corresponding area and percentage within declared marine protected or managed areas (P/M %). The total hardbottom protection percentages in bold indicate attainment of at least 30%.
Hardbottom Dense Algae Hardbottom Sparse Algae Hardbottom Totals
Country/Territory Total
km2
P/M % Total
km2
P/M % Total
km2
P/M %
Anguilla111.967.35 (7%)75.349.30 (12%)187.3016.66 (9%)
Antigua and Barbuda414.1643.18 (10%)597.2536.40 (6%)1011.4179.58 (8%)
The Bahamas6192.81841.05 (14%)7754.22927.84 (12%)13,947.031768.88 (13%)
Barbados13.050.18 (1%)21.940.84 (4%)34.981.03 (3%)
British Virgin Islands237.437.37 (3%)498.9418.25 (4%)736.3725.63 (3%)
Cayman Islands4.892.46 (50%)27.5614.34 (52%)32.4516.80 (52%)
Cuba951.51186.99 (20%)1386.20443.03 (32%)2337.71630.02 (27%)
Dominica10.520.11 (1%)0.040.02 (54%)10.560.13 (1%)
Dominican Republic923.72547.95 (59%)1146.58529.27 (46%)2070.301077.23 (52%)
Grenada16.552.75 (17%)67.906.93 (10%)84.459.68 (11%)
Guadeloupe144.83144.83 (100%)148.46148.46 (100%)293.29293.29 (100%)
Haiti *667.91176.18 (27%)888.55192.57 (22%)1556.46368.75 (24%)
Jamaica1950.42313.08 (16%)2068.46477.35 (23%)4018.88790.43 (20%)
Martinique77.2377.23 (100%)68.5568.55 (100%)145.78145.78 (100%)
Montserrat8.550.00 (0%)10.470.00 (0%)19.020.00 (0%)
Puerto Rico714.80168.10 (24%)440.12159.83 (36%)1154.92327.94 (28%)
Saba449.02449.02 (100%)173.26173.26 (100%)622.28622.28 (100%)
Saint Barthelemy53.2153.21 (100%)45.4945.49 (100%)98.7198.71 (100%)
Saint Kitts and Nevis73.2046.23 (63%)95.1450.36 (53%)168.3496.59 (57%)
Saint Lucia68.847.30 (11%)8.730.06 (0.7%)73.577.36 (10%)
Saint Martin39.3739.37 (100%)36.3236.32 (100%)75.6875.68 (100%)
Saint Vincent and the Grenadines11.412.17 (19%)139.7521.15 (15%)151.1623.32 (15%)
Sint Eustatius6.456.00 (93%)5.584.08 (73%)12.0310.08 (84%)
Sint Maarten31.307.91 (25%)23.408.68 (37%)54.7116.58 (30%)
Turks and Caicos323.032.13 (0.7%)352.960.83 (0.2%)675.982.96 (0.4%)
U.S. Virgin Islands178.5590.72 (51%)117.0662.91 (54%)295.60153.63 (52%)
* Haiti statistics include Navassa Island, which is a disputed area between Haiti, the U.S., and Jamaica.
Table 8. Total area (km2) of other benthic habitat classes within the shallow marine zone (<30 m depth) of the Insular Caribbean per EEZ and corresponding area and percentage within declared marine protected or managed areas. The total protection percentages in bold indicate attainment of at least 30% of the area of the habitat.
SandMuddy BottomBoulders and Rocks
Country/TerritoryTotal
km2
P/M %Total
km2
P/M %Total
km2
P/M %
Anguilla211.837.50 (4%)2.310.08 (3%)0.0060.00 (0%)
Antigua and Barbuda1001.03105.89 (11%)8.076.90 (85%)0.240.00 (0%)
The Bahamas44,988.894465.90 (10%)513.93174.69 (34%)0.00N/A
Barbados57.330.83 (1%)0.0060.00 (0%)0.00N/A
British Virgin Islands965.3411.85 (1%)0.350.08 (24%)0.00N/A
Cayman Islands29.8119.18 (64%)0.890.0001 (0.01%)0.00N/A
Cuba19,190.403430.29 (18%)193.9957.96 (30%)0.00N/A
Dominica63.143.62 (6%)0.00N/A4.540.23 (5%)
Dominican Republic870.34618.25 (71%)112.7459.16 (52%)0.00N/A
Grenada61.103.86 (6%)0.00N/A2.600.13 (5%)
Guadeloupe356.96356.96 (100%)0.780.78 (100%)0.100.10 (100%)
Haiti *746.02285.19 (38%)24.2523.44 (97%)0.00N/A
Jamaica1567.86275.19 (18%)19.756.03 (31%)0.00N/A
Martinique134.54134.54 (100%)1.441.44 (100%)0.350.35 (100%)
Montserrat7.810.00 (0%)0.00N/A0.910.00 (0%)
Puerto Rico1326.55320.94 (24%)16.146.45 (40%)0.00N/A
Saba246.35246.35 (100%)0.00N/A0.00N/A
Saint Barthelemy43.2543.25 (100%)0.140.14 (100%)0.00N/A
Saint Kitts and Nevis137.70120.52 (88%)2.160.001 (0.06%)0.00N/A
Saint Lucia116.6124.92 (21%)0.00N/A0.350.12 (35%)
Saint Martin85.2685.26 (100%)6.436.43 (100%)0.010.01 (100%)
Saint Vincent and the Grenadines47.8617.52 (37%)0.050.05 (100%)3.890.0006 (0.02%)
Sint Eustatius3.062.52 (82%)0.00N/A0.060.04 (66%)
Sint Maarten42.4411.91 (28%)2.290.00 (0%)0.00N/A
Turks and Caicos2746.52102.62 (4%)23.068.18 (35%)0.00N/A
U.S. Virgin Islands225.74110.63 (49%)2.142.04 (95%)0.00N/A
* Haiti statistics include Navassa Island, which is a disputed area between Haiti, the U.S., and Jamaica.
Table 9. Accuracy assessment of the Caribbean benthic habitat product using 2686 field data points collected between 2010–2017 with reef classes combined. The reported overall accuracy is 72% (not shown in the table). The numbers in the diagonal cells (depicted in bold) represent the proportion of total area correctly classified for each benthic class. Classes along the top of the table (columns) represent the observed (reference) data, and the classes on the left side (rows) represent the predicted (map) classes. All numbers reported in each table represent the proportion of the total area.
Observed Class (Reference)
Predicted Class (Map) Boulders and RocksCoral/
Algae
Hard-Bottom Dense AlgaeHard-Bottom Sparse AlgaeMuddy BottomSandSeagrass DenseSeagrass SparseUser’s Accuracy
Boulders and Rocks0.040.010.000.000.000.000.000.0085.7%
Coral/
Algae
0.025.751.130.330.000.160.270.1773.5%
Hardbottom Dense Algae0.061.1616.111.270.000.350.410.7080.4%
Hardbottom Sparse Algae0.131.271.6511.420.002.920.634.1951.4%
Muddy Bottom0.000.000.000.000.650.000.000.0987.5%
Sand0.171.620.460.400.2926.941.040.7585.0%
Seagrass Dense0.030.210.270.040.010.094.520.3182.3%
Seagrass Sparse0.001.130.350.910.350.611.956.6755.8%
Producer’s Accuracy9.2%51.6%80.7%79.4%50.1%86.8%51.3%51.8%
Table 10. Accuracy assessment results of the six-class major benthic habitat types after combining sparse and dense seagrass as well as sparse and dense hardbottom algae. The numbers in the diagonal cells (depicted in bold) represent the proportion of total area correctly classified for each benthic class. The reported overall accuracy for this analysis is 80% (not shown in the table). All numbers reported in each table represent the proportion of total area.
Boulders and RocksCoral/AlgaeHardbottom AlgaeMuddy BottomSandSeagrassUser’s Accuracy
Boulders and Rocks0.040.010.000.000.000.0085.7%
Coral/Algae0.025.751.460.000.160.4473.5%
Hardbottom Algae0.162.4332.690.002.354.6277.4%
Muddy Bottom0.000.000.000.650.000.0987.5%
Sand0.171.620.870.2926.941.7985.0%
Seagrass0.051.081.350.240.5314.1981.4%
Producer’s Accuracy9.2%52.8%90.0%55.3%89.9%67.1%
Publisher’s Note: MDPI stays neutral with regard to jurisdictional claims in published maps and institutional affiliations.