Spatiotemporal Analysis of Sea Ice Leads in the Arctic Ocean Retrieved from IceBridge Laxon Line Data 2012–2018
Abstract
1. Introduction
2. Dataset
2.1. IceBridge DMS Images and Study Area
2.2. Auxiliary Sea Ice Data
2.2.1. AMSR Data
2.2.2. ATM Surface Height Data (DMS Level)
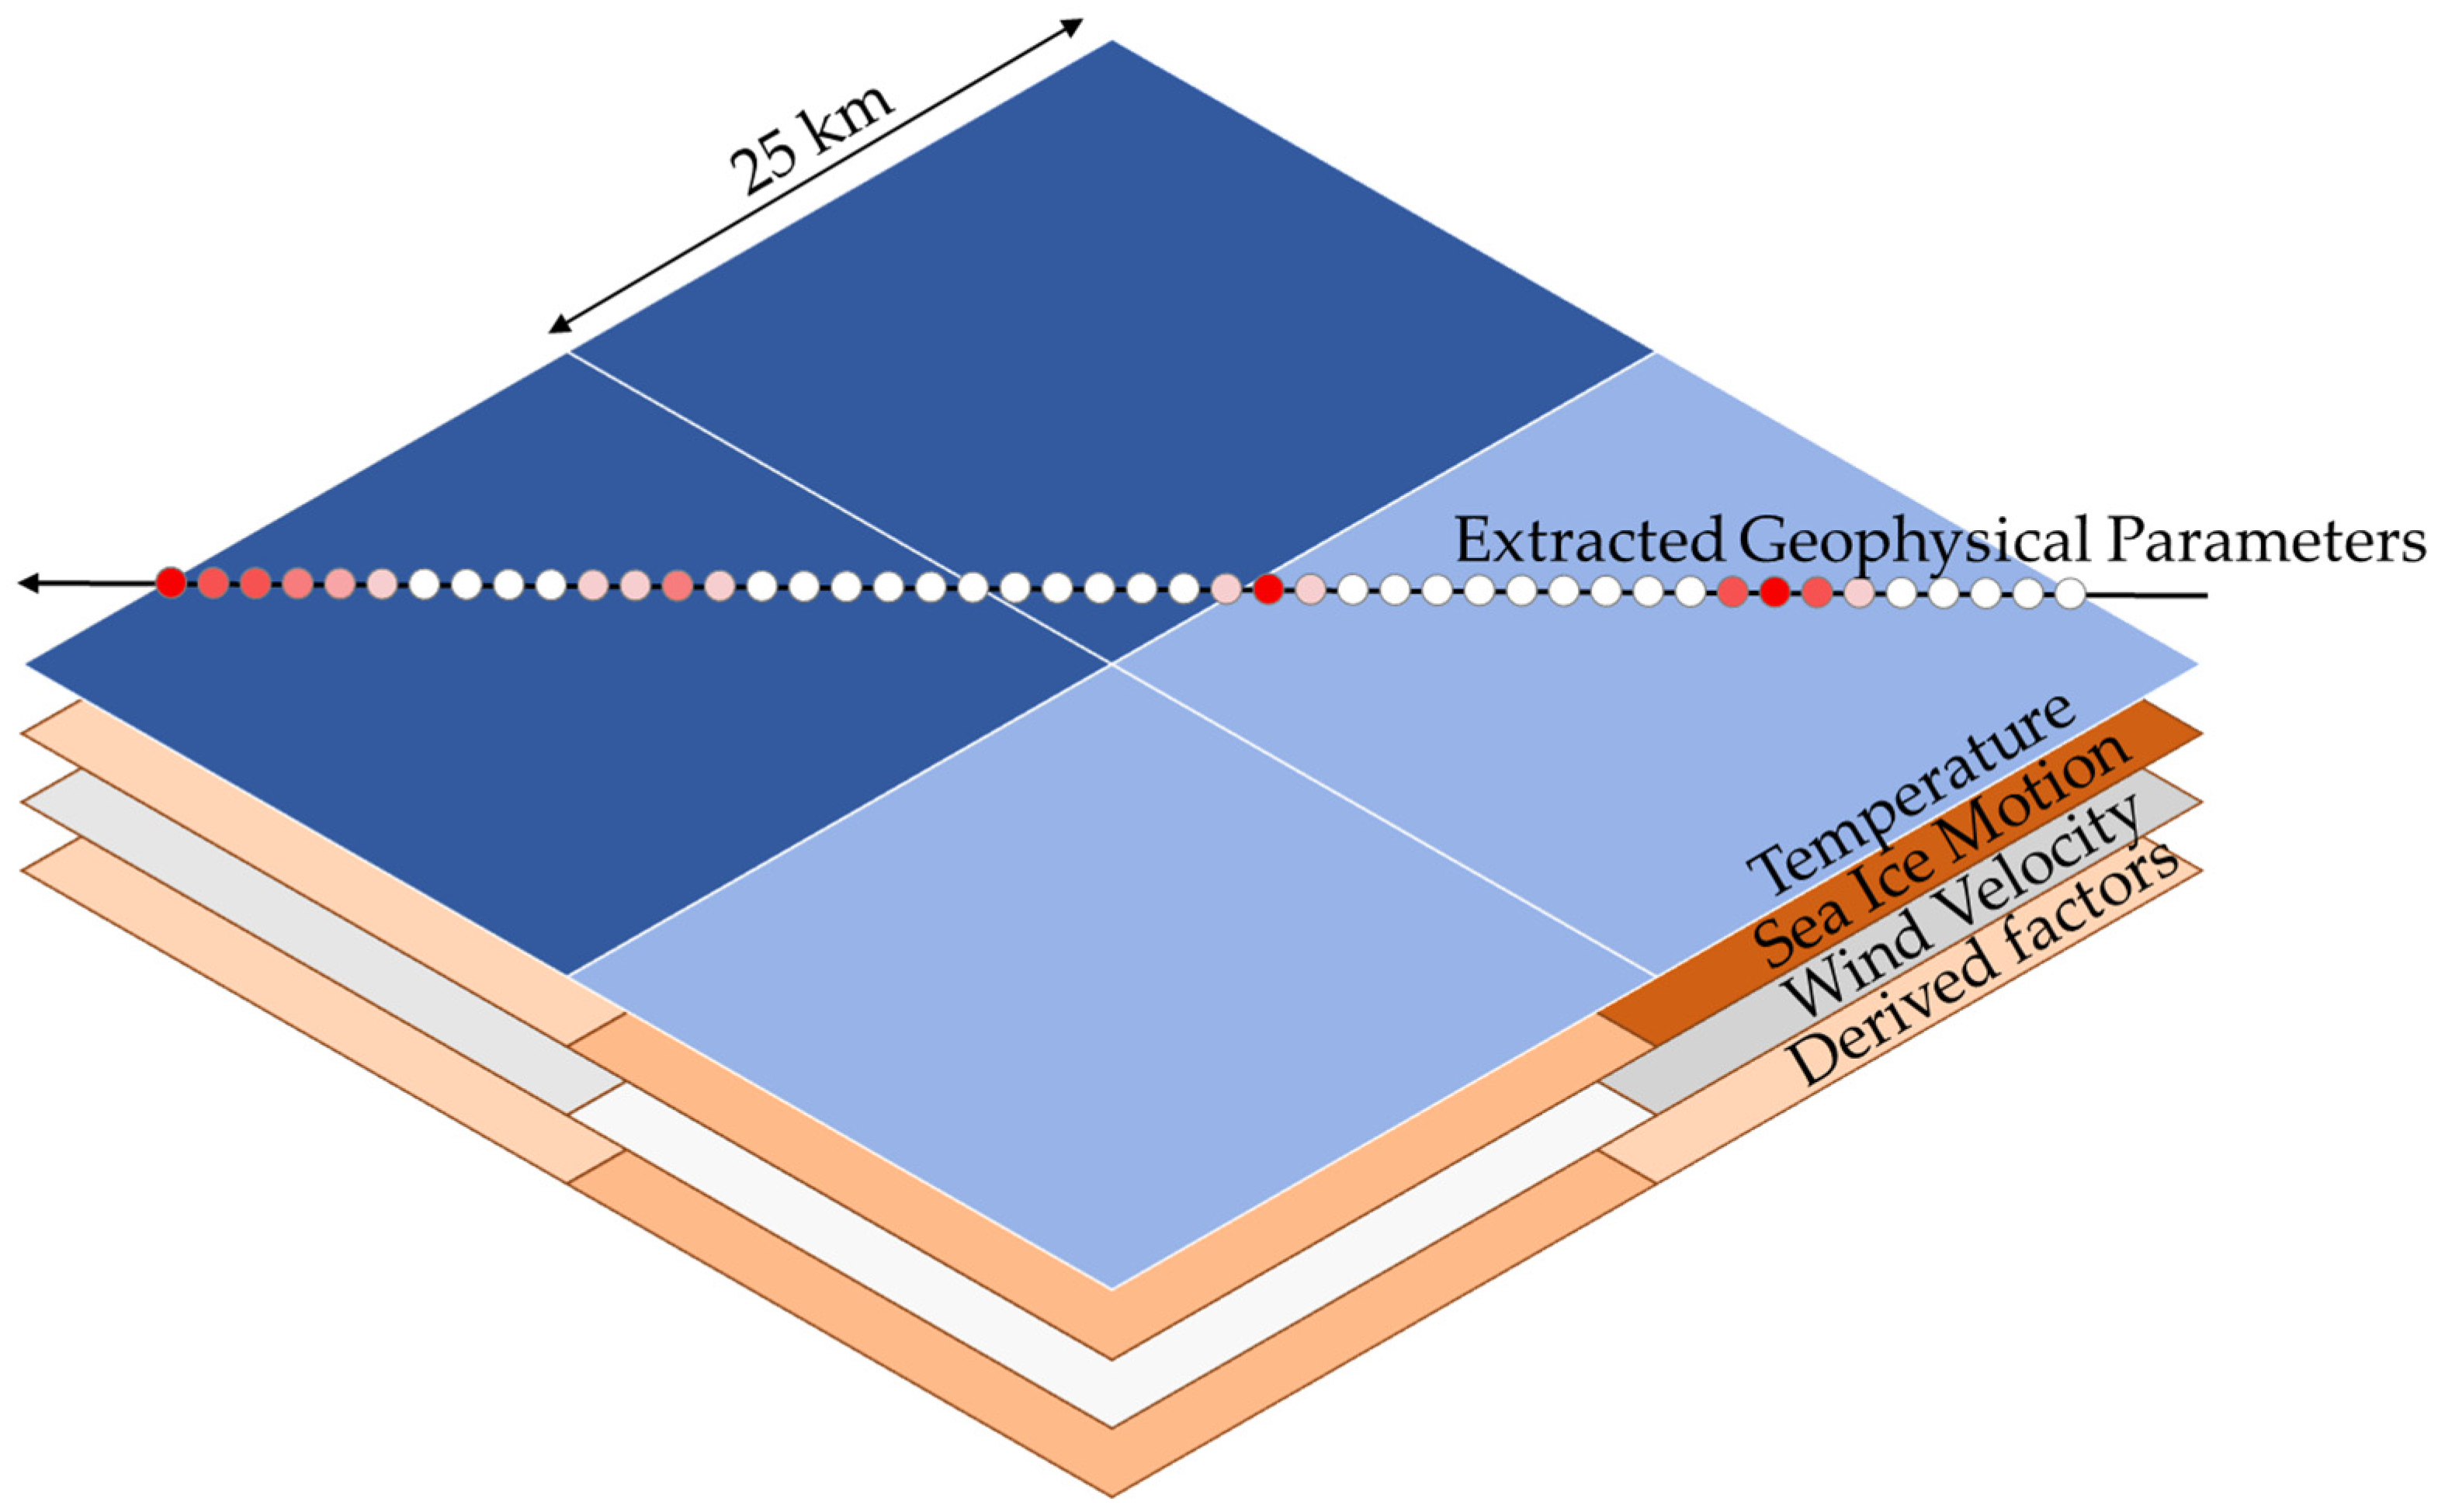
2.3. Oceanic and Atmospheric Geophysical Parameters
3. Methods
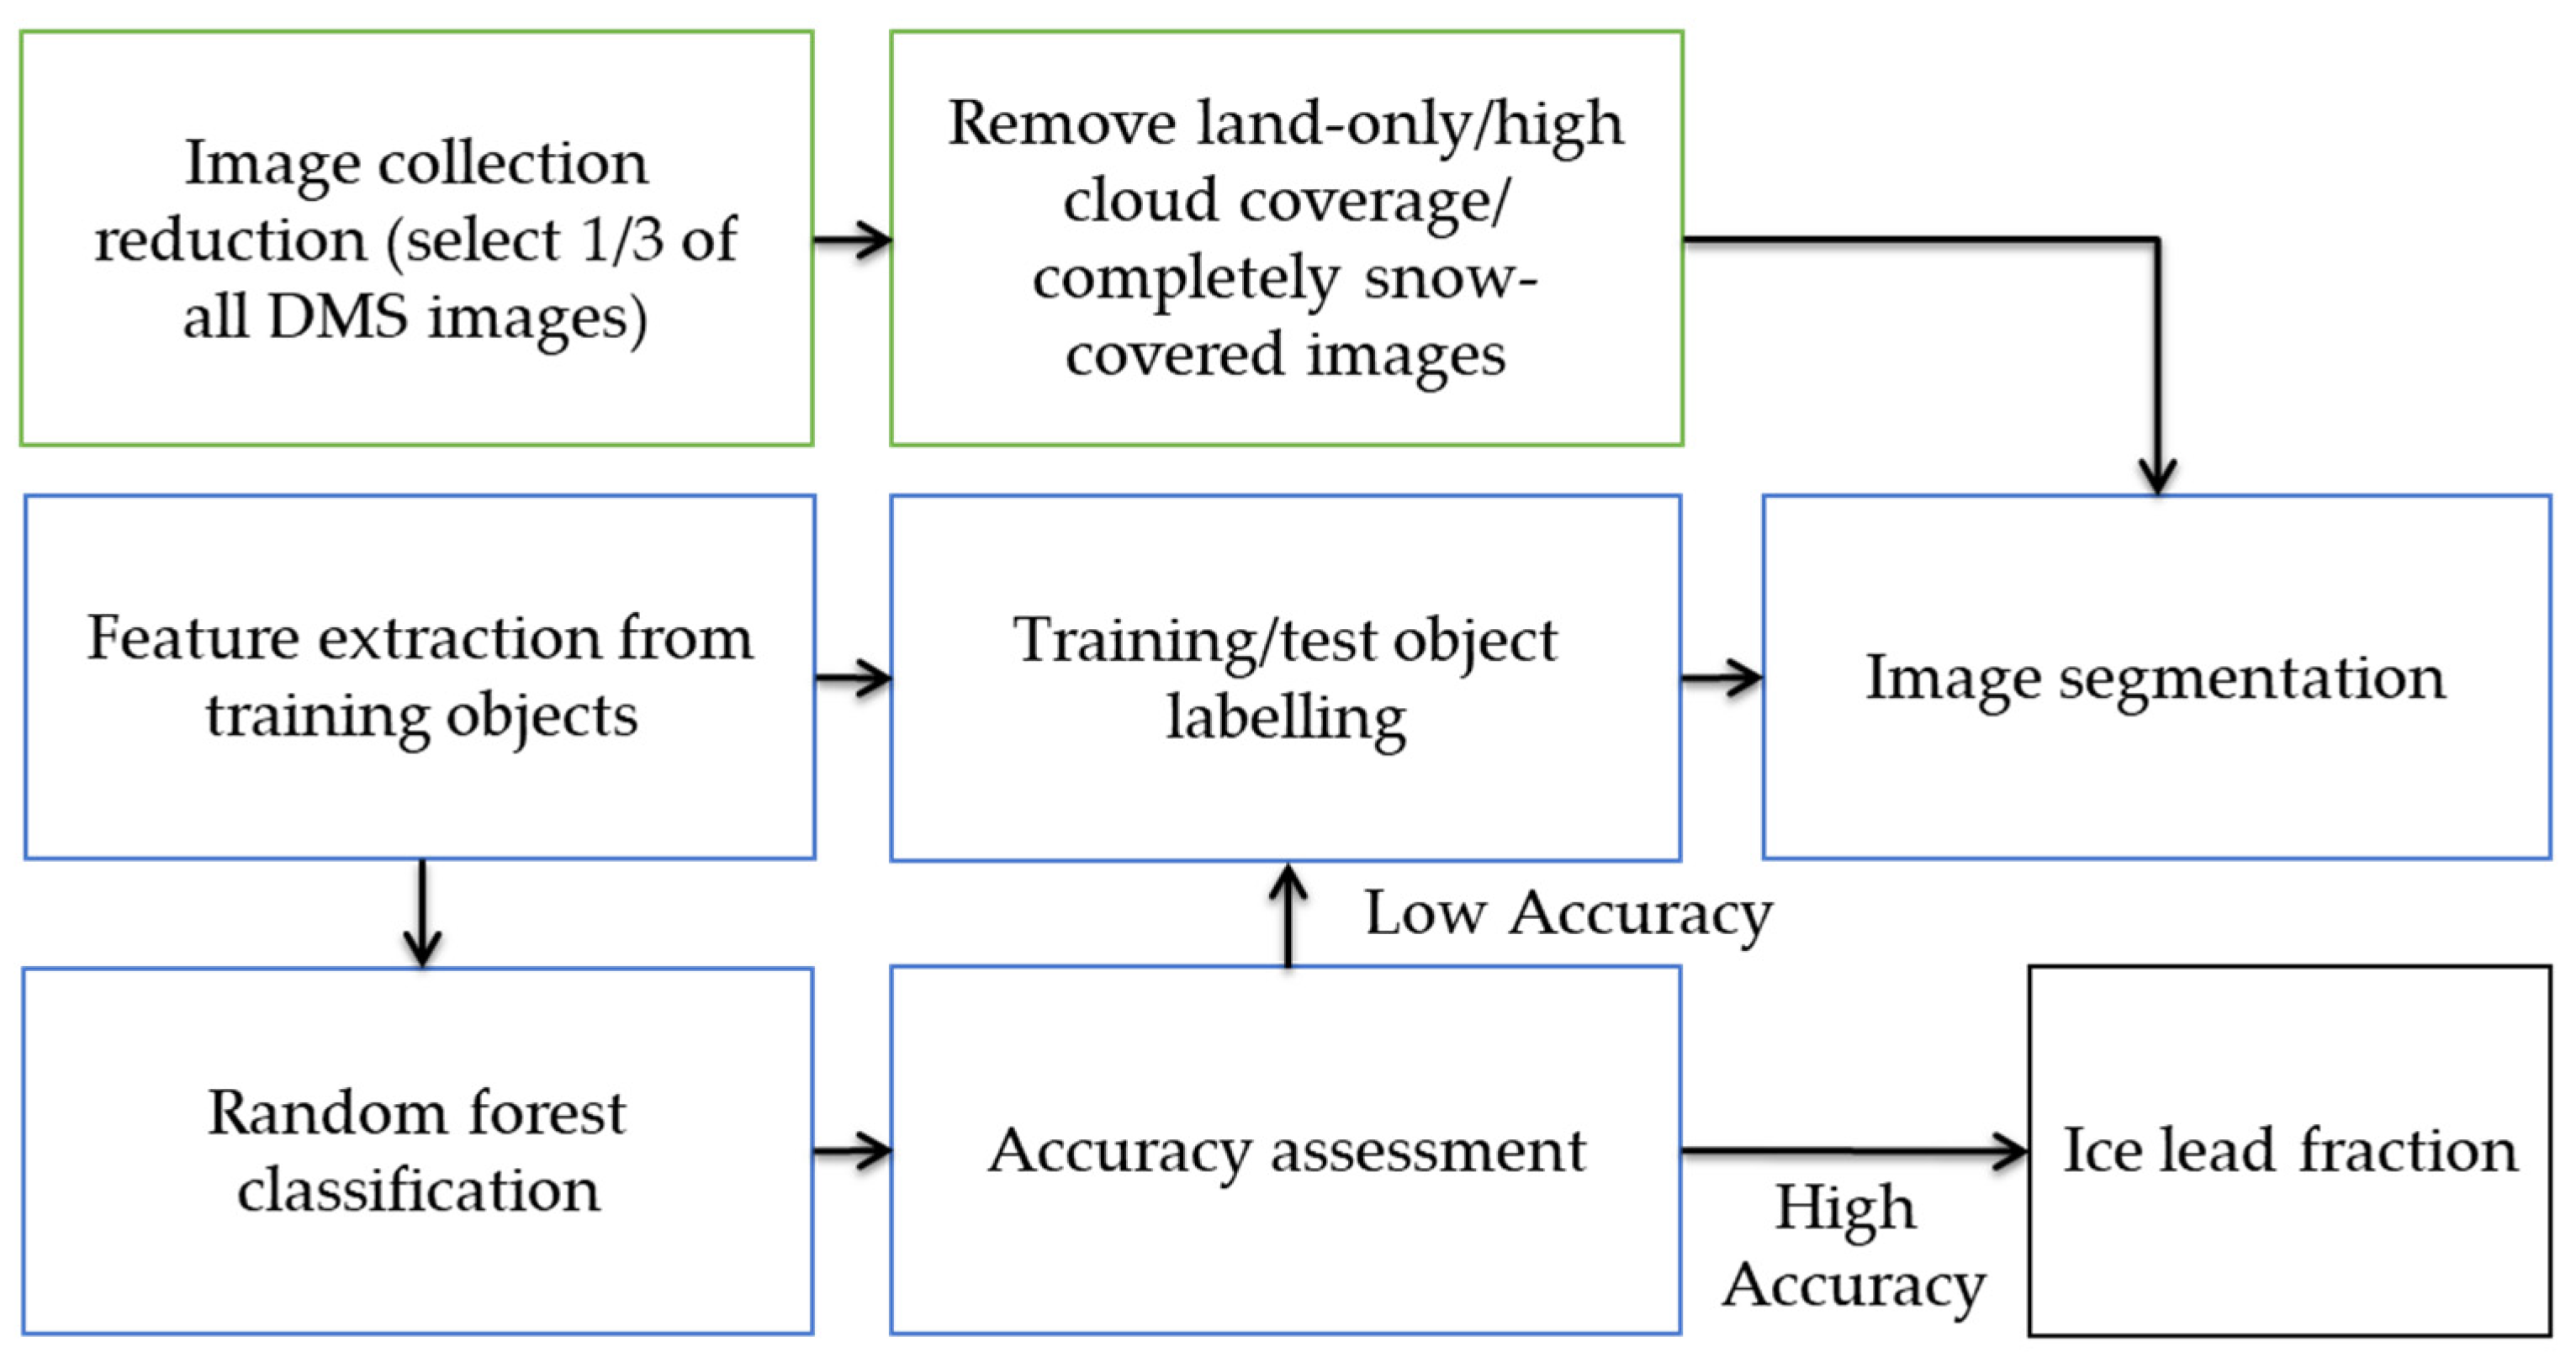
3.1. Batch Classification Processing Workflow
3.2. Sea Ice Leads Parameters Definitions
3.3. Spatiotemporal Analysis with Auxiliary Sea Ice Data
4. Result and Discussion
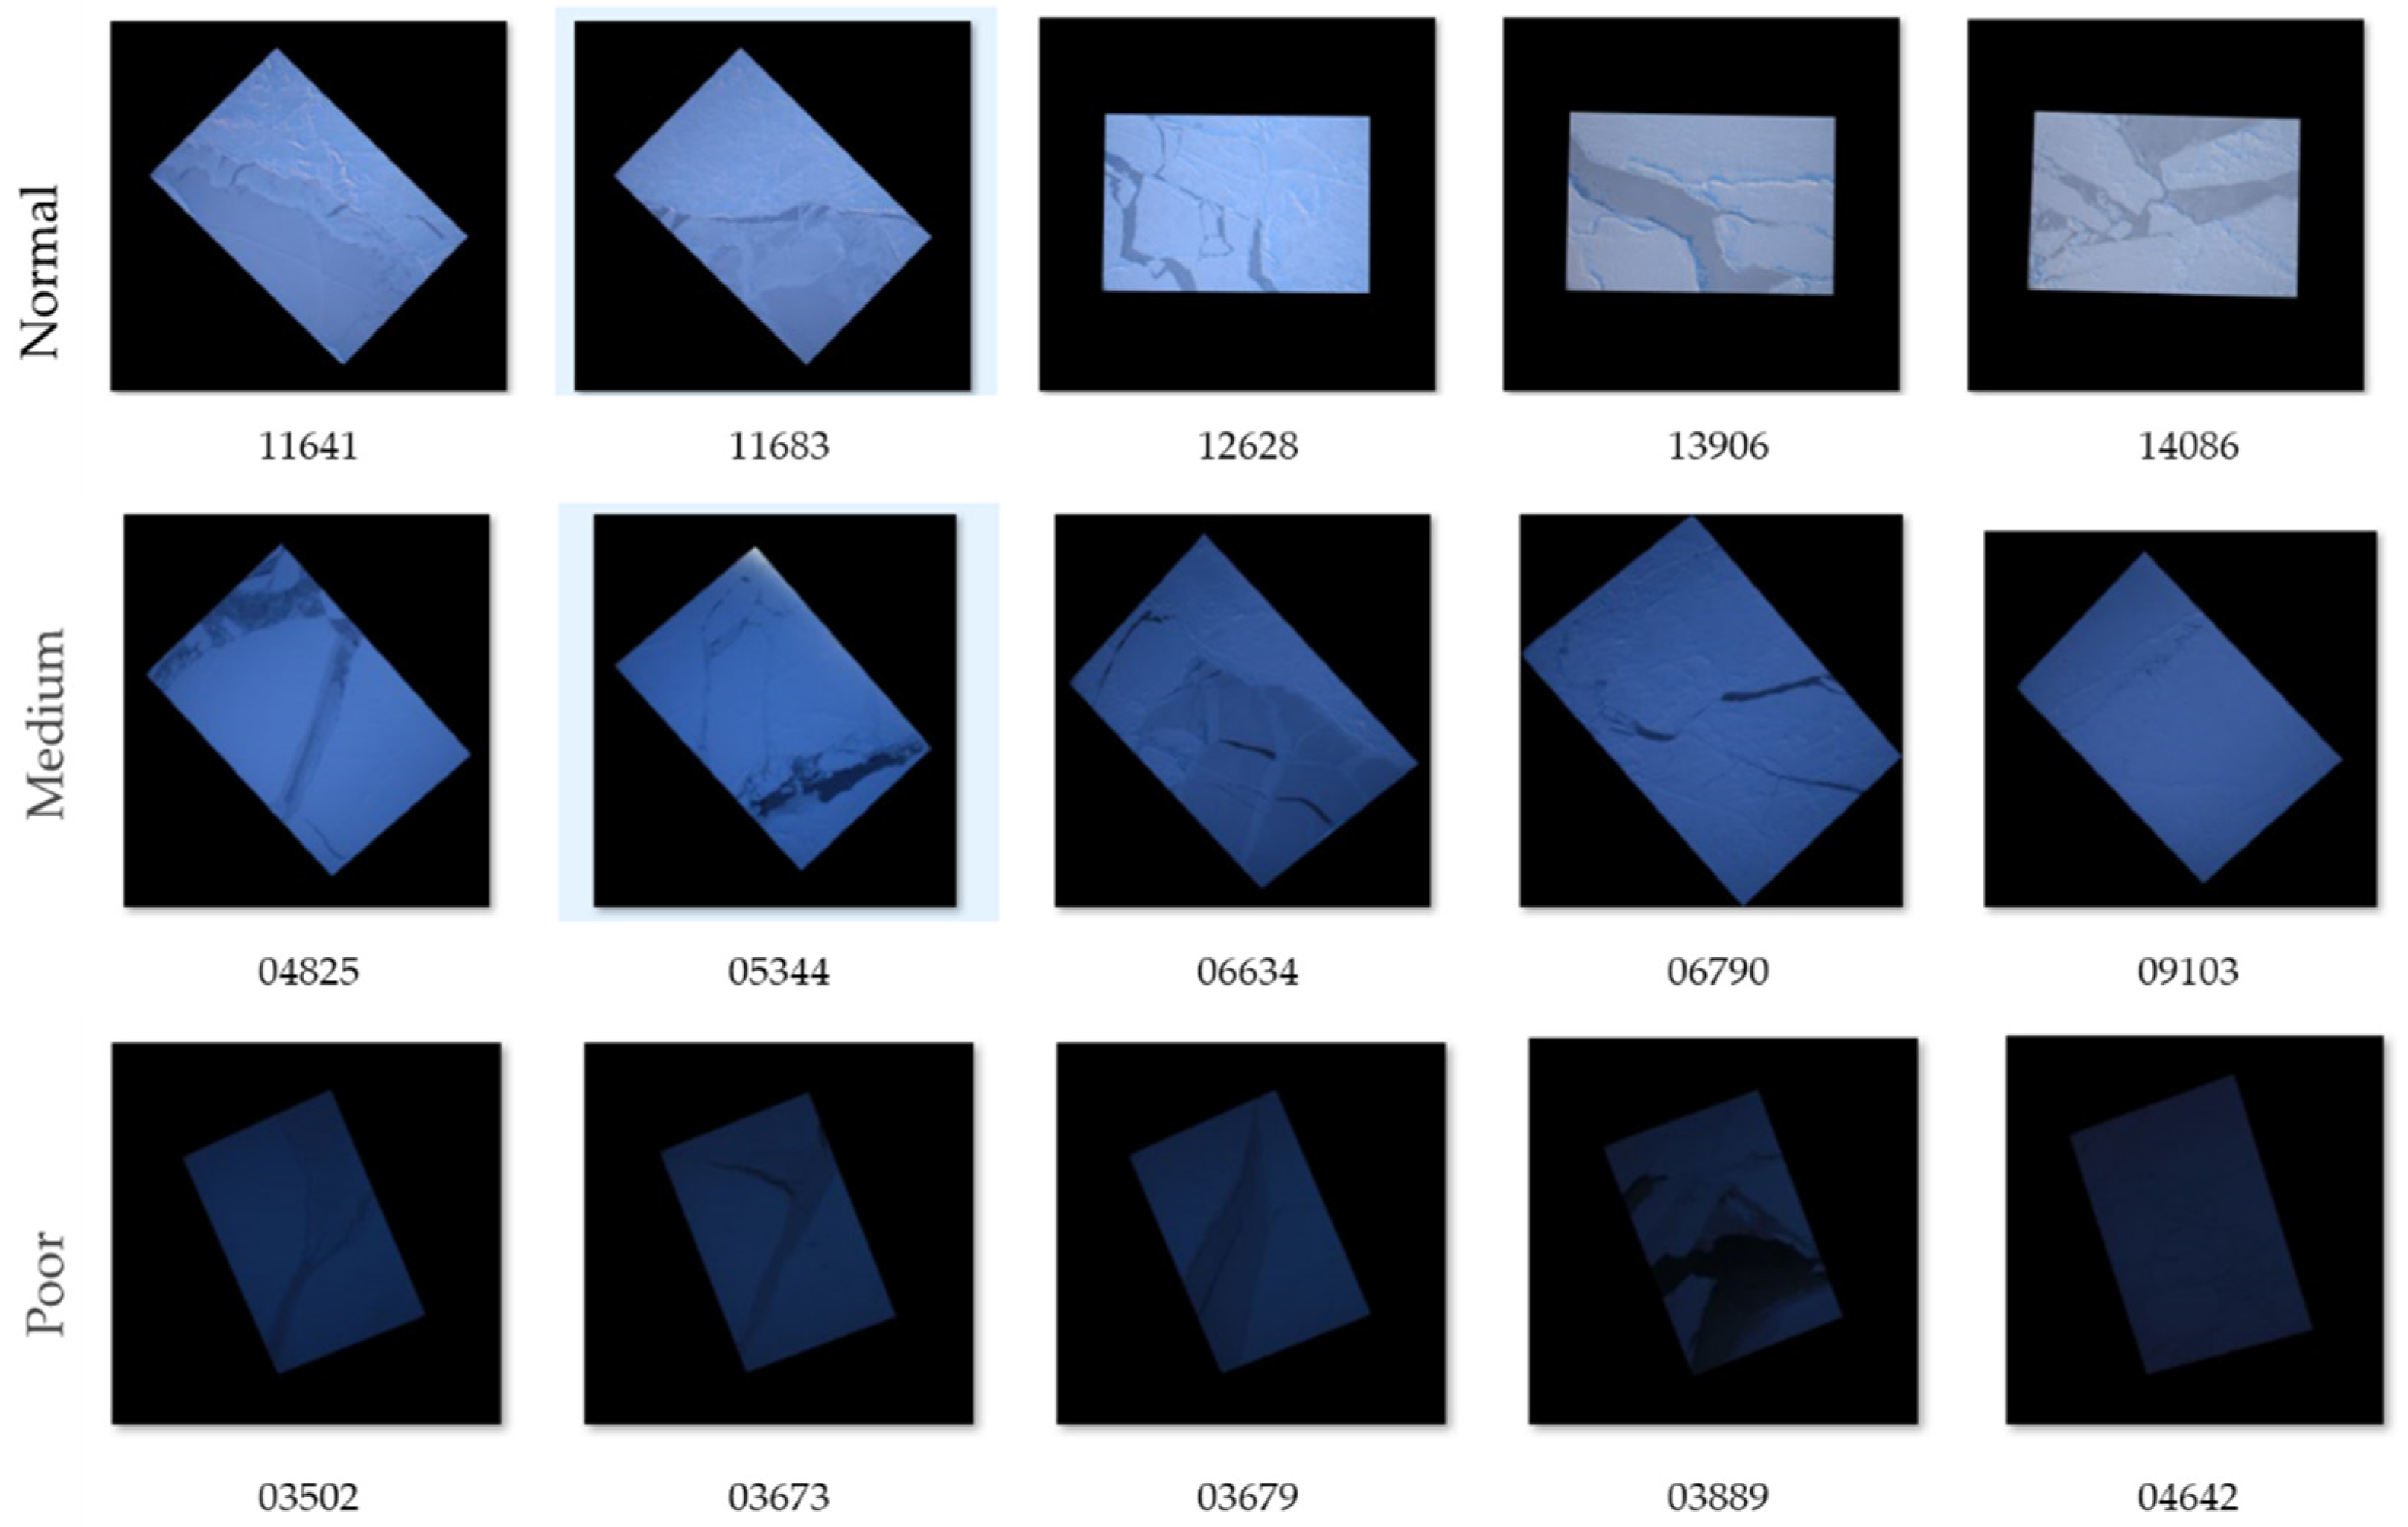
4.1. Classification Result
4.2. Overall Integrated Statistical Analysis and Trend of Sea Ice Leads and Freeboard
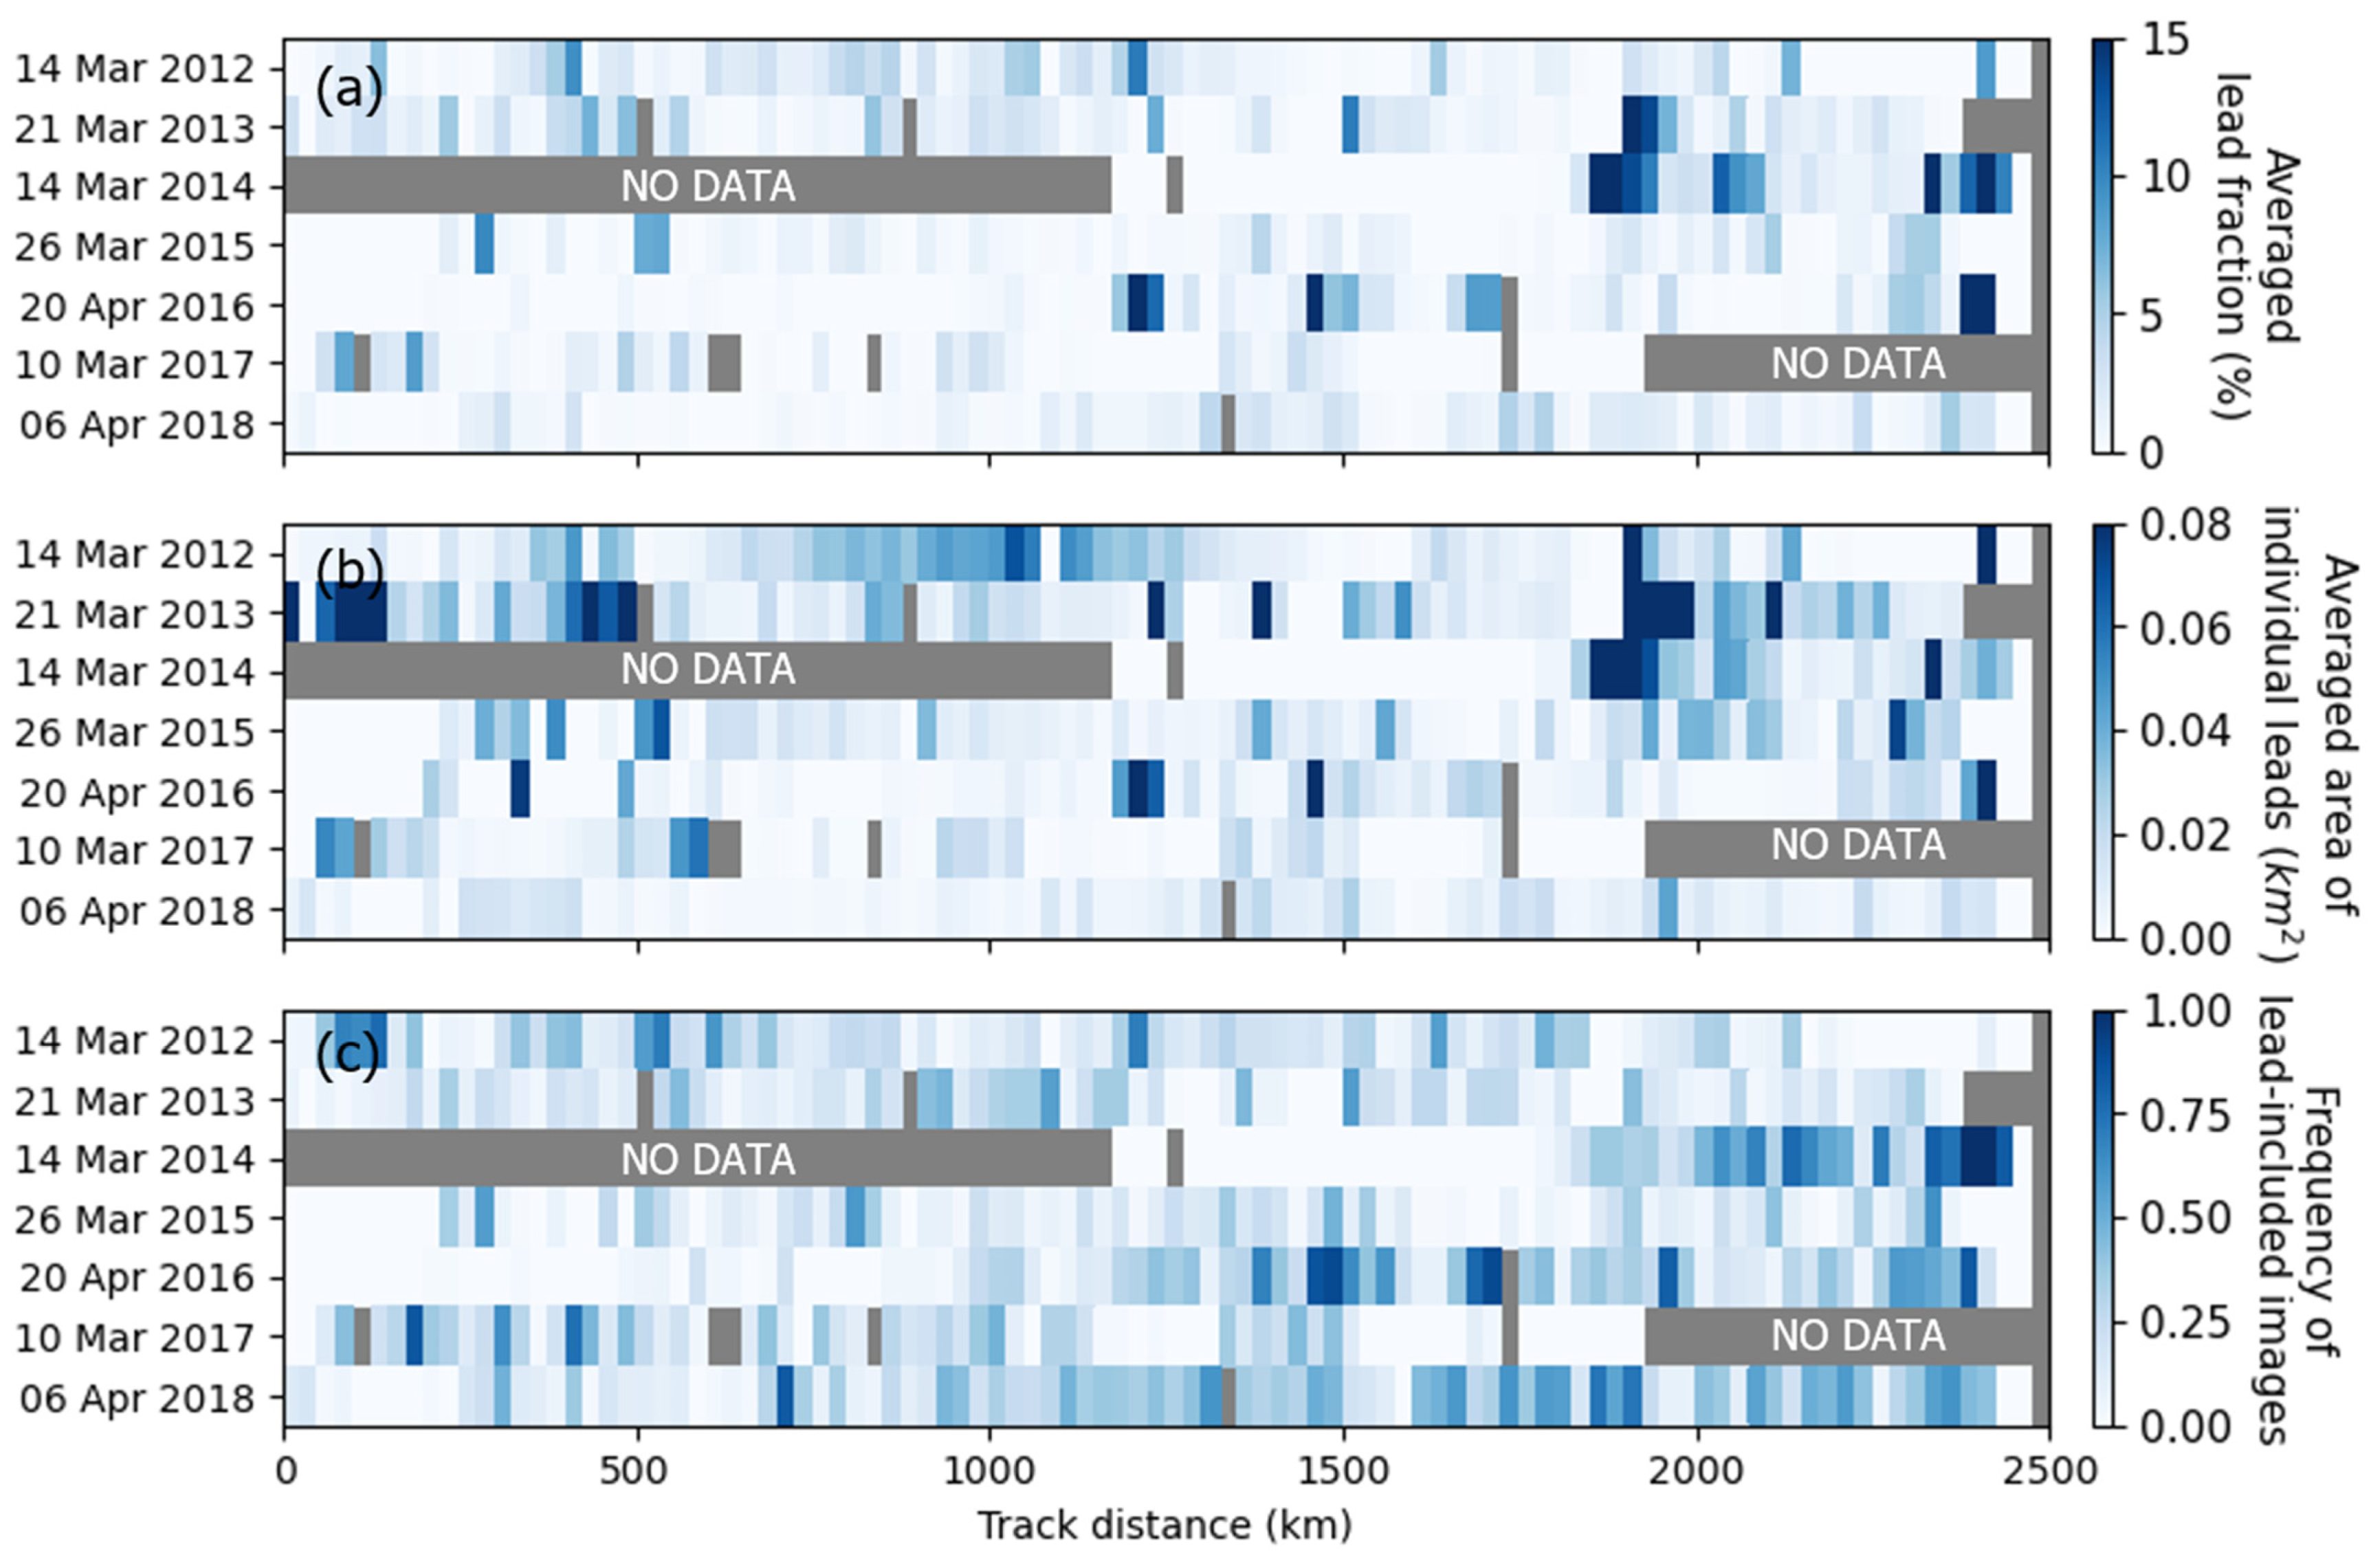
4.2.1. Sea Ice Leads Fraction, Area, and Frequency
4.2.2. Retrieval of Freeboard
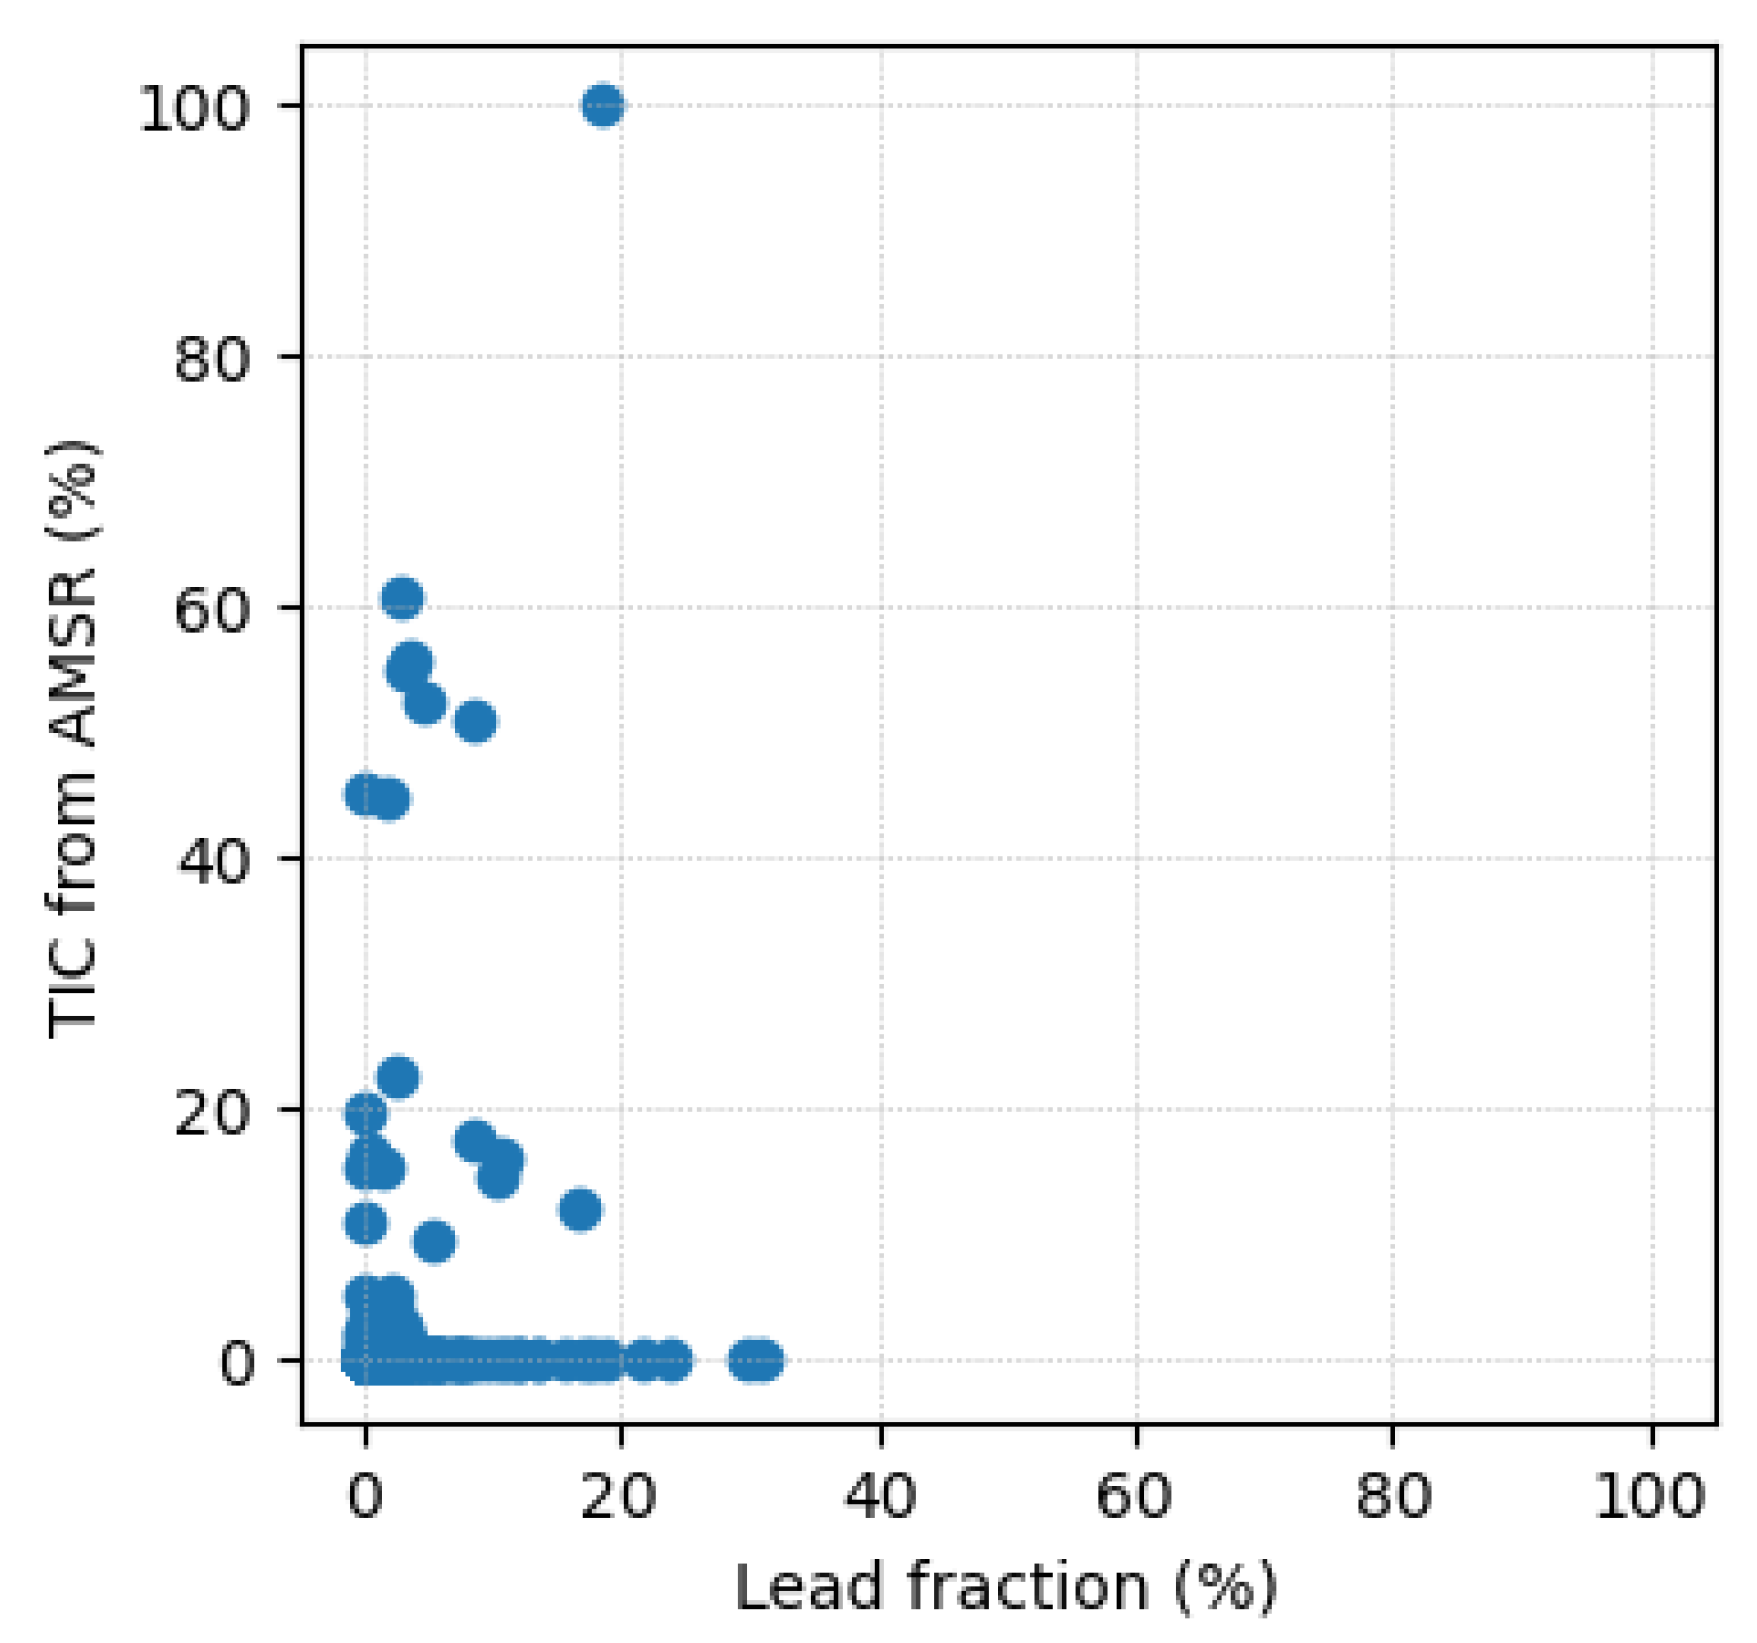
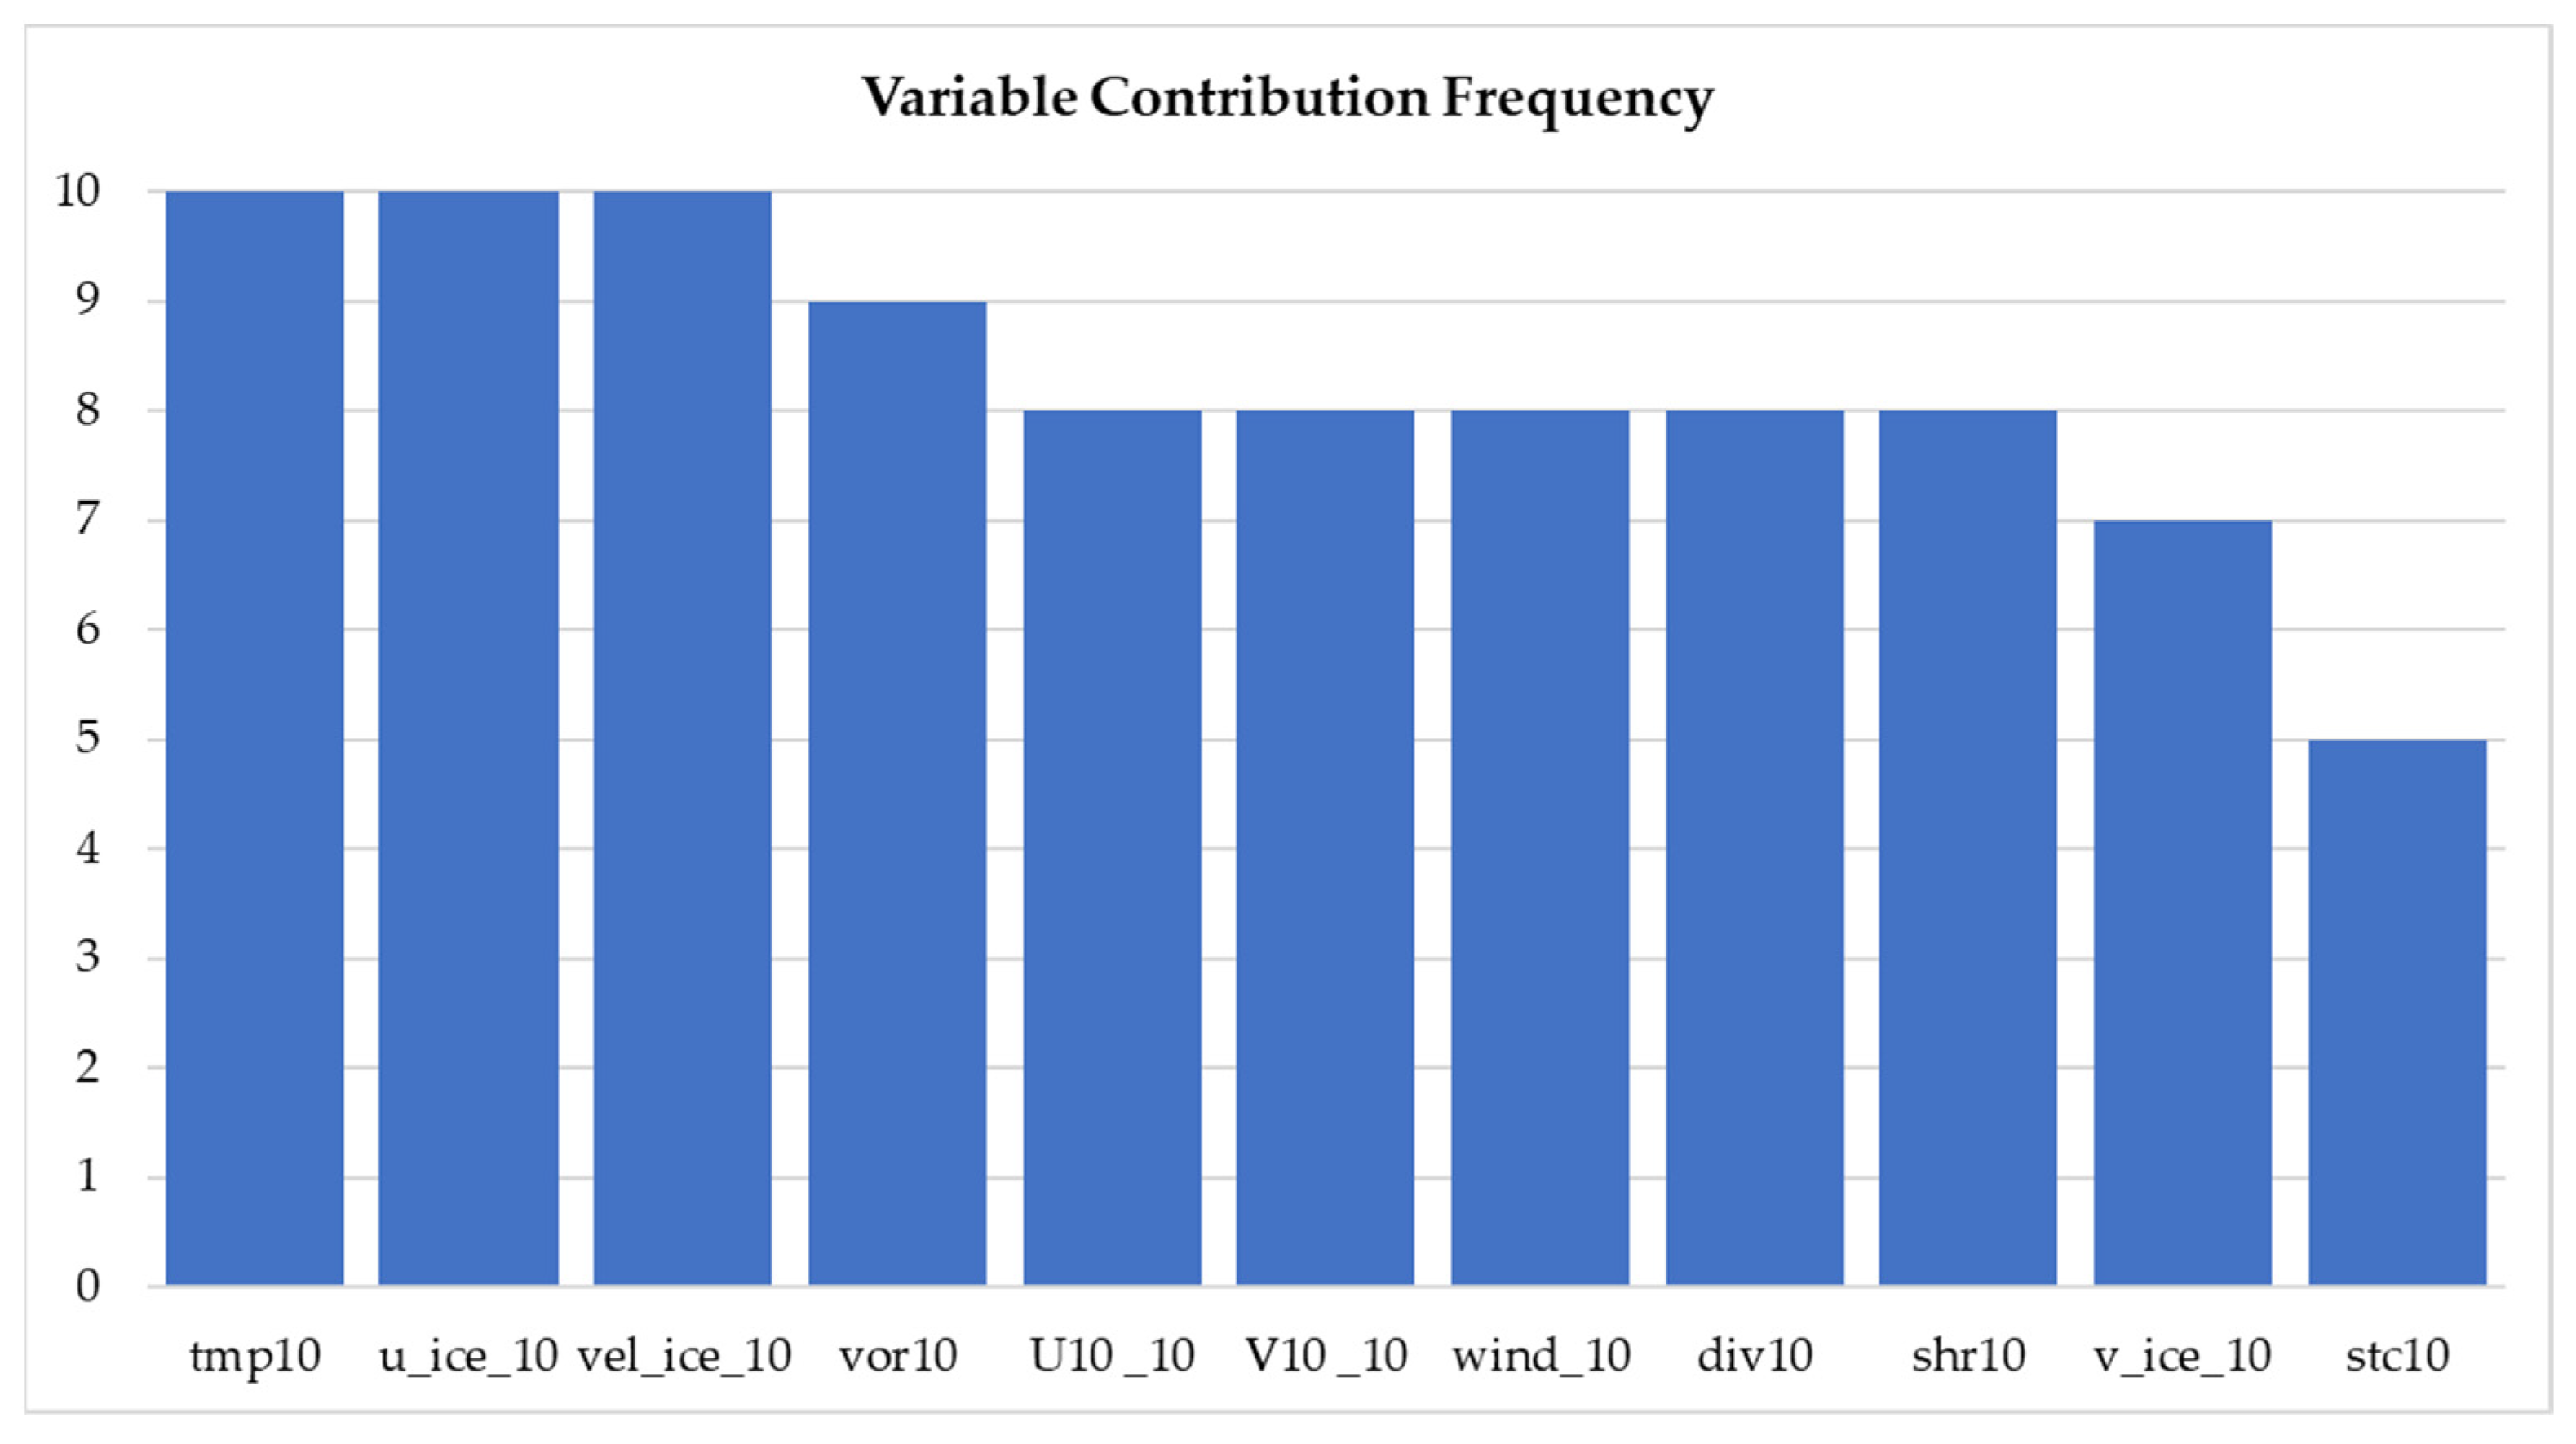
4.3. Sea Ice Lead Fraction Modelling with Auxiliary Sea Ice Product
5. Conclusions
Author Contributions
Funding
Acknowledgments
Conflicts of Interest
References
- Parkinson, C.L. A 40-y record reveals gradual Antarctic sea ice increases followed by decreases at rates far exceeding the rates seen in the Arctic. Proc. Natl. Acad. Sci. USA 2019, 116, 14414–14423. [Google Scholar] [CrossRef]
- Peng, G.; Matthews, J.L.; Yu, J.T. Sensitivity Analysis of Arctic Sea Ice Extent Trends and Statistical Projections Using Satellite Data. Remote Sens. 2018, 10, 230. [Google Scholar] [CrossRef]
- Marshall, M. Arctic ice low kicks off a cascade of tipping points. New Sci. 2013, 217, 6–7. [Google Scholar] [CrossRef]
- Parkinson, C.L.; Comiso, J.C. On the 2012 record low Arctic sea ice cover: Combined impact of preconditioning and an August storm. Geophys. Res. Lett. 2013, 40, 1356–1361. [Google Scholar] [CrossRef]
- Wang, Q.; Danilov, S.; Jung, T.; Kaleschke, L.; Wernecke, A. Sea ice leads in the Arctic Ocean: Model assessment, interannual variability and trends. Geophys. Res. Lett. 2016, 43, 7019–7027. [Google Scholar] [CrossRef]
- Hui, F.; Zhao, T.; Li, X.; Shokr, M.; Heil, P.; Zhao, J.; Zhang, L.; Cheng, X. Satellite-Based Sea Ice Navigation for Prydz Bay, East Antarctica. Remote Sens. 2017, 9, 518. [Google Scholar] [CrossRef]
- Hakkinen, S.; Proshutinsky, A.; Ashik, I. Sea ice drift in the Arctic since the 1950s. Geophys. Res. Lett. 2008, 35, 19704. [Google Scholar] [CrossRef]
- Hirano, D.; Fukamachi, Y.; Watanabe, E.; Ohshima, K.I.; Iwamoto, K.; Mahoney, A.R.; Eicken, H.; Simizu, D.; Tamura, T. A wind-driven, hybrid latent and sensible heat coastal polynya off Barrow, Alaska. J. Geophys. Res. Ocean. 2016, 121, 980–997. [Google Scholar] [CrossRef]
- Alam, A. Determination of surface turbulent fluxes over leads in Arctic sea ice. J. Geophys. Res. C Ocean. 1997, 102, 3331–3343. [Google Scholar] [CrossRef]
- Andreas, E.L.; Murphy, B. Bulk Transfer Coefficients for Heat and Momentum over Leads and Polynyas. J. Phys. Oceanogr. 1986, 16, 1875–1883. [Google Scholar] [CrossRef]
- Marcq, S.; Weiss, J. Influence of sea ice lead-width distribution on turbulent heat transfer between the ocean and the atmosphere. Cryosphere 2012, 6, 143–156. [Google Scholar] [CrossRef]
- Worby, A.P.; Allison, I. Ocean-atmosphere energy exchange over thin, variable concentration Antarctic pack ice. Ann. Glaciol. 1991, 15, 184–190. [Google Scholar] [CrossRef][Green Version]
- Maykut, G.A. Large-scale heat exchange and ice production in the central Arctic. J. Geophys. Res. 1982, 87, 7971. [Google Scholar] [CrossRef]
- Röhrs, J.; Kaleschke, L. An algorithm to detect sea ice leads by using AMSR-E passive microwave imagery. Cryosphere 2012, 6, 343–352. [Google Scholar] [CrossRef]
- Heorton, H.D.B.S.; Radia, N.; Feltham, D.L. A Model of Sea Ice Formation in Leads and Polynyas. J. Phys. Oceanogr. 2017, 47, 1701–1718. [Google Scholar] [CrossRef]
- National Research Council. Earth Science and Applications from Space: National Imperatives for the Next Decade and Beyond; National Academies Press: Washington, DC, USA, 2007. [Google Scholar]
- Hall, D.K.; Riggs, G.A.; Salomonson, V.V. MODIS Snow and Sea Ice Products. In Earth Science Satellite Remote Sensing; Springer: Berlin/Heidelberg, Germany, 2006; pp. 154–181. [Google Scholar]
- Willmes, S.; Heinemann, G. Sea-Ice Wintertime Lead Frequencies and Regional Characteristics in the Arctic, 2003–2015. Remote Sens. 2016, 8, 4. [Google Scholar] [CrossRef]
- Hoffman, J.; Ackerman, S.; Liu, Y.; Key, J. The Detection and Characterization of Arctic Sea Ice Leads with Satellite Imagers. Remote Sens. 2019, 11, 521. [Google Scholar] [CrossRef]
- Lindsay, R.W.; Rothrock, D.A. Arctic sea ice leads from advanced very high resolution radiometer images. J. Geophys. Res. 1995, 100, 4533. [Google Scholar] [CrossRef]
- Li, L.; Changqing, K.E.; Xie, H.; Ruibo, L.; Anqi, T. Aerial observations of sea ice and melt ponds near the North Pole during CHINARE2010. Acta Oceanol. Sin. 2017, 36, 64–72. [Google Scholar] [CrossRef]
- Sha, D.; Miao, X.; Xu, M.; Yang, C.; Xie, H.; Mestas-Nuñez, A.M.; Li, Y.; Liu, Q.; Yang, J. An On—Demand Service for Managing and Analyzing Arctic Sea Ice High Spatial Resolution Imagery. Data 2020, 5, 39. [Google Scholar] [CrossRef]
- Onana, V.-D.-P.; Kurtz, N.T.; Farrell, S.L.; Koenig, L.S.; Studinger, M.; Harbeck, J.P. A Sea-Ice Lead Detection Algorithm for Use With High-Resolution Airborne Visible Imagery. IEEE Trans. Geosci. Remote Sens. 2013, 51, 38–56. [Google Scholar] [CrossRef]
- Miao, X.; Xie, H.; Ackley, S.F.; Perovich, D.K.; Ke, C. Object-based detection of Arctic sea ice and melt ponds using high spatial resolution aerial photographs. Cold Reg. Sci. Technol. 2015, 119, 211–222. [Google Scholar] [CrossRef]
- Wright, N.C.; Polashenski, C.M. Open-source algorithm for detecting sea ice surface features in high-resolution optical imagery. Cryosphere 2018, 12, 1307–1329. [Google Scholar] [CrossRef]
- Wright, N.C.; Polashenski, C.M.; Mcmichael, S.T.; Beyer, R.A. Observations of sea ice melt from Operation IceBridge imagery. Cryosphere 2020, 14, 3523–3536. [Google Scholar] [CrossRef]
- Dominguez, R. IceBridge DMS L1B Geolocated and Orthorectified Images; National Snow and Ice Data Center: Boulder, CO, USA, 2010. [Google Scholar]
- Markus, T.; Comiso, J.C.; Meier, W.N. AMSR-E/AMSR2 Unified L3 Daily 25 km Brightness Temperatures & Sea Ice Concentration Polar Grids, Version 1; NASA National Snow and Ice Data Center Distributed Active Archive Center: Boulder, CO, USA, 2018. [Google Scholar]
- Meier, W.N.; Markus, T.; Comiso, J.; Ivanoff, A.; Miller, J. Amsr2 Sea Ice Algorithm Theoretical Basis Document; NASA Goddard Space Flight Center: Greenbelt, MD, USA, 2017. [Google Scholar]
- Markus, T.; Cavalieri, D.J. An enhancement of the NASA Team sea ice algorithm. IEEE Trans. Geosci. Remote Sens. 2000, 38, 1387–1398. [Google Scholar] [CrossRef]
- Markus, T.; Cavalieri, D. The AMSR-E NT2 Sea Ice Concentration Algorithm: Its Basis and Implementation. J. Remote Sens. Soc. Jpn. 2009, 29, 216–225. [Google Scholar] [CrossRef]
- Kurtz, N.T.; Farrell, S.L.; Studinger, M.; Galin, N.; Harbeck, J.P.; Lindsay, R.; Onana, V.D.; Panzer, B.; Sonntag, J.G. Sea ice thickness, freeboard, and snow depth products from Operation IceBridge airborne data. Cryosphere 2013, 7, 1035–1056. [Google Scholar] [CrossRef]
- Wang, X.; Guan, F.; Liu, J.; Xie, H.; Ackley, S. An improved approach of total freeboard retrieval with IceBridge Airborne Topographic Mapper (ATM) elevation and Digital Mapping System (DMS) images. Remote Sens. Environ. 2016, 184, 582–594. [Google Scholar] [CrossRef]
- Tschudi, M.; Meier, W.N.; Stewart, J.S.; Fowler, C.; Maslanik, J. Polar Pathfinder Daily 25 km EASE-Grid Sea Ice Motion Vectors, Version 4; NASA National Snow and Ice Data Center Distributed Active Archive Center: Boulder, CO, USA, 2019. [Google Scholar] [CrossRef]
- Aaboe, S.; Down, E.J.; Eastwood, S. Product User Manual for the Global Sea-Ice Edge and Type Product; Norwegian Meteorological Institute: Oslo, Norway, 2021. [Google Scholar]
- NSIDC. IceBridge Sea Ice Freeboard, Snow Depth, and Thickness Quick Look, Version 1. Available online: https://nsidc.org/data/NSIDC-0708/versions/1 (accessed on 16 September 2021).
- Molinari, R.; Kirwan, A.D. Calculations of Differential Kinematic Properties from Lagrangian Observations in the Western Caribbean Sea. J. Phys. Oceanogr. 1975, 5, 483–491. [Google Scholar] [CrossRef]
- Wilkinson, L. Tests of significance in stepwise regression. Psychol. Bull. 1979, 86, 168–174. [Google Scholar] [CrossRef]
- Qu, M.; Pang, X.; Zhao, X.; Lei, R.; Ji, Q.; Liu, Y.; Chen, Y. Spring leads in the Beaufort Sea and its interannual trend using Terra/MODIS thermal imagery. Remote Sens. Environ. 2021, 256, 112342. [Google Scholar] [CrossRef]
- Lee, S.; Kim, H.; Im, J. Arctic lead detection using a waveform mixture algorithm from CryoSat-2 data. Cryosphere 2018, 12, 1665–1679. [Google Scholar] [CrossRef]
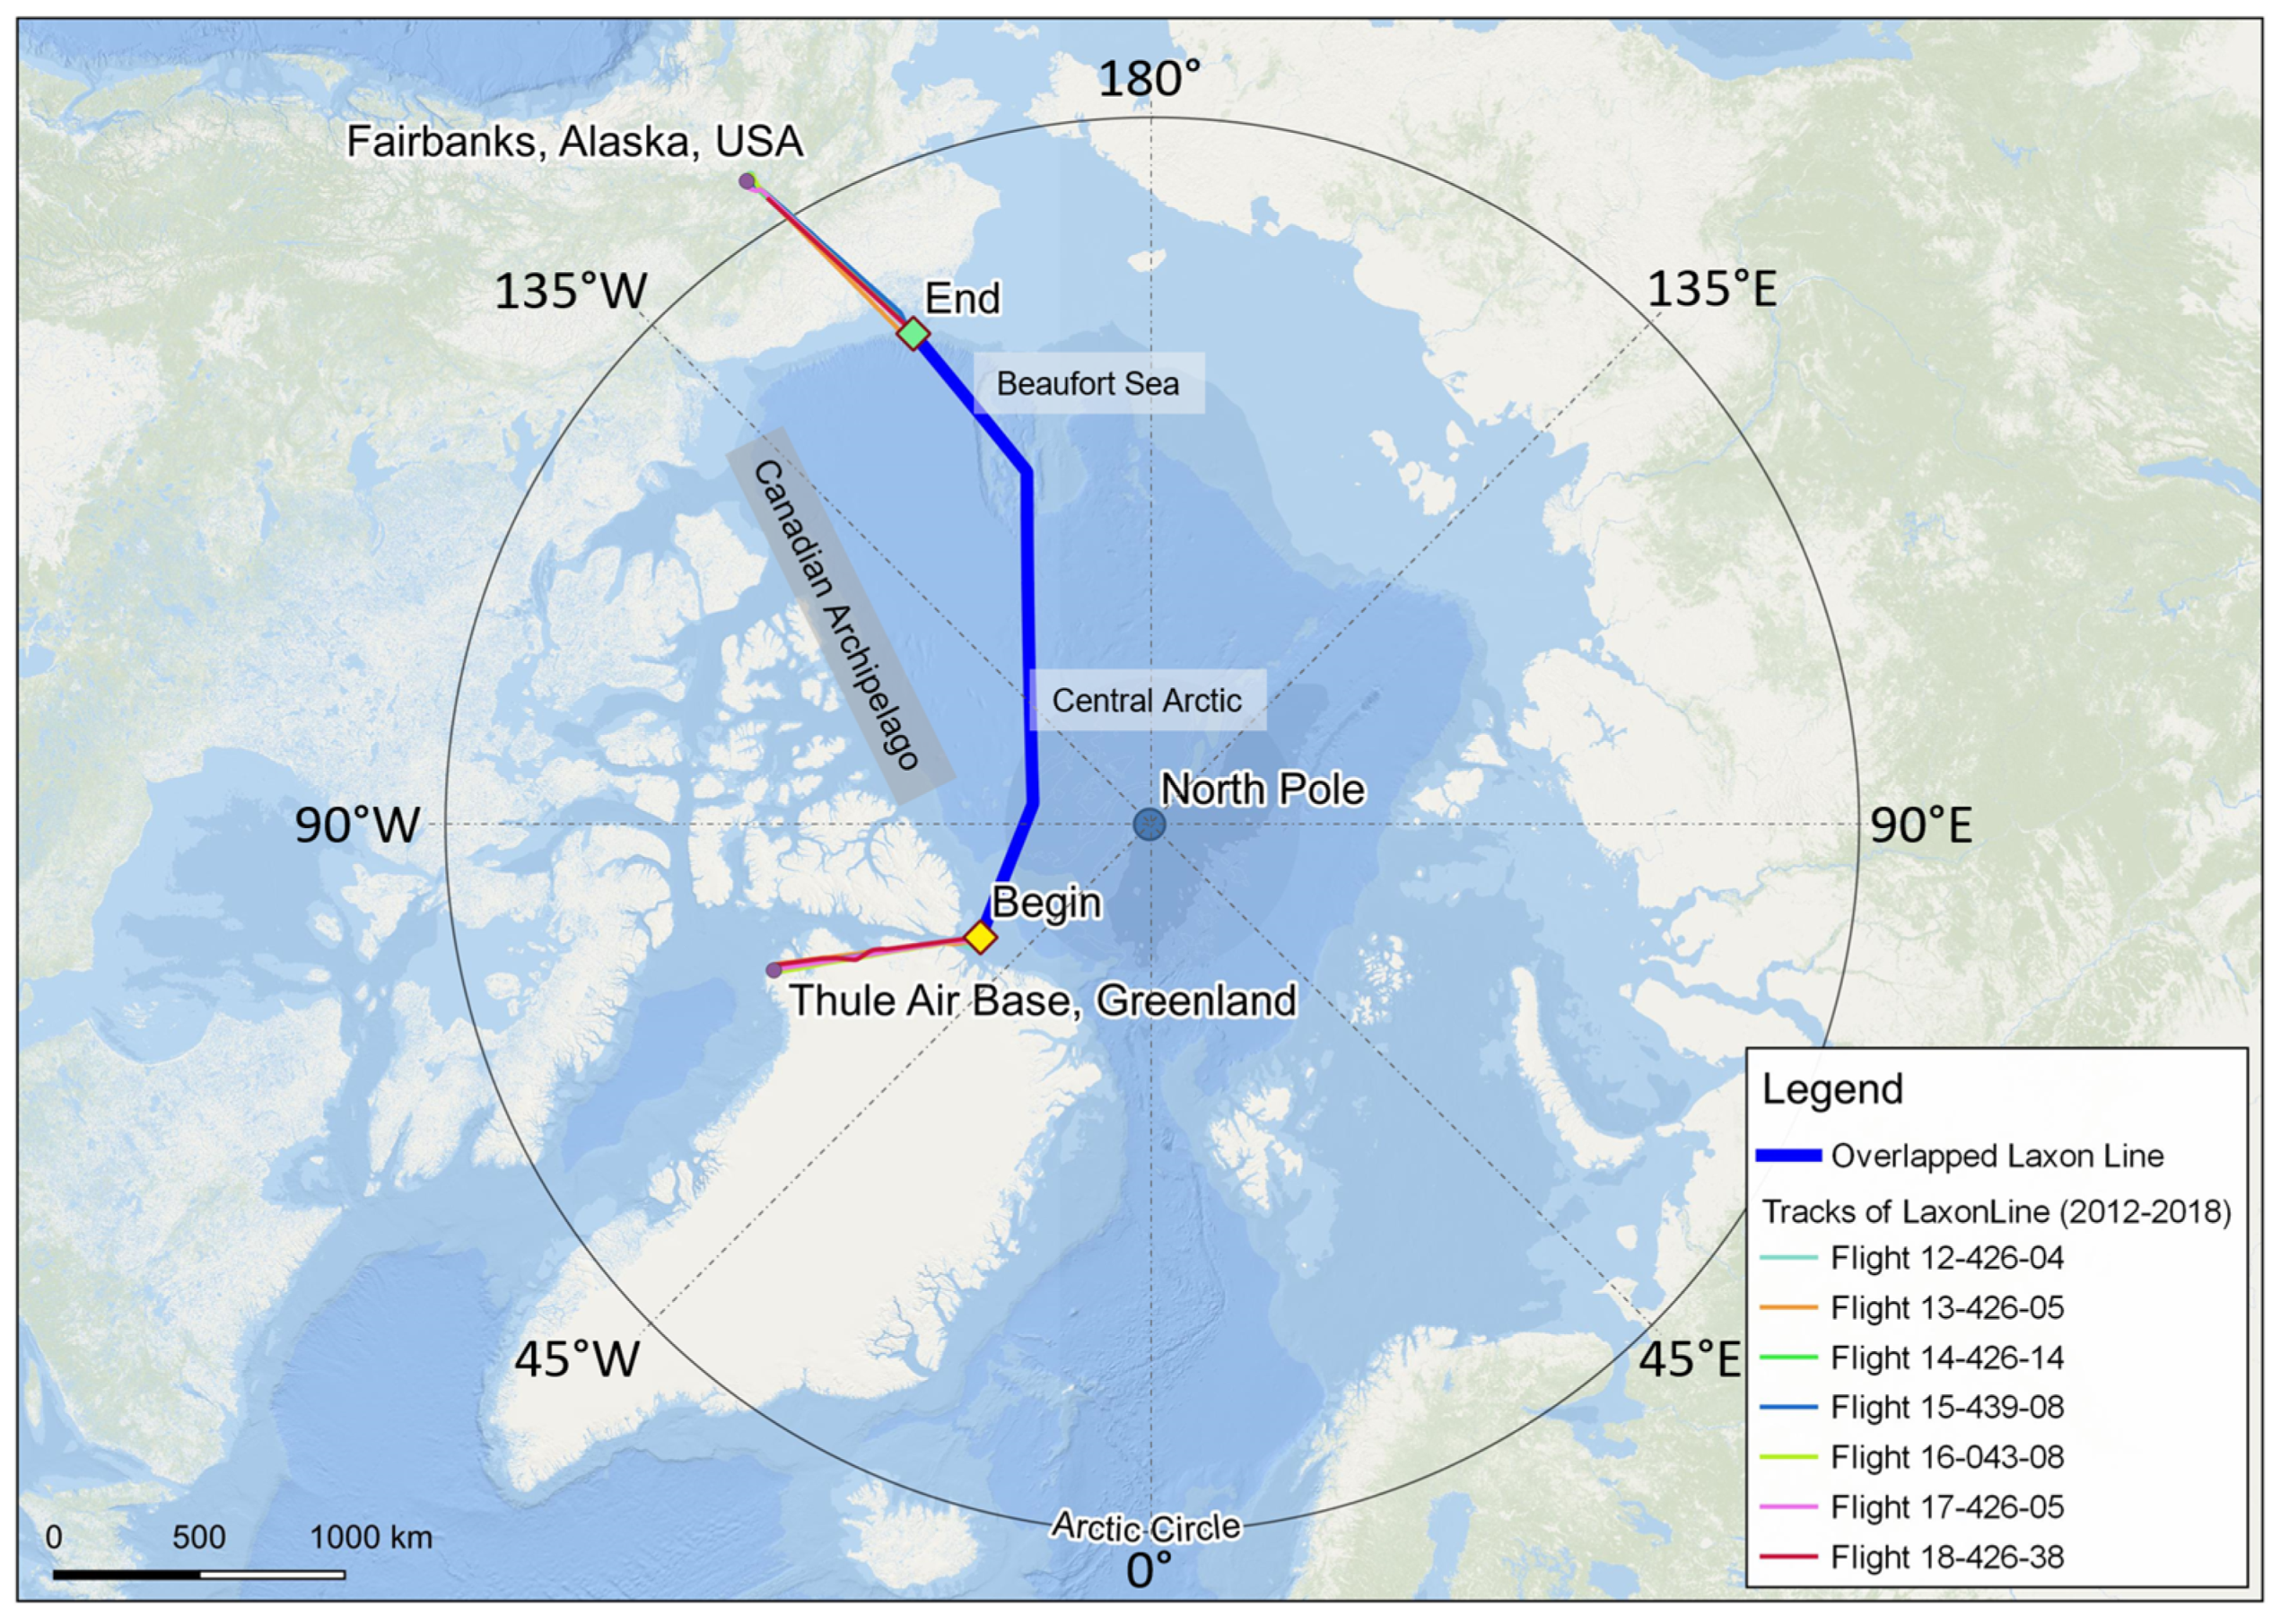



| Name | Date | Image # | # Image with Sea Ice Leads | Selected/Original Image Size (GB) | Lighting Condition |
|---|---|---|---|---|---|
| Flight 12-426-04 | 14 March 2012 | 16,544 | 1066 | 14.8/260 | Cloudy |
| Flight 13-426-05 | 21 March 2013 | 18,480 | 993 | 13.8/290 | Normal |
| Flight 14-426-14 | 14 March 2014 | 14,322 | 492 | 5.2/150 | Cloudy |
| Flight 15-439-08 | 26 March 2015 | 20,038 | 816 | 9.3/250 | Normal |
| Flight 16-043-08 | 20 April 2016 | 15,205 | 1069 | 18.4/270 | Normal |
| Flight 17-426-05 | 10 March 2017 | 10,939 | 659 | 8.67/93 | Cloudy |
| Flight 18-426-38 | 6 April 2018 | 11,146 | 1040 | 22.2/240 | Normal |
| Product Name | Type | Source | Spatial Resolution | Category |
|---|---|---|---|---|
| AMSR-E/AMSR2 Unified L3 Daily Brightness Temperatures & Sea Ice Concentration | Passive microwave | NSIDC | 25 km | Sea Ice |
| IceBridge Airborne Topographic Mapper (ATM) | Laser altimeter | NSIDC | ~1 m footprint (resampled to 2 m grid) | Sea Ice |
| Global sea ice type | Sea ice type | EUMETSAT OSI SAF | 10 km | Sea Ice |
| Polar Pathfinder Daily EASE-Grid Sea Ice Motion Vectors | Sea ice motion | NSIDC | 25 km | Dynamic |
| ERA5 (air temperature and wind velocity) | Climate reanalysis | European Centre for Medium-Range Weather Forecasts (ECMWF) | 0.25° | Dynamic and thermodynamic |
| Testing Group | # Training Image | # Training Object | # Test Image | # Test object |
|---|---|---|---|---|
| DMS2012_normal | 6 | 50 | 5 | 114 |
| DMS2012_medium | 7 | 90 | 5 | 94 |
| DMS2012_ poor | 7 | 65 | 5 | 124 |
| DMS2013 | 13 | 196 | 7 | 221 |
| DMS2014_normal | 8 | 106 | 6 | 178 |
| DMS2014_medium | 6 | 66 | 6 | 119 |
| DMS2015 | 11 | 150 | 9 | 254 |
| DMS2016 | 8 | 144 | 12 | 444 |
| DMS2017 | 12 | 140 | 6 | 150 |
| DMS2018 | 13 | 135 | 9 | 319 |
| Department | Factors | Description |
|---|---|---|
| Sea Ice Leads | mean_leads | Mean lead fraction for 25 km segment |
| Temperature | tmpXX | Averaged air temperature for last XX days (e.g., tmp03 means average temperature of last 1, 2, 3 days) |
| Wind | U10_XX | Averaged u-component of wind velocity for last XX days |
| V10_XX | Averaged v-component of wind velocity for last XX days | |
| wind_XX | Averaged wind velocity for last XX days (e.g., wind_10 means wind velocity for last 10 days) | |
| Sea Ice Motion | u_ice_XX | Averaged u-component of ice velocity for last XX days (e.g., u_ice_10 means u-velocity for last 10 days) |
| v_ice_XX | Averaged v-component of ice velocity for last XX days (e.g., v_ice_10 means v-velocity for last 10 days) | |
| vel_ice_XX | Averaged ice velocity for last XX days (e.g., v_ice_10 means ice velocity for last 10 days) | |
| divXX | Averaged divergence of sea ice motion for last XX days (e.g., div10 means divergence for last 10 days) | |
| vorXX | Averaged vorticity of sea ice motion for last XX days (e.g., vor10 means vorticity for last 10 days) | |
| shrXX | Averaged shearing deformation of sea ice motion for last XX days (e.g., shr10 means shearing deformation for last 10 days) | |
| stcXX | Averaged stretching deformation of sea ice motion for last XX days (e.g., stc10 means stretching deformation for last 10 days) |
| Sample Result 1 | Sample Result 2 | |||
|---|---|---|---|---|
| Raw Image | Classified Result | Raw Image | Classified Result | |
| Normal |  |  | 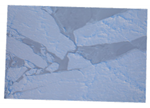 | 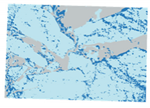 |
| Medium | 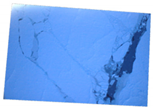 | 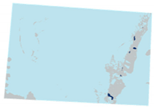 | 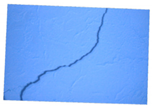 | 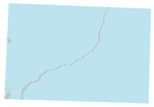 |
| Poor | 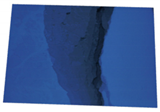 | 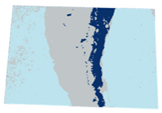 | 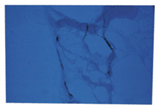 | 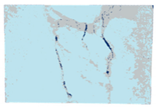 |
 | ||||
| Testing Group | Overall Accuracy | Kappa Coef. | UA_Thick ** | UA_Thin | UA_Shadow | UA_Water | PA_Thick ** | PA_Thin | PA_Shadow | PA_Water |
|---|---|---|---|---|---|---|---|---|---|---|
| DMS2012_normal | 88.9 | 0.83 | 88.0 | 91.7 | 83.8 | nan * | 98.4 | 94.2 | 63.8 | nan |
| DMS2012_medium | 93.6 | 0.85 | 97.3 | 85.0 | nan | 95.5 | 93.8 | 93.1 | nan | 97.5 |
| DMS2012_poor | 93.8 | 0.86 | 95.0 | 96.0 | nan | 61.9 | 98.9 | 81.2 | nan | 94.9 |
| DMS2013 | 96.4 | 0.95 | 92.2 | 100.0 | 99.4 | 95.5 | 99.7 | 96.5 | 88.3 | 99.9 |
| DMS2014_normal | 88.0 | 0.82 | 74.7 | 86.2 | 93.9 | 98.0 | 97.1 | 81.3 | 99.7 | 89.0 |
| DMS2014_medium | 93.7 | 0.89 | 91.7 | 96.3 | nan | 97.1 | 100.0 | 75.7 | nan | 97.1 |
| DMS2015 | 86.4 | 0.78 | 86.6 | 83.5 | 98.6 | 93.4 | 99.8 | 80.9 | 82.2 | 57.9 |
| DMS2016 | 87.9 | 0.83 | 82.1 | 89.3 | 95.0 | 95.7 | 99.4 | 68.8 | 89.7 | 90.2 |
| DMS2017 | 86.7 | 0.75 | 87.4 | 82.8 | nan | 99.4 | 97.6 | 76.5 | nan | 60.7 |
| DMS2018 | 93.5 | 0.88 | 91.9 | 96.5 | 95.2 | 97.9 | 98.5 | 79.1 | 89.4 | 98.4 |
| Average Accuracy | 90.9 | 0.84 | 88.7 | 90.7 | 94.3 | 92.7 | 98.3 | 82.7 | 85.5 | 87.3 |
| Year | FYI | MYI | Total |
|---|---|---|---|
| 2013 | 0.263 | 0.519 | 0.409 |
| 2014 | 0.277 | 0.339 | 0.320 |
| 2015 | 0.275 | 0.470 | 0.407 |
| 2016 | 0.335 | 0.398 | 0.354 |
| 2017 | 0.211 | 0.467 | 0.366 |
| 2018 | 0.320 | 0.505 | 0.414 |
| Year | R | RMSD (m) |
|---|---|---|
| 2013 | 0.928 | 0.089 |
| 2014 | 0.907 | 0.063 |
| 2015 | 0.755 | 0.140 |
| 2016 | 0.784 | 0.114 |
| 2017 | 0.742 | 0.119 |
| 2018 | 0.869 | 0.082 |
| Total | 0.832 | 0.105 |
| Year | Approach | R2 | Tmp10 | U10_10 | V10 _10 | Wind_10 | U_Ice_10 | V_Ice_10 | Vel_Ice_10 | Div10 | Vor10 | Shr10 | Stc10 | Constant |
|---|---|---|---|---|---|---|---|---|---|---|---|---|---|---|
| 2012 | Forward | 0.26 | / | / | / | / | −0.39 | −0.38 | 0.16 | −0.10 | −0.08 | / | / | 0.41 |
| Backward | 0.26 | 0.10 | / | / | / | −0.34 | −0.19 | / | −0.12 | / | / | / | 0.31 | |
| 2013 | Forward | 0.48 | −1.19 | / | / | 0.35 | −6.46 | −2.78 | 9.51 | / | −0.01 | −0.14 | / | 0.60 |
| Backward | 0.48 | −1.18 | / | / | 0.35 | −6.44 | −2.75 | 9.45 | / | / | −0.15 | / | 0.08 | |
| 2014 | Forward | 0.87 | 4.61 | −5.60 | −0.97 | 1.09 | 1.24 | 15.31 | −12.98 | / | 0.89 | −0.55 | / | −2.08 |
| Backward | 0.87 | 4.64 | −5.37 | / | / | 1.16 | 13.34 | −11.25 | −0.16 | 0.87 | −0.59 | / | −1.94 | |
| 2015 | Forward | 0.34 | / | / | −0.53 | / | −1.35 | / | 1.19 | 0.15 | 0.14 | 0.28 | −0.33 | 0.40 |
| Backward | 0.34 | / | / | −0.53 | / | −1.35 | / | 1.19 | 0.15 | 0.14 | 0.28 | −0.33 | 0.40 | |
| 2016 | Forward | 0.29 | / | −0.79 | / | / | / | / | 0.29 | 0.30 | −0.39 | 0.57 | 0.15 | 0.21 |
| Backward | 0.34 | 0.67 | −4.62 | −0.53 | 4.09 | / | / | / | / | −0.36 | 0.46 | / | 0.22 | |
| 2017 | Forward | 0.66 | −1.17 | −6.54 | −3.08 | 6.77 | 2.98 | −0.09 | −2.01 | −0.19 | / | / | / | 1.50 |
| Backward | 0.66 | −1.15 | −6.57 | −3.11 | 6.86 | 3.02 | / | −2.09 | −0.19 | / | / | / | 1.45 | |
| 2018 | Forward | 0.30 | 0.34 | −1.40 | −1.40 | 1.83 | / | / | / | / | −0.03 | / | −0.31 | 0.45 |
| Backward | 0.30 | 0.34 | −1.31 | −1.33 | 1.72 | / | / | / | / | / | / | −0.32 | 0.42 |
Publisher’s Note: MDPI stays neutral with regard to jurisdictional claims in published maps and institutional affiliations. |
© 2021 by the authors. Licensee MDPI, Basel, Switzerland. This article is an open access article distributed under the terms and conditions of the Creative Commons Attribution (CC BY) license (https://creativecommons.org/licenses/by/4.0/).
Share and Cite
Sha, D.; Koo, Y.; Miao, X.; Srirenganathan, A.; Lan, H.; Biswas, S.; Liu, Q.; Mestas-Nuñez, A.M.; Xie, H.; Yang, C. Spatiotemporal Analysis of Sea Ice Leads in the Arctic Ocean Retrieved from IceBridge Laxon Line Data 2012–2018. Remote Sens. 2021, 13, 4177. https://doi.org/10.3390/rs13204177
Sha D, Koo Y, Miao X, Srirenganathan A, Lan H, Biswas S, Liu Q, Mestas-Nuñez AM, Xie H, Yang C. Spatiotemporal Analysis of Sea Ice Leads in the Arctic Ocean Retrieved from IceBridge Laxon Line Data 2012–2018. Remote Sensing. 2021; 13(20):4177. https://doi.org/10.3390/rs13204177
Chicago/Turabian StyleSha, Dexuan, Younghyun Koo, Xin Miao, Anusha Srirenganathan, Hai Lan, Shorojit Biswas, Qian Liu, Alberto M. Mestas-Nuñez, Hongjie Xie, and Chaowei Yang. 2021. "Spatiotemporal Analysis of Sea Ice Leads in the Arctic Ocean Retrieved from IceBridge Laxon Line Data 2012–2018" Remote Sensing 13, no. 20: 4177. https://doi.org/10.3390/rs13204177
APA StyleSha, D., Koo, Y., Miao, X., Srirenganathan, A., Lan, H., Biswas, S., Liu, Q., Mestas-Nuñez, A. M., Xie, H., & Yang, C. (2021). Spatiotemporal Analysis of Sea Ice Leads in the Arctic Ocean Retrieved from IceBridge Laxon Line Data 2012–2018. Remote Sensing, 13(20), 4177. https://doi.org/10.3390/rs13204177


