Article

Monitoring the Severity of Pantana phyllostachysae Chao on Bamboo Using Leaf Hyperspectral Data

1
International Institute for Earth System Science, Nanjing University, Nanjing 210023, China
2
Research Center of Geography and Ecological Environment, Fuzhou University, Fuzhou 350108, China
*
Author to whom correspondence should be addressed.
Remote Sens. 2021, 13(20), 4146; https://doi.org/10.3390/rs13204146
Submission received: 31 August 2021 / Revised: 30 September 2021 / Accepted: 12 October 2021 / Published: 16 October 2021

Abstract

:
Effectively monitoring Pantana phyllostachysae Chao (PPC) is essential for the sustainable development of the bamboo industry. However, the morphological similarity between damaged and off-year bamboo imposes challenges in the monitoring. The knowledge on whether the severity of this pest could be effectively monitored by using remote sensing methods is very limited. To fill this gap, this study aimed to identify the PPC damage of moso bamboo leaves using hyperspectral data. Specifically, we investigated differences in relative chlorophyll content (RCC), leaf water content (LWC), leaf nitrogen content (LNC), and hyperspectral spectrum among healthy, damaged (mildly damage, moderately damage, severely damage), and off-year bamboo leaves. Then, the hyperspectral indices sensitive to pest damage were selected by recursive feature elimination (RFE). The PPC damage identification model was constructed using the light gradient boosting machine (LightGBM) algorithm. We designed two different scenarios, without (A) and with (B) off-year samples, to evaluate the impact of off-year leaves on identification results. The RCC, the LWC, and the LNC of damaged leaves generally showed clear declined trends with the deterioration of damaged severity. The RCC and the LNC of off-year leaves were significantly lower than those of healthy and damaged leaves, whereas the LWC of off-leaves was significantly different from that of damaged leaves. The pest infestation caused noticeable distortion of leaf spectrum, increases in red and shortwave infrared bands, and decreases in green and near-infrared bands. The magnitude of reflectance change increased with the pest severity. The reflectance of off-year leaves in visible and near-infrared regions was distinguishably higher than that of healthy and damaged leaves. The overall accuracy (OA) of the constructed model for the identification of leaves with different degrees of damage severity reached 81.51%. When off-year, healthy, and damaged leaves were lumped together, the OA of the constructed model decreased by 5%. About half of the off-year leaf samples were misclassified into the damaged group. The identification of off-year leaves is a challenge for monitoring PPC damage using hyperspectral data. These results can provide practical guidance for monitoring PPC using remote sensing methods.

1. Introduction

China has the most abundant bamboo resources in the world and is known as the “bamboo civilized country” [1]. According to the Ninth National Forest Inventory from 2014 to 2018, the area of bamboo forest in China amounts to 6.4 million hm2, accounting for about 3% of the total forest area, and is still rapidly expanding [2]. Since the ecological pressure on forests is increasingly rising and leading to the scarcity of timber resources, bamboo has been regarded as a fine substitute of traditional timber. Among numerous bamboo species, moso bamboo (Phyllostachys pubescens) has the longest cultivation history and the widest distribution area, accounting for about 70% of the total bamboo forest area in China [3]. With the advantages of its rapid growth and high utilization rate, moso bamboo has become the most important ecological and economic bamboo species. However, due to its clonal and invasive growth pattern as well as the irrational silviculture measures, the pure forest rate of moso bamboo is continuously rising. Single species composition has seriously affected the forest biodiversity, leading to frequent occurrence of various kinds of insect disturbance events.
Pantana phyllostachysae Chao (PPC) is one of the most destructive defoliators of bamboo forest [4]. When it outbreaks, the population density of its larvae (caterpillars) could reach 2000 per tree and cause wide defoliation. The residual leaves of damaged bamboo are withered and yellow, which appear to be burned. Therefore, this forest pest is well known as the “forest fire without smoke”. Furthermore, the new bamboos in damaged areas are thin, and their material becomes brittle. Consequently, the ecological and the economic values greatly decrease. Although the local government and foresters have made great efforts to control this pest, the annual disaster area is still high. Therefore, timely monitoring of the occurrence and the severity of this pest is the prerequisite for effectively alleviating its damage.
PPC initially occurs on the hillside or the foot of a mountain with leeward and sunny areas. When the numerous larvae hatch, they spread from the source area quickly [5,6]. The damaged area is usually located in deep mountainous forest regions, which makes its field monitoring difficult and costly. In recent decades, remote sensing has gradually become a powerful tool for monitoring forest disturbances [7]. Remote sensing can provide abundant information for locating pest occurrence spots and assessing its severity. However, most previous studies on PPC were still limited to its biological characteristics and physicochemical control measures [8,9]. A few studies tried to explore its occurrence mechanism and spatial distribution pattern using remote sensing and geographic information system techniques [10,11]. However, the achievements of these studies were still unable to satisfy the needs of ecological security monitoring of bamboo forests. Applicable monitoring approaches based on remote sensing are urgently needed to combat the increasing threat of PPC.
Comprehensive understanding of host characterization changes and selecting effective monitoring indicators are the foundation for monitoring PPC [12,13]. Initially, the most intuitive characterization change of host bamboo is defoliation. When the defoliation amount exceeds a certain threshold, the nutrient supply system of host bamboo gradually collapses. The residual and the new leaves in the damaged canopy display visibly pathological symptoms, e.g., hydroponic, chlorosis, that can be directly detected in the spectral information [14]. The spectrum is the basic information of optical remote sensing, which is currently one of the most widely used data methods for the assessment of vegetation health with advantages of being fast and non-destructive. Especially, hyperspectral data, which can sensitively perceive the changes of vegetation structure and pigments with continuous narrowband spectral information, has become a powerful tool to delineate the host characterization at different stress levels [15,16,17].
The growth process of moso bamboo has the phenomenon of on- and off-years. Normally, the on-year is the period between the end of leaf change stage (i.e., April–May) of moso bamboo and the shoots yield stage in the following spring. The external morphology of bamboo’s canopy during this period is thick and lush. The off-year is the period from the end of shoots yield stage to the leaf change stage in the following year, in which there are no shoots yield. Since most nutrients of maternal bamboo are served for rhizome growth [18], the canopy of off-year bamboo displays several characteristics during this period, e.g., defoliation, discoloration, with morphology very similar to that of the pest damaged bamboo. The physiological status of off-year bamboo is noticeably different from that of healthy on-year bamboo. The spectrums of off-year and on-year bamboo are distinguishable. However, the spectral difference between off-year and damaged bamboo is still poorly understood.
The primary objective of this research was to explore the physiological (e.g., chlorophyll, water, nitrogen, and spectrum) differences among healthy, damaged, and off-year bamboo leaves and to propose a model for identifying PPC damaged severity. Specifically, we discussed the following questions: (1) What are the differences in nutrients contents of healthy, damaged and off-year leaves? (2) Are hyperspectral data able to identify PPC damage? (3) Will off-year leaves affect the identification results?

2. Materials and Methods

2.1. Study Area

The study area is located in Shunchang county of Fujian Province, China (117°29′–118°14′E, 26°38′–27°12′N; Figure 1). The whole county covers an area of about 1985 km2 and the terrain here is mainly mountainous and hilly. The area has a subtropical marine monsoon climate with distinct alternation of dry and wet seasons. Annual mean temperature is about 19 °C, and annual precipitation is approximately 1747.9 mm.
The forest coverage rate of Shunchang county is nearly 80%. The forest types of the study area include broadleaf (e.g., Ginkgo biloba, Eucalyptus grandis), coniferous (e.g., Cunninghamia lanceolata, Pinus massoniana), and moso bamboo. The area of moso bamboo forest is approximately 4.21 × 10⁴ ha, accounting for 21.8% of the total forest area [19]. Therefore, Shunchang county was selected as the first batch of “the bamboo town of China”. Moso bamboo is an evergreen tree species with a unique on- and off-year phenomenon. The stand structure of moso bamboo forest is relatively simple due to its growth pattern and economic forest attribute [20,21]. Unlike other tree species, new bamboo shoots can grow rapidly into young bamboo in about 40–60 days. The increases of height, crown width, and diameter at breast height are finalized in the first year [22,23].
According to the statistical data from the local forestry department, annual occurrence area of various kinds of forest pests was about 3.33 × 10⁴ ha during the recent decade, resulting in huge economic and ecological losses. Previous studies declared that the occurrence of PPC is highly related to climate of the habitat [5,24]. Warm and moist environments are favorable to the occurrence and the outbreak of PPC. A warm winter might induce PPC outbreak. Both amount and intensity of precipitation affect the occurrence and the outbreak of PPC. The severity of PPC decreases with the increases of heavy rain events.

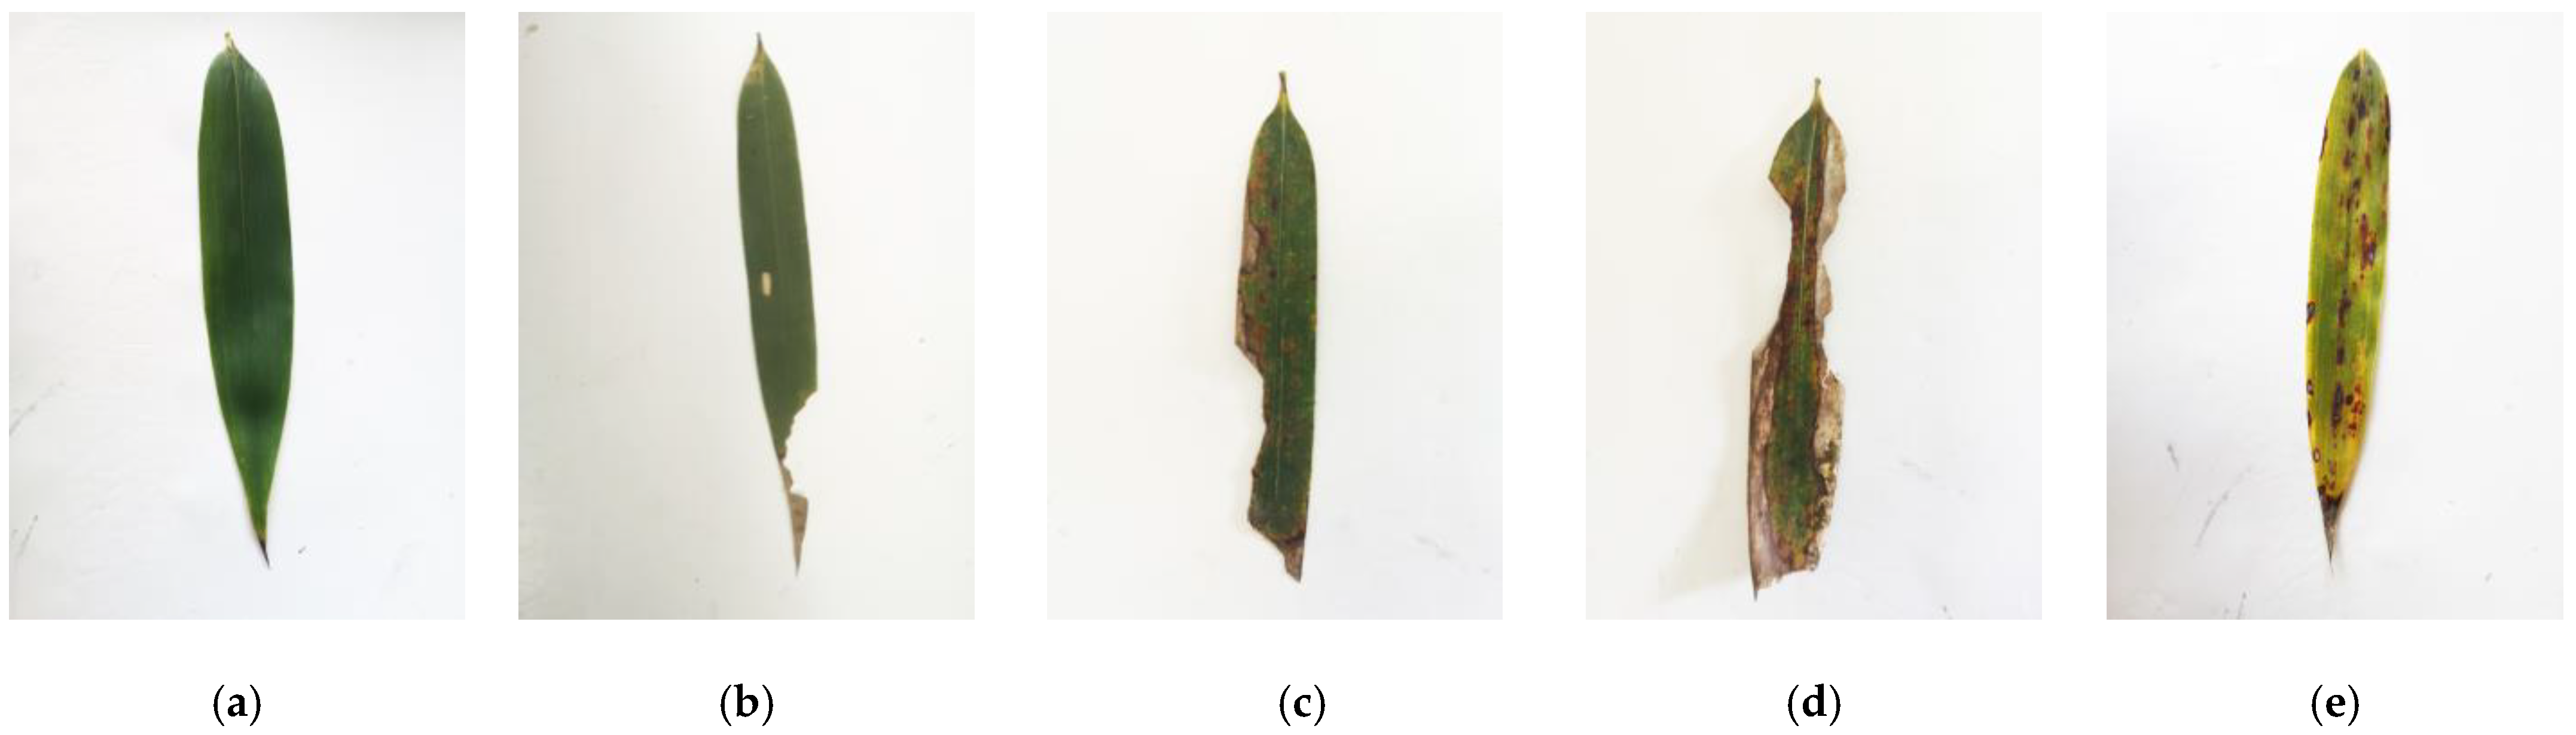
2.2. The Criteria of Pest Severity

Normally, PPC has three generations within a year in Fujian Province, including overwintering generation (i.e., from early March to late May), the first generation (i.e., from late June to late August), and the second generation (i.e., from mid-September to early October). The first generation of larvae is the most destructive one, resulting in the most visible defoliation in this period. Therefore, the field investigation and the data collection were conducted during 20–23 August 2019. We randomly sampled leaves from healthy, damaged, and off-year bamboo canopies at different altitude areas.
The leaf loss rate (LLR) was used as the criteria for severity determination of damaged leaf (healthy: [0%, 5%], mild damage: [5%, 25%], moderate damage: [25%, 50%], severe damage: 50%) (Figure 2). LLR was measured by the following steps: (1) each sample leaf was horizontally laid on a white reference board. (2) The picture of the selected leaf was taken using a digital camera, which was vertically downward fixed above the leaf. (3) Each leaf pixel was classified into non-damaged, indentation, or disease spots groups using AutoCAD 2008 and Photoshop CS5 software. (4) The total areas of indentation and disease spots of each leaf were calculated for determining LLR using Equation (1):
LLR = A LL A × 100 %
where ALL is the total area of indentation and disease spots of the leaf; A is the original leaf total area.
In order to calculate ALL and A, the shapes of damaged leaves were reconstructed. For the leaf with the basic shape retained, the edge gaps were manually filled. For a severely damaged leaf, the edge was manually restored with the nearest bamboo leaf without damage as the reference. The original leaf total area A was calculated according to the restored leaf edge. The area of indentation was calculated according to the ratio of gap pixels within the leaf edge to the total within the reference box. The disease spots were first visually determined, and then their total area was calculated in the same way for the indentation area (Figure 3). Finally, a total of 468 leaf samples were collected and targeted (healthy: 101, mildly damaged: 97, moderately damaged: 97, severely damaged: 103, off-year: 70).

2.3. Measurements and Analysis of Leaf Physicochemical Parameters

2.3.1. Leaf Reflectance Measurements

The leaf spectrum was taken using an ASD FieldSpec3 spectrometer coupled with an ASD Plant Probe (Analytical Spectral devices (ASD) Inc., Longmont, CO, USA). The spectrometer has 2151 bands that can sense the spectral information in the full range of solar irradiance spectrum (350–2500 nm) with the sampling intervals of 1.4 nm (350–1000 nm) and 2 nm (1001–2500 nm) and the resampled bandwidth of 1 nm. The ASD Plant Probe is equipped with a built-in lower intensity bulb for the spectral measurement of live vegetation. Its design of a closed chamber can minimize the interference of stray light from the external environment. The dark current correction was conducted before every measurement. The spectral record was the average of 5 scans. The scanning area included normal and damaged parts of the leaf, and the measurements were averaged to produce the spectrum of a leaf. All spectral raw data were preprocessed by the Savitzky–Golay smoothing algorithm (the polynomial order was 3, and the window width was 11) to minimize the influence of particle size, scattering, and collinearity [25].

2.3.2. Measurements and Analysis of Leaf Biochemical Factors

To explore factors driving the spectral distortion of damaged leaves, we measured relative chlorophyll content (RCC), leaf water content (LWC), and leaf nitrogen content (LNC) of 174 representative leaves.
Portable chlorophyll meters provide a convenient and non-destructive way to measure the RCC. The Soil Plant Analysis Development (SPAD) instrument (Minolta Camera Co., Osaka, Japan) has demonstrated excellent ability to measure RCC [26,27]. In this study, we used SPAD-502 plus to record SPAD values of upper, middle, and lower parts of each leaf, respectively. They were averaged as the RCC value of a leaf.
The fresh weight of each leaf was measured by an electronic scale in situ and then put into the sealed bag and taken back to the laboratory. The leaves were dried in an oven with air circulation for 30 min at 105 °C to deactivate the enzymes, then dried to constant weights at 80 °C. The dry weight of each leaf was recorded using the electronic scale and was used to calculate LWC:
LWC = ( FW DW ) FW × 100 %
where LWC is the leaf water content; FW and DW are fresh and dry weights of a leaf.
After the measurement of dry weight, each leaf sample was placed into a microcentrifuge tube and then ground into powder by a high-flux grinder (DHS v4800, DHS Life Science & Technology Co., Beijing, China). Finally, the nitrogen content of each leaf was obtained using an element analyzer [28,29,30] (Vario MICRO cube, Elementar Co., Langenselbold, Germany).
The difference of measured parameters among different severity groups was analyzed by means of one-way ANOVA. A significance level of 0.05 indicated a significant difference. A significance level of 0.01 indicated a very significant difference. The variance of measured parameters was examined before the difference analysis. When the variance of a test group was homogeneous, the least significant difference method (LSD) was applied to test the difference significance among severity factors, otherwise, we used the Tamhane’s T2. All the difference analysis processes were conducted using the Statistical Package for Social Sciences (IBM SPSS Statistics 22.0).

2.4. Indicators of Pest Severity

2.4.1. Hyperspectral Indices

It was demonstrated that the vegetation indices can be used to indicate the plant physiological status [31,32]. A total of 29 existing hyperspectral indices usable for indicating plant stress and nutrients content were selected as candidates for monitoring the physiological status of moso bamboo leaves (Table 1).

2.4.2. Feature Selection

The recursive feature elimination (RFE) algorithm was applied to search for the optimal feature combination to avoid invalid information during the model training process [55]. There are three key parameters in the RFE algorithm, which are “estimator”, “step”, and “n_features_to_select”. The “estimator” is the base evaluator of RFE to assess the performance of selected features (i.e., LightGBM was selected here, and its description is in Section 2.5). The “step” was set to 1, which means that the number of features added or removed during each iteration was 1. The “n_features_to_select” represents the number of features finally selected. We set the cycle of [1, 29] to determine the optimal number of features according to the accuracy of the model.

2.5. Development of Severity Identification Model

Light gradient boosting machine (LightGBM) was applied as a classifier to identify the leaf damage severity. The construction process was implemented on the Python 3.6.5 platform. LightGBM is an ensemble algorithm that is an improvement over GBDT (gradient boosting decision tree) [56]. It uses the gradient descent algorithm to continuously correct the deviation of the previous model through iteration until the simulation reaches the best. Compared with other GBDT-based algorithm, LightGBM has faster training speed and lower memory usage based on Gradient-based One-Side Sampling (GOSS) and Exclusive Feature Bundling (EFB) [57,58].
There are several critical parameters that can affect the model performance and need to be adjusted, including (1) num_leaves (i.e., maximum tree leaves for base learners, NL), (2) max_depth (i.e., maximum tree depth for base learners, MD), (3) learning_rate (i.e., boosting learning rate, LR), and (4) n_estimator (i.e., number of boosted trees to fit, NE). The greedy algorithm and 10-fold cross-validation (via GridSearchCV module from scikit-learn 0.19.1) were applied to determine the optimum hyper-parameters of LightGBM.

2.6. Model Accuracy Evaluation

We designed two experimental scenarios, i.e., scenario-A (identification objectives: H, Mi, Mo, S) and scenario-B (identification objectives: H, Mi, Mo, S, O), to assess the impact of off-year leaves on severity identification. Abbreviations H, Mi, Mo, S, and O denote healthy, mildly damaged, moderately damaged, severely damaged, and off-year leaves. For each scenario, the sample data were randomly split into the training set (70%) and the test set (30%). The training set served for model training. We employed 10-fold cross validation to test the robustness of the model. The test set was used to evaluate the extrapolation ability of the constructed model. The model performance was evaluated by the overall classification accuracy (OA) and the grading producer’s accuracy (GPA). They are calculated as:
OA = T a l l S a l l × 100 %
GPA = T i S i × 100 %
where Tall is the number of correctly classified samples; Sall is the number of all samples in the validation dataset; Ti is the number of correctly classified samples in one certain severity group; Si is the number of samples in this group.

3. Results

3.1. Physicochemical Differences among Healthy, Damaged, and Off-Year Leaves

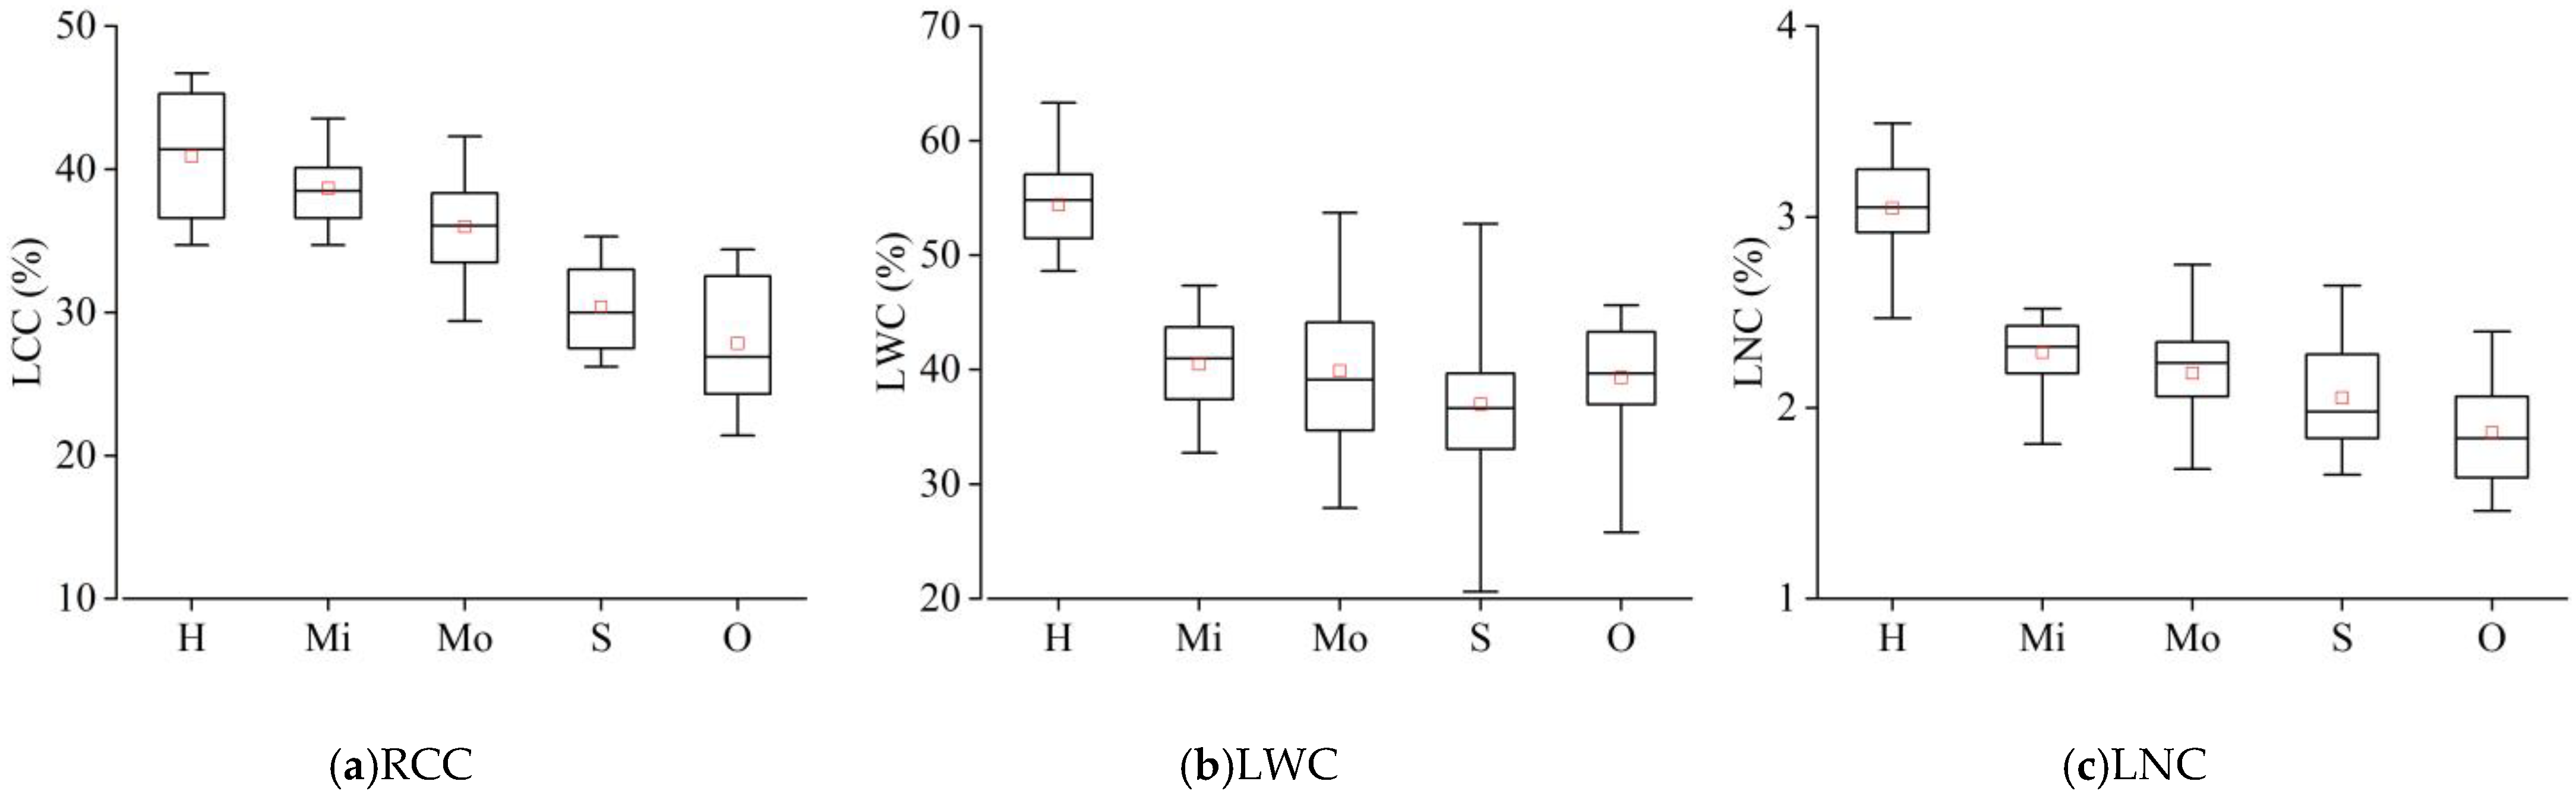
3.1.1. Differences of Biochemical Factors among Healthy, Damaged, and Off-Year Leaves

Overall, RCC, LWC, and LNC values of damaged leaves decreased with the aggravation of damaged severity (Figure 4). For off-year leaves, all factors were noticeably lower than those of healthy leaves, but the difference with damaged leaves was relatively small. Specifically, RCC and LNC of off-year leaves were lower than those of healthy and damaged leaves. However, the LWC values of off-year leaves were similar to those of damaged on-year leaves.
Although all factors showed clearly descending trends with the deterioration of damaged severity, they still had great variations within the same severity group and sometimes were not significantly different among severity groups. As shown in Table 2, the difference in RCC between different severity groups was significant with the exception of that between healthy and mildly damaged leaves and that between severely damaged and off-year leaves. For LWC, the healthy leaves were significantly distinguishable from damaged and off-year leaves. However, the difference in LWC between damaged and off-year groups was not statistically significant. Different damage severity groups also showed significant difference in this factor. As for LNC, the differences between healthy, damaged, and off-year leaves were significant with the exception of the difference between mildly and moderately damaged leaves.

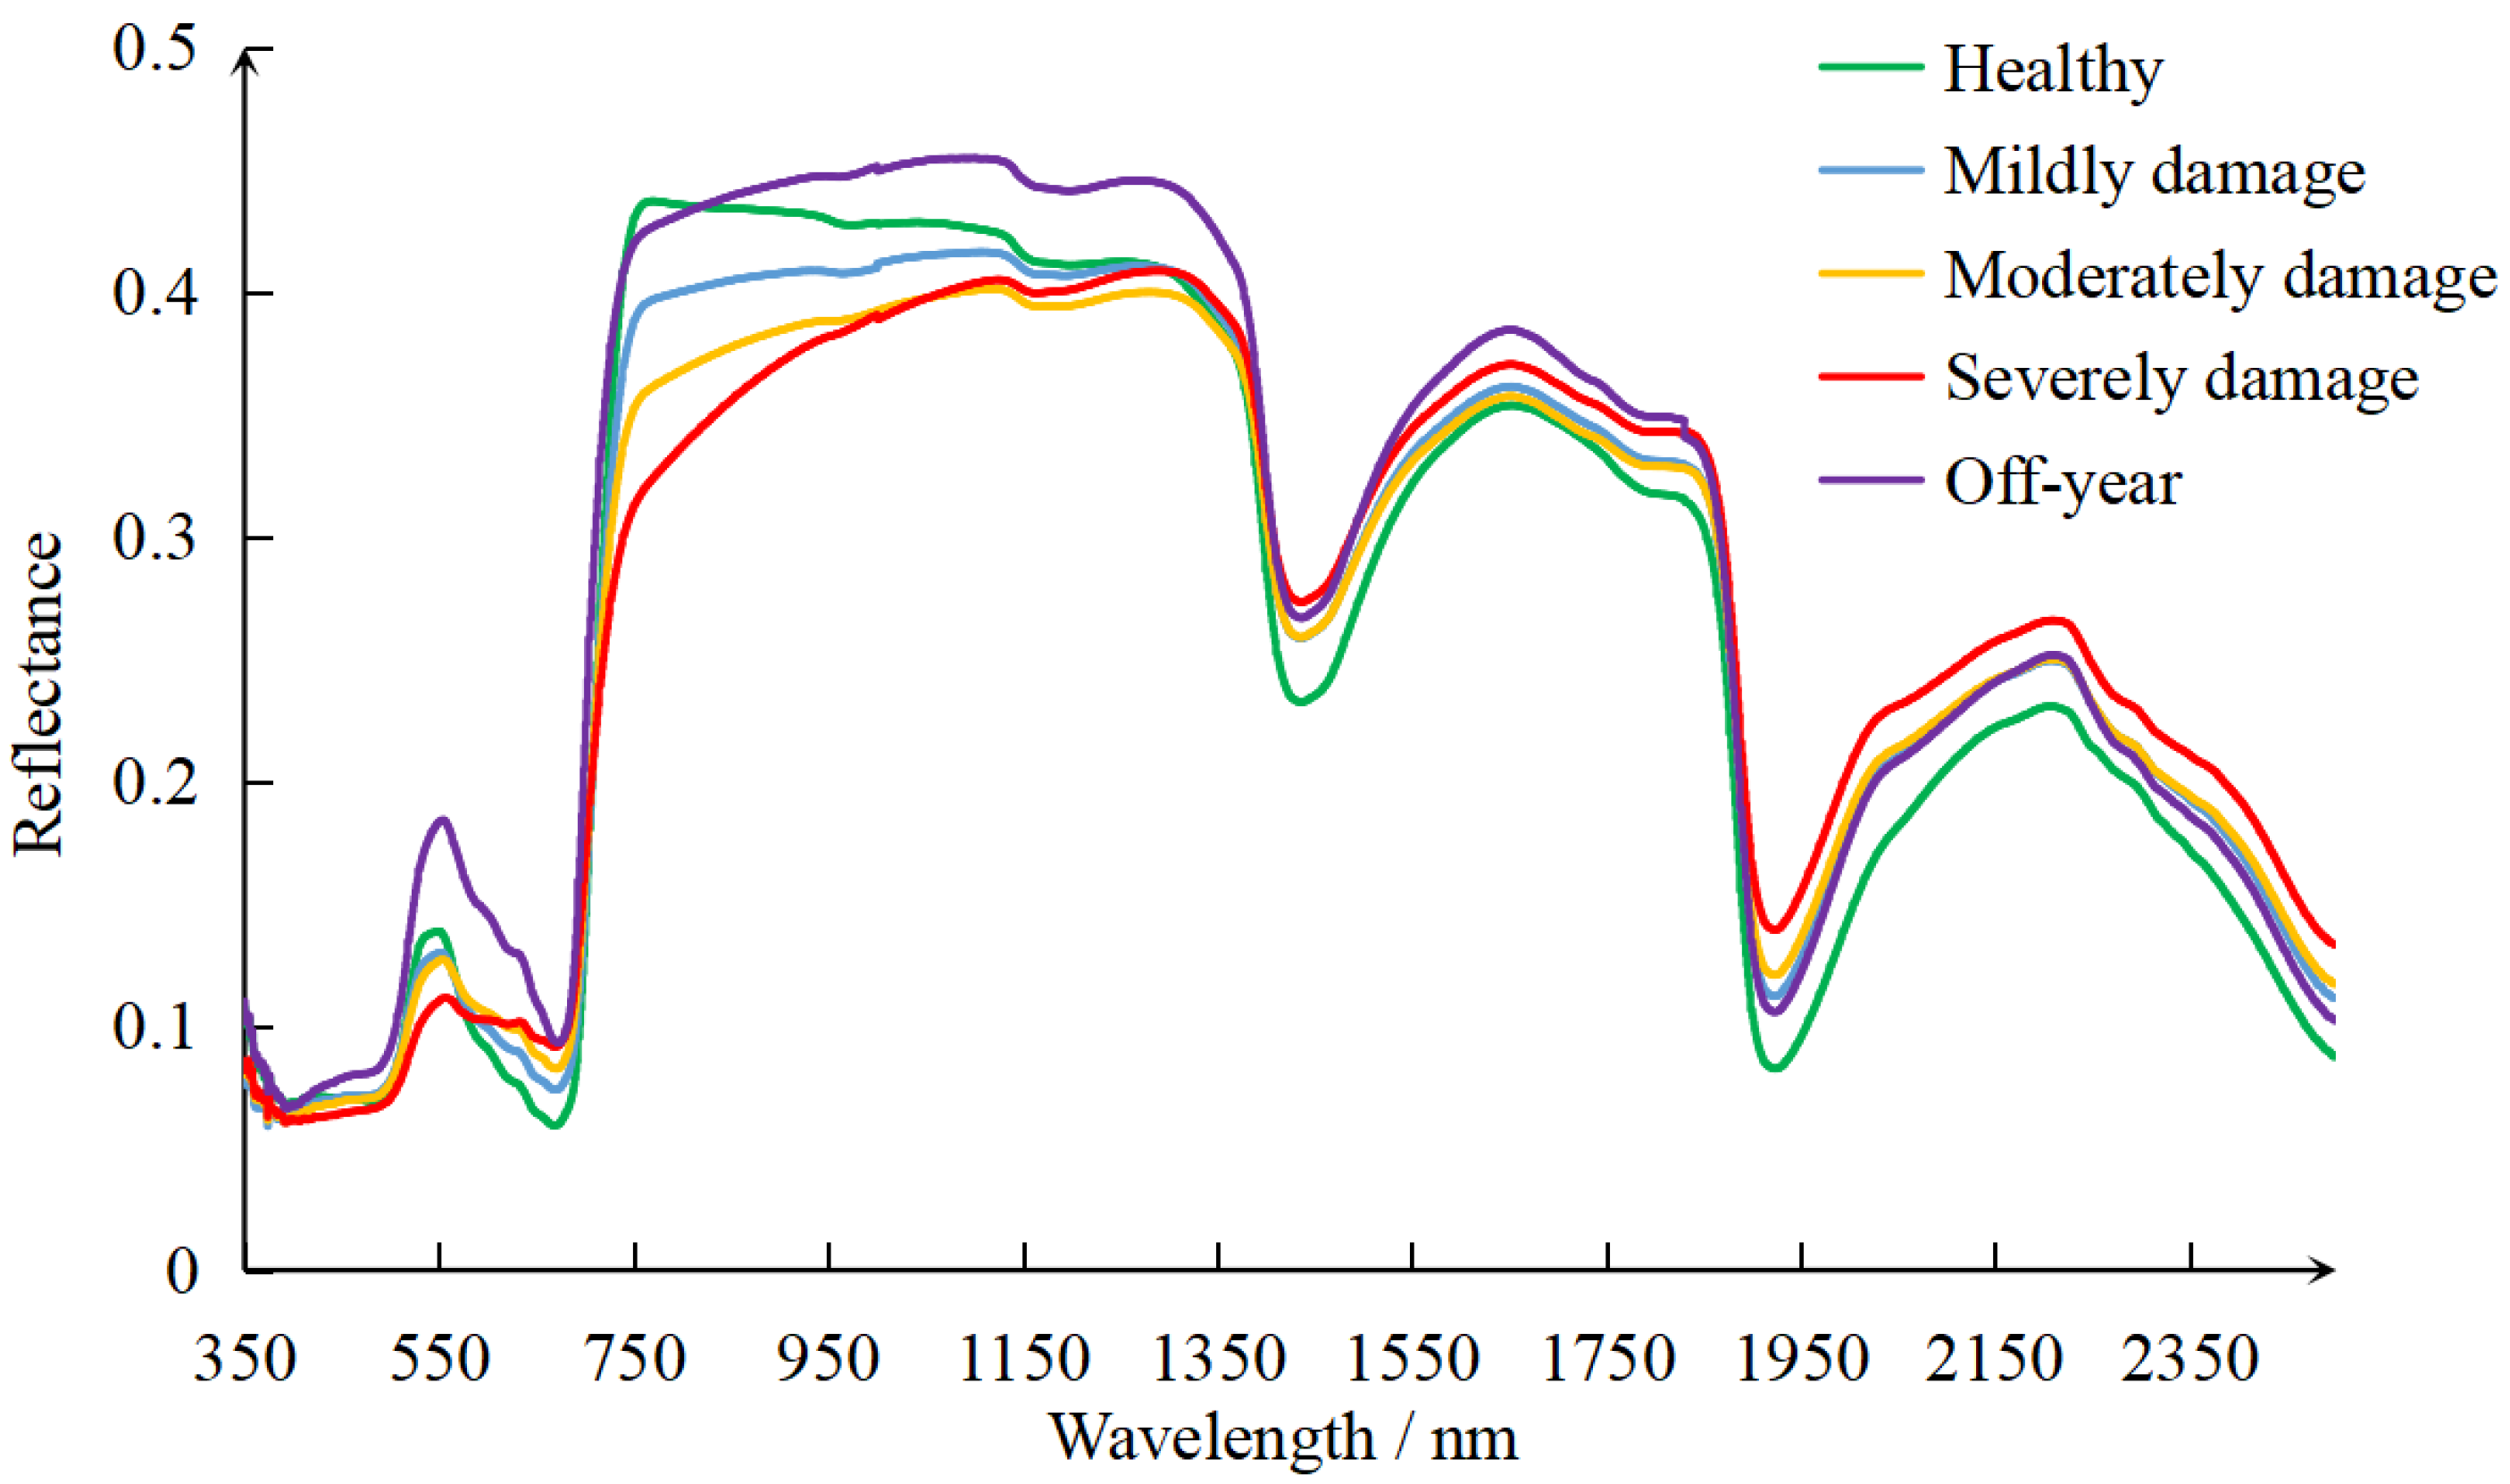
3.1.2. Spectra of Healthy, Damaged, and Off-Year Leaves

The spectrum curves of moso bamboo leaves had obvious peak–valley characteristics that were similar to those of most green vegetation. However, the pest infestation changed the physicochemical properties of host leaves, leading to spectrum distortion (Figure 5). In the visible region, the pest damage caused the leaf reflectance to decrease in the green band and to increase in the red band. The change magnitude increased with damage severity. The spectral difference between damaged and healthy leaves was the most visible in the near-infrared band. The reflectance decreased with the deterioration of damage severity. In the shortwave-infrared region, the reflectance of damaged leaves was generally higher than that of healthy leaves, especially at the two typical water absorption wavelengths, i.e., near 1450 nm and 1940 nm.
For off-year leaves, since the nutrients absorbed by maternal bamboo in this period mainly served for rhizome growth, their spectral characteristics were noticeably different from those of on-year leaves [23,59]. The reflectance of off-year leaves was noticeably higher than that of healthy and damaged leaves in visible and near-infrared regions. In the shortwave-infrared region, off-year leaves still had higher reflectance than healthy ones. However, the reflectance of off-year and damaged leaves was not distinguishable.

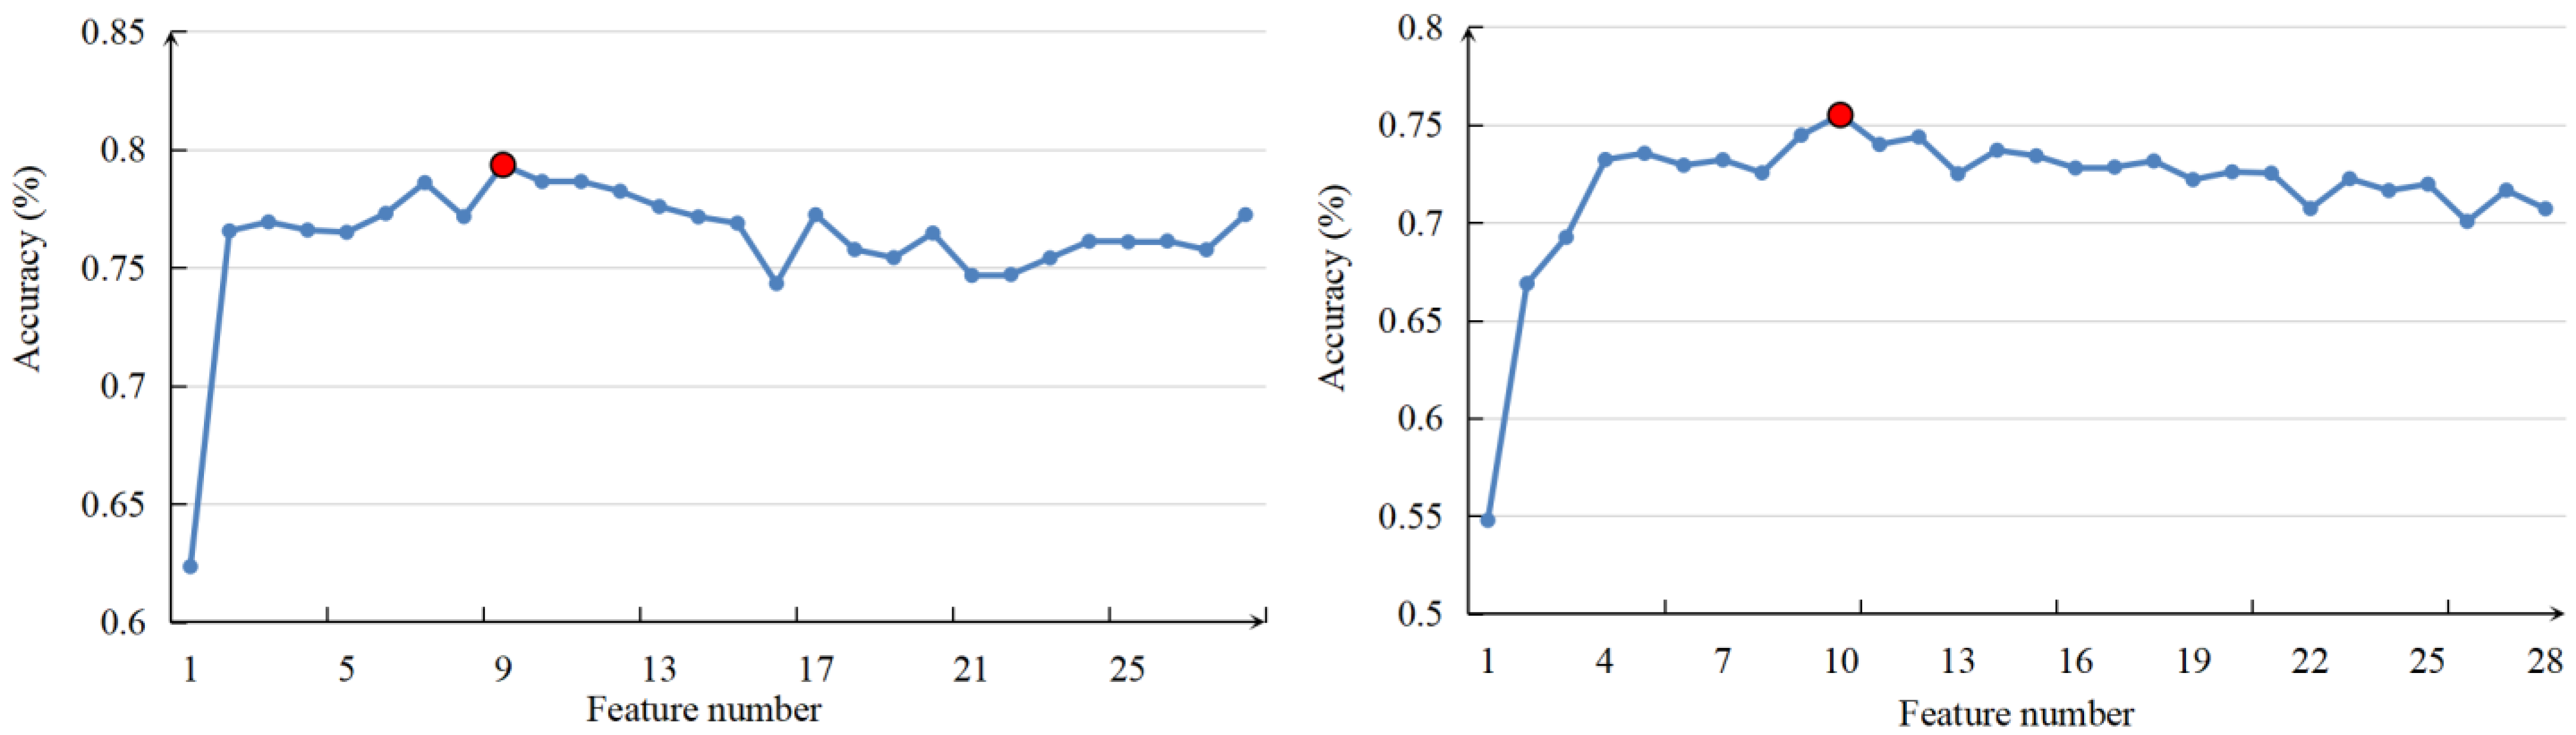
3.2. Features Selected as Model Inputs

According to the results given by RFE, the accuracy of scenario-A and scenario-B reached the best when the numbers of features as model inputs were 9 and 10, respectively (Figure 6). The selected features included those linked with leaf pigment, water, nitrogen status, and photosynthetic light use efficiency.
The distinguishability of selected features for leaf damage severity was further examined (Figure 7). For scenario-A, the feature’s values generally presented clear ascension (e.g., ARI1, ARI2, RVSI) or descension (e.g., PRI, NDWI, NDLI) trends with the aggravation of damaged severity. The GNDVI and the LCI values of damaged leaves were lower than those of healthy ones, but the differences between moderately and severely damaged groups were small. The CRI values of damaged leaves first decreased and slightly increased with the increase of damage severity. For scenario-B, GNDVI, LCI, and MCARI values of off-year leaves were noticeably different from those of healthy and damaged leaves. The GNDVI and the LCI values of off-year leaves were lower than those of healthy and damaged ones, while the changes of MCARI values were opposite. Other features were sensitive to pest damage, but their ability to distinguish off-year leaves was relatively weak. In addition, the dispersion of selected features was great within the same severity group, and their variations of damaged leaves were higher than those of healthy leaves.

3.3. Model Performance

Table 3 shows the values of hyper-parameters of scenario-A and scenario-B as well as their performance on the training dataset. Table 4 shows the classification results of the two models for the validation dataset. The OA values of scenario-A were about 5% higher than those of scenario-B for both training and validation datasets.
We further analyzed the damage recognition ability of each leaf group according to GPA values. The model showed excellent ability to identify healthy and severely damaged leaves, i.e., the GPA values were above 90%. The GPA values of scenario-A and scenario-B for mildly damaged leaves were both 74.2%. Some of mildly damaged leaves were misclassified into the moderately damaged group. The model had poor ability to recognize moderately damaged leaves, with GPA values of 55.6% for scenario-A and 50.0% for scenario-B. Moderately damaged leaves were easily misclassified into mildly and severely damaged groups. The GPA value of off-year leaves was low, i.e., they were easily misclassified with damaged leaves. The addition of off-year leaves in scenario-B had impacts on the GPA of moderately and severely damaged groups. The off-year leaves interfered with the model’s ability to identify pest damage to a certain extent, which was likely to cause the model to overestimate the actual occurrence of pests.

4. Discussion

4.1. The Effects of PPC on Host Bamboo Leaf Spectrum

Plants release water from leaves in the forms of vapor to the atmosphere by transpiration [60,61]. When the leaf is gnawed by the larvae, the relatively sealed leaf inner-space is exposed to the external environment, causing it to appear as though there are many unclosed stomata, thus causing profligate leaf water loss. The leaf reflectance in shortwave infrared bands is sensitive to water content. Due to the low water content of the damaged leaf, its reflectance in shortwave infrared bands is higher than that of the healthy leaf [62,63].
When the damaged edges are healed, the stomatal conductance decreases due to water deficit, therefore the transpiration rate slows down. Consequently, the leaf tissues can be burned because the weakened transpiration cannot remove the excess heat. Meanwhile, the transpiration pull is the main driving force for absorption and transmission of plant water and soluble inorganic salts [64], which means the synthesis rate of photosynthetic pigments (e.g., chlorophyll, carotenoids) of host bamboo decreases due to the lack of essential synthesis material. Moreover, the leaf internal environment changes induced by herbivory, hydroponic, and temperature anomalies that accelerate the degradation of pigments [65].
Normally, the reflectance of vegetation in the visible band is mainly dominated by pigments. The leaf reflectance increases in this spectral region when the chlorophyll content is decreased [66]. In this study, the reflectance of damaged leaves in the red band was higher than that of healthy leaves, which is quite logical. However, although the chlorophyll content of damaged leaves presented a downward trend with the deterioration of pest severity, their reflectance in the green band was lower than that of healthy leaves. This phenomenon may be related to the leaf compensation mechanism. When the leaves were damaged by herbivory, they compensated the photosynthesis loss by increasing the chlorophyll content per unit area of the residual leaf [67,68]. Since the water loss rate in damaged edges was faster than in the undamaged part, the chlorophyll distribution in a residual leaf appeared with clearly spatial heterogeneity [69], thus inducing the spectral difference among these parts. Two typical leaves were selected to present the aforementioned difference (Figure 8).
The leaf reflectance in the near-infrared band was mainly affected by its structure. There are many cavities in mesophyll spongy tissue with a great deal of reflecting surface, which was the reason that a leaf had high reflectance in the near-infrared band. However, the larvae destroyed the leaf tissue structure during the feeding process, thus the internal scattering of light inside leaf was weakened, therefore leading to the decline of near-infrared reflectance of the damaged leaf [70,71,72].
The chlorophyll and the water contents of off-year leaves were lower than those of on-year bamboo leaves, resulting in higher reflectance of off-year leaves relative to that of on-year healthy ones in visible and shortwave infrared bands. Although the nutrient content of off-year leaves was similar to that of damaged leaves, the reflectance of off-year leaves was noticeably higher than that of damaged ones owing to their intact structure, i.e., lower affected degree of inside light scattering.

4.2. The Uncertainty in Pest Severity Identification

Generally, PPC attacks the leaves at the top of the canopy first. After the leaves of this part are eaten up, they move down and threaten the leaves in the middle and the lower parts of the canopy. Therefore, the damaged timing of leaves at different canopy positions differs. The leaf spectrum does not change significantly in the initial damage stage. However, when the leaf loss amount reaches a certain threshold, weak photosynthesis and transpiration affect various physiological activities of the host. The residual leaves appear with disease spots due to nutrients deficiency, and their spectrum is tremendously different from that at the initial damage stage. For instance (Figure 9a, Table 5), the indentation area ratios of leafMo-90 and leafMo-61 were high, whereas the disease spots area ratios were only 3.61% and 7.41%, respectively. It can be seen that their nutrients content did not change much, and the spectrum still retained the characteristics of normal vegetation. On the contrary, the spectrum of those leaves with higher disease spot area ratio (e.g., leafMo-9, leafMo-54) had serious distortions.
Additionally, the spectral differences between leaves with the same damage severity also make pest monitoring full of uncertainty. The physiological conditions of leaves at different canopy positions might differ considerably, and their spectra are naturally dissimilar (Figure 9b). Since PPC indiscriminately attacks all leaves at different positions within its activity range, there is a large dispersion of biochemical factors and spectrally derived features within the same severity group. The dispersion of spectra within the same damage severity group and the certain similarity of spectra among different damage severity groups induce uncertainties in pest severity identification.

4.3. Weaknesses and Prospects of the Proposed Approach

Normally, a pest is not the only disturbance factor in forest ecosystems. Distinguishing it from other disturbance agents is a critical step for monitoring it using remote sensing data. However, this key step is often neglected in most studies [73]. Therefore, we carried out small but important fundamental research to explore the spectral differences among healthy, damaged, and off-year leaves. The findings are valuable for future studies.
The development of UAV technology enables us to acquire centimeter or millimeter hyperspectral imaging data, which can be used to monitor pest damage at the canopy scale [16]. This study shows that indices such as GNDVI, NDWI, and NDLI related to RCC, LWC, and LNC are applicable for monitoring PPC damage at the leaf scale. Theoretically, data from UAV platforms usable for calculating these indices might be used to monitor PPC damage severity at the canopy scale. Sensors on UAV platforms can only detect canopy spectra instead of leaf spectra. Thus, the applicability of UAV data for this purpose needs further investigation. Since PPC is a typical defoliator, it is necessary to consider the structural change of damaged canopies when remote sensing data are applied to assess damage severity at the canopy level. Light detection and ranging (LiDAR) proved an effective tool for detecting canopy structures [74,75]. The combination of LiDAR and hyperspectral data might be a solution for monitoring canopy damage caused by PPC.
Medium resolution multispectral satellite images were used to monitor forest pest disturbances in recent decades at regional scales [7,73]. Several studies demonstrated the applicability of satellite images (e.g., MODIS, Landsat, Sentinel, etc.) in monitoring herbivorous insects [62,76,77,78,79]. However, the usability of multispectral satellite images for monitoring PPC is still unclear. Satellite images have merits of large coverages and low cost. However, moso bamboo usually grows in hilly areas with complex terrains. There are inevitably many shadows on satellite images. The spectrum of vegetation in shadows is distorted, imposing difficulties in monitoring PPC. The proper correction of shadow effect is a prerequisite for monitoring PPC in hilly areas.
The off-year leaves are easily classified as damaged ones. It is necessary to distinguish on- and off-year bamboo for better monitoring PPC. In order to differentiate on- and off-year bamboo effectively, it is better to use remote sensing data acquired before PPC occurrence, at least before the first generation of larvae. Li et al. [18] proposed a multi-temporal bamboo forest index (i.e., Yearly Change Bamboo Index, YCBI) that can effectively distinguish on- and off-year bamboo based on the interannual differences of canopy spectra retrieved from satellite images. The application of greenness and wetness indicators in conjunction with YCBI might be an effective way for monitoring PPC using satellite images.

5. Conclusions

In this research, the effect of PPC on the physiological condition (RCC, LWC, LNC, spectrum) of moso bamboo leaves was explored on the basis of field measurements. The machine learning approach-based model was constructed to identify the PPC damage at the leaf scale. The effect of off-year leaves on identification results was also discussed. The main conclusions are summarized as follows:
(1)
The RCC, the LWC, and the LNC of damaged leaves were lower than those of healthy leaves, and the decreasing magnitude increased with the aggravation of damaged severity. The differences in LWC among different damaged groups were not significant. The nutrient content of off-year leaves was significantly lower than that of healthy leaves, but its difference in LWC with damaged leaves was not obvious.
(2)
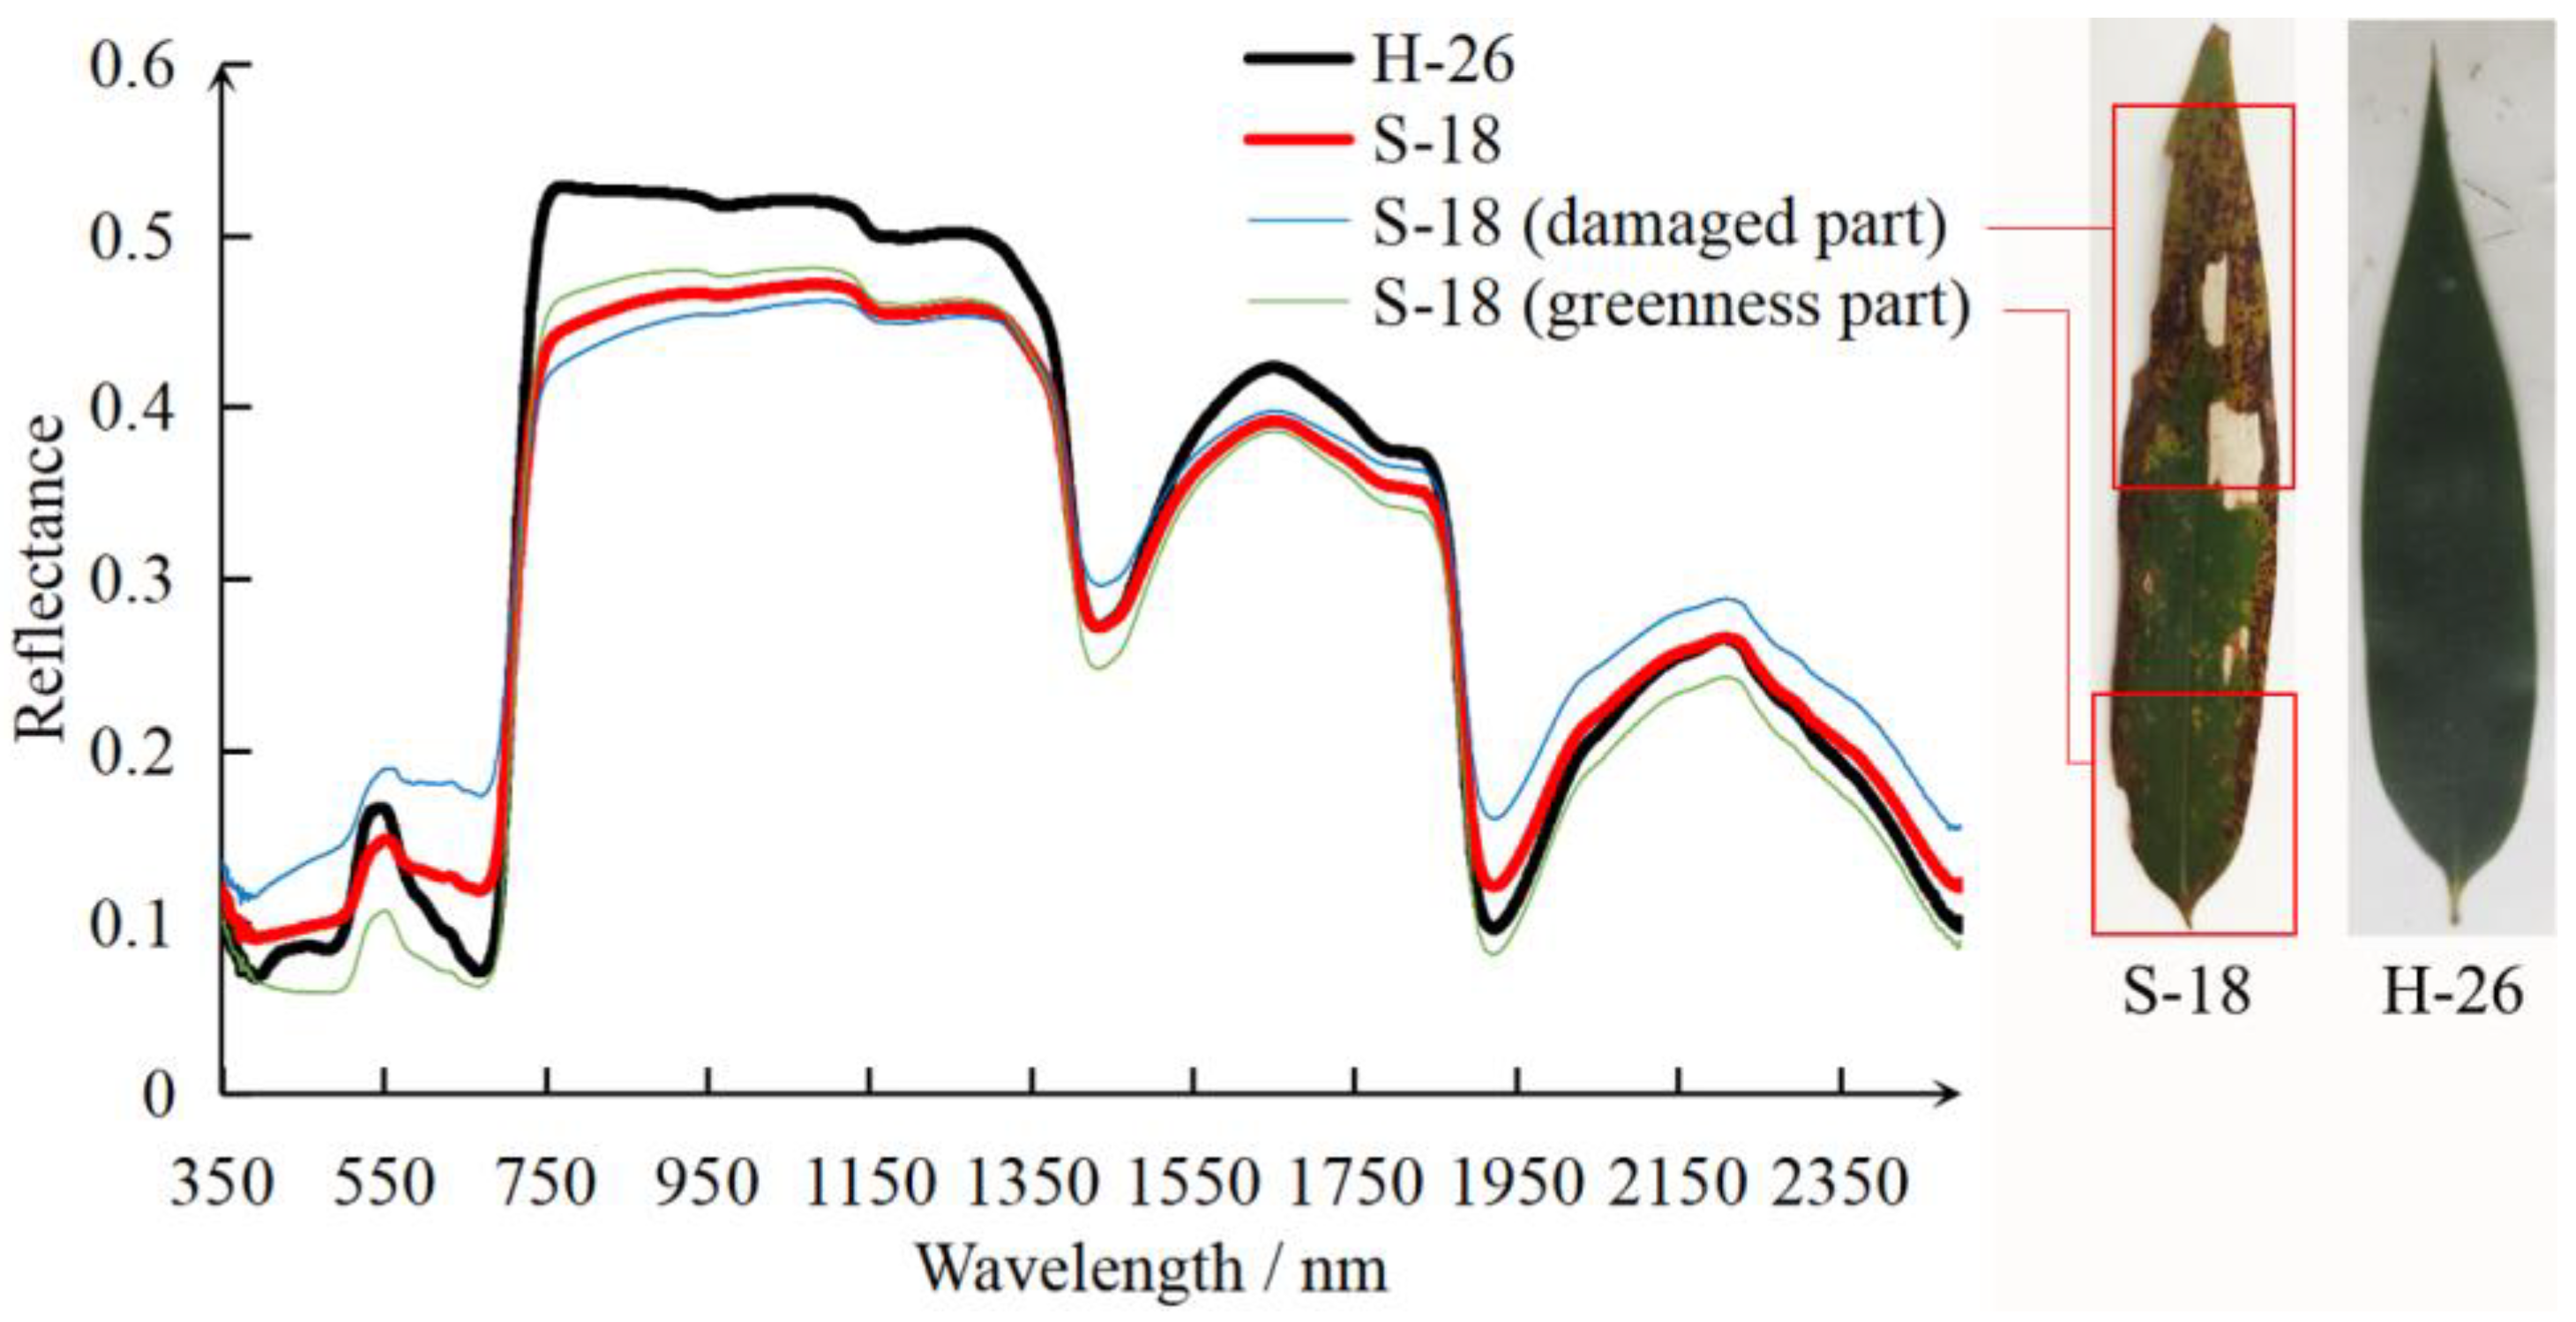
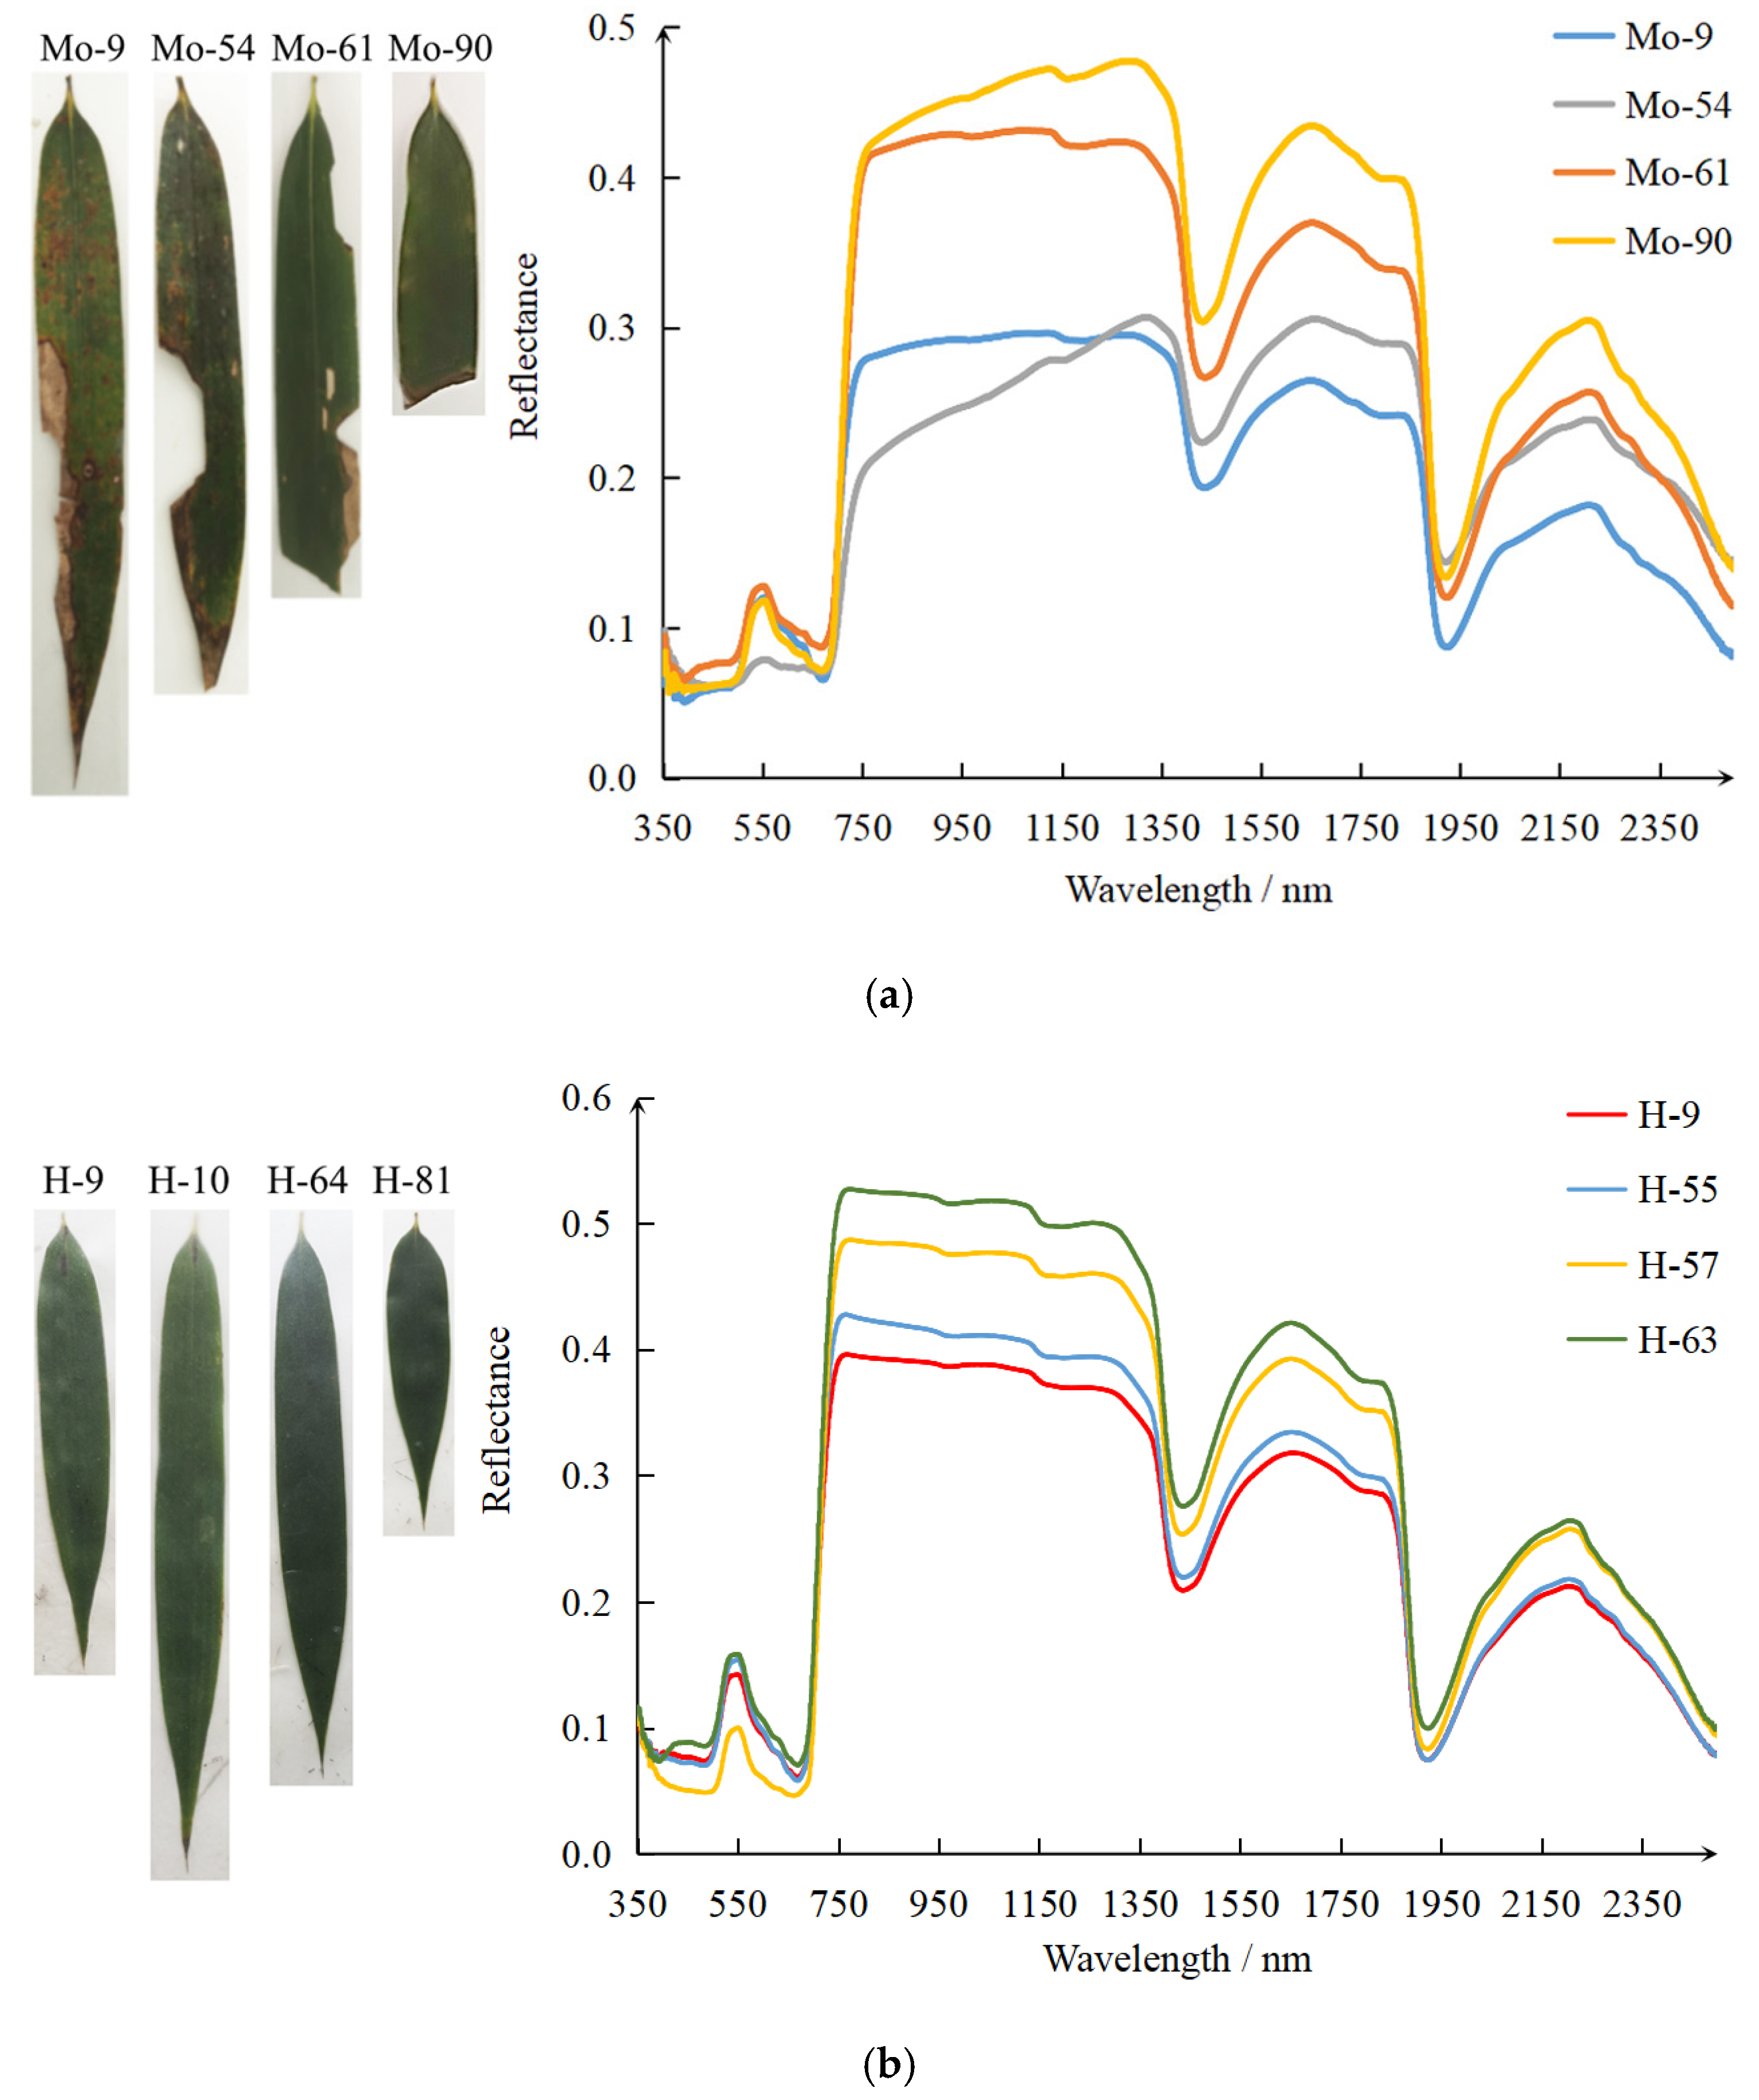
The pest damage caused noticeable distortion of leaf spectrum. The reflectance of damaged leaves decreased in the green band and increased in the red band. The reflectance difference between healthy and damaged leaves in the near-infrared band was the greatest. Damaged leaves had much lower reflectance in the near-infrared and much higher reflectance in shortwave-infrared relative to healthy leaves. The reflectance of off-year leaves was noticeably higher than healthy and damaged leaves in visible and near-infrared regions.
(3)
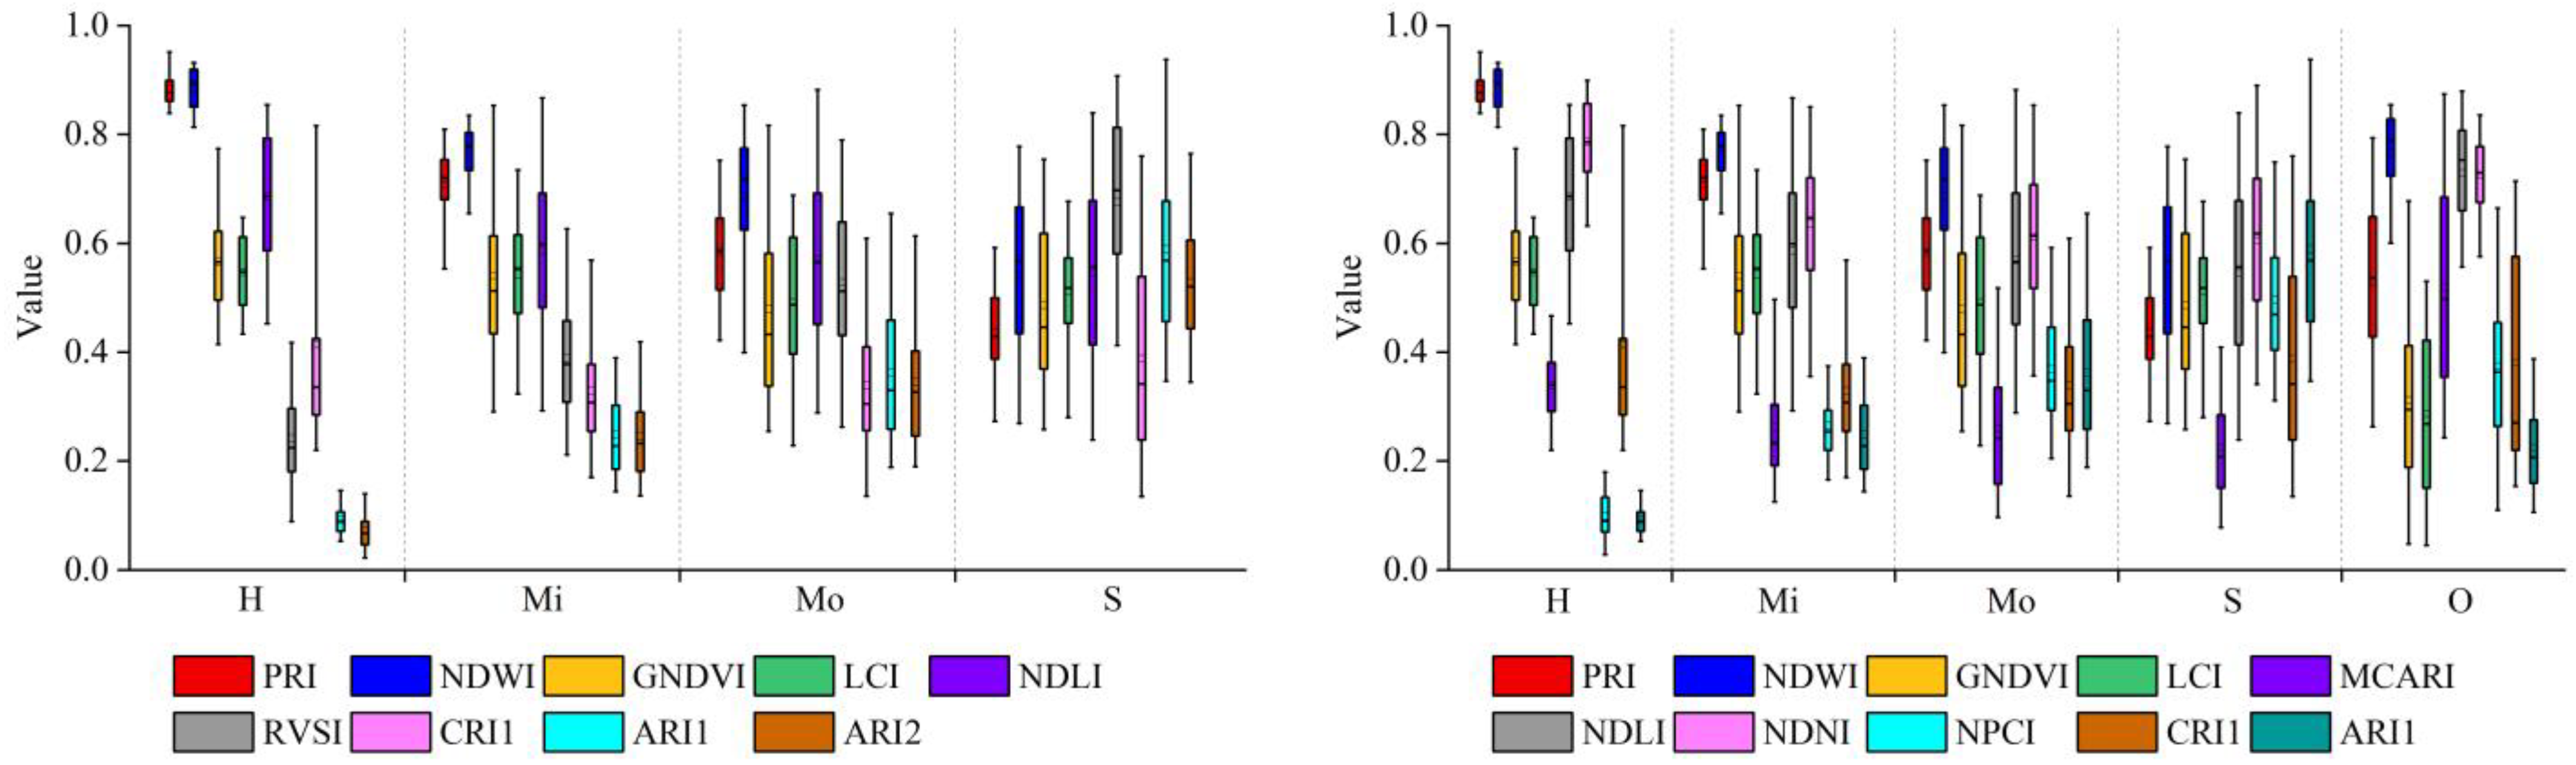
Selected spectral indicators detectably differed among damage groups of leaves. However, their values also had great variations within the same severity group due to the physiological difference of individual leaves and the damaged timing on host bamboo, which imposes difficulties in identifying damage severities.
(4)
The proposed model can effectively distinguish the damaged leaves, and its identification accuracy for healthy and severely damaged leaves is the best. The identification ability of the model for moderately damaged leaves is poor, i.e., below 60%. Off-year leaves can noticeably affect the identification results of damaged leaves since they were easily classified as damaged ones.

Author Contributions

Conceptualization, X.H. (Xuying Huang), W.J. and Z.X.; methodology and software, X.H. (Xuying Huang); data collection and process, X.H. (Xuying Huang), X.Y., J.S. and X.H. (Xinyu Hu); validation, W.J. and Z.X.; writing—original draft preparation, X.H. (Xuying Huang); writing—review and editing, W.J. and Z.X.; project administration, W.J. and Z.X.; funding acquisition, W.J. and Z.X. All authors have read and agreed to the published version of the manuscript.

Funding

This research was funded by the National Key Research and Development Program of China, grant number 2019YFA0606601, by the National Natural Science Foundation of China, grant number 42071300, by the China Postdoctoral Science Foundation, grant number 2018M630728, and by the Fujian Province Natural Science Foundation Project, grant number 2020J01504.

Institutional Review Board Statement

Not Applicable.

Informed Consent Statement

Not Applicable.

Data Availability Statement

Not Applicable.

Acknowledgments

We are grateful to the forestry bureau of Shunchang County for their help in this work. A special thanks to Juyuan Gao for his help in the field experiment of this research. Comments made by the anonymous reviewers are greatly appreciated.

Conflicts of Interest

The authors declare no conflict of interest.

References

  1. Mao, F.J.; Zhou, G.M.; Li, P.H.; Du, H.Q.; Xu, X.J.; Shi, Y.J.; Mo, L.F.; Zhou, Y.F.; Tu, G.Q. Optimizing selective cutting strategies for maximum carbon stocks and yield of Moso bamboo forest using BIOME-BGC model. J. Environ. Manag. 2017, 191, 126–135. [Google Scholar] [CrossRef] [PubMed]
  2. National Forestry and Grassland Administration. P.R.C. China Forest Resources Report (2014–2018); China Forestry Publishing House: Beijing, China, 2019; pp. 3–4. [Google Scholar]
  3. Yin, J.Y.; Ge, Z.P.; Deng, X.; Shi, Y.J.; Xu, L.; Zhou, G.M.; Ye, Y.Z.; Zhang, F.G.; Zhou, Y.F.; Li, C.; et al. Abandonment lead to structural degradation and changes in carbon allocation patterns in Moso bamboo forests. For. Ecol. Manag. 2019, 449, 117449. [Google Scholar] [CrossRef]
  4. Zhang, F.P.; Hou, Y.M.; You, M.S. Effects of different management measures on the composition and structure of arthropod community in Phyllostachys heterocycla cv. pubescens forest. Acta Entomol. Sin. 2005, 48, 928–934. [Google Scholar] [CrossRef]
  5. Chen, D.L.; Wang, B.Y. Life history of Pantana phyllostachysae and relationships between the insect and meteorological conditions. J. Zhejiang For. Coll. 1993, 10, 342–345. [Google Scholar]
  6. Lan, S.W.; Ye, X.Y.; Li, T.S.; Lu, S.Q.; Yang, Z.W.; Lu, M.Z. Type of distribution and method of density estimation for Pantana phyllostachysae. For. Res. 1993, 6, 579–582. [Google Scholar] [CrossRef]
  7. Rullan-Silva, C.D.; Olthoff, A.E.; Delgado de la Mata, J.A.; Pajares-Alonso, J.A. Remote Monitoring of Forest Insect Defoliation—A Review. For. Syst. 2013, 22, 377–391. [Google Scholar] [CrossRef] [Green Version]
  8. Su, J.; Zhang, F.P.; Huang, W.L.; Chen, D.L.; Chen, S.L. Influence of different types of Phyllostachys pubescens (Poales: Poaceae) leaves on population parameters of Pantana phyllostachysae (Lepidoptera: Lymantriidae) and parasitic effects of Beauveria bassiana (Moniliales: Moniliaceae). J. Insect Sci. 2015, 15, 39. [Google Scholar] [CrossRef] [Green Version]
  9. Cai, G.G. Screening of the superior strains of Beauveria bassiana of Pantana phyllostachysae and practical application. Sci. Silvae Sin. 2003, 39, 102–108. [Google Scholar]
  10. Zhou, Z.Y.; Hu, X.Y.; Lin, L.; Huang, X.Y.; Xu, Z.H.; Zhou, H.K.; Xu, R.N.; Wu, K.X. Preliminary study on the influence of topographic factors on the damage of Pantana phyllostachysae Chao. J. Agric. Catastrophol. 2020, 10, 61–64. [Google Scholar] [CrossRef]
  11. Wei, C.J. Plague division and application of Pantana phyllostachysae Chao in Fujian province. J. For. Environ. 2003, 23, 79–83. [Google Scholar]
  12. Lausch, A.; Heurich, M.; Gordalla, D.; Dobner, H.J.; Gwillym-Margianto, S.; Salbach, C. Forecasting potential bark beetle outbreaks based on spruce forest vitality using hyperspectral remote-sensing techniques at different scales. For. Ecol. Manag. 2013, 308, 76–89. [Google Scholar] [CrossRef]
  13. Fassnacht, F.E.; Latifi, H.; Ghosh, A.; Joshi, P.K.; Koch, B. Assessing the potential of hyperspectral imagery to map bark beetle-induced tree mortality. Remote Sens. Environ. 2014, 140, 533–548. [Google Scholar] [CrossRef]
  14. Liang, S.X.; Qian, S.S.; Hei, Z.H. Life histroy of the moth Pantana phyllostachysae and its control. Chin. J. Appl. Entomol. 2004, 41, 464–467. [Google Scholar]
  15. Zhang, S.L.; Qin, J.; Tang, X.D.; Wang, Y.J.; Huang, J.L.; Song, Q.L.; Min, J.Y. Spectral Characteristics and Evaluation Model of Pinus Massoniana Suffering from Bursaphelenchus xylophilus Disease. Spectrosc. Spectr. Anal. 2019, 39, 865–872. [Google Scholar] [CrossRef]
  16. Zhang, N.; Zhang, X.L.; Yang, G.J.; Zhu, C.H.; Huo, L.N.; Feng, H.K. Assessment of defoliation during the Dendrolimus tabulaeformis Tsai et Liu disaster outbreak using UAV-based hyperspectral images. Remote Sens. Environ. 2018, 217, 323–339. [Google Scholar] [CrossRef]
  17. Nguyen, H.D.D.; Nansen, C. Hyperspectral remote sensing to detect leafminer-induced stress in bok choy and spinach according to fertilizer regime and timing. Pest Manag. Sci. 2020, 76, 2208–2216. [Google Scholar] [CrossRef] [PubMed] [Green Version]
  18. Li, L.W.; Li, N.; Zang, Z.; Lu, D.S.; Wang, G.X.; Wang, N. Examining phenological variation of on-year and off-year bamboo forests based on the vegetation and environment monitoring on a New Micro-Satellite (VENµS) time-series data. Int. J. Remote Sens. 2020, 42, 2203–2219. [Google Scholar] [CrossRef]
  19. Feng, H.Y. Study on the Establishment of Health Evaluation System for Phyllostachys edulis Forest and its Application. Ph.D. Thesis, Chinese Academy of Forestry, Beijing, China, 2014. [Google Scholar]
  20. Ni, H.; Su, W.; Fan, S.; Chu, H. Effects of intensive management practices on rhizosphere soil properties, root growth, and nutrient uptake in Moso bamboo plantations in subtropical China. For. Ecol. Manag. 2021, 493, 119083. [Google Scholar] [CrossRef]
  21. Yang, C.; Wang, A.; Zhu, Z.; Lin, S.; Bi, Y.; Du, X. Impact of extensive management system on soil properties and carbon sequestration under an age chronosequence of Moso bamboo plantations in subtropical China. For. Ecol. Manag. 2021, 497, 119535. [Google Scholar] [CrossRef]
  22. Chen, L.; Liu, Y.; Zhou, G.; Mao, F.; Du, H.; Xu, X.; Li, P.; Li, X. Diurnal and seasonal variations in carbon fluxes in bamboo forests during the growing season in Zhejiang province, China. J. For. Res. 2019, 30, 657–668. [Google Scholar] [CrossRef]
  23. Xu, C.; Wang, H.X.; Wen, G.S.; Hu, C.; Liang, X.E.; Huang, H.N.; Zhu, L.N.; Bai, S.B.; Zhang, R.M. Analysis on the reason of Phyllostachys edulis explosive growth by physiological and ecological. J. Cent. South Univ. For. Technol. 2018, 38, 64–69. [Google Scholar] [CrossRef]
  24. Li, X.T. Bionomics and comprehensive control measure of Pantana phyllostachysae. Contemp. Hortic. 2013, 2, 153–154. [Google Scholar] [CrossRef]
  25. Zarco-Tejada, P.J.; Miller, J.R.; Mohammed, G.H.; Noland, T.L. Chlorophyll fluorescence effects on vegetation apparent reflectance: I. Leaf-level measurements and model simulation. Remote Sens. Environ. 2000, 74, 582–595. [Google Scholar] [CrossRef]
  26. Sims, N.C.; De Barro, P.; Newnham, G.J.; Kalyebi, A.; Macfadyen, S.; Malthus, T.J. Spectral separability and mapping potential of cassava leaf damage symptoms caused by whiteflies (Bemisia tabaci). Pest Manag. Sci. 2018, 74, 246–255. [Google Scholar] [CrossRef] [PubMed] [Green Version]
  27. Golhani, K.; Balasundram, S.K.; Vadamalai, G.; Pradhan, B. Estimating chlorophyll content at leaf scale in viroid-inoculated oil palm seedlings (Elaeis guineensis Jacq.) using reflectance spectra (400 nm–1050 nm). Int. J. Remote Sens. 2019, 40, 7647–7662. [Google Scholar] [CrossRef]
  28. Bu, Q.; Hou, Y.; Fang, H.; Zhang, Z.; Bai, X. Eco-Physiological Characteristics of the Exotic Plant Rhus typhina in Comparison with Its Indigenous Congeners Rhus chinensis. Sci. Silvae Sin. 2017, 53, 1–7. [Google Scholar] [CrossRef]
  29. Zhang, J.; Bai, X.; Hou, Y.; Dong, Z.; Bu, Q. Comparison on the competitiveness of the invaded pokeweed with its accompanying species in the coastal protection forest of Shandong Peninsula. Sci. Silvae Sin. 2016, 52, 24–29. [Google Scholar] [CrossRef]
  30. Liu, B.; Dong, Y.; He, T.; Chen, Y.; Yang, H.; Wang, X.; Chen, H. Component change law of char during bamboo pyrolysis process. Transations Chin. Soc. Agric. Eng. 2016, 32, 232–239. [Google Scholar]
  31. Oumar, Z.; Mutanga, O.; Ismail, R. Predicting Thaumastocoris peregrinus damage using narrow band normalized indices and hyperspectral indices using field spectra resampled to the Hyperion sensor. Int. J. Appl. Earth Obs. 2013, 21, 113–121. [Google Scholar] [CrossRef]
  32. Abdullah, H.; Darvishzadeh, R.; Skidmore, A.K.; Groen, T.A.; Heurich, M. European spruce bark beetle (Ips typographus, L.) green attack affects foliar reflectance and biochemical properties. Int. J. Appl. Earth Obs. 2018, 64, 199–209. [Google Scholar] [CrossRef] [Green Version]
  33. Tucker, C.J. Red and photographic infrared linear combinations for monitoring vegetation. Remote Sens. Environ. 1979, 8, 127–150. [Google Scholar] [CrossRef] [Green Version]
  34. Sims, D.A.; Gamon, J.A. Estimation of vegetation water content and photosynthetic tissue area from spectral reflectance: A comparison of indices based on liquid water and chlorophyll absorption features. Remote Sens. Environ. 2003, 84, 526–537. [Google Scholar] [CrossRef]
  35. Vogelmann, J.E.; Rock, B.N.; Moss, D.M. Red edge spectral measurements from sugar maple leaves. Int. J. Remote Sens. 1993, 14, 1563–1575. [Google Scholar] [CrossRef]
  36. Gamon, J.A.; Penuelas, J.; Field, C.B. A narrow-waveband spectral index that tracks diurnal changes in photosynthetic efficiency. Remote Sens. Environ. 1992, 41, 35–44. [Google Scholar] [CrossRef]
  37. Merzlyak, M.N.; Gitelson, A.A.; Chivkunova, O.B.; Rakitin, V.Y. Non-destructive optical detection of pigment changes during leaf senescence and fruit ripening. Physiol. Plant. 1999, 106, 135–141. [Google Scholar] [CrossRef] [Green Version]
  38. Gao, B.C. NDWI—A normalized difference water index for remote sensing of vegetation liquid water from space. Remote Sens. Environ. 1996, 58, 257–266. [Google Scholar] [CrossRef]
  39. Zhang, H.W.; Zhang, F.; Zhang, X.L.; Li, Z.; Abduwasit, G.; Song, J. Inversion of vegetation leaf water content based on spectral index. Spectrosc. Spectr. Anal. 2018, 38, 1540–1546. [Google Scholar] [CrossRef]
  40. Song, B.W.; Liu, L.Y.; Zhang, B. A novel restoration approach for vegetation reflectance spectra at noisy bands using the principal component analysis method. Int. J. Remote Sens. 2020, 41, 2303–2325. [Google Scholar] [CrossRef]
  41. Gitelson, A.A.; Merzlyak, M.N. Spectral reflectance changes associated with autumn senescence of Aesculus hippocastanum L. and Acer platanoides L. leaves. spectral features and relation to chlorophyll estimation. J. Plant Physiol. 1994, 143, 286–292. [Google Scholar] [CrossRef]
  42. Peñuelas, J.; Baret, F.; Filella, I. Semiempirical indexes to assess carotenoids chlorophyll—A ratio from leaf spectral reflectance. Photosynthetica 1995, 31, 221–230. [Google Scholar]
  43. Apan, A.; Held, A.; Phinn, S.; Markley, J. Detecting sugarcane ‘orange rust’ disease using EO-1 Hyperion hyperspectral imagery. Int. J. Remote Sens. 2004, 25, 489–498. [Google Scholar] [CrossRef] [Green Version]
  44. Daughtry, C.S.T.; Walthall, C.L.; Kim, M.S.; de Colstoun, E.B.; McMurtrey, J.E. Estimating corn leaf chlorophyll concentration from leaf and canopy reflectance. Remote Sens. Environ. 2000, 74, 229–239. [Google Scholar] [CrossRef]
  45. Serrano, L.; Peñuelas, J.; Ustin, S.L. Remote sensing of nitrogen and lignin in Mediterranean vegetation from AVIRIS data: Decomposing biochemical from structural signals. Remote Sens. Environ. 2002, 81, 355–364. [Google Scholar] [CrossRef]
  46. Gitelson, A.A.; Keydan, G.P.; Merzlyak, M.N. Three-band model for noninvasive estimation of chlorophyll, carotenoids, and anthocyanin contents in higher plant leaves. Geophys. Res. Lett. 2006, 33, L11402. [Google Scholar] [CrossRef] [Green Version]
  47. Cao, Z.S.; Yao, X.; Liu, H.Y.; Liu, B.; Cheng, T.; Tian, Y.C.; Cao, W.X.; Zhu, Y. Comparison of the abilities of vegetation indices and photosynthetic parameters to detect heat stress in wheat. Agric. For. Meteorol. 2019, 265, 121–136. [Google Scholar] [CrossRef]
  48. Perry, E.M.; Davenport, J.R. Spectral and spatial differences in response of vegetation indices to nitrogen treatments on apple. Comput. Electron. Agric. 2007, 59, 56–65. [Google Scholar] [CrossRef]
  49. Peñuelas, J.; Gamon, J.A.; Fredeen, A.L.; Merino, J.; Field, C.B. Reflectance indices associated with physiological changes in nitrogen- and water-limited sunflower leaves. Remote Sens. Environ. 1994, 48, 135–146. [Google Scholar] [CrossRef]
  50. Augusto-Silva, P.; Ogashawara, I.; Barbosa, C.; de Carvalho, L.; Jorge, D.; Fornari, C.; Stech, J. Analysis of MERIS reflectance algorithms for estimating chlorophyll—A concentration in a Brazilian reservoir. Remote Sens. 2014, 6, 11689–11707. [Google Scholar] [CrossRef] [Green Version]
  51. Xu, Z.H.; Liu, J.; Yu, K.Y.; Gong, C.H.; Xie, W.J.; Tang, M.Y.; Lai, R.W.; Li, Z.L. Spectral features analysis of Pinus massoniana with pest of Dendrolimus punctatus walker and level detection. Spectrosc. Spectr. Anal. 2013, 33, 428–433. [Google Scholar] [CrossRef]
  52. Lin, Y.; Liu, S.Y.; Yan, L.; Kuan, F.H.; Zhao, S.Y.; Zhao, H.Y. Improvement of hyperspectral estimation of nitrogen content in winter wheat by leaf surface polarized reflection measurement. Spectrosc. Spectr. Anal. 2020, 40, 1956–1964. [Google Scholar] [CrossRef]
  53. Gitelson, A.A.; Zur, Y.; Chivkunova, O.B.; Merzlyak, M.N. Assessing carotenoid content in plant leaves with reflectance spectroscopy. Photochem. Photobiol. 2002, 75, 272–281. [Google Scholar] [CrossRef]
  54. Gitelson, A.A.; Merzlyak, M.N.; Chivkunova, O.B. Optical properties and nondestructive estimation of anthocyanin content in plant leaves. Photochem. Photobiol. 2001, 74, 38–45. [Google Scholar] [CrossRef]
  55. Yan, K.; Zhang, D. Feature selection and analysis on correlated gas sensor data with recursive feature elimination. Sens. Actuators B. 2015, 212, 353–363. [Google Scholar] [CrossRef]
  56. Ke, G.; Meng, Q.; Finley, T.; Wang, T.; Chen, W.; Ma, W.; Ye, Q.; Liu, T. LightGBM: A Highly Efficient Gradient Boosting Decision Tree. In Proceedings of the 31st Annual Conference on Neural Information Processing Systems (NIPS), Long Beach, CA, USA, 4–9 December 2017; Curran Associates Inc.: New York, NY, USA, 2017; pp. 3146–3154. [Google Scholar]
  57. Wang, N.; Zhang, G.; Pang, W.; Ren, L.; Wang, Y. Novel monitoring method for material removal rate considering quantitative wear of abrasive belts based on LightGBM learning algorithm. Int. J. Adv. Manuf. Technol. 2021, 114, 3241–3253. [Google Scholar] [CrossRef]
  58. Su, H.; Lu, X.; Chen, Z.; Zhang, H.; Lu, W.; Wu, W. Estimating Coastal Chlorophyll-A Concentration from Time-Series OLCI Data Based on Machine Learning. Remote Sens. 2021, 13, 576. [Google Scholar] [CrossRef]
  59. Xu, X.J.; Du, H.Q.; Zhou, G.M.; Mao, F.J.; Li, X.J.; Zhu, D.E.; Li, Y.G.; Cui, L. Remote estimation of canopy leaf area index and chlorophyll content in Moso bamboo (Phyllostachys edulis (Carrière) J. Houz.) forest using MODIS reflectance data. Ann. For. Sci. 2018, 75, 33. [Google Scholar] [CrossRef] [Green Version]
  60. Woodward, I. Plant science: Tall storeys. Nature 2004, 428, 807–808. [Google Scholar] [CrossRef]
  61. Nolan, R.H.; Mitchell, P.J.; Bradstock, R.A.; Lane, P.N. Structural adjustments in resprouting trees drive differences in post-fire transpiration. Tree Physiol. 2014, 34, 123–136. [Google Scholar] [CrossRef] [PubMed]
  62. Barta, V.; Lukes, P.; Homolova, L. Early detection of bark beetle infestation in Norway spruce forests of Central Europe using Sentinel-2. Int. J. Appl. Earth Obs. Geoinf. 2021, 100, 102335. [Google Scholar] [CrossRef]
  63. Huo, L.N.; Persson, H.J.; Lindberg, E. Early detection of forest stress from European spruce bark beetle attack, and a new vegetation index: Normalized distance red & SWIR (NDRS). Remote Sens. Environ. 2021, 255, 112240. [Google Scholar] [CrossRef]
  64. Martinez-Vilalta, J.; Sauret, M.; Duro, A.; Pinol, J. Make your own transpiring tree. J. Biol. Educ. 2003, 38, 32–35. [Google Scholar] [CrossRef]
  65. Huang, L.; Ning, Z.Y.; Zhang, X.L. Impacts of caterpillar disturbance on forest net primary production estimation in China. Ecol. Indic. 2010, 10, 1144–1151. [Google Scholar] [CrossRef]
  66. Datt, B. Remote Sensing of Chlorophyll a, Chlorophyll b, Chlorophyll a + b, and Total Carotenoid Content in Eucalyptus Leaves. Remote Sens. Environ. 1998, 66, 111–121. [Google Scholar] [CrossRef]
  67. Zhou, X.H.; Li, Y.Q.; Huang, Z.; Luo, J.D.; Xiao, Z.Y.; Yan, S.B. Effects of defoliations on chlorophyll contents and growth of Sapium discolor seedlings. J. Cent. South Univ. For. Technol. 2017, 37, 39–43. [Google Scholar] [CrossRef]
  68. Barros, P.P.S.; Schutze, I.X.; Iost Filho, F.H.; Yamamoto, P.T.; Fiorio, P.R.; Dematte, J.A.M. Monitoring Bemisia tabaci (Gennadius) (Hemiptera: Aleyrodidae) Infestation in Soybean by Proximal Sensing. Insects 2021, 12, 47. [Google Scholar] [CrossRef] [PubMed]
  69. Nabity, P.D.; Hillstrom, M.L.; Lindroth, R.L.; DeLucia, E.H. Elevated CO2 interacts with herbivory to alter chlorophyll fluorescence and leaf temperature in Betula papyrifera and Populus tremuloides. Oecologia 2012, 169, 905–913. [Google Scholar] [CrossRef] [PubMed]
  70. Donovan, S.D.; MacLean, D.A.; Zhang, Y.; Lavigne, M.B.; Kershaw, J.A. Evaluating annual spruce budworm defoliation using change detection of vegetation indices calculated from satellite hyperspectral imagery. Remote Sens. Environ. 2021, 253, 112204. [Google Scholar] [CrossRef]
  71. Li, K.; Chen, Y.Z.; Xu, Z.H.; Huang, X.Y.; Hu, X.Y.; Wang, X.Q. Hyperspectral Estimation Method of Chlorophyll Content in MOSO Bamboo under Pests Stress. Spectrosc. Spectr. Anal. 2020, 40, 2578–2583. [Google Scholar] [CrossRef]
  72. Liu, Y.; Zhan, Z.; Ren, L.; Ze, S.; Yu, L.; Jiang, Q.; Luo, Y. Hyperspectral evidence of early-stage pine shoot beetle attack in Yunnan pine. For. Ecol. Manag. 2021, 497, 119505. [Google Scholar] [CrossRef]
  73. Senf, C.; Seidl, R.; Hostert, P. Remote sensing of forest insect disturbances: Current state and future directions. Int. J. Appl. Earth Obs. Geoinf. 2017, 60, 49–60. [Google Scholar] [CrossRef] [Green Version]
  74. Meng, R.; Dennison, P.E.; Zhao, F.; Shendryk, I.; Rickert, A.; Hanavan, R.P.; Cook, B.D.; Serbin, S.P. Mapping canopy defoliation by herbivorous insects at the individual tree level using bi-temporal airborne imaging spectroscopy and LiDAR measurements. Remote Sens. Environ. 2018, 215, 170–183. [Google Scholar] [CrossRef]
  75. Huo, L.N.; Zhang, N.; Zhang, X.L.; Wu, Y.S. Tree defoliation classification based on point distribution features derived from single-scan terrestrial laser scanning data. Ecol. Indic. 2019, 103, 782–790. [Google Scholar] [CrossRef]
  76. De Beurs, K.M.; Townsend, P.A. Estimating the effect of gypsy moth defoliation using MODIS. Remote Sens. Environ. 2008, 112, 3983–3990. [Google Scholar] [CrossRef]
  77. Lin, Q.; Huang, H.; Chen, L.; Wang, J.; Huang, K.; Liu, Y. Using the 3D model RAPID to invert the shoot dieback ratio of vertically heterogeneous Yunnan pine forests to detect beetle damage. Remote Sens. Environ. 2021, 260, 112475. [Google Scholar] [CrossRef]
  78. Spruce, J.P.; Sader, S.; Ryan, R.E.; Smoot, J.; Kuper, P.; Ross, K.; Prados, D.; Russell, J.; Gasser, G.; McKellip, R.; et al. Assessment of MODIS NDVI time series data products for detecting forest defoliation by gypsy moth outbreaks. Remote Sens. Environ. 2011, 115, 427–437. [Google Scholar] [CrossRef]
  79. Townsend, P.A.; Singh, A.; Foster, J.R.; Rehberg, N.J.; Kingdon, C.C.; Eshleman, K.N.; Seagle, S.W. A general Landsat model to predict canopy defoliation in broadleaf deciduous forests. Remote Sens. Environ. 2012, 119, 255–265. [Google Scholar] [CrossRef]
Figure 1. Location of Shunchang County, Nanping City, Fujian Province, China.
Remotesensing 13 04146 g001
Figure 2. Leaves with different damage severities taken from the sampling bamboo in the study area: (a) healthy leaves; (b) mildly damaged leaves; (c) moderately damaged leaves; (d) severely damaged leaves; (e) off-year leaves.
Remotesensing 13 04146 g002
Figure 3. The example of a damaged leaf. The green line is the boundary of the reference box used to calculate areas of indentation and disease spots. Yellow color indicates indentation parts manually delineated, and red color denotes disease spots visually determined.
Remotesensing 13 04146 g003
Figure 4. Biochemical parameters of moso bamboo leaves at different damage levels.
Remotesensing 13 04146 g004
Figure 5. The mean reflectance values of moso bamboo leaves with different levels of damage severity calculated from measurements of 468 sampling leaves.
Remotesensing 13 04146 g005
Figure 6. The RFE results of scenario-A (left) and scenario-B (right) for the training dataset. The position of the red dot indicates that the accuracy of the model was highest when the feature numbers were 9 (scenario-A) and 10 (scenario-B).
Remotesensing 13 04146 g006
Figure 7. Variations of selected features in different groups of leaves for scenario-A (left) and scenario-B (right) for the training dataset.
Remotesensing 13 04146 g007
Figure 8. The spectrum difference between damaged and green parts of a leaf (S-18) and spectrum of a healthy leaf (H-26) shown for the purpose of comparison.
Remotesensing 13 04146 g008
Figure 9. The pictures and the spectrums of selected leaf samples with different ratios of indentation and disease spots. (a) The damaged leaves with different ratios of indentation and disease spots. (b) The healthy leaves with a different spectrum.
Remotesensing 13 04146 g009
Table 1. Hyperspectral indices used for monitoring the physiological status of moso bamboo leaves.
IndexFormulaReferences
Normalized Difference Vegetable Index, NDVI(R800 − R670)/(R800 + R670)[33]
Modified Red Edge Simple Ratio Index, mSR705(R750 − R445)/(R705 + R445)[34]
Vogelmann Red Edge Index 1, VOG 1R740/R720[35]
Vogelmann Red Edge Index 2, VOG 2(R734 − R747)/(R715 + R726)[35]
Photochemical reflectance index, PRI(R531 − R570)/(R531 + R570)[36]
Plant Senescence Reflectance Index, PSRI(R680 − R500)/R750[37]
Normalized Difference Water Index, NDWI(R857 − R1241)/(R857 + R1241)[38]
Moisture Stress Index, MSIR1599/R819[39]
Normalized Difference Infrared Index, NDII(R819 − R1649)/(R819 + R1649)[40]
Green Normalized Difference Vegetation Index, GNDVI(R750 − R550)/(R750 + R550)[41]
Leaf Chlorophyll Index, LCI(R850 − R710)/(R850 − R680)[42]
Disease Water Stress Index, DSWI(R803 + R549)/(R1659 + R681)[43]
Modified Chlorophyll Absorption
Reflectance Index, MCARI
[(R700 − R670) − 0.2 × (R700 − R550)] × (R700/R670)[44]
Normalized Difference Lignin Index, NDLI log ( 1 / R 1754 )     log ( 1 / R 1680 ) log ( 1 / R 1754 )   +   log ( 1 / R 1680 ) [45]
Normalized Difference Nitrogen Index, NDNI log ( 1 / R 1510 )     log ( 1 / R 1680 ) log ( 1 / R 1510 )   +   log ( 1 / R 1680 ) [45]
Green Chlorophyll Index, CIgreen(R800/R550) − 1[46]
Red-edge Chlorophyll Index, CIrededge(R800/R720) − 1[46]
Normalized Difference Red Edge Index, NDRE(R790 − R720)/(R790 + R720)[47]
Red-edge Vegetation Stress Index, RVSI(R712 + R752) − R732[48]
Structure Insensitive Pigment Index, SIPI(R800 − R445)/(R800 − R680)[49]
Normalized Difference Chlorophyll Index, NDCI(R762 − R527)/(R762 + R527)[50]
Normalized Pigment Chlorophyll ratio Index, NPCI(R680 − R430)/(R680 + R430)[49]
Red Edge Normalized Difference Vegetation Index, RENDVI(R760 − R680)/(R760 + R680)[51]
Red Edge Ratio Vegetation Index, RERVIR760/R680[51]
Simple Ratio, SR705R750/R705[52]
Carotenoid Reflectance Index 1, CRI1(1/R510) − (1/R550)[53]
Carotenoid Reflectance Index 2, CRI2(1/R510) − (1/R700)[53]
Anthocyanin Reflectance Index 1, ARI1(1/R550) − (1/R700)[54]
Anthocyanin Reflectance Index 2, ARI2R800 × [(1/R550) − (1/R700)][54]
Table 2. The significance levels of differences in RCC, LWC, and LNC between different severity groups.
Significance (p-Value)
RCCLWCLNC
HMi0.2300.000 **0.000 **
Mo0.000 **0.000 **0.000 **
S0.000 **0.000 **0.000 **
O0.000 **0.000 **0.000 **
MiMo0.047 *1.0000.070
S0.000 **0.1690.000 **
O0.000 **0.9500.000 **
MoS0.000 **0.5370.029 *
O0.000 **1.0000.000 **
SO0.2060.6800.002 **
Note: * at the significance level of 0.05; ** at the significance level of 0.01.
Table 3. Hyper-parameters of the model and the overall accuracy of the training dataset.
ModelHyper-ParametersOA (%)
NLMDLRNE
Scenario-A17−10.17781.12
Scenario-B17−10.048076.54
Table 4. The OA and the GPA values of the validation dataset.
HMiMoSOGPA (%)OA (%)
Scenario-AH31100 96.8881.51
Mi02380 74.19
Mo08154 55.56
S00128 96.55
Scenario-BH31000196.8875.71
Mi02371074.19
Mo08146050.00
S00328090.32
O12411055.56
Table 5. The measured factors of selected leaves.
Leaf CodeRCCLWCLNCIndentation Area RatioDisease Spots Area RatioLLR
Mo-931.9036.59%1.71%3.69%36.53%40.22%
Mo-5436.1044.23%2.08%13.62%33.16%46.78%
Mo-6145.0040.94%2.45%22.49%7.41%29.90%
Mo-9043.1053.72%2.33%43.54%3.61%47.16%
H-936.663.31%2.97%0.00%0.00%0.00%
H-1034.457.05%2.88%0.00%0.00%0.01%
H-6446.953.55%3.43%0.00%0.45%0.45%
H-8145.851.70%2.94%0.00%0.00%0.00%
Publisher’s Note: MDPI stays neutral with regard to jurisdictional claims in published maps and institutional affiliations.

