Article

Missing Burns in the High Northern Latitudes: The Case for Regionally Focused Burned Area Products

Department of Geographical Sciences, University of Maryland, College Park, MD 20742, USA
*
Author to whom correspondence should be addressed.
Remote Sens. 2021, 13(20), 4145; https://doi.org/10.3390/rs13204145
Submission received: 27 September 2021 / Revised: 7 October 2021 / Accepted: 10 October 2021 / Published: 16 October 2021

Abstract

:
Global estimates of burned areas, enabled by the wide-open access to the standard data products from the Moderate Resolution Imaging Spectroradiometer (MODIS), are heavily relied on by scientists and managers studying issues related to wildfire occurrence and its worldwide consequences. While these datasets, particularly the MODIS MCD64A1 product, have fundamentally improved our understanding of wildfire regimes at the global scale, their performance may be less reliable in certain regions due to a series of region- or ecosystem-specific challenges. Previous studies have indicated that global burned area products tend to underestimate the extent of the burned area within some parts of the boreal domain. Despite this, global products are still being regularly used by research activities and management efforts in the northern regions, likely due to a lack of understanding of the spatial scale of their Arctic-specific limitations, as well as an absence of more reliable alternative products. In this study, we evaluated the performance of two widely used global burned area products, MCD64A1 and FireCCI51, in the circumpolar boreal forests and tundra between 2001 and 2015. Our two-step evaluation shows that MCD64A1 has high commission and omission errors in mapping burned areas in the boreal forests and tundra regions in North America. The omission error overshadows the commission error, leading to MCD64A1 considerably underestimating burned areas in these high northern latitude domains. Based on our estimation, MCD64A1 missed nearly half the total burned areas in the Alaskan and Canadian boreal forests and the tundra during the 15-year period, amounting to an area (74,768 km2) that is equivalent to the land area of the United States state of South Carolina. While the FireCCI51 product performs much better than MCD64A1 in terms of commission error, we found that it also missed about 40% of burned areas in North America north of 60° N between 2001 and 2015. Our intercomparison of MCD64A1 and FireCCI51 with a regionally adapted MODIS-based Arctic Boreal Burned Area (ABBA) shows that the latter outperforms both MCD64A1 and FireCCI51 by a large margin, particularly in terms of omission error, and thus delivers a considerably more accurate and consistent estimate of fire activity in the high northern latitudes. Considering the fact that boreal forests and tundra represent the largest carbon pool on Earth and that wildfire is the dominant disturbance agent in these ecosystems, our study presents a strong case for regional burned area products like ABBA to be included in future Earth system models as the critical input for understanding wildfires’ impacts on global carbon cycling and energy budget.

1. Introduction

Wildfires, both of natural and anthropogenic origins, are a widely spread disturbance agent in nearly all global ecosystems [1]. Due to their substantial impacts on the global climate [2], ecosystem services [3], public health and safety [4], and the economy [5,6], wildfire monitoring and management are being implemented by many countries around the world. Remote sensing is a primary technique used in these efforts, thanks to its capability to cover large spatial extents, including areas with limited access [7,8]. In recent years, an increasing number of satellite-based remotely sensed products, including those based on the publicly available archives of imagery acquired by the Moderate Resolution Imaging Spectroradiometer (MODIS) and Visible Infrared Imaging Radiometer Suite (VIIRS), have been created with short latency between image acquisition and their availability. This allows fire management agencies to quickly detect ongoing fire events, closely monitor their progress, and initiate and maintain fire mitigation efforts if necessary. In addition to the operational applications of these datasets within the fire management community, a large range of ecologists, climate scientists, and resource managers rely on the relatively objective and spatially comprehensive assessment of various aspects of wildfires, including burned areas, duration, and intensity, to support their work (e.g., [9,10,11]).
The MCD64A1 product [12,13] is the burned area product that is part of the suite of standard global MODIS datasets. It is one of the first consistently delivered global burned area products that details the global burned area extent from 2001 to the present. MCD64A1 is among one of the most commonly used remotely sensed fire products and it has been integrated into a series of large-scale assessments of fire impacts including the Global Fire Emissions Database (GFED) [14], the Global Fire Atlas [15], and the Wildland Fire Information Emissions System (WFIES) [16], among others. Various research efforts, including many high-profile publications (e.g., [17,18,19]), also relied on the MCD64A1 data for their analyses.
The circumpolar high northern latitude (HNL) region contains two major terrestrial biomes: boreal forests and tundra. In both biomes, wildfires are a dominant disturbance agent [20,21] and are usually of natural origins due to the regions’ remote location and very low population density [21]. Wildfires in the HNL can exert strong impacts on the Earth system, particularly through impacts on the carbon cycle and surface radiation budget. Boreal forests are believed to be the terrestrial biome that holds the largest amount of carbon when both aboveground biomass and soil carbon are taken into account [22]. While aboveground biomass in tundra areas is comparatively low, very large carbon stores are found below ground, mostly locked within the permafrost [23]. Together, boreal and tundra ecosystems form a massive carbon pool that takes up a significant portion of the global carbon budget [23,24]. Through direct combustion [25] and indirect acceleration of the thawing of the permafrost [26], wildfires can substantially boost the emission rates of this stored carbon, which, in turn, contributes to global warming. In contrast, wildfires’ impact on the energy budget in the vast boreal biome is generally believed to lead to a net cooling effect [27,28]. This is because wildfires tend to lead to substantial increases in forest albedo that last for decades after the fires through the opening of the forest canopy, which results in a higher exposure of surface snow during the snow season [27,28]. As the extent of wildfires is usually correlated with the various impacts that wildfires have on the climate, burned area is a key parameter for various studies that focus on wildfire-climate interactions [25,29,30,31]. Moreover, numerous modeling studies suggest that fire occurrence and extent across the circumpolar boreal forests and tundra zones are likely to increase under the projected strong Arctic warming [32,33,34], making quantifying fire impacts on HNL ecosystems a critical component of understanding consequences and drivers of the global climate system and enabling a further improvement in global climate models.
The unique environmental conditions of the HNL regions present substantial challenges to mapping burned areas. One of the most prominent limitations for mapping the extent of fires within a single fire season is the narrow temporal window. This window is controlled by five main components: (1) wildfires in the HNL typically occur during the snow-off season, which typically lasts from May to September [35]; (2) during the snow season, snow on the ground would obscure the burned signal; (3) solar angles are low during much of the year; (4) there is frequent cloud cover in many Arctic regions during the snow-free season [36,37]; and (5) HNL fire events are frequently large [38] and produce extensive and dense smoke plumes that further limit clear surface observations [39]. There are other potentially influential factors, such as an abundance of small, shallow water bodies during the snow-free season [40,41], which strongly fragment the surface and lead to the strong absorption of visible and near-infrared wavelengths, creating a signal similar to the deposition of char associated with fire events. The extent and depth of these water bodies varies greatly under the influence of meteorological conditions, which further complicates their identification [40].
As a result of these challenges, several studies have pointed out that MCD64A1 performs sub-optimally within HNL ecosystems. Although a global-scale assessment found that MCD64A1 possesses the lowest commission and omission error rates in boreal forests among all terrestrial biomes [42], other studies that investigated its performance in North America [43], Siberia [44], and Alaska [45] reported a substantial underestimation of area burned. Admittedly, MCD64A1 routinely outperforms MCD45A1 burned area product [46], a conceptually different MODIS-based burned area product that has been superseded by MCD64A1, as well as two other burned area products with coarser spatial resolutions in North America [43]. However, the reported underestimation of the area burned in the HNL regions has notable implications for studies and models which are based on the MCD64A1 estimates.
In this project, we aim to (1) compare MCD64A1 with two additional MODIS-based burned area products, including the global FireCCI51 burned area product [47] from the European Space Agency (ESA) and the regionally-adapted Arctic Boreal Burned Area (ABBA) dataset [48] across the full extent of circumpolar HNL zones, (2) systematically assess the performance of the three burned area products in the HNL regions in North America and discuss its implications, and (3) discuss the potential of these newer products to supplement or replace MCD64A1 as primary data products to be used to represent the burned area in the HNL.

2. Study Area

This project focuses on the circumpolar land areas north of 60° N, primarily located in Russia, Canada, and the US (Figure 1). Although the boreal biome extends further south beyond the 60° N, 60° N represents a generally accepted boundary for the HNL zone and includes representative samples for both tundra and boreal biomes. The study area is generally characterized by long, cold winters and short summers [49]. In most of the boreal zone, forests are dominated by evergreen needleleaf species, including pine (Pinus spp.), spruce (Picea spp.), and fir (Abies spp.), deciduous broadleaf species including birch (Betula spp.) and aspen (Populus spp.), and deciduous needleleaf larch (Larix spp.) [50,51]. Regardless of the dominant tree species, wildfires play a pivotal role in affecting the successional cycles and species compositions of boreal forests [52,53]. In the treeless tundra, vegetation is dominated by mosses, grasses, sedges, and shrubs [54]. Tundra wildfires are historically infrequent [21] and are currently mostly congregated in a few “hotspots”, including the Alaskan tundra [55]. However, due to the substantial regional warming during the past decades, which is likely to persist in the future, it is believed that tundra wildfires may become increasingly common [56].

3. Datasets

In this project, we examined the latest version (Collection 6) of the MCD64A1 product. Integrating data acquired by the MODIS sensors onboard both Terra and Aqua satellites, MCD64A1 is one of the standard MODIS data products and has been produced for global land areas at the nominal spatial resolution of 500 m. It maps burned areas based on a “hybrid” algorithm, as both surface reflectance and active fire detections are used to determine the extents of the burned areas [12]. The MOD09GHK/MYD09GHK atmospherically corrected daily surface reflectance products [58] and the MOD14A1/MYD14A1 active fire products [59] are adopted as the inputs for surface reflectance and active fire, respectively. In addition to the MCD64A1 product, we also included two other burned area products, which were also compared against the reference fire products (listed and marked by * in Table 1): the Arctic Boreal Burned Area (ABBA) product [45,48] and the FireCCI51 product [47]. The ABBA product was developed specifically to address the unique environmental setting of wildfire occurrence and detection in the HNL zone [45] and has been subsequently chosen to support the NASA Terrestrial Ecology Program’s Arctic Boreal Vulnerability Experiment (ABoVE) campaign due to its high mapping accuracy based on evaluations of limited scape [45]. Similarly to MCD64A1, the ABBA product relies on attributing the detected changes in surface reflectance in the MOD09 products to fire occurrence using the standard MODIS active fire detections. However, it is not developed as an operational dataset and its mapping of burned areas relies on imagery acquired during the early period of the snow-free season, following the estimated year of fire occurrence. For example, the burns for the year of 2003 would be mapped using surface reflectance data from the snow-free season of 2003 and the early snow-free season (April–May) of the year of 2004. As a result, the ABBA product is well suited to support wildfire-related research and post-fire resource management but cannot be used to support operational fire suppression activities. Improved upon its predecessors (FireCCI41 [60] and FireCCI50 [61]), the FireCCI51 product is a recent global burned area product that was funded through the Fire_CCI project under ESA’s Climate Change Initiative program. By relying mostly on the 250 m near-infrared band of the MODIS sensors [47], FireCCI51 has a nominal spatial resolution of 250 m, making it one of the global burned area products with the highest spatial resolution. A regional intercomparison based on Sub-Saharan Africa showed that FireCCI51 performs better than MCD64A1 in terms of both commission error and omission error [47]. Table 1 summarizes the major characteristics of these three burned area datasets as well as the characteristics of the auxiliary datasets included in this study.
In this study, we opted for a different strategy to assess and compare the performance of the three burned area products. On the one hand, while the standard validation approaches rely on generating a sample of testing sites in a specified time and space, following a set of assumptions and relying on (a usually stratified) random selection (e.g., [42,61] among others), we aimed to use existing independent geospatial datasets that provide a full record of fire activity in the North American HNL, as a whole or within a substantial geographic subset of this area. This was made possible by the high-quality reference datasets that are available for North America. On the other hand, unlike conventional intercomparisons, which usually do not involve ground-truth data, we decided to incorporate a ground-truthing component (see Section 4.3), which allowed us to be more confident in the robustness of our assessments. Based on this fused approach, we evaluated the performance of the MCD64A1, ABBA, and FireCCI51 products in North America by comparing them with four independent datasets reflecting fire activity and burned areas, which are routinely used for wildfire research in the HNL. They include: (1) the VIIRS VNP14IMG active fire product [62], (2) the Monitoring Trends in Burn Severity (MTBS; [63]) dataset, (3) the Alaska Large Fire Database (ALFD; https://www.frames.gov/catalog/10465; accessed on 1 October 2020), and (4) Canadian National Fire Database (CNFDB; https://cwfis.cfs.nrcan.gc.ca/ha/nfdb; accessed on 1 October 2020) (Table 1). Although active fire detections are not directly comparable to the burned area estimates, they present the only consistent dataset that offers a comprehensive and consistent coverage of circumpolar fire occurrence in the HNL. While the VIIRS record is substantially shorter (available from 2012) than that of MODIS (available from 2000), it is the only independent HNL-wide record of fire occurrence as both MCD64A1 and ABBA products rely on MODIS active fire detections. The remaining three datasets are more directly linked to burned area estimates that provide a comprehensive and independent view of fire occurrence but within a limited geographic region. The MTBS data suite contains the complete archive of Landsat-based estimates of burn severity (and therefore burned area) for all wildfires that occurred since 1984 and were larger than 4 km2 in Alaska. These images are classified into burn severity levels, including unburned, low-severity burn, moderate-severity burn, and high-severity burn. As such classification processes were guided by expert knowledge [63], the resultant burn severity maps provide crucial information about the areas that were confirmed to have been burned within each fire perimeter for a large number of fire events at a higher resolution (30 m). Similarly to MTBS, ALFD is also limited to Alaska. However, in addition to its longer temporal coverage (which is not relevant for our study, since MODIS observations cover only the post-2000 era), ALFD is different from MTBS in two major aspects: (1) it covers more fire events since the lower limit of the size of included fires is 0.25 km2 [64] and (2) it likely overestimates the burned areas within each mapped fire event because ALFD only supplies the outer fire perimeter [65]. Because it is also a consistently produced product aided by expert opinions, ALFD was also adopted by our study to act as an independent reference dataset. For the same reason, we adopted the CNFDB dataset, which provides fire perimeters for wildfires in Canada, based on information compiled from multiple administrative levels [66].

4. Methodology

4.1. Direct Intercomparisons of Burned Area Products with Reference Datasets

We first conducted a set of direct intercomparisons of the burned areas as mapped by the MCD64A1, ABBA, and FireCCI51 products with the reference fire products to establish a baseline understanding of the spatio-temporal distribution of the burned areas as mapped by different burned area products in the HNL. Three types of intercomparisons were conducted: (1) annual and grand totals of burned area, (2) total burned area by country (i.e., US, Canada, and Russia) to evaluate the potential coarse-scale geographic bias, and (3) total burned area by biomes (i.e., boreal forest and Arctic tundra) to evaluate the potential coarse-scale biome-based bias. All burned area products were compared at their native resolutions to preserve their original information. According to the availability of the reference datasets, the intercomparisons were carried out over three different spatial domains: Alaska (where MTBS, ALFD, and VNP14IMG data are available), Canada (where CNFDB and VNP14IMG are available), and the entire circumpolar region above 60° N (where VNP14IMG is available). Since none of the reference fire products are strictly burned area products, all of them were manipulated to enable a direct comparison to a burned area product. For MTBS, all burn severity levels within datasets available for wildfires that occurred in Alaska between 2001 and 2015 were converted into the MTBS confirmed burned area maps (hereafter referred to as MTBS burned area) at their native resolution (30 m) by merging the three classes that were confirmed as burned areas by human interpreters (i.e., low-severity burn, moderate-severity burn, high-severity burn, and increased greenness) into a single burned class; the remaining classes were merged into a single unburned class. While the resultant unburned class contains areas that were actually burned but unmapped, including areas impacted by cloud, shadow, and the missed observations caused by the Scan Line Corrector (SLC) malfunction on the ETM+ instrument, the burned area class preserves burned areas with the highest level of confidence within all wildfires that are larger than 4 km2. The ALFD and CNFDB fire perimeters were converted to quasi-burned area maps (since they are not true burned area products; these maps are hereafter referred to as ALFD burned area and CNFDB burned area, respectively) at 30 m. A limitation of these quasi-burned area maps is that the unburned islands, which are common within wildfire burn perimeters [64,67], were also mapped as burned. However, the high spatial completeness of these datasets [68] offers a unique opportunity for assessing the mapping accuracies of the burned area products in North America. The VNP14IMG active fire points were converted to 375 m raster files for the intercomparison to simulate a pixel footprint. The higher resolution of the VIIRS pixels and the higher sensitivity of the VIIRS sensors compared to MODIS support the detection of many smaller and lower-intensity fires below the detection threshold of the MODIS active fire product [69].

4.2. Omission Error Assessment

In this study, omission error of the MCD64A1, ABBA, and FireCCI51 products was assessed in the HNL region in North America at a per-pixel level relative to our reference datasets (ALFD and CNFDB). We chose to not use MTBS burned area as a reference because of its exclusion of wildfires that are smaller than 4 km2. To allow for robust evaluations, the reference burned area data were reconciled with MCD64A1, ABBA, and FireCCI51 so that their projection and resolutions (500 m for MCD64A1 and ABBA; 250 m for FireCCI51) were matched exactly during comparison. Using each of the two reference burned area datasets, we then calculated the omission error (OE) for MCD64A1, ABBA, and FireCCI51, respectively, in each year following:
OE = Nmissed/Ntotal
where Ntotal and Nmissed stand for the number of pixels (after reprojection and resampling) of the reference fire perimeters (i.e., ALFD for Alaska and CNFDB for Canada) and the number of pixels that are not mapped as burned by the burned area products under evaluation within the corresponding reference fire perimeters, respectively.
Because the outer perimeters of wildfires (such as those supplied by ALFD and CNFDB) are known to include unburned islands [65,70], to estimate the area of missed burned areas by the burned area products under evaluation more accurately, we created a variable called Burned Ratio (BR), which stands for the proportion of actual burned areas within the wildfire perimeters. Although the value of this variable has been explored previously [70,71,72], it has previously been explored using limited sample sizes and spatial scales, and therefore we decided to identify a more representative estimate of this variable. Even though the MTBS data were not used as the reference dataset, it offers a great opportunity to infer the value of BR over a large spatial scale, thanks to its mapping of different severity levels, including unburned islands, within each fire perimeter based on visual examination guided by expert knowledge [63]. We extracted the four severity classes (i.e., low-severity burn, moderate-severity burn, high-severity burn, and increased greenness) that are associated with confirmed burned areas as reported by MTBS for all wildfires that occurred in Alaska between 1984 and 2002. We did not include wildfires that occurred since 2003 because the Landsat ETM+ data acquired since the SLC malfunction (which happened in 2003) has missing data that prorogated into the MTBS data. Specifically, BR is calculated by dividing the total areas of confirmed burned areas by the total area of all wildfire perimeters of the corresponding period. For each burned area product under evaluation in each of the two regions, we calculated the area of missed burned area (Amissed) following:
Amissed = (Atotal − Amapped) × BR
where Atotal and Amapped stand for the total area of the reference fire perimeters (i.e., ALFD for Alaska and CNFDB for Canada) and the burned areas that are mapped by the burned area products under evaluation within the corresponding reference fire perimeters, respectively.

4.3. Commission Error Assessment

For this assessment, we used the ALFD and CNFDB datasets as the reference products, and we hypothesized that areas that were not mapped as burned by ALFD in Alaska and by CNFDB in Canada are likely to be truly unburned. Our confidence in such a hypothesis is particularly high in Alaska because of the reported high spatial completeness of the ALFD fire perimeters in recent decades [64,68]. In Canada, our confidence in the spatial completeness of the fire perimeters included by CNFDB is relatively lower because CNFDB is known to miss certain fires, especially smaller fires (i.e., those whose size is smaller than 2 km2) [73], however, it is still believed to offer a highly accurate representation of the wildfire distribution over the vast expanse of Canadian forests [68,73].
The difference in spatial resolutions between the datasets under evaluation and the reference datasets creates a possibility for small burn scars in the proximity of larger burns to be omitted in the delineation of a scar boundary at 30 m resolution but being correctly captured as burned within the larger 250 or 500 m pixels. To account for these cases, we buffered the ALDF and CNFDB scars out by roughly four pixels at the burned area products’ nominal resolutions, resulting in a 2 km buffer for MCD64A1 and ABBA and a 1 km buffer for FireCCI51. Subsequently, all pixels that were located outside the merged buffered areas, but were mapped by MCD64A1, ABBA, or FireCCI51, were considered as candidates for commission errors of the corresponding burned area product. In Alaska, the distribution of the candidate pixels highlighted 2003 and 2004 as years of particularly large disagreements between the coarse resolution burned area products and ALFD burn scars. Sample pixels were thus randomly selected from the candidate pixels for MCD64A1, ABBA, and FireCCI51 for each of these two years with a target of 100 pixels per dataset, per year. We intentionally oversampled, where possible, from candidate pixels, in anticipation of cases where a confident decision could not be made by the analyst for a pixel, due to reasons such as a lack of clear surface observations within Landsat imagery. Those pixels were discarded from our analysis. A total of 100 pixels were reviewed for MCD64A1 and FireCCI51, whereas all of the candidate pixels for ABBA were reviewed for 2003 (39 points) and 2004 (72 points), respectively, because there were fewer than 100 candidate pixels for both years. Sample pixels for each of the three products for each year were visually compared with Landsat imagery to verify the existence of a burn by analysts who were not previously involved in this project. If any part of the pixel was found to have been burned, that candidate pixel was marked as correct, otherwise, it was marked as incorrect. The commission errors (CE) of MCD64A1, ABBA, and FireCCI51 for each year were calculated following:
CE = Nincorrect/Ntotal
where Ntotal and Nincorrect stand for the numbers of the total candidate pixels and among them, the incorrectly mapped pixels for product i (i: MCD64A1, ABBA, or FireCCI51). A similar assessment was carried out for Canada, which found 2013 and 2015 to be the two years with the highest level of disagreement between the burned area products under evaluation and CNFDB burn scars. These two years were therefore selected, based on which, the commission error assessment for Canada was conducted.

5. Results

5.1. Intercomparisons of Burned Area Extent as Mapped by Different Products

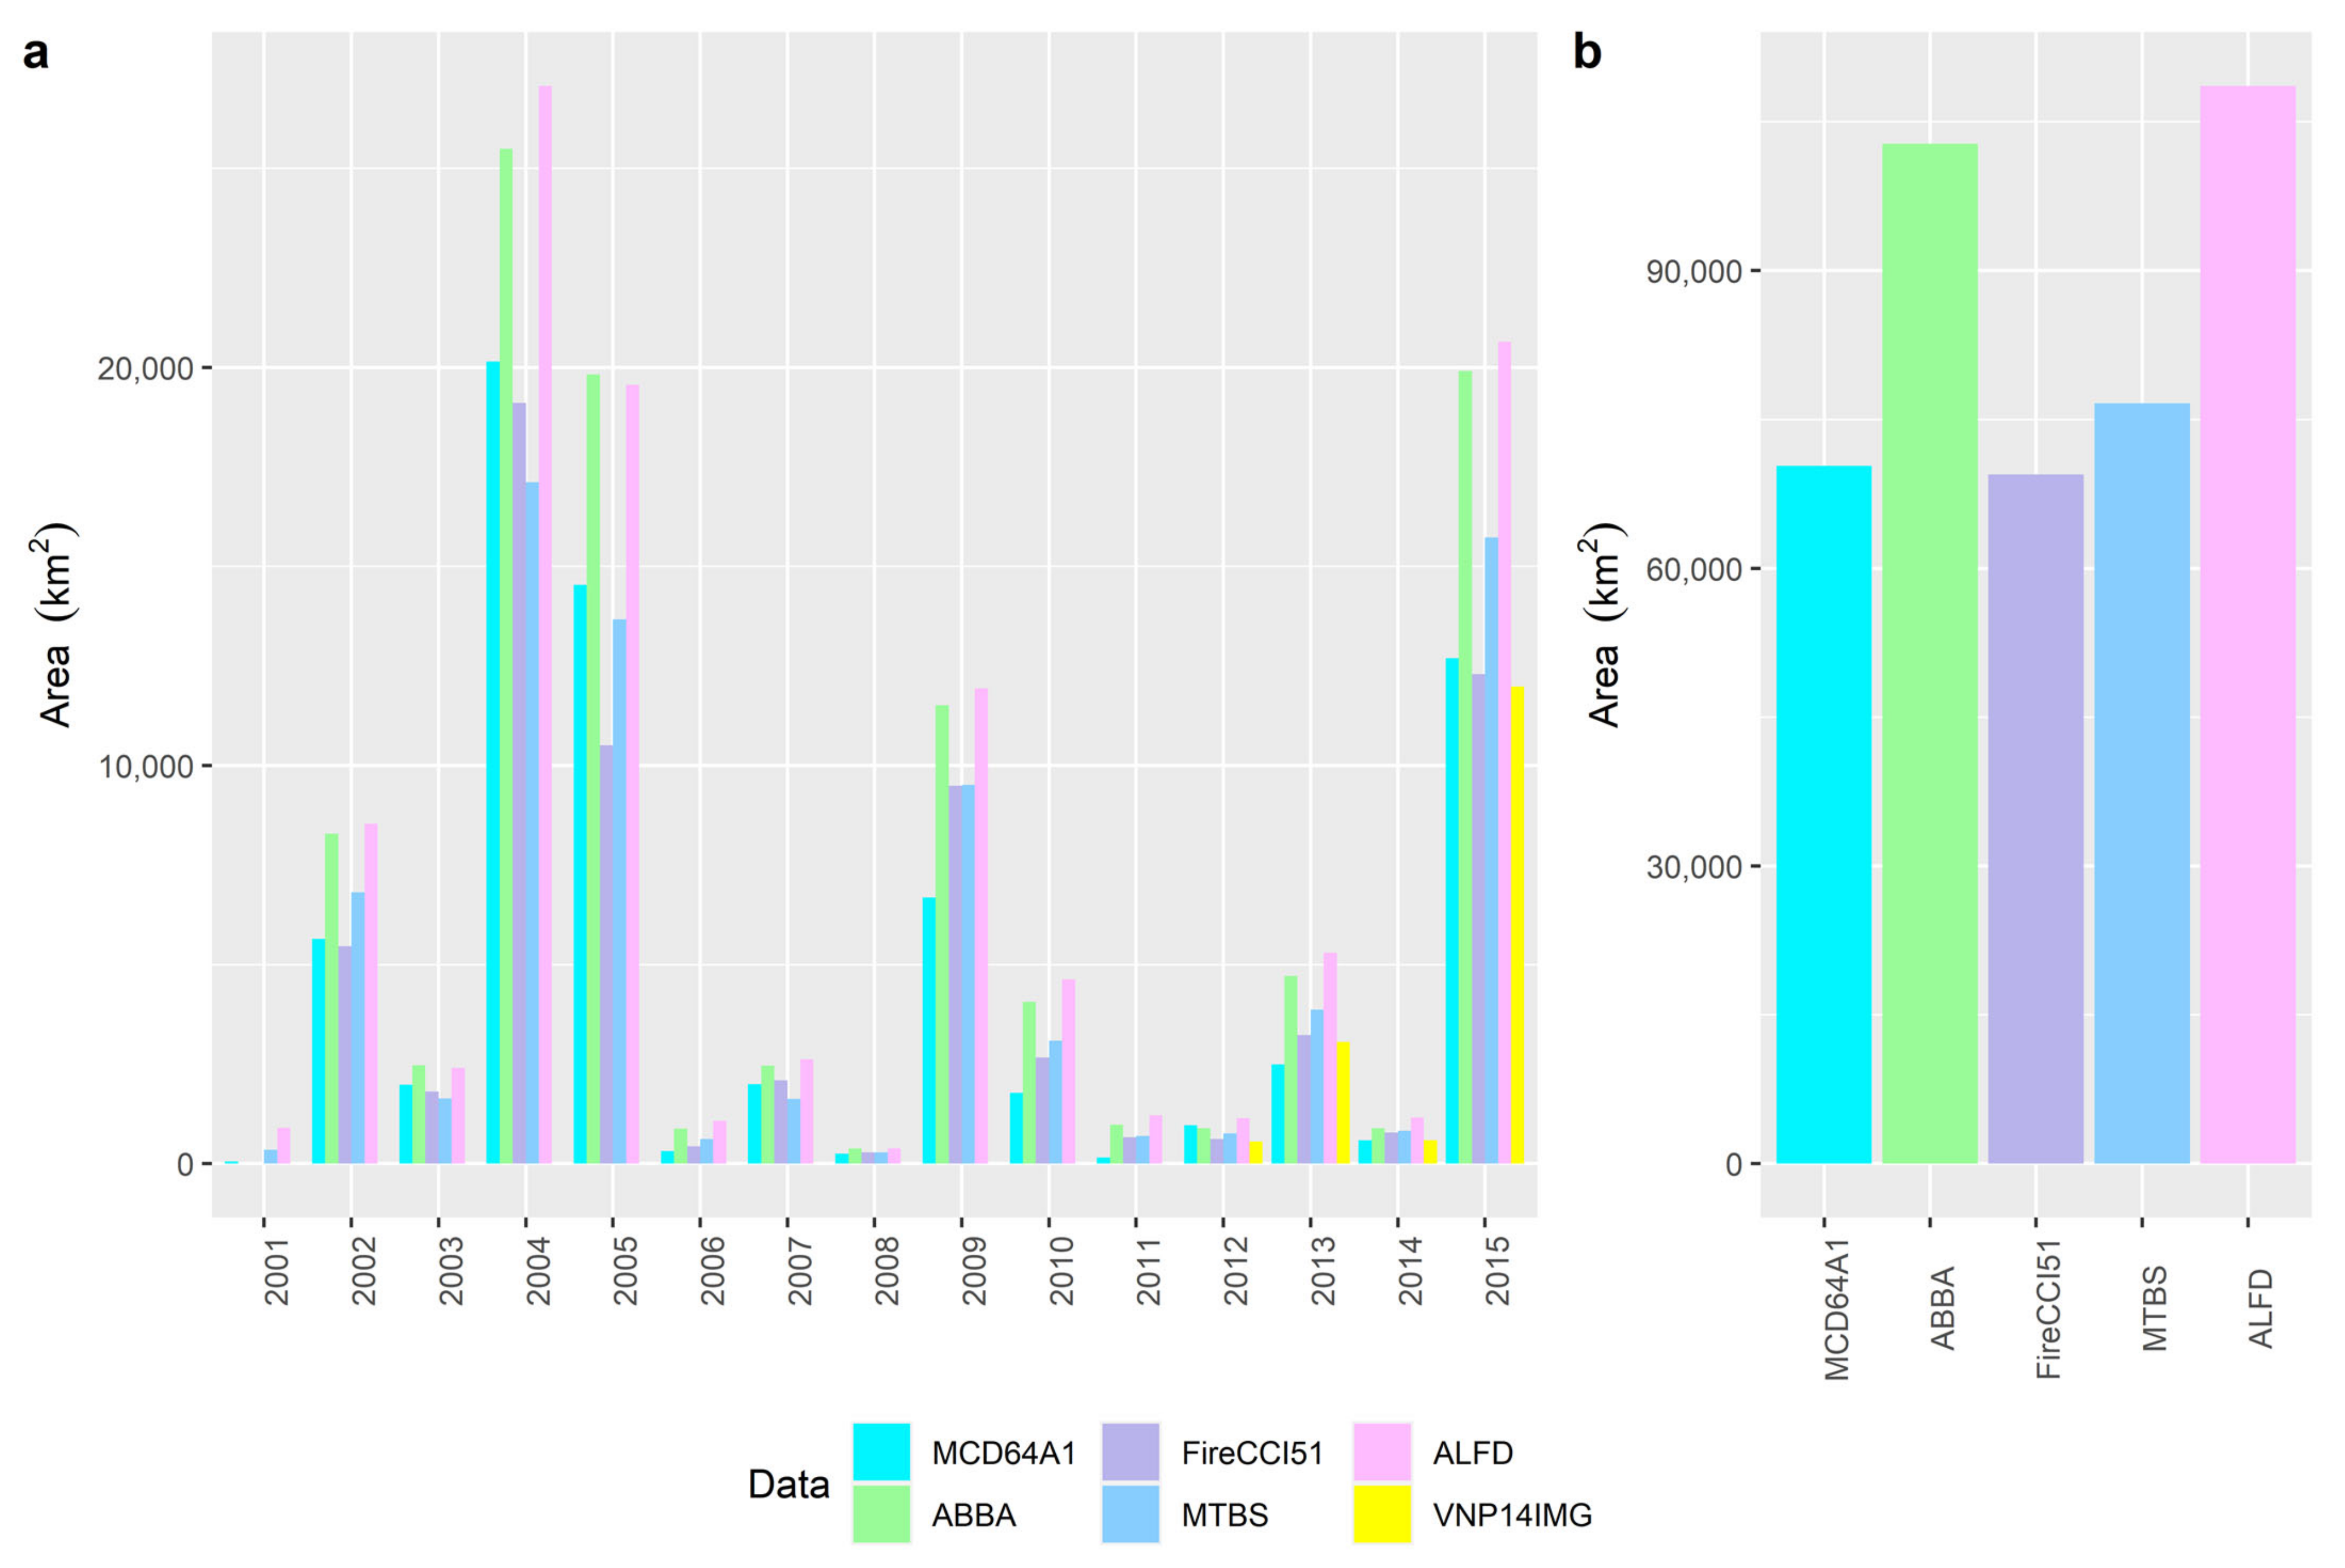
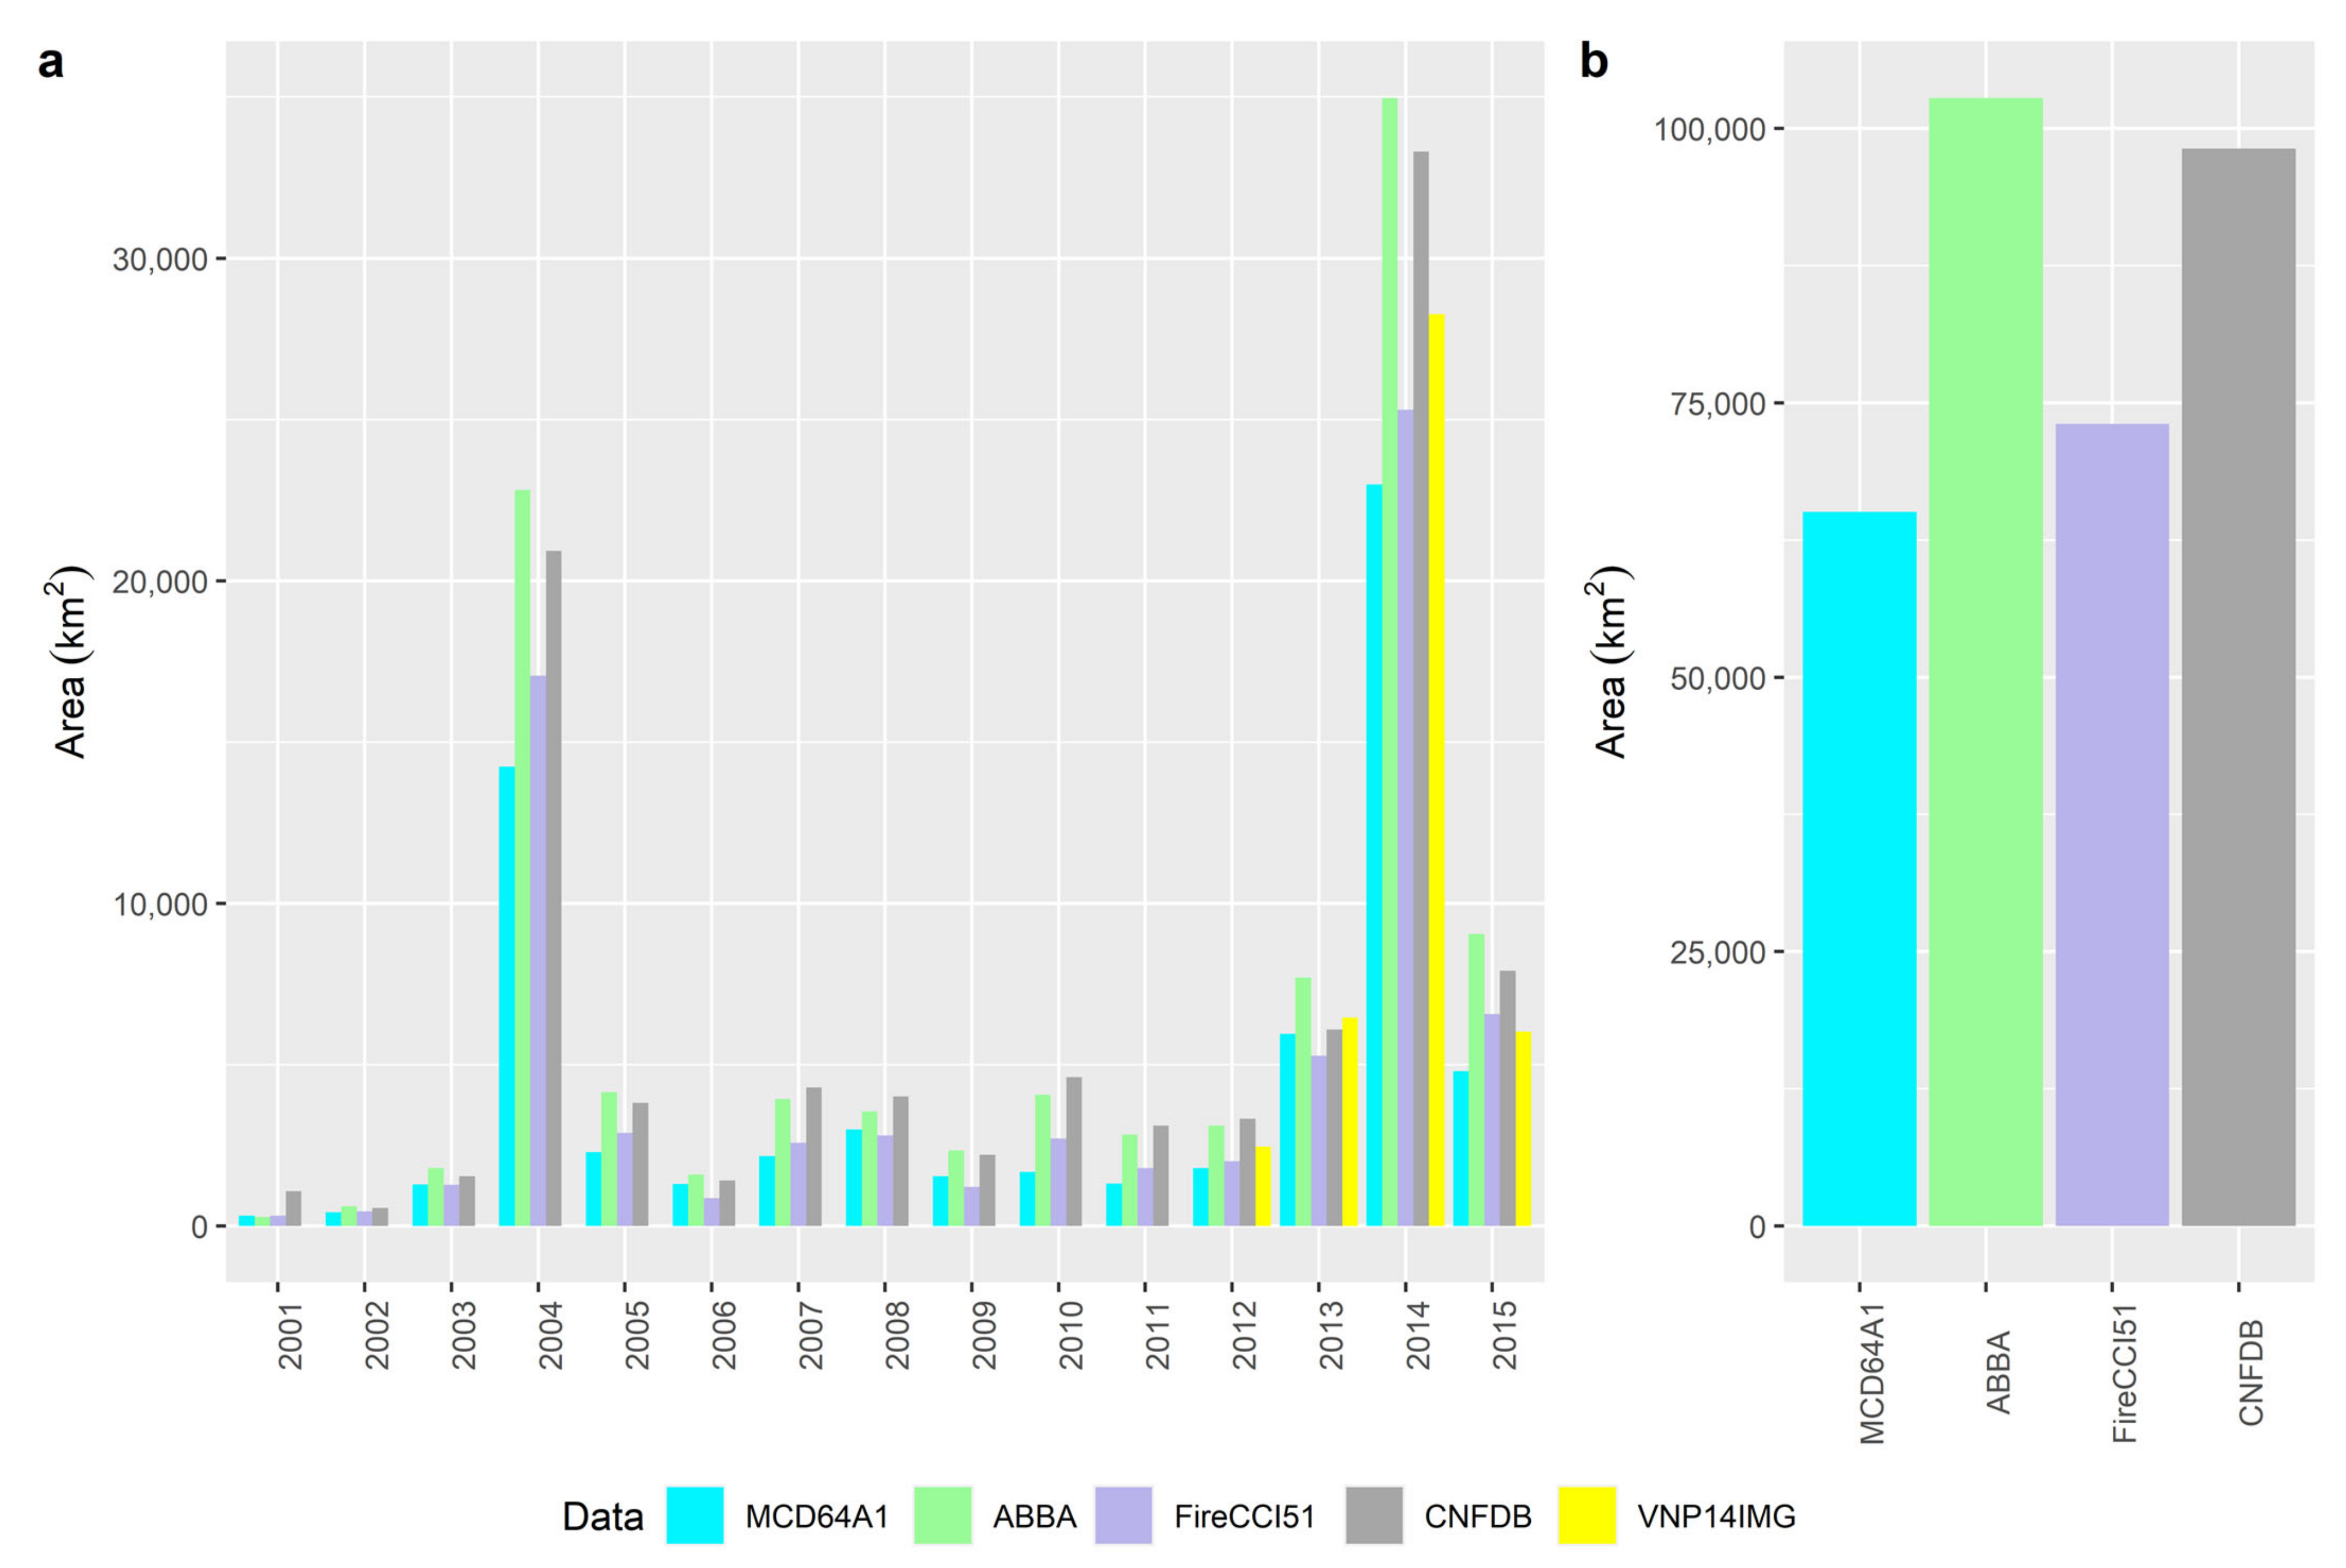
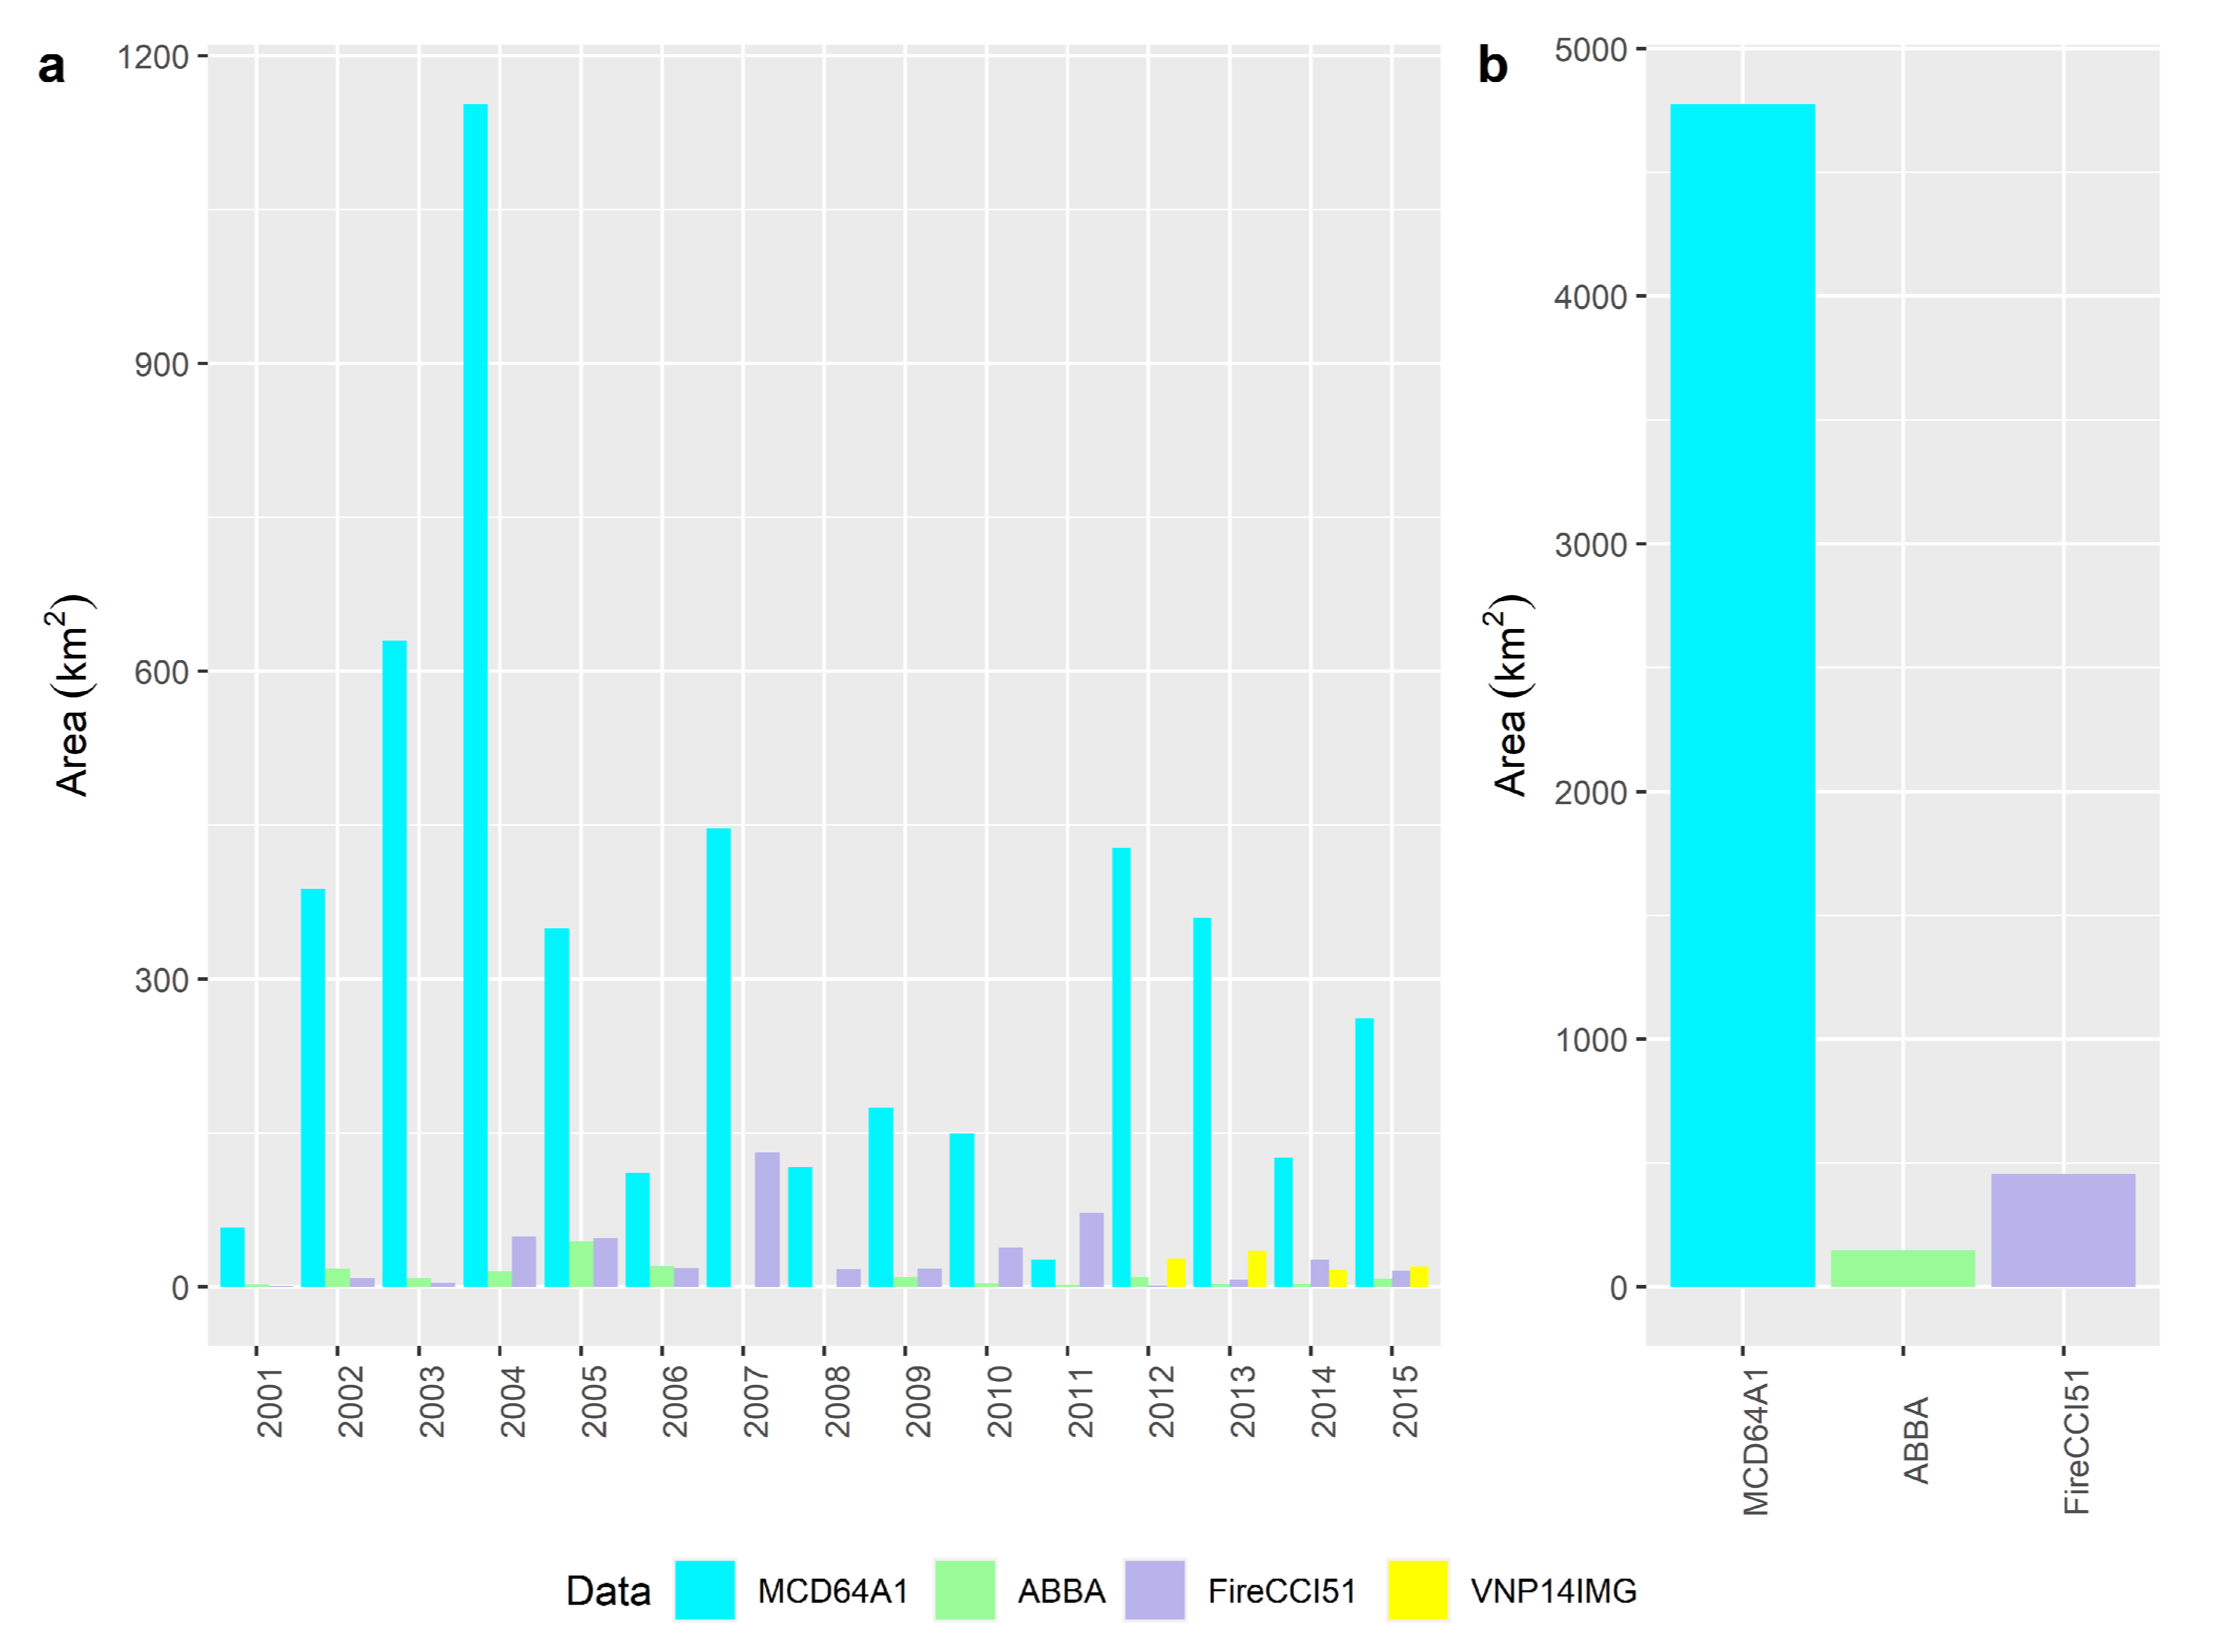
The burned areas mapped by the ABBA product are consistently larger than those mapped by MCD64A1 and FireCCI51 in almost every year between 2001 and 2015 (Figure 2, Figure 3 and Figure 4) and across all geographic regions and biomes (Figure 5). Summed over the 15 years, ABBA maps 46% (Figure 2b), 58% (Figure 3b), and 41% (Figure 4b) more burned areas than MCD64A1 in Alaska, Canada, and the circumpolar domain, respectively. The interannual variability in the amount of mapped burned area between MCD64A1 and ABBA is generally positively related to the annual total burned area: the more fires in a year, the larger the difference in mapped burned area between the two products. While the FireCCI51 product maps slightly more (5%) burned area over the circumpolar domain (Figure 4b) than the MCD64A1 product does, overall, its estimates of the total area burned are close to those of MCD64A1.
When compared with the reference datasets, especially MTBS, ALFD, and CNFDB, the three datasets that were produced with human guidance, ABBA estimates are considerably more consistent than the MCD64A1 and FireCCI51 estimates. In Alaska, the annual total burned area values as mapped by ABBA fall consistently between MTBS (which likely underestimates true burned areas because of the exclusion of fires that are smaller than 4 km2) and ALFD (which likely overestimates true burned areas because of the inclusion of unburned areas in every fire perimeter). Between MTBS and ALFD, the burned area mapped by ABBA is much closer to ALFD than to that mapped by MTBS, as ABBA’s annual total burned areas are usually within 5% difference from those of ALFD in years with a large number of acres burned (e.g., 2002, 2004, 2005, 2009, and 2015) (Figure 2). The grand total burned area as mapped by MCD64A1 and FireCCI51 in Alaska is smaller than that mapped by MTBS (Figure 2b), confirming that they likely underestimate the actual burned areas, since we have high confidence that MTBS underestimates the actual burned areas in Alaska due to its exclusion of smaller burn scars. During the four years where there was VNP14IMG data coverage (2012–2015), the quasi-burned area as mapped by VNP14IMG is similar to that as mapped by MCD64A1 and FireCCI51 and consistently lower than MTBS, ALFD, and ABBA in Alaska (Figure 2a).
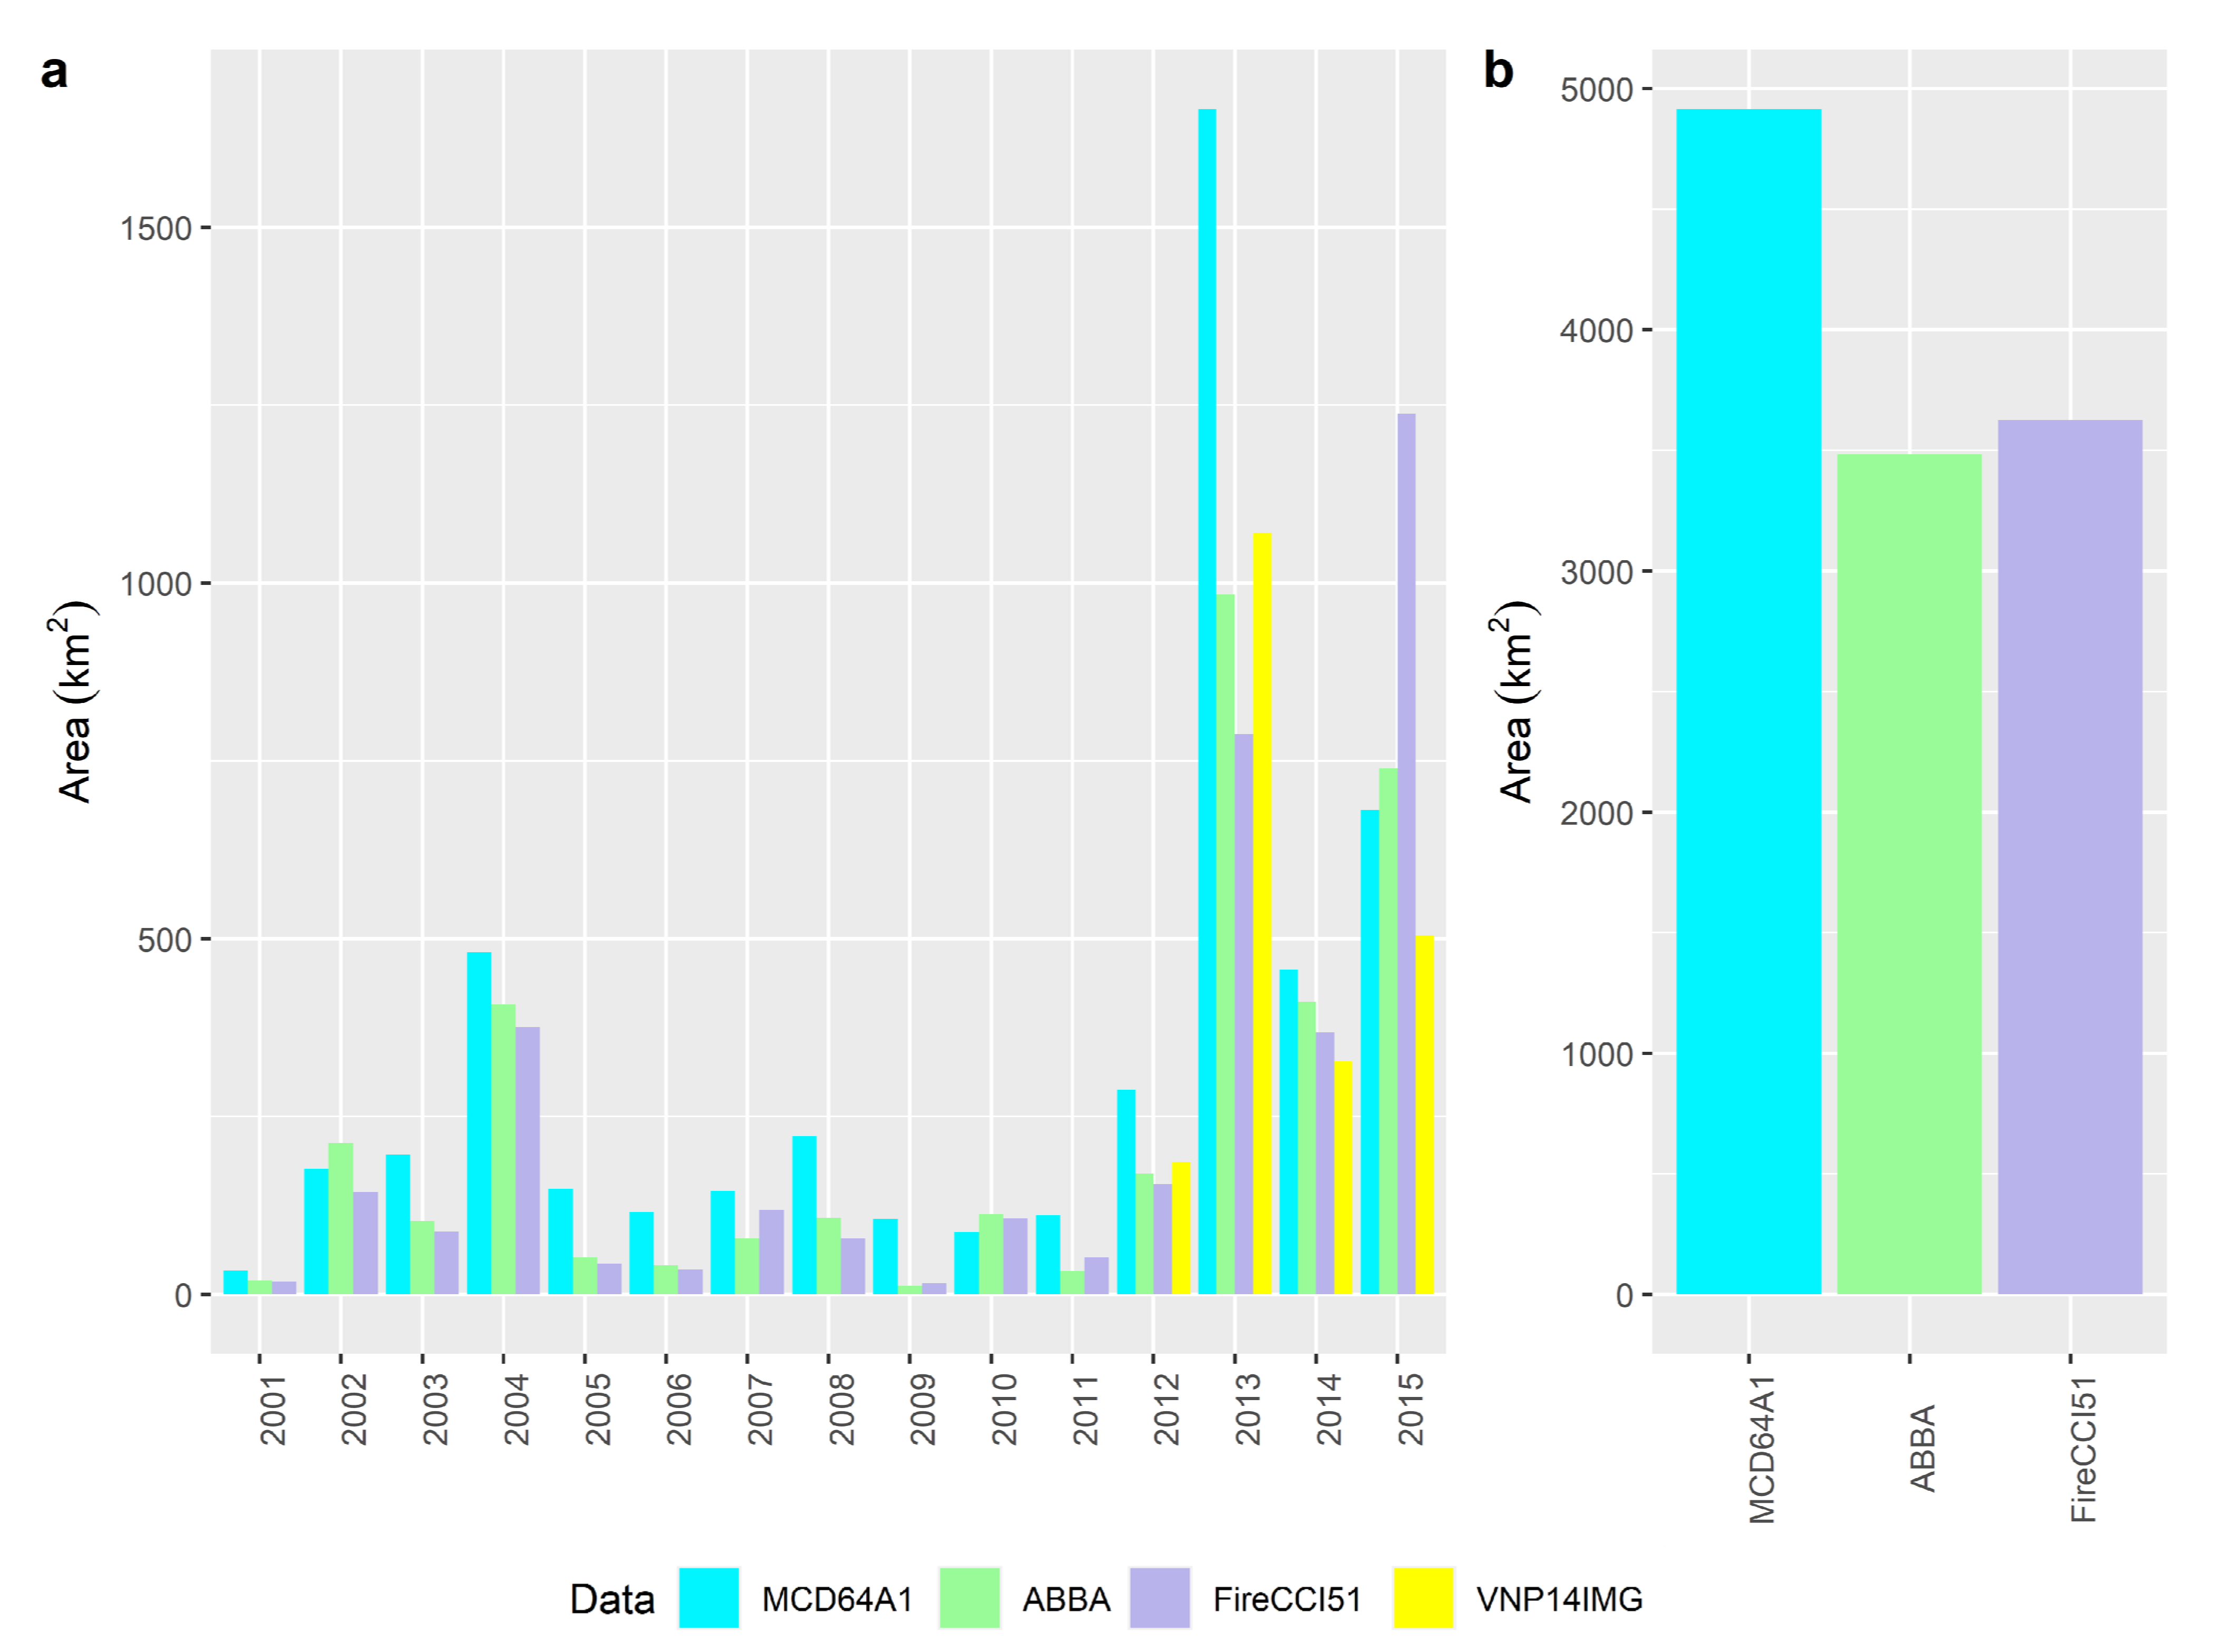
Similar patterns exist in Canada as well, where ABBA is shown to be more consistent with the reference CNFDB dataset. Both MCD64A1 and FireCCI51 map much smaller total burned areas than ABBA does, with MCD64A1 mapping the least amount of burned areas in Canada (Figure 3). The quasi-burned areas mapped by VNP14IMG are still lower than ABBA but higher than MCD64A1 and FireCCI51 (Figure 3a). Over the circumpolar domain, ABBA maps the most amount of burned areas (41% more than MCD64A1), followed by FireCCI51 (5% more than MCD64A1) (Figure 4). The VNP14IMG quasi-burned area totaled over 2012–2015 is more consistent with ABBA than with the other two burned area products.
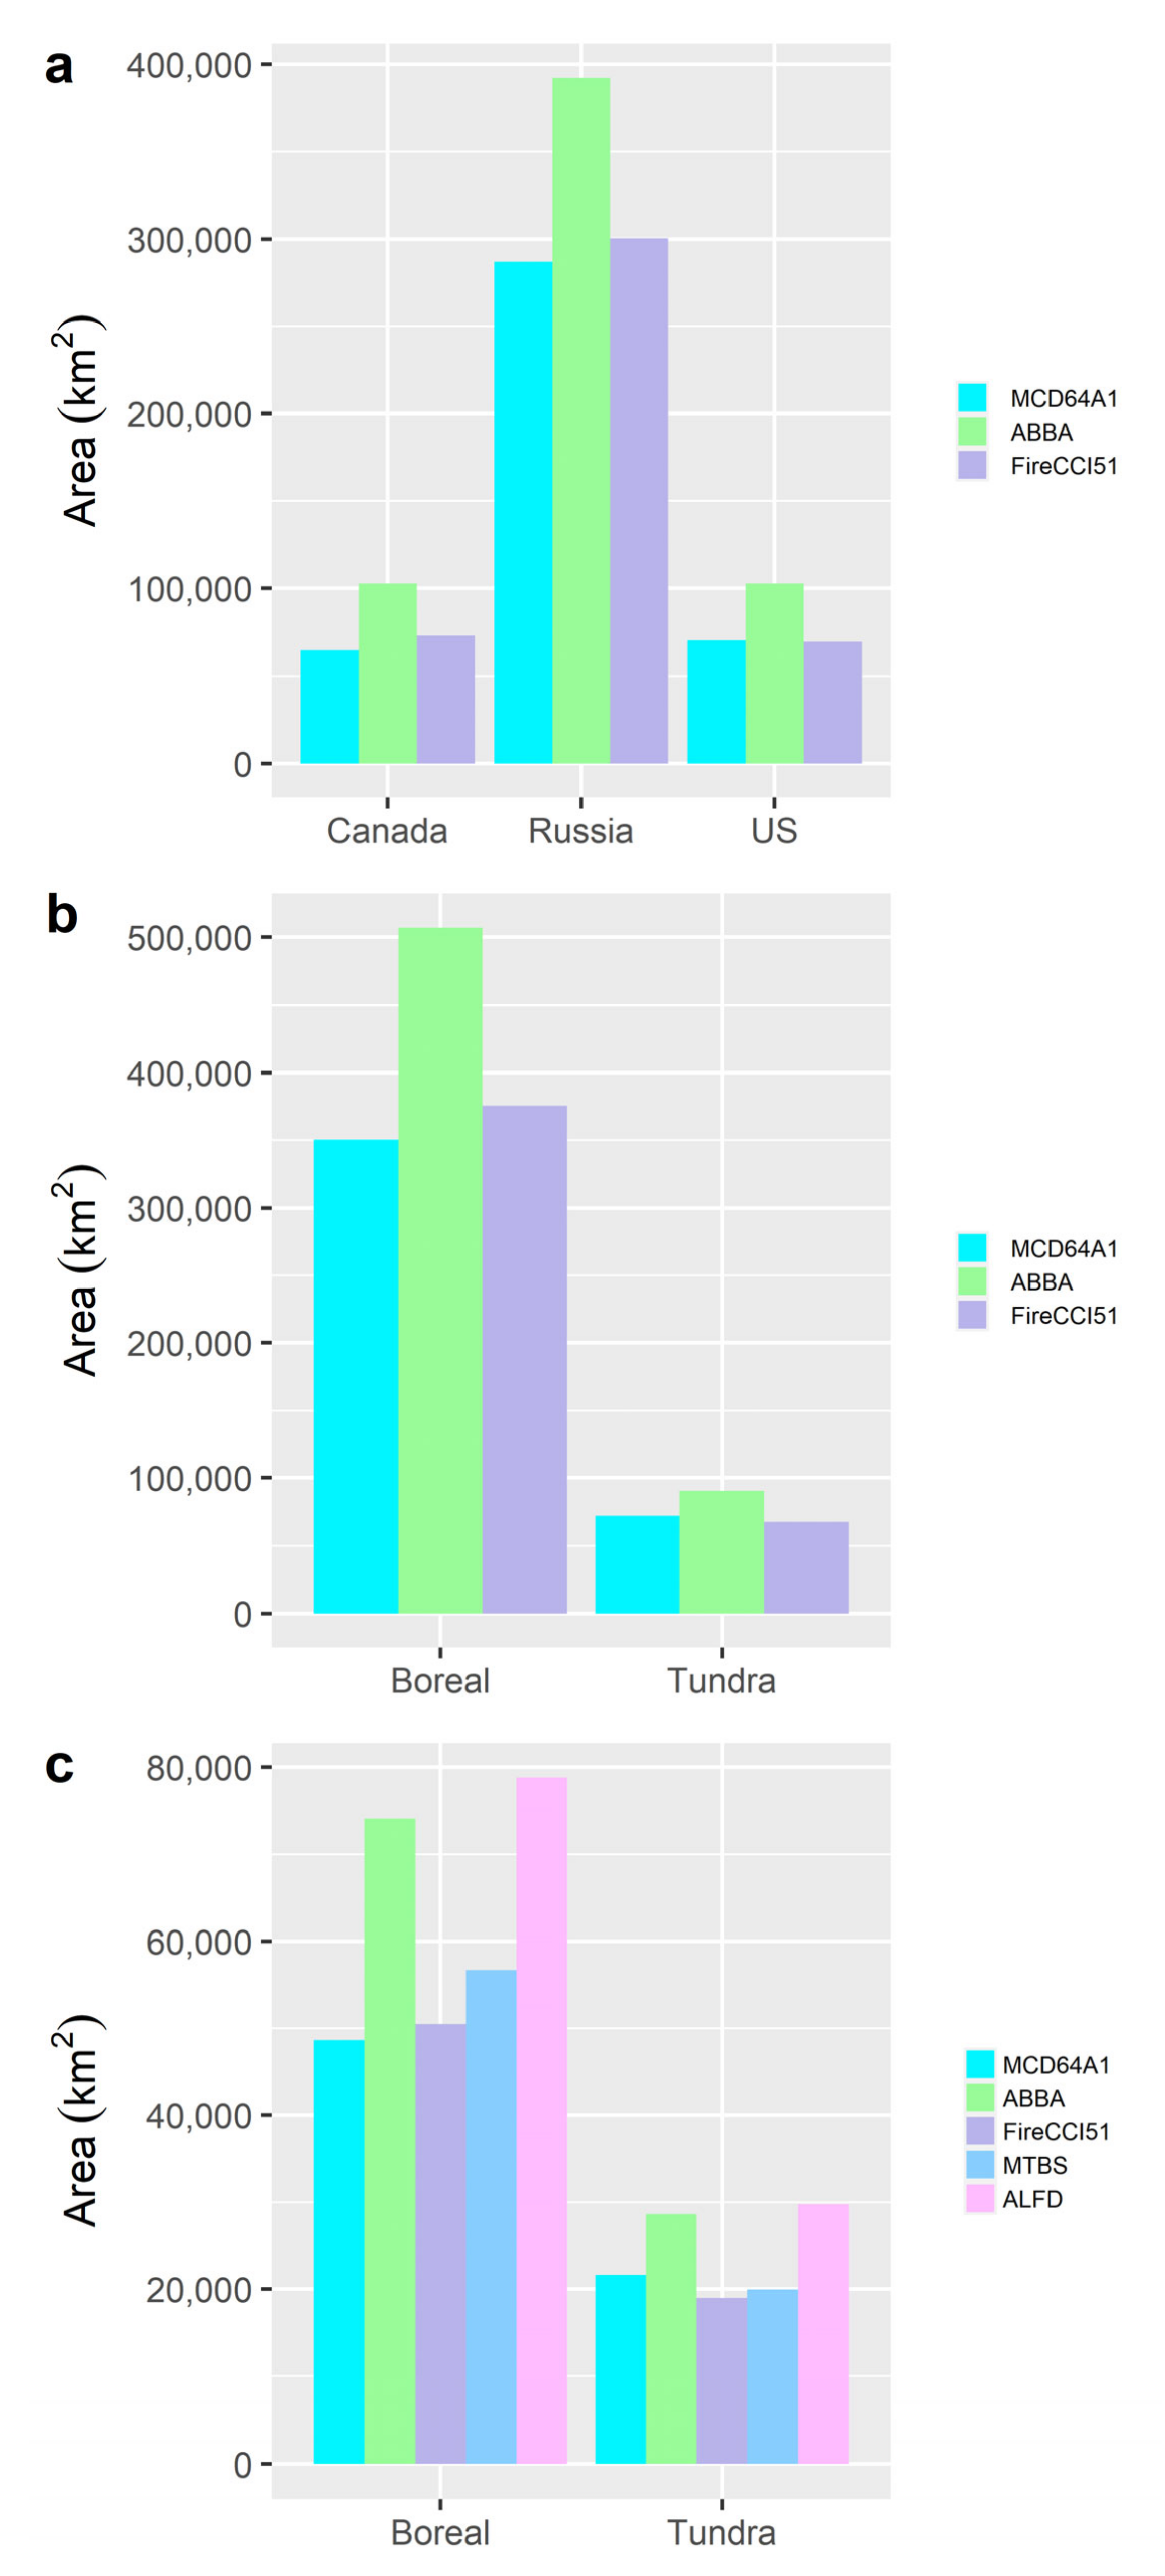
A spatial breakdown of mapped burned areas by the three countries that comprise the majority of the circumpolar study domain (i.e., Canada, Russia, and the US (Alaska)) is depicted in Figure 5a. Burned areas mapped by the three products are much higher in Russia than in Canada and the US. In addition, in each of the three countries, ABBA maps more burned areas than the other two products, and the difference between ABBA and MCD64A1/FireCCI51 in terms of the total burned area is largest in Russia, where ABBA maps 1.05 × 10⁵ km2 more burned area than MCD64A1 does, whereas, in Canada and the US, the differences between the two products are 3.8 × 10⁴ km2 and 3.2 × 10⁴ km2, respectively. In terms of the burned area distribution between boreal forests and tundra, all three burned area products map more burned areas in the boreal forest biome than in the tundra (Figure 5b). Similar to the grand total burned area mapped in Alaska, the total burned area mapped in Alaskan boreal forests and tundra shows that ABBA is more consistent with ALFD than MCD64A1 and FireCCI51 are (Figure 5c).

5.2. Omission Error

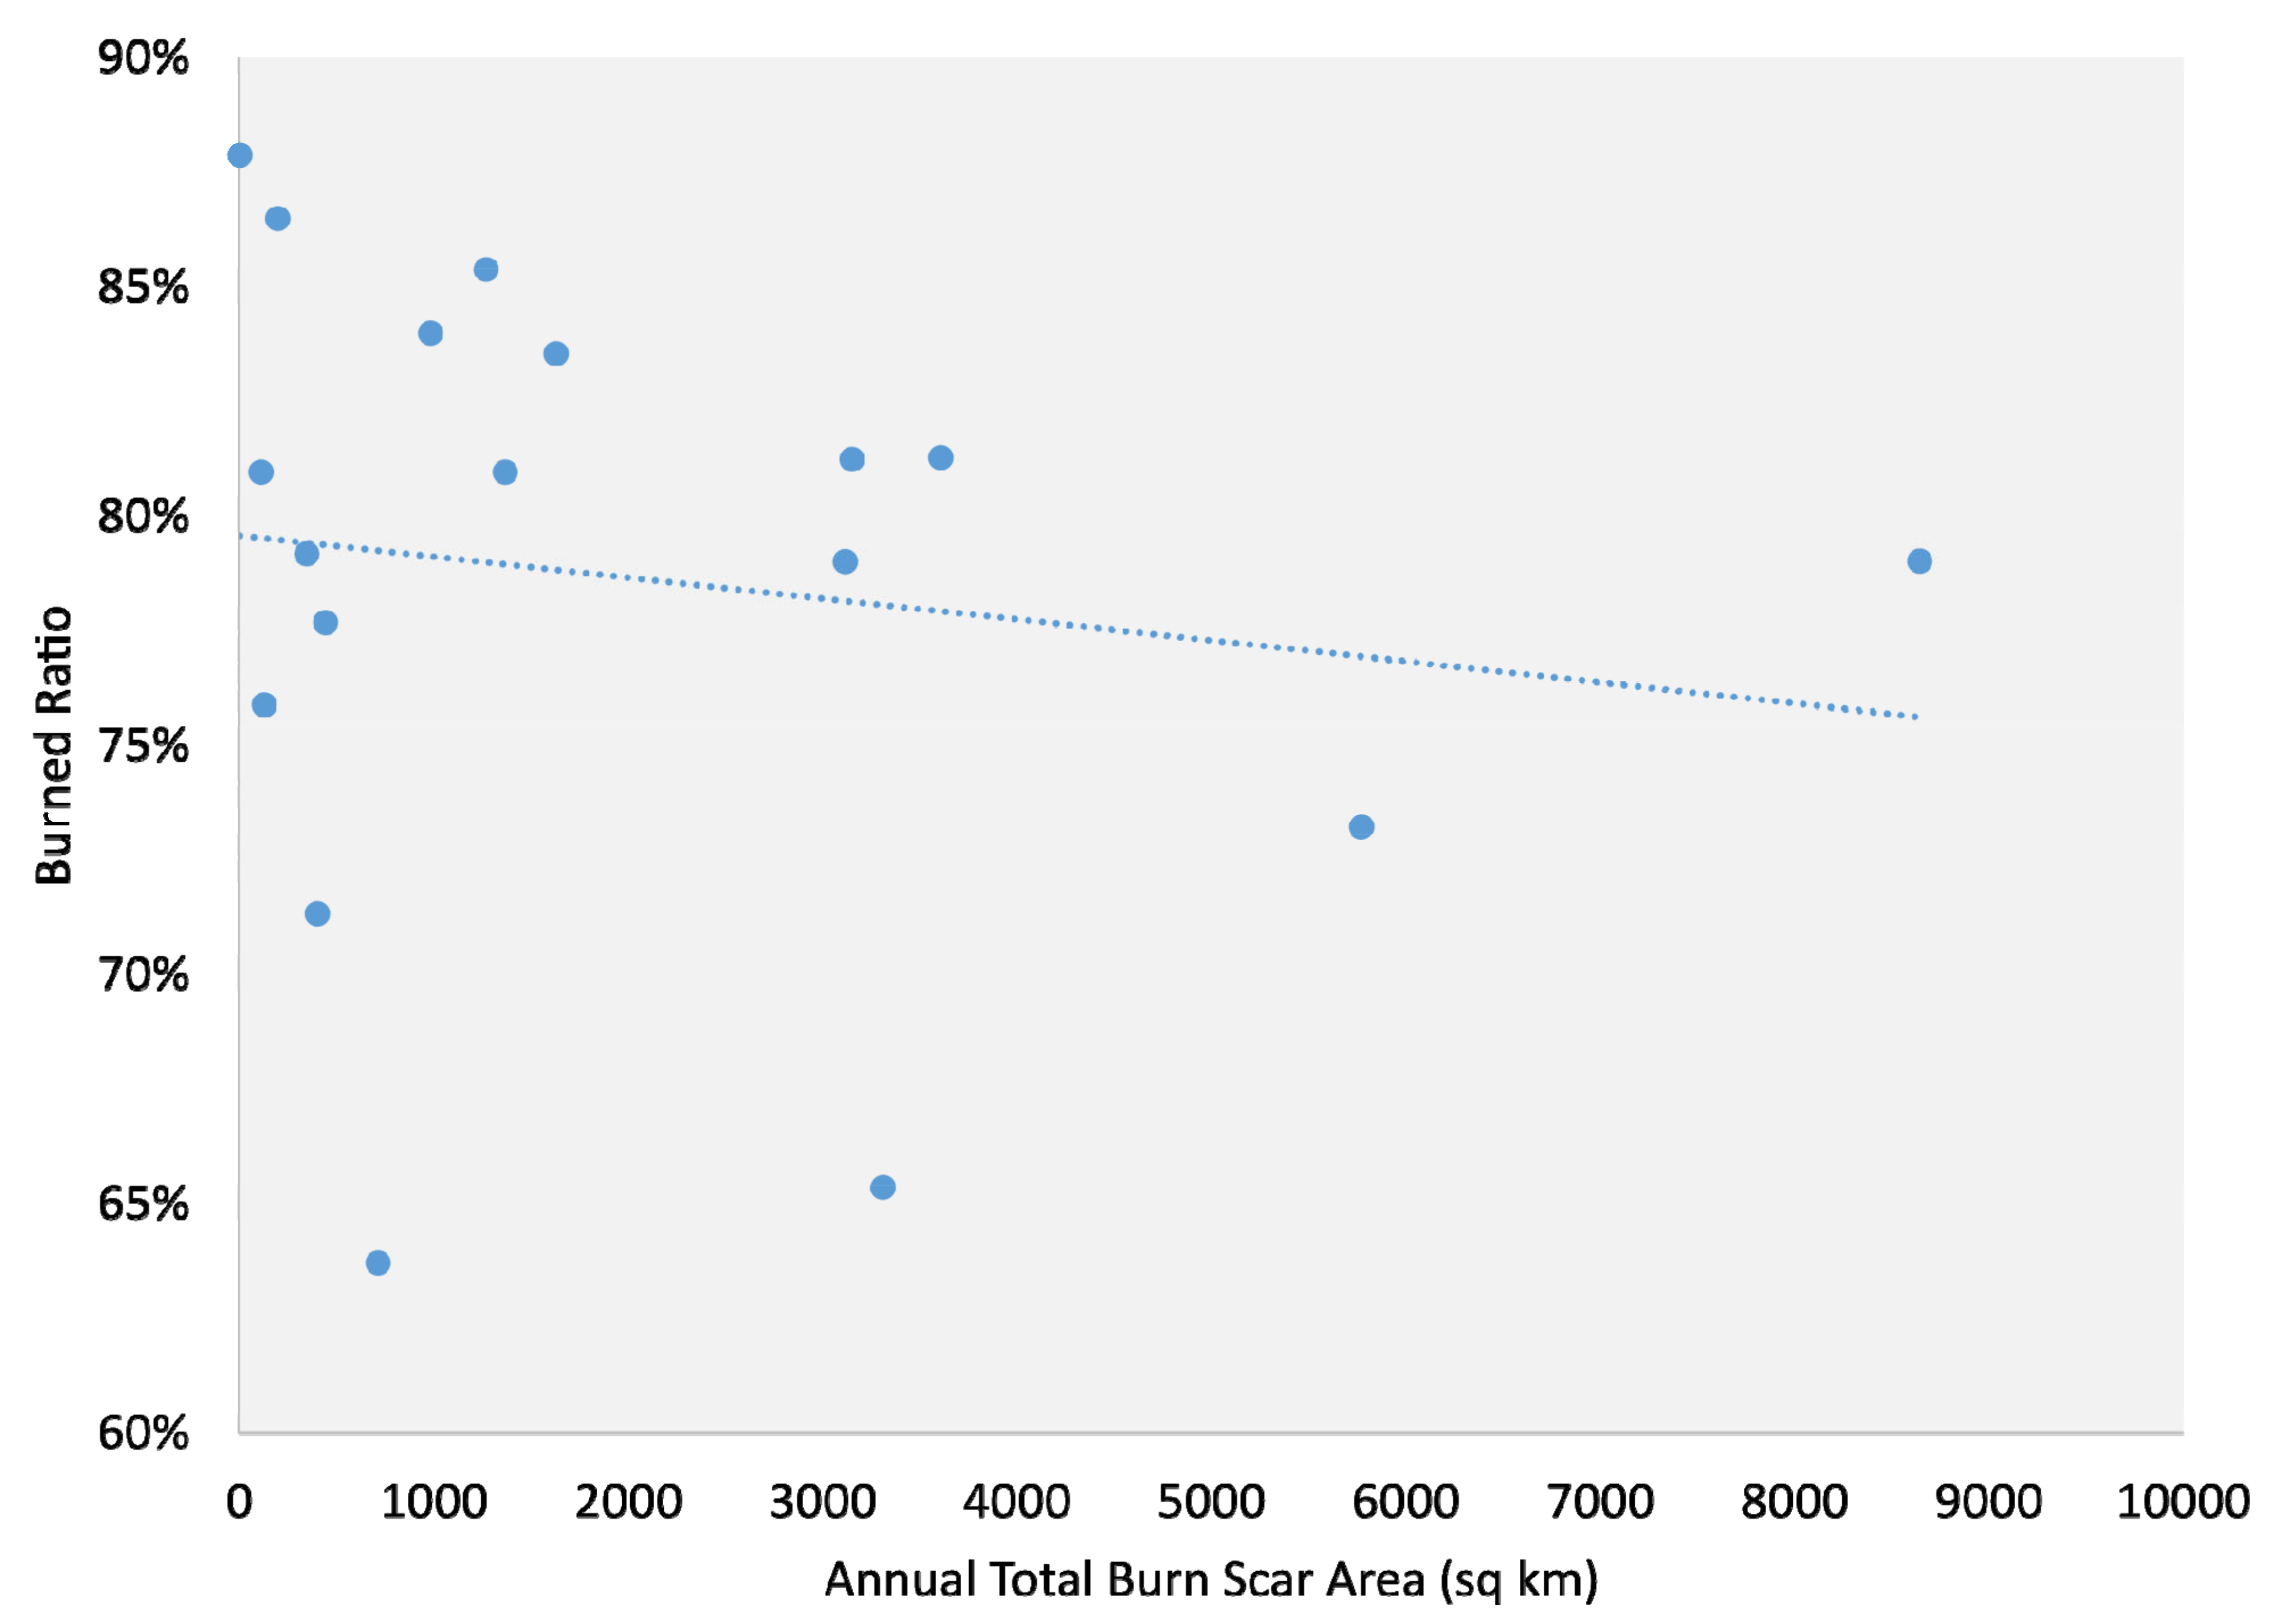
Table 2 lists the BR values calculated based on the MTBS data. Over the 19-year period, the total BR is 77%, with 27,299 km2 out of 35,228 km2 of burn perimeters delineated by the MTBS data confirmed to be burned. A detailed examination of the interannual distribution of the BR values shows that BR fluctuates quite substantially interannually between 64% (in 1998) and 88% (in 1997). In addition, BR is found to negatively correlate with the annual total burn perimeter area, with lower BR values tending to be associated with larger fire years (Figure 6).
The results of the omission error assessment, including OE and Amissed, are summarized in Table 3 (for Alaska) and Table 4 (for Canada). Our analyses show that MCD64A1 has the highest omission error rates out of the three burned area products in almost every year in Alaska (Table 3) and in all but three years in Canada (Table 4). Over the 15-year period, the total omission error rates of MCD64A1 are 45% and 46% for Alaska and Canada, respectively. FireCCI51 has slightly lower omission rates than MCD64A1 (39% and 37% for Alaska and Canada, respectively). The omission error rates of ABBA are considerably smaller, with the total omission error rates being 13% (for Alaska) and 15% (for Canada). The magnitude of the omission error for the three datasets is fairly consistent across individual years, with the exception being 2001 (when there were minimal fire activities in the North American HNL and the instrument onboard the Terra satellite was the only MODIS instrument for data acquisition). As a result, the omission error rates calculated for all three burned area products for 2001 are exceptionally high, with the OE values for Alaska approaching 100% for all three products. Based on the overall BR value of 77% (Table 2), as well as the Atotal and Amapped values (Table 3 and Table 4), we estimated Amissed, i.e., the “true” burned area that is missed by each burned area product, with ALFD and CNFDB as references. Our calculation shows that during 2001–2015, the total area missed by the MCD64A1 product reached 37,964 km2 and 36,804 km2 in Alaska and Canada, respectively.

5.3. Commission Error

Our examination of the distribution of the burned areas outside of the buffer zones (created based on ALFD and CNFDB), as mapped by the three burned area products, shows both similarities and dissimilarities in the performance of the three burned area products between Alaska and Canada. In both Alaska and Canada, MCD64A1 maps the most amount of burned areas outside the fire perimeters delineated by the corresponding reference fire products (ALFD in Alaska and CNFDB in Canada), with the total mapped area in both regions approaching 5000 km2 (Figure 7b and Figure 8b). The other two burned area products, ABBA and FireCCI51, map similar amounts of total burned areas outside of known fire perimeters in both regions (Figure 7b and Figure 8b). However, the differences between MCD64A1 and ABBA/FireCCI51 in terms of total burned areas mapped outside of known fire perimeters differ substantially between Alaska and Canada. In Alaska, only a small amount of burned areas are mapped by either ABBA or FireCCI51 (Figure 7b); whereas in Canada, considerable amounts of burned areas are mapped by both ABBA and FireCCI51 (Figure 8b). As for the interannual variation in the difference between MCD64A1 and ABBA/FireCCI51, in Alaska, the dominance of MCD64A1 over the other two is significant in almost every year (Figure 7a), whereas, in Canada, the interannual variation in the difference between the burned area products is generally not high, with two exceptions being 2013 (where MCD64A1 maps substantially more areas than the other two) and 2015 (where FireCCI51 maps considerably more than both MCD64A1 and ABBA) (Figure 8a). Notably, the interannual distribution of the quasi-burned area mapped by the VNP14IMG closely resembles that of ABBA’s in both Alaska (Figure 7) and Canada (Figure 8) among the three burned area products under evaluation.
As shown in Table 5, we found that in terms of the commission error rates, most candidate points for the three burned area products were false positives (i.e., unburned pixels mistakenly mapped as burned). In Alaska, the commission error rates for MCD64A1 were especially high (2003: 100%, 2004: 100%), followed by FireCCI51 (2003: 100%, 2004: 93%) and ABBA (2003: 90%, 2004: 78%). In Canada, each burned area product has one commission error rate that is above 50% (58% for MCD64A1 in 2013, 73% for ABBA in 2013, and 74% for FireCCI51 in 2015).

6. Discussion

The MODIS fire products have reshaped our collective understanding of the global wildfire regimes. The MCD64A1 product, by incorporating both reflectance changes and active fire detections, shows a higher performance than its precursor, the MCD54A1 product [43,74], and has been adopted widely to characterize fire regimes at the regional [75,76], continental [19,77], and global scales [14,15]. In this project, using high-quality fire history data available for Alaska and Canada, we systematically evaluated the performance of the MCD64A1 product in the boreal forest and tundra regions. Rather than relying on the conventional confusion matrices, here we designed a two-step evaluation scheme that evaluated the omission error and commission error separately, allowing for the mapping errors to be highlighted.
Our analyses show that the MCD64A1 product has high omission error rates compared against the ALFD and CNFDB reference datasets in almost every year between 2001 and 2015 (Table 3 and Table 4). In total, nearly half of burned areas mapped by ALFD and CNFDB burned area data were missed by MCD64A1 over the 15-year period. Previous research [43] has noted the underestimation of MCD64A1 in the boreal zone; however, the level of underestimation in this study is higher than what the authors previously indicated. A closer inspection of the performance of the MCD64A1 product in mapping the individual burn scars when compared with the ALFD fire perimeters reveals that MCD64A1’s underestimation of the burned areas primarily stems from the lack of ability to map out the full extent of the burn scars, rather than missing the burn scars completely (Figure 9). At the same time, our analyses indicate that the commission error of the MCD64A1 product is also high. We found that during 2001–2015, 4779 km2 (Figure 7) and 4915 km2 (Figure 8) of burned areas are mapped by MCD64A1 to be located outside the fire perimeters reported by ALFD and by CNFDB, respectively. Through inspecting random sample points generated out of all the burned pixels mapped outside known burn scars in a few years when large numbers of such pixels were found (i.e., 2003 and 2004 for Alaska and 2013 and 2015 for Canada), we found that most of these burned areas were erroneous (Table 5). This issue was particularly striking in Alaska, where all burned pixels mapped by MCD64A1 outside known fire perimeters were found to be misclassifications. We compared the distribution of these burned areas with the elevation and slope layers we created based on the Digital Elevation Model (DEM) produced by the Advanced Spaceborne Thermal Emission and Reflection Radiometer (ASTER) and found that a majority of these problematic pixels are spatially consistent with high-elevation and high-slope regions in Alaska. Even though identifying the specific cause of these errors is beyond the scope of this study, we suspect that they are the results of the reduced mapping accuracy of MCD64A1’s algorithm when the ground surface shows high percentages of shadow and/or snow cover. In addition to shadow and snow cover, other surface features were also found to be associated with MCD64A1’s false positives (e.g., bare ground and short-lived vegetation), although to a lesser degree.
Even though MCD64A1 has been shown to have both high commission errors and high omission errors, the commission error is unable to offset the amount of burned areas that are missed by MCD64A1. In other words, the high omission error of MCD64A1 is directly responsible for the observed underestimation of burned areas by MCD64A1 as observed in Alaska (Figure 2) and Canada (Figure 3) when compared with ALFD and CNFDB, respectively. If we accept the hypothesis that an average of 77% of the areas within each fire perimeter are actually burned, MCD64A1 underestimates 37,964 km2 and 36,804 km2 of burned area in Alaska and Canada, respectively. This means that during the 15-year period between 2001 and 2015, an estimation of 74,768 km2 (this number is estimated based on the hypothesis that an average of 77% of the areas within each fire perimeter are actually burned within Alaskan forests between 1984 and 2002. The authors acknowledge the uncertainty associated with it since the Burn Ratio varies significantly interannually and between different ecosystems), an area that is equivalent to the land area of the state of South Carolina, USA, of burned areas were missed by MCD64A1 in boreal forests and tundra north of 60° N in North America. Although similar quantitative estimation could not be implemented in Eurasian boreal forests and tundra due to a lack of a reference dataset that is equivalent to ALFD and CNFDB, we are confident that this Arctic-specific limitation of the MCD64A1 product is likely to hold true in Eurasia because (1) the MCD64A1 is produced based on a global algorithm, (2) the climate and environmental conditions in Eurasian boreal forests and tundra are generally similar to their North American counterparts, and (3) the analyses using the VNP14IMG data as a reference on two different continents revealed similar results. In this project, the VNP14IMG active fire data were adopted as a quasi burned area product. Because it overlaps with other reference datasets in both space (Alaska and Canada) and time (2012–2015) and is distinctly separate from MODIS, which is incorporated in the algorithm for both MCD64A1 and ABBA, the VNP14IMG active fire data offers a unique benchmark with which both evaluated and reference fire datasets used in our project could be compared. Considering Russian wildfires are much more pervasive than North American fires are (Figure 5a), we expect that the total amount of missed burned areas in Eurasian forests is more likely to be higher than to be lower than that in North America. Taken together, our findings indicate that the previous studies that relied on MCD64A1 as a key fire input are likely to underestimate the fire-related impacts across the HNL.
Compared to MCD64A1, FireCCI51, another global burned area product, has higher performance in terms of commission error. In Alaska, FireCCI51 maps considerably less burned area outside the ALFD fire perimeters (Figure 7 and Table 5). In Canada, FireCCI51 is able to identify burned areas that are not accounted for by the CNFDB fire perimeters, particularly in 2013 (only 6% of the 25,261 km2 of burned areas mapped by FireCCI51 outside the CNFDB fire perimeters were found to be erroneous, as shown in Table 5). However, FireCCI51 suffers from the same primary issue that affects MCD64A1, i.e., high omission error. We found that over the 15-year period, about 40% of burned areas in North America north of 60° N were missed by FireCCI51, accounting for an area of 61,444 km2 (Table 3 and Table 4). Among the three coarse resolution datasets evaluated in this study, the regionally adapted ABBA product performs considerably better than both global algorithms (MCD64A1 and FireCCI51). It has substantially lower omission errors than MCD64A1 and FireCCI51 have (Table 3 and Table 4). While ABBA’s commission error rates are non-negligible (Table 5), we believe it still outperforms the other two products, considering ABBA maps the least amount of burned areas outside the known fire perimeters in both Alaska and Canada (Figure 7 and Figure 8). In terms of the interannual distribution, the burned area mapped by ABBA is consistently the closest to the burned areas mapped by ALFD (Figure 2) and CNFDB (Figure 3), the two historical wildfire datasets that have high spatial completeness over the study period. Across the circumpolar domain, ABBA’s burned area is noticeably higher than VNP14IMG quasi-burned area (Figure 4a), which is shown to be smaller than both MTBS and ALFD in Alaska (Figure 2a) and CNFDB in Canada (Figure 3a).
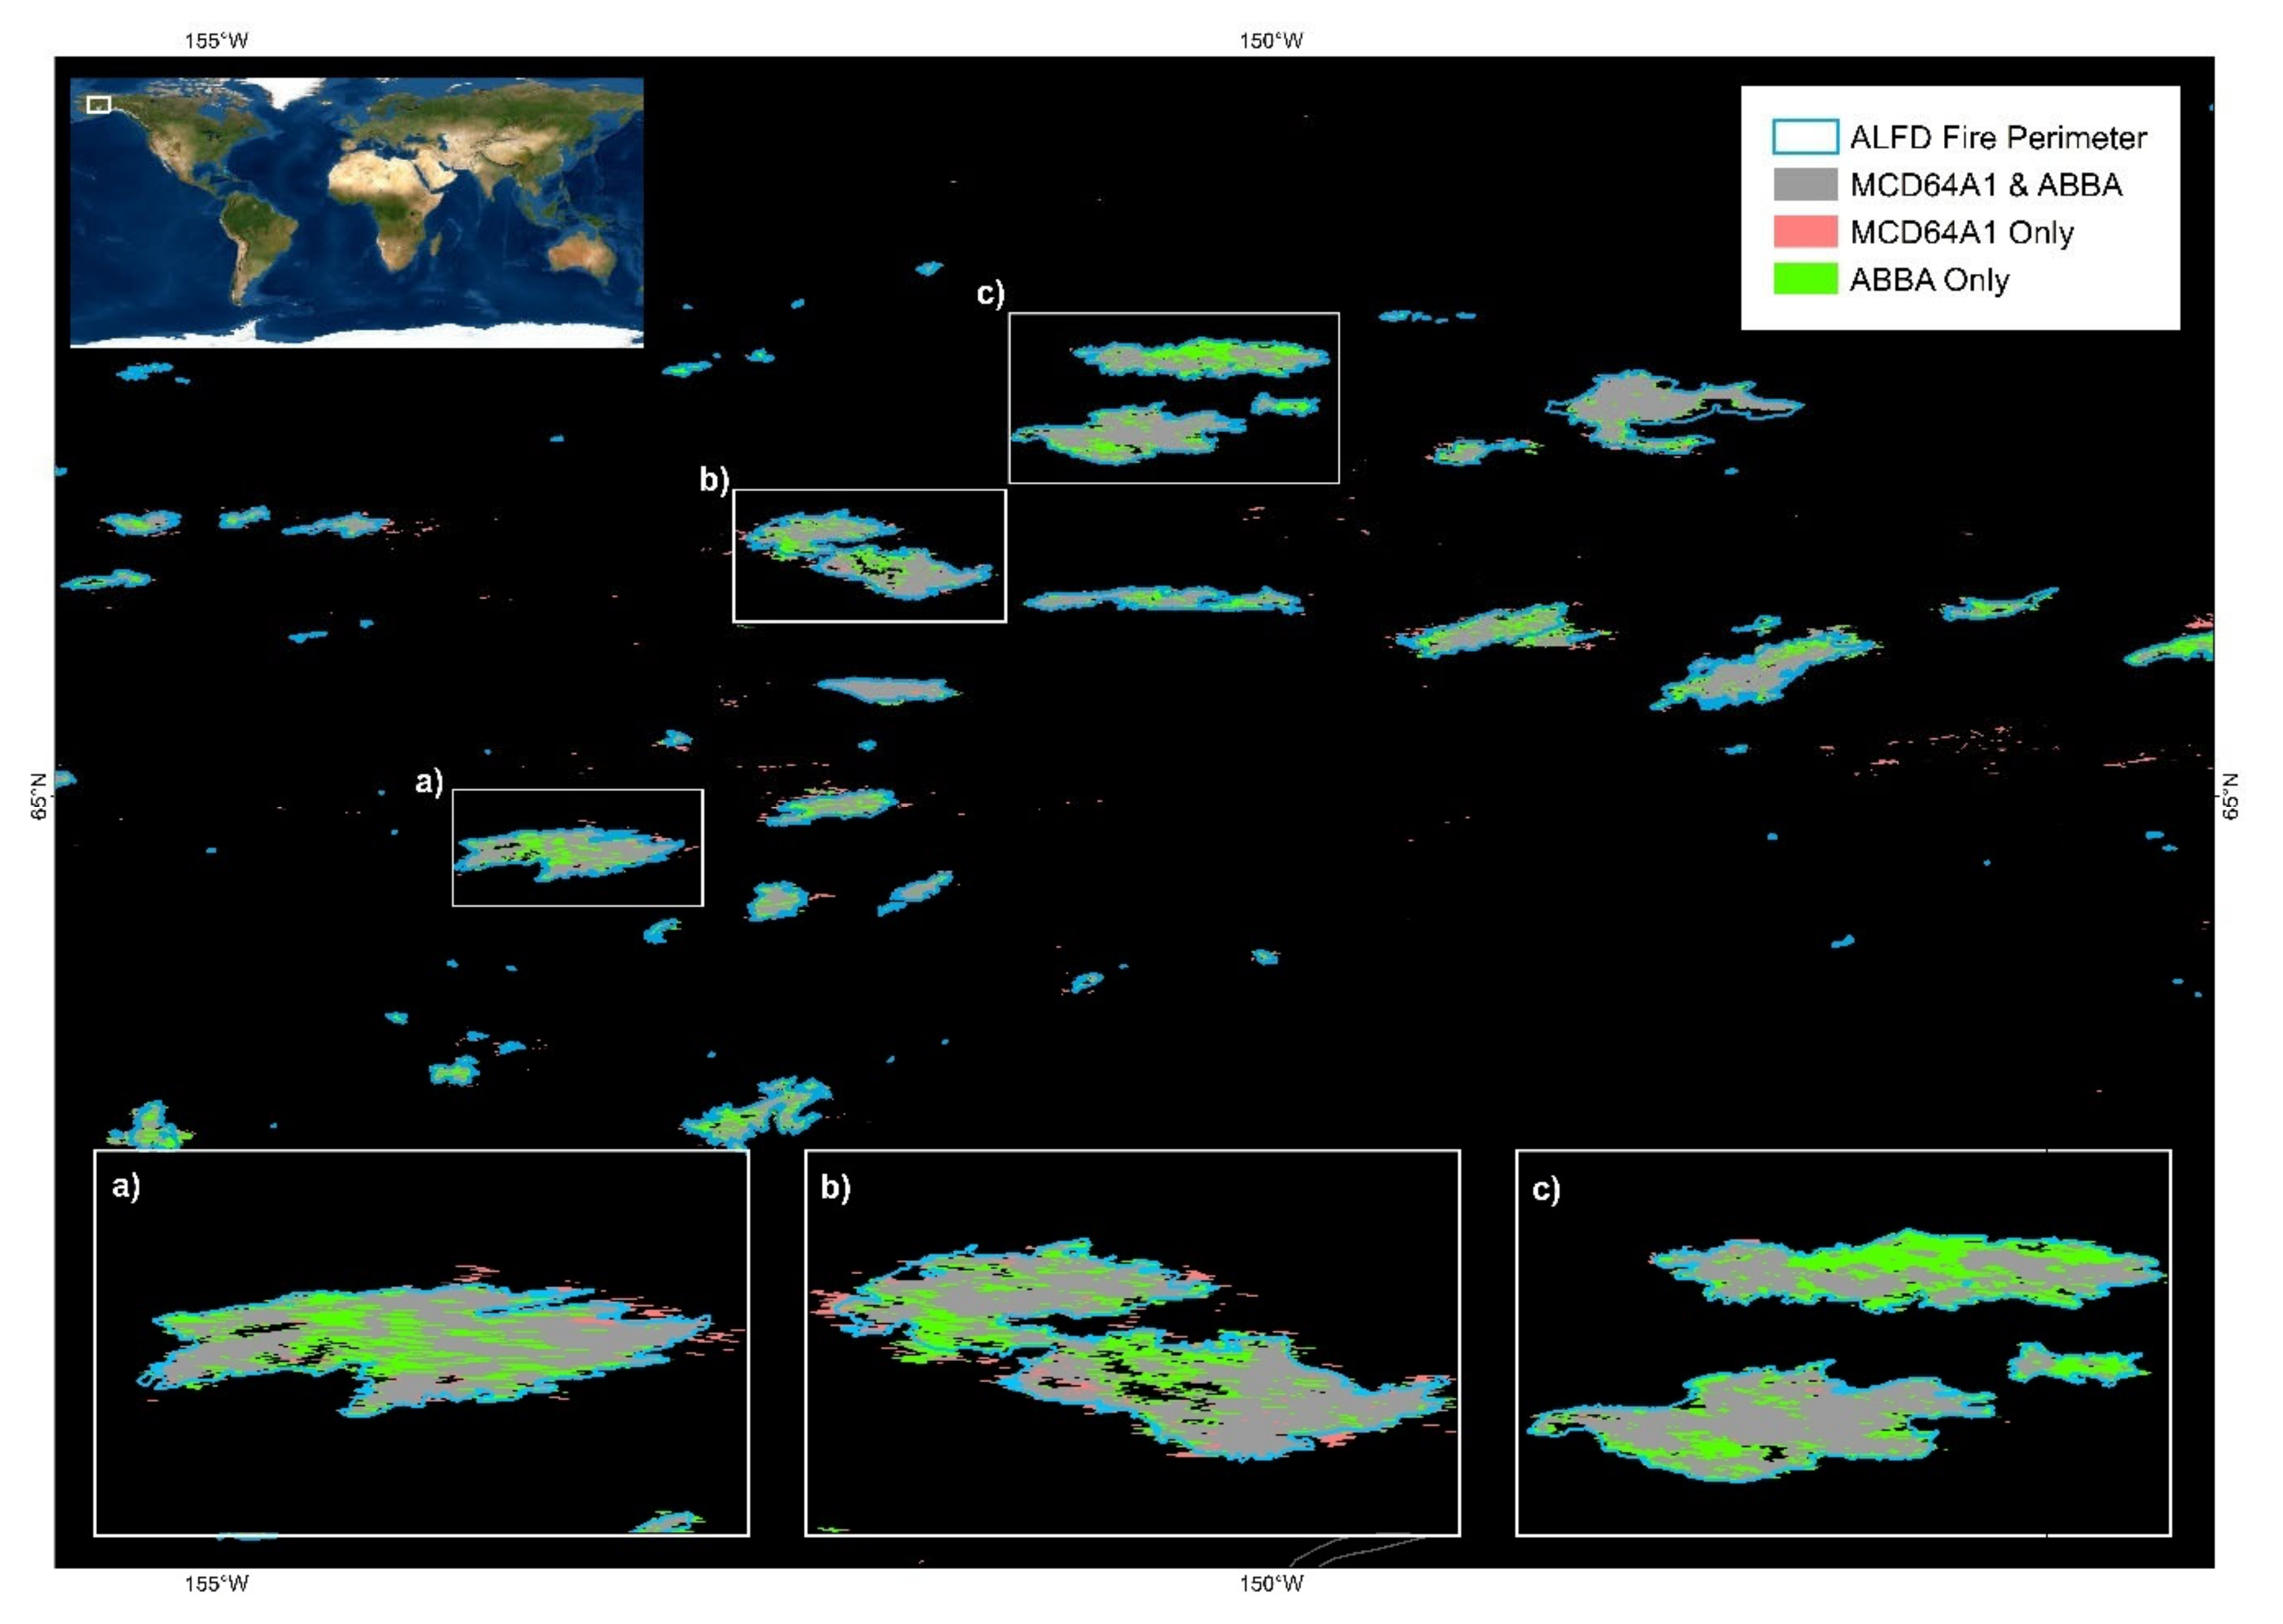
A visual examination of ABBA and MCD64A1 burned areas in boreal forests of Alaska (Figure 9) shows that MCD64A1 tends to miss significant amounts of burned areas within confirmed burned scars. A similar discontinuity of mapping within burns is noted in Siberia (Figure 10 and a visual comparison against Google Earth imagery; results not shown here). In contrast, ABBA is able to map burned areas more consistently within known scars (Table 3 and Table 4, Figure 9 and Figure 10), which is likely the reason why its total burned area resembles the ALFD and CNFDB the best. Although this study does not aim to identify the mechanisms that explain the apparent differences in the performance of the MCD64A1 and ABBA products, our visual examinations point to the inclusion of spring imagery from the year after the year of fires by the ABBA algorithm; a major contributing factor to a more complete mapping of burned areas. The lack of clear surface observations, due to smoke, cloud cover, and eventually snow cover, limits the capacity of burned area algorithms to map the full extent of the burn scars within the same fire season. Consequently, ABBA adopts snow-free imagery acquired in the spring following the fire events to aid the delineation of the burned scars [48].
The analyses carried out in this study are subject to the influence of several sources of uncertainty. For example, the reference fire products from which known fire perimeters were extracted may have missed certain wildfires. This is particularly likely for CNFDB, as has been reported in the literature [78]. This may explain the considerably lower commission error rates of the three burned area products in Canada compared to Alaska. In addition, we used the mean BR value (77%) identified based on Alaskan wildfires in our estimation of missed burned areas by the three burned area products over North American boreal and tundra wildfires, which is a practice that will introduce uncertainties. Our analysis, as well as previous research [70], shows that the proportion of unburned areas within wildfire perimeters varies significantly with the fire size (Figure 6). Considering MTBS does not report burn severity maps for fires whose size is below 4 km2, this means the BR value that we used may not be representative of all wildfires in North America. Moreover, since BR likely also varies with vegetation types and species compositions, the BR value that we used may not be representative of the mean conditions of wildfires in tundra (since tundra fires are much scarcer than boreal forests) or Russia (since we do not have high-quality reference data products for Russian forests).

7. Conclusions

In this project, we evaluated the performance of two global burned area products, i.e., MCD64A1 and FireCCI51, in the circumpolar boreal forests and tundra between 2001 and 2015. Despite some uncertainties (which are discussed above), we believe the multiple pieces of evidence that we have presented here all suggest that these two global burned area products, particularly MCD64A1, considerably underestimate the extent of wildfires in the HNL. This, coupled with the crucial role of wildfire in arctic and boreal ecosystems, implies that studies based on the data provided by the MCD64A1 and FireCCI51 are likely to substantially underestimate fire-related impacts in the HNL areas of the globe. While global algorithms undoubtedly play a critically important role in understanding global dynamics of fire occurrence, the much higher accuracy of ABBA estimates points to the substantial advantages offered by regionally adapted algorithms for regionally focused studies. A current practical limitation of using the ABBA product is its limited spatial (north of 60° N) and temporal coverage (2001–2015). We hereby call for the expansion of the ABBA product both spatially (moving the southern boundary to 50° N, which would cover the majority of the boreal forest biome) and temporally (producing ABBA for the years since 2015). To our knowledge, there is no known ecological or technical reason that would prevent such expansions. In addition, we believe an updated ABBA product will further contribute to our collective understanding of the wildfire regimes in circumpolar ecosystems.

Author Contributions

Conceptualization, D.C.; methodology, D.C.; validation, V.S. and A.B.; investigation, D.C.; writing—original draft preparation, D.C.; writing—review and editing, D.C., V.S., A.B. and T.V.L.; visualization, D.C.; funding acquisition, T.V.L. All authors have read and agreed to the published version of the manuscript.

Funding

The presented work was supported by the NASA Terrestrial Ecology Program under grant #NNX13AK44G.

Institutional Review Board Statement

Not applicable.

Informed Consent Statement

Not applicable.

Data Availability Statement

All data used in this project are openly available through their respective sources. The code produced through this project is available from the corresponding author on reasonable request.

Acknowledgments

We would like to thank Louis Giglio and Joanne Hall from the University of Maryland, College Park for their discussion about this paper.

Conflicts of Interest

The authors declare no conflict of interest.

References

  1. Jolly, W.M.; Cochrane, M.A.; Freeborn, P.H.; Holden, Z.A.; Brown, T.J.; Williamson, G.J.; Bowman, D.M.J.S. Climate-induced variations in global wildfire danger from 1979 to 2013. Nat. Commun. 2015, 6, 7537. [Google Scholar] [CrossRef] [PubMed]
  2. Walker, X.J.; Rogers, B.M.; Veraverbeke, S.; Johnstone, J.F.; Baltzer, J.L.; Barrett, K.; Bourgeau-Chavez, L.; Day, N.J.; de Groot, W.J.; Dieleman, C.M.; et al. Fuel availability not fire weather controls boreal wildfire severity and carbon emissions. Nat. Clim. Chang. 2020, 10, 1130–1136. [Google Scholar] [CrossRef]
  3. Chuvieco, E.; Martínez, S.; Román, M.V.; Hantson, S.; Pettinari, M.L. Integration of ecological and socio-economic factors to assess global vulnerability to wildfire. Glob. Ecol. Biogeogr. 2014, 23, 245–258. [Google Scholar] [CrossRef]
  4. Liu, J.C.; Pereira, G.; Uhl, S.A.; Bravo, M.A.; Bell, M.L. A systematic review of the physical health impacts from non-occupational exposure to wildfire smoke. Environ. Res. 2015, 136, 120–132. [Google Scholar] [CrossRef] [PubMed] [Green Version]
  5. Jin, Y.; Goulden, M.L.; Faivre, N.; Veraverbeke, S.; Sun, F.; Hall, A.; Hand, M.S.; Hook, S.; Randerson, J.T. Identification of two distinct fire regimes in Southern California: Implications for economic impact and future change. Environ. Res. Lett. 2015, 10, 094005. [Google Scholar] [CrossRef] [Green Version]
  6. Wang, D.; Guan, D.; Zhu, S.; Kinnon, M.M.; Geng, G.; Zhang, Q.; Zheng, H.; Lei, T.; Shao, S.; Gong, P.; et al. Economic footprint of California wildfires in 2018. Nat. Sustain. 2020. [Google Scholar] [CrossRef]
  7. Fernández-Guisuraga, J.M.; Calvo, L.; Fernández-García, V.; Marcos-Porras, E.; Taboada, Á.; Suárez-Seoane, S. Efficiency of remote sensing tools for post-fire management along a climatic gradient. Forest Ecol. Manag. 2019, 433, 553–562. [Google Scholar] [CrossRef]
  8. Chuvieco, E.; Kasischke, E.S. Remote sensing information for fire management and fire effects assessment. J. Geophys. Res. Biogeosci. 2007, 112. [Google Scholar] [CrossRef] [Green Version]
  9. Chuvieco, E.; Giglio, L.; Justice, C. Global characterization of fire activity: Toward defining fire regimes from Earth observation data. Glob. Chang. Biol. 2008, 14, 1488–1502. [Google Scholar] [CrossRef]
  10. Cattau, M.E.; Wessman, C.; Mahood, A.; Balch, J.K. Anthropogenic and lightning-started fires are becoming larger and more frequent over a longer season length in the U.S.A. Glob. Ecol. Biogeogr. 2020, 29, 668–681. [Google Scholar] [CrossRef]
  11. Pechony, O.; Shindell, D.T. Fire parameterization on a global scale. J. Geophys. Res. Atmosph. 2009, 114. [Google Scholar] [CrossRef]
  12. Giglio, L.; Loboda, T.; Roy, D.P.; Quayle, B.; Justice, C.O. An active-fire based burned area mapping algorithm for the MODIS sensor. Remote Sens. Environ. 2009, 113, 408–420. [Google Scholar] [CrossRef]
  13. Giglio, L.; Boschetti, L.; Roy, D.P.; Humber, M.L.; Justice, C.O. The Collection 6 MODIS burned area mapping algorithm and product. Remote Sens. Environ. 2018, 217, 72–85. [Google Scholar] [CrossRef]
  14. Giglio, L.; Randerson, J.T.; van der Werf, G.R. Analysis of daily, monthly, and annual burned area using the fourth-generation global fire emissions database (GFED4). J. Geophys. Res. Biogeosci. 2013, 118, 317–328. [Google Scholar] [CrossRef] [Green Version]
  15. Andela, N.; Morton, D.C.; Giglio, L.; Paugam, R.; Chen, Y.; Hantson, S.; van der Werf, G.R.; Randerson, J.T. The Global Fire Atlas of individual fire size, duration, speed and direction. Earth Syst. Sci. Data 2019, 11, 529–552. [Google Scholar] [CrossRef] [Green Version]
  16. French, N.H.; McKenzie, D.; Erickson, T.; Koziol, B.; Billmire, M.; Endsley, K.A.; Yager Scheinerman, N.K.; Jenkins, L.; Miller, M.E.; Ottmar, R. Modeling regional-scale wildland fire emissions with the Wildland Fire Emissions Information System. Earth Interact. 2014, 18, 1–26. [Google Scholar] [CrossRef] [Green Version]
  17. Andela, N.; van der Werf, G.R. Recent trends in African fires driven by cropland expansion and El Niño to La Niña transition. Nat. Clim. Chang. 2014, 4, 791–795. [Google Scholar] [CrossRef]
  18. Andela, N.; Morton, D.C.; Giglio, L.; Chen, Y.; van der Werf, G.R.; Kasibhatla, P.S.; DeFries, R.S.; Collatz, G.J.; Hantson, S.; Kloster, S.; et al. A human-driven decline in global burned area. Science 2017, 356, 1356–1362. [Google Scholar] [CrossRef] [PubMed] [Green Version]
  19. Rogers, B.M.; Soja, A.J.; Goulden, M.L.; Randerson, J.T. Influence of tree species on continental differences in boreal fires and climate feedbacks. Nat. Geosci. 2015, 8, 228–234. [Google Scholar] [CrossRef]
  20. Bond-Lamberty, B.; Peckham, S.D.; Ahl, D.E.; Gower, S.T. Fire as the dominant driver of central Canadian boreal forest carbon balance. Nature 2007, 450, 89–92. [Google Scholar] [CrossRef] [Green Version]
  21. French, N.H.F.; Jenkins, L.K.; Loboda, T.V.; Flannigan, M.; Jandt, R.; Bourgeau-Chavez, L.L.; Whitley, M. Fire in arctic tundra of Alaska: Past fire activity, future fire potential, and significance for land management and ecology. Int. J. Wildland Fire 2015, 24, 1045–1061. [Google Scholar] [CrossRef] [Green Version]
  22. Bradshaw, C.J.A.; Warkentin, I.G. Global estimates of boreal forest carbon stocks and flux. Glob. Planet. Chang. 2015, 128, 24–30. [Google Scholar] [CrossRef]
  23. Zimov, S.A.; Schuur, E.A.G.; Chapin, F.S. Permafrost and the Global Carbon Budget. Science 2006, 312, 1612–1613. [Google Scholar] [CrossRef] [PubMed]
  24. Tarnocai, C.; Canadell, J.G.; Schuur, E.A.G.; Kuhry, P.; Mazhitova, G.; Zimov, S. Soil organic carbon pools in the northern circumpolar permafrost region. Glob. Biogeochem. Cycle 2009, 23. [Google Scholar] [CrossRef]
  25. Walker, X.J.; Baltzer, J.L.; Cumming, S.G.; Day, N.J.; Ebert, C.; Goetz, S.; Johnstone, J.F.; Potter, S.; Rogers, B.M.; Schuur, E.A.G.; et al. Increasing wildfires threaten historic carbon sink of boreal forest soils. Nature 2019, 572, 520–523. [Google Scholar] [CrossRef] [PubMed]
  26. Gibson, C.M.; Chasmer, L.E.; Thompson, D.K.; Quinton, W.L.; Flannigan, M.D.; Olefeldt, D. Wildfire as a major driver of recent permafrost thaw in boreal peatlands. Nat. Commun. 2018, 9, 3041. [Google Scholar] [CrossRef] [Green Version]
  27. Chen, D.; Loboda, T.V.; He, T.; Zhang, Y.; Liang, S. Strong cooling induced by stand-replacing fires through albedo in Siberian larch forests. Sci. Rep. 2018, 8, 4821. [Google Scholar] [CrossRef]
  28. Randerson, J.T.; Liu, H.; Flanner, M.G.; Chambers, S.D.; Jin, Y.; Hess, P.G.; Pfister, G.; Mack, M.C.; Treseder, K.K.; Welp, L.R.; et al. The impact of boreal forest fire on climate warming. Science 2006, 314, 1130–1132. [Google Scholar] [CrossRef] [Green Version]
  29. Conard, S.G.; Ivanova, G.A. Wildfire in Russian boreal forests - Potential impacts of fire regime characteristics on emissions and global carbon balance estimates. Environ. Pollut. 1997, 98, 305–313. [Google Scholar] [CrossRef]
  30. Balshi, M.S.; McGuire, A.D.; Duffy, P.; Flannigan, M.; Kicklighter, D.W.; Melillo, J. Vulnerability of carbon storage in North American boreal forests to wildfires during the 21st century. Glob. Chang. Biol. 2009, 15, 1491–1510. [Google Scholar] [CrossRef]
  31. French, N.H.F.; Goovaerts, P.; Kasischke, E.S. Uncertainty in estimating carbon emissions from boreal forest fires. J. Geophys. Res.-Atmos. 2004, 109. [Google Scholar] [CrossRef]
  32. Flannigan, M.D.; Logan, K.A.; Amiro, B.D.; Skinner, W.R.; Stocks, B.J. Future Area Burned in Canada. Clim. Chang. 2005, 72, 1–16. [Google Scholar] [CrossRef]
  33. Stocks, B.J.; Fosberg, M.A.; Lynham, T.J.; Mearns, L.; Wotton, B.M.; Yang, Q.; Jin, J.Z.; Lawrence, K.; Hartley, G.R.; Mason, J.A.; et al. Climate change and forest fire potential in Russian and Canadian boreal forests. Clim. Chang. 1998, 38, 1–13. [Google Scholar] [CrossRef]
  34. Hu, F.S.; Higuera, P.E.; Walsh, J.E.; Chapman, W.L.; Duffy, P.A.; Brubaker, L.B.; Chipman, M.L. Tundra burning in Alaska: Linkages to climatic change and sea ice retreat. J. Geophys. Res.-Biogeosci. 2010, 115. [Google Scholar] [CrossRef] [Green Version]
  35. Grabinski, Z.; McFarland, H.R. Alaska’s Changing Wildfire Environment; Alaska Fire Science Consortium, International Arctic Research Center, University of Alaska Fairbanks: Fairbanks, AK, USA, 2020. [Google Scholar]
  36. Hope, A.S.; Pence, K.R.; Stow, D.A. NDVI from low altitude aircraft and composited NOAA AVHRR data for scaling Arctic ecosystem fluxes. Int. J. Remote Sens. 2004, 25, 4237–4250. [Google Scholar] [CrossRef]
  37. Stow, D.A.; Hope, A.; McGuire, D.; Verbyla, D.; Gamon, J.; Huemmrich, F.; Houston, S.; Racine, C.; Sturm, M.; Tape, K.; et al. Remote sensing of vegetation and land-cover change in Arctic Tundra Ecosystems. Remote Sens. Environ. 2004, 89, 281–308. [Google Scholar] [CrossRef] [Green Version]
  38. Chen, D.; Fu, C.; Hall, J.V.; Hoy, E.E.; Loboda, T.V. Spatio-temporal patterns of optimal Landsat data for burn severity index calculations: Implications for high northern latitudes wildfire research. Remote Sens. Environ. 2021, 258, 112393. [Google Scholar] [CrossRef]
  39. Loboda, T.; O’Neal, K.J.; Csiszar, I. Regionally adaptable dNBR-based algorithm for burned area mapping from MODIS data. Remote Sens. Environ. 2007, 109, 429–442. [Google Scholar] [CrossRef]
  40. Carroll, M.; Loboda, T. Multi-Decadal Surface Water Dynamics in North American Tundra. Remote Sens. 2017, 9, 497. [Google Scholar] [CrossRef] [Green Version]
  41. Smol, J.P.; Douglas, M.S.V. Crossing the final ecological threshold in high Arctic ponds. Proc. Natl. Acad. Sci. USA 2007, 104, 12395–12397. [Google Scholar] [CrossRef] [Green Version]
  42. Boschetti, L.; Roy, D.P.; Giglio, L.; Huang, H.; Zubkova, M.; Humber, M.L. Global validation of the collection 6 MODIS burned area product. Remote Sens. Environ. 2019, 235, 111490. [Google Scholar] [CrossRef]
  43. Ruiz, J.A.M.; Lázaro, J.R.G.; Cano, I.D.Á.; Leal, P.H. Burned Area Mapping in the North American Boreal Forest Using Terra-MODIS LTDR (2001–2011): A Comparison with the MCD45A1, MCD64A1 and BA GEOLAND-2 Products. Remote Sens. 2014, 6, 815–840. [Google Scholar] [CrossRef] [Green Version]
  44. Zhu, C.; Kobayashi, H.; Kanaya, Y.; Saito, M. Size-dependent validation of MODIS MCD64A1 burned area over six vegetation types in boreal Eurasia: Large underestimation in croplands. Sci. Rep. 2017, 7, 4181. [Google Scholar] [CrossRef] [PubMed]
  45. Loboda, T.V.; Hoy, E.E.; Giglio, L.; Kasischke, E.S. Mapping burned area in Alaska using MODIS data: A data limitations-driven modification to the regional burned area algorithm. Int. J. Wildland Fire 2011, 20, 487–496. [Google Scholar] [CrossRef]
  46. Roy, D.P.; Jin, Y.; Lewis, P.E.; Justice, C.O. Prototyping a global algorithm for systematic fire-affected area mapping using MODIS time series data. Remote Sens. Environ. 2005, 97, 137–162. [Google Scholar] [CrossRef]
  47. Lizundia-Loiola, J.; Otón, G.; Ramo, R.; Chuvieco, E. A spatio-temporal active-fire clustering approach for global burned area mapping at 250 m from MODIS data. Remote Sens. Environ. 2020, 236, 111493. [Google Scholar] [CrossRef]
  48. Loboda, T.V.; Hall, J.V.; Hall, A.H.; Shevade, V.S. ABoVE: Cumulative Annual Burned Area, Circumpolar High Northern Latitudes, 2001–2015; ORNL Distributed Active Archive Center: Oak Ridge, TN, USA, 2017. [Google Scholar] [CrossRef]
  49. Weller, G. The Weather and Climate of the Arctic. In The Arctic; Nuttall, M., Callaghan, T.V., Eds.; Routledge: London, UK, 2000. [Google Scholar] [CrossRef]
  50. Chapin, F.S.I.; Hollingsworth, T.; Murray, D.; Viereck, L.; Walker, M. Floristic Diversity and Vegetation Distribution in the Alaskan Boreal Forest. In Alaska’s Changing Boreal Forest; Chapin, F.S.I., Oswood, M.W., Van Cleve, K., Viereck, L., Verbyla, D.L., Eds.; Oxford University Press: Oxford, UK, 2006; pp. 332–338. [Google Scholar] [CrossRef]
  51. Larsen, J.A. The Boreal Ecosystem; Academic Press: New York, NY, USA, 1980. [Google Scholar]
  52. Kasischke, E.S. Boreal ecosystems in the global carbon cycle. In Fire, Climate Change and Carbon Cycling in the Boreal Forest; Kasischke, E.S., Stocks, B.J., Eds.; Springer: New York, NY, USA, 2000; pp. 19–30. [Google Scholar] [CrossRef]
  53. Wirth, C. Fire Regime and Tree Diversity in Boreal Forests: Implications for the Carbon Cycle. In Forest Diversity and Function; Scherer-Lorenzen, M., Körner, C., Schulze, E.-D., Eds.; Springer: Berlin/Heidelberg, Germany, 2005; Volume 176, pp. 309–344. [Google Scholar]
  54. Bliss, L.C. Arctic tundra and polar desert biome. In North American Terrestrial Vegetation, 2nd ed.; Cambridge University Press: Cambridge, UK, 2000; pp. 1–40. [Google Scholar]
  55. Masrur, A.; Petrov, A.N.; DeGroote, J. Circumpolar spatio-temporal patterns and contributing climatic factors of wildfire activity in the Arctic tundra from 2001–2015. Environ. Res. Lett. 2018, 13, 014019. [Google Scholar] [CrossRef] [Green Version]
  56. Hu, F.S.; Higuera, P.E.; Duffy, P.; Chipman, M.L.; Rocha, A.V.; Young, A.M.; Kelly, R.; Dietze, M.C. Arctic tundra fires: Natural variability and responses to climate change. Front. Ecol. Environm. 2015, 13, 369–377. [Google Scholar] [CrossRef] [Green Version]
  57. Olson, D.M.; Dinerstein, E.; Wikramanayake, E.D.; Burgess, N.D.; Powell, G.V.N.; Underwood, E.C.; D’Amico, J.A.; Itoua, I.; Strand, H.E.; Morrison, J.C.; et al. Terrestrial ecoregions of the worlds: A new map of life on Earth. Bioscience 2001, 51, 933–938. [Google Scholar] [CrossRef]
  58. Vermote, E.F.; El Saleous, N.Z.; Justice, C.O. Atmospheric correction of MODIS data in the visible to middle infrared: First results. Remote Sens. Environ. 2002, 83, 97–111. [Google Scholar] [CrossRef]
  59. Giglio, L.; Descloitres, J.; Justice, C.O.; Kaufman, Y.J. An enhanced contextual fire detection algorithm for MODIS. Remote Sens. Environ. 2003, 87, 273–282. [Google Scholar] [CrossRef]
  60. Chuvieco, E.; Yue, C.; Heil, A.; Mouillot, F.; Alonso-Canas, I.; Padilla, M.; Pereira, J.M.; Oom, D.; Tansey, K. A new global burned area product for climate assessment of fire impacts. Glob. Ecol. Biogeogr. 2016, 25, 619–629. [Google Scholar] [CrossRef] [Green Version]
  61. Chuvieco, E.; Lizundia-Loiola, J.; Pettinari, M.L.; Ramo, R.; Padilla, M.; Tansey, K.; Mouillot, F.; Laurent, P.; Storm, T.; Heil, A.; et al. Generation and analysis of a new global burned area product based on MODIS 250 m reflectance bands and thermal anomalies. Earth Syst. Sci. Data 2018, 10, 2015–2031. [Google Scholar] [CrossRef] [Green Version]
  62. Schroeder, W.; Oliva, P.; Giglio, L.; Csiszar, I.A. The New VIIRS 375m active fire detection data product: Algorithm description and initial assessment. Remote Sens. Environ. 2014, 143, 85–96. [Google Scholar] [CrossRef]
  63. Eidenshink, J.C.; Schwind, B.; Brewer, K.; Zhu, Z.-L.; Quayle, B.; Howard, S.M. A project for monitoring trends in burn severity. Fire Ecol. 2007, 3, 3–21. [Google Scholar] [CrossRef]
  64. Kasischke, E.S.; Williams, D.; Barry, D. Analysis of the patterns of large fires in the boreal forest region of Alaska. Int. J. Wildland Fire 2002, 11, 131–144. [Google Scholar] [CrossRef] [Green Version]
  65. Kasischke, E.S.; Hoy, E.E. Controls on carbon consumption during Alaskan wildland fires. Glob. Chang. Biol. 2012, 18, 685–699. [Google Scholar] [CrossRef]
  66. Stocks, B.J.; Mason, J.A.; Todd, J.B.; Bosch, E.M.; Wotton, B.M.; Amiro, B.D.; Flannigan, M.D.; Hirsch, K.G.; Logan, K.A.; Martell, D.L.; et al. Large forest fires in Canada, 1959–1997. J. Geophys. Res. Atmosph. 2002, 107, FFR 5-1–FFR 5-12. [Google Scholar] [CrossRef]
  67. Parisien, M.-A.; Peters, V.S.; Wang, Y.; Little, J.M.; Bosch, E.M.; Stocks, B.J. Spatial patterns of forest fires in Canada, 19801999. Int. J. Wildland Fire 2006, 15, 361–374. [Google Scholar] [CrossRef]
  68. Murphy, P.J.; Mudd, J.P.; Stocks, B.J.; Kasischke, E.S.; Barry, D.; Alexander, M.E.; French, N.H.F. Historical fire records in the North American boreal forest. In Fire, Climate Change, and Carbon Cycling in the Boreal Forest; Kasischke, E.S., Stocks, B.J., Eds.; Springer: New York, NY, USA, 2000; pp. 274–288. [Google Scholar]
  69. Oliva, P.; Schroeder, W. Assessment of VIIRS 375m active fire detection product for direct burned area mapping. Remote Sens. Environ. 2015, 160, 144–155. [Google Scholar] [CrossRef]
  70. Kolden, C.A.; Lutz, J.A.; Key, C.H.; Kane, J.T.; van Wagtendonk, J.W. Mapped versus actual burned area within wildfire perimeters: Characterizing the unburned. Forest Ecol. Manag. 2012, 286, 38–47. [Google Scholar] [CrossRef]
  71. Eberhart, K.E.; Woodard, P.M. Distribution of residual vegetation associated with large fires in Alberta. Canad. J. Forest Res. 1987, 17, 1207–1212. [Google Scholar] [CrossRef]
  72. Burton, P.J.; Parisien, M.-A.; Hicke, J.A.; Hall, R.J.; Freeburn, J.T. Large fires as agents of ecological diversity in the North American boreal forest. Int. J. Wildland Fire 2008, 17, 754–767. [Google Scholar] [CrossRef]
  73. Hanes, C.C.; Wang, X.; Jain, P.; Parisien, M.-A.; Little, J.M.; Flannigan, M.D. Fire-regime changes in Canada over the last half century. Can. J. Forest Res. 2019, 49, 256–269. [Google Scholar] [CrossRef]
  74. Tsela, P.; Wessels, K.; Botai, J.; Archibald, S.; Swanepoel, D.; Steenkamp, K.; Frost, P. Validation of the Two Standard MODIS Satellite Burned-Area Products and an Empirically-Derived Merged Product in South Africa. Remote Sens. 2014, 6, 1275–1293. [Google Scholar] [CrossRef] [Green Version]
  75. Kukavskaya, E.A.; Soja, A.J.; Petkov, A.P.; Ponomarev, E.I.; Ivanova, G.A.; Conard, S.G. Fire emissions estimates in Siberia: Evaluation of uncertainties in area burned, land cover, and fuel consumption. Can. J. Forest Res. 2013, 43, 493–506. [Google Scholar] [CrossRef]
  76. Shi, Y.; Yamaguchi, Y. A high-resolution and multi-year emissions inventory for biomass burning in Southeast Asia during 2001–2010. Atmospher. Environ. 2014, 98, 8–16. [Google Scholar] [CrossRef]
  77. Valentini, R.; Arneth, A.; Bombelli, A.; Castaldi, S.; Cazzolla Gatti, R.; Chevallier, F.; Ciais, P.; Grieco, E.; Hartmann, J.; Henry, M.; et al. A full greenhouse gases budget of Africa: Synthesis, uncertainties, and vulnerabilities. Biogeosciences 2014, 11, 381–407. [Google Scholar] [CrossRef] [Green Version]
  78. Amiro, B.D.; Todd, J.B.; Wotton, B.M.; Logan, K.A.; Flannigan, M.D.; Stocks, B.J.; Mason, J.A.; Martell, D.L.; Hirsch, K.G. Direct carbon emissions from Canadian forest fires, 1959-1999. Can. J. Forest Res. 2001, 31, 512–525. [Google Scholar] [CrossRef]
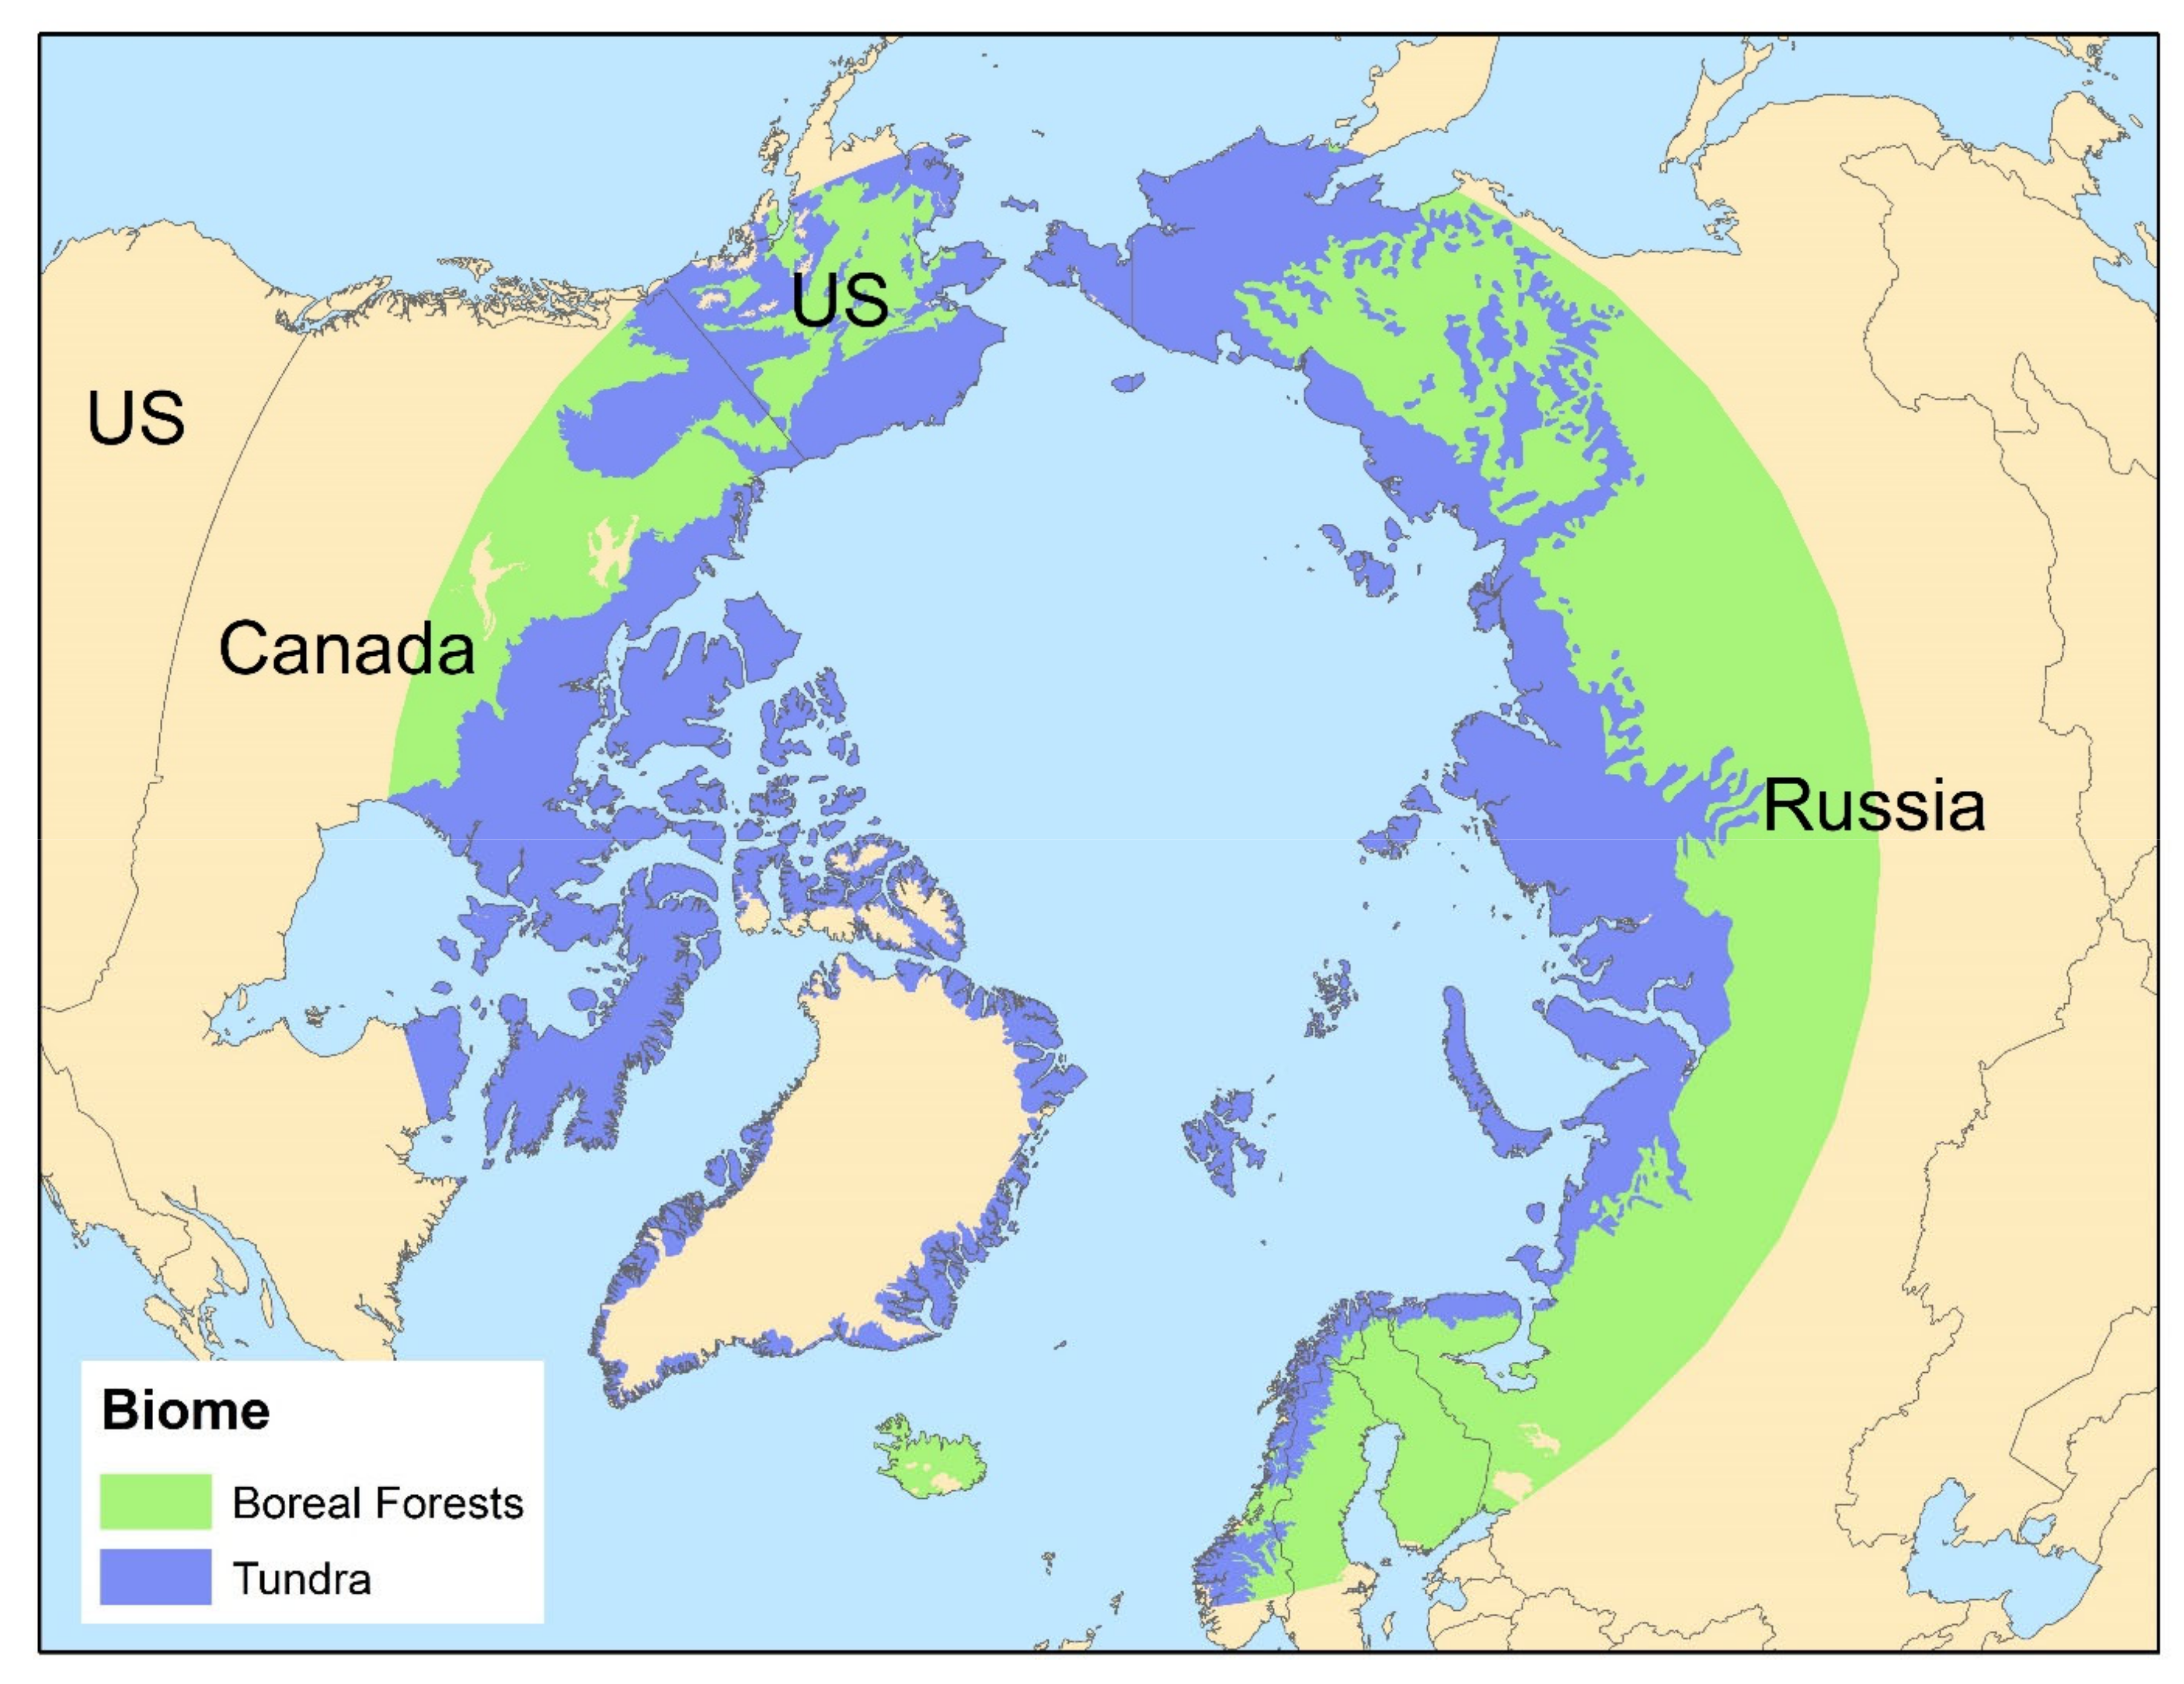
Figure 1. The extent of the study area, as represented by areas in green (the boreal forests) and purple (tundra). The delineation of the boreal forest and tundra biomes is based on the World Wildlife Fund (WWF) Terrestrial Ecoregions dataset [57].
Remotesensing 13 04145 g001
Figure 2. Comparisons of (a) annual total area and (b) grand total area of burned areas as mapped by the MCD64A1, ABBA, FireCCI51, MTBS, ALFD, and VNP14IMG data over areas in Alaska north of 60° N. The grand total area of burned areas as mapped by VNP14IMG is not visualized in (b) because of its shorter temporal coverage.
Remotesensing 13 04145 g002
Figure 3. Comparisons of (a) annual total area and (b) grand total area of burned areas as mapped by the MCD64A1, ABBA, FireCCI51, CNFDB, and VNP14IMG data over areas in Canada north of 60° N. The grand total area of burned areas as mapped by VNP14IMG is not visualized in (b) because of its shorter temporal coverage.
Remotesensing 13 04145 g003
Figure 4. Comparisons of (a) annual total area and (b) grand total area of burned areas as mapped by the MCD64A1, ABBA, FireCCI51, and VNP14IMG data over areas in circumpolar boreal forest and tundra north of 60° N. The grand total area of burned areas as mapped by VNP14IMG is not visualized in (b) because of its shorter temporal coverage.
Remotesensing 13 04145 g004
Figure 5. Comparisons of the total area of burned areas as mapped by the MCD64A1, ABBA, and FireCCI51 products broken down by (a) countries and (b) biomes over the circumpolar domain. (c) shows the total area of burned areas as mapped by the three burned area products in Alaska in comparison to the MTBS and ALFD burned area.
Remotesensing 13 04145 g005
Figure 6. Scatterplot showing the relationship between annual total burn scar area (in km2) during 1984–2002 and the corresponding Burned Ratio, as identified based on the MTBS dataset.
Remotesensing 13 04145 g006
Figure 7. Comparisons of (a) annual total area and (b) grand total area of burned areas, as mapped by the MCD64A1, ABBA, FireCCI51 products, that are outside the buffer zones created based on the ALFD burned areas. In (a), the total area of 500 m pixels that have VNP14IMG active fire detections and outside the buffer zones is compared with the three burned area products as reference.
Remotesensing 13 04145 g007
Figure 8. Comparisons of (a) annual total area and (b) grand total area of burned areas, as mapped by the MCD64A1, ABBA, FireCCI51 products, that are outside the buffer zones created based on the CNFDB burned areas. In (a), the total area of 500 m pixels that have VNP14IMG active fire detections and outside the buffer zones is compared with the three burned area products as reference.
Remotesensing 13 04145 g008
Figure 9. Close-up views of the differences in burned areas mapped by MCD64A1 and ABBA in Alaska in 2005. The ALFD fire perimeters are superimposed on top. Areas in gray indicate burned areas that are mapped by both MCD64A1 and ABBA. Areas in red and green indicate burned areas that are mapped only by MCD64A1 and only by ABBA, respectively.
Remotesensing 13 04145 g009
Figure 10. Close-up views of the differences in burned areas mapped by MCD64A1 and ABBA in Eastern Siberia in (a) 2002, (b) 2012, and (c) 2014. Areas in gray indicate burned areas that are mapped by both MCD64A1 and ABBA. Areas in red and green indicate burned areas that are mapped only by MCD64A1 and only by ABBA, respectively.
Remotesensing 13 04145 g010
Table 1. List of the fire products that were used in this project. Datasets that are marked by * are those that were used as reference. Datasets that are marked by # are those whose production involved expert knowledge.
DatasetSource of InformationType of Fire-Related InformationSpatial CoverageTemporal CoverageSpatial Resolution
MCD64A1 burned area productMODIS
(onboard Terra and Aqua)
Burned area
(with timing of fire)
Global2000–present463 m (nominal: 500 m)
ABBA burned area productMODIS
(onboard Terra and Aqua)
Burned area
(without timing of fire)
Circumpolar (North of 60° N)2001–2015463 m (nominal: 500 m)
FireCCI51 burned area productMultiple satellite platformsBurned area
(with timing of fire)
Global2001–2019250 m
VNP14IMG active fire product *VIIRS
(onboard Suomi NPP)
Active Fire DetectionsGlobal2012–present375 m
MTBS *,#Landsat TM, ETM+, OLI imageryFire perimeter and burned area classificationUS
(including Alaska)
1984–201830 m
ALFD *,#Multiple agencies at federal and state levelsFire perimeterAlaska1942–presentVarious
CNFDB *,#Multiple agencies at various levelsFire perimeterCanada1917–2019Various
Table 2. The BR values calculated for each year between 1984 and 2002 as well as the entire 19-year period. The year 2006 is left blank due to a lack of coverage of 2006 wildfires by the MTBS dataset.
YearConfirmed Burned
Area (km2)
Total Burn
Perimeter Area (km2)
Burned Ratio (BR)
1984277.4350.479%
19851108.31368.981%
19861085.61271.685%
1987287.3402.771%
19882164.83312.665%
1989173.5200.686%
19904226.95772.373%
19912464.73119.379%
199292.7114.581%
19931361.31629.384%
1994828.1985.884%
199599.7131.476%
1996N/AN/AN/A
19974.04.688%
1998455.4714.764%
19992933.03608.681%
20002560.73151.981%
2001347.2447.178%
20026828.88641.679%
Total27,299.435,227.877%
Table 3. Results of the omission error analysis that was based on the ALFD dataset in Alaska. The cells that are highlighted in blue and purple represent the comparisons made at the 500 m and 250 m nominal resolutions, respectively. The cells that contain OE values are colored, with green to red indicating low to high OE values.
YearAtotal, ALFD
(km2; 500 m)
Amapped, MCD64A1 (km2)Amapped, ABBA (km2)Atotal, ALFD
(km2; 250 m)
Amapped, FireCCI51 (km2)OEMCD64A1OEABBAOEFireCCI51Amiss, MCD64A1
(km2)
Amiss, ABBA
(km2)
Amiss, FireCCI51
(km2)
2001896058924100%99%100%690686684
20028492484475108492509643%12%40%28097562615
20032423130822302392175546%8%27%859149490
200426,89616,86624,23626,88818,31037%10%32%772320486605
200519,55412,93517,78519,43510,05534%9%48%509713627223
20061078185779107439183%28%64%688230526
20072686139321862606181848%19%30%996385607
200838511031038621071%19%46%21258136
200911,865615210,67911,862904348%10%24%43999132171
20104633143635734599245269%23%47%24628161653
20111209119897120853290%26%56%839240521
20121202492783113358059%35%49%547323426
20135278198143405275310762%18%41%25397221669
20141162449867116074161%25%36%549227323
201520,69810,88318,37320,51211,99147%11%42%755817906561
Total108,45759,15394,553107,91466,08545%13%39%37,96410,70632,208
Table 4. Results of the omission error analysis that was based on the CNFDB dataset in Canada. The cells that are highlighted in blue and purple represent the comparisons made at the 500 m and 250 m nominal resolutions, respectively. The cells that contain OE values are colored, with green to red indicating low to high OE values.
YearAtotal, CNFDB
(km2; 500 m)
Amapped, MCD64A1 (km2)Amapped, ABBA (km2)Atotal, CNFDB (km2; 250 m)Amapped, FireCCI51 (km2)OEMCD64A1OEABBAOEFireCCI51Amiss, MCD64A1
(km2)
Amiss, ABBA
(km2)
Amiss, FireCCI51
(km2)
20011128238180113126379%84%77%685730668
200260022131359427063%48%55%292221249
20031618100214131621109038%13%33%474158409
200422,09012,28919,56622,09715,41344%11%30%754719435147
20054015199734954025263150%13%35%15544001073
2006147810691287148375428%13%49%315147561
20074542193635924538238757%21%47%20077321656
20084229257830854229257539%27%39%12718811274
20092324131120922326114944%10%51%780179906
20104867150935724871248269%27%49%25869971840
20113284112124913290162566%24%51%16666111282
20123489136525003498168561%28%52%16357621396
20136426377756466413411741%12%36%20406011768
201435,18521,61131,92635,17924,22439%9%31%10,45225098435
20158342379672328348500954%13%40%35008552571
Total103,61755,82088,390103,64365,67446%15%37%36,80411,72529,236
Table 5. Results of the visual examination on sample points selected based on the burned pixels located outside the buffer zones as mapped by three burned area products. The cells that contain CE values are colored, with green to red indicating low to high CE values.
RegionDataYearConfirmed Burned
Pixel Count
Confirmed Unburned
Pixel Count
Total Examined Pixel CountTotal Candidate Pixel CountTotal Candidate Area (km2)CE
AlaskaMCD64A1200301001002934630100%
2004010010053721153100%
ABBA20034353939890%
2004165672721578%
FireCCI51200301001001284100%
200479310015694993%
CanadaMCD64A1201342581007761166658%
20156436100317368136%
ABBA20132773100458398473%
20155743100344273943%
FireCCI51201394610025,2617886%
2015267410039,689123774%
Publisher’s Note: MDPI stays neutral with regard to jurisdictional claims in published maps and institutional affiliations.