Article

Building Cultural Heritage Resilience through Remote Sensing: An Integrated Approach Using Multi-Temporal Site Monitoring, Datafication, and Web-GL Visualization

1
Department of Anthropology and Heritage Studies, University of California, Merced, 5200 North Lake Rd., Merced, CA 95343, USA
2
Far Western Anthropological Research Group, 2727 Del Rio Pl, Davis, CA 95618, USA
3
Department of Ancient World Studies, Sapienza University of Rome, Piazzale Aldo Moro 5, 00185 Rome, Italy
4
Interdisciplinary Humanities Graduate Group, University of California, Merced, 5200 North Lake Rd., Merced, CA 95343, USA
5
Digital Media Lab., Geisel Library, University of California, 9500 Gilman Dr. La Jolla, San Diego, CA 92093, USA
6
Instituto de Investigaciones Antropológicas, Universidad Nacional Autónoma de México. Cto. Exterior, s/n Ciudad Universitaria, Coyoacán, Ciudad de México 04510, México
7
Sierra District, California State Parks, P.O. Box 266, Tahoma, CA 96142, USA
*
Author to whom correspondence should be addressed.
Remote Sens. 2021, 13(20), 4130; https://doi.org/10.3390/rs13204130
Submission received: 31 August 2021 / Revised: 4 October 2021 / Accepted: 12 October 2021 / Published: 15 October 2021
(This article belongs to the Special Issue Remote Sensing for Archaeological Heritage Preservation)

Abstract

:
In the American West, wildfires and earthquakes are increasingly threatening the archaeological, historical, and tribal resources that define the collective identity and connection with the past for millions of Americans. The loss of said resources diminishes societal understanding of the role cultural heritage plays in shaping our present and future. This paper examines the viability of employing stationary and SLAM-based terrestrial laser scanning, close-range photogrammetry, automated surface change detection, GIS, and WebGL visualization techniques to enhance the preservation of cultural resources in California. Our datafication approach combines multi-temporal remote sensing monitoring of historic features with legacy data and collaborative visualization to document and evaluate how environmental threats affect built heritage. We tested our methodology in response to recent environmental threats from wildfire and earthquakes at Bodie, an iconic Gold Rush-era boom town located on the California and Nevada border. Our multi-scale results show that the proposed approach effectively integrates highly accurate 3D snapshots of Bodie’s historic buildings before/after disturbance, or post-restoration, with surface change detection and online collaborative visualization of 3D geospatial data to monitor and preserve important cultural resources at the site. This study concludes that the proposed workflow enhances the monitoring of at-risk California’s cultural heritage and makes a call to action to employ remote sensing as a pathway to advanced planning.

1. Introduction

The intensifying effects of climate change in the arid American West pose increasingly severe threats to the natural and cultural resources of this vast and incredibly diverse region. The consequences of global warming in California have resulted in higher than average temperatures and greater temperature extremes [1,2], decreased rainfall and extremely dry vegetation [3], prolonged drought [4,5,6], strong winds, and more frequent lightning ignitions [7,8]. These environmental risk factors have led to increased occurrences of the severe wildfires that have scorched the Golden State in recent years. For instance, in the late summer of 2020, the CZU Lightning Complex Fire was ignited by a series of lightning strikes that hit multiple areas across the Santa Cruz Mountains. Due to the continual dense vegetation characterizing the landscape of western Santa Cruz and San Mateo counties and low humidity and high wind conditions, this wildfire spread at a speed of over 400 hectares per hour, burned a total of 86,509 acres, and took over a month to be fully contained [9]. Tragically, the CZU Lightning Complex Fire resulted in the loss of 1450 structures and one reported fatality [10]. Among the burned structures, this powerful wildfire destroyed, or severely damaged, an unprecedented number of historically significant buildings and burned over several previously recorded archaeological and tribal cultural resources [10,11]. As California’s earliest and most celebrated state park, Big Basin Redwoods suffered the greatest impact, with a total of 52 historic buildings destroyed. Many were serving as park facilities for staff and visitors [12] (Figure 1a,b). Although many conservationists speak to the resilience of the old-growth redwood forest at Big Basin [13,14], the park’s burned cultural resources are not renewable. The risk of post-fire erosion further threatens its environment [15]. Analyzing the catastrophic effects of the CZU Lightning Complex Fire in the broader context of a wildfire emergency in California, it is clear that recent fire behavior trends demonstrate the need to better protect values at risk. This goal can be achieved using a suite of fire management strategies and tactics, including forest stewardship, fuel reduction, prescribed fire, and wildfire planning, combined with remote sensing data.
When the effects of wildfires are compounded with the devastating damage caused by the powerful earthquakes that frequently occur in seismic California and its border regions [16], the threats to the state’s archaeological, historical, and tribal resources become even greater. For instance, the area around Bodie (1859–1942), an iconic Gold Rush-era boom town located few miles west of the California and Nevada border, has been a hotbed of seismological activity and earthquake swarms for thousands of years [17,18,19]. This grim scenario exacerbates a sense of urgency in protecting California cultural heritage and brings to the fore the need for the development of new preservation methods and increased cooperation between preservationists, resource managers, scholars, and local communities to increase their sustainability and resilience [20,21,22,23,24].
While the primary intent of collecting remote sensing data is to generate and curate baseline data of at-risk heritage resources, these datasets would also be invaluable to proactively assess ignition risk, monitor structural integrity, and prioritize future treatments. Therefore, this paper argues that to better protect and preserve cultural heritage sites in fire and earthquake-prone regions worldwide, resource managers are encouraged to enhance traditional documentation, monitoring, and site management practices by integrating remote sensing as a pathway to advance planning and apply mitigation measures. We contend this approach would foster greater awareness of conditions and facilitate the creation of site-specific monitoring schedules for resources that are identified as particularly vulnerable.
Thus, this study examined how to collect new remote sensing data and integrate their derivative products and analyses with legacy data, such as historic photographs, fire and earthquake incidents data, and other resource management and field reports, within a collaborative web visualization platform through a process called ‘datafication’ [25]. In our study, datafication means integrating terrestrial laser scanning (TLS), or Light Detection and Ranging (LiDAR), close-range photogrammetry, or Image-based Modeling (IBM), simultaneous localization and mapping (SLAM), automated surface change detection data, and WebGL-based visualization in a process that produces new insights and knowledge on the performance and resilience of at-risk cultural resources. Previous studies have applied similar techniques for what concerns the 3D reconstruction or digitization of heritage sites and buildings [26,27,28,29,30], structural monitoring of archaeological buildings [31,32,33], producing site cartography from drone-based aerial surveys [34,35,36,37], generating rapid and precise documentation as a quick response to disturbance from natural hazards, such as earthquakes [38], or integrating geospatial data into Building Information Modeling systems [39,40,41].
In a scenario of increasingly frequent disturbance from wildfire and continuous seismic threats to California historical, archaeological, and tribal resources, between 2015 and 2020, our team partnered with California State Parks (CSP), the state agency entrusted with the management and preservation of natural and cultural resources in the Golden State, to test the proposed methodology and collect geospatial data at Bodie State Historic Park. We generated ultra-precise measurements, 3D models, geospatial data and analyses, and visualizations as pre and post-mitigation tools and baseline information to plan conservation efforts or physical reconstruction of the site in case of severe damage or destruction from the site natural hazards [42]. We aligned our research aims with several goals of the Transforming California State Parks initiative, a state-wide effort to improve cultural and natural resources preservation, park management, and connection with the California public and ensure the CSP System’s long-term sustainability [43]. We disseminated our results and data in an online digital collection hosted by the UC San Diego Library [44]. This study concludes that our remote sensing and data analysis/visualization techniques enhance monitoring efforts of at-risk California’s cultural resources and recommends the application of these tools to better understand conditions and aid in prioritizing treatments.

2. Materials and Methods

2.1. Study Objectives

The environmental risks and threats discussed in this study stress the sustainability and resilience issues of cultural resources in California and, more broadly, in the American West. Consequently, it has become a high priority for CSP to capture comprehensive geospatial and 3D data at several state parks to effectively collect and curate detailed information on these resources if they are damaged or destroyed. Thus, the main objective of this study is to test the capacity of remote sensing tools, Geographical Information Systems (GIS), and Web-GL visualization techniques to seamlessly integrate geospatial data into a comprehensive workflow for site monitoring, documentation, and advanced planning purposes at multiple scales, from sitewide to the building-level. To achieve this goal, we conducted fieldwork at Bodie in 2015–2020, accomplishing the following sub-goals: (1) to establish a baseline model to document the current state of Bodie downtown and other areas of interest and compare it with legacy data (2) to create geometrically-accurate 3D models of several historic buildings and ruins to examine their structural soundness or the effects of environmental threats, and (3) to create GIS and online 3D visualizations disseminating the project’s results to other scholars, stakeholder communities, and the general public, which increase awareness of the significance of the site and reinforce our call to action in its preservation.

2.2. Study Area

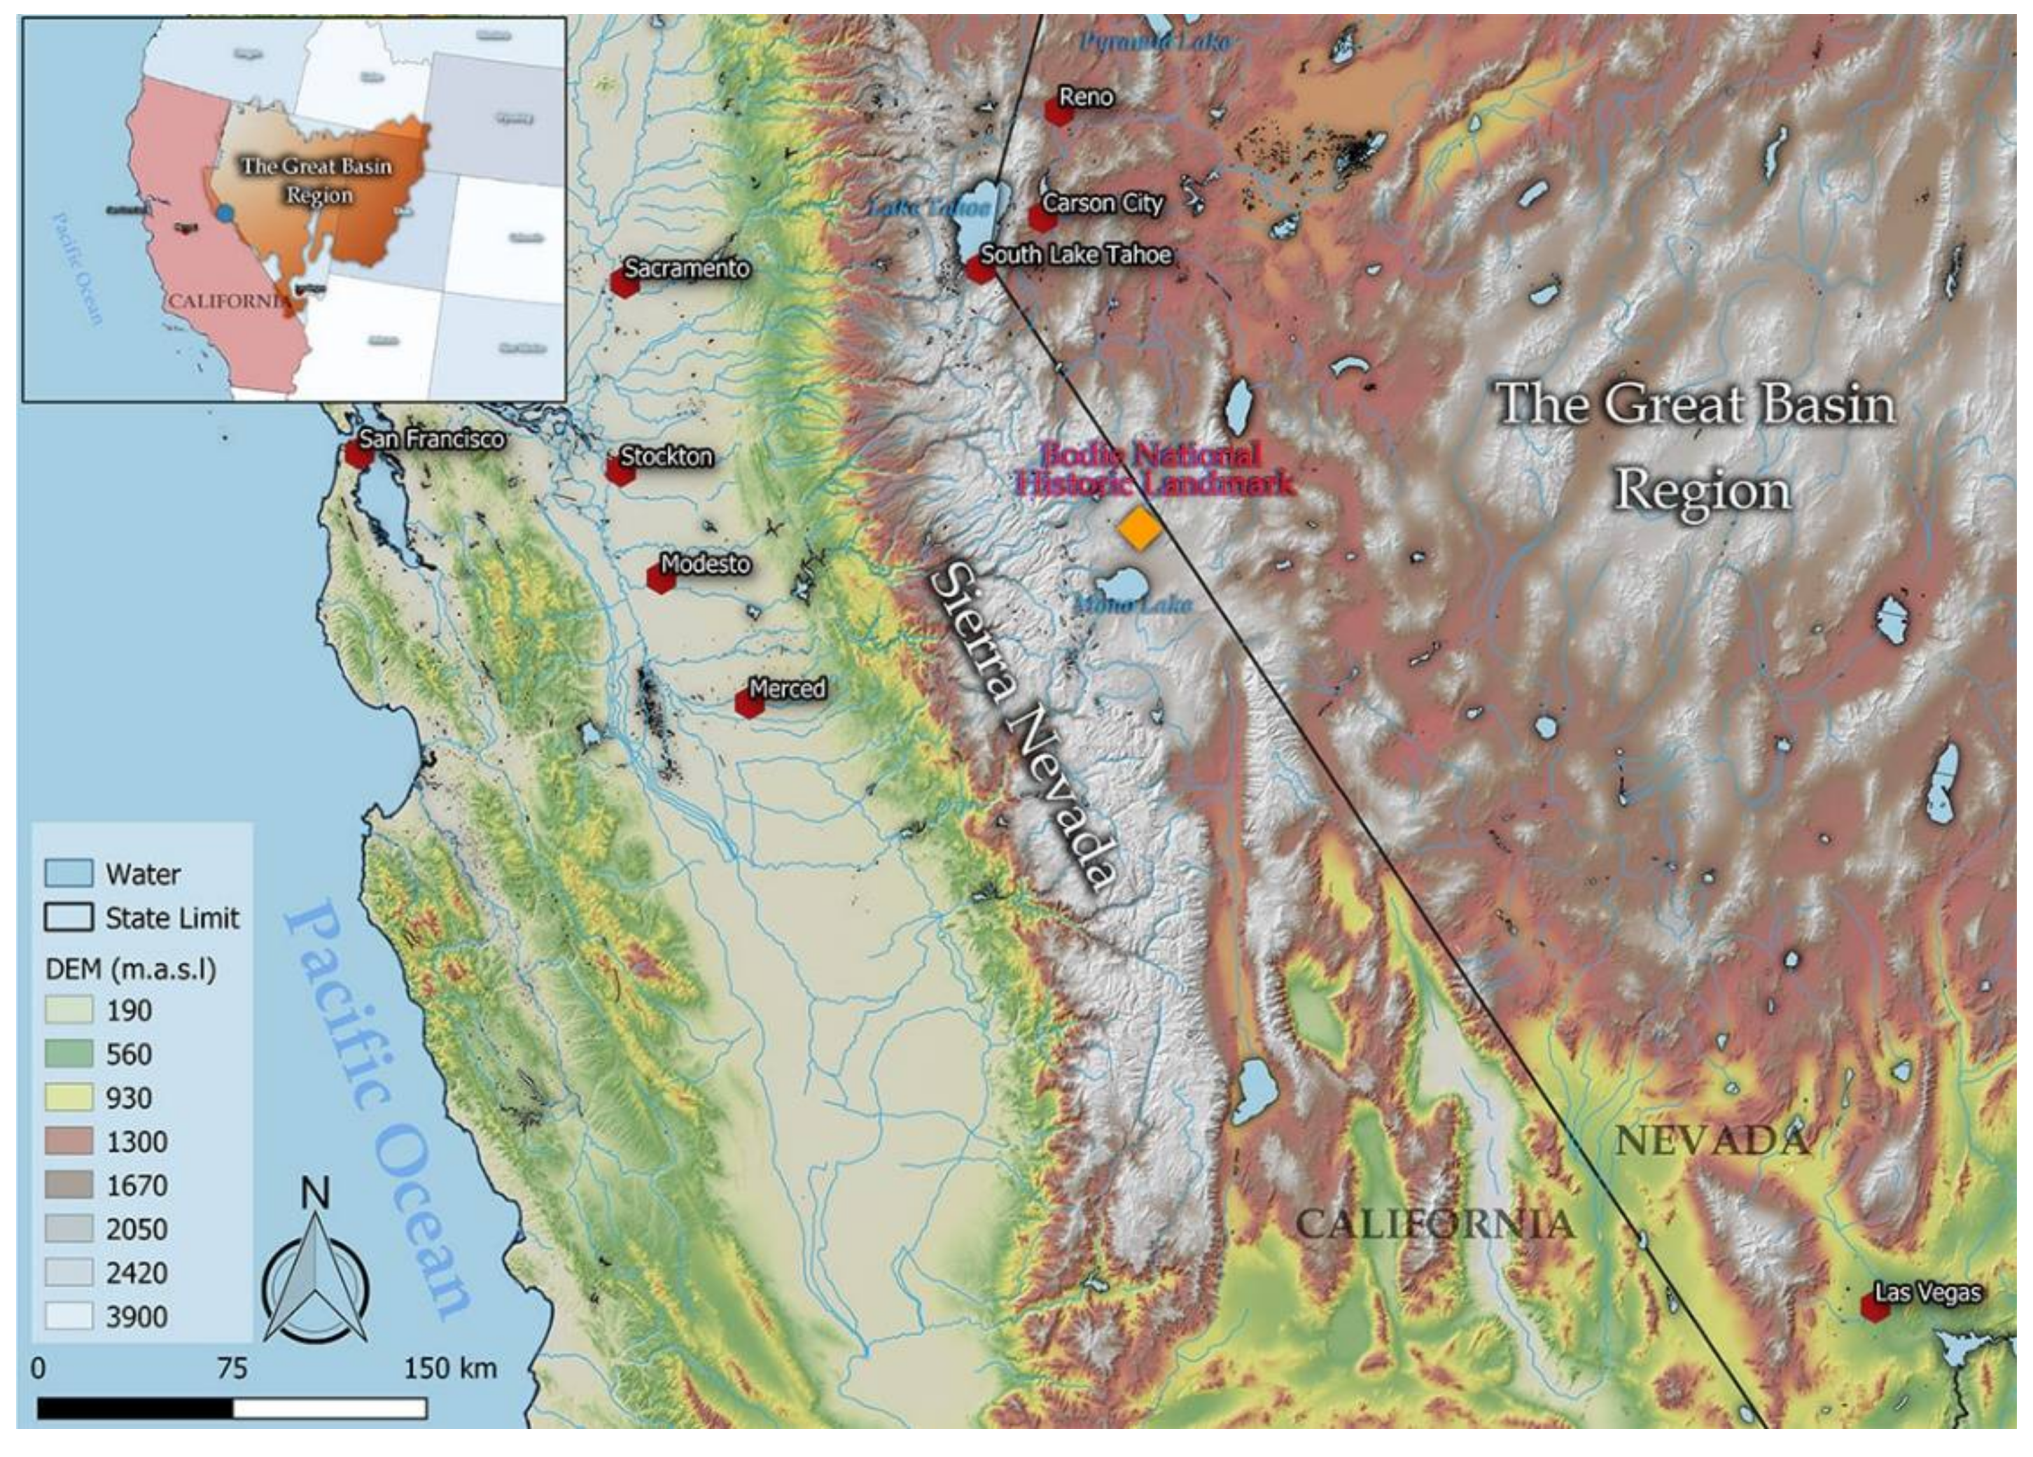
Our research focused on the historic town of Bodie, a site of state and national significance located in Mono County, in the east-central portion of California (Figure 2). Since 1961, Bodie has been preserved as a National Historic Landmark [45], the highest recognition of outstanding historical value in the United States. In 1962, the site became a California State Park [46]. Today, Bodie encompasses a 1173.5-hectare landscape of historic buildings, structures, objects, ruins, and landforms associated with the mining-related activities spanning 1859 and 1942. The cultural remains associated with mining, or those living in the Bodie Mining District, are found in clusters, isolates, and networks distributed across the barren, high-desert landscape.
The core of the Bodie townsite, as well as the surrounding mining zone, contain hundreds of ruins in the form of collapsed wooden buildings, cellar pits, privy holes, dumps, and broadcast refuse, which constituted the commercial and residential remains of the district’s 7000 to 8000 former inhabitants [47]. Mining remains, including shafts, tunnels, waste rock dumps, mill sites, tailings ponds, habitation sites, and other structures and objects, cover the hillsides. Specifically, more than 120 original buildings remain [48], constructed in vernacular styles from the late 19th and early 20th centuries and built primarily of local pine milled in nearby sawmills [49]. Their informal construction technique shows that most structures were erected as an economic response to the need for shelter in a remote high-sierra desert area with incredibly severe winters where building material was scarce [50]. These characteristics compounded with the harshness of Bodie’s high-elevation desert environment make the preservation and restoration of historic structures quite complex, even in normal circumstances. California State Parks has maintained Bodie in a state of “arrested decay,” stabilizing structures and intervening only to preserve buildings as they existed at the time they were acquired in 1960 [51,52] (Figure 3a,b). The physical conservation intervention has most often taken the form of roof repair and replacement, foundation work, and bracing. Buildings within the town have been stabilized to prevent their collapse and halt further deterioration. However, many of the buildings are at risk due to a deferred maintenance backlog, threat of wildfire, and earthquake damage.

2.2.1. Dry Climate and Fire

The prolonged drought that hit California between 2012 and 2016 amplified the effects of climate change in the region, resulting in environmental conditions that further weakened the already fragile historic fabric [3,4,5,6]. This issue brings into focus questions regarding Bodie’s sustainability and resilience in the context of its harsh high-desert climate, identified as cold winter/dry summer (Dsc) in the Modified Köppen Climate Classification System. The site’s climate features snowy and frigid winters with average low temperatures in January as low as 4.7 °F (−15.2 °C) and dry summers with an average high temperature in July as high as 77.6 °F (25.33 °C), which make maintenance and conservation efforts particularly challenging [53]. Bodie’s historic landscape evolved through successive boom and bust cycles and fires in and around town that occurred during the historic period, natural deterioration resulting from abandonment, and alteration due to modern land-use practices. For instance, the 1892 fire destroyed much of Main Street between the Miner’s Union Hall and the bank building [54]. Residents rebuilt several buildings and moved others from back streets to fill in Main Street [55]. In 1932, another large fire destroyed most of the north part of the town. Bodie’s population dwindled significantly afterward, leaving only 10% of the town we see today [48].
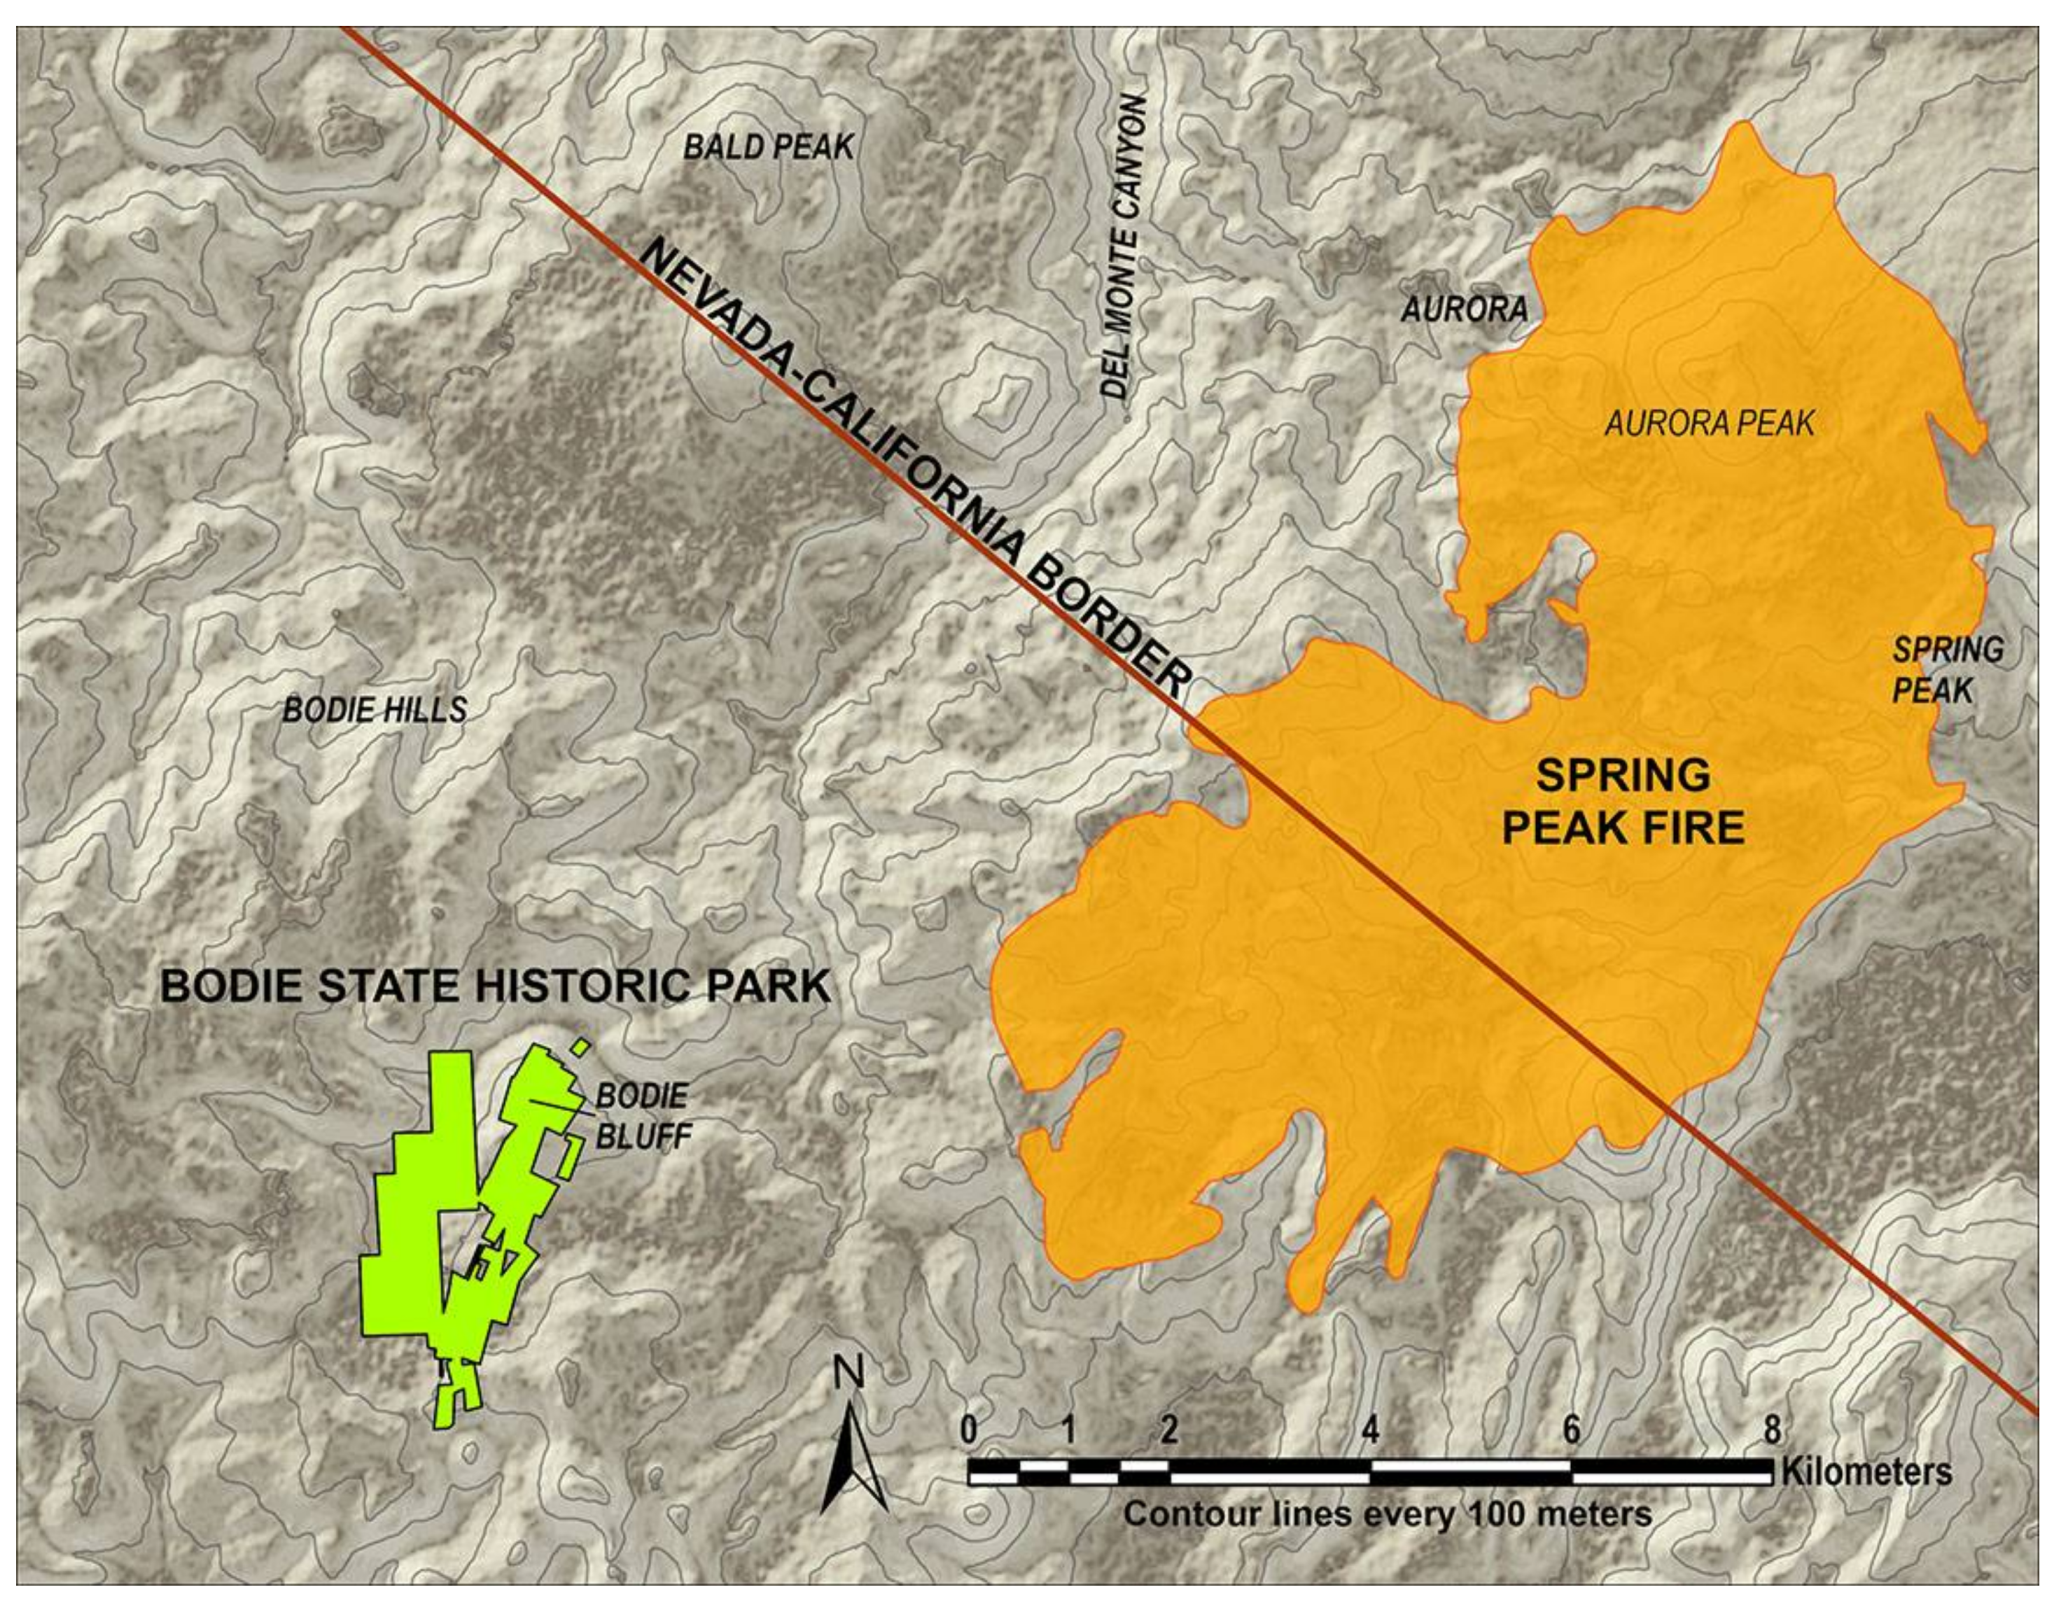
As of August 2021, Mono County is once again experiencing extreme drought conditions [56], making maintenance and stabilization efforts at Bodie more challenging. This situation is further aggravated by the park’s remote location, where fire suppression efforts are costly and may not be timely enough to protect Bodie’s cultural resources in case of a fast-moving fire incident. The most recent and serious fire threat came with the Spring Peak Fire that started as a lightning strike on 17 August 2013, within the Humboldt-Toiyabe National Forest in Nevada. High winds quickly carried the fire southwest. It crossed the California state line and stabilized approximately three miles east of Bodie [57] (Figure 4).
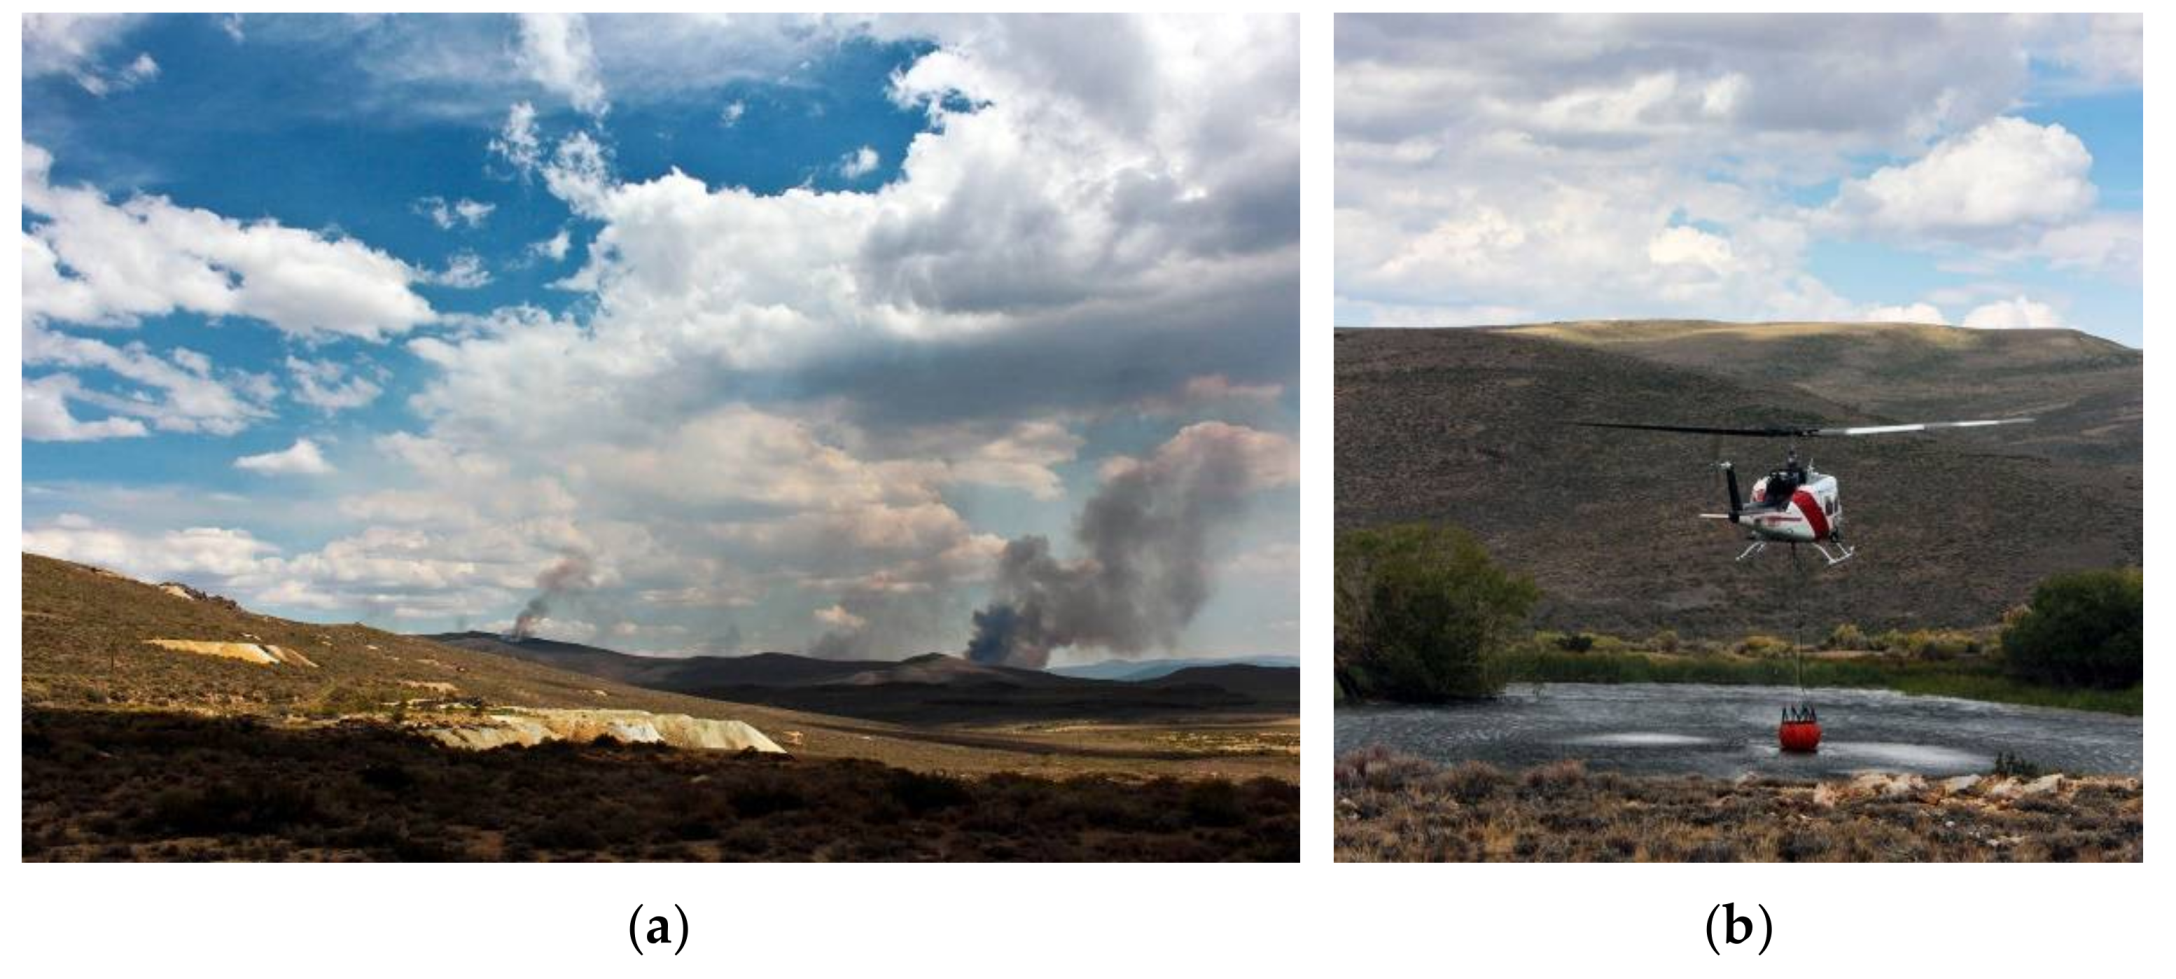
During the incident, a Structural Fire crew was deployed to the park to provide fire suppression support and protect buildings identified as high-value assets (Figure 5a,b). Of the 120 buildings still standing at Bodie, site managers were asked to provide a list of no more than ten structures to actively protect [57]. Fortunately, the Spring Peak Fire spared Bodie and its historical and archaeological remains. However, this dramatic incident served as an opportunity to evaluate and improve the park’s Wildfire Management Plan, fire suppression systems, and defensible space [58]. Prioritizing which resources to actively protect during a wildfire event is undoubtedly challenging. The selection process can be more discernable if there is a prior understanding of how individual resources contribute to the significance of the property along with advanced information about the site and its environmental conditions. The remote sensing documentation techniques employed in this study, together with our analytical and visualization pipeline, can enhance the acquisition and processing of this important intelligence before the urgency to respond to a fast-moving wildfire makes this task incredibly time-sensitive and complex, potentially draining resources from the response. For this reason, CSP partnered with our team to enhance the documentation of structures located in remote areas that are poorly defensible as detailed in the Results section (i.e., the Benton Railroad Office, the New Bodie Mine Hoist, the New Standard Hoist, the water tanks, and the Roseklip Mill Complex located on the hills above the townsite). Additionally, the agency explored options to utilize the 3D visualization tools discussed in this paper (i.e., Potree viewer) to identify and monitor at-risk buildings over time. This approach contributed to inform advanced planning and creating a priority list of buildings to protect before new fire disturbances occur.

2.2.2. Seismic Risk

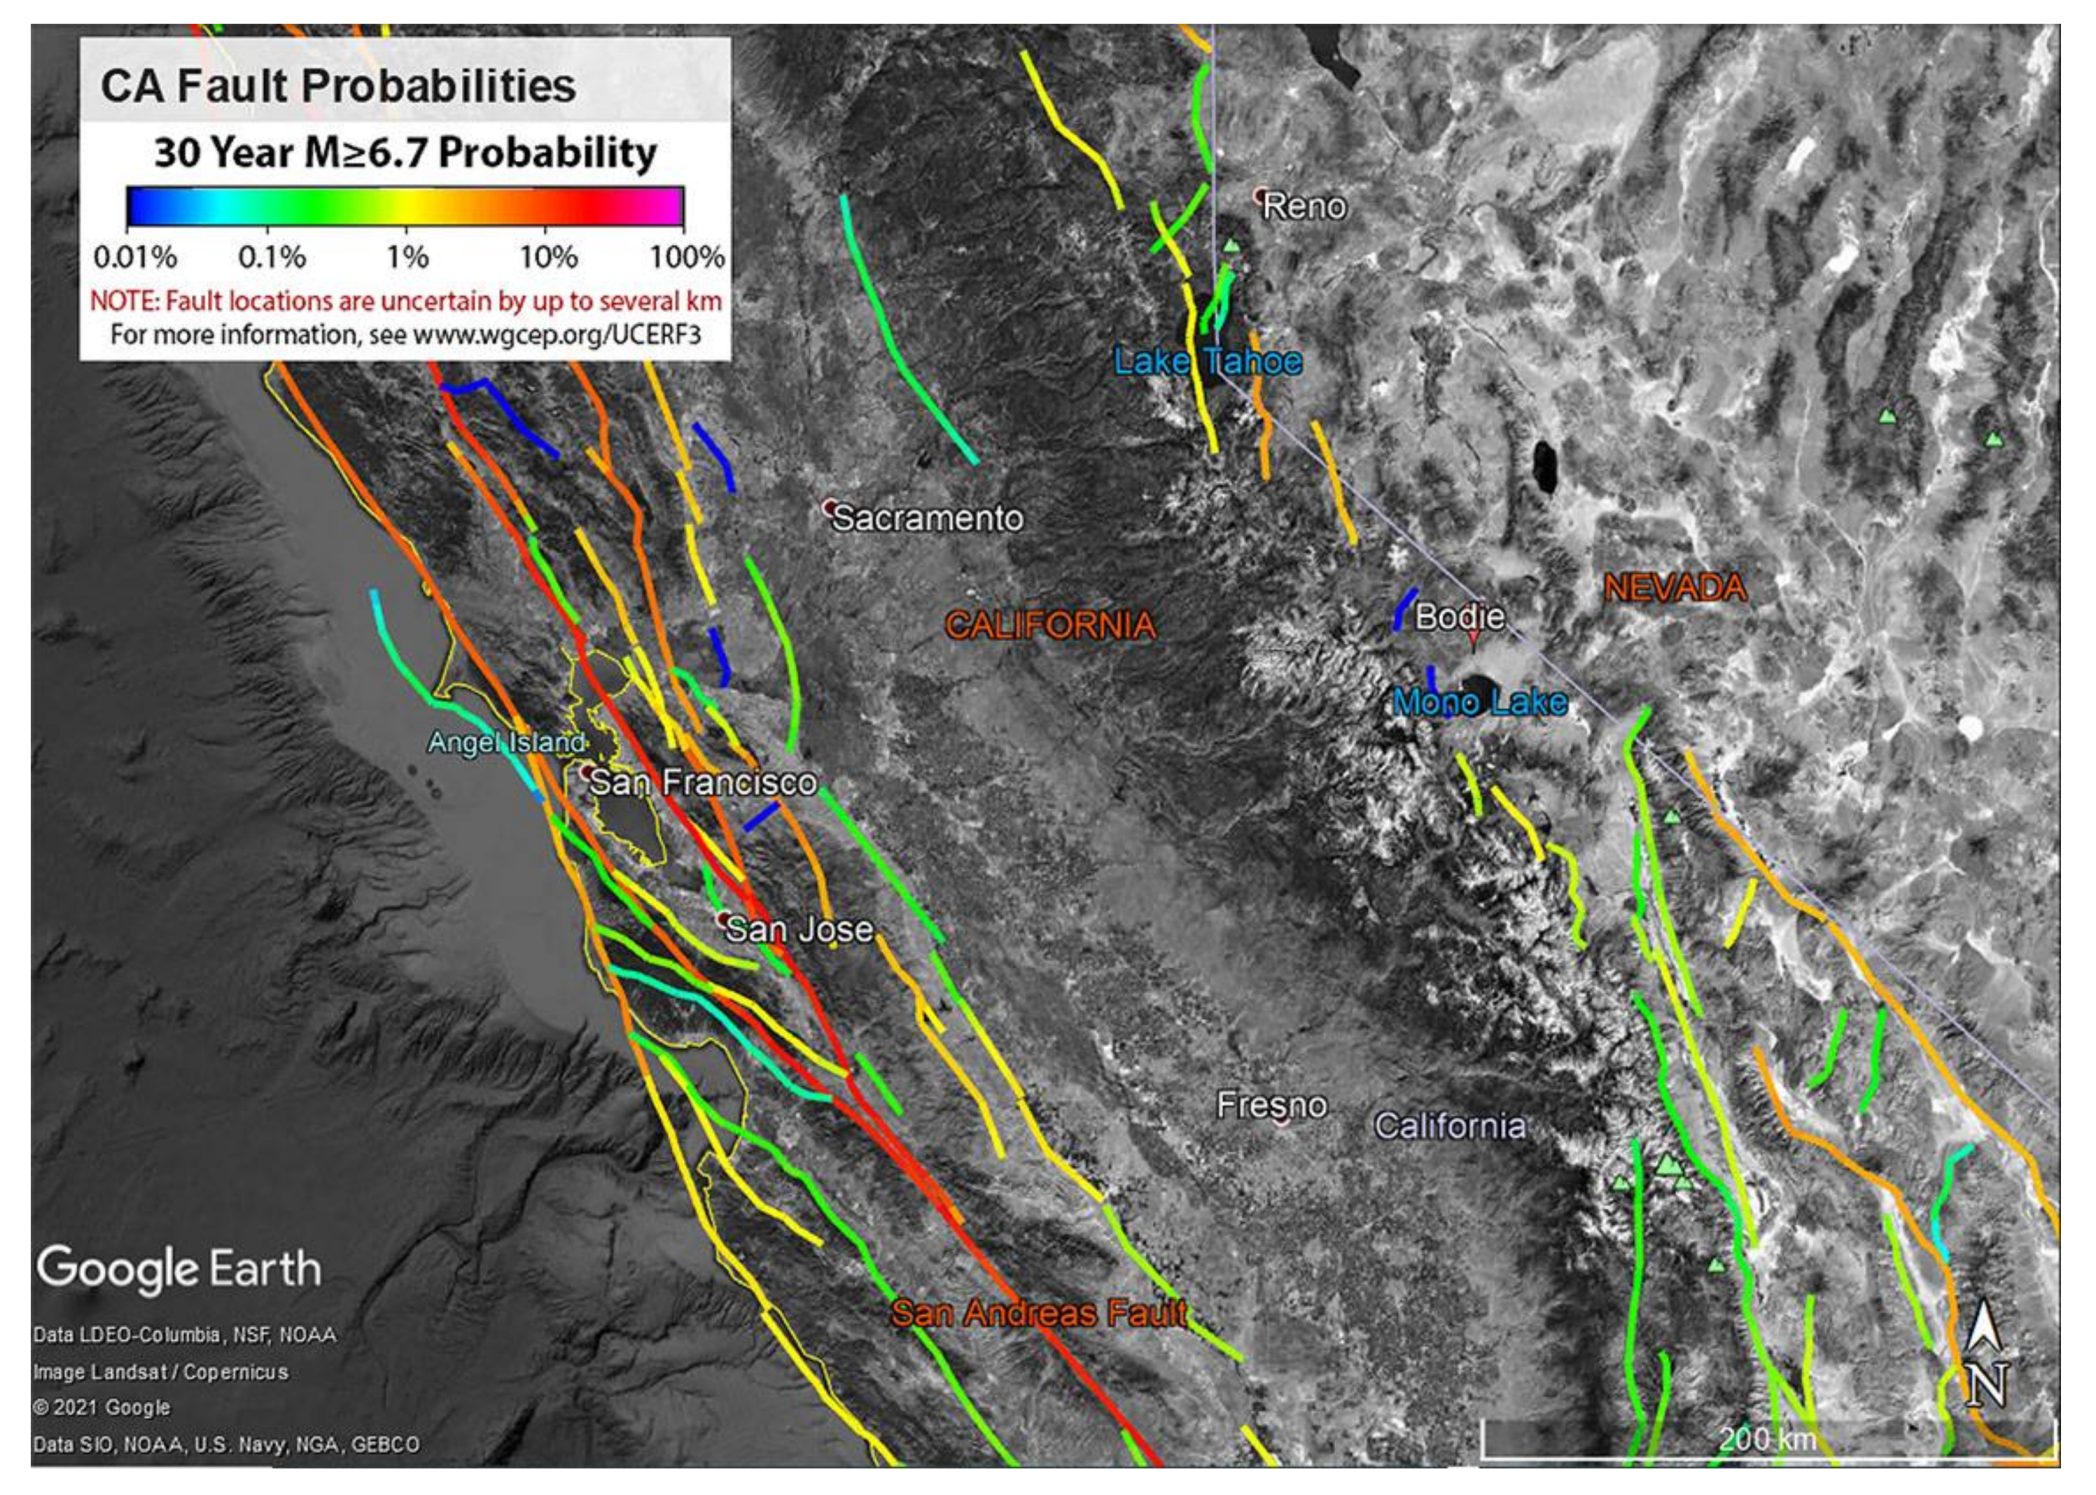
Bodie lies near several seismic faults on both sides of the California and Nevada border, two of the most seismically active areas in the United States [59] (Figure 6). A large number of moderate tremors with no identifiable mainshock are relatively common in the region. While it is rare that these episodes cause complete historic building collapse, they can compromise overall structural integrity and contribute to non-structural element failures.
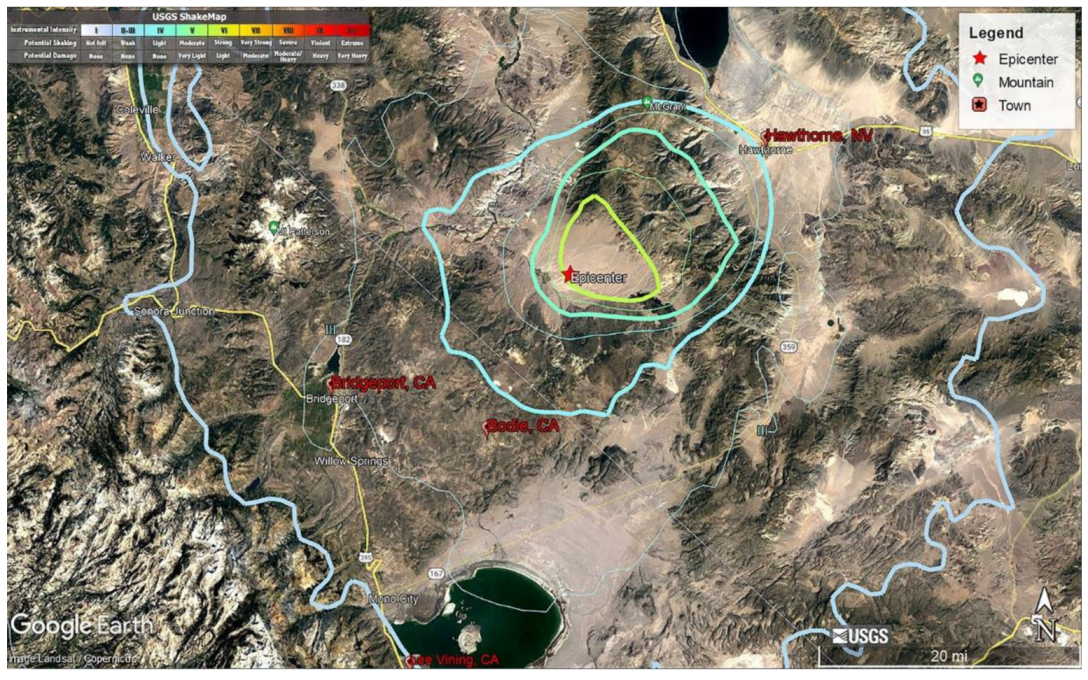
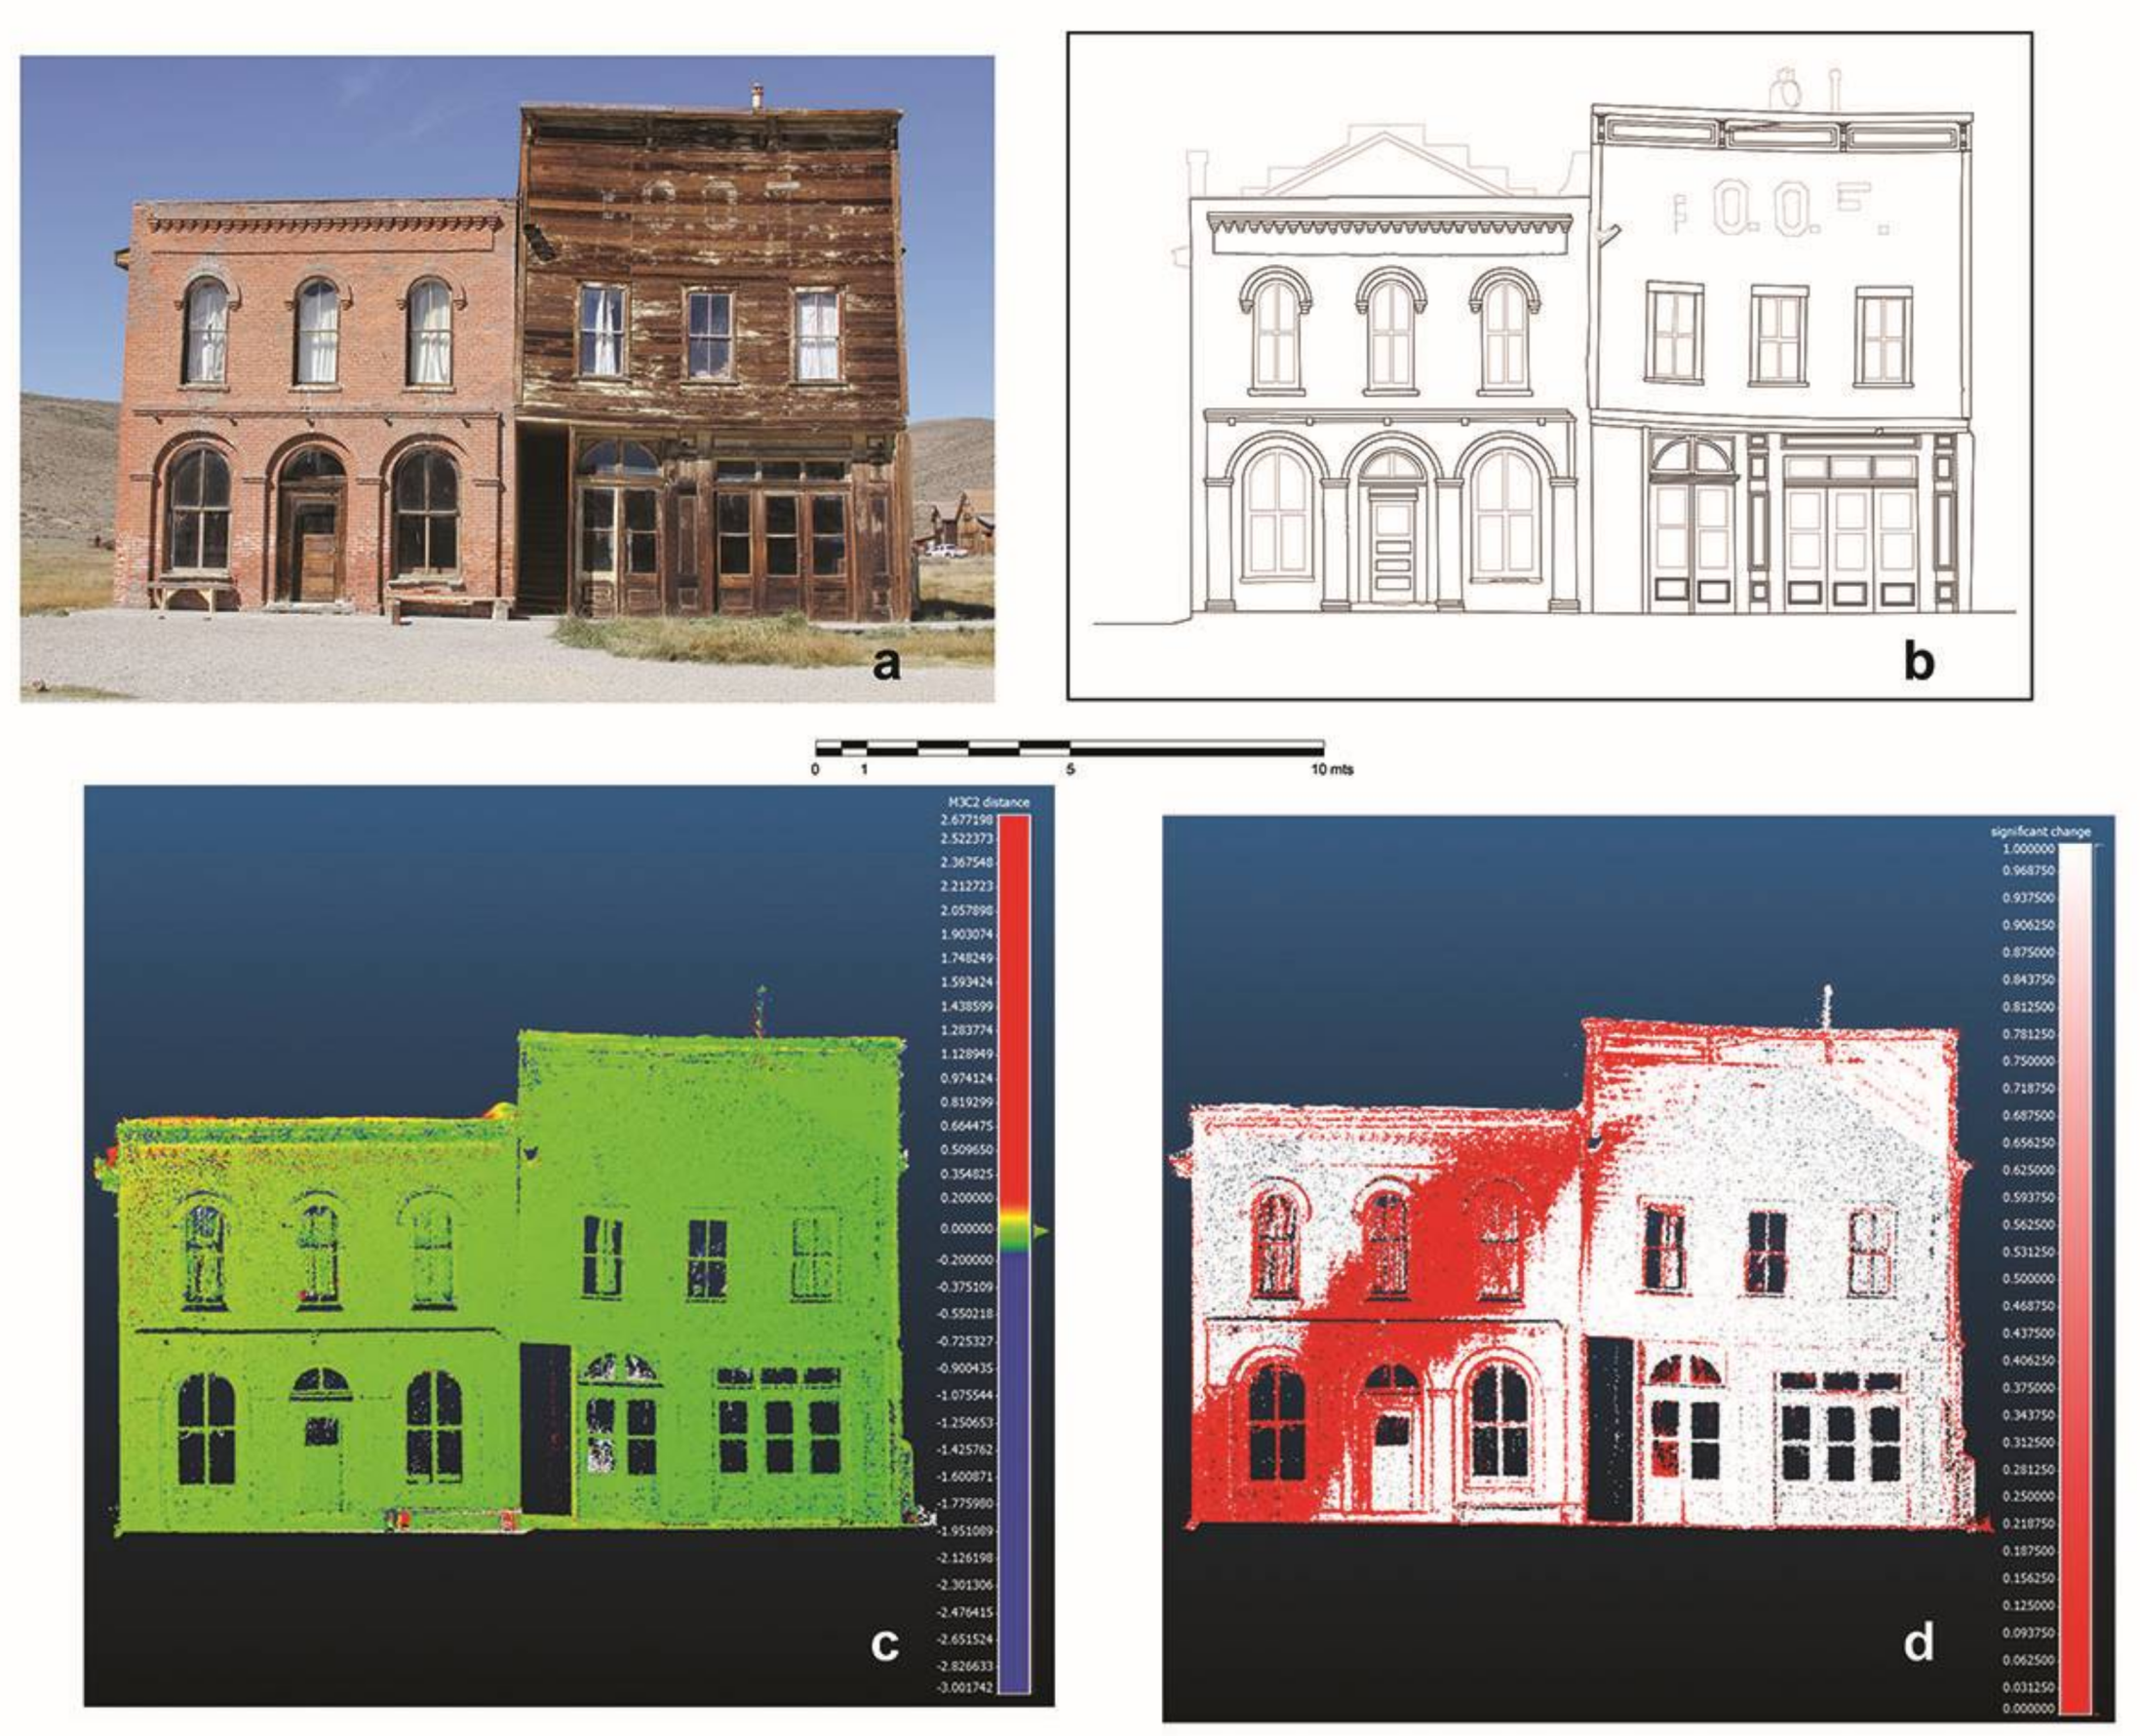
At Bodie, the most vulnerable non-structural elements affected by seismological activities are unanchored stone veneers, cornices, chimneys, and gable ends [60]. Intense seismological activity poses significant threats to historic settlements similar to Bodie as gas and water lines may rupture, which can cause fire and water damage. For instance, on 28 December 2016, the Dechambeau Hotel and the International Order of Odd Fellows (IOOF) Hall buildings at Bodie suffered damage during a magnitude 5.6 earthquake with an epicenter 28 km southwest from Hawthorne, Nevada, just a few miles east of the park [61] (Figure 7). As shown by our multi-temporal monitoring and building-level analysis of the said structures, this study detected and displayed the visible and invisible harmful effects of the 2016 earthquake. It is critical to be able to recognize these structural weaknesses early so efforts can be made to stabilize the structure, if it warrants immediate action, or modify the monitoring schedule to track changes if the situation is less severe. Results of the comparative analysis for Dechambeau Hotel and IOOF Hall would not have been possible without the collection of baseline 3D data prior to the incident. With the remote sensing techniques utilized in this study, collecting this kind of data has never been simpler. Being aware that post-processing and analysis can be time-consuming and costly, we argue that it is best to have these baseline data available if disaster strikes, especially in high fire and earthquake prone-zones.

2.3. Employed Data Capture Techniques

This study employed well-established geospatial and 3D capture techniques, such as topographic surveying by total station and differential GPS, stationary TLS [62,63], SLAM-based scanning [64,65,66], ground and drone-based IBM to produce 3D models [67,68,69], high-resolution ortho maps, Digital Elevation Models (DEMs), and Digital Terrain Models (DTMs) that can be analyzed in a GIS or CAD environment for further analysis [70,71,72]. A multi-temporal site monitoring methodology was developed to detect decay, material loss, non-structural issues in specific historic buildings and significant areas over time. Building on previous studies employing 3D surveys for damage assessment [63,73,74,75,76], we performed multi-temporal surveying of several historically significant structures and areas of the site, producing 3D datasets with a temporal frequency of one year. We also scanned several other buildings at risk producing single TLS datasets that can be used by site managers in case of damage or destruction. Details on buildings and areas scanned are provided in the section Results.

2.4. Datafication

A datafication process goes beyond the mere collection of information on at-risk cultural heritage and generates new questions on our data. Human interpretation plays a key role in creating new intermediate data from heterogeneous digital and analog data [77]. The data intimacy fostered by a human decision-making process—entailing the integration, transformation, and translation of all the diverse datasets—encourages new research questions sparked by the new knowledge acquired in this process [25]. For these reasons, our study utilized a datafication process to integrate new 3D geospatial data we collected a Bodie and intermediate and derived 2.0 and 2.5 data with legacy geospatial data of natural hazard disturbance made available by the U.S. Geological Service (USGS) and the U.S. Forest Service [61,78], historic photographs, technical reports, survey notes and field observations produced by California State Parks specialists, site managers, and preservationists working at the site.

2.4.1. Visualization of Cultural Landscape Features in a GIS Environment

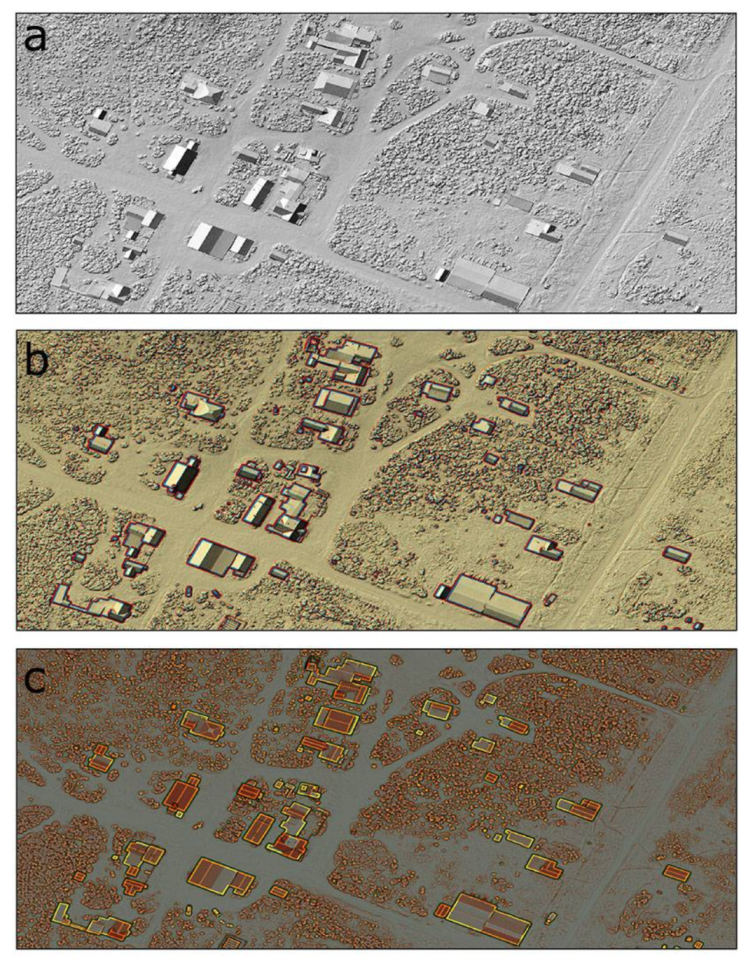
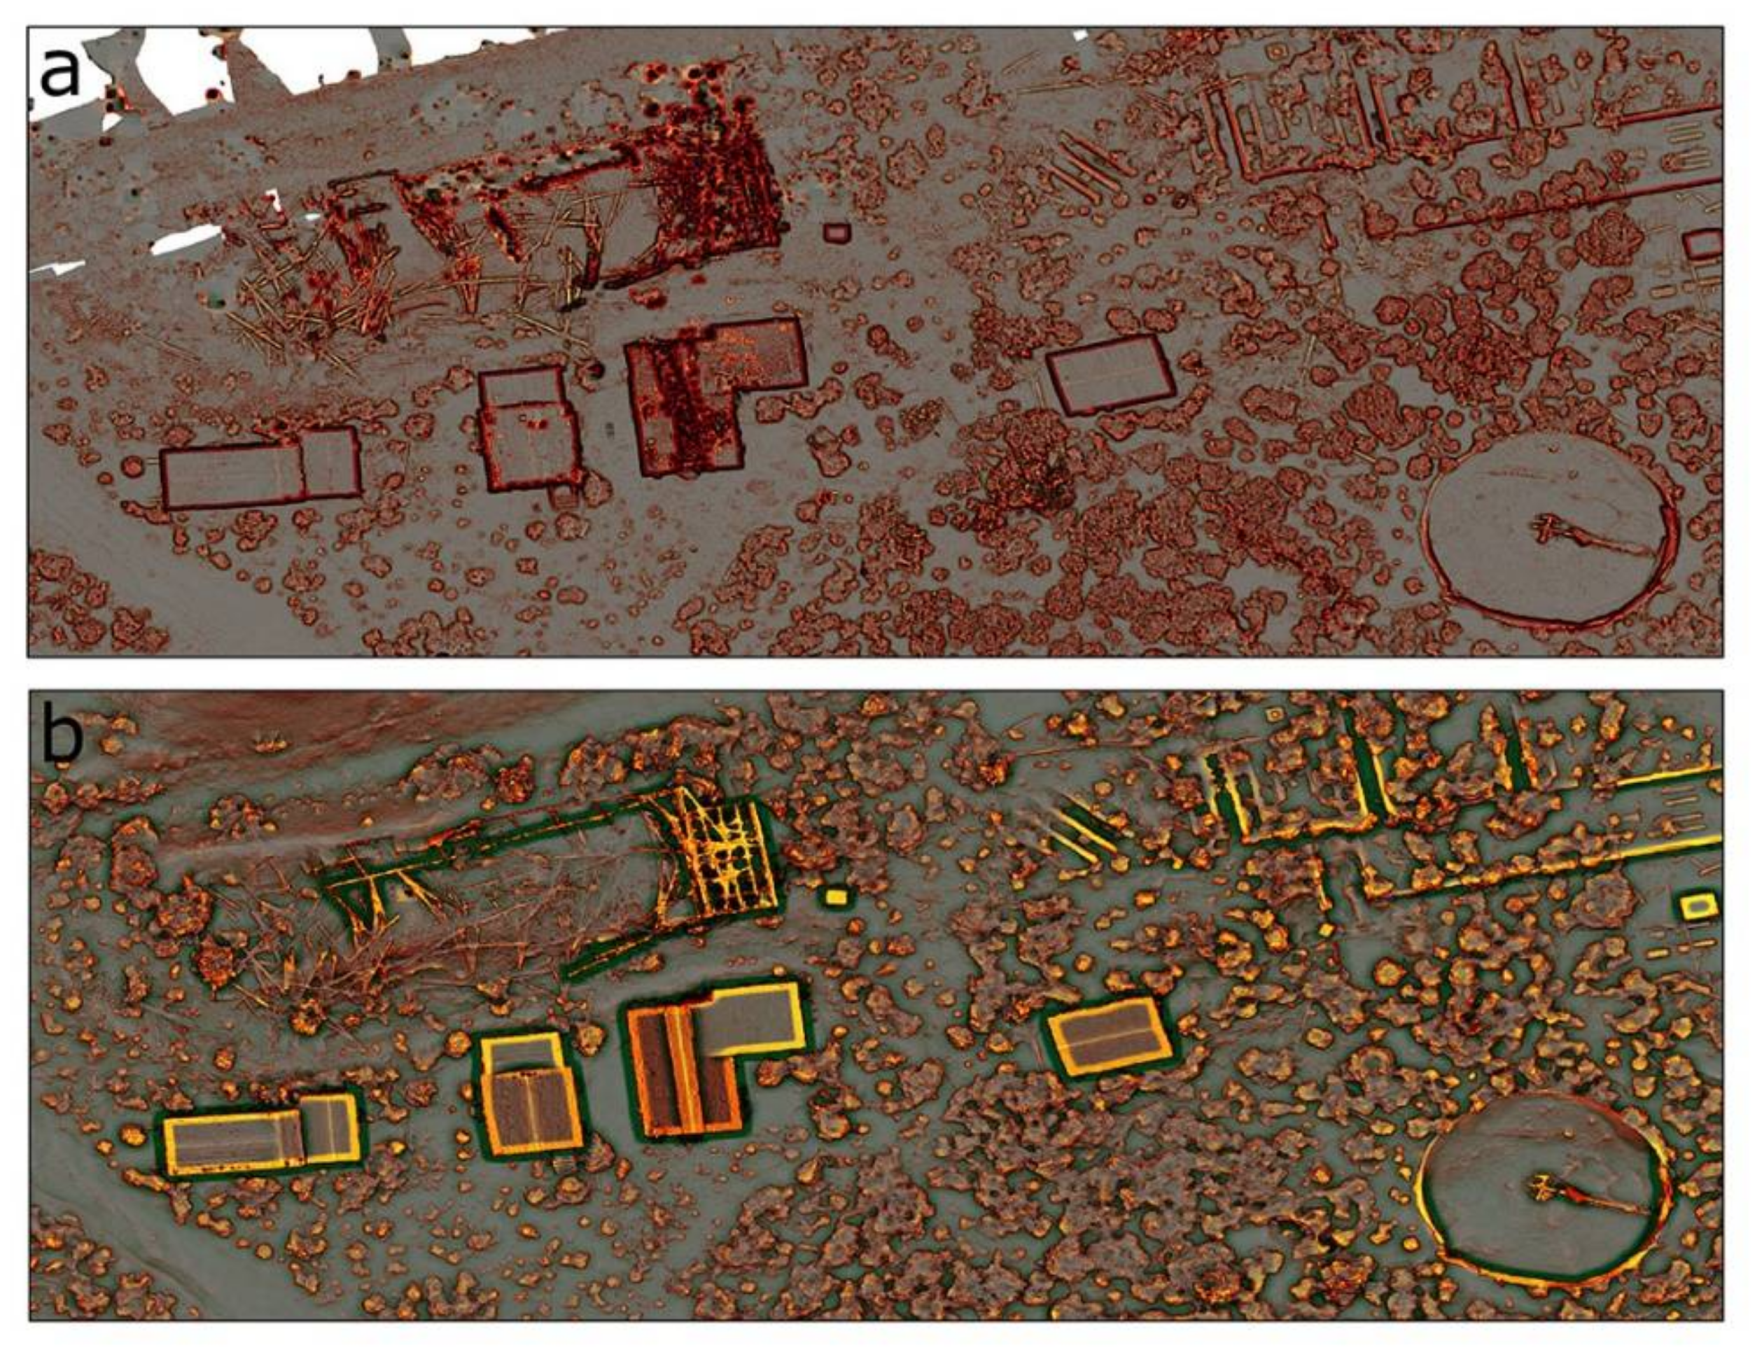
At the sitewide level, our datafication process relied on transforming geospatial 3D data captured by stationary or SLAM laser scanning and low-altitude aerial photographs processed through an IBM pipeline into visualizations that enhance the perception of spatial features of interest related to natural or cultural resources. We created DTMs of several significant areas of Bodie and produced visualizations of sitewide level data using different GIS visualization techniques. With the use of hill shading and various manipulations of the original DTMs, these visualizations were produced to emphasize or smooth out features such as roads, paths, buildings, ruins, sinkholes, mining shafts, tailings, and other remains of mining operations [79,80,81] (Figure 8a–c).
Of note, we applied a custom Local Relief Model (LRM) method to our DTMs [82] and obtained visualizations that isolate large landforms and buildings (Figure 8). We calculated the mean filter from the original DTM with an application radius of 50 pixels using the Whitebox Tools plug-in in Qgis 3.16.8. This low-pass filter was subtracted from our original DTMs. The LRM is presented in grayscale (Figure 8a) or in a palette of dark green tones to show negative deviations, gray as an intermediate tone, and yellow for positive deviations (Figure 8b). The resulting LRM was combined with a slope model calculated in degrees. The latter was visualized in a palette of red or orange colors where the less pronounced slopes are displayed in light tones and the steepest in dark tones (Figure 8c). The fusion of both visualizations was produced in multiplication blending mode. The result is visually very similar to the Red Relief Image Map (RRIM) utilized in previous studies. However, it uses the LRM method to show positive and negative deviations to the surface trend instead of emphasizing concave and convex features of the relief as in the RRIM technique [83,84,85]. This method facilitates the detection of small landscape and architectural features, thus improving monitoring of the Bodie landscape and its buildings and ruins while also providing an enhanced representation of said features in their broader spatial context.

2.4.2. Damage Map in a CAD Environment

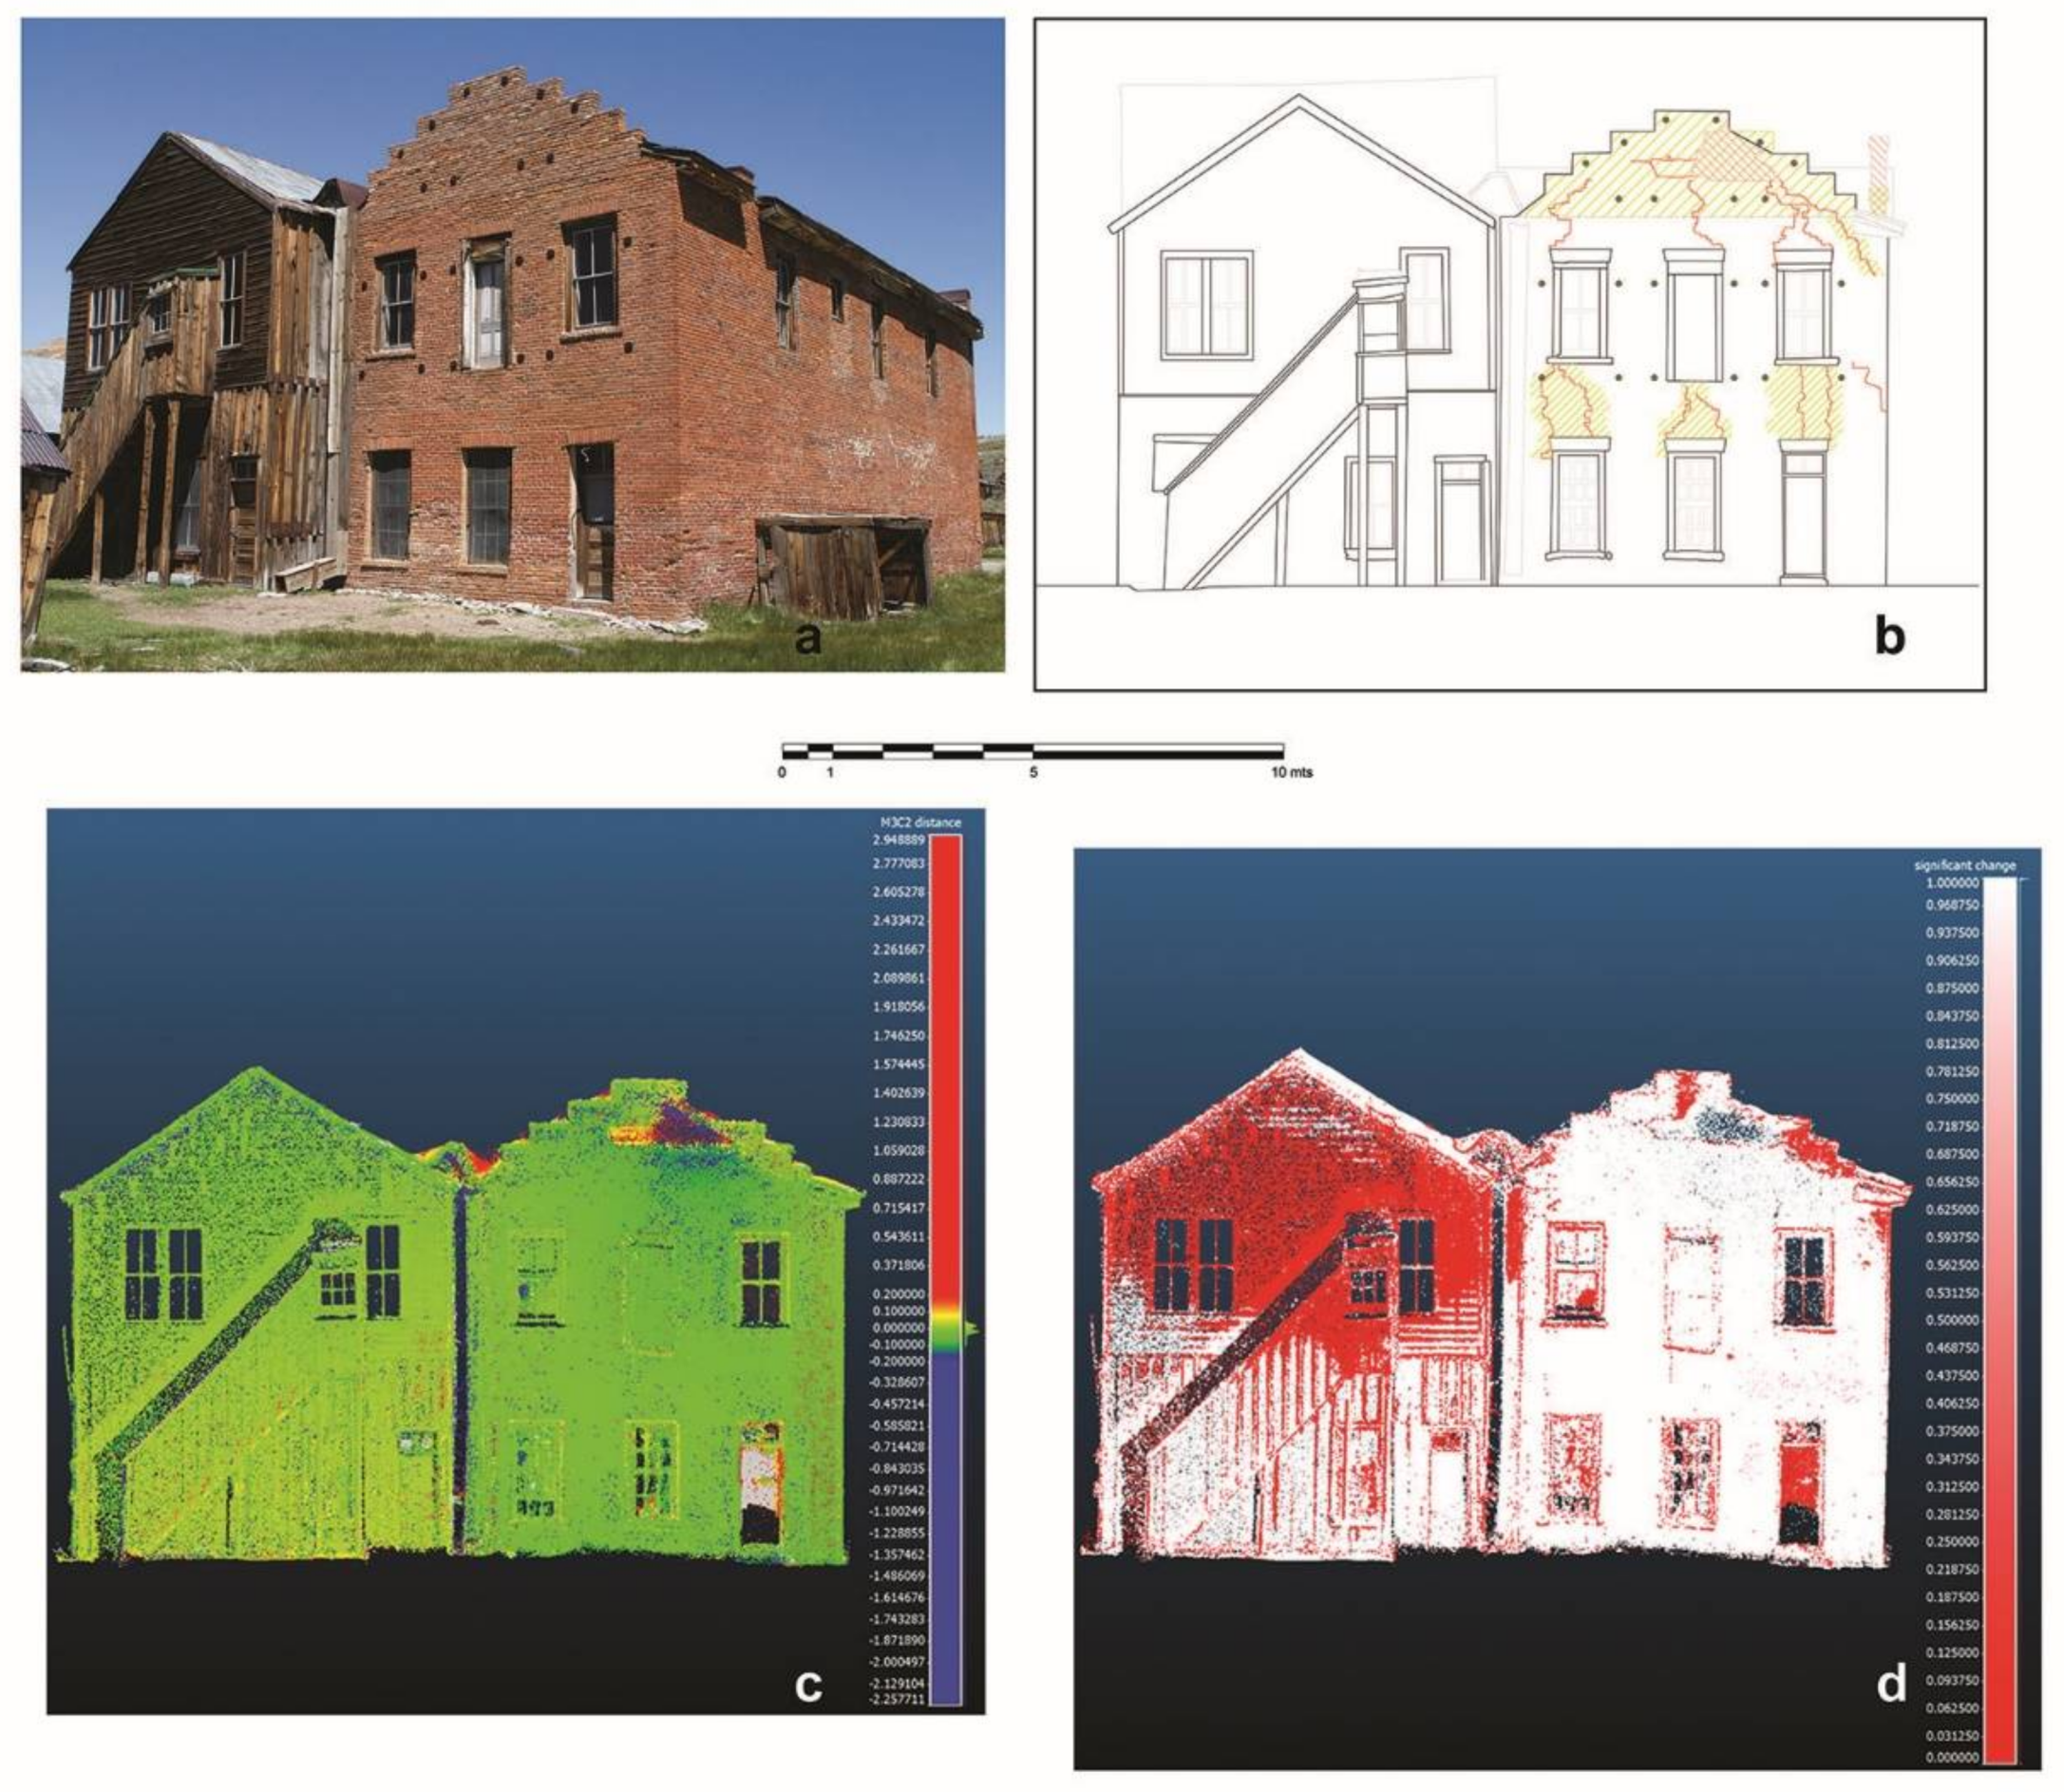
At the building level, our datafication process focused on assessing the resilience of iconic historic structures. We selected the adjacent Dechambeau Hotel and the IOOF Hall buildings as a case study, given their prominent location on Main Street at the entrance of the site and their ubiquitous presence in the legacy and contemporary photographic record of the site. We integrated and compared a heterogeneous corpus of digital and analog data documenting these buildings to illustrate the pattern of seismic damage caused by the 2016 earthquake and the solutions adopted for the subsequent repair and consolidation. We employed a computer-aided design (CAD) environment to sketch an elevation of the more iconic and representative western and eastern façades of the buildings. Significantly, we used the CAD to produce a damage map of the western façades where visible damage affected the Dechambeau brickwork. Our damage map displays in 2D the life cycle of the Dechambeau Hotel western façades before/after disturbance and post-restoration. While complying with the Historic American Buildings Survey (HABS) drawing guidelines was out of scope in our work [86], our elevations build upon the 3D data recorded to make the structures more understandable to the general public through measured drawings. This approach is recommended by the Heritage Documentation Programs of the U.S. National Park Service [87]. Additionally, the natively digital data we used in our drawings were stored in our online digital collection to ensure their long-term permanence and access by architectural historians interested in Western U.S. vernacular architecture and the public [44].

2.4.3. Automated Surface Change Detection

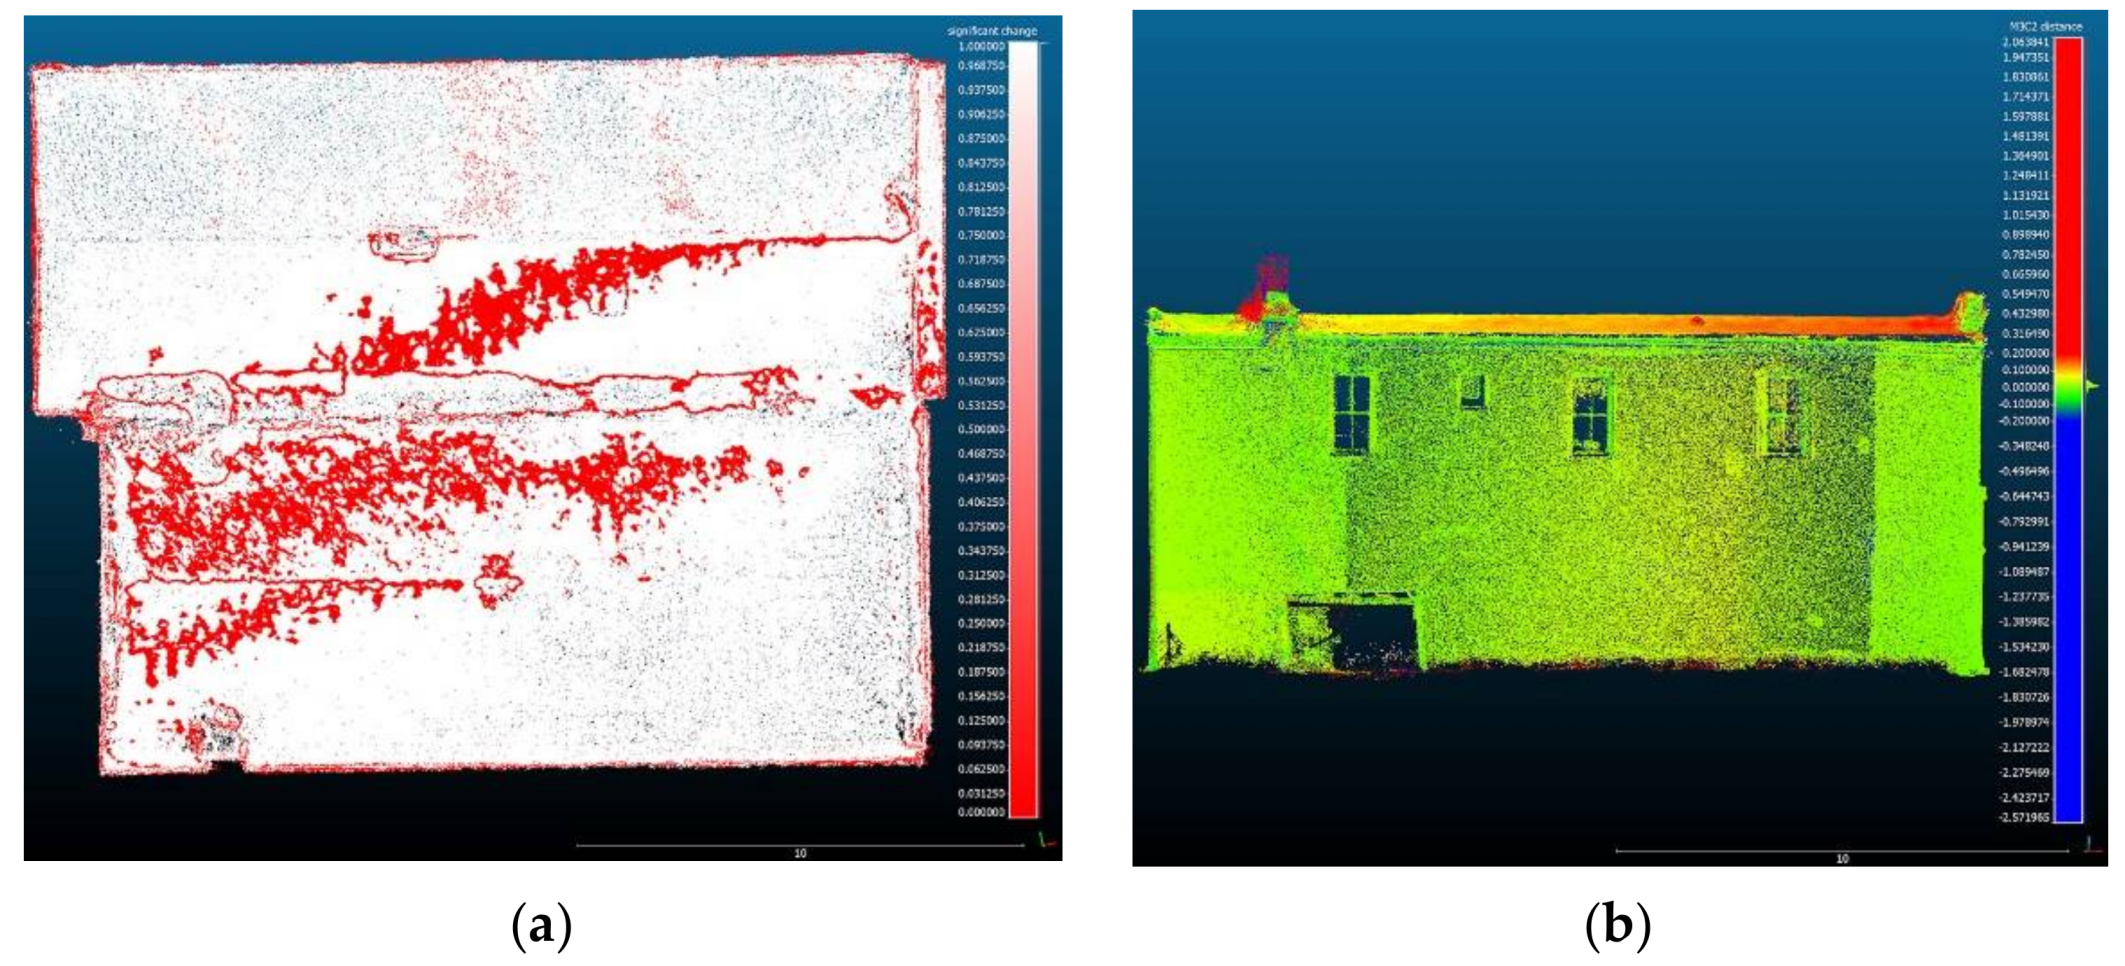
We produced additional data to be integrated into our datafication process using the open-source software CloudCompare (CC) and its Multi-scale Model to Model Cloud Comparison (M3C2) plug-in. Using these tools, we calculated millimeter-level distances between identical X, Y, Z points captured in multi-temporal point clouds describing the surfaces of surveyed buildings and areas [88,89,90,91,92]. We employed the M3C2 method to compare pairs of perfectly aligned and identically segmented point clouds and detect surface change. More specifically, we used the CC 3-Point Registration tool to align the datasets achieving the lowest useful registration error values (RMS) we then used in the M3C2 plug-in to avoid false positives. Since we compared morphologically complex surfaces, we oriented the point normal using CC Minimum Spanning Tree method. We then used the M3C2 method to compare a subset of core points obtained using a cylindrical projection for which we identified optimal radius and maximum depth. The M3C2 plug-in performed automatic point cloud segmentation to decrease the chance of points compared to not having almost identical references in the base cloud and avoid mistakenly registered false distance values. It then created datasets with almost identical dimensions. Finally, it identified the significant change (based on a 95% confidence interval) that occurred on different portions of the compared buildings and areas. The M3C2 results allowed us to inform site managers if a building has begun shifting dramatically or an area eroded or decayed faster than it could be detected during foot surveys or manual inspection.

2.5. Web-GL Visualization

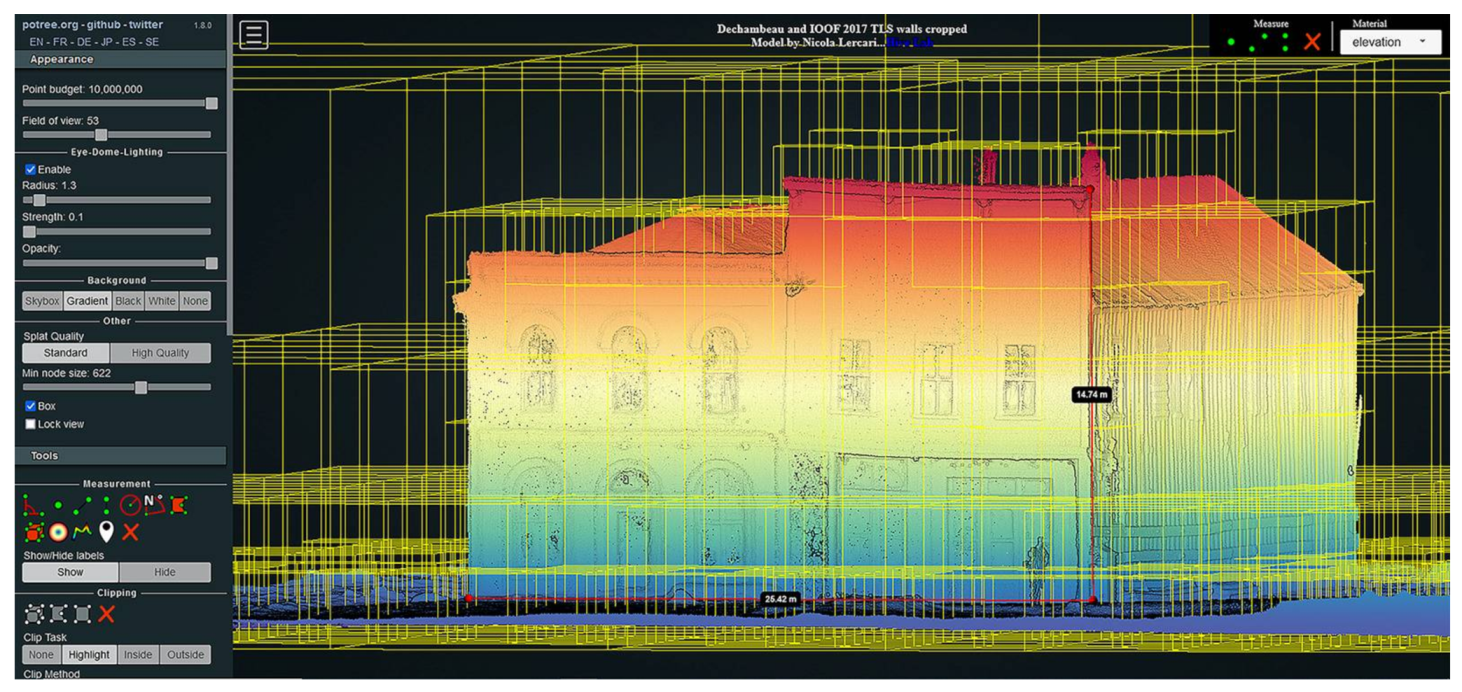
While the LiDAR and IBM data capture techniques used in this study are increasingly accessible, they produce overly complex data outputs with a limited immediate utility to heritage preservationists. The use of these data requires high-performance computing, complex processing pipelines, and additional manual labeling. The utility of high-resolution 3D data is often limited to downsampled 2D derivatives, such as snapshots, videos, plans, orthophotos, and DTMs. At the same time, the raw data remain too dense and unwieldy to warrant digital archiving or dissemination. Multi-resolution data structures, implemented in open-source WebGL viewers, contribute to solving this problem as they offer robust interactivity and customization. They can stream multi-billion-point, hundred-gigabyte datasets as they might a YouTube video, scaling resolution to individual devices and bandwidths. Thus, this study employed the Potree point cloud viewer as an exceptionally efficient multi-resolution WebGL platform to enable collaborative visualization and web-based interaction with data collected at Bodie. Potree is built on the popular open-source Three.js WebGL game engine [93]. The system, essentially, trades network storage for local computing power by incorporating “octrees” or recursively nested cubes of finer and finer detail (Figure 9).
Octrees are loaded real-time, relative to the user’s camera position, only loading as many points as can be seen at any given time. Potree implements these data structures in a highly versatile web environment, allowing for custom annotation and contextualization. Moving seamlessly from kilometer to sub-millimeter scale, placing data captured via LiDAR, IBM, sonar, volumetric CT scans, and meshes and shapefiles in a single open, georeferenced, extended reality-ready context that can be used for visualization and collaborative data interpretation purposes. Built-in measurement tools and coloration allow users to navigate between layers of colors, scalar values, and classifications, supporting all fields within the LAS specification, along with customized attributes. A highly optimized “adaptive” point sizing feature makes most point clouds appear as continuous surfaces with approximately homogeneous point distributions. The same web page can be adapted to a standard desktop, laptop, custom visualization walls, now common at large research institutions, virtual reality headsets, and select Android tablets. The employed Potree can stream individual datasets in custom external web instances, enabling students, community stakeholders, and external collaborators to re-purpose the research data in localized contexts without being gouged by hosting fees.

3. Results

Geospatial control data used in this study were collected by CSP land surveyors in 2015–2017 using Bodie’s permanent control network in combination with a Trimble differential GPS (DGPS) and triangulation by a total station. We used these centimeter-level positioning data to georeference our 3D survey data and related intermediate 2.0 and 2.5 derivative data. Additional high-resolution geospatial data were retrieved from the OpenTopography repository [94]. Between 2015 and 2020, we utilized various UAVs (i.e., a custom drone manufactured by Monarch Inc.; a DJI Phantom 3 Pro; a DJI Inspire Raw 1; a DJI Phantom 4 Pro, a DJI Mavic Pro) to collect thousands of close-range aerial photographs of individual buildings (i.e., the D.V. Cain, the Firehouse, the Miners Union Hall among many others, the entire Bodie townsite, and several nearby mining areas (i.e., the Standard Stamp Mill and the Roseklip Mill complexes, and a water tank located on the slope of the Bodie Bluff) (Figure 10). Using the IBM app Agisoft Metashape, we processed the photographs and produced georeferenced 3D models and DTMs that precisely describe the mapped areas or buildings.
In 2015–2017, 2019, and 2020 we employed a FARO Focus3D S120 shift phase stationary scanner to perform multi-temporal monitoring of historic structures. We documented with high accuracy and precision several iconic historic buildings, including the Dechambeau Hotel and IOOF Hall, the Hoover House, the Benton Railroad Office, the Swazey Hotel, and the Methodist Church, the only remaining original place of worship at the site (Figure 10). Additionally, a few more modest yet culturally distinct residences were laser scanned, including the house of a Paiute tribal member, Rosie McDonald, and the stamped tin can-sided “Chinese Residence” (Figure 10—top left). Using the FARO scanner, we also documented the New Standard Hoist and the New Bodie Mine Hoist buildings, two structures associated with mining operations, identified as high priority by CSP site managers. Their remote location along the slopes of the Bodie Bluff makes the latter buildings particularly at risk in a rapid-moving wildfire (Figure 10—right side).
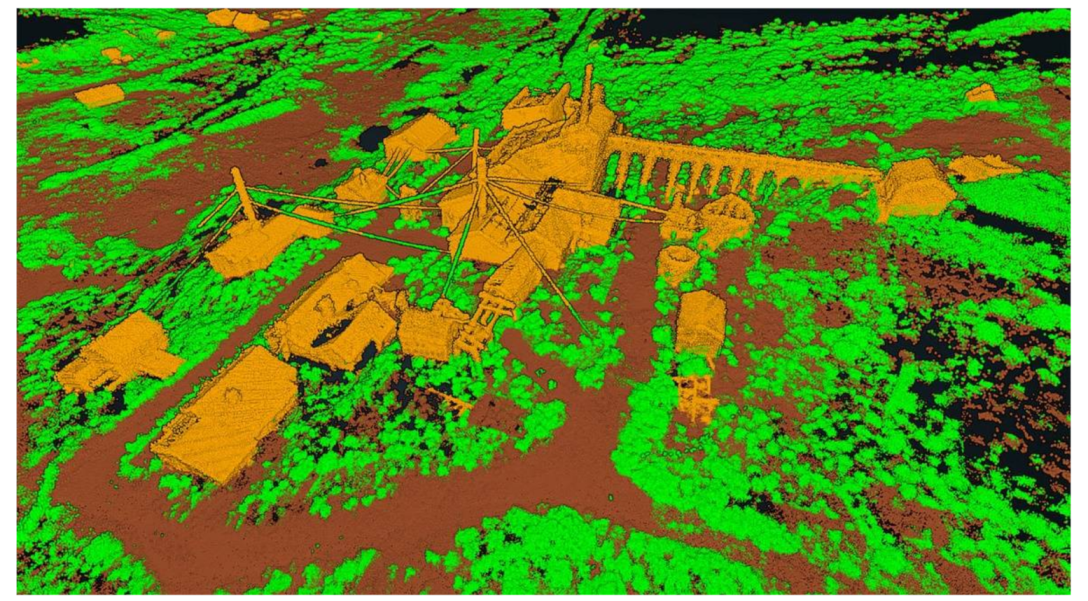
In 2020, the last year in our study period, we deployed at Bodie a GeoSLAM ZebHorizon handheld scanner featuring a Velodyne Puck sensor. We performed SLAM mapping of entire areas of interest to produce extensive 3D documentation that can be used in future studies or preservation efforts. Leveraging the fast speed and high mobility of the SLAM scanner, we walked along the several roads and trails that cross the park and documented, in 3D, an area encompassing approximately 35 hectares, or 349,858 sq. meters in few hours. The SLAM scanned area covers the entire Bodie downtown and Chinatown, which lies adjacent to the northernmost section of Main Street, and the Standard Stamp Mill complex, which is accessible only through guided tours due to physical and moderate biohazard present in the area. We then processed the SLAM data using a series of tools included in the LAStools suite optimized for our Velodyne Puck sensor [95]. These tools helped us filter, denoise, and classify the SLAM data (Figure 11) and then produce derivative datasets that can be visualized online in our Potree viewer to inspect or monitor buildings and areas or, simply, to virtually tour the park.
Using the remote sensing techniques and the data discussed above, we produced a collection of highly accurate 3D models and intermediate and derived 2.0 and 2.5 data of Bodie documenting over forty structures, and three areas of the site (i.e., the townsite, the Standard Stampmill complex, and the Roseklip complex). These datasets can be used to inform maintenance, conservation, or physical reconstruction. We shared results with park managers and created a best-practice guide for built heritage documentation that was reviewed and accepted by California State Parks as the standard operating procedure for the department [96]. Most importantly, we created an open access online collection archiving our data to ensure replicability of results and dissemination to the public [44]. Given the heterogeneity and different scales of our results, we chose to demonstrate the viability and effectiveness of our methodology through two examples that represent how our work can be integrated within a comprehensive site monitoring program to increase the resilience and sustainability of Bodie. More specifically, the following examples focus on the Web-GL visualization of several areas of the site and on the damage analysis of the Dechambeau Hotel and IOOF Hall.

3.1. Sitewide Level Results: WebGL Visualizations of Bodie in Potree

We incorporated our sitewide level results into an instance of Potree viewer. This online visualization environment combines the collected geospatial and 3D data with derivative products and facilitates collaborative exploration of our results [97]. As applied to Bodie, our WebGL platform includes 9 different datasets: a 2020 sitewide drone IBM model (3.9 billion points, 36 Gigabytes), 2 IBM models of the Roseklip Mill area comparing 2015 and 2020 changes (530 million points—5.8 Gigabytes; 1.3 billion points—12 Gigabyte), a 2020 SLAM point cloud (6 billion points—5.9 Gigabytes) and 4 TLS models of individual buildings (totaling 765 million points—3.9 Gigabytes) [97]. We integrated our instance of Potree with Cesium.js global base map to enable a geographic contextualization of our results with an OpenStreetMaps tile server. We also applied a fine adjustment to imperfectly georeferenced 3D models via manual offset added in the Potree HTML page. For instance, we adjusted the location of our 2020 sitewide drone IBM 3D model, where a subset of the base imagery included incorrect elevation metadata due to an error generated by the GPS unit of one of the employed UAVs. We used the more accurate TLS data of the Dechambeau Hotel and IOOF Hall, the Rosie McDonald House, the Benton Railroad Office, and the Hoover House to fix this issue. The latter 3D datasets were accurately georeferenced using geospatial control collected at Bodie by CSP surveyors in 2016 and 2017 using a DGPS and total station.
Online visual analysis of our results in Potree is significant as it enables Bodie site managers to discuss and interpret the damaging environmental effects on managed resources with experts and specialists who are not on site for advanced planning purposes. For instance, our WebGL platform can effectively make large classified SLAM LiDAR point clouds (Figure 11) or the drone-based IBM model capturing the entire townsite (Figure 12) available on the internet as interactive 3D visualizations to discuss the historical significance of buildings and areas and inform the creation of a priority list of resources to save in case of natural hazards.
Our Roseklip Mill area results are significant as they display multitemporal 3D data documenting the complex in 2015 and 2020 (Figure 13). These 3D datasets capture the large historic complex of buildings, industrial refuse concentrations, mine tails, cyanide vats, tailings pond, and other related features at the beginning and end of our study period. These multitemporal datasets can be used to monitor site conditions over time and better understand how contaminants might be migrating from tailings and document erosion and distribution. Our Potree results also allow park managers to identify and track the expansion of previously known mine shafts while also providing early indicators of subsidence and future collapse. Finally, our Web-GL visualizations allow stakeholders, communities, and the general public to access and review the data in a 3D Web environment. Leveraging this capability, our instance of Potree engages them with a more inclusive monitoring effort of Bodie meant to increase this beloved park’s protection and awareness of threats to its cultural resources.
Our Web-GL platform can also be used to obtain measurements easily, produce enhanced documentation, such as ortho maps, vector drawings, and segmented 3D point clouds, allowing for better preservation and protection planning. In future studies, scholars can leverage Potree shading techniques, such as the Eye-dome non-photorealistic lighting model [98], to visually analyze our datasets and reveal hidden or otherwise unobtainable knowledge, such as the location of Chinatown buildings that were burned in the 1982 fire.
However, the system has some limitations for the effective re-use of data. For instance, the native Potree file format does not currently support granular web-facing segmentation and queries (e.g., select and download only a small section of a larger model), offering this feature only on machines with filesystem access. The Entwine Point Tile (EPT) offers an alternative Potree-readable format that can be queried directly [99]. Another archival structure is employed by the OpenTopography project [94], which stores large point clouds as EPT files. Users select a region on a map and can download or visualize the corresponding data in various formats, such as point clouds, DEMs, and orthophotos. This system allows for on-request WebGL visualization, building temporary Potree viewers when the option is selected. Unfortunately, the EPT format does not scale well to giga-resolution data. For this reason, it takes days to process the octree structures for point clouds exceeding two billion points and creating hundreds of thousands of tiny files, making the visualization stack unwieldy to move between local and network locations. For this reason, we separate archival and visualization layers, which could otherwise be combined in smaller projects.

3.2. Building-Level Results: the Example of the Dechambeau Hotel and IOOF Hall

We scanned the Dechambeau Hotel and IOOF Hall in 2016 before the earthquake disturbance and then again in 2017 (Figure 14a–d). Data collection was performed using stationary TLS scanning from ground level and drone-based aerial photos.
Sections of the buildings were mapped via laser scanning, creating walls of points that had position and color data stored. The scanner had to be set up at various points around the building to ensure that every surface had been imaged completely. Next, the scans were stitched together in FARO Scene to form a single cloud of the walls of the buildings. Due to occlusion, the scanner did not properly measure the roof of the structures, so aerial mapping via UAV was also required. A drone made several passes in a grid pattern (nadir camera) over the area of interest and circular patterns around the buildings (oblique camera). The base imagery was processed in Agisoft Metashape to generate 3D point clouds. Both the roof and wall sections of the respective years were edited to remove noise and points that were not of relevance to the analysis of the structure. Once cleaned, the roof and wall point clouds were merged in a single cloud for 2016 and 2017. The 2017 dataset was then aligned to the 2016 reference dataset in CloudCompare by selecting analog characteristic points on each cloud for a minimum of three pairs, achieving 0.013 m accuracy. Once the initial alignment was completed, more points were chosen to reduce the RMS error as much as possible, eventually to a final value of 0.0038. At that point, normal were calculated for the 2017 cloud. A triangular method was used for the local surface model and a minimum spanning tree of knn = 25 to best project from the surface to calculate the normal. Next, we performed an M3C2 analysis of the two clouds with a projection diameter of 0.08 and a depth of 2, inputting the RMS, using the normal of 2017, and projected onto the 2016 cloud. Using the M3C2 plug-in, we computed significant change between the datasets and projected the results on the 2016 point cloud showing both significant change (Figure 15a) and M3C2 distance along an axis (Figure 15b). White points display significant change on a 95% confidence interval in our significant change visualizations, while red points are not significantly altered or otherwise outside of this interval.
Using TLS results, we also sketched measured drawings of the buildings by digitizing wall limits and main architectural details from orthophotos derived from our 2016 pre-disturbance 3D survey. Furthermore, we double-checked architectural features by contrasting the 2016 orthophotos with historical images of the buildings made available by California State Parks or retrieved from federal and state online photo collections [100,101]. We found that during the 2016 Hawthorne earthquake, the west façade of the Dechambeau Hotel was severely damaged. Multiple fractures appeared between the bricks adjacent to windows and doors. The upper part of the building, decorated with corbie steps, suffered a severe material loss while the chimney entirely collapsed. We mapped our findings and the results of subsequent consolidation and restoration effort in CAD by integrating additional information obtained through our 2017 post-disturbance 3D survey (Figure 16a–d).
We integrated our CAD drawings, and M3C2 distance maps, with the Dechambeau and IOFF Hall photographs to complement our damage maps and accurately represent the buildings’ materials. This approach enables a broader understanding of our measured drawings by the general public. Our on-scale CAD visualization spatially contextualizes the 2016 seismic damage pattern and distribution of resulting cracks, which are necessary information to anticipate structural damage [31]. When overlapped with the solutions adopted to mitigate the loss of material and the issues detected, our damage map provides a comprehensive approximation to the structural integrity of the building and its before/after disturbance life cycle. For instance, during restoration, the upper part of the Dechambeau’s West façade was completely rebuilt. Comparing our results with historic photographs, we found that one of the corbie steps decorating the right part of the gable roof was reconstructed in 2017–2018, even if it was absent in any photograph of the building taken after 2007. We also discovered that those same images show the reintegration of a corbie step on the left side of the roof at an unknown time. The left corbie step was not present in the pictures taken in the 1960s and 1970s. Our findings speak to the value of producing damage maps of historic buildings as cultural heritage monitoring tools that capture the life cycle of significant structures.

4. Discussion

The preservation threats affecting Bodie can be contextualized in the broader context of the American West, where many other cultural sites of significance share similar environmental or historical characteristics. The risk factors studied highlight a sense of urgency in improving site management and heritage preservation practices to address some of the most pressing threats to California’s cultural heritage, such as wildfires and earthquakes. Our results show that multi-temporal remote sensing, datafication, and Web-GL data visualization effectively document the results of said catastrophic events. Additionally, they can also become tools to proactively produce new knowledge and best-practice methodologies for site monitoring as well as for advanced planning, conservation interventions, and reconstruction efforts.
At the site level, our approach is significant because it allows comparing the results of multi-temporal aerial surveys performed with small UAVs or SLAM scanners. These techniques make it easier and faster to produce updated cartography of a site at risk or create GIS-based visualizations. The latter can enhance understanding of imminent or recurring threats that may not be visible during foot surveys. They can also reveal details that can be easily missed due to the large scale of the area to monitor (i.e., the Standard Stamp Mill complex) or because access to the area is restricted due to environmental threats and physical hazards (i.e., the Roseklip Mill complex). Additionally, our Potree visualizations can be easily shared with stakeholders and the general public to increase awareness of the site’s conservation issues.
At the building level, our multitemporal 3D documentation and datafication are relevant because they produce highly accurate site snapshots and enable integrating orthophotos of elevations and damage maps with surface change information applied to natively digital data [102]. In the discussed Dechambeau Hotel and IOOF Hall example, the M3C2 analysis of multi-temporal point clouds provides a deeper and more comprehensive understanding of visible and “invisible” damages and structural irregularities, such as cracks and lateral displacements, caused by seismological activity near the site.
The broader impact of the results we obtained at Bodie is related to the worldwide applicability of our methods at cultural heritage sites presenting similar environmental characteristics, wildfire and seismic risk. The dramatic consequences of earthquakes and wildfire in the Middle East, Eastern Mediterranean, and Southern Europe, such as the powerful earthquake that struck southeastern Iran in 2003, destroying much of the ancient city of Bam, or the multiple seismological events that severely damaged important cultural sites in Italy in 2009–2012 (i.e., Abruzzo and Emilia Romagna regions), or the more recent fatal effect of the 2021 fire season in Greece (i.e., the island of Evia) and Western Turkey (i.e., the resort town of Bodrum), clearly show the need and urgency in adopting our tested methodology outside California.

5. Conclusions

Based on our experience working at sites in California, Turkey, and Mexico, we have come to the harsh realization that many cultural heritage resources are at risk of loss due to natural or anthropogenic conditions that are not easily mitigated. While we know that it is more cost-effective and efficient to address structural or environmental issues when they are small, the scale of deferred maintenance is often overwhelming and difficult to manage, especially with little to no data to base decisions. The methodology presented in this article can provide a means to collect and process 3D and geospatial data in a way that delivers comprehensive information to resource managers so they can quickly identify changing conditions and apply appropriate treatments. Our approach produced 3D models, natively digital data, and derivative data that highlight potential issues on a multitude of scales. Once collected and properly curated, these datasets can be used at any time to develop resource management plans that would summarize current conditions, address potential threats, prioritize maintenance needs, and develop a monitoring and treatment schedule. The need to document and characterize significant heritage sites is urgent and we encourage managers to begin the process of digitally documenting resources using the proposed remote sensing and data analysis and visualization techniques. The global climate crisis has elevated preservation issues and the time to begin collecting baseline data is now, especially those that are located in high fire and earthquake-prone zones.

Author Contributions

Conceptualization, N.L. and D.J.; methodology, N.L., S.M., A.C., and G.J.D.; validation, D.J. and A.B.N.; formal analysis, N.L., A.C., A.G., and G.J.D.; data curation, N.L., S.M., and A.C.; writing—original draft preparation, all authors; writing—review and editing, N.L.; visualization, S.M., A.G., and A.C.; funding acquisition, N.L. All authors have read and agreed to the published version of the manuscript.

Funding

This research was funded by the California Department of Parks and Recreation via Work Order #13-203732-00 and supplement Work Order #13-203732-00R3, by the Resources Legacy Fund, California State Parks Initiative (RLF Grant #2013-0387), and by the University of California Office of the President via a CITRIS Seed Grant 2016. The APC was funded by the University of California, Merced. Arianna Campiani’s research was funded by the European Union’s Horizon 2020 research and innovation program under the Marie Skłodowska-Curie grant agreement No 839602.

Data Availability Statement

All data were archived in an online digital collection hosted on the University of California San Diego Digital Collections platform [https://doi.org/10.6075/J0WH2Q4X, accessed on 14 October 2021], allowing open access and free download of raw and derivative data to ensure replicability of our results [44]. Our instance of the Potree Viewer [https://doi.org/10.34946/D6V88B, accessed on 14 October 2021], including visualizations of a subsample of our data, is also available on the UC San Diego Potree server [100].

Acknowledgments

We thank California State Parks Sierra District staff Josh Heitzmann and Catherine Jones for facilitating data capture at Bodie and provide field resources. We are particularly grateful to CSP Surveyor David Gutierrez for providing accurate control data and feedback in the field and UC San Diego Library staff Ho Jung Yoo, Abigail Pennington, and David Minor for helping curate and publish the data. We thank UC Merced students Manuel Dueñas García, Jad Aboulhosn, Andreas Anderson, John Flynn, Estrella Garcia, and Christopher Reps for contributing to processing and analyzing collected data. We are immensely grateful to CSP Cultural Resources Division Chief Leslie Hartzell, CSP Architectural Designer Elizabeth Prather, State Historian Kathleen Kennedy, and Paul Veisze for inspiring and guiding our research. The authors, UC Merced students, and collaborators were officially authorized to utilize remote sensing and digital preservation techniques at Bodie and process derivative data by the California Department of Parks and Recreation via Interagency Agreement #C16E0013.

Conflicts of Interest

The authors declare no conflict of interest.

References

  1. Hulley, G.C.; Dousset, B.; Kahn, B.H. Rising Trends in Heatwave Metrics Across Southern California. Earth’s Future 2020, 8, e2020EF001480. [Google Scholar] [CrossRef]
  2. Reyes-Velarde, A.; Pinho, F.E. Blistering Heat Wave Sets Record Temperatures across California. Los Angeles Times. 2021. Available online: https://www.latimes.com/california/story/2021-07-11/record-breaking-temperatures-set-as-heat-wave-continues-across-california (accessed on 14 October 2021).
  3. Dong, C.; MacDonald, G.M.; Willis, K.; Gillespie, T.W.; Okin, G.S.; Williams, A.P. Vegetation Responses to 2012–2016 Drought in Northern and Southern California. Geophys. Res. Lett. 2019, 46, 3810–3821. [Google Scholar] [CrossRef]
  4. Wang, S.-Y.; Yoon, J.; Gillies, R.R.; Hsu, H.-H. The California Drought. In Climate Extremes; American Geophysical Union (AGU): Washington, DC, USA, 2017; pp. 223–235. ISBN 978-1-119-06802-0. [Google Scholar]
  5. Ullrich, P.A.; Xu, Z.; Rhoades, A.M.; Dettinger, M.D.; Mount, J.F.; Jones, A.D.; Vahmani, P. California’s Drought of the Future: A Midcentury Recreation of the Exceptional Conditions of 2012–2017. Earth’s Future 2018, 6, 1568–1587. [Google Scholar] [CrossRef] [Green Version]
  6. Williams, A.P.; Cook, E.R.; Smerdon, J.E.; Cook, B.I.; Abatzoglou, J.T.; Bolles, K.; Baek, S.H.; Badger, A.M.; Livneh, B. Large Contribution from Anthropogenic Warming to an Emerging North American Megadrought. Science 2020, 368, 314–318. [Google Scholar] [CrossRef] [PubMed]
  7. Halofsky, J.E.; Peterson, D.L.; Harvey, B.J. Changing Wildfire, Changing Forests: The Effects of Climate Change on Fire Regimes and Vegetation in the Pacific Northwest, USA. Fire Ecol. 2020, 16, 4. [Google Scholar] [CrossRef] [Green Version]
  8. Cardil, A.; Rodrigues, M.; Ramirez, J.; de-Miguel, S.; Silva, C.A.; Mariani, M.; Ascoli, D. Coupled Effects of Climate Teleconnections on Drought, Santa Ana Winds and Wildfires in Southern California. Sci. Total Environ. 2021, 765, 142788. [Google Scholar] [CrossRef] [PubMed]
  9. CalFire CZU Lightning Complex. Available online: https://www.fire.ca.gov/incidents/2020/8/16/czu-lightning-complex-including-warnella-fire/ (accessed on 3 August 2021).
  10. Cultural Resources Division Big Basin Redwoods Historical Resources Survey: CZU Post-Fire Documentation Report; California State Parks: Sacramento, CA, USA, 2021; p. 395.
  11. Scalingi, P.L. Creating Wildfire-Resilient Communities. In The Palgrave Handbook of Climate Resilient Societies; Springer International Publishing: Cham, Germany, 2020; pp. 1–28. ISBN 978-3-030-32811-5. [Google Scholar]
  12. Smith, K.; Mossburg, C. CNN California’s Oldest State Park Has Been Extensively Damaged by Wildfires. CNN. 2020. Available online: https://www.cnn.com/2020/08/21/us/ca-oldest-state-park-damaged-wildfires-trnd/index.html (accessed on 14 October 2021).
  13. KQED News Staff and Wires Some Good News: Many of Big Basin’s Ancient Redwoods Appear to Have Survived. KQED. 2020. Available online: ttps://www.kqed.org/news/11835124/some-good-news-many-of-big-basins-ancient-redwoods-appear-to-have-survived (accessed on 10 October 2021).
  14. California Department of Parks and Recreation Reimagining Big Basin. Available online: https://www.parks.ca.gov/ (accessed on 19 July 2021).
  15. Robichaud, P.R.; Ashmun, L.E.; Robichaud, P.R.; Ashmun, L.E. Tools to Aid Post-Wildfire Assessment and Erosion-Mitigation Treatment Decisions. Int. J. Wildland Fire 2012, 22, 95–105. [Google Scholar] [CrossRef] [Green Version]
  16. Toppozada, T.; Branum, D. California Earthquake History. Ann. Geophys. 2004, 2–3, 47. [Google Scholar]
  17. Ryall, A. Earthquake Hazard in the Nevada Region. Bull. Seismol. Soc. Am. 1977, 67, 517–532. [Google Scholar] [CrossRef]
  18. Wallace, R.E. Patterns and Timing of Late Quaternary Faulting in the Great Basin Province and Relation to Some Regional Tectonic Features. J. Geophys. Res. Solid Earth 1984, 89, 5763–5769. [Google Scholar] [CrossRef]
  19. Petersen, M.D.; Cao, T.; Campbell, K.W.; Frankel, A.D. Time-Independent and Time-Dependent Seismic Hazard Assessment for the State of California: Uniform California Earthquake Rupture Forecast Model 1.0. Seismol. Res. Lett. 2007, 78, 99–109. [Google Scholar] [CrossRef] [Green Version]
  20. Macalister, F. Preparing for the Future: Mitigating Disasters and Building Resilience in the Cultural Heritage Sector. J. Inst. Conserv. 2015, 38, 115–129. [Google Scholar] [CrossRef]
  21. O’Brien, G.; O’Keefe, P.; Jayawickrama, J.; Jigyasu, R. Developing a Model for Building Resilience to Climate Risks for Cultural Heritage. J. Cult. Herit. Manag. Sustain. Dev. 2015, 5, 99–114. [Google Scholar] [CrossRef]
  22. Lercari, N.; Shulze, J.; Wendrich, W.; Porter, B.; Burton, M.; Levy, T.E. 3-D Digital Preservation of at-Risk Global Cultural Heritage. In Proceedings of the 14th EUROGRAPHICS Workshop on Graphics and Cultural Heritage (GCH) 2016, Genova, Italy, 5–7 October 2016; Eurographics Association: Genova, Italy. [Google Scholar]
  23. Lercari, N.; Jaffke, D. Implementing Participatory Site Stewardship through Citizen Science and Mobile Apps: The Case of Bodie, California. Adv. Archaeol. Pract. 2020, 8, 337–350. [Google Scholar] [CrossRef]
  24. Chmutina, K.; Jigyasu, R.; Okubo, T. Editorial for the Special Issue on “Securing Future of Heritage by Reducing Risks and Building Resilience”. Disaster Prev. Manag. Int. J. 2020, 29, 1–9. [Google Scholar] [CrossRef]
  25. Richards-Rissetto, H.; Landau, K. Digitally-Mediated Practices of Geospatial Archaeological Data: Transformation, Integration, & Interpretation. J. Comput. Appl. Archaeol. 2019, 2, 120–135. [Google Scholar] [CrossRef]
  26. Opitz, R.S.; Cowley, D.C. Interpreting archaeological topography: Lasers, 3D data, observation, visualisation and applications. In nterpreting Archaeological Topography: 3D Data, Visualisation and Observation; Opitz, R.S., Cowley, D.C., Eds.; Oxbow Books: Barnsley, UK, 2012; ISBN 978-1-84217-516-3. [Google Scholar]
  27. Fassi, F.; Fregonese, L.; Ackermann, S.; De Troia, V. Comparison Between Laser Scanning and Automated 3d Modelling Techniques to Reconstruct Complex and Extensive Cultural Heritage Areas. ISPRS Int. Arch. Photogramm. Remote Sens. Spat. Inf. Sci. 2013, XL—5/W1, 73–80. [Google Scholar] [CrossRef] [Green Version]
  28. Xu, Z.; Wu, L.; Shen, Y.; Li, F.; Wang, Q.; Wang, R. Tridimensional Reconstruction Applied to Cultural Heritage with the Use of Camera-Equipped UAV and Terrestrial Laser Scanner. Remote Sens. 2014, 6, 10413–10434. [Google Scholar] [CrossRef] [Green Version]
  29. Di Filippo, A.; Sánchez-Aparicio, L.J.; Barba, S.; Martín-Jiménez, J.A.; Mora, R.; González Aguilera, D. Use of a Wearable Mobile Laser System in Seamless Indoor 3D Mapping of a Complex Historical Site. Remote Sens. 2018, 10, 1897. [Google Scholar] [CrossRef] [Green Version]
  30. Cucchiaro, S.; Fallu, D.J.; Zhang, H.; Walsh, K.; Van Oost, K.; Brown, A.G.; Tarolli, P. Multiplatform-SfM and TLS Data Fusion for Monitoring Agricultural Terraces in Complex Topographic and Landcover Conditions. Remote Sens. 2020, 12, 1946. [Google Scholar] [CrossRef]
  31. Forlin, P.; Valente, R.; Kázmér, M. Assessing Earthquake Effects on Archaeological Sites Using Photogrammetry and 3D Model Analysis. Digit. Appl. Archaeol. Cult. Herit. 2018, 9, e00073. [Google Scholar] [CrossRef] [Green Version]
  32. Antón, D.; Pineda, P.; Medjdoub, B.; Iranzo, A. As-Built 3D Heritage City Modelling to Support Numerical Structural Analysis: Application to the Assessment of an Archaeological Remain. Remote Sens. 2019, 11, 1276. [Google Scholar] [CrossRef] [Green Version]
  33. Caponero, M.A.; Mongelli, M.; Imbimbo, M.; Modoni, G.; Polito, E.; Grande, E. Structural Monitoring of the Ninfeo Ponari by Fibre Optic Sensors, Photogrammetry and Laser Scanning. AeC 2020, 31, 223–232. [Google Scholar] [CrossRef]
  34. Ditaranto, I. Aerotopografia e fotogrammetria finalizzata per la carta archeologica di Aeclanum. In Archeologia Aerea; Ceraudo, G., Ed.; Claudio Grenzi Editore: Foggia, Italy, 2013; Volume 7, pp. 53–64. [Google Scholar]
  35. Stek, T.D. Drones over Mediterranean Landscapes. The Potential of Small UAV’s (Drones) for Site Detection and Heritage Management in Archaeological Survey Projects: A Case Study from Le Pianelle in the Tappino Valley, Molise (Italy). J. Cult. Herit. 2016, 22, 1066–1071. [Google Scholar] [CrossRef]
  36. Castillo, L.J.; Serván, F.; Patroni, K. Documenting Archaeological Sites on Mountains and Slopes with Drones. Adv. Archaeol. Pract. 2019, 7, 337–352. [Google Scholar] [CrossRef] [Green Version]
  37. Hill, A.C. Economical Drone Mapping for Archaeology: Comparisons of Efficiency and Accuracy. J. Archaeol. Sci.-Rep. 2019, 24, 80–91. [Google Scholar] [CrossRef]
  38. Gilento, P. Fotogrammetria, Nuvole Di Punti e Rischio Sismico. Applicazioni e Riflessioni Su Una Metodologia Di Rilievo. Archeol. E Calc. 2012, 23, 297–309. [Google Scholar]
  39. Mill, T.; Alt, A.; Liias, R. Combined 3D Building Surveying Techniques—Terrestrial Laser Scanning (TLS) and Total Station Surveying for BIM Data Management Purposes. J. Civ. Eng. Manag. 2013, 19, S23–S32. [Google Scholar] [CrossRef]
  40. Solla, M.; Gonçalves, L.M.S.; Gonçalves, G.; Francisco, C.; Puente, I.; Providência, P.; Gaspar, F.; Rodrigues, H. A Building Information Modeling Approach to Integrate Geomatic Data for the Documentation and Preservation of Cultural Heritage. Remote Sens. 2020, 12, 4028. [Google Scholar] [CrossRef]
  41. Andriasyan, M.; Moyano, J.; Nieto-Julián, J.E.; Antón, D. From Point Cloud Data to Building Information Modelling: An Automatic Parametric Workflow for Heritage. Remote Sens. 2020, 12, 1094. [Google Scholar] [CrossRef] [Green Version]
  42. Lercari, N.; Jaffke, D. Bodie 3D Project: Best Practices for Heritage Digital Documentation at Bodie SHP. In Proceedings of the Society for California Archaeology Annual Meeting 2017, Fish Camp, CA, USA, 9–12 March 2017; Society for California Archaeology (SCA): Fish Camp, CA, USA. [Google Scholar]
  43. California State Parks Transformation Action Plan; California Department of Parks and Recreation: Sacramento, CA, USA, 2015.
  44. Lercari, N.; Jaffke, D.; McAvoy, S.; Campiani, A.; Jiménez Delgado, G. Data from: Building Cultural Heritage Resilience through Remote Sensing: An Integrated Approach Using Multi—Temporal Site Monitoring, Datafication, and Web—GL Visualization. Remote Sens 2021, 13, 4130. [Google Scholar] [CrossRef]
  45. Felton, D.L.; Lortie, F.; Davis, K.; Lewis, L. The Cultural Resources of Bodie State Historic Park; California Department of Parks and Recreation: Sacramento, CA, USA, 1977. [Google Scholar]
  46. DPR. Appraisal Survey of Bodie Property Prior to Acquisition; California Department of Parks and Recreation: Sacramento, CA, USA, 1960. [Google Scholar]
  47. Piatt, M.H. Bodie: “The Mines Are Looking Well...”: The History of the Bodie Mining District, Mono County, California; North Bay Books: El Sobrante, CA, USA, 2003; ISBN 978-0-9725200-5-8. [Google Scholar]
  48. Jackson-Retondo, E.; Kennedy, K.; Jaffke, D. Bodie Historic District National Historic Landmark Nomination (Update). Draft Form Prepared for National Park Service; U.S. Department of the Interior: Washington, DC, USA, 2016. [Google Scholar]
  49. Schulz, P.; Morrison, A.S. Architecture as Material Culture: A Survey of Residential and Commercial Structures in a Western Ghost Town. In Proceedings of the Society for California Archaeology Annual Meeting 2000, Sacramento, CA, USA, 23–25 April 1999; Society for California Archaeology: Sacramento, CA, USA, 2000; Volume 13, pp. 103–111. [Google Scholar]
  50. Morrison, A.S. Structural Failures of Single Wall Construction in a Western Mining Town: Bodie, California. Master’s Thesis, University of Pennsylvania, Philadelphia, PA, USA, 1998. [Google Scholar]
  51. Calloway, R.A.; Albright, R.G.; Felton, D.L.; West, J.; Pierce, K. Bodie State Historic Park: Resource Management Plan, General Development Plan and Environmental Impact Report; California Department of Parks and Recreation: Sacramento, CA, USA, 1979. [Google Scholar]
  52. DeLyser, D. Authenticity on the Ground: Engaging the Past in a California Ghost Town. Ann. Assoc. Am. Geogr. 1999, 89, 602–632. [Google Scholar] [CrossRef]
  53. Kauffman, E. Climate and Topography. In Atlas of the Biodiversity of California; California Department of Fish and Game: Sacramento, CA, USA, 2003; pp. 12–15. ISBN 978-0-9722291-0-4. [Google Scholar]
  54. Cain, E.M.C. The Story of Bodie; Fearon Publishers in cooperation with Mother Lode Press: San Francisco and Sonora, CA, USA, 1956. [Google Scholar]
  55. Jimenez, C.L. Bodie, California: Understanding the Architecture and Built Environment of a Gold Mining Town. Ph.D. Thesis, University of Oregon, Eugene, OR, USA, 2000. [Google Scholar]
  56. Curtis Riganti California|U.S. Drought Monitor. Available online: https://droughtmonitor.unl.edu/CurrentMap/StateDroughtMonitor.aspx?CA (accessed on 20 August 2021).
  57. Dillingham, E.; Kaiser, R.; Lowden, J.; Stever, E. Spring Peak Wildfire. Memo Prepared for U.S. Forest Service District Manager; U.S. Forest Service: Bridgeport, CT, USA, 2013. [Google Scholar]
  58. Forest Management Task Force California’s Wildfire and Forest Resilience Action Plan. Report Prepared for State of California, Calfornia Natural Resources Agency, California Environmental Protection Agency, and Department of Forestry and Fire Protection; California Department of Water Resources: Sacramento, CA, USA, 2021. [Google Scholar]
  59. Working Group on California Earthquake Probabilities The Third California Earthquake Rupture Forecast (UCERF3). Available online: http://wgcep.org/UCERF3.html (accessed on 21 July 2021).
  60. Aguilar, A. The Seismic Rehabilitation of Historic Buildings, Preservation Brief, 41st ed.; National Park Service: Washington, DC, USA, 2016; ISBN 978-0-16-093252-6. [Google Scholar]
  61. USGS National Earthquake Information Center, PDE; California Integrated Seismic Network; Nevada Seismological Laboratory M 5.6 Earthquake—28 Km WSW of Hawthorne, Nevada. Available online: https://earthquake.usgs.gov/earthquakes/eventpage/nn00570710/executive (accessed on 22 August 2021).
  62. Boardman, C.; Bryan, P. 3D Laser Scanning for Heritage: Advice and Guidance to Users on Laser Scanning in Archaeology and Architecture, Guidance, 3rd ed.; Historic England Publishing: Swindon, UK, 2018. [Google Scholar]
  63. Lercari, N. Monitoring Earthen Archaeological Heritage Using Multi-Temporal Terrestrial Laser Scanning and Surface Change Detection. J. Cult. Herit. 2019, 39C, 152–165. [Google Scholar] [CrossRef] [Green Version]
  64. Cole, D.M.; Newman, P.M. Using Laser Range Data for 3D SLAM in Outdoor Environments. In Proceedings of the 2006 IEEE International Conference on Robotics and Automation, Orlando, FL, USA, 15–19 May 2006; pp. 1556–1563. [Google Scholar]
  65. Choi, J. Hybrid Map-Based SLAM Using a Velodyne Laser Scanner. In Proceedings of the 17th International IEEE Conference on Intelligent Transportation Systems (ITSC), Qingdao, China, 8–11 October 2014; pp. 3082–3087. [Google Scholar]
  66. Zlot, R.; Bosse, M. Efficient Large-Scale 3D Mobile Mapping and Surface Reconstruction of an Underground Mine. In Field and Service Robotics: Results of the 8th International Conference; Springer Tracts in Advanced Robotics; Yoshida, K., Tadokoro, S., Eds.; Springer: Berlin/Heidelberg, Germany, 2014; pp. 479–493. ISBN 978-3-642-40686-7. [Google Scholar]
  67. Remondino, F.; El-Hakim, S. Image-Based 3D Modelling: A Review. Photogramm. Rec. 2006, 21, 269–291. [Google Scholar] [CrossRef]
  68. Szeliski, R. Computer Vision: Algorithms and Applications; Springer Science & Business Media: Berlin/Heidelberg, Germany, 2010; ISBN 978-1-84882-935-0. [Google Scholar]
  69. Quan, L. Image-Based Modeling; Springer Science & Business Media: Berlin/Heidelberg, Germany, 2010; ISBN 978-1-4419-6679-7. [Google Scholar]
  70. Andrews, D.; Bedford, J.; Blake, B.; Bryan, P.; Cromwell, T.; Lea, R. Measured and Drawn: Techniques and Practice for the Metric Survey of Historic Buildings, 2nd ed.; English Heritage: Swindon, UK, 2009; ISBN 978-1-84802-047-4. [Google Scholar]
  71. Campiani, A.; Lingle, A.; Lercari, N. Spatial Analysis and Heritage Conservation: Leveraging 3-D Data and GIS for Monitoring Earthen Architecture. J. Cult. Herit. 2019, 39C, 166–176. [Google Scholar] [CrossRef] [Green Version]
  72. Campiani, A.; Liendo Stuardo, R.; Lercari, N. The Mausoleum Architectural Project: Reinterpreting Palenque’s Temple of The Inscriptions through 3d Data-Driven Architectural Analysis. Anc. Mesoam. 2021, 1–16. [Google Scholar] [CrossRef]
  73. Olsen, M.J.; Kuester, F.; Chang, B.J.; Hutchinson, T.C. Terrestrial Laser Scanning-Based Structural Damage Assessment. J. Comput. Civ. Eng. 2009, 24, 264–272. [Google Scholar] [CrossRef]
  74. Olsen, M.J.; Chen, Z.; Hutchinson, T.; Kuester, F. Optical Techniques for Multiscale Damage Assessment. Geomat. Nat. Hazards Risk 2013, 4, 49–70. [Google Scholar] [CrossRef] [Green Version]
  75. Olsen, M.J. In Situ Change Analysis and Monitoring through Terrestrial Laser Scanning. J. Comput. Civ. Eng. 2015, 29, 04014040. [Google Scholar] [CrossRef]
  76. Campiani, A.; Lingle, A.M.; Lercari, N. Diversified Approach to Earthen Architecture Conservation: Implementing Digital Monitoring and Spatial Analysis at Çatalhöyük. In Preserving Cultural Heritage in the Digital Age: Sending Out an S.O.S.; Lercari, N., Willeke, W., Porter, B.W., Burton, M.M., Levy, T.E., Eds.; New Directions in Anthropological Archaeology; Equinox Publishing: Sheffield, UK, 2021; ISBN 978-1-80050-126-3. [Google Scholar]
  77. Richards-Rissetto, H. What Can GIS + 3D Mean for Landscape Archaeology? J. Archaeol. Sci. 2017, 84, 10–21. [Google Scholar] [CrossRef] [Green Version]
  78. U.S. Forest Service Data Access | Rapid Assessment of Vegetation Condition after Wildfire (RAVG). Available online: https://fsapps.nwcg.gov/ravg/data-access (accessed on 23 August 2021).
  79. Hesse, R. Extraction of Archaeological Features from High-Resolution LIDAR Data. In Proceedings of the 14th International Congress “Cultural Heritage and New Technologies”, Vienna, Austria, 16–18 November 2009; Stadtarchäologie Wien: Vienna, Austria, 2010; pp. 636–642. [Google Scholar]
  80. Štular, B.; Kokalj, Ž.; Oštir, K.; Nuninger, L. Visualization of Lidar-Derived Relief Models for Detection of Archaeological Features. J. Archaeol. Sci. 2012, 39, 3354–3360. [Google Scholar] [CrossRef]
  81. Kokalj, Ž.; Zakšek, K.; Krištof, O. Visualizations of lidar derived relief models. In Interpreting Archaeological Topography: Airborne Laser Scanning, 3D Data and Ground Observation; Opitz, R.S., Cowley, D., Eds.; Occasional publication of the Aerial Archaeology Research Group; Oxbow Books: Oxford, UK; Oakville, CT, USA, 2013; pp. 100–114. ISBN 978-1-84217-516-3. [Google Scholar]
  82. Hesse, R. Using LIDAR-derived Local Relief Models (LRM) as a new tool for archaeological prospection. In Landscape Archaeology between Art and Science; Kluiving, S.J., Guttmann-Bond, E., Eds.; Amsterdam University Press: Amsterdam, The Netherlands, 2012; pp. 369–378. ISBN 978-90-485-1607-0. [Google Scholar]
  83. Yokoyama, R.; Shirazawa, M.; Pike, R.J. Visualizing Topography by Openness: A New Application of Image Processing to Digital Elevation Models. Photogramm. Eng. Remote Sens. 2002, 68, 257–265. [Google Scholar]
  84. Chiba, T.; Kaneta, S.; Susuki, Y. Red Relief Image Map: New Visualization Method for Three Dimensional Data. Int. Arch. Photogramm. Remote Sens. Spat. Inf. Sci. 2008, 37, 1071–1076. [Google Scholar]
  85. Chiba, T.; Hasi, B. Ground Surface Visualization Using Red Relief Image Map for a Variety of Map Scales. Int. Arch. Photogramm. Remote Sens. Spat. Inf. Sci. 2016, XLI—B2, 393–397. [Google Scholar] [CrossRef] [Green Version]
  86. Secretary of the Interior’s Standards and Guidelines|HABS/HAER/HALS. Available online: https://www.nps.gov/hdp/standards/index.htm (accessed on 13 August 2021).
  87. Lavoie, C.; Lockett, D. Producing HABS/HAER/HALS Measured Drawings from Laser Scans: The Pros and Cons of Using Laser Scanning for Heritage Documentation. Available online: https://www.nps.gov/hdp/standards/laser.htm (accessed on 12 August 2021).
  88. Girardeau-Montaut, D. CloudCompare. 2019. Available online: http://www.cloudcompare.org (accessed on 14 October 2021).
  89. Lague, D. M3C2 (Plugin)—CloudCompareWiki. Available online: https://www.cloudcompare.org/doc/wiki/index.php?title=M3C2_ (accessed on 11 September 2018).
  90. Lague, D.; Brodu, N.; Leroux, J. Accurate 3D Comparison of Complex Topography with Terrestrial Laser Scanner: Application to the Rangitikei Canyon (N-Z). ISPRS J. Photogramm. Remote Sens. 2013, 82, 10–26. [Google Scholar] [CrossRef] [Green Version]
  91. Barnhart, T.B.; Crosby, B.T. Comparing Two Methods of Surface Change Detection on an Evolving Thermokarst Using High-Temporal-Frequency Terrestrial Laser Scanning, Selawik River, Alaska. Remote Sens. 2013, 5, 2813–2837. [Google Scholar] [CrossRef] [Green Version]
  92. Kleber, E.; Nissen, E.; Arrowsmith, J.R. Topographic Change Detection Using CloudCompare Version 1.0. 2013. Available online: https://cloud.sdsc.edu/v1/AUTH_opentopography/www/education/13SCEC_Cloud_compare_final.pdf (accessed on 14 October 2021).
  93. Schuetz, M. Potree: Rendering Large Point Clouds in Web Browsers. Master’s Thesis, Institute of Computer Graphics and Algorithms, Vienna University of Technology, Vienna, Austria, 2016. [Google Scholar]
  94. OpenTopography. Available online: https://opentopography.org (accessed on 22 August 2021).
  95. Isenburg, M. First Look with LAStools at LiDAR from Hovermap Drone by CSIRO. rapidlasso GmbH. 2018. Available online: https://rapidlasso.com/2018/04/16/first-look-with-lastools-at-lidar-from-hovermap-drone-by-csiro/ (accessed on 14 October 2021).
  96. Lercari, N. UC Merced HIVE Lab Heritage Digital Documentation: Guides to Good Practices; California Department of Parks and Recreation: Sacramento, CA, USA, 2017; p. 44. [Google Scholar]
  97. McAvoy, S.; Lercari, N.; Campiani, A.; Jiménez Delgado, G.; Jaffke, D. Bodie, California WebGL Viewer. 2021. Available online: https://pointcloud.ucsd.edu/HIVE/Bodie/Bodie_Cesium.html (accessed on 14 October 2021). [CrossRef]
  98. Boucheny, C.; Ribes, A. Eye-Dome Lighting: A Non-Photorealistic Shading Technique. Kitware Source Q. Mag. 2011, 17. [Google Scholar]
  99. Crosby, C.; Nandigam, V.; Baru, C.; Arrowsmith, J.R. Proccedings of the OpenTopography: Enabling Online Access to High-Resolution Lidar Topography Data and Processing Tools, Vienna, Austira, 7–12 April 2013; 2013.
  100. Search Results: “Bodie”—Prints & Photographs Online Catalog (Library of Congress). Available online: https://www.loc.gov/pictures/search/?q=Bodie&co=hh (accessed on 13 August 2021).
  101. Search Results: “Bodie” (California State Library). Available online: https://csl.primo.exlibrisgroup.com/discovery/search?query=any,contains,Bodie&tab=Everything&search_scope=MyInst_and_CI&vid=01CSL_INST:CSL&facet=tlevel,include,online_resources&facet=rtype,include,images&mode=Basic&offset=0 (accessed on 13 August 2021).
  102. Austin, A. Mobilizing Archaeologists: Increasing the Quantity and Quality of Data Collected in the Field with Mobile Technology. Adv. Archaeol. Pract. 2014, 2, 13–23. [Google Scholar] [CrossRef]
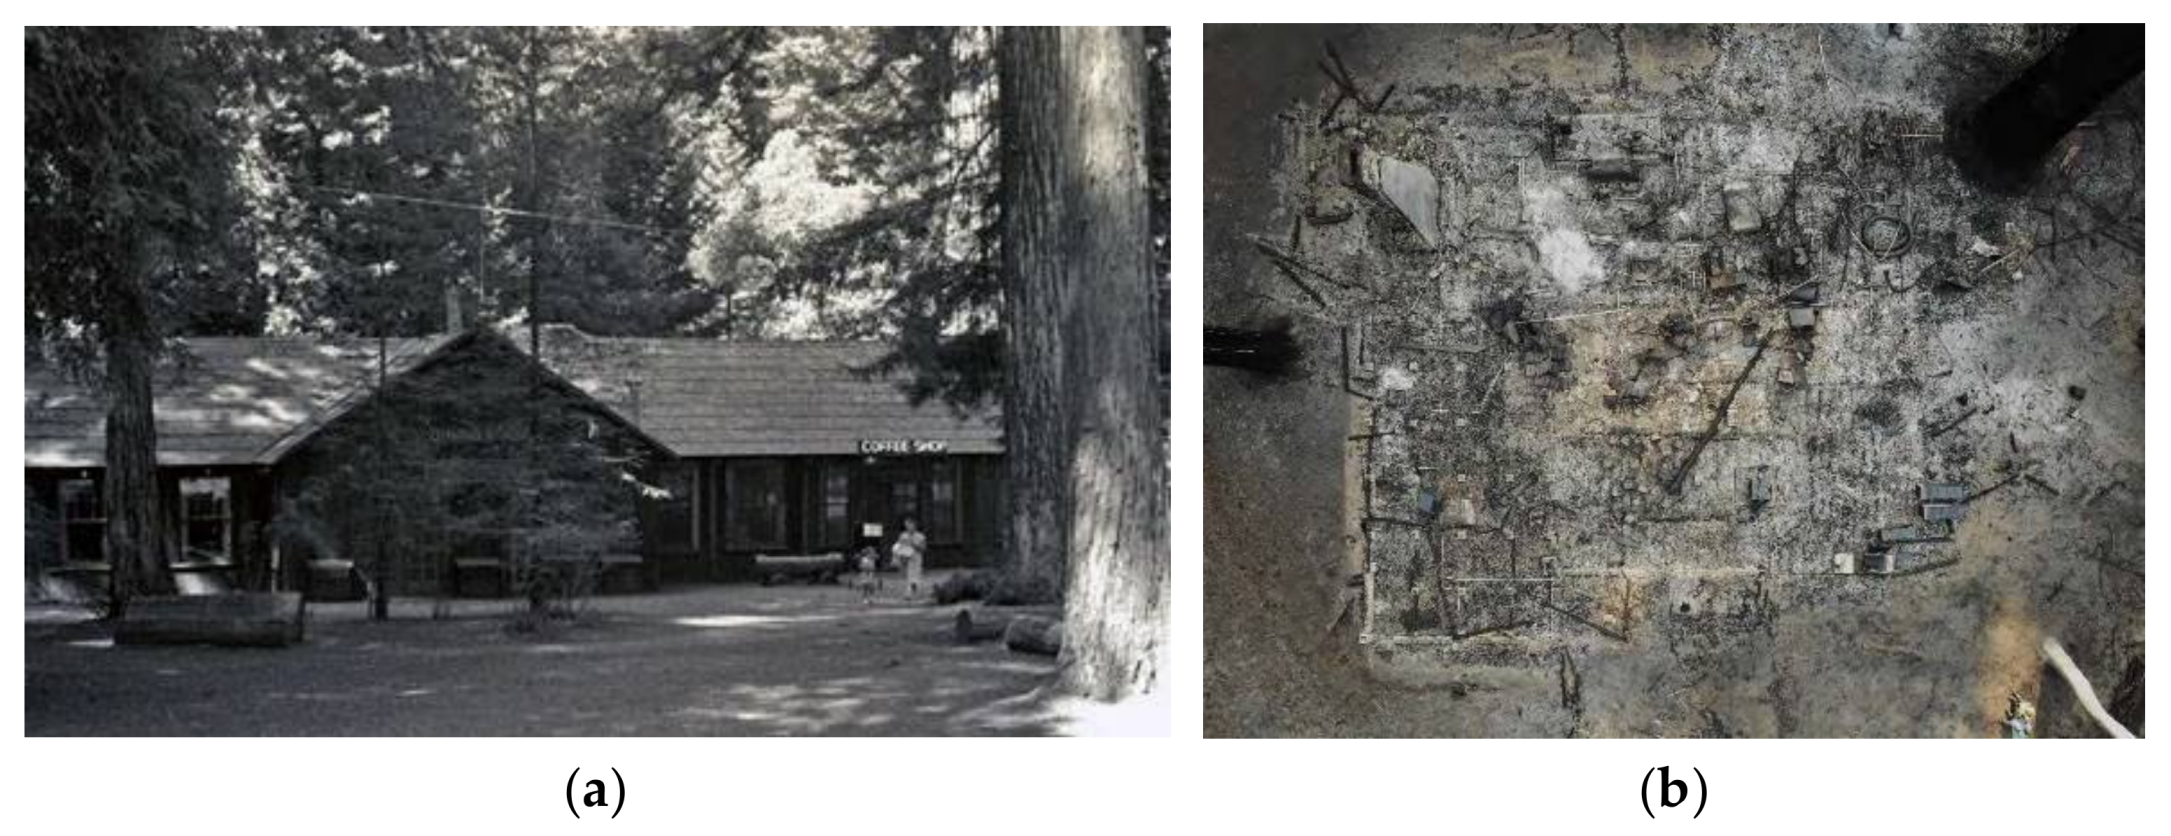
Figure 1. (a) The Old Lodge at Big Basin Redwoods State Park is seen in the 1950s; (b) aerial plan view image of the ruins of the Old Lodge after the 2020 CZU Fire. Photographs (a) by K. Parker and (b) by D. Jaffke. (a,b) Courtesy of California State Parks.
Remotesensing 13 04130 g001
Figure 2. Map showing Bodie’s location in the Western United States, nearby cities in California and Nevada, the Sierra Nevada mountain range, and the hydrographic Great Basin Region. Map by M. Dueñas Garcia.
Remotesensing 13 04130 g002
Figure 3. Examples of “arrested decay” at Bodie. (a) Swazey Hotel; (b) New Standard Hoist building. Photographs (a,b) by N. Lercari.
Remotesensing 13 04130 g003
Figure 4. Map showing the Spring Peak Fire’s perimeter (orange) and proximity to the Bodie State Historic Park’s boundaries (green). Generated from data made available by the U.S. Forest Service, California State Parks, and NASA JPL (2021). NASADEM Merged DEM Global 1 arc second V001. Distributed by OpenTopography. https://doi.org/10.5069/G93T9FD9 Accessed: 23 August 2021. Map by A. Campiani.
Remotesensing 13 04130 g004
Figure 5. (a) Plumes of smoke from the Spring Peak fire are seen in the landscape near Bodie; (b) a fire crew’s helicopter is seen filling up a bucket at a pond at Bodie. Photographs courtesy of California State Parks and U.S. Forest Service.
Remotesensing 13 04130 g005
Figure 6. Map showing Bodie’s proximity to several faults’ locations in California and their probability of being involved in seismic activities of magnitude ≥6.7 in the next 30 years. Generated from data made available by the Working Group on California Earthquake Probabilities and Google Earth Pro v.7.3.4.8248 (22 February 2014). Bodie, California. 38°12′45.41″N, 119°00′48.25″W, Eye alt 10,378 feet. Data LDEO-Columbia, NSF, NOAA, SIO, U.S. Navy, NGA, GEBCO. Image Landsat/Copernicus. Google 2021. http://www.earth.google.com [accessed on 22 July 2021]. Map by N. Lercari.
Remotesensing 13 04130 g006
Figure 7. Map showing the epicenter location and intensity contour lines of the 5.6 M earthquake that affected Bodie’s region in December 2016. Generated from data made available by USGS and Google Earth Pro v.7.3.4.8248 (22 February 2014). Epicenter 38°23′25.44″N, 118°53′49.92″W, Eye alt 74.25 miles. Data CISN:NCSS, Nevada Seismological Laboratory, USGS NEIC. Image Landsat/Copernicus. Google 2021. http://www.earth.google.com (accessed on 15 August 2021). Map by N. Lercari.
Remotesensing 13 04130 g007
Figure 8. GIS visualizations of the Bodie downtown captured by drone-based IBM in 2020. The figure compares our results obtained using the following techniques: (a) Hillshade; (b) Local Relief Model; (c) our custom Local Relief blending a Slope Map with Local Relief Model. Visualizations by G. Jiménez Delgado.
Remotesensing 13 04130 g008
Figure 9. View of the Dechambeau and IOOF Hall buildings’ 2016 point cloud visualized in our instance of the Potree Viewer showing elevation (point cloud color coding), measurements (red lines), and octrees (yellow cubes). Visualization by S. McAvoy.
Remotesensing 13 04130 g009
Figure 10. Map showing Bodie’s downtown, Chinatown, roads, and creeks. 3D documented buildings are seen in yellow. Generated from data made available by California State Parks and NASA JPL (2021). NASADEM Merged DEM Global 1 arc second V001. Distributed by OpenTopography. https://doi.org/10.5069/G93T9FD9 Accessed: 23 August 2021. Map by A. Campiani.
Remotesensing 13 04130 g010
Figure 11. Visualization of our classified 2020 SLAM data documenting the Standard Stamp Mill area in our instance of the Potree viewer. Point cloud classification performed via LASTools using the following classes: buildings = orange; vegetation = green; ground = brown. Visualization by G. Jiménez Delgado.
Remotesensing 13 04130 g011
Figure 12. View of the Bodie downtown point cloud in our instance of the Potree viewer, as it was captured in 2020 using drone-based IBM. The Dechambeau Hotel and IOOF Hall are seen along Main St. (bottom left). The Standard Stampmill complex is seen on the slope adjacent to the town (top right). Visualization by S. McAvoy.
Remotesensing 13 04130 g012
Figure 13. Visualization of the multitemporal Roseklip Mill area point clouds in our instance of Potree. (a) Shows our custom Local Relief colorization of the 2015 dataset; (b) shows our custom Local Relief colorization of the 2015 dataset. Colorization variation is due to the different resolutions of the source point clouds. Visualizations by S. McAvoy and G. Jiménez Delgado.
Remotesensing 13 04130 g013
Figure 14. On-scale visualization of (a) photograph of the Dechambeau Hotel and IOOF Hall’s East façades; (b) architectural drawing showing no visible damage caused by the 2016 Hawthorne earthquake; (c) M3C2 distance map visualizing the surface change in centimeter between 2016 pre-disturbance dataset and 2017 post-disturbance dataset; (d) M3C2 significant change map highlighting invisible damage patterns. (a) By A. Guillem; (b) by A. Campiani; (c,d) by A. Guillem and C. Reps.
Remotesensing 13 04130 g014
Figure 15. (a) Dechambeau Hotel and IOOF Hall roof significant change. Point size increased to “2” to decrease transparency in the structure. No other features have been modified; (b) Dechambeau Hotel and IOOF Hall south wall. M3C2 distance displayed in centimeters. (a,b) By A. Guillem and C. Reps.
Remotesensing 13 04130 g015
Figure 16. On-scale visualization of (a) photograph of the Dechambeau Hotel and IOOF Hall’s West façades; (b) damage map showing cracks and collapsed material (red) caused by the 2016 earthquake and the repair and consolidation work (yellow); (c) M3C2 distance map visualizing the surface change in centimeter between 2016 pre-disturbance dataset and 2017 post-disturbance dataset; (d) M3C2 significant change map highlighting visible and invisible damage patterns. (a) By N. Lercari; (b) by A. Campiani; (c,d) by A. Guillem and C. Reps.
Remotesensing 13 04130 g016
Publisher’s Note: MDPI stays neutral with regard to jurisdictional claims in published maps and institutional affiliations.