Article

Spatial Assessment of Community Resilience from 2012 Hurricane Sandy Using Nighttime Light

School of Geosciences, University of South Florida, Tampa, FL 33620, USA
*
Author to whom correspondence should be addressed.
Remote Sens. 2021, 13(20), 4128; https://doi.org/10.3390/rs13204128
Submission received: 14 August 2021 / Revised: 10 October 2021 / Accepted: 11 October 2021 / Published: 15 October 2021
(This article belongs to the Special Issue Human–Environment Interactions Research Using Remote Sensing)

Abstract

:
Quantitative assessment of community resilience is a challenge due to the lack of empirical data about human dynamics in disasters. To fill the data gap, this study explores the utility of nighttime lights (NTL) remote sensing images in assessing community recovery and resilience in natural disasters. Specifically, this study utilized the newly-released NASA moonlight-adjusted SNPP-VIIRS daily images to analyze spatiotemporal changes of NTL radiance in Hurricane Sandy (2012). Based on the conceptual framework of recovery trajectory, NTL disturbance and recovery during the hurricane were calculated at different spatial units and analyzed using spatial analysis tools. Regression analysis was applied to explore relations between the observed NTL changes and explanatory variables, such as wind speed, housing damage, land cover, and Twitter keywords. The result indicates potential factors of NTL changes and urban-rural disparities of disaster impacts and recovery. This study shows that NTL remote sensing images are a low-cost instrument to collect near-real-time, large-scale, and high-resolution human dynamics data in disasters, which provide a novel insight into community recovery and resilience. The uncovered spatial disparities of community recovery help improve disaster awareness and preparation of local communities and promote resilience against future disasters. The systematical documentation of the analysis workflow provides a reference for future research in the application of SNPP-VIIRS daily images.

Graphical Abstract

1. Introduction

Natural disasters continue to cause widespread and long-lasting economic, social, and environmental impacts during the past decades. Hurricanes, one of the devastating natural hazards in the United States, adversely interrupt businesses, impact transportation, and disrupt communities. Empirical evidence shows that communities may suffer from different consequences and recover at different rates during a disaster. Such differences can be attributed to community resilience, which is the critical ability of individuals and communities to cope with, adapt to, and recover from external stresses [1]. To reduce the adverse impacts of disasters, considerable efforts have been made to understand and measure community resilience. One of the challenges in this endeavor is the lack of empirical data to monitor different aspects of human activities in disasters [2]. Previous studies on community resilience mostly rely on qualitative data (e.g., surveys and interviews) [3,4,5] and resilience indices aggregated from socio-economic variables [6,7,8,9,10]. However, the qualitative data lack timeliness, are costly to acquire, and are inapplicable in large geographic areas [2,11]. The resilience index-based approaches were theory-driven and lack validation from empirical data [2,12]. Thus, there is a pressing need for large-scale, high-resolution data to detect human dynamics in disasters, from which to extract new indicators to measure community resilience.
With the development of remote sensing and earth observation techniques, various types of images of the earth’s surface are captured at different spatial and temporal resolutions. As a special type of remote sensing techniques, nighttime light (NTL) remote sensing captures artificial nocturnal lights generated from human activities, and thus are widely applied to estimate population distribution and movement [13,14], monitor economic activity [15,16], urban growth [17], marine transportation [18], and energy consumption [19]. A comprehensive review of applications of NTL data can be found in Levin et al. (2017) [20] and Zhao et al. (2018) [21]. In the field of disaster management, previous work has applied NTL to detect property damage [22,23,24], power outages [25,26,27], and estimate economic recovery [15,16]. For example, Román et al. (2019) and Wang et al. (2018) used NTL data to detect power outages in natural disasters [25,27]. Mohan & Strobl (2017) explored the use of NTL in identifying short-term economic impacts and recovery of tropical Cyclone Pam in South Pacific islands [16]. Compared with traditional remote sensing images captured in the daytime, NTL images are particularly useful for detecting declines in human activities, for instance, real estate bubbles [28] and evacuated cities [29] where physical land cover remains the same, but the intensity of human activities has decreased. In a disaster process, various community functions (e.g., population, economy, and infrastructure functionality) may decline due to the hazard impact and gradually recover as the impact dissipates. This unique feature makes NTL images a promising data source to fill the data gap in disaster resilience assessment.
Among all publicly available NTL products, images from the Defense Meteorological Satellite Program Operational Line-Scan System (DMSP-OLS) NTL data [30,31] and the Suomi National Polar-Orbiting Partnership Visible Infrared Imaging Radiometer Suite (SNPP-VIIRS) NTL data [30,32] are most widely used. As an older generation platform, DMSP-OLS provides daily raw images and annual composites from 1992 to 2013 captured by six different sensors. Due to the issues of radiance saturation in urban cores, coarse spatial resolution (30 arc seconds, around 1 km), and absence of on-board and inter-satellite calibration, the DMSP-OLS images are primarily used to analyze long-term socio-economic changes, and are incapable to monitor human dynamics at a fine spatiotemporal resolution. The NASA Black Marble product suite captured from the SNPP-VIIRS platform emerged in 2011 and has substantial improvements in spatial resolution (15 arc seconds, around 500 m), spectral resolution (400–900 nm), and providing onboard calibration [30]. Despite these improvements, the original VIIRS product (NASA product ID: VNP46A1) is still suffered from noises of lunar illumination, twilight, and clouds. In 2020 August, NASA released the VIIRS/NPP moonlight-adjusted daily images (NASA product ID: VNP46A2), which apply advanced algorithms to eliminate noises from moonlight and correct the Bidirectional Reflectance Distribution Function (BRDF). Due to these new features, the VIIRS daily images become a valuable data source to study human dynamics at a fine spatiotemporal resolution in natural disasters. Previous studies utilized the VIIRS daily images to detecting power outages [27,33], building and infrastructure damages [23,24]. Despite the potential of VIIRS images in disaster monitoring, its utility in assessing community recovery and resilience has not been systematically evaluated.
In this study, daily moonlight-adjusted VIIRS/NPP images (VNP46A2) were applied to monitor socio-economic impacts and community recovery during Hurricane Sandy (2012), which is one of the most destructive natural disasters in U.S. history. The article demonstrates the characteristics of the moonlight-adjusted VIIRS/NPP daily images and documents the entire analytical process from data preprocessing, spatial analysis and visualization, and statistical modeling. The utilities and limitations of the VIIRS/NPP daily images in disaster management and resilience assessment were discussed. Specifically, the spatiotemporal variations of NTL radiance were analyzed at multiple spatial scales (e.g., block groups, Core-Based Statistical Areas, etc.). Metrics derived from recovery trajectories, including disturbance and recovery rate, were calculated from the NTL time series and were analyzed over geographic space. Statistical analyses were conducted to examine the relations between the NTL data and explanatory data (e.g., land cover data, damage data, meteorological data, and Twitter data) in order to interpret the detected NTL variations. This study aims to test the utility of the NTL as an alternative data source to monitor human dynamics in natural disasters, which can provide novel insights and measurable indicators of community recovery and resilience. The results will provide practical guidance for the future use of daily NTL images in disaster management and resilience assessment.

2. Study Area and Data
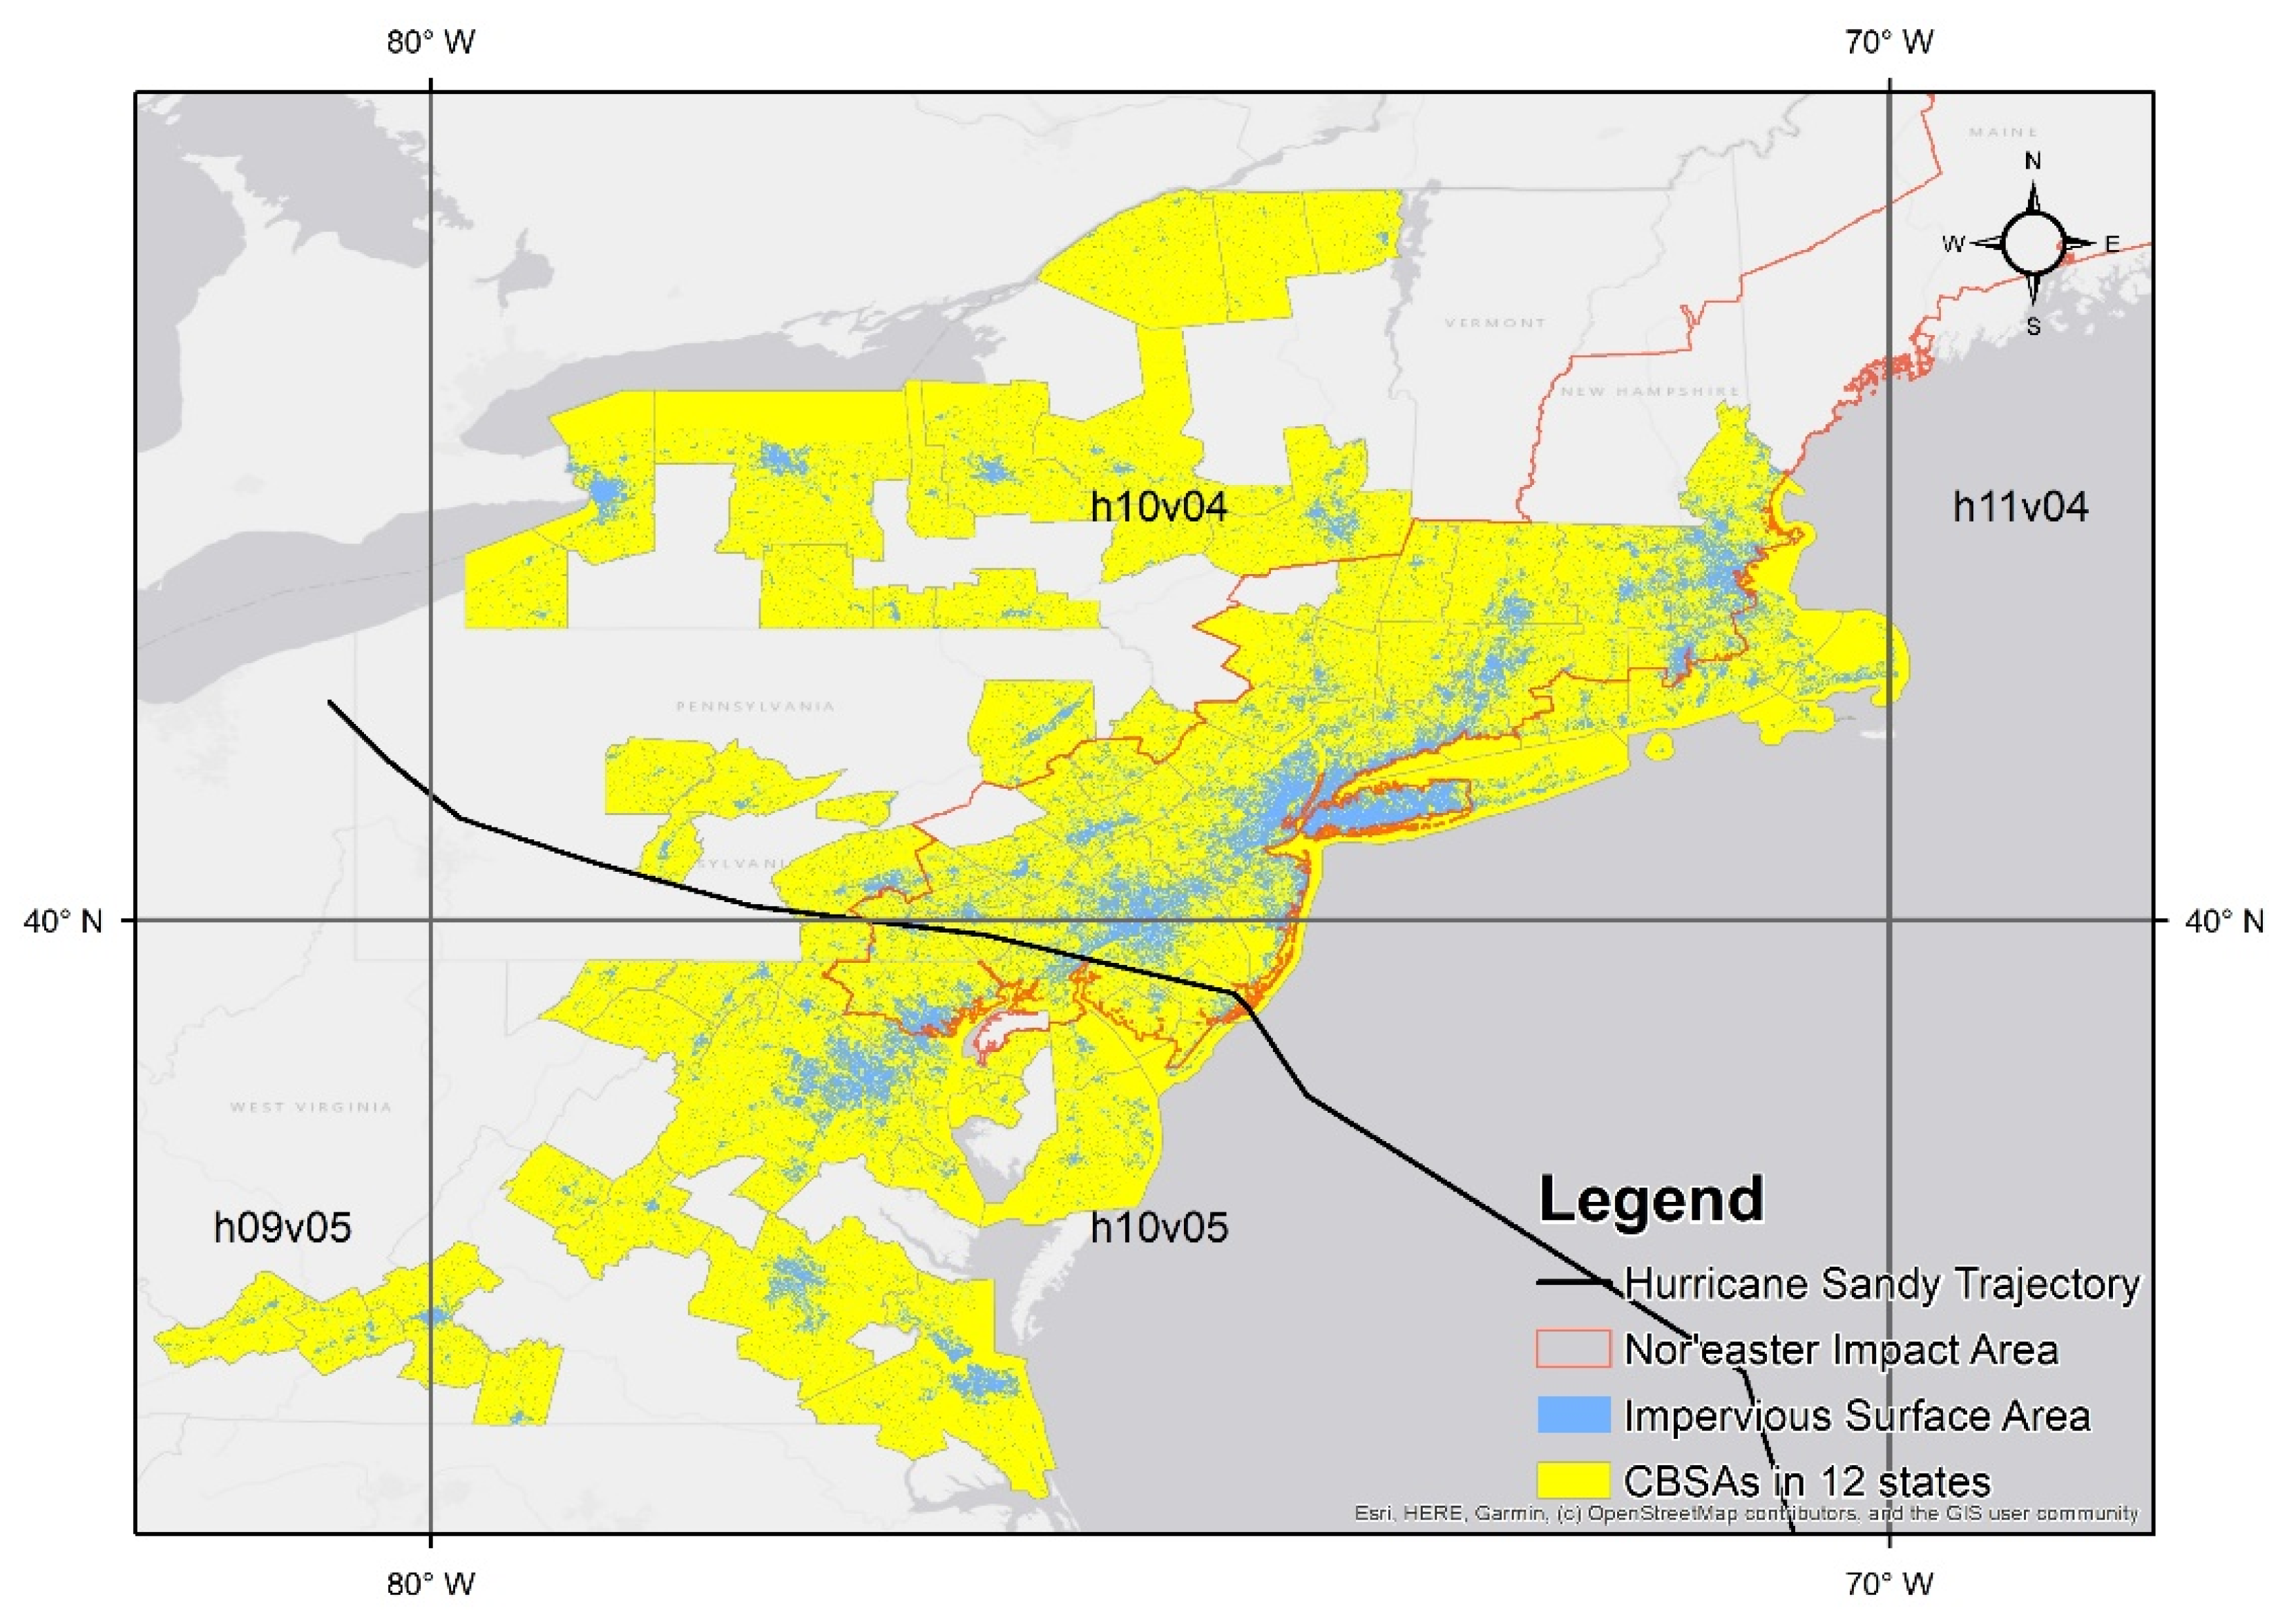
2.1. Study Area

Hurricane Sandy (2012), also called Superstorm Sandy, was formed in the western Caribbean Sea on 22 October, made its landfall near Atlantic City in New Jersey in the United States on 29 October, and finally dissipated on 2 November. Hurricane Sandy impacted the Northeastern United States with heavy rain and strong winds and later caused flash flooding and storm surge consequently. In total, 233 people were dead across eight countries from the Caribbean to Canada and over 650,000 homes were damaged in the US [34]. Moreover, Hurricane Sandy caused around 68.7 billion worth of damage, which heavily impacted the economy in the Northeastern US. According to the Hazus disaster damage model from the Federal Emergency Management Agency (FEMA), 12 states were heavily impacted by Hurricane Sandy, including New York, Connecticut, New Jersey, Delaware, District of Columbia, Maryland, Massachusetts, New Hampshire, Pennsylvania, Rhode Island, Virginia, and West Virginia [35]. To capture human dynamics in populated areas, 66 Core-Based Statistical Areas (CBSAs) within 12 states, including both metropolitan and micropolitan statistical areas, are selected as the study area (yellow areas in Figure 1) (CBSA data can be downloaded from the US Census [36]). According to 2010 American Community Survey (2012ACS 5-year estimates) and Bureau of Economic Analysis (BEA) data, the study area has a 19.7% of the US total population (60,876,820 out of 308,745,538) and contributes 28.7% of the Gross Domestic Product generated in the US in 2012 ($4,107,550,656,000 out of $14,332,171,020,000). Within these 66 CBSAs, 52.3 million people (86.0% of the total population) lived in coastal areas. The population in the study area consists of 69.0% White, 16.1% African American, and 6.2% Asian. The research area has 5 of the 25 largest urbanized areas in the US, including Washington D.C., Philadelphia, New York City, Boston, and Baltimore [37]. In summary, the study area is one of the most urbanized regions in the US and it is of utmost importance to analyze how a well-developed region responds and recovers from one of the costliest Atlantic hurricanes in US history. Four SNPP-VIIRS DNB tiles (h09v05, h10v04, h10v05, and h11v04) that fully cover the study area were utilized to analyze NTL radiance changes. The spatial analysis of NTL radiance has been conducted in pixels, block groups, and CBSAs to avoid the Modifiable Areal Unit Problem (MAUP).

2.2. NASA Black Marble Products

As the primary data source in this study, NASA Black Marble Product, also known as the VNP46 product suite, includes two types of images: (1) NPP/VIIRS At-sensor TOA Nighttime Radiance Daily L3 Global 500 m SIN Grid V001 (NASA product ID: VNP46A1) and (2) NPP/VIIRS Moonlight-adjusted Nighttime Lights Daily L3 Global 500 m SIN Grid V001 (NASA product ID: VNP46A2). VNP46A2 products are enhanced from VNP46A1 by screening moonlight and calibrating the BRDF. VNP46A1 products only contain fundamental layers, such as spectral bands, acquisition time, and original radiance collected from the sensor. Improved from VNP46A1, the VNP46A2 products include additional layers, such as BRDF-corrected radiance, BRDF-corrected gap-filled radiance, mandatory quality assurance (QA) flags, and snow flags, which inform the data quality and correction been conducted at each pixel. Images used in this study were downloaded from NASA’s Level 1 and Atmosphere Archive and Distribution System Distributed Active Archive Center (LAADS-DAAC) using the modified PowerShell wget tool (version 5.1.18362.1801) in Windows OS with two parameters: (1) Tiles: four tiles (h09v05, h10v04, h10v05, and h11v04) covering the study area (Figure 1 and Figure 2). Time: day numbers from 275 (22 October) to 335 (17 November) in 2012 [32,38].
The NTL radiance data were extracted from the compressed Black Marble images in Hierarchical Data Format (HDF5) using R. The BRDF-corrected radiance (in VNP46A1 products), BRDF-corrected gap-filled radiance (VNP46A2), and non-corrected radiance at sensor (in both VNP46A1 and VNP46A2) were compared in Figure 2. The result shows that the corrected radiance (VNP46A2 & VNP46A2 gap-filled) has a more stable daily NTL radiance compared with the original radiance (VNP46A1) that is fluctuated due to moonlight cycles (Figure 2). The UTC_Time layer in the VNP46A1 products contains the UTC time when nighttime radiance is acquired. Four types of QA values in the VNP46A2 products indicate the quality of pixels: value 00 denotes high-quality persistent NTL, value 01 means high-quality ephemeral NTL, value 02 is poor quality (outlier, potential cloud contamination, or other issues), and value 255 is no retrieval (VNP46A2 gap-filled layer applies high-quality pixels from the nearest date to replace no-retrieval pixels) [32,38]. To ensure high-quality and consistent NTL radiance, this study only used high-quality pixels (value 00) in the non-filled images (VNP46A2) and excluded pixels in the other quality levels (01, 02, and 255). Daily NTL images of the research area that are collected by a single scan and mainly covered by high-quality pixels were used. Then the qualified daily NTL images were mosaiced in R and later cropped into different spatial units (e.g., block groups, CBSAs, etc.) for spatial and explanatory analysis.

2.3. Auxiliary Data

Auxiliary data were collected from multiple sources to explain the variation of NTL during Hurricane Sandy (Table 1). The auxiliary data include wind speed data, damaged housing unit data, Twitter data, land-use data, and proximity data, all of which are considered to have potential relations with NTL variation. Wind speed data at ground observations in the study area were obtained from the National Oceanic and Atmospheric Administration (NOAA) Hurricane Sandy aftermath report [39]. Damaged housing unit data at the block-group level were acquired from the U.S. Department of Housing and Urban Development (HUD) [40]. Twitter data were collected from Archive.org (an online archive of digital materials) from 22 October 2012 to 17 November 2012 and aggregated at the Core-Based Statistical Area (CBSA) scale according to geotags and user locations. Defined by the Office of Management and Budget (OMB), a CBSA is a geographic area that consists of one or more counties (or equivalents) anchored by an urban center of at least 10,000 people plus adjacent counties that are socioeconomically tied to the urban center by commuting [41]. CBSA refers collectively to both Metropolitan Statistical Areas (MSA) and Micropolitan Statistical Areas (μSA). The NLCD 2011 Land Cover (product name: NLCD_2011_Land_Cover_L48_20190424) and NLCD 2011 Developed Imperviousness Descriptor (product name: NLCD_2011_Impervious_descriptor_L48_20190405) in the Contiguous United States (CONUS) from the Multi-Resolution Land Characteristics (MRLC) Consortium (http://www.mrlc.gov, accessed on 18 September 2021) [42,43,44,45,46,47] were used to compare NTL changes in different land uses. Spatial analysis tools were applied to aggregate and analyze the NTL data in different spatial units and land-use types. In addition, the hurricane trajectory was collected from National Weather Service (NWS) and was used to calculate the proximity to Hurricane Sandy using Euclidean Distance.

3. Analysis

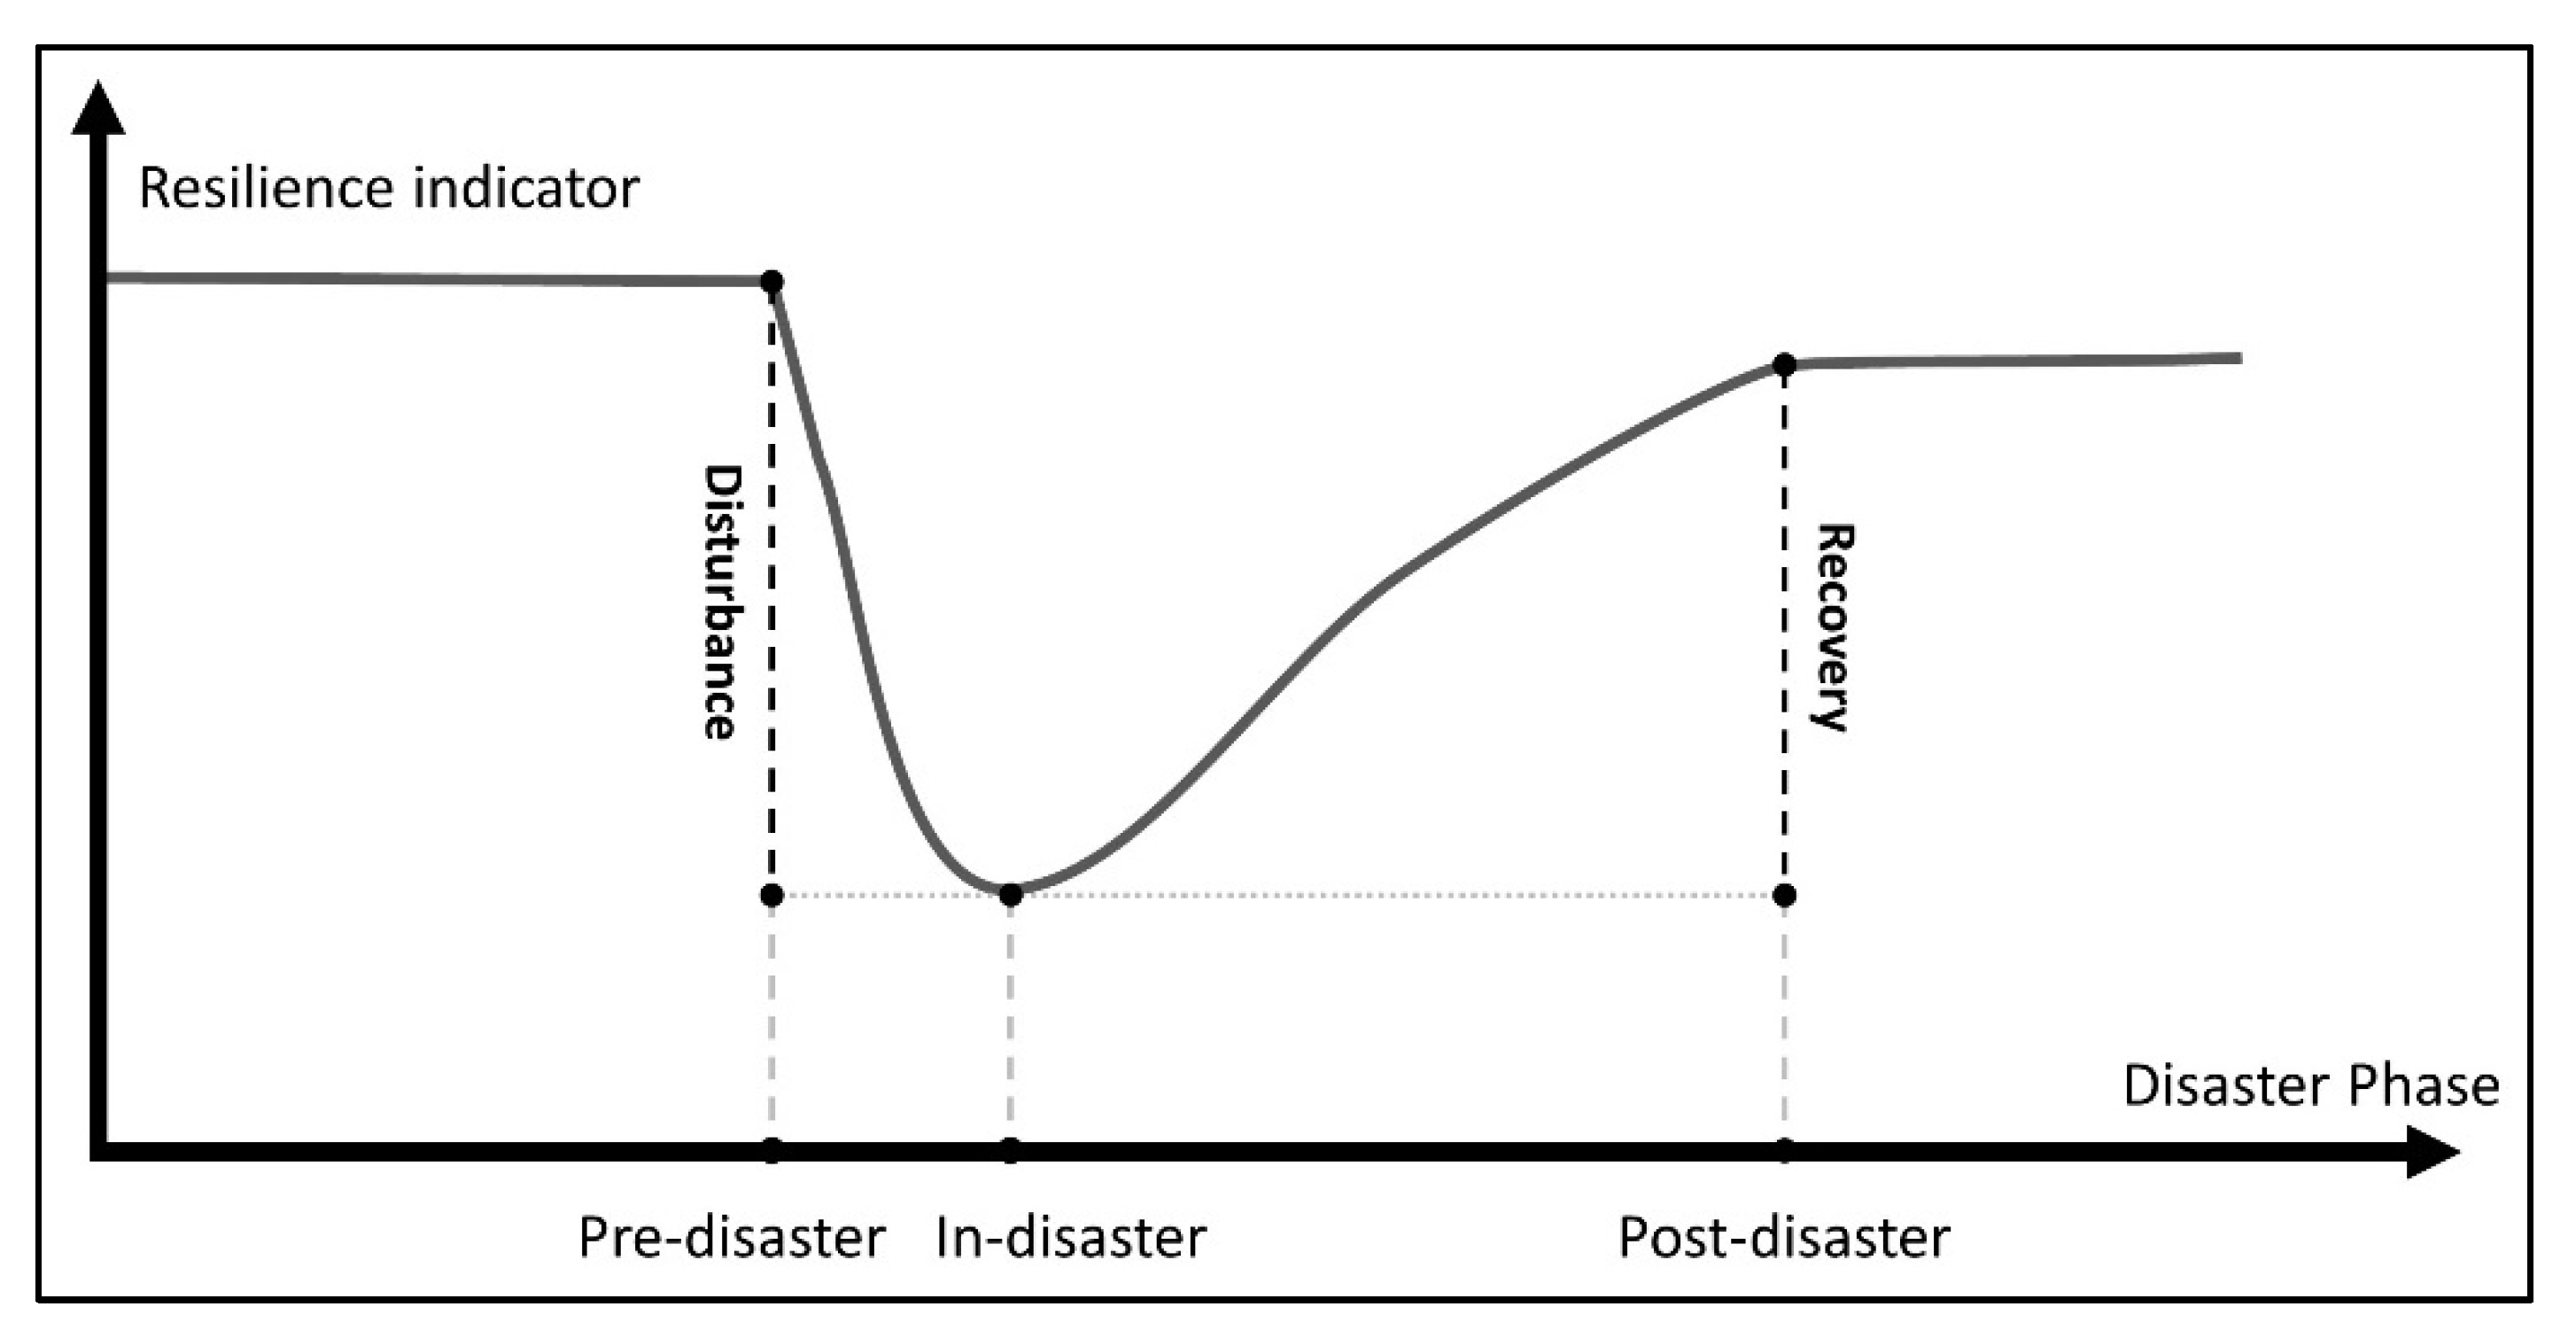
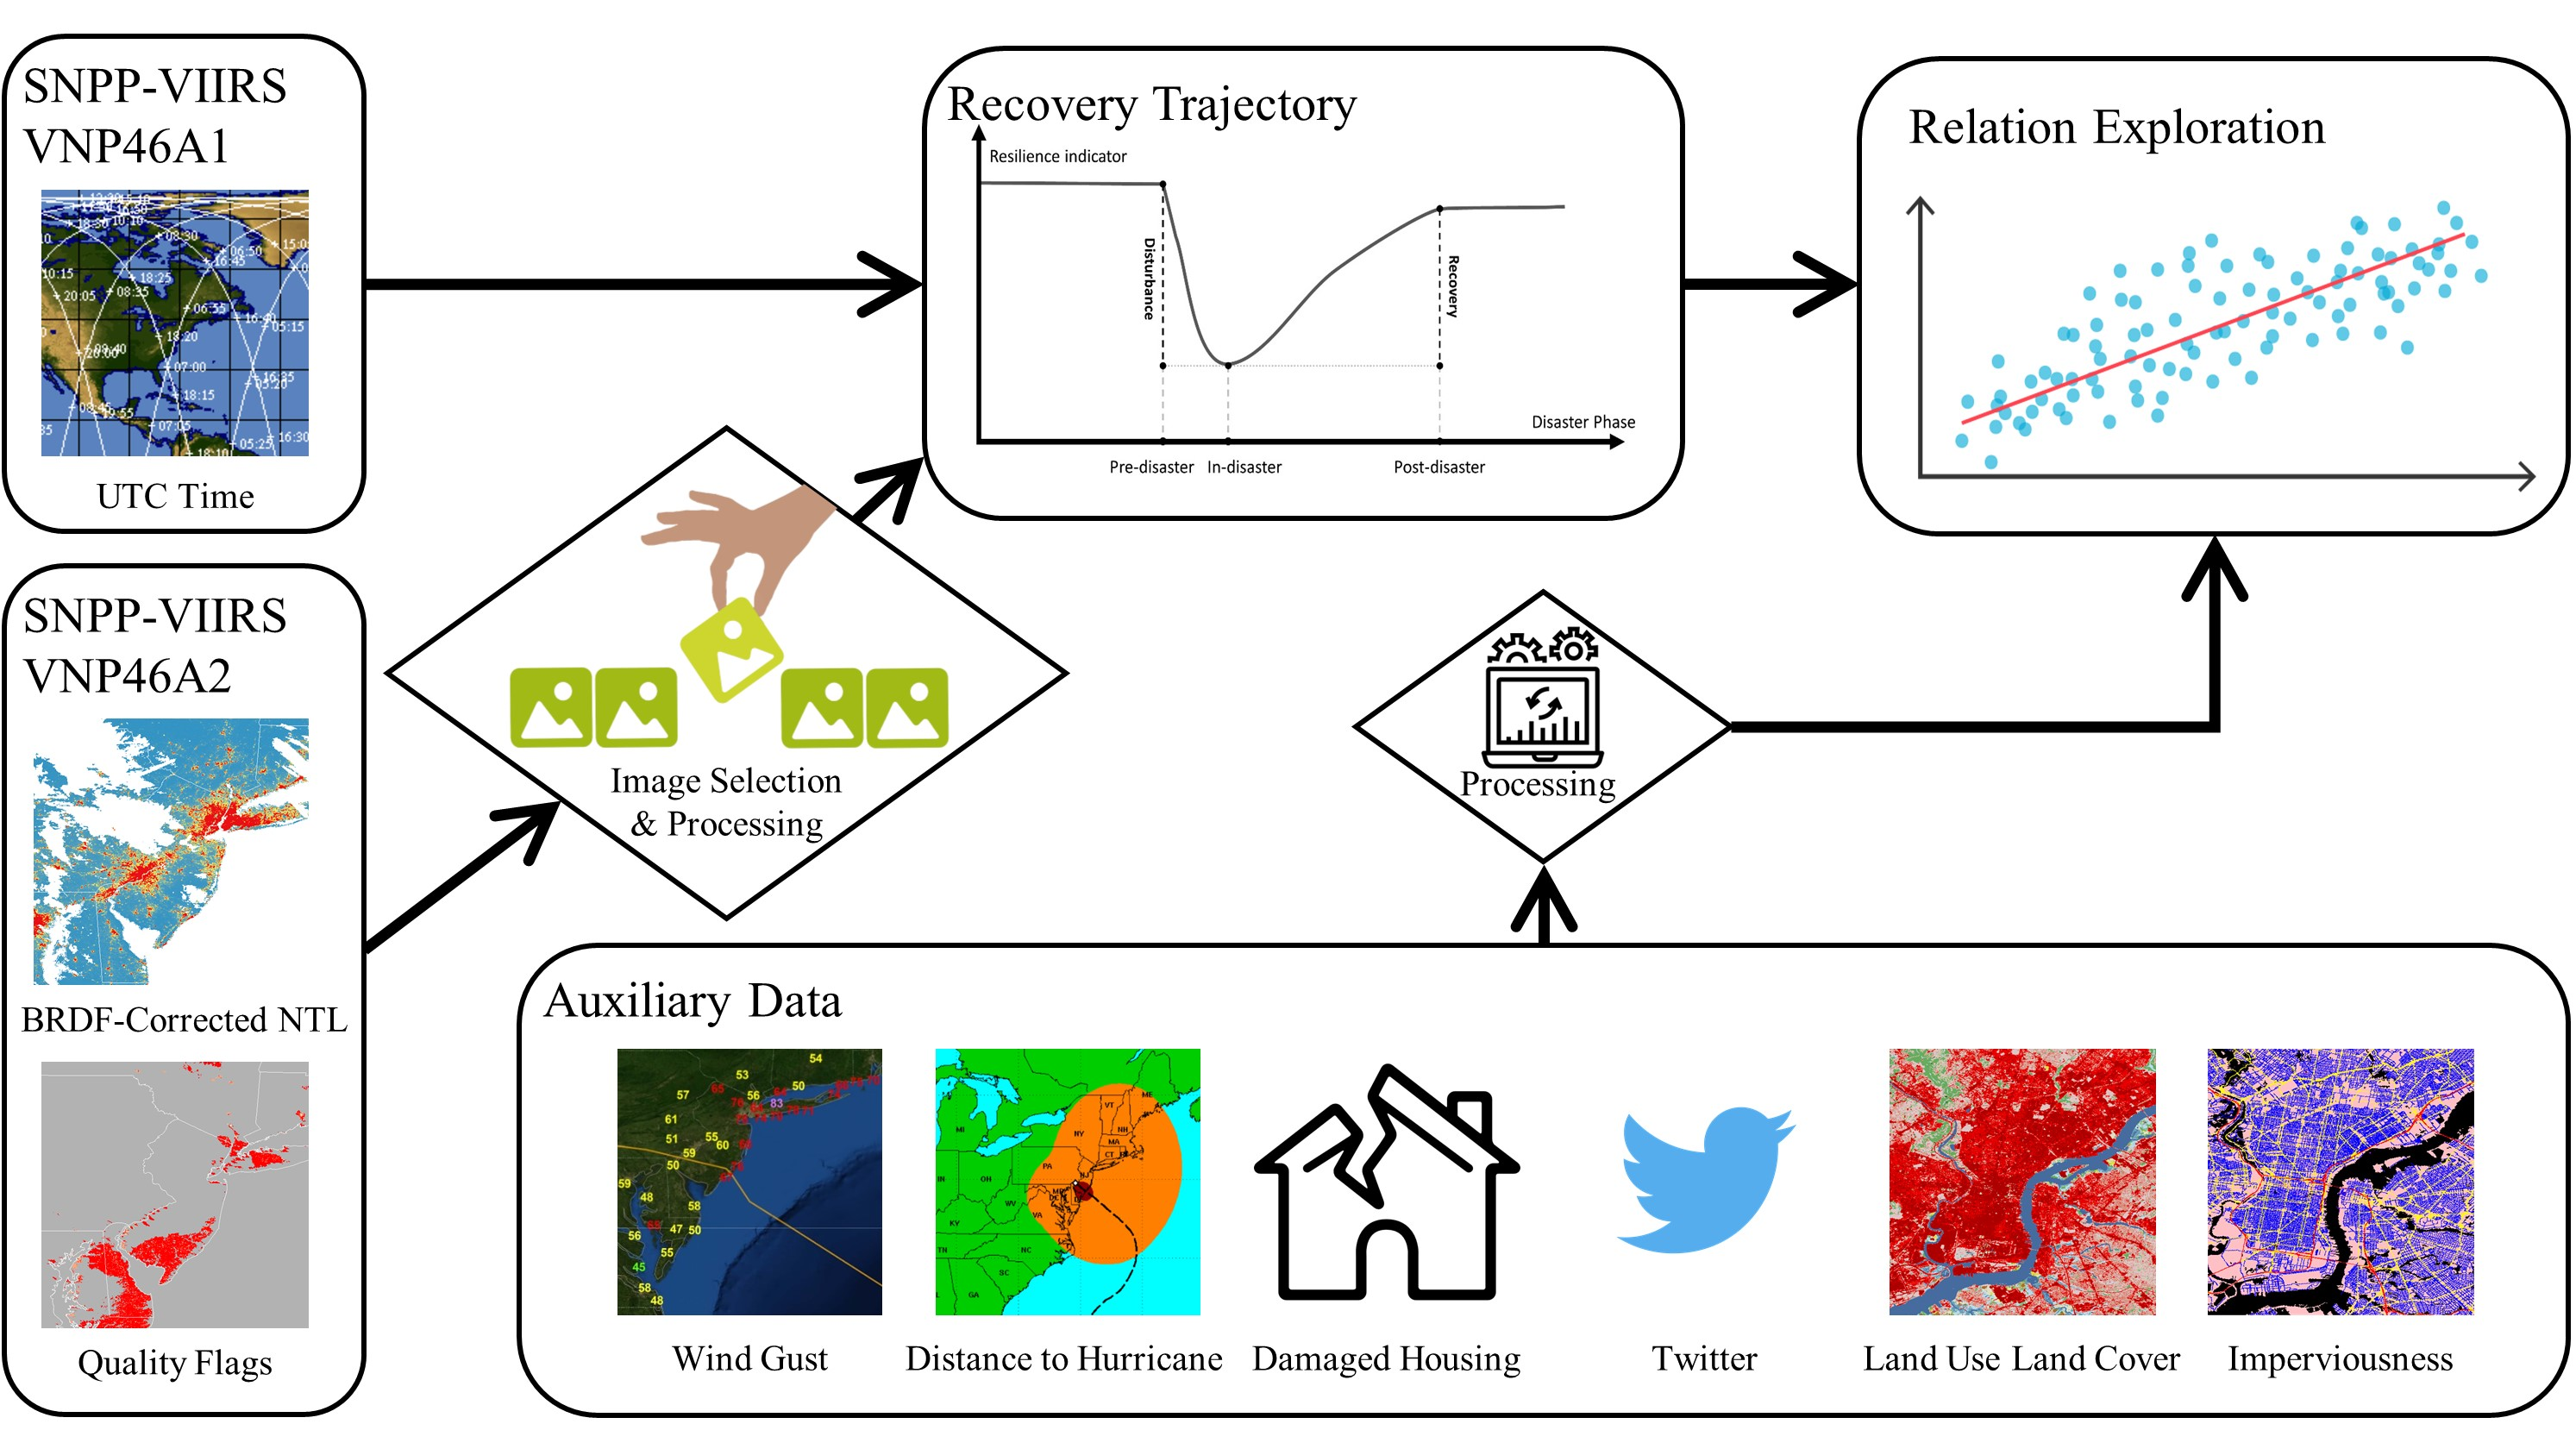
3.1. Conceptual Framework of Recovery Trajectories

Based on the concept of resilience including resistance and recovery, resilience under the disastrous condition should be measured on both the reduction of functional capacities and the recovery of the capacities to a normal condition [48]. Recovery trajectories conceptualize resilience as a dynamic process that describes the change of a social system’s functional capacities after a shock, such as natural disasters. Figure 3 shows an example of the recovery trajectory where a functional capacity suddenly declines after the disaster and gradually recovers subsequently. The conceptual framework of recovery trajectories has been widely used to measure the resilience of social-ecological and infrastructural systems [49,50,51,52,53]. The variation of recovery trajectories among different places can indicate resilience. In this study, due to varying the atmospheric condition during the hurricane, many images do not have sufficient high-quality pixels covering the study area. The time series of the images cannot provide continuous recovery trajectories. Thus, the analysis of NTL changes is limited to three sampling points at pre-disaster, in-disaster, and post-disaster phases. Specifically, the Disturbance Rate ( D N T L ) and Recovery Rate ( R N T L ) of NTL radiance are measured from the three sampling points:
D N T L = E ( N T L i n ) E ( N T L p r e ) E ( N T L p r e )
R N T L = E ( N T L p o s t ) E ( N T L i n ) E ( N T L p r e )
where N T L p r e , N T L i n , and N T L p o s t denote the NTL radiance measured in the pre-, in-, and post-disaster phases respectively (Figure 3). The function E calculates the mean NTL radiance within a spatial unit (e.g., block groups or CBSAs) or land use type. In general, a small disturbance (low D N T L ) and fast recovery (high R N T L ) would indicate high resilience, while high D N T L and low R N T L mean the opposite.

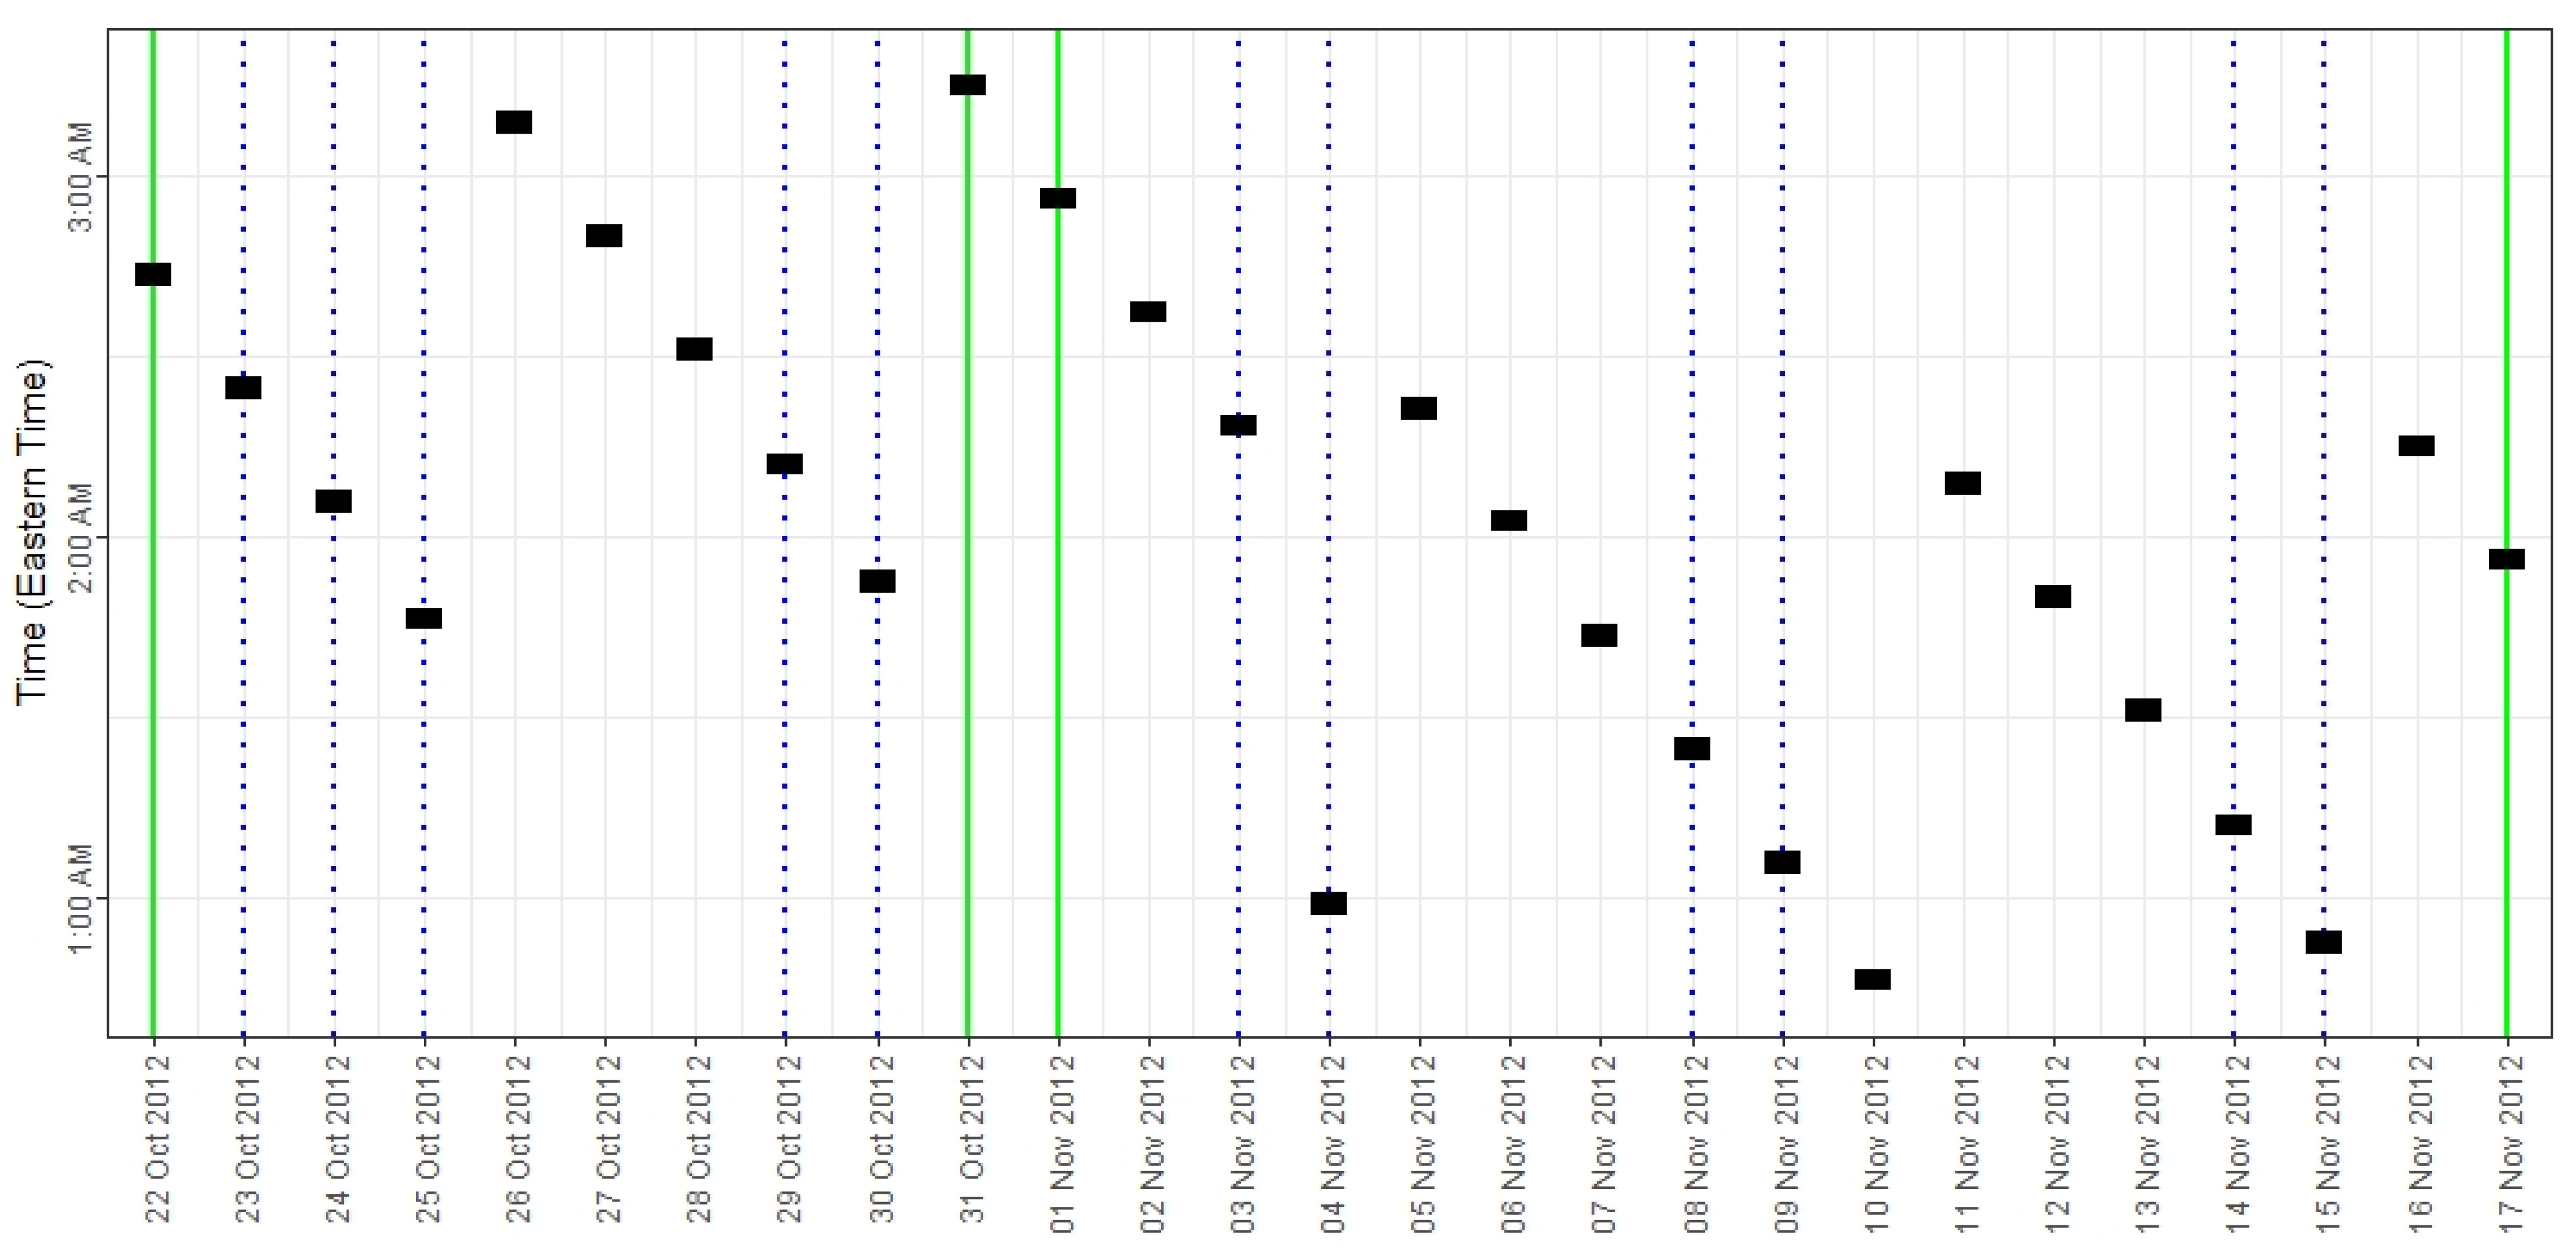
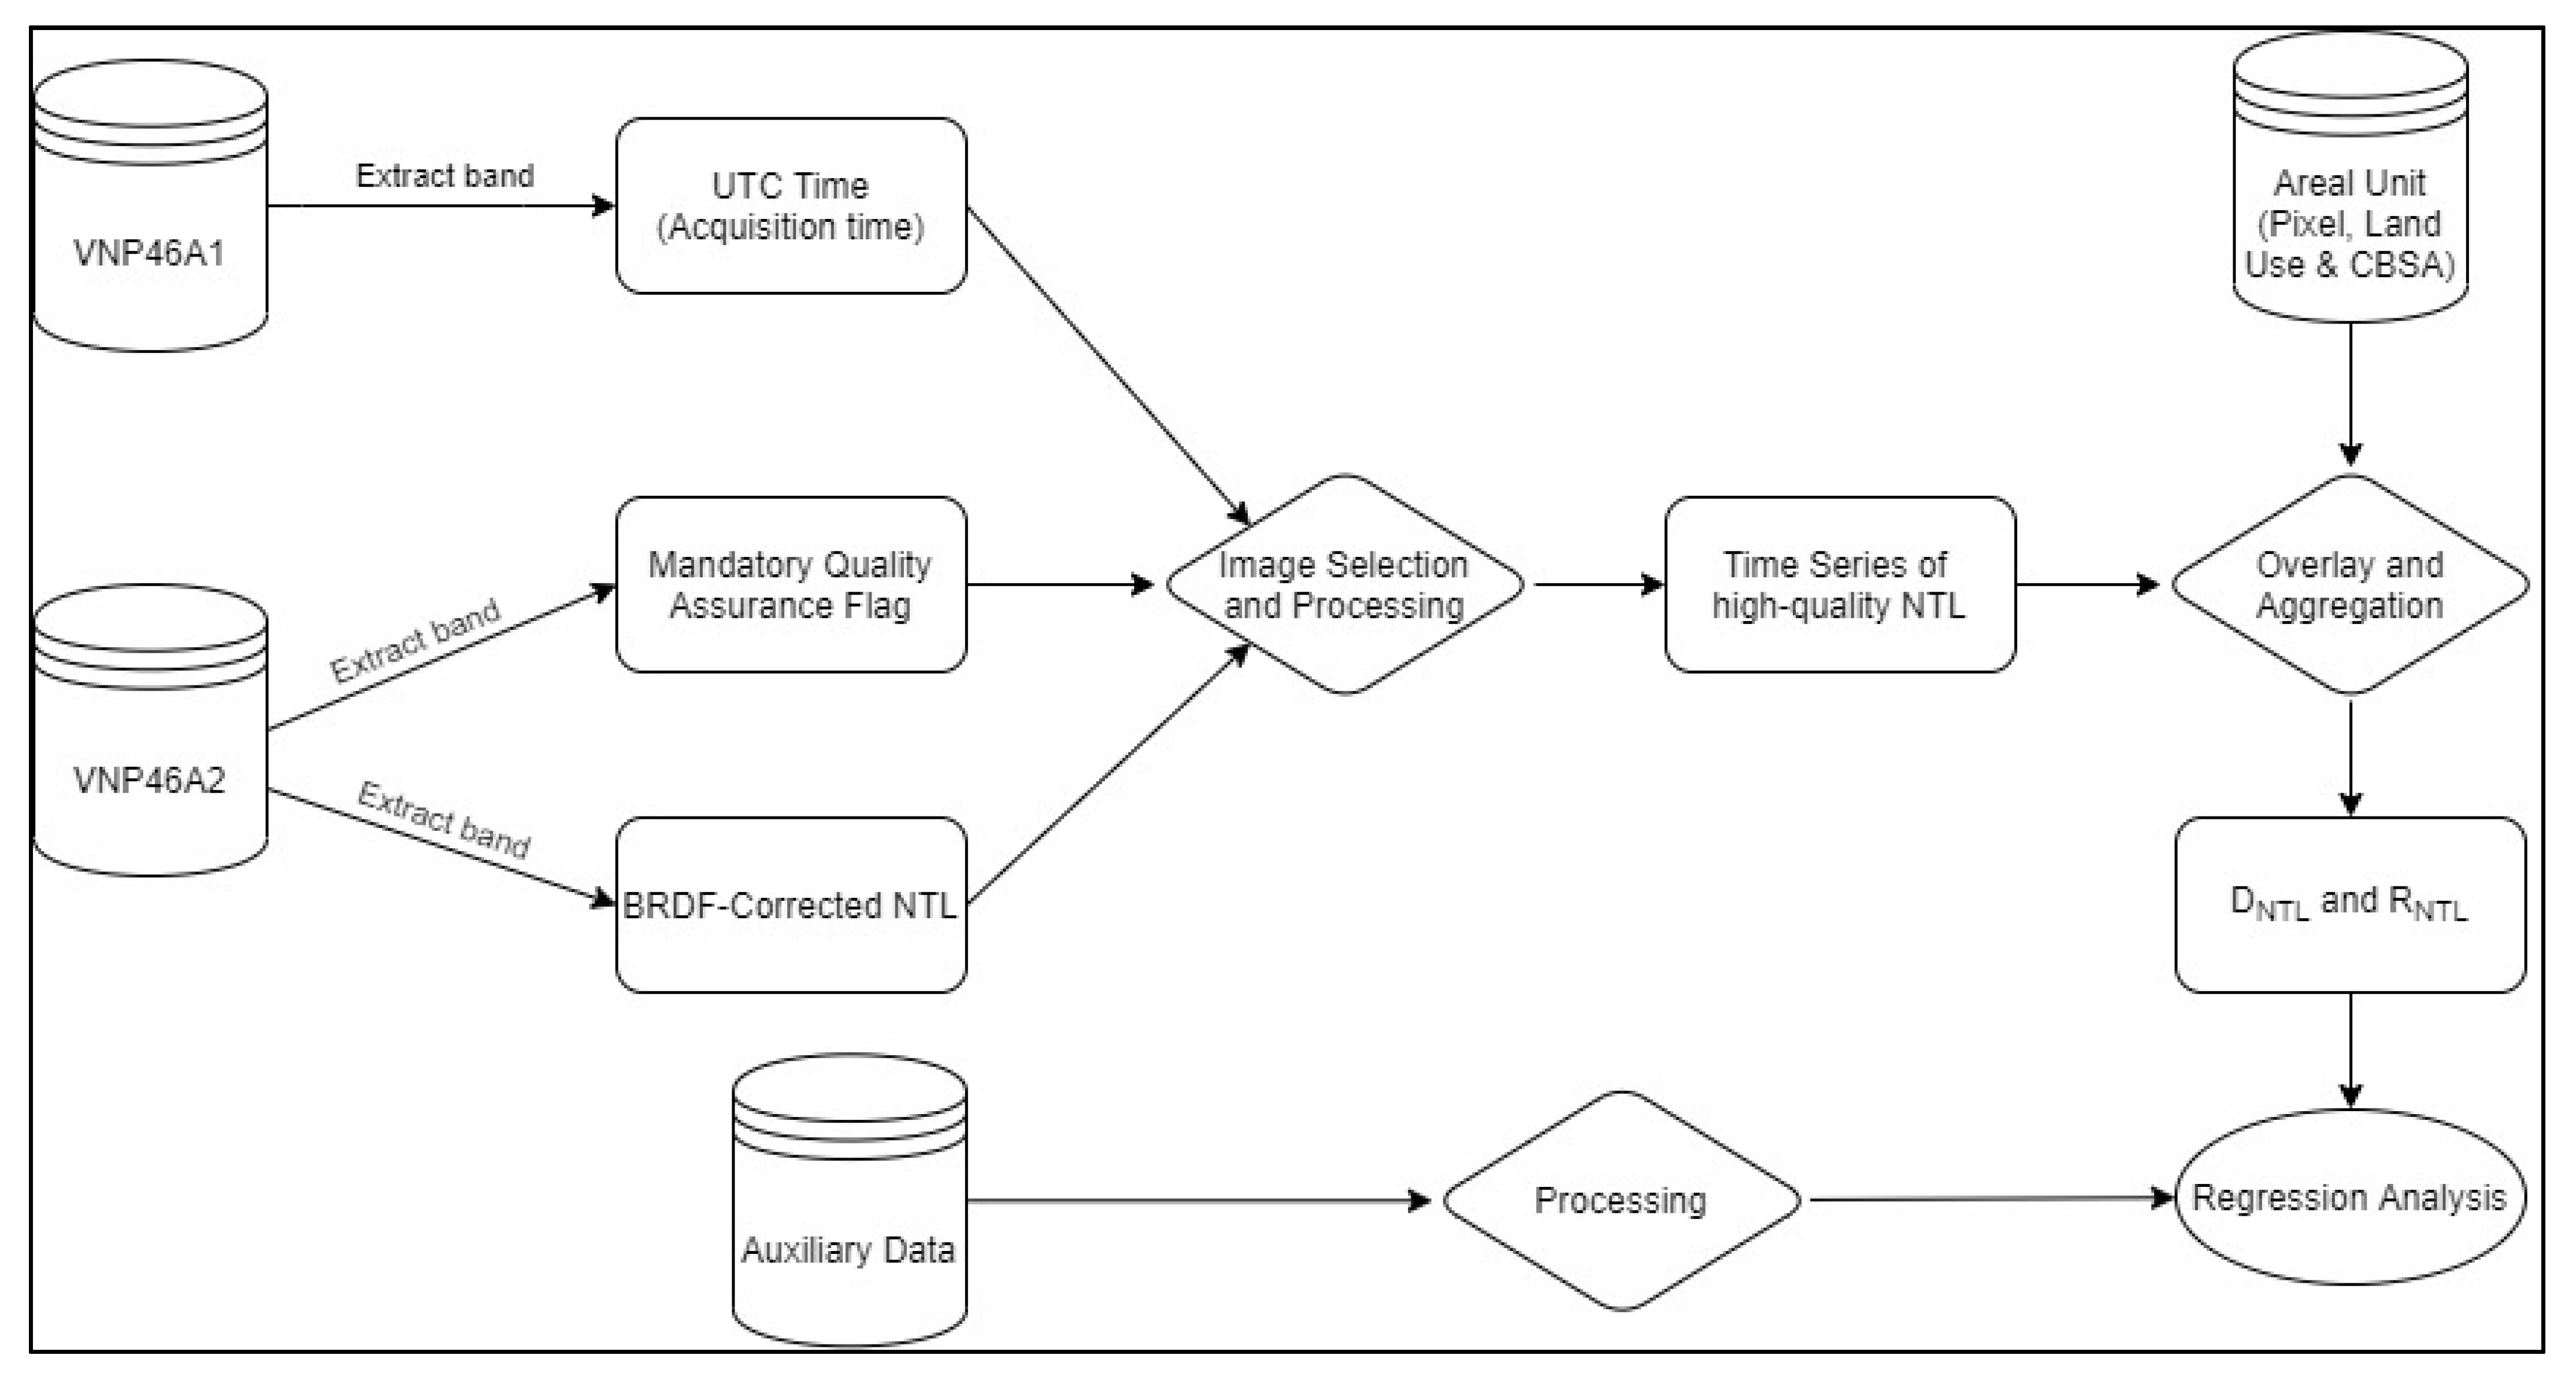
3.2. NTL Image Selection and Processing

NTL data from four tiles were extracted from the VNP46 suite and mosaiced, including the UTC time layer, mandatory QA flag layer, and three radiance layers. Boundaries of 66 CBSAs in the Northeastern US were used as the extent of the extracted NTL data. Due to varying cloud cover, the data quality of NTL images is very unstable during the disaster period. Thus, we selected images with sufficient high-quality pixels in three disaster phases (pre-disaster, in-disaster, and post-disaster) to analyze NTL changes.
Referring to previous studies [33,54], we split the hurricane process into three periods by the landing time (29 October) and dissipating time (2 November), including the pre-disaster period (22–28 October), the in-disaster period (29 October–1 November), and the post-disaster period (2–17 November). Three sampling time points were used to represent NTL radiance in the three periods respectively. The selection is based on two criteria: data quality and single acquisition time. For the former criterion, dates are selected when the study area is mostly covered by high-quality (cloudless) pixels. For the latter criteria, only days when the study area is scanned at the same time are selected. Figure 4 shows the UTC_Time layers (denoting the acquisition time in UTC) in the VNP46A1 products from 22 October to 17 November in 2012. The blue dashed lines indicate days when the study area is covered by image tiles, scanned at different time points. As an example, on 8 November the study area is covered by two image tiles scanned at different time points (red and cyan in Figure 5a). A clear radiance difference can be observed in the boundary between the two tiles (see Figure 5b). Thus, mosaicking of images with various scanning time points on the same day can cause inconsistent NTL radiance over space. To avoid this bias, dates with multiple acquisition times (highlighted in blue dashed lines in Figure 6) were excluded from the selection.
Combining the two criteria, 22 October was selected as the sampling time point in the pre-disaster period. 17 November was selected as the sampling point in the post-disaster period with additional considerations. First, dates between 6 November and 10 November were excluded from the selection to eliminate impacts from the 2012 Nor’easter Storm. 12 November meets both criteria but does not cover the populated areas (e.g., New York City) near the landfall location, and thus was not selected. Due to the thick cloud brought by the hurricane, it has been a challenge to find a single image meeting both criteria during the in-disaster period. Thus, the two images on 31 October and 1 November were combined to create a larger spatial coverage. When combining the images, if a pixel had a high-quality flag on both days, the average NTL radiance of the two days was assigned in the combined image. If a pixel had a good QA value in one of the two days, the NTL radiance on that day was selected. Pixels with poor QA values on both days were excluded from the analysis.

3.3. Spatial Analysis

The spatial variation of NTL changes metrics ( D N T L and R N T L ) in Hurricane Sandy was analyzed in different spatial units, including the pixel, block group, and CBSA level, thus avoiding the MAUP in the spatial analysis. At the pixel level, D N T L and R N T L were calculated in high-quality pixels at the three sampling time points using Equations (1) and (2). For visualization purposes, a 5-by-5 focal window was applied to smooth the spatial pattern at the pixel level. At the block-group and CBSA level, zonal statistic methods were used to aggregate D N T L and R N T L in each spatial unit. To mainly focus on the illuminated areas at night, a mask of impervious surface area (NLCD 2011 Developed Imperviousness Descriptor) was applied to the NTL radiance before aggregating D N T L and R N T L . Then, choropleth maps were produced to visualize the spatial distribution of D N T L and R N T L at two levels. Comparing different distribution maps, spatial variations of NTL change as well as the underlying factors were discussed. Additionally, the zonal statistics tool was applied to extract and compare NTL radiance in different land uses.

3.4. Regression Analysis

Univariate ordinary least square regression was applied to examine the relation between NTL radiance changes ( D N T L and R N T L ) and each explanatory variable. The equations of the regression model are as follows:
y = β x i + ε
where x i is the explanatory variable, y is D N T L or R N T L derived from NTL changes using Equations (1) and (2), and ε is the residual.
First, wind speed data were analyzed at the 1-km buffer scale. The maximum surface wind speed data during Hurricane Sandy in the research area were collected from the NOAA Hurricane Sandy aftermath report, geocoded based on the geographic coordinates, and later used to explain the spatial variation of disturbance ( D N T L ) and recovery of NTL ( R N T L ) [39]. In total, 387 observation stations located in high-quality pixels were used to analyze the relations. Maximum surface wind speed occurred near the landfall time (from 29 October, 12:51 pm UTC to 30 October, 4:57 am UTC) at these stations were compared with NTL changes in 1-km buffers around the stations.
Second, damaged housing unit data were analyzed at the block-group scale. Data collected from HUD include block groups in New York, New Jersey, Connecticut, and Rhode Island. Percentage of non-seasonal damaged housing units in block groups were used (pct_dmg_ns in the HUD dataset) as an explanatory variable. This percentage was calculated using the number of damaged non-seasonal housing units divided by the number of total non-seasonal housing units.
Third, geocoded Twitter data were assessed at the CBSA scale. According to user profiles and geotags, the collected tweets were geocoded at the city level and linked to each affiliated CBSA. Hurricane-related tweets were retrieved by querying the keywords ‘hurricane’ and ‘sandy’. The retrieved tweets were preprocessed by removing stop words (e.g., a, the, is, etc.) and word stemming (e.g., converting flooded/flooding/floods to flood). The average sentiments of hurricane-related and all tweets in each CBSA were calculated using the Valence Aware Dictionary and sEntiment Reasoner (VADER) package (version 3.2.1) in Python 3.8.2 (https://pypi.org/project/vaderSentiment/, accessed on 18 September 2021) [55,56]. The ratio of hurricane-related tweets to all tweets was calculated in CBSAs. Next, tweets containing various keywords (e.g., ‘electric’, ‘close’, ‘outage’, ‘flood’, ‘evacuate’, ‘wind’, ‘rain’, ‘storm’, and ‘damage’) were extracted from the hurricane-related tweets. The selection of keywords refers to previous studies that utilize Twitter data to study natural disasters [54,57,58]. The ratio of tweets containing each keyword was calculated in CBSAs, with the number of tweets containing the keyword as the nominator and the number of all geocoded tweets as the denominator. The relation between tweets and NTL change was compared among CBSAs using univariate regression models.
Fourth, Euclidean Distance was applied to calculate the distance to the hurricane trajectory in each pixel. The relations of D N T L and R N T L in each pixel to distance to hurricane track were examined using regression analysis. Additionally, D N T L and R N T L . were compared in different land use and land cover (LULC) types. The comparison was conducted in two LULC classifications, including NLCD 2011 Land Cover (CONUS) and NLCD 2011 Developed Imperviousness Descriptor (CONUS). Zonal statistics were used to calculate the mean value of D N T L and R N T L in each land-use type.
Finally, results from all univariate regression models at different research scales are summarized in the table. The coefficients of these models (e.g., p-value, R2) are reported to indicate the significance of the relationships. Variables with high correlation with D N T L and R N T L are highlighted. The potential driving factors of these significant correlations with the NTL change are discussed. The workflow of the entire analysis process is summarized in Figure 7.

4. Results

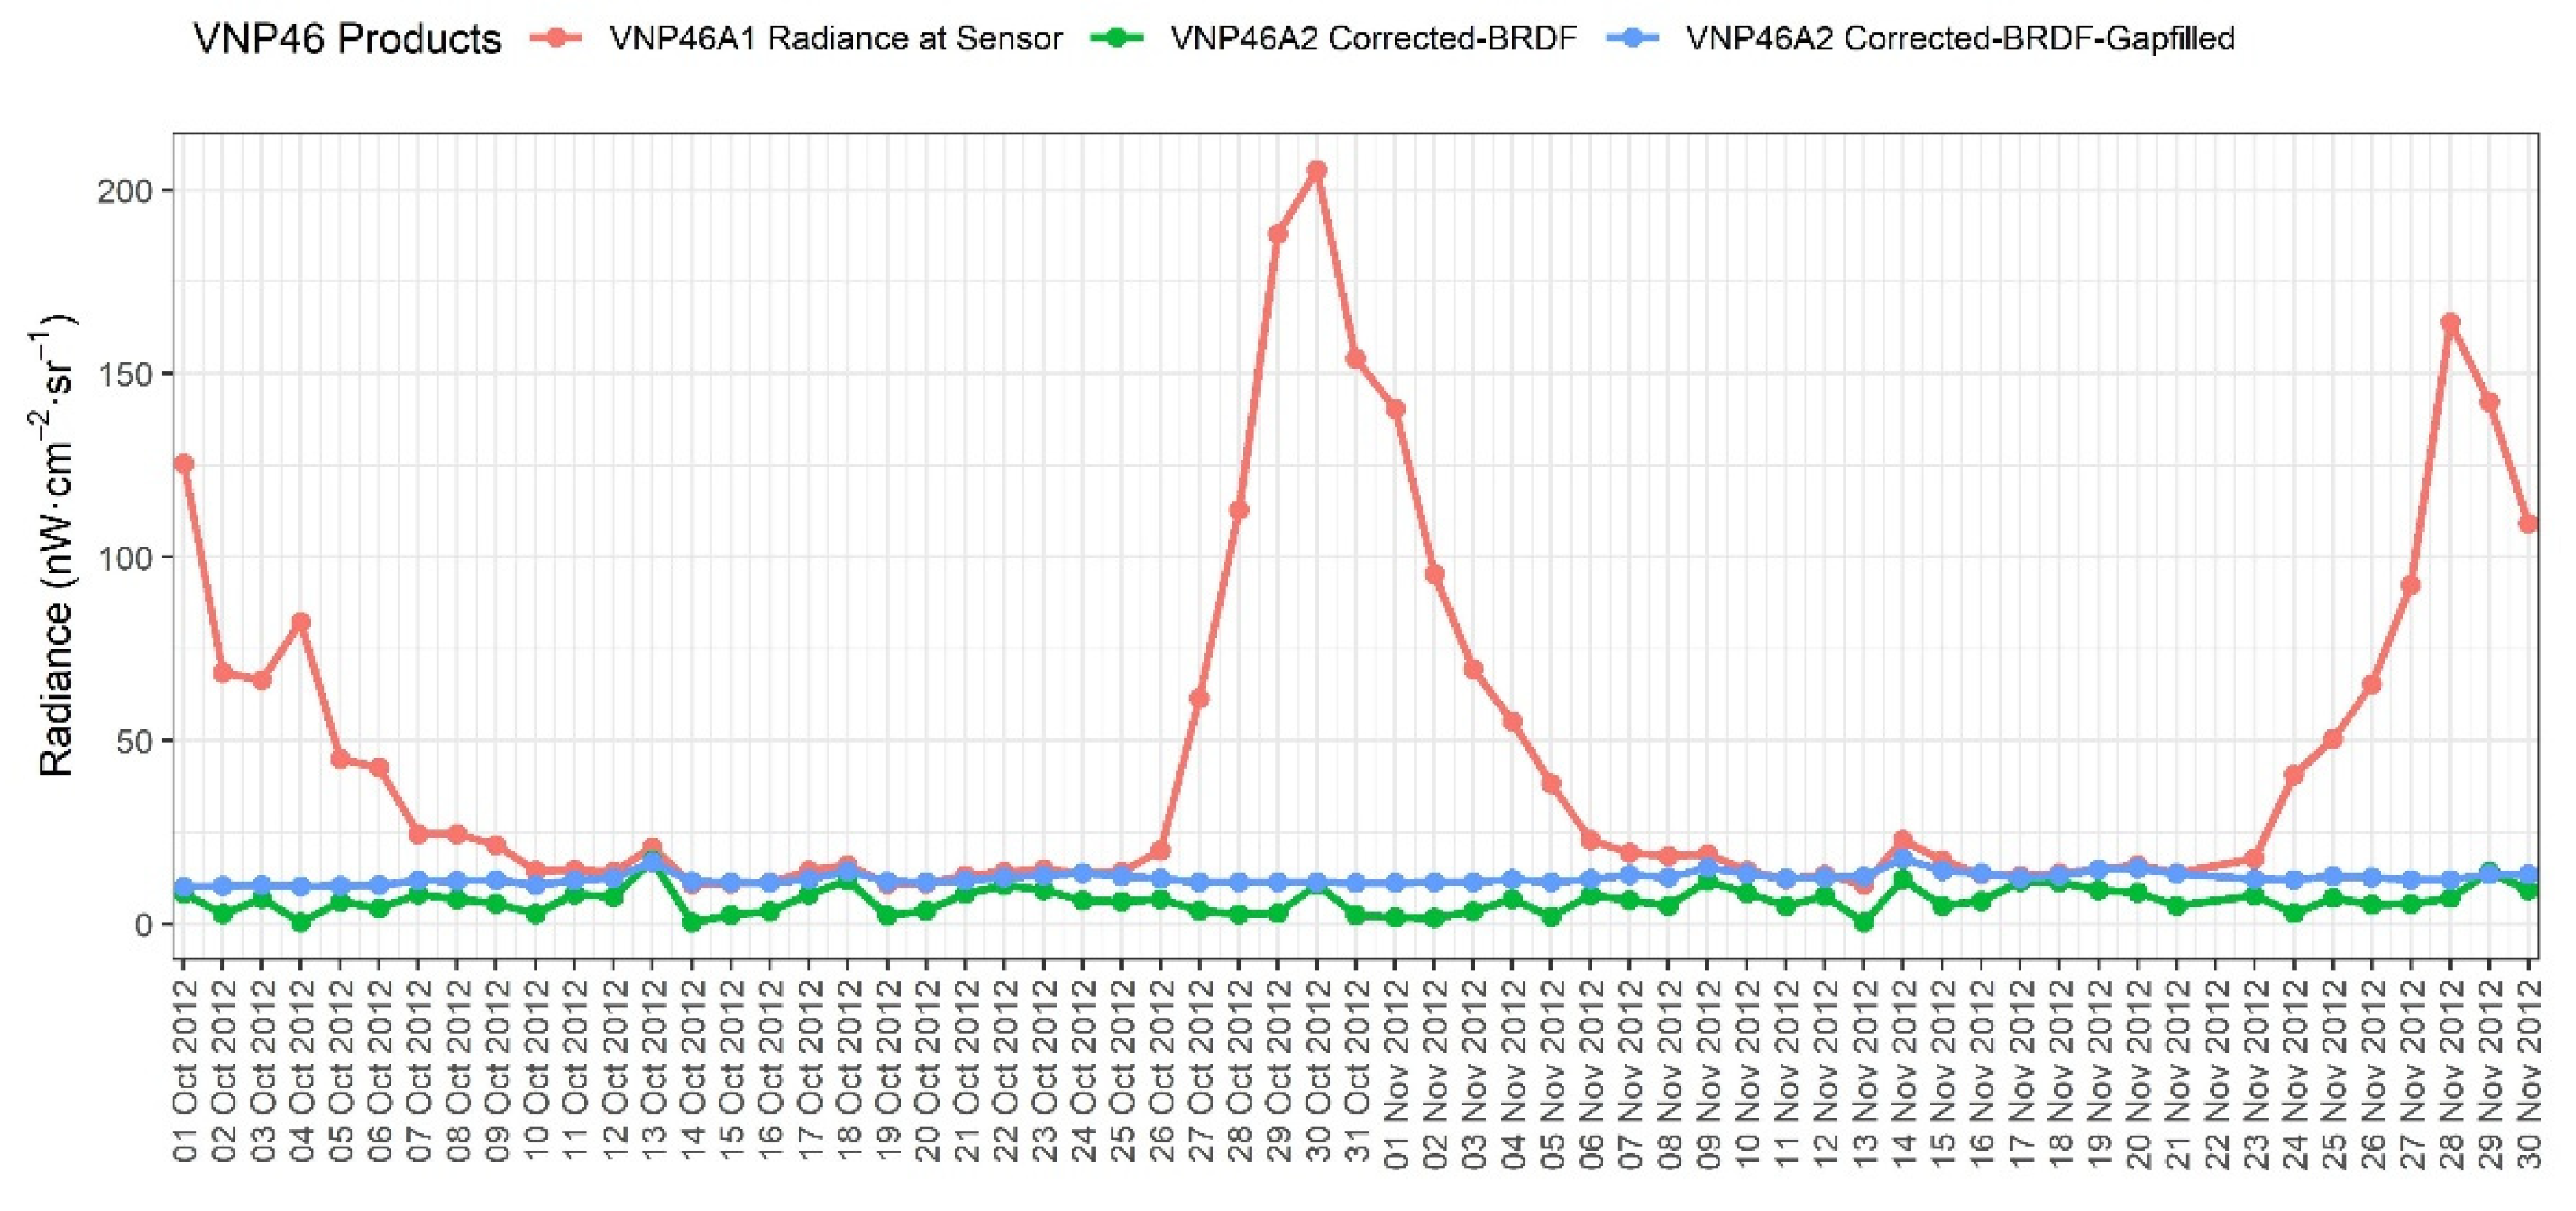
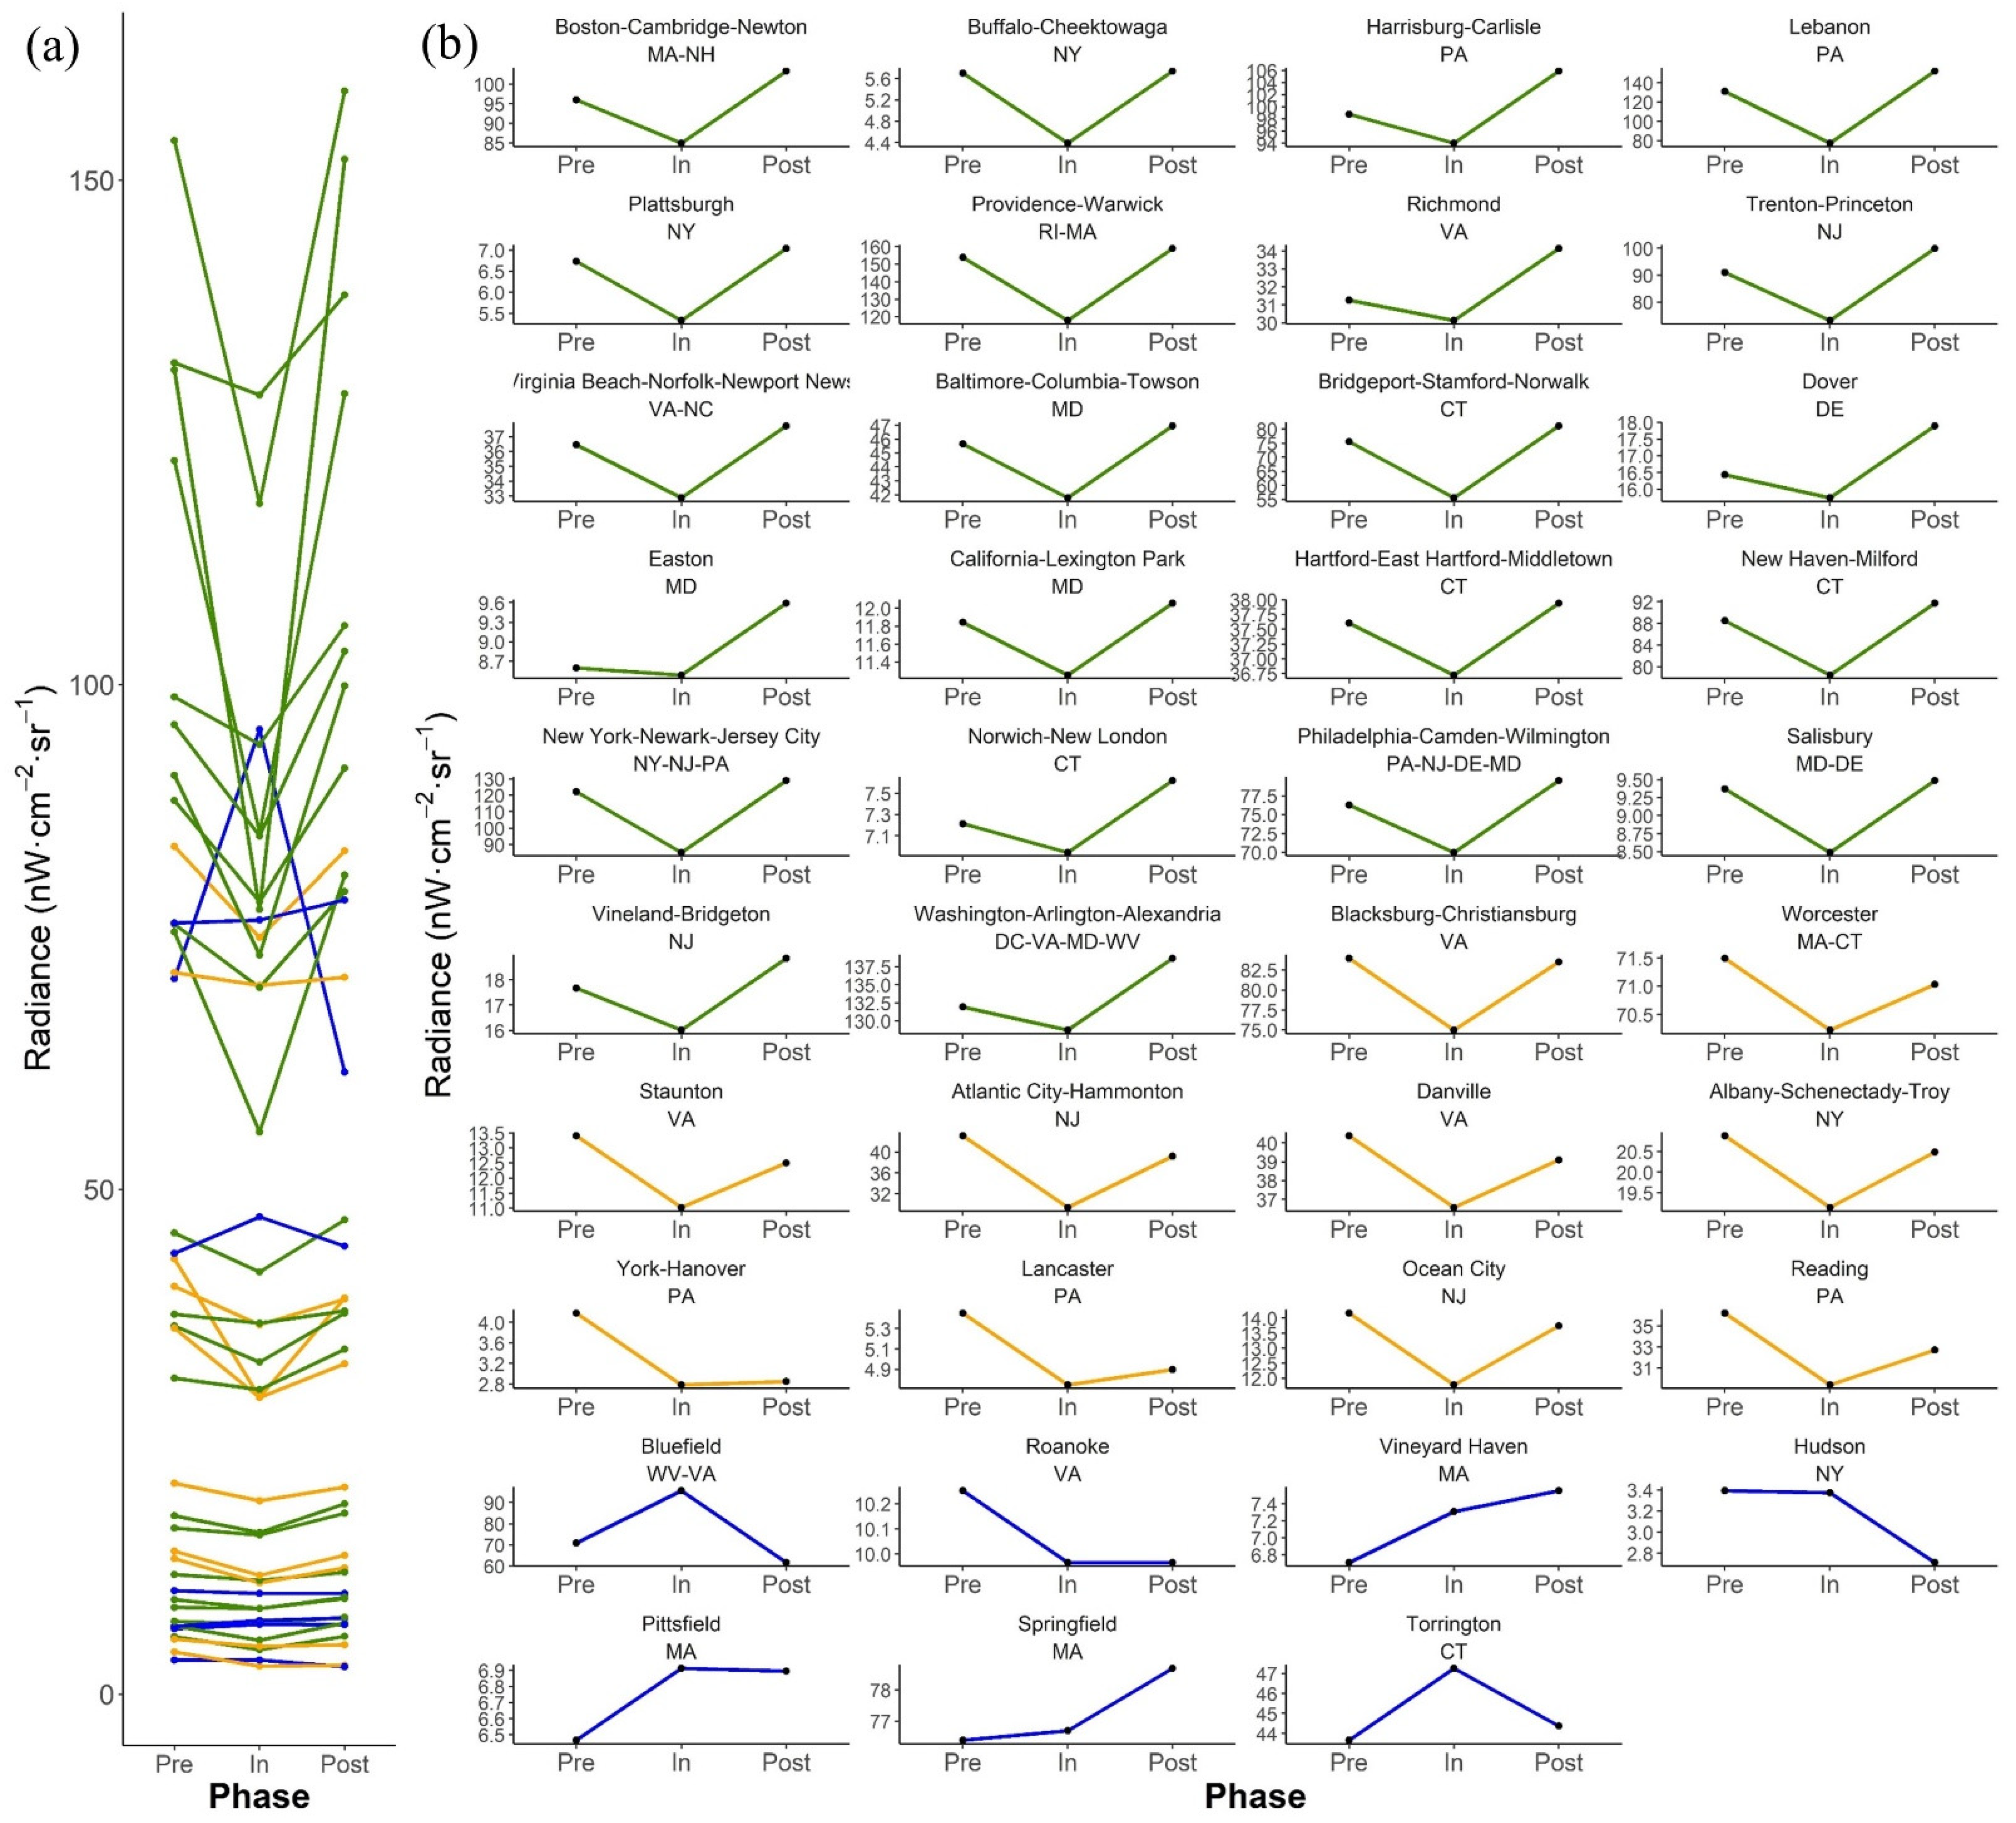
4.1. Temporal Changes of NTL Radiance

Within the study area, 39 CBSAs with sufficient high-quality pixels were plotted in Figure 8. Thirty-two CBSAs (82.1% of the 39 CBSAs) show a decline of NTL radiance on Oct. 31 or Nov. 1 (i.e., in-disaster time point) and a recovery on 17 November (the post-disaster time point). This V-shaped pattern is analogous to the recovery trajectory introduced in Section 3.1, which may reflect the disturbance and recovery of certain human activities. However, the exact pattern differs in different CBSAs. On 17 November (post-disaster), the NTL radiance in 22 CBSAs (56.4% of the 39 CBSAs) have fully recovered or exceeded the pre-disaster level (denoted as ‘recovered’ in Figure 8), while the other 10 CBSAs (25.6%) have not fully recovered (denoted as ‘not recovered’ in Figure 8). The remaining 7 CBSAs (17.9%) in other patterns (denoted as ‘Other’ in Figure 8) were excluded in the next steps as not showing a similar pattern to the recovery trajectory. For example, Springfield in Massachusetts and Torrington in Connecticut show an opposite pattern: the NTL radiance is highest at the in-disaster time point.

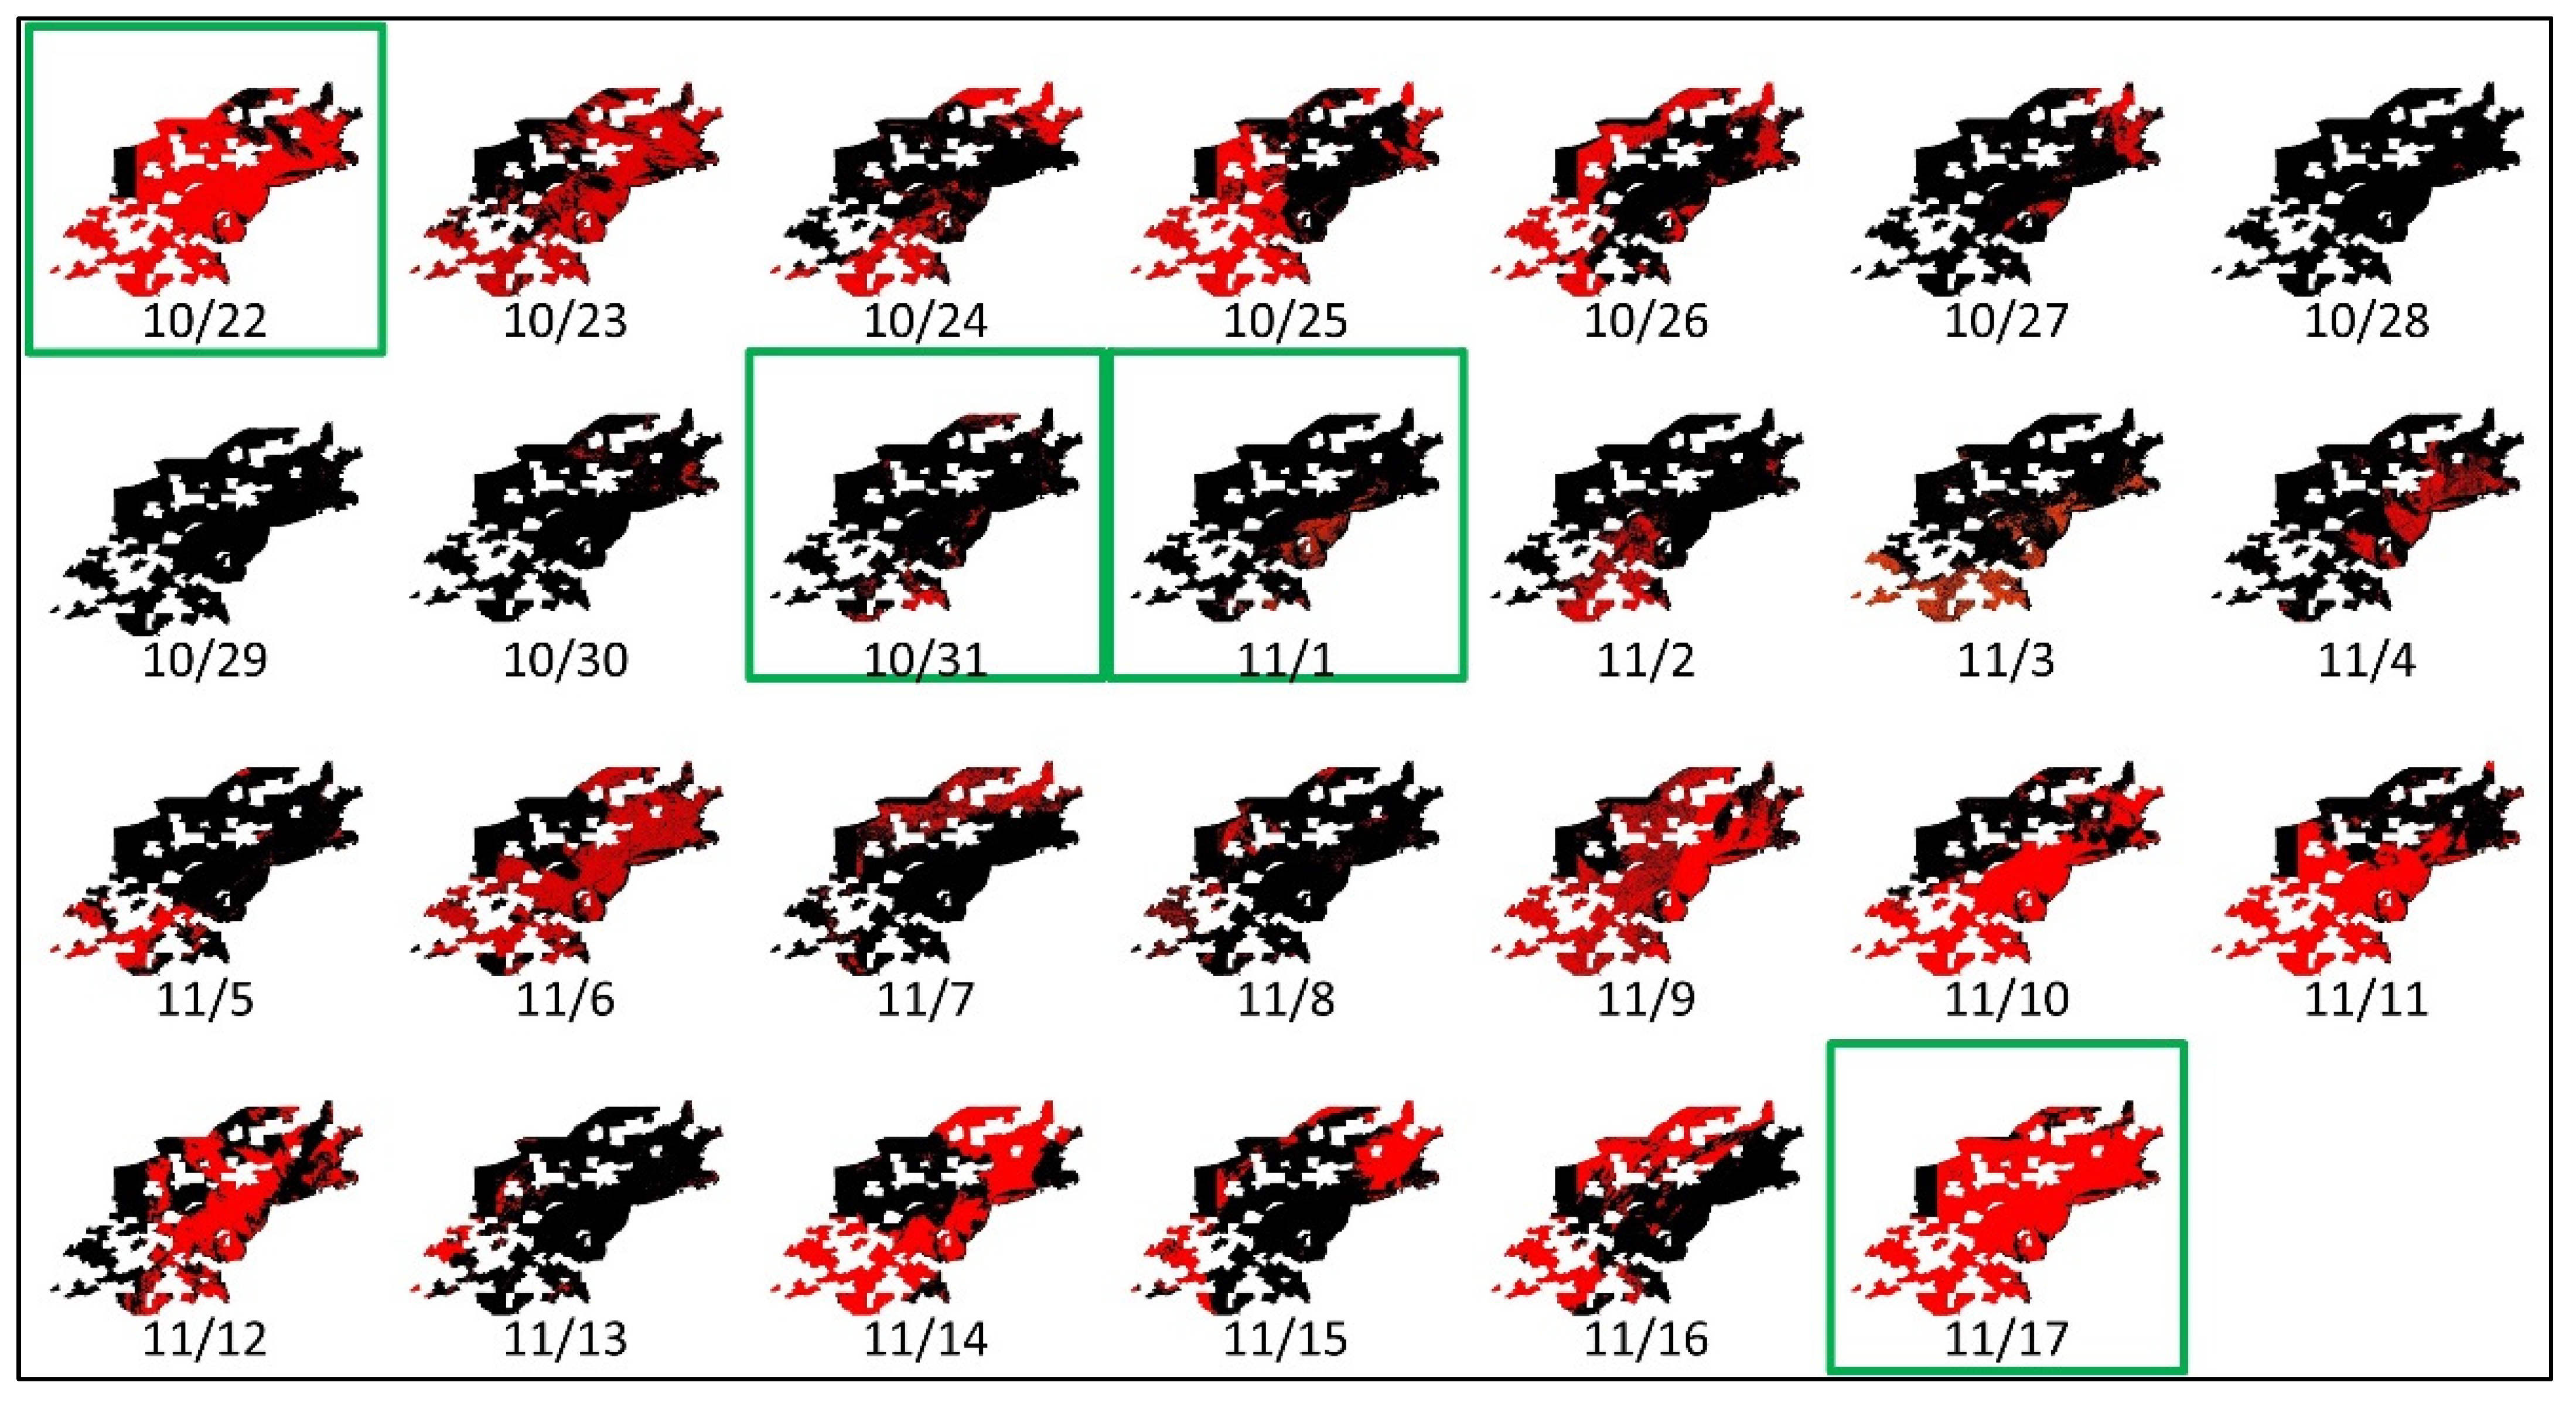
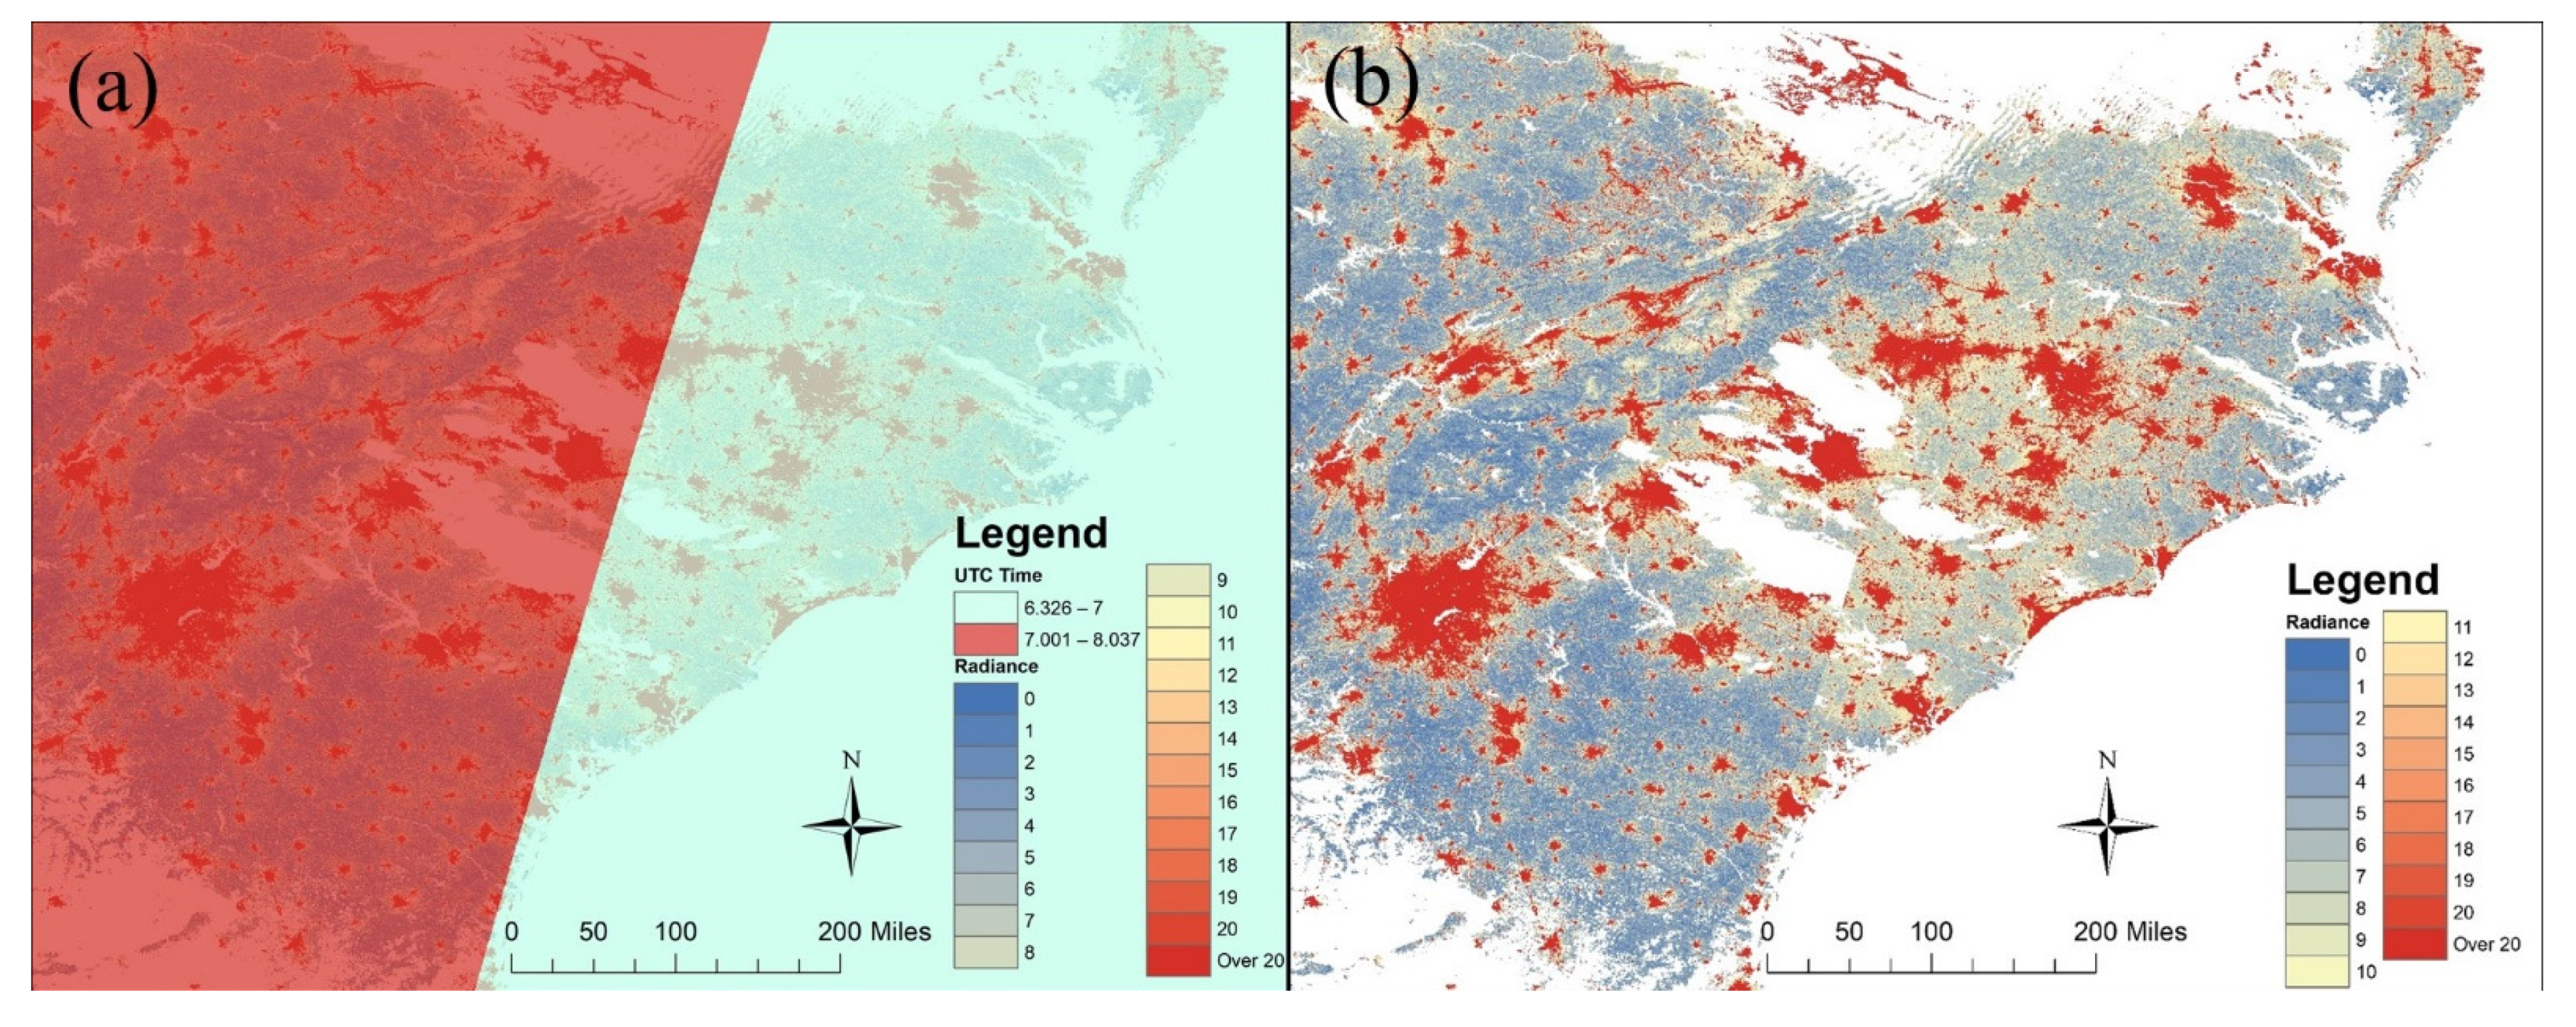
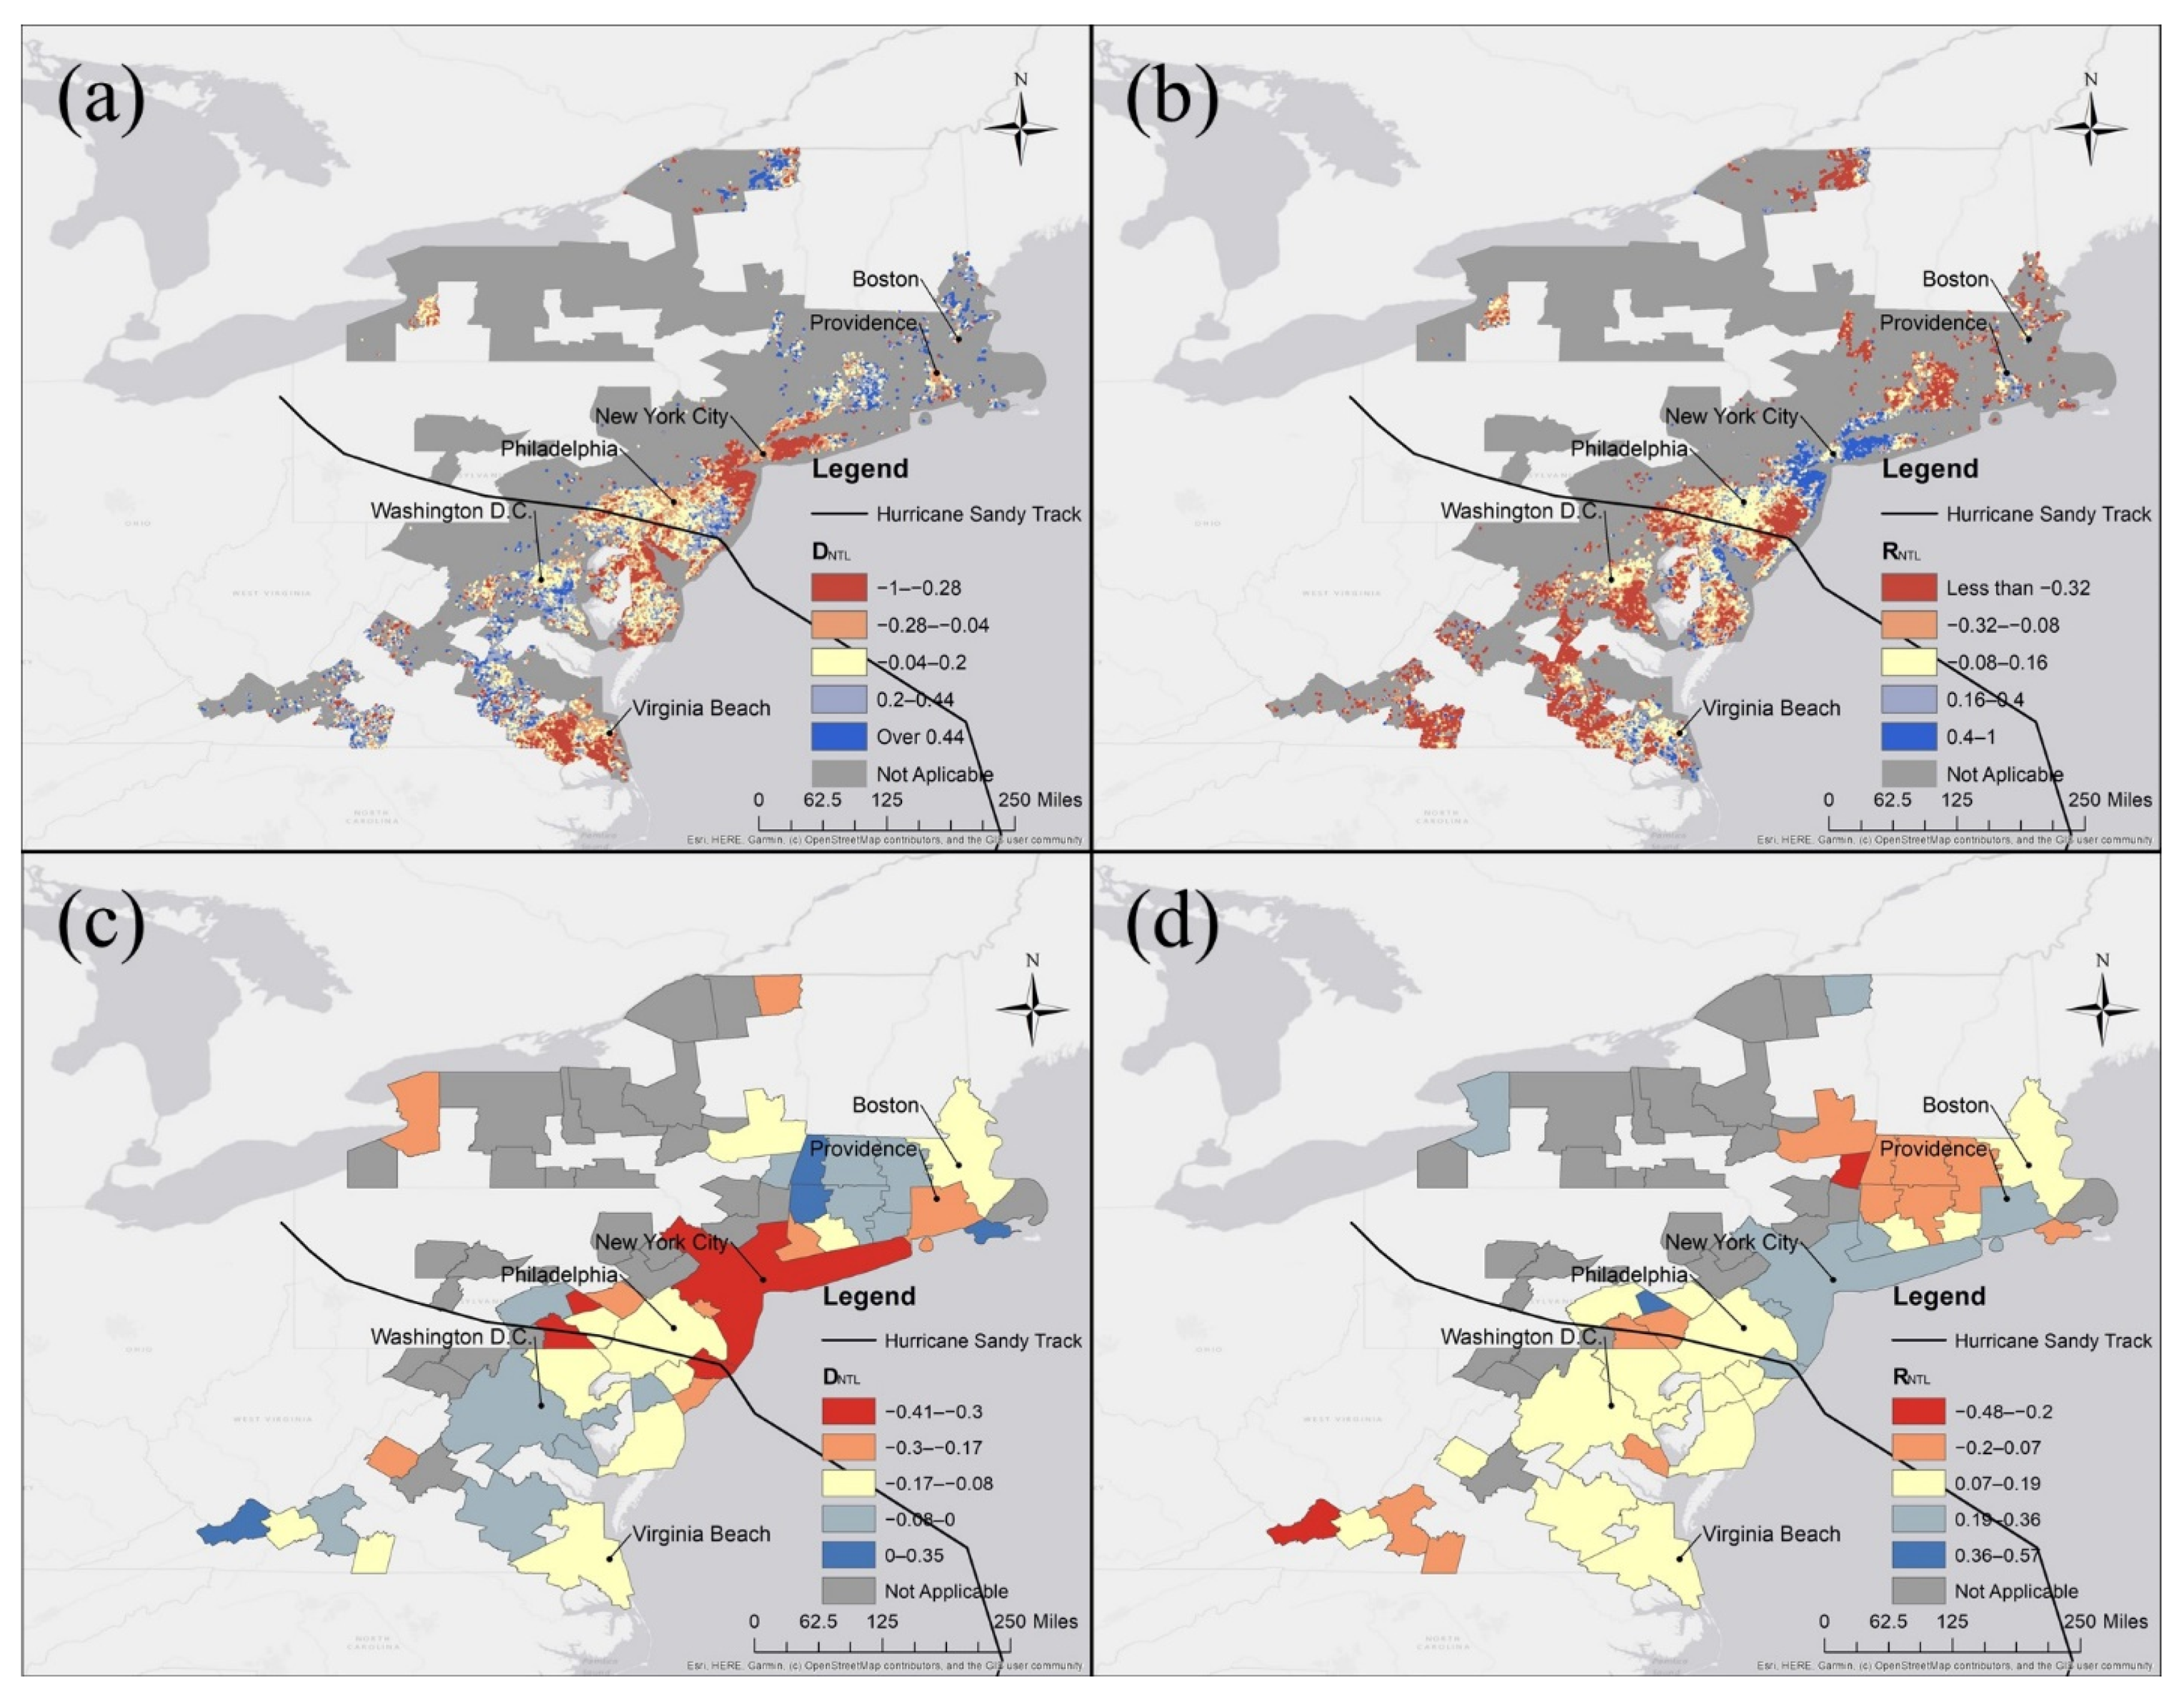
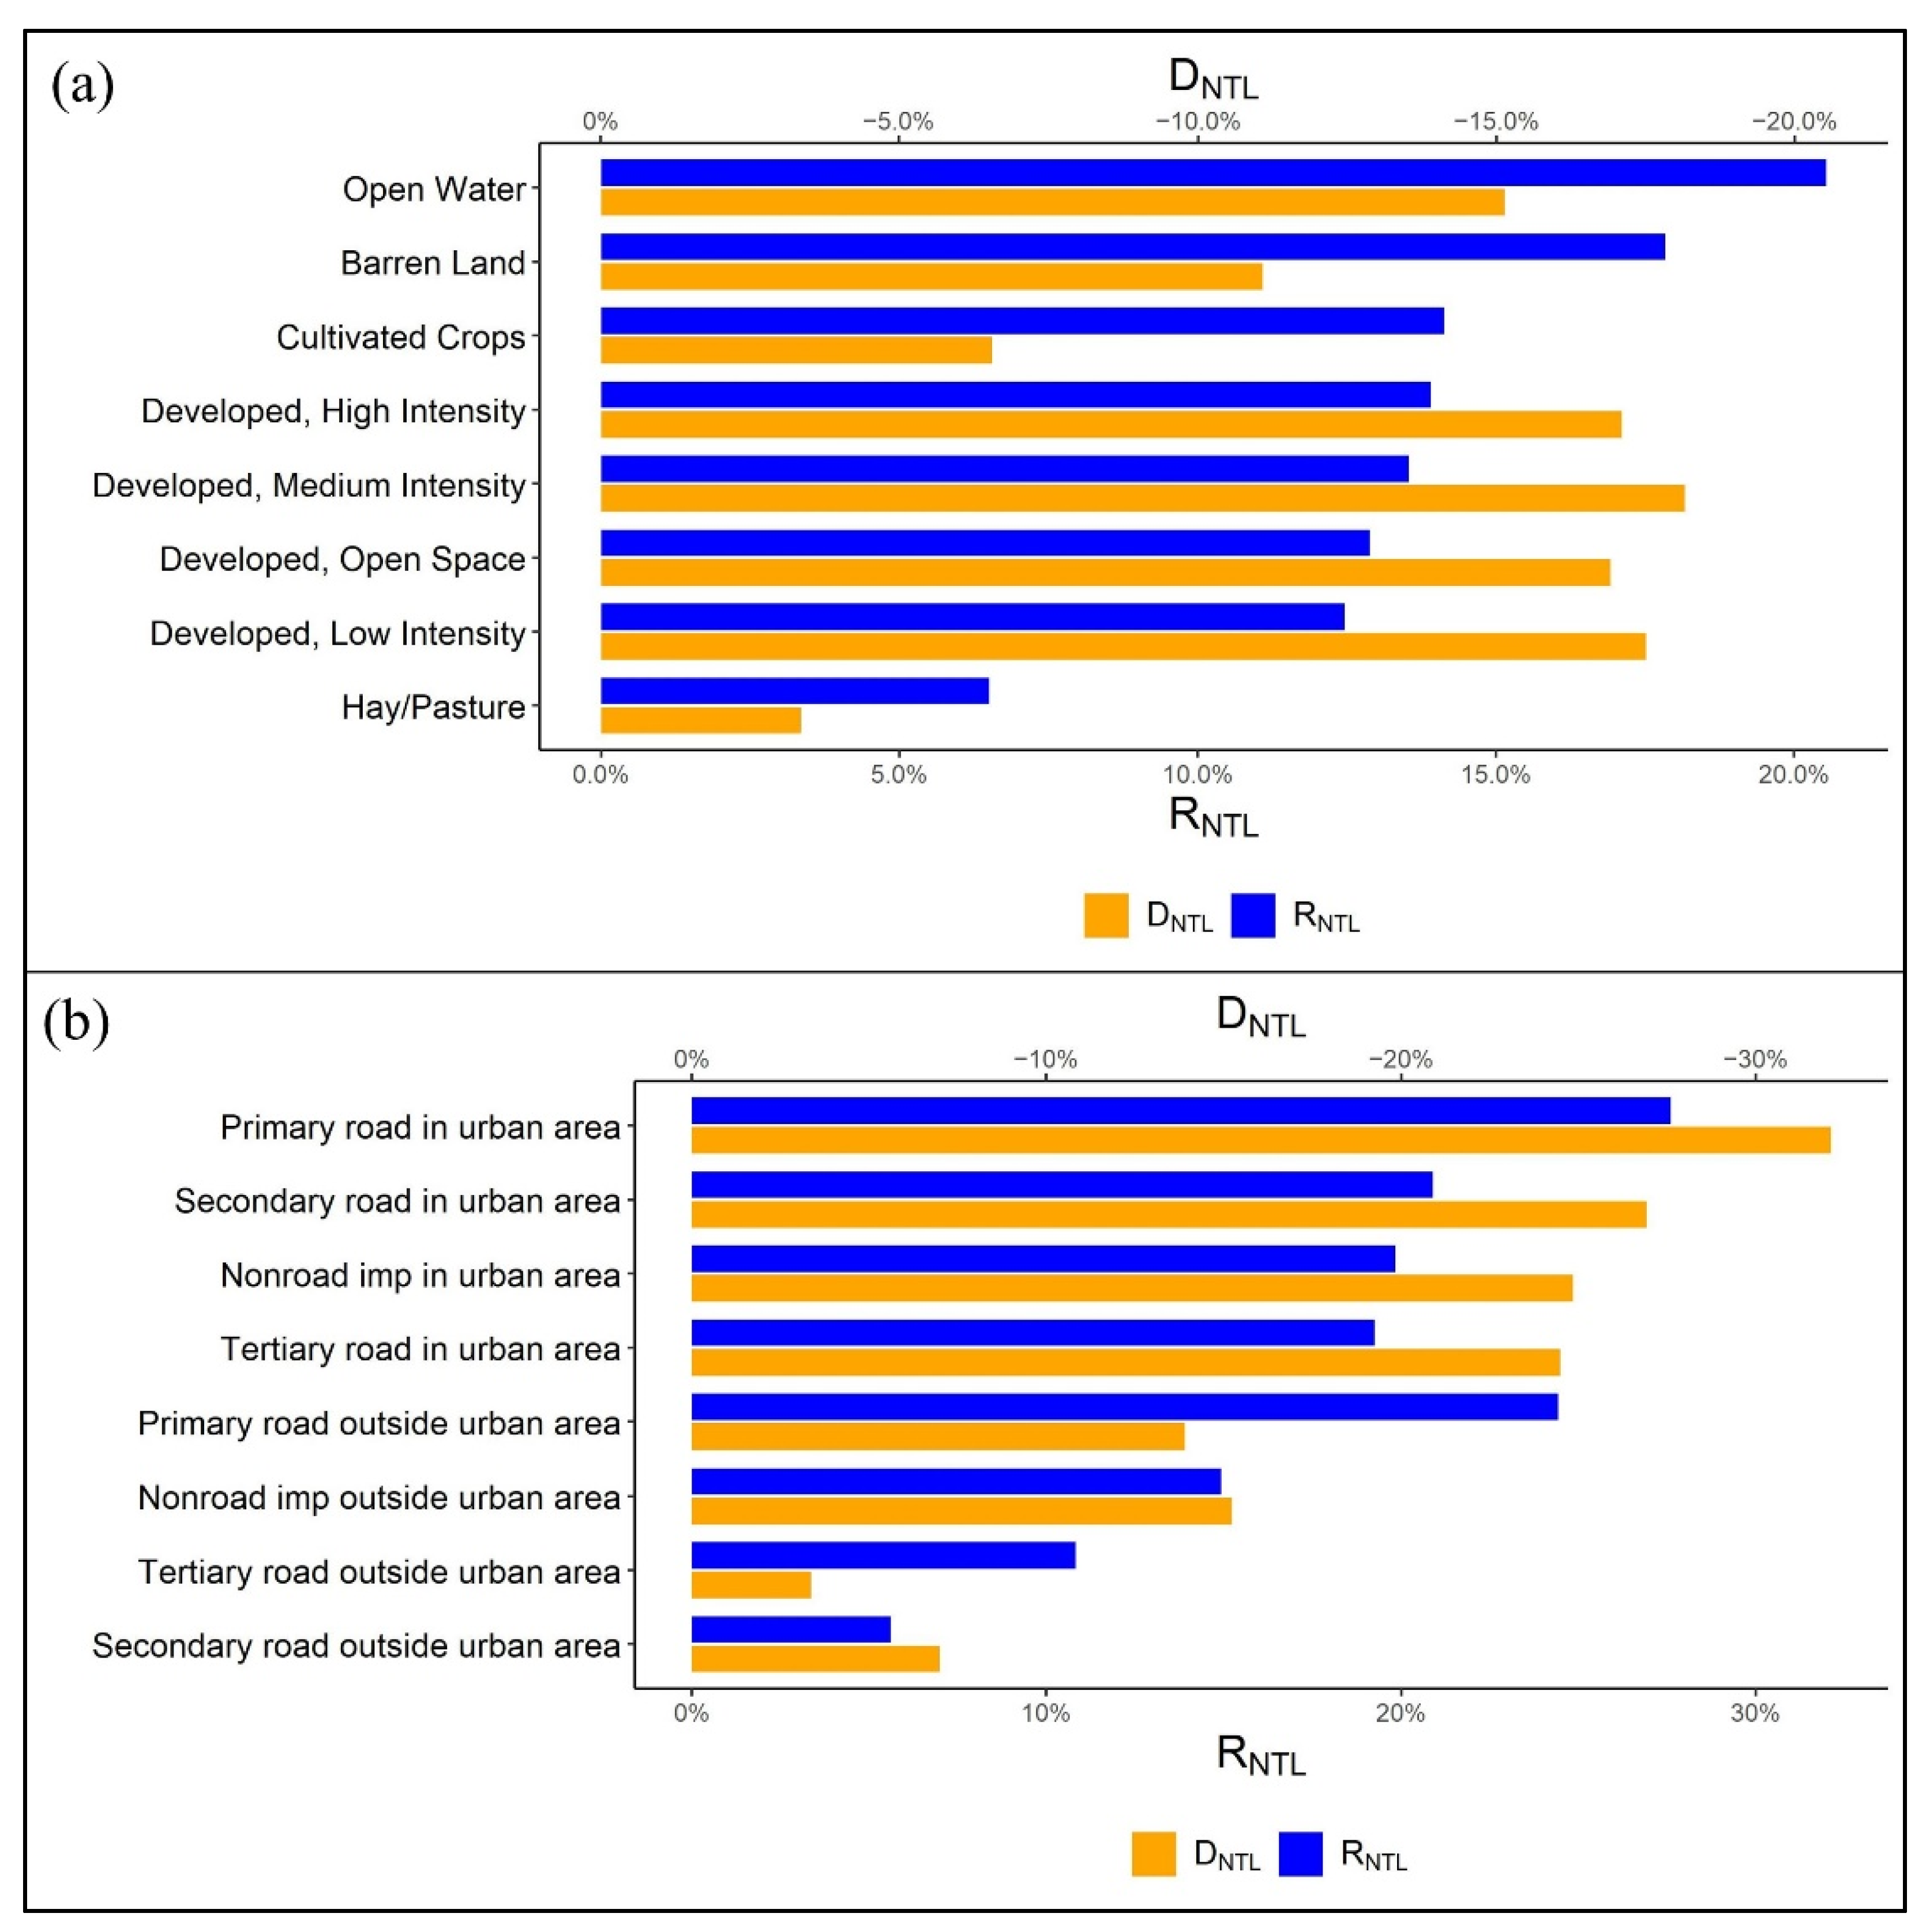
4.2. Spatial Patterns of NTL Change

The spatial patterns of D N T L and R N T L are shown at the pixel and CBSA levels in Figure 9. At the pixel level (Figure 9a,b), the New York/New Jersey Bight area has a large NTL disturbance (high absolute value of D N T L , red color) in the hurricane and a strong recovery after the hurricane (high R N T L ). This area is highly populated and close to the landfall location of Hurricane Sandy. As an exception, the center of New York City only had moderate NTL disturbance and recovery. Additionally, NTL disturbance can also be observed in Providence, Virginia Beach. At the CBSA level (Figure 9c,d), the metropolitan areas near New York City and Providence had a large NTL reduction (high absolute D N T L ), but the NTL in most areas soon recovered from the reduction (high R N T L ). Regions near Providence, Philadelphia, New York, Washington D.C., have recovered to the pre-disaster condition and can be considered resilient from this perspective. Several inland areas, such as Lancaster and York-Hannover CBSA in Pennsylvania, experienced NTL reduction and did not recover to their pre-disaster condition. As can be observed in Figure 9, the NTL disturbance shows different spatial patterns when aggregated in different spatial units. For example, areas near Virginia Beach had a large NTL reduction at the pixel level but had a small reduction at CBSA level. The variation in different spatial levels demonstrates the MAUP when analyzing the NTL changes.

4.3. Univariate Regression Results

Univariate regression analyses were conducted to associate the NTL variation with explanatory variables. The purpose of the regression analysis is to find underlying factors that can explain the spatial variation of NTL radiance observed in the spatial analysis (Section 4.2). Depending on the resolutions of the auxiliary data, regression results at all spatial scales are listed in Table 2. In this study, we consider p < 0.05 and R2 > 0.13 [59] as significant relations. Highlighted in bold font in Table 2, 6 of the total 36 regression models meet both criteria. First, a significant relation between NTL fluctuation ( D N T L and R N T L ) and wind speed is detected, indicating high wind speed caused a V-shape recovery pattern (low negative D N T L and high positive R N T L ) during the hurricane. This result suggests that large D N T L disturbance occurred in areas that experienced severe physical impacts from the hurricane. At the CBSA scale, regression analysis was conducted to associate NTL changes with Twitter data. Significant relations are detected between: (1) D N T L and the ratio of keyword ‘damage’, (2) D N T L   and the ratio of ‘sandy’, (3) R N T L and the ratio of ‘electric’. The first relation suggests that the NTL disturbance is a signal of property damage. The significant relation with the keyword “sandy” indicates areas experienced high NTL disturbance also have more people discussing the hurricane in Twitter. The relation between R N T L and keyword ‘electric’ may imply that electric outage or restoration is an important factor in the recovery process. These detected relations indicate that the NTL changes may reflect certain aspects of human activities related to the Twitter keywords. Moreover, a significant relation between D N T L and distance to the hurricane track was detected at the CBSA level, indicating that a higher NTL reduction was observed near the hurricane track. Due to low p-value or R2, the other 30 regression models do not show significant relations.
Finally, NTL metrics ( D N T L and R N T L ) were compared among different LULC types. Figure 10a shows that non-urban land cover types (open water, barren lands, cultivated crops) have a large radiance reduction (large absolute value of D N T L ) and relatively slow recovery (lower R N T L ). Urban areas, including high-, medium-, and low-intensity developed land, and open space had relatively small radiance reduction (small absolute D N T L ) but faster recovery (higher R N T L ). Among the four urban land uses, high-intensity developed area had the largest NTL reduction (largest absolute D N T L ) in the hurricane. In different imperviousness surfaces, primary and secondary roads had large radiance reduction (large absolute D N T L ) which may be caused by interrupted traffic (Figure 10b). The recovery rate of primary roads in urban areas is higher than primary roads in non-urban areas. Tertiary and secondary roads outside urban areas had little fluctuations (low absolute D N T L and low R N T L ). In general, roads within urban areas have shown a strong post-disaster recovery, while roads in rural areas take longer to recover.

5. Discussion

The analysis aims to evaluate the utility of NTL images as a potential data source to study community resilience. Compared with previous studies, this study has the following contributions. First, it demonstrates the utility of the new moonlight-adjusted Black Marble images (VNP46A2) in detecting short-term human dynamics in a disaster. Despite the advancements claimed by NASA, the utility of the new image product has not been tested in real disaster events. This study systematically documented the analytical workflow and noted potential issues of the new image product, which are of reference values for future studies. Second, this study uses the conceptual framework of recovery trajectory to quantify temporal patterns of NTL radiance in a disaster. This brings cutting-edge remote sensing techniques to resolve challenges in resilience assessment. The spatial analyses of disturbance ( D N T L ) and recovery ( R N T L ) revealed geographical disparities of human activities during the disaster, which provide novel insights into community recovery and resilience. We recognize the complexity of community resilience, which cannot be adequately measured using the two indicators. Instead, the study demonstrates the value of NTL images in providing timely and high-resolution data of human dynamics in disasters, which serves as an empirical grounding for developing and validating resilience measurement.

5.1. Interpretation of NTL Spatial Pattern

By comparing the disturbance ( D N T L ) and recovery rate ( R N T L ), the analysis revealed geographical disparities of recovery patterns in different CBSAs. In general, populated areas near the landfall location (including New York City) experienced a large disturbance but fast recovery, indicating the strong ability to bounce back in these areas. At the pixel level, the hurricane caused a large disturbance near the landfall location, including Ocean City in Maryland and Atlantic City in New Jersey. However, this region did not recover as fast as New York City. Several small CBSAs northeast to the landfall location (e.g., Springfield and Torrington in Connecticut and Pittsfield in Massachusetts) had a relatively smaller disturbance and recovery slower, which is possibly due to the impact of Nor’easter.
The analysis shows that the NTL metrics ( D N T L and R N T L ) are significantly correlated (p < 0.05 and R2 > 0.13) with 6 of the 36 variables, including wind speed, distance to hurricane, and ratios of keyword ‘sandy’, ‘damage’, and ‘electric’ in Twitter. Although the relatively low R2 suggests limited prediction power of the regression models, the detected significant relations provide insights to the potential factors causing the NTL changes. The significant relations of the NTL metrics with wind speed indicate that the NTL fluctuation is mainly attributed to the hazardous weather condition brought by the hurricane. This finding confirmed that damaging wind is one of the primary causes of hurricane-inflicted loss of life and property damage as documented in the literature [34,60,61,62]. Additionally, the high-wind areas are mostly located near the hurricane track, where the intensity of human activities were significantly reduced due to various reasons. For example, the largest NTL reduction is observed in the New York/New Jersey Bight area, which is a highly populated coastal area to the northeast of the landfall location. During the hurricane, a large population was evacuated from the predicted impact area, especially in New York City and surrounding cities in New Jersey [63]. Also, the hurricane has caused businesses and road closures, which lead to reduced visitations and traffic [64,65]. The evacuation and business closures are possibly the cause of NTL radiance reduction observed in urban areas. The relatively small NTL reduction in the center of New York City may reflect the local gathering of emergency responders [64]. The significant relation between NTL disturbance ( D N T L ) and the ratio of keyword ‘sandy’ demonstrates a direct link between social media activity and NTL disturbance. Intensive discussions about the hurricane on Twitter occurred in areas that experienced large NTL disturbance. The literature shows that Twitter data is an effective indicator of human dynamics in disasters [54,66,67]. The correlation between NTL and Twitter further confirms the observed NTL changes likely reflect socio-economic impacts instead of other factors. Specifically, NTL disturbance ( D N T L ) is significantly related to the ratio of keyword ‘damage’ in Twitter, which implies that the NTL radiance reduction may reflect damage to properties and infrastructures. Literature documented severe property damage in Ocean County in New Jersey [68], which is consistent with the large reduction of NTL observed in Figure 9a. The significant relation between the ratio of keyword ‘electric’ and NTL recovery ( R N T L ) implies that areas concerned about electric issues recovered more quickly. This result agrees with the literature that restoration of electric supply played an important role in community and business recovery [69,70]. Additionally, D N T L has a significant relation with distance to hurricane track at the CBSA level, which confirms that the NTL disturbance is related to hazardous conditions in the hurricane. Areas closer to hurricane track were likely to experience strong wind, storm surge, and flooding brought by the hurricane, which lead to reduced intensity of human activity (e.g., evacuation, road/business closure).
Despite the detected significant relations, further research is needed to build robust models to explain the underlying causes of the observed NTL changes. The relatively low R2 in the regression models may be attributed to insufficient high-quality images for continuous monitoring, as well as the lack of fine-resolution human dynamics data to compare with the NTL changes. Also, resampling the NTL data to the same scale of the exploratory variables may result in potential data loss or bias, thus affecting the model fitting. Future work is needed to ground-truthing the detected NTL patterns from other data sources, such as real-time traffic data [51], mobile phone tracking data [71], and survey data.
In general, larger disturbance (large absolute D N T L ) and faster recovery (large R N T L ) can be observed in urban land cover and roads. In contrast, most rural land cover and road types had smaller NTL changes (small absolute D N T L and small R N T L ) during the hurricane. This rural-urban disparity possibly indicates that NTL radiance is more sensitive to human dynamics in the populated area. Meanwhile, some rural areas in the state of Virginia, New York, and Connecticut still have not recovered to the pre-disaster condition on 17 November. The slow recovery potentially indicates low resilience in these rural areas. In addition to the large cities where public attention and resources are concentrated, more actions are needed to assist the recovery of rural areas that are often marginalized in disaster management [72,73].

5.2. Utility of the Black Marble Product in Disaster Monitoring

This study has attempted the use of new moonlight-adjusted NTL daily images to detect short-term recovery trajectories of human activities in Hurricane Sandy. Despite the limited high-quality images covering the study area during the hurricane, a V-shape pattern of NTL radiance has been detected in 82.1% of the studied CBSAs, which generally resemble the pattern of a recovery trajectory observed in other studies [33]. This result confirmed the utility of the daily Black Marble images in sensing disturbance and recovery of human activities in the hurricane. The remaining 12 CBSAs (17.9%) showing other patterns may be explained by a few possible reasons. First, these places were not impacted by the hurricane, and the NTL changes reflect normal activities (e.g., traffic congestion, public events, and power outage). Second, the larger in-disaster NTL can result from the evacuated population, which normally illuminated the evacuation sites and increase the local NTL. Third, inherent noise in Black Marble images, such as atmospheric reflection and lightning, may also introduce bias to the NTL radiance. Further investigations are needed to explain the real causes of the other patterns.
Despite the detected patterns of NTL changes, due to the characteristics of the Black Marble images, the analysis is still limited in the following aspects. First, the utility of daily NTL images is highly dependent on the atmospheric condition. Due to the cloudy sky during the hurricane, only images collected on some days have enough high-quality pixels covering the study area. Thus, the analysis is limited to three sampling points during the hurricane. Second, mosaicking images with different acquisition times may cause inconsistent NTL radiance in the study area. To overcome this issue, this study only selected days when the images were from a single scan, which ensures consistent NTL radiance over space. However, this selection criterion further reduces useable images for analysis. Ideally, the radiance inconsistency at different acquisition times can be calibrated before temporal analysis, which requires future work. Third, the influence of the other storm (Nor’easter Storm) affected the detected recovery pattern. Though dates around the Nor’easter are excluded in this study, NTL radiance at the post-disaster phase may be affected by the Nor’easter. The results interpreted in this study may reflect overlapped impacts and community responses in both disasters. In summary, these limitations indicate that the daily NTL images may not continuously provide high-quality data in hurricanes and flooding events when the atmospheric condition is not stable. Systematic data filtering, processing, and analysis are needed to develop valid analysis results. Instead, the daily NTL images may be more suited in monitoring disaster processes with a clear sky, such as an earthquake and tsunami. Although the moonlight-adjusted Black Marble Product brings advantages in resolution, data quality, and superior calibration algorithms, their applications need to be carefully designed according to specific disaster conditions.

5.3. Future Work

A few improvements in NTL products can be conducted in future studies. First, the resolution of current NTL data can be improved with additional data layers. Despite the 500 m (15 arc seconds) resolution of the Black Marble images is already an improvement from the older generation DMSP-OLS products, the pixel size is still too large to be precisely assigned to different land-use types or damaged structures, which creates difficulty to interpret the detected radiance changes. A possible solution is upsampling the NTL data to a finer resolution with additional data layers. For example, Zhao et al. (2018) upsampled the NTL image from 0.00833° (30 arc seconds, about 1 km) to 0.00416° (15 arc seconds, about 500 m) resolution by overlaying with geotagged social media data layers [74]; Román et al. (2019) upsampled the NTL image from 500 m (15 arc seconds) to 30 m resolution by overlaying with surface reflectance layers from Landsat 8 and Sentinel-2 [25]. Second, new techniques can be applied to make use of low-quality pixels in NTL images. In this study, only high-quality pixels were used to analyze the daily NTL changes, leading to the limited coverage of the disaster area. In future studies, low-quality pixels may be calibrated by simulating atmospheric refraction and interpolating using neighboring high-quality pixels. Including low-quality pixels in analysis can significantly increase the monitoring area to obtain continuous data about human dynamics in disaster areas. Third, the validation issue needs to be solved. Currently, the detected NTL patterns cannot be fully explained by the selected variables, thus the causes of fluctuation remain uncertain. In the future, the NTL radiance will be compared with additional types of data (e.g., traffic data, mobile phone tracking data, and survey data) to fully understand the relation between NTL fluctuation and community recovery and resilience. Additionally, through applications in more disaster events, the utility of NTL data for resilience assessment can be further tested and the analytical method can be refined.

6. Conclusions

This study evaluated the use of NASA’s new moonlight-adjusted Black Marble Products (SNPP-VIIRS VNP46A2) in detecting human activities during a major disaster (Hurricane Sandy). The study documented the analytical workflow from data collection, processing to data analysis and interpretation. The spatial analysis revealed the spatial variation of NTL radiance changes during the disaster. Univariate regression analyses were conducted to associate the NTL changes with auxiliary data, aiming to find explaining factors of the observed spatial variance. This study not only confirmed the merits of the NTL products in observing community recovery in disasters, but also identified issues that need to be resolved in future analysis. The findings and limitations discussed in this study recommend further research on associating additional ancillary datasets on environmental, socioeconomic, and demographic aspects. Overall, this study shows that daily NTL data is of great potential for exploring the impact on human activities during disasters and calls for more contributions in the methods and applications of daily SNPP-VIIRS NTL data. For broader implications, our framework on daily NTL data can be applied in other disasters and broader fields, such as detecting population movement, economic growth, and urbanization at both short-term and long-term scales.

Author Contributions

Conceptualization, J.X. and Y.Q.; Data curation, J.X.; Formal analysis, J.X.; Funding acquisition, Y.Q.; Methodology, J.X. and Y.Q.; Resources, J.X.; Supervision, Y.Q.; Visualization, J.X.; Writing—original draft, J.X.; Writing—review & editing, J.X. and Y.Q. All authors have read and agreed to the published version of the manuscript.

Funding

This article is based on work supported by two research grants from the U.S. National Science Foundation: one under the Coastlines and People (CoPe) Program (Award No. 2052063) and the other under the Methodology, Measurement & Statistics (MMS) Program (Award No. 2102019). Any opinions, findings, and conclusions or recommendations expressed in this material are those of the authors and do not necessarily reflect the views of the funding agencies.

Institutional Review Board Statement

Not applicable.

Informed Consent Statement

Not applicable.

Data Availability Statement

The data are freely available upon request.

Conflicts of Interest

The authors declare no conflict of interest.

References

  1. Adger, W.N. Social and ecological resilience: Are they related? Prog. Hum. Geogr. 2000, 24, 347–364. [Google Scholar] [CrossRef]
  2. Cai, H.; Lam, N.S.; Qiang, Y.; Zou, L.; Correll, R.M.; Mihunov, V. A synthesis of disaster resilience measurement methods and indices. Int. J. Disaster Risk Reduct. 2018, 31, 844–855. [Google Scholar] [CrossRef]
  3. Harte, E.W.; Childs, I.R.; Hastings, P.A. Imizamo Yethu: A Case Study of Community Resilience to Fire Hazard in an Informal Settlement Cape Town, South Africa. Geogr. Res. 2009, 47, 142–154. [Google Scholar] [CrossRef]
  4. Salvia, R.; Quaranta, G. Place-Based Rural Development and Resilience: A Lesson from a Small Community. Sustainability 2017, 9, 889. [Google Scholar] [CrossRef] [Green Version]
  5. Pfefferbaum, R.L.; Pfefferbaum, B.; Van Horn, R.L.; Klomp, R.W.; Norris, F.H.; Reissman, D.B. The communities advancing resilience toolkit (CART): An intervention to build community resilience to disasters. J. Public Health Manag. Pract. 2013, 19, 250–258. [Google Scholar] [CrossRef] [PubMed]
  6. Cutter, S.L.; Boruff, B.J.; Shirley, W.L. Social Vulnerability to Environmental Hazards. Soc. Sci. Q. 2003, 84, 242–261. [Google Scholar] [CrossRef]
  7. Cutter, S.L.; Burton, C.G.; Emrich, C.T. Disaster Resilience Indicators for Benchmarking Baseline Conditions. J. Homel. Secur. Emerg. Manag. 2010, 7, 51. [Google Scholar] [CrossRef]
  8. Peacock, W.G.; Brody, S.D.; Seitz, W.A.; Merrell, W.J.; Vedlitz, A.; Zahran, S.; Stickney, R. Advancing Resilience of Coastal Localities: Developing, Implementing, and Sustaining the Use of Coastal Resilience Indicators: A Final Report; Hazard Reduction and Recovery Center, Texas A&M University: College Station, TX, USA, 2010; pp. 1–148. [Google Scholar]
  9. Flanagan, B.E.; Gregory, E.W.; Hallisey, E.J.; Heitgerd, J.L.; Lewis, B. A Social Vulnerability Index for Disaster Management. J. Homel. Secur. Emerg. Manag. 2011, 8, 3. [Google Scholar] [CrossRef]
  10. Anderson, C.C.; Hagenlocher, M.; Renaud, F.G.; Sebesvari, Z.; Cutter, S.L.; Emrich, C.T. Comparing index-based vulnerability assessments in the Mississippi Delta: Implications of contrasting theories, indicators, and aggregation methodologies. Int. J. Disaster Risk Reduct. 2019, 39, 101128. [Google Scholar] [CrossRef] [Green Version]
  11. Cutter, S.L. The landscape of disaster resilience indicators in the USA. Nat. Hazards 2016, 80, 741–758. [Google Scholar] [CrossRef]
  12. Burton, C.G. A Validation of Metrics for Community Resilience to Natural Hazards and Disasters Using the Recovery from Hurricane Katrina as a Case Study. Ann. Assoc. Am. Geogr. 2015, 105, 67–86. [Google Scholar] [CrossRef]
  13. Alahmadi, M.; Mansour, S.; Martin, D.; Atkinson, P.M. An Improved Index for Urban Population Distribution Mapping Based on Nighttime Lights (DMSP-OLS) Data: An Experiment in Riyadh Province, Saudi Arabia. Remote Sens. 2021, 13, 1171. [Google Scholar] [CrossRef]
  14. Chen, X.; Nordhaus, W.D. Using luminosity data as a proxy for economic statistics. Proc. Natl. Acad. Sci. USA 2011, 108, 8589–8594. [Google Scholar] [CrossRef] [PubMed] [Green Version]
  15. Li, X.; Ge, L.; Chen, X. Detecting Zimbabwe’s Decadal Economic Decline Using Nighttime Light Imagery. Remote Sens. 2013, 5, 4551–4570. [Google Scholar] [CrossRef] [Green Version]
  16. Mohan, P.; Strobl, E. The short-term economic impact of tropical Cyclone Pam: An analysis using VIIRS nightlight satellite imagery. Int. J. Remote Sens. 2017, 38, 5992–6006. [Google Scholar] [CrossRef]
  17. Stevens, M.R.; Berke, P.R.; Song, Y. Creating disaster-resilient communities: Evaluating the promise and performance of new urbanism. Landsc. Urban Plan. 2010, 94, 105–115. [Google Scholar] [CrossRef]
  18. Long, F.; Zheng, L.; Song, Z. High-speed rail and urban expansion: An empirical study using a time series of nighttime light satellite data in China. J. Transp. Geogr. 2018, 72, 106–118. [Google Scholar] [CrossRef]
  19. Xie, Y.; Weng, Q. World energy consumption pattern as revealed by DMSP-OLS nighttime light imagery. GISci. Remote Sens. 2016, 53, 265–282. [Google Scholar] [CrossRef]
  20. Levin, N. The impact of seasonal changes on observed nighttime brightness from 2014 to 2015 monthly VIIRS DNB composites. Remote Sens. Environ. 2017, 193, 150–164. [Google Scholar] [CrossRef]
  21. Zhao, X.; Yu, B.; Liu, Y.; Yao, S.; Lian, T.; Chen, L.; Yang, C.; Chen, Z.; Wu, J. NPP-VIIRS DNB Daily Data in Natural Disaster Assessment: Evidence from Selected Case Studies. Remote Sens. 2018, 10, 1526. [Google Scholar] [CrossRef] [Green Version]
  22. Gillespie, T.W.; Frankenberg, E.; Chum, K.F.; Thomas, D. Night-time lights time series of tsunami damage, recovery, and economic metrics in Sumatra, Indonesia. Remote Sens. Lett. 2014, 5, 286–294. [Google Scholar] [CrossRef] [PubMed] [Green Version]
  23. Kohiyama, M.; Hayashi, H.; Maki, N.; Higashida, M.; Kroehl, H.W.; Elvidge, C.D.; Hobson, V.R. Early damaged area estimation system using DMSP-OLS night-time imagery. Int. J. Remote Sens. 2004, 25, 2015–2036. [Google Scholar] [CrossRef]
  24. Fan, X.; Nie, G.; Deng, Y.; An, J.; Zhou, J.; Li, H. Rapid detection of earthquake damage areas using VIIRS nearly constant contrast night-time light data. Int. J. Remote Sens. 2018, 40, 2386–2409. [Google Scholar] [CrossRef]
  25. Román, M.O.; Stokes, E.C.; Shrestha, R.; Wang, Z.; Schultz, L.; Carlo, E.A.S.; Sun, Q.; Bell, J.; Molthan, A.; Kalb, V.; et al. Satellite-based assessment of electricity restoration efforts in Puerto Rico after Hurricane Maria. PLoS ONE 2019, 14, e0218883. [Google Scholar] [CrossRef]
  26. Hultquist, C.; Simpson, M.; Cervone, G.; Huang, Q. Using nightlight remote sensing imagery and Twitter data to study power outages. In Proceedings of the 1st ACM SIGSPATIAL International Workshop on the Use of GIS in Emergency Management, Bellevue, WA, USA, 3–6 November 2015; ACM Press: Cambridge, MA, USA, 2015; pp. 1–6. [Google Scholar]
  27. Wang, Z.; Román, M.O.; Sun, Q.; Molthan, A.L.; Schultz, L.A.; Kalb, V.L. Monitoring disaster-related power outages using NASA black marble nighttime light product. ISPRS Int. Arch. Photogramm. Remote Sens. Spat. Inf. Sci. 2018, XLII-3, 1853–1856. [Google Scholar] [CrossRef] [Green Version]
  28. Wang, L.; Fan, H.; Wang, Y. An estimation of housing vacancy rate using NPP-VIIRS night-time light data and OpenStreetMap data. Int. J. Remote Sens. 2019, 40, 8566–8588. [Google Scholar] [CrossRef]
  29. Hou, J.; Ren, Z.; Wang, P.; Wang, J.; Gao, Y. Tsunami Assessment and Evacuation Analysis Using Remote Sensing for Tianya District of Sanya City, China. J. Earthq. Tsunami 2019, 13, 1941003. [Google Scholar] [CrossRef]
  30. Elvidge, C.D.; Baugh, K.E.; Zhizhin, M.; Hsu, F.-C. Why VIIRS data are superior to DMSP for mapping nighttime lights. Proc. Asia-Pac. Adv. Netw. 2013, 35, 62. [Google Scholar] [CrossRef] [Green Version]
  31. Forbes, D.J. Multi-scale analysis of the relationship between economic statistics and DMSP-OLS night light images. GISci. Remote Sens. 2013, 50, 483–499. [Google Scholar] [CrossRef]
  32. Román, M.O.; Wang, Z.; Sun, Q.; Kalb, V.; Miller, S.D.; Molthan, A.; Schultz, L.; Bell, J.; Stokes, E.C.; Pandey, B.; et al. NASA’s Black Marble nighttime lights product suite. Remote Sens. Environ. 2018, 210, 113–143. [Google Scholar] [CrossRef]
  33. Cao, C.; Shao, X.; Uprety, S. Detecting Light Outages After Severe Storms Using the S-NPP/VIIRS Day/Night Band Radiances. IEEE Geosci. Remote Sens. Lett. 2013, 10, 1582–1586. [Google Scholar] [CrossRef]
  34. Diakakis, M.; Deligiannakis, G.; Katsetsiadou, K.; Lekkas, E. Hurricane Sandy mortality in the Caribbean and continental North America. Disaster Prev. Manag. 2015, 24, 132–148. [Google Scholar] [CrossRef]
  35. Vickery, P.J.; Skerlj, P.F.; Lin, J.; Twisdale, L.A., Jr.; Young, M.A.; Lavelle, F.M. HAZUS-MH hurricane model methodology. II: Damage and loss estimation. Nat. Hazards Rev. 2006, 7, 94–103. [Google Scholar] [CrossRef] [Green Version]
  36. Bureau, U.S.C. (2016, December 7). Core-Based Statistical Areas. The United States Census Bureau. Available online: https://www.census.gov/topics/housing/housing-patterns/about/core-based-statistical-areas.html (accessed on 1 June 2021).
  37. The Website Services & Coordination Staff, U.S.C.B. (1994, March 1). Largest Urbanized Areas with Selected Cities and Metro Areas. U.S. Census. Available online: https://www.census.gov/dataviz/visualizations/026/ (accessed on 1 June 2021).
  38. Román, M.O.; Wang, Z.; Shrestha, R.; Yao, T.; Kalb, V. Black Marble User Guide Version 1.0; NASA: Washington, DC, USA, 2019.
  39. Blake, E.S.; Kimberlain, T.B.; Berg, R.J.; Cangialosi, J.P.; Beven, J.L. Tropical Cyclone Report: Hurricane Sandy; National Hurricane Center: Miami, FL, USA, 2013; Volume 12, pp. 1–10. [Google Scholar]
  40. United States. Department of Housing and Urban Development. (2013). Hurricane Sandy Damage Estimates by Block Group, 2012. [Shapefile]. United States. Department of Housing and Urban Development. Available online: https://earthworks.stanford.edu/catalog/stanford-jp095bg5089 (accessed on 1 June 2021).
  41. Vicino, T.J.; Hanlon, B.; Short, J.R. Megalopolis 50 Years On: The Transformation of a City Region. Int. J. Urban Reg. Res. 2007, 31, 344–367. [Google Scholar] [CrossRef]
  42. Multi-Resolution Land Characteristics (MRLC) Consortium. Available online: http://www.mrlc.gov (accessed on 26 May 2019).
  43. Homer, C.; Dewitz, J.; Jin, S.; Xian, G.; Costello, C.; Danielson, P.; Gass, L.; Funk, M.; Wickham, J.; Stehman, S.; et al. Conterminous United States land cover change patterns 2001–2016 from the 2016 National Land Cover Database. ISPRS J. Photogramm. Remote Sens. 2020, 162, 184–199. [Google Scholar] [CrossRef]
  44. Jin, S.; Homer, C.; Yang, L.; Danielson, P.; Dewitz, J.; Li, C.; Zhu, Z.; Xian, G.; Howard, D. Overall Methodology Design for the United States National Land Cover Database 2016 Products. Remote Sens. 2019, 11, 2971. [Google Scholar] [CrossRef] [Green Version]
  45. Wickham, J.D.; Stehman, S.V.; Gass, L.; Dewitz, J.; Fry, J.A.; Wade, T.G. Accuracy assessment of NLCD 2006 land cover and impervious surface. Remote Sens. Environ. 2013, 130, 294–304. [Google Scholar] [CrossRef]
  46. Xian, G.; Homer, C.; Dewitz, J.; Fry, J.; Hossain, N.; Wickham, J. The change of impervious surface area between 2001 and 2006 in the conterminous United States. Photogramm. Eng. Remote Sens. 2011, 77, 758–762. [Google Scholar]
  47. Yang, L.; Huang, C.; Homer, C.G.; Wylie, B.; Coan, M.J. An approach for mapping large-area impervious surfaces: Synergistic use of Landsat-7 ETM+ and high spatial resolution imagery. Can. J. Remote Sens. 2003, 29, 230–240. [Google Scholar] [CrossRef]
  48. Qiang, Y.; Huang, Q.; Xu, J. Observing community resilience from space: Using nighttime lights to model economic disturbance and recovery pattern in natural disaster. Sustain. Cities Soc. 2020, 57, 102115. [Google Scholar] [CrossRef]
  49. Bruneau, M.; Chang, S.E.; Eguchi, R.T.; Lee, G.C.; O’Rourke, T.D.; Reinhorn, A.M.; Shinozuka, M.; Tierney, K.; Wallace, W.A.; Von Winterfeldt, D. A Framework to Quantitatively Assess and Enhance the Seismic Resilience of Communities. Earthq. Spectra 2003, 19, 733–752. [Google Scholar] [CrossRef] [Green Version]
  50. Koliou, M.; van de Lindt, J.W.; McAllister, T.P.; Ellingwood, B.R.; Dillard, M.; Cutler, H. State of the research in community resilience: Progress and challenges. Sustain. Resilient Infrastruct. 2020, 5, 131–151. [Google Scholar] [CrossRef]
  51. Qiang, Y.; Xu, J. Empirical assessment of road network resilience in natural hazards using crowdsourced traffic data. Int. J. Geogr. Inf. Sci. 2020, 34, 2434–2450. [Google Scholar] [CrossRef]
  52. Vugrin, E.D.; Turnquist, M.A.; Brown, N.J. Optimal recovery sequencing for enhanced resilience and service restoration in transportation networks. Int. J. Crit. Infrastruct. 2014, 10, 218–246. [Google Scholar] [CrossRef] [Green Version]
  53. White, R.K.; Edwards, W.C.; Farrar, A.; Plodinec, M.J. A Practical Approach to Building Resilience in America’s Communities. Am. Behav. Sci. 2014, 59, 200–219. [Google Scholar] [CrossRef]
  54. Zou, L.; Lam, N.S.N.; Cai, H.; Qiang, Y. Mining Twitter Data for Improved Understanding of Disaster Resilience. Ann. Am. Assoc. Geogr. 2018, 108, 1422–1441. [Google Scholar] [CrossRef]
  55. Hutto, C.; Gilbert, E. Vader: A parsimonious rule-based model for sentiment analysis of social media text. In Proceedings of the International AAAI Conference on Web and Social Media, Ann Arbor, MI, USA, 1–4 June 2014; Volume 8. [Google Scholar]
  56. Ribeiro, F.N.; Araújo, M.; Gonçalves, P.; Gonçalves, M.A.; Benevenuto, F. SentiBench—A benchmark comparison of state-of-the-practice sentiment analysis methods. EPJ Data Sci. 2016, 5, 1. [Google Scholar] [CrossRef] [Green Version]
  57. Shelton, T.; Poorthuis, A.; Graham, M.; Zook, M. Mapping the data shadows of Hurricane Sandy: Uncovering the sociospatial dimensions of ‘big data’. Geoforum 2014, 52, 167–179. [Google Scholar] [CrossRef]
  58. Xu, J.; Qiang, Y. Analysing Information Diffusion in Natural Hazards using Retweets—A Case Study of 2018 Winter Storm Diego. Ann. GIS 2021, 1–15. [Google Scholar] [CrossRef]
  59. Cohen, J. A power primer. Psychol. Bull. 1992, 112, 155–159. [Google Scholar] [CrossRef]
  60. Rappaport, E.N. Loss of Life in the United States Associated with Recent Atlantic Tropical Cyclones. Bull. Am. Meteorol. Soc. 2000, 81, 2065–2073. [Google Scholar] [CrossRef] [Green Version]
  61. Schmidlin, T.W. Human fatalities from wind-related tree failures in the United States, 1995–2007. Nat. Hazards 2008, 50, 13–25. [Google Scholar] [CrossRef]
  62. Yeo, S.W.; Blong, R.J. Fiji’s worst natural disaster: The 1931 hurricane and flood. Disasters 2010, 34, 657–683. [Google Scholar] [CrossRef]
  63. Brown, S.; Parton, H.; Driver, C.; Norman, C. Evacuation During Hurricane Sandy: Data from a Rapid Community Assessment. PLoS Curr. 2016, 8. [Google Scholar] [CrossRef] [PubMed] [Green Version]
  64. Li, J.; Ozbay, K.; Bartin, B. Effects of Hurricanes Irene and Sandy in New Jersey: Traffic patterns and highway disruptions during evacuations. Nat. Hazards 2015, 78, 2081–2107. [Google Scholar] [CrossRef]
  65. Wang, Q.; Taylor, J.E. Quantifying Human Mobility Perturbation and Resilience in Hurricane Sandy. PLoS ONE 2014, 9, e112608. [Google Scholar] [CrossRef]
  66. Zou, L.; Lam, N.S.N.; Shams, S.; Cai, H.; Meyer, M.A.; Yang, S.; Lee, K.; Park, S.-J.; Reams, M.A. Social and geographical disparities in Twitter use during Hurricane Harvey. Int. J. Digit. Earth 2019, 12, 1300–1318. [Google Scholar] [CrossRef]
  67. Mihunov, V.V.; Lam, N.S.N.; Zou, L.; Wang, Z.; Wang, K. Use of Twitter in disaster rescue: Lessons learned from Hurricane Harvey. Int. J. Digit. Earth 2020, 13, 1454–1466. [Google Scholar] [CrossRef]
  68. Sagara, E. (2012, November 18). Hurricane Sandy’s Destruction: Aerial Assessment Shows Nearly 72K Buildings Damaged IN N.J. Available online: https://www.nj.com/news/2012/11/hurricane_sandys_destruction_a.html (accessed on 1 June 2021).
  69. Sandalow, D. Hurricane Sandy and Our Energy Infrastructure; US Department of Energy: Washington, DC, USA, 2012.
  70. Burger, J.; Gochfeld, M. Perceptions of personal and governmental actions to improve responses to disasters such as SuperstormSandy. Environ. Hazards 2014, 13, 200–210. [Google Scholar] [CrossRef]
  71. Shaw, S.-L.; Tsou, M.-H.; Ye, X. Editorial: Human dynamics in the mobile and big data era. Int. J. Geogr. Inf. Sci. 2016, 30, 1687–1693. [Google Scholar] [CrossRef]
  72. Pongponrat, K.; Ishii, K. Social vulnerability of marginalized people in times of disaster: Case of Thai women in Japan Tsunami 2011. Int. J. Disaster Risk Reduct. 2018, 27, 133–141. [Google Scholar] [CrossRef]
  73. Farquhar, S.; Dobson, N. Community and university participation in disaster-relief recovery: An example from eastern North Carolina. J. Community Pract. 2004, 12, 203–217. [Google Scholar] [CrossRef]
  74. Zhao, N.; Zhang, W.; Liu, Y.; Samson, E.L.; Chen, Y.; Cao, G. Improving Nighttime Light Imagery With Location-Based Social Media Data. IEEE Trans. Geosci. Remote Sens. 2018, 57, 2161–2172. [Google Scholar] [CrossRef]
Figure 1. VIIRS image tiles covering the study area.
Remotesensing 13 04128 g001
Figure 2. Daily average nighttime lights in Tile h10v04 from 1 October 2012 to 30 November 2012.
Remotesensing 13 04128 g002
Figure 3. The conceptual framework of recovery trajectories and sampling time points used in this study.
Remotesensing 13 04128 g003
Figure 4. High-quality pixel coverage during Hurricane Sandy (2012) in the northeastern United States, where the red color indicates high-quality pixels, the black background is the study area (i.e., 66 CBSAs in the Northeastern US), and the green boxes indicate dates selected.
Remotesensing 13 04128 g004
Figure 5. (a) NTL on 8 November in Tile h09v04 and h10v04 with the acquisition time as background (b) NTL radiance on 8 November in Tile h09v04 and Tile h10v04, which shows a clear cut-off line.
Remotesensing 13 04128 g005
Figure 6. The acquisition time of NTL during Hurricane Sandy (2012) in the Northeastern United States. Blue dashed lines indicate dates with dual acquisition time. Green lines indicate dates with single acquisition time, which were used to represent pre-, in-, and post-disaster periods.
Remotesensing 13 04128 g006
Figure 7. Flowchart of the analysis workflow.
Remotesensing 13 04128 g007
Figure 8. NTL radiance changes in 39 CBSAs in the Northeastern United States in the pre-, in-, and post-disaster periods: (a) NTL changes in a single plot (same scale in the y-axis); (b) NTL changes are shown in separate plots (different scales in the y-axis), CBSA name and state abbreviation is attached to the header of each plot to the right.
Remotesensing 13 04128 g008
Figure 9. Choropleth maps of NTL fluctuation in Hurricane Sandy (2012) in the Northeastern US: (a) D N T L by pixel; (b) R N T L by pixel; (c) D N T L by CBSA; (d) R N T L by CBSA.
Remotesensing 13 04128 g009
Figure 10. (a) Negative D N T L and R N T L in NLCD 2011 Land Cover classification; (b) Negative D N T L and R N T L in NLCD 2011 Developed Imperviousness Descriptor classification.
Remotesensing 13 04128 g010
Table 1. Description of auxiliary data.
VariableDescriptionSpatial ScaleData Source
Wind SpeedRecorded maximum surface wind speed from1-km bufferNOAA
Housing DamagePercentage of the non-seasonal damaged housing unitsBlock groupHUD
Tweet RatioRatios of tweets including specific keywords, such as ‘hurricane’, ‘sandy’, etc.CBSAArchive.org
Distance to HurricaneEuclidean distance of the place from the hurricane trajectoryPixelNWS
Land Use & Land CoverLand Cover and Developed Imperviousness DescriptorLand-use typesMRLC
Table 2. Relationship between the reduction in NTL radiance and auxiliary damage data.
Independent Variable D N T L R N T L Spatial ScaleSample #
βR2RMSEPr (>|t|)βR2RMSEPr (>|t|)
Wind speed−0.0120.2410.1980.000 ***0.0140.1820.2780.002 **1-km buffer387
Percentage of damaged housing units−0.0010.0060.230.019 *0.0010.0010.3780.285Block group909
Tweet ratio (disaster-related to all)−0.7940.0160.1340.4491.2600.0280.1570.308CBSA39
Tweet ratio (keyword: close)1.5190.0020.1340.7942.7620.0040.1590.689CBSA39
Tweet ratio (keyword: damage)−46.6170.1710.1230.009 **38.7600.0840.1520.073CBSA39
Tweet ratio (keyword: electric)−86.3940.0960.1280.055135.2880.1680.1450.009 **CBSA39
Tweet ratio (keyword: evacuate)−21.1210.0410.1320.2153.7440.0010.1590.854CBSA39
Tweet ratio (keyword: flood)−16.2330.0430.1320.20513.7270.0220.1570.368CBSA39
Tweet ratio (keyword: hurricane)−3.8650.0090.1340.57612.1300.0600.1540.132CBSA39
Tweet ratio (keyword: outage)4.6480.0020.1340.798−28.4880.0480.1550.181CBSA39
Tweet ratio (keyword: rain)−10.8510.0890.1280.0658.4840.0390.1560.229CBSA39
Tweet ratio (keyword: sandy)−19.5190.1570.1240.012 *20.0130.1180.1500.032 *CBSA39
Tweet ratio (keyword: storm)1.2890.0040.1340.7072.2770.0090.1590.575CBSA39
Tweet ratio (keyword: wind)−16.7540.0340.1320.26324.1950.0500.1550.170CBSA39
Average sentiment (total tweets)−0.4290.0040.1340.690−0.5790.0060.1590.649CBSA39
Average sentiment (disaster tweets)−0.0514.05 × 10−40.1350.903−0.1860.0040.1590.708CBSA39
Distance to hurricane2.32 × 10−70.0010.7770.000 ***−3.05 × 10−70.0020.8700.000 ***Pixel67793
Distance to hurricane3.58× 10−70.1560.1240.013 *−3.12 × 10−70.0840.1520.073CBSA39
*** p < 0.001, ** p < 0.01, * p < 0.05.
Publisher’s Note: MDPI stays neutral with regard to jurisdictional claims in published maps and institutional affiliations.

