Article

A Novel Approach for Forest Fragmentation Susceptibility Mapping and Assessment: A Case Study from the Indian Himalayan Region

1
Field Science Center for Northern Biosphere, Hokkaido University, Sapporo 060-0809, Japan
2
Graduate School of Environmental Science, Hokkaido University, Sapporo 060-0810, Japan
3
Faculty of Environmental Earth Science, Hokkaido University, Sapporo 060-0810, Japan
*
Author to whom correspondence should be addressed.
Remote Sens. 2021, 13(20), 4090; https://doi.org/10.3390/rs13204090
Submission received: 30 August 2021 / Revised: 8 October 2021 / Accepted: 8 October 2021 / Published: 13 October 2021
(This article belongs to the Special Issue Remote Sensing for Mountain Ecosystems)

Abstract

:
An estimation of where forest fragmentation is likely to occur is critically important for improving the integrity of the forest landscape. We prepare a forest fragmentation susceptibility map for the first time by developing an integrated model and identify its causative factors in the forest landscape. Our proposed model is based upon the synergistic use of the earth observation data, forest fragmentation approach, patch forests, causative factors, and the weight-of-evidence (WOE) method in a Geographical Information System (GIS) platform. We evaluate the applicability of the proposed model in the Indian Himalayan region, a region of rich biodiversity and environmental significance in the Indian subcontinent. To obtain a forest fragmentation susceptibility map, we used patch forests as past evidence of completely degraded forests. Subsequently, we used these patch forests in the WOE method to assign the standardized weight value to each class of causative factors tested by the Variance Inflation Factor (VIF) method. Finally, we prepare a forest fragmentation susceptibility map and classify it into five levels: very low, low, medium, high, and very high and test its validity using 30% randomly selected patch forests. Our study reveals that around 40% of the study area is highly susceptible to forest fragmentation. This study identifies that forest fragmentation is more likely to occur if proximity to built-up areas, roads, agricultural lands, and streams is low, whereas it is less likely to occur in higher altitude zones (more than 2000 m a.s.l.). Additionally, forest fragmentation will likely occur in areas mainly facing south, east, southwest, and southeast directions and on very gentle and gentle slopes (less than 25 degrees). This study identifies Himalayan moist temperate and pine forests as being likely to be most affected by forest fragmentation in the future. The results suggest that the study area would experience more forest fragmentation in the future, meaning loss of forest landscape integrity and rich biodiversity in the Indian Himalayan region. Our integrated model achieved a prediction accuracy of 88.7%, indicating good accuracy of the model. This study will be helpful to minimize forest fragmentation and improve the integrity of the forest landscape by implementing forest restoration and reforestation schemes.

Graphical Abstract

1. Introduction

Forests are particularly significant, as they provide goods and services such as fuel, timber, food, bioproducts, greenhouse gas regulation, air, water supply, carbon storage, nutrient cycling, and genetic and species diversity, which are essential to the support of life [1,2]. In the Indian Himalayan region, forests are among the most diverse and dominant land-covers and have been recognized as having vital benefits in socio-economic development and biodiversity conservation [3,4]. Furthermore, forests play a vital role in maintaining river water flow during the dry seasons, controlling erosion on the slope, replenishing groundwater, and supporting agriculture in the Indian Himalayan region. Forests are mainly used for fuelwood and fodder, timber for construction, livestock grazing, and medicinal and recreational purposes in the Indian Himalayan region [5,6,7,8,9]. However, a literature review revealed that forest fragmentation due to forest conversion and loss had caused severe degradation of the forest landscape and loss of the rich biodiversity of the Indian Himalayan region [10,11,12,13,14,15,16,17]. Previous studies have also highlighted that land use and cover changes lead to forest fragmentation [18,19,20,21]. The process of forest fragmentation due to human activities such as built-up expansion, agriculture expansion, infrastructure development, illegal logging, and shifting cultivation have been identified as the most dominant causative factors in the Indian Himalayan region [18,19,20,21]. At the same time, these human activities contribute to the decline of species and genetic diversity, habitat destruction, downsizing of the protected areas, and restrictions of wildlife behavior and mobility [22,23,24]. Not surprisingly, the Indian Himalayan region is prone to different types of natural hazards such as landslides, floods, and forest fires [25]. These natural hazards cause tree mortality and forest fragmentation and may lead to further forest degradation in the future. However, the forest fragmentation caused by natural hazards is still poorly understood in this region. The fragile nature of the Indian Himalayan region, coupled with increasing anthropogenic activities, poses a severe threat to the forest landscape. That is why forest cover has been under pressure from both natural and anthropogenic drivers in the Indian Himalayan region.
Forest fragmentation is a form of habitat fragmentation in which a wide forest area or contiguous forest is separated or broken down into relatively smaller isolated patches of the forest known as forest fragments or forest remnants [26,27,28,29,30,31]. Forest fragmentation is among the major threats to forest landscape integrity, natural habitat, protected area, and forest structure and function, leading to loss of biodiversity richness and forest ecosystem goods and services [10,11,12,13,14,15,16,17,18,19,20,21]. For example, the conversion of natural forest to agriculture and other land use leading to forest fragmentation. As a result, the available wildlife habitat is shrinking and poses a severe threat to terrestrial biodiversity [22,23,24]. The negative effects of forest fragmentation depend primarily on the forest patch size, isolation, and forest edge, and the consequences may vary at a different spatial scale or local, regional, and global level [26,27,28,29,30,31]. A recent study revealed that sources of carbon emissions are increasing at forest edges due to forest fragmentation across the globe [32]. It should also be noted that natural hazards such as forest fire, landslide, and flood events are increasing across the globe, which is also contributing to tree mortality and forest fragmentation from local to global scale. However, very few studies have investigated the relationship between natural hazards and forest fragmentation [21,33]. Therefore, it is vital to understand the changes in spatio-temporal patterns of forest fragmentation caused by both anthropogenic and natural drivers in order to achieve proper forest management and effective land-use planning at different scales or levels.

Why Forest Fragmentation Susceptibility Mapping?

We define forest fragmentation susceptibility as an estimation of where forest fragmentation is likely to occur. It is an estimation of patch forests and causative factors as determined by the degree of anthropogenic and natural drivers. In the recent past, many studies have been carried out on landscape fragmentation using multiple landscape metrics (landscape indices) in many parts of India and globally at different scales. Many researchers have also performed studies related to the spatial patterns of forest fragmentation in India and globally. For example, the Indian Institute of Remote Sensing (IIRS), Indian Space Research Organization (ISRO), Dehradun, India, has published landscape fragmentation mapping for national assessment based on satellite remote sensing data using landscape metrics at landscape level on a 1:20,000 scale in a GIS platform [34,35]. This landscape fragmentation map is now available on the Indian Biodiversity Information system (www.bisindia.org/, data accessed on 17 March 2021) web portal. However, there is no future forest fragmentation mapping to our knowledge in biodiversity-rich regions like the Indian Himalayas. Therefore, it is very vital to identify the areas where forest fragmentation is likely to occur and investigate which causative factors are likely to cause forest fragmentation at different spatial scales or at local, regional, and global levels. It is also essential to map and analyze where the forest landscape is not free from anthropogenic and natural drivers to improve the integrity of forest landscapes so that rational reforestation, forest restoration, and afforestation schemes can be applied.
Generally, previous studies have addressed the influence of forest fragmentation changes on forest landscape, either through edge effects, identifying patch size, or through examining the forest fragmentation process by a multiple landscape metrics analysis, or just classifying forest fragmentation patterns on forest landscape level [17,18,19,20,34,35]. However, there is no factor-based estimation on where forest fragmentation is likely to occur. The application of landscape metrics is limited and sensitive to distribution, resolution, and scale [36,37,38,39,40,41,42,43,44,45,46]. Considering the limitations of the landscape metrics, Riitters et al. [28] and Vogt et al. [47] laid an important foundation for mapping of landscape fragmentation patterns, i.e., forest fragmentation patterns at the pixel level [48]. The use of earth observation data and the capability of GIS-based software have expanded the capabilities of mapping and analyzing the landscape fragmentation at the pixel level. Thus, by avoiding the uncertainty faced in landscape metrics and taking advantage of mapping landscape fragmentation at pixel-level using earth observation data:
(1)
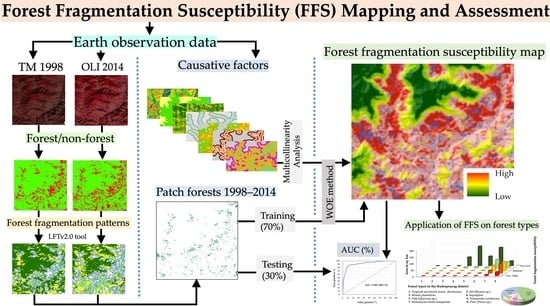
we prepare a forest fragmentation susceptibility map for the first time by developing an integrated model,
(2)
we identify causative factors of forest fragmentation in the forest landscape, and
(3)
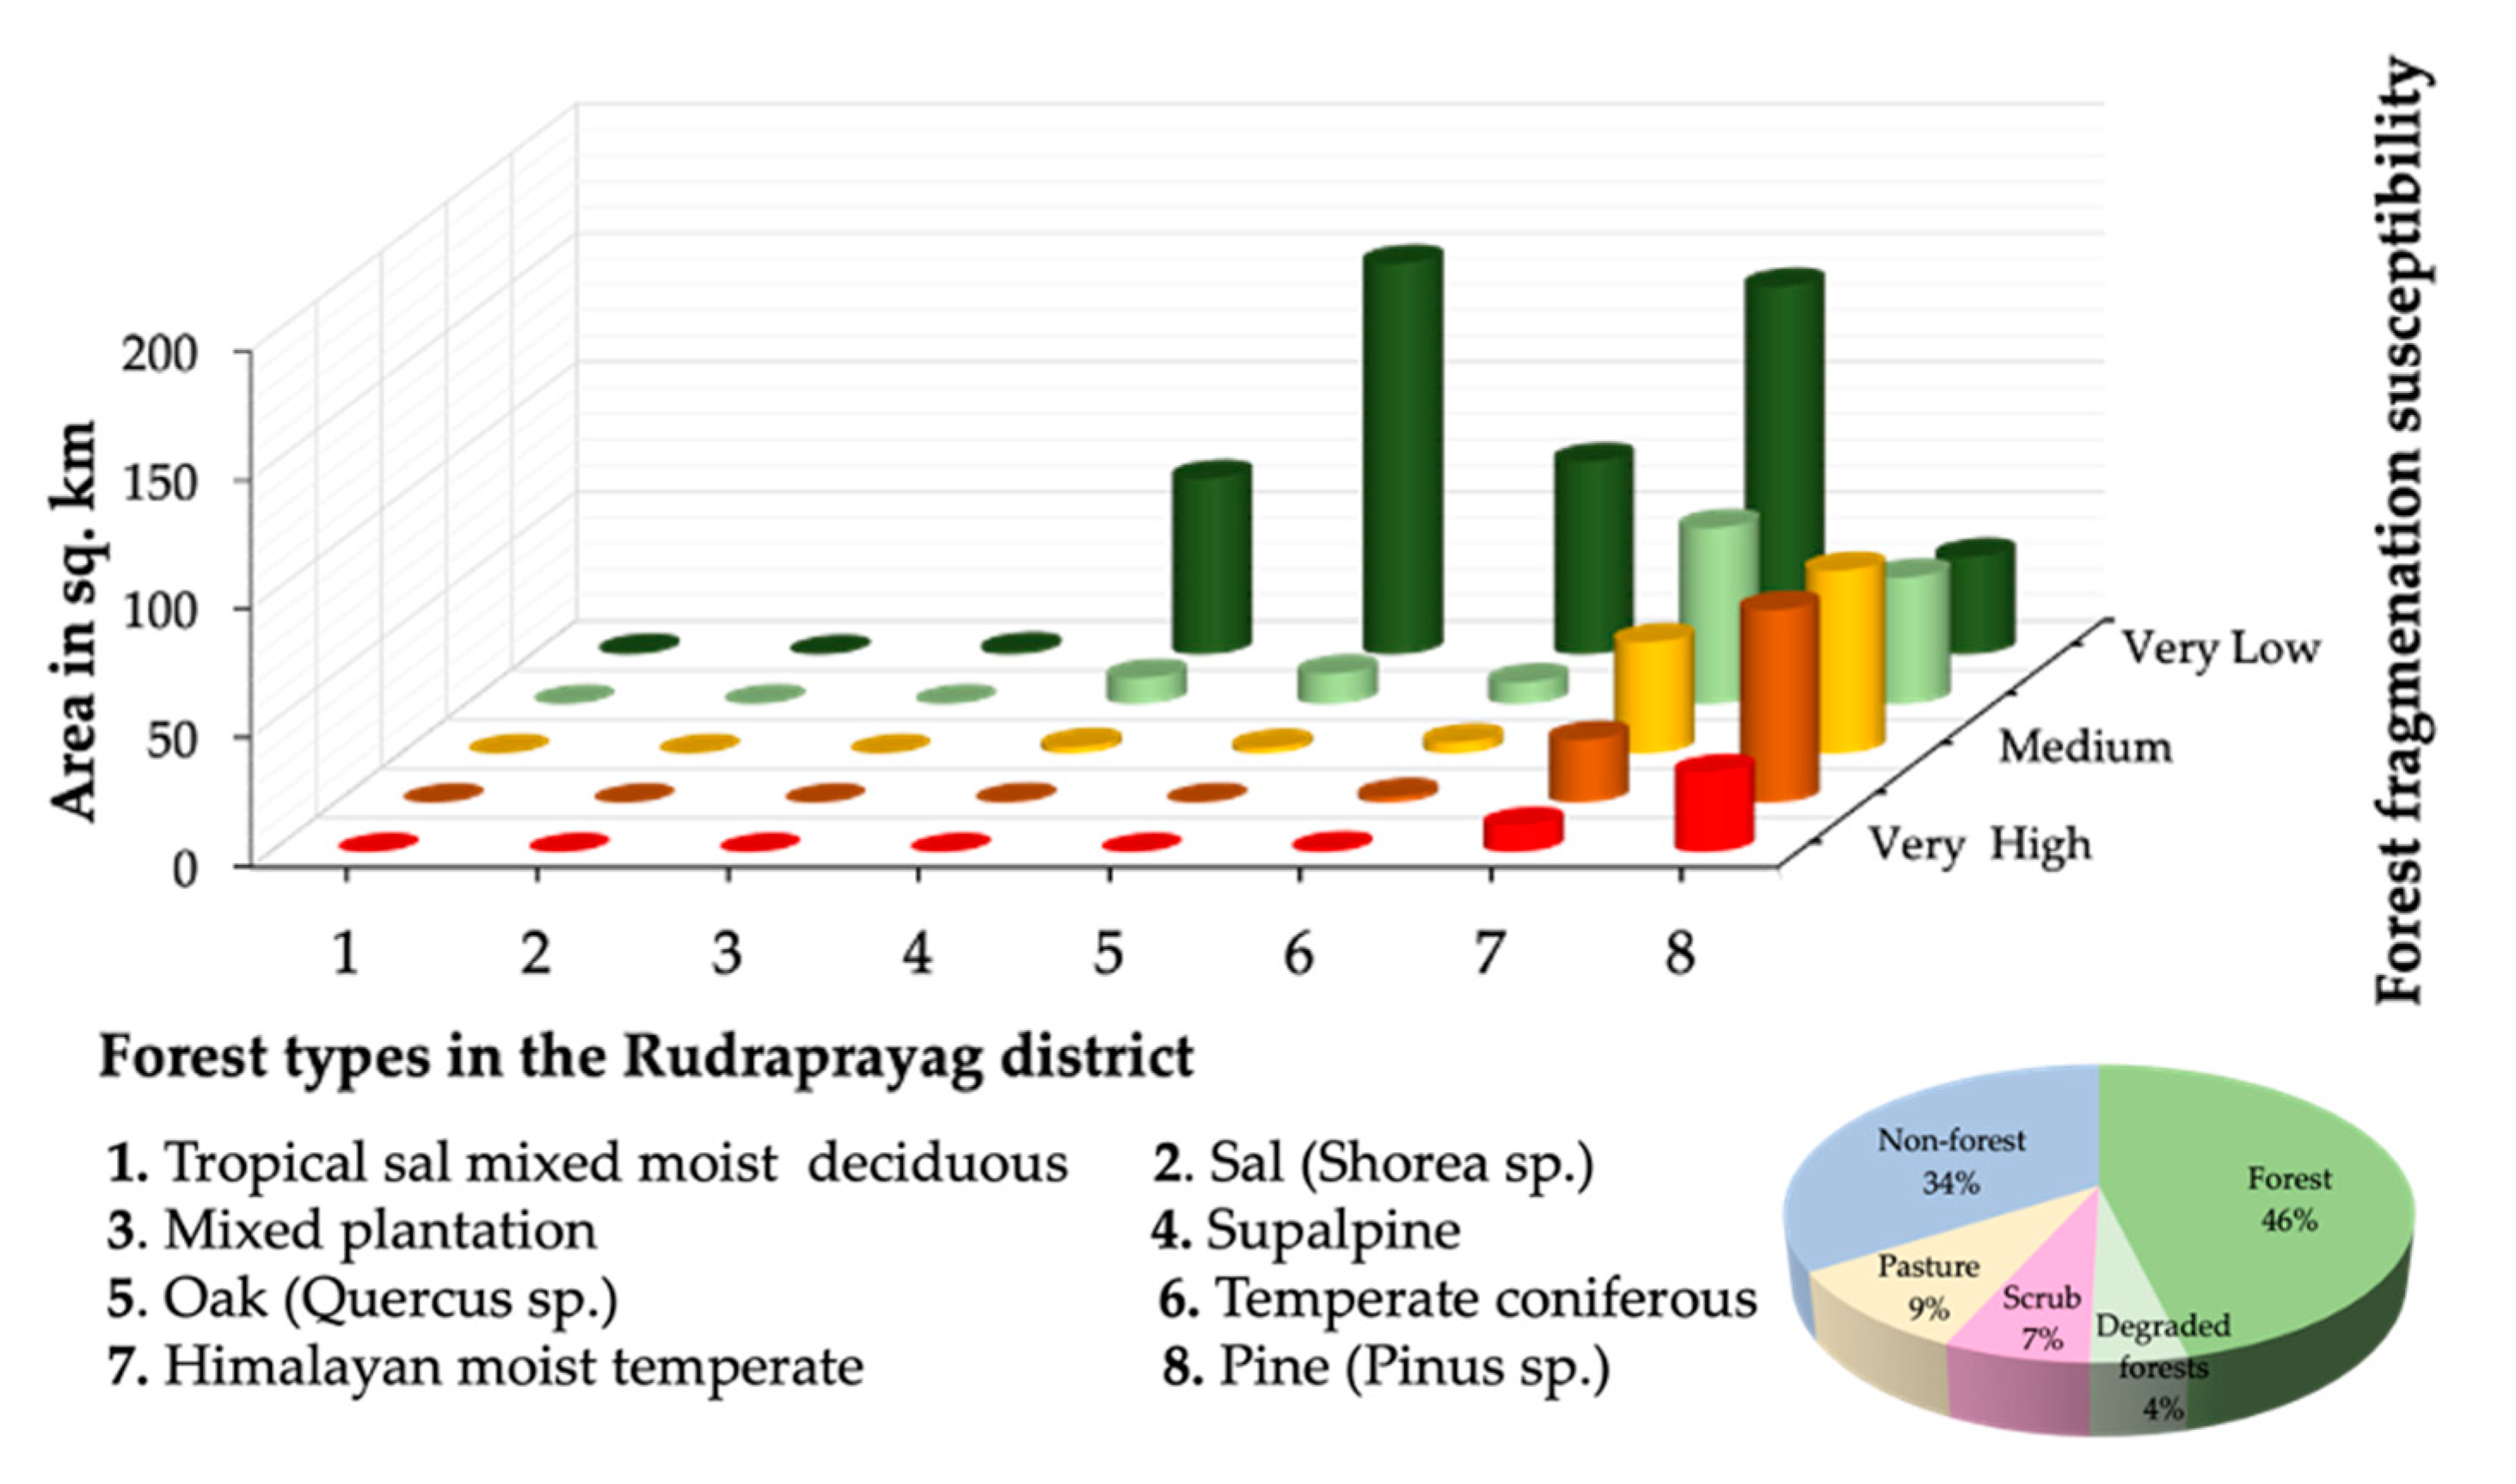
as an application of our proposed model, we identify which forest types are most susceptible to forest fragmentation in the study area.
Hence, our research is the first step towards understanding the likelihood of forest fragmentation due to various anthropogenic and natural causative factors, which also avoids the uncertainty faced in landscape metrics. This factor-based estimation of forest fragmentation is critically essential for improving the integrity of the forest landscape and essential for long-term forest management strategy. Thus, this forest fragmentation susceptibility map will fill the necessary gap to minimize forest fragmentation and improve the integrity of the forest landscape in the Indian Himalayan region.

2. Materials and Methods
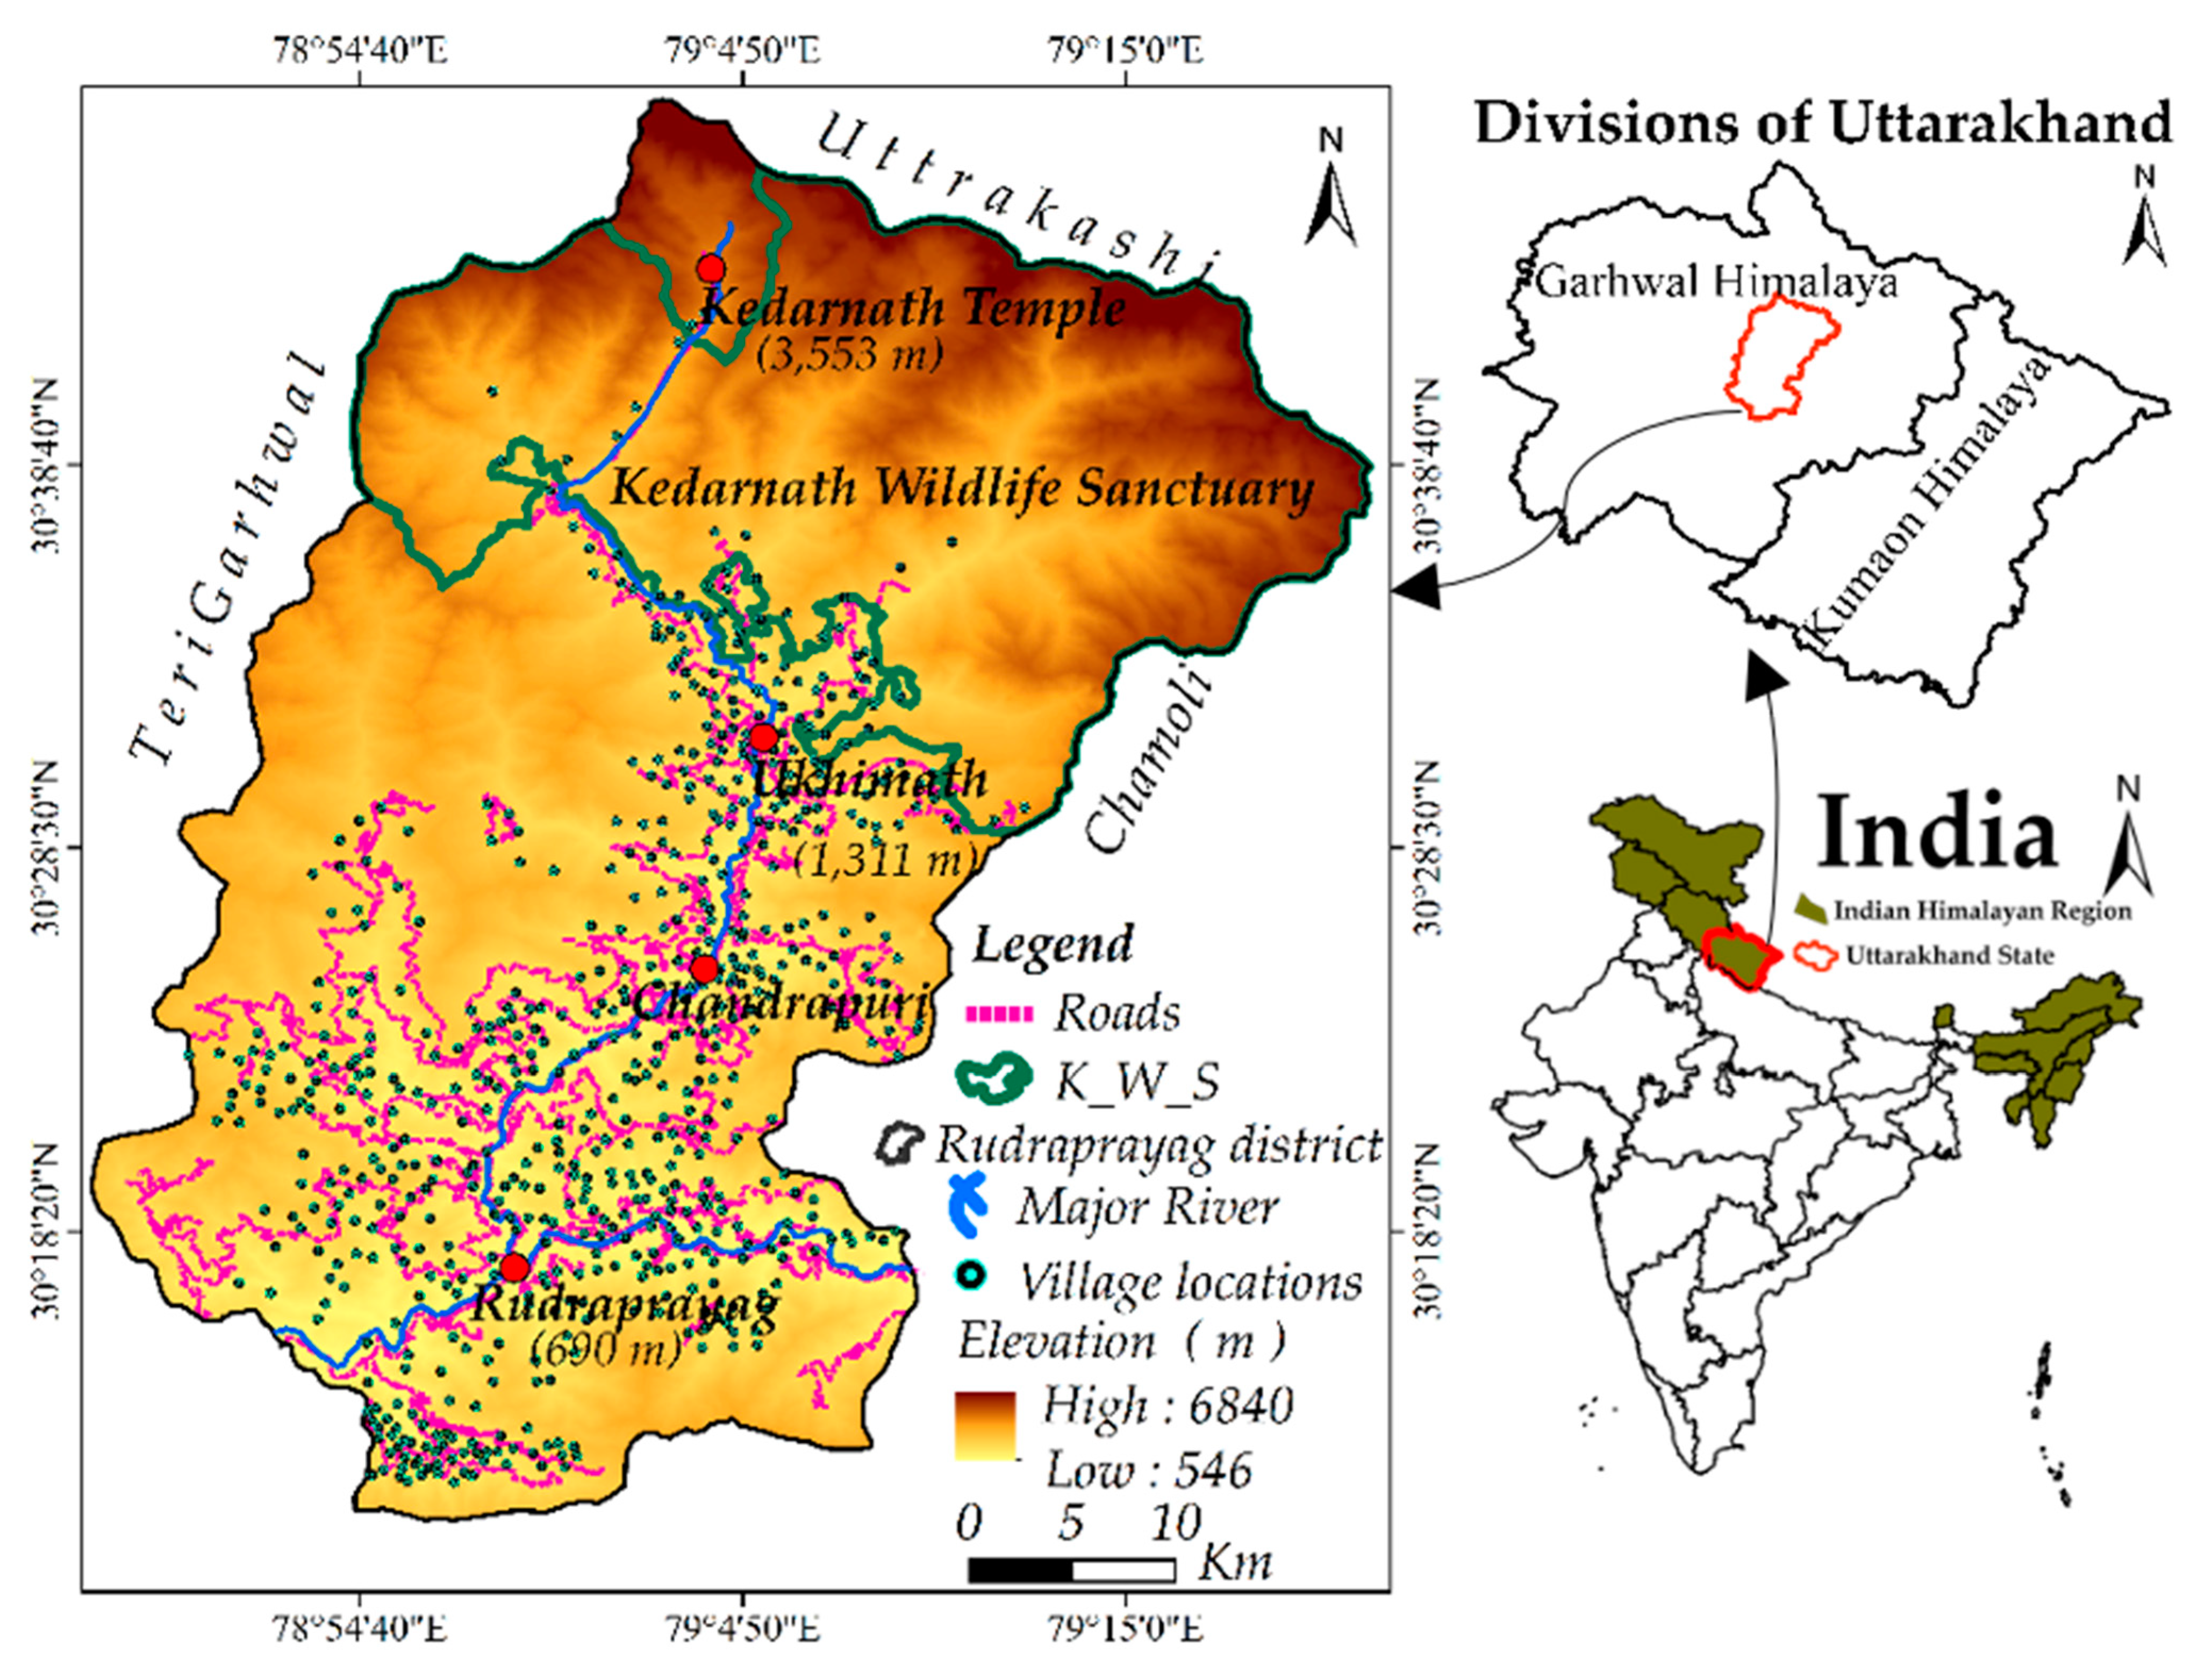
2.1. Study Area

The Rudraprayag district was selected as a case study and is situated in the Garhwal Himalaya division of Uttarakhand state and a part of the Himalayan region of India (Figure 1) [49]. The Rudraprayag district lies between 30°12′58″ N to 30°48′47″ N latitude and 78°50′07″ E to 79°22′34″ E longitude. It has a geographical area of around 1936.06 km2 (Figure 1). Due to mountainous terrain, the altitude ranges from 546 to 6840 m above sea level (Figure 1), and rainfall is highly variable depending upon the altitude [21,50]. The study area receives most of the rainfall occurs during the monsoon season (Jun to Sep). The mean air temperature varies from 8.32 to 13.15 °C in winter (Dec to Feb) and from 27.75 to 32.54 °C in summer (May to Jul) [21,50]. The major river of the district is the Mandakini, with a catchment area of 1641.64 km2, which originates from the Chorabari glacier (3895 m a.s.l.). The Rudraprayag district has a total population of 242,000, and the majority of the population (92%) lives in rural areas [21]. The population density of Rudraprayag district as per the 2001 and 2011 census of India was 115 persons per km2 and 119 persons per km2, respectively [21]. Since this study area is highly mountainous, most of the agricultural activities are concentrated in river terraces, gentle hill slopes, and intermountain valleys. The major field crops and horticulture of the Rudraprayag district are paddy, wheat, gram, lentil, mustard, fruits, vegetables, and flowers [51]. Most of the people are engaged in agricultural activities to earn their livelihood. Therefore, agricultural activities are the primary livelihood source of the people living in the Rudraprayag district. The Rudraprayag district is famous for its important pilgrimage site (Kedarnath Temple) in India (Figure 1). Therefore, the pilgrimage site offers additional livelihood option for the local people during the tourist season (May to Jun and Sep to Oct) in the Rudraprayag district [21,52].
The Kedarnath wildlife sanctuary is the largest protected area in the Western Himalayas of India [53]. It covers approximately 975 km2, of which 645 km2 is situated in the upper part of the Rudraprayag district (Figure 1). It had been a notified reserve forest between 1916 and 1920. Its status was changed to a sanctuary on 21 January 1972, and it is now designated under management category IV (Managed Nature Reserve) of the International Union for Conservation of Nature (IUCN). The major forest types and species of the Kedarnath wildlife sanctuary are Himalayan moist temperate, subalpine, tropical sal mixed moist deciduous, temperate coniferous, sal (Shore asp.), pine (Pinus sp.), and oak (Quercus) [52,53,54]. The southern boundary of the Kedarnath wildlife sanctuary is facing pressure because the inhabitants of over 175 villages depend substantially on its resources for fuelwood, fodder, medicinal plants, and pastures for livestock grazing [21,52,53]. According to IUCN, the sanctuary has covered 44.4% to 48.8% of the forest, 7.7% comprises alpine meadows and scrub, 42.1% covers rocky or under glaciers and permanent snow, and 1.5% of forested areas have been degraded [21].

2.2. Data Source and Processing

The data source and processing for forest fragmentation susceptibility mapping are divided into two groups: (1) patch forests and (2) causative factors of forest fragmentation.

2.2.1. Patch Forest

Previous studies have indicated that patch forests are degraded forests because these patch forests are isolated from the core forest area and situated in non-forest areas, which are not healthy forests for the forest landscape and ecosystem [21,47,48]. Therefore, we used patch forest as evidence of degraded forest to apply the weight-of-evidence (WOE) method. These patch forests were derived from the forest fragmentation pattern map, as described below. Afterward, patch forests were re-sampled to the same resolution (30 m) with the standard Universal Transverse Mercator (UTM) 44N zone. Point location of patch forests could ignore the size of the existing patch forests and might yield a biased result. Therefore, each pixel of the patch forests was used to reduce these uncertainties. At first, we acquired two cloud-free satellite images with the same 30-m resolution for the years 1998 and 2014 from Landsat 5 (TM) and Landsat 8 (OLI), respectively, which are freely available on the USGS (United States Geological Survey) website. Then, to prepare the land cover maps, we applied supervised classification with the maximum likelihood method. Afterward, these land cover maps were reclassified into forest and non-forest maps. Subsequently, we used the Landscape Fragmentation tool (LFT v2.0), a tool developed by Centre for Land Use Education and Research (CLEAR) at the University of Connecticut [47,48], on these re-classified land cover maps to prepare the forest fragmentation pattern maps. Finally, patch forests were extracted from these forest fragmentation pattern maps for the years 1998 and 2014 using the ArcGIS spatial analyst tool. A detailed description of the database and preparation of forest fragmentation patterns maps is given in our previous work [21].

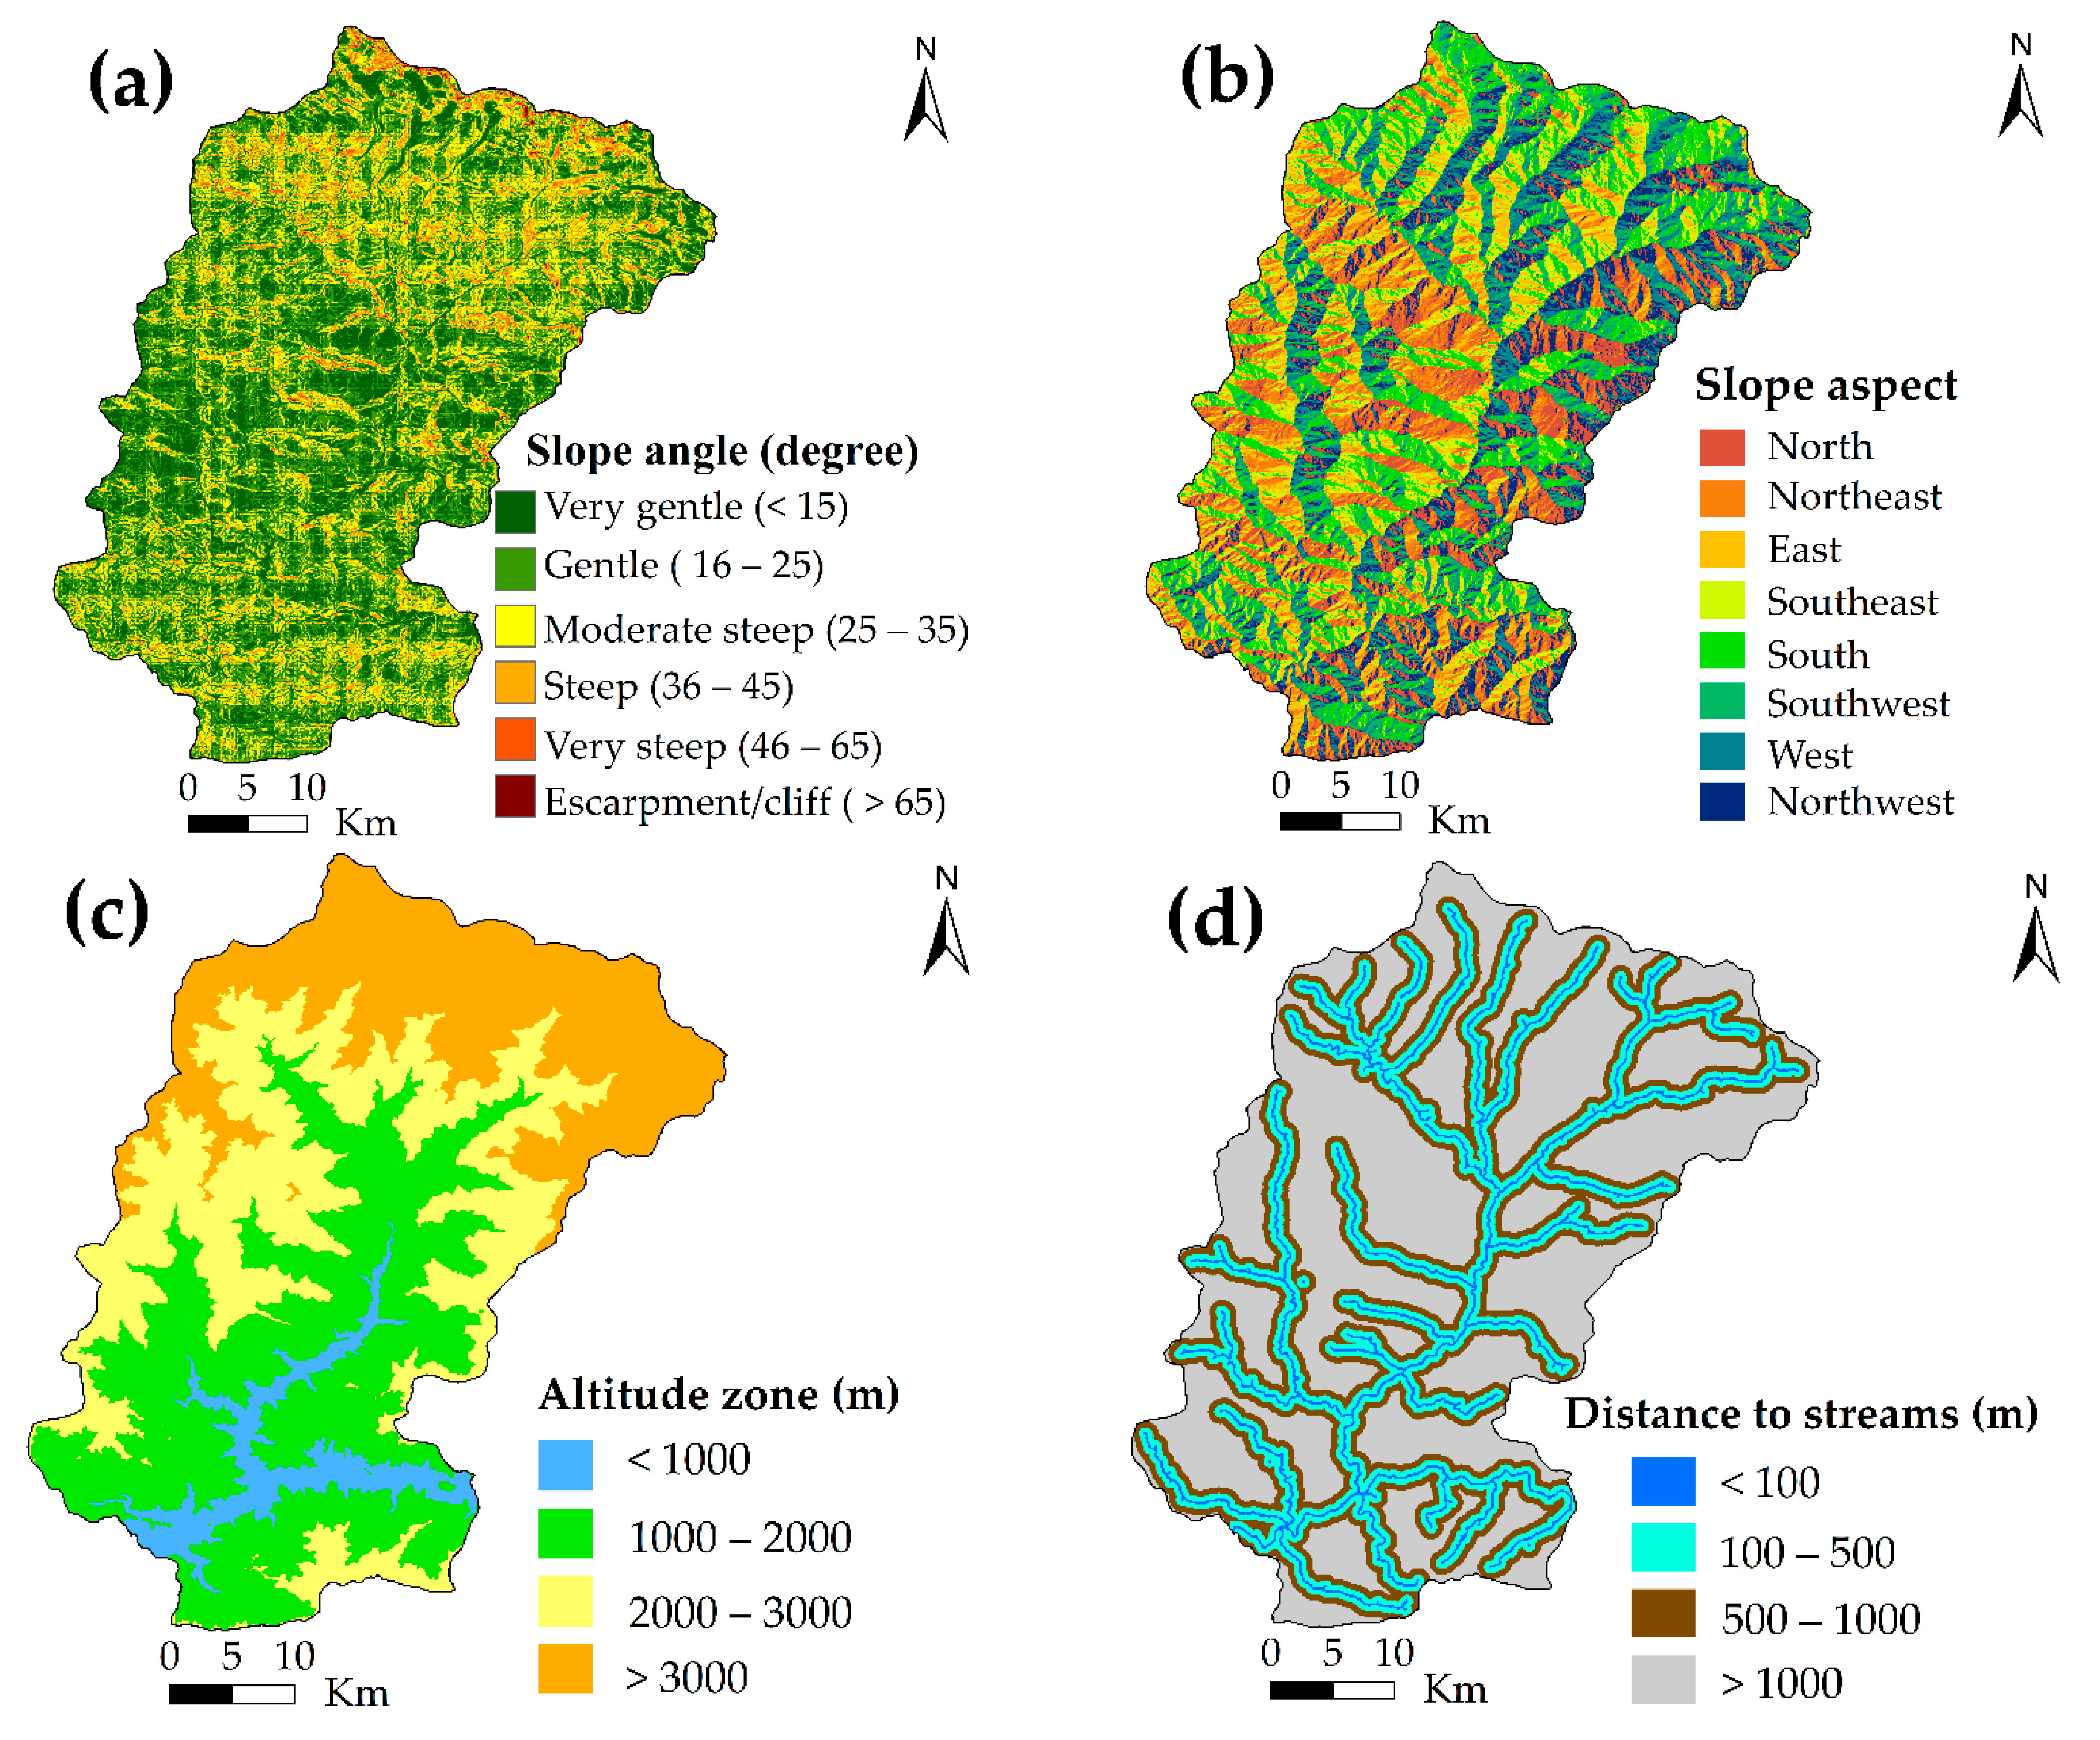
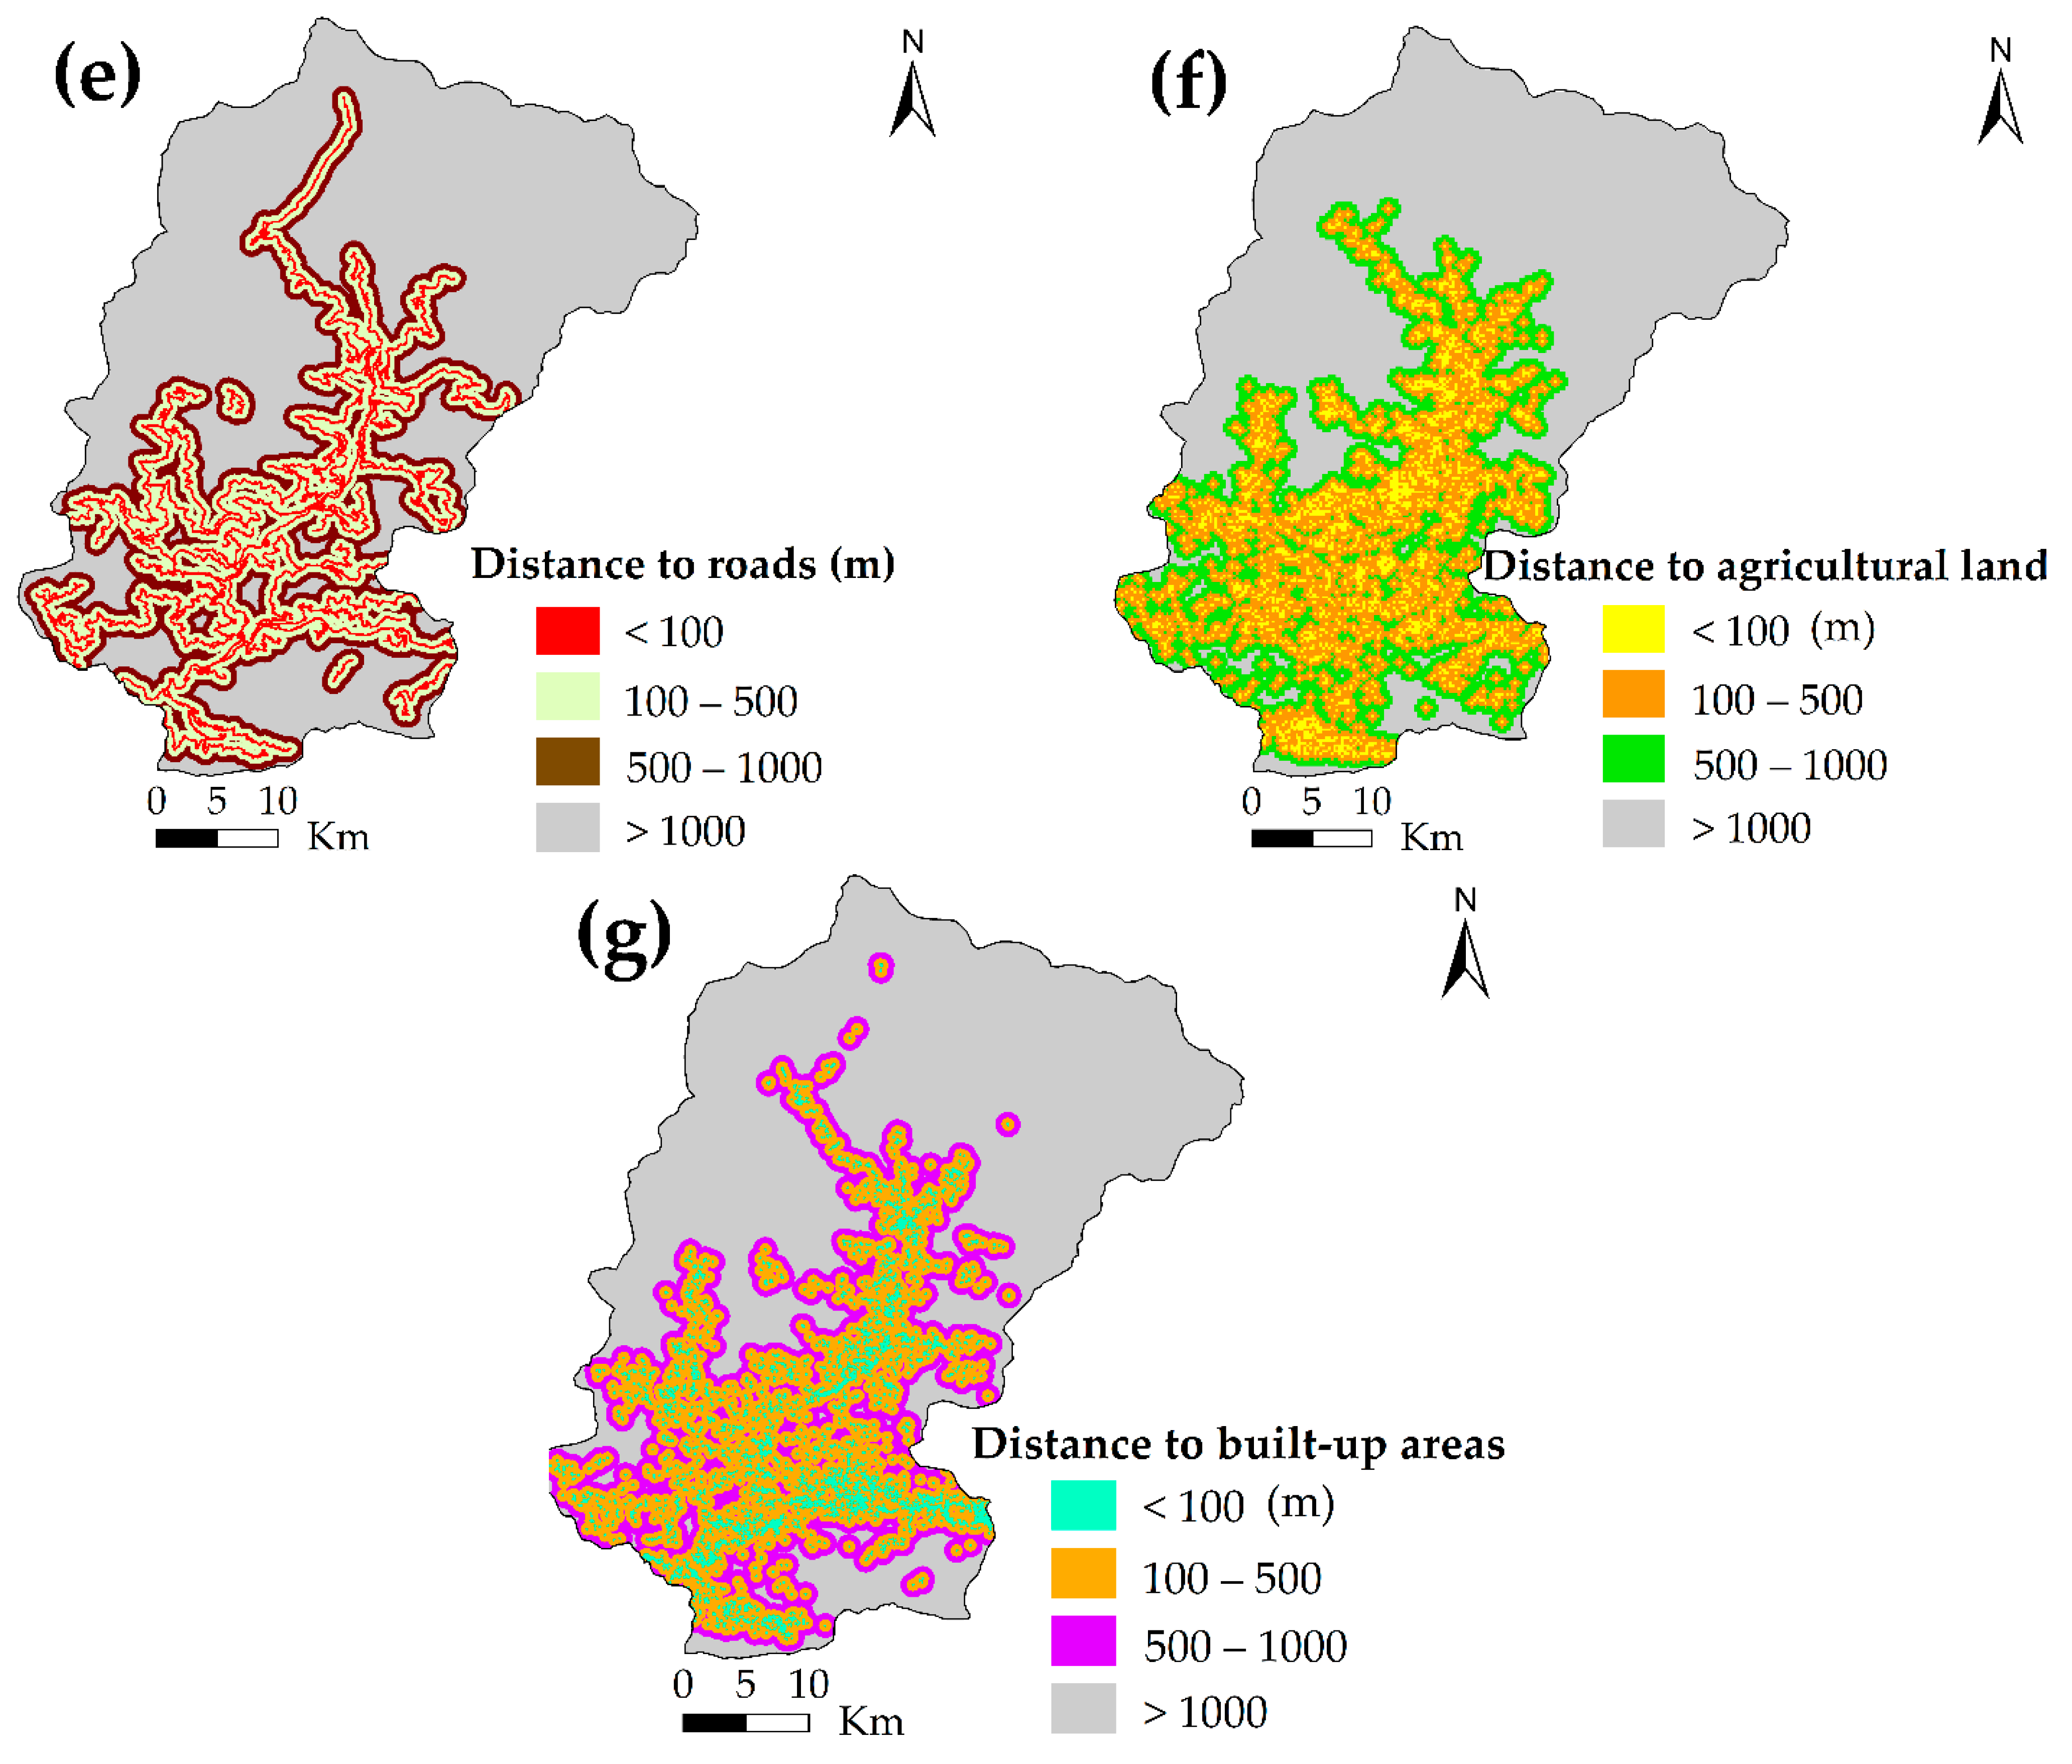
2.2.2. Forest Fragmentation Causative Factors

In many cases, anthropogenic activities are responsible for forest fragmentation. It is assumed that both human and natural factors are responsible for forest fragmentation. Therefore, the factors of topographic and human activities were considered to obtain the forest fragmentation susceptibility map. Based on previous studies and data availability, seven factors were considered that cause forest fragmentation: slope angle, slope aspect, distance to streams, distance to roads, distance to agricultural land, distance to the built-up area, and altitude zones. Meanwhile, other external factors such as forest fires, floods, and landslides could not be used due to the lack of complete and reliable data, even though their potential influence may be significant. Map layers depicting altitude zone, slope angle, slope aspect, and distance to streams were derived from 10-m-resolution digital elevation model (DEM) stereoscopic Cartosat-1 data provided free by the Indian Space Research Organization (ISRO) (https://www.isro.gov.in/) (data accessed on 17 March 2021). Roads were extracted using an online digitization facility from BHUVAN (https://bhuvan.nrsc.gov.in/bhuvan_links.php) open data geoportal of ISRO (data accessed on 17 March 2021). The built-up area and agricultural land were extracted from Landsat 8 OLI satellite data (30-m resolution) provided by USGS for the year 2014. We provided the descriptions of the preparation procedure of each causative factor below. The slope angle and slope aspect are derived from a 10-m digital elevation model (DEM) extracted from the stereoscopic Cartosat-1 data using the ArcGIS tool. Distance to streams was produced from DEM by hydrology tools in ArcGIS. The layers of distance to streams, built-up area, agricultural land, and roads were calculated by the Euclidean Distance System in spatial analyst tools of ArcGIS. Landsat 8 OLI satellite image was used to produce agricultural land and built-up area, and then we prepared distance to the built-up area and distance to the agricultural land map. The altitude zone map was produced using DEM on the basis of precipitation levels in accordance with the Indian Metrological Department (IMD). All causative factors layers were in raster format and resampled into the same resolution (30 m) with the standard Universal Transverse Mercator (UTM) 44N zone. Finally, each causative factor was divided into several classes based on our field visit and ancillary information. Figure 2 shows the final outputs of causative factor maps.

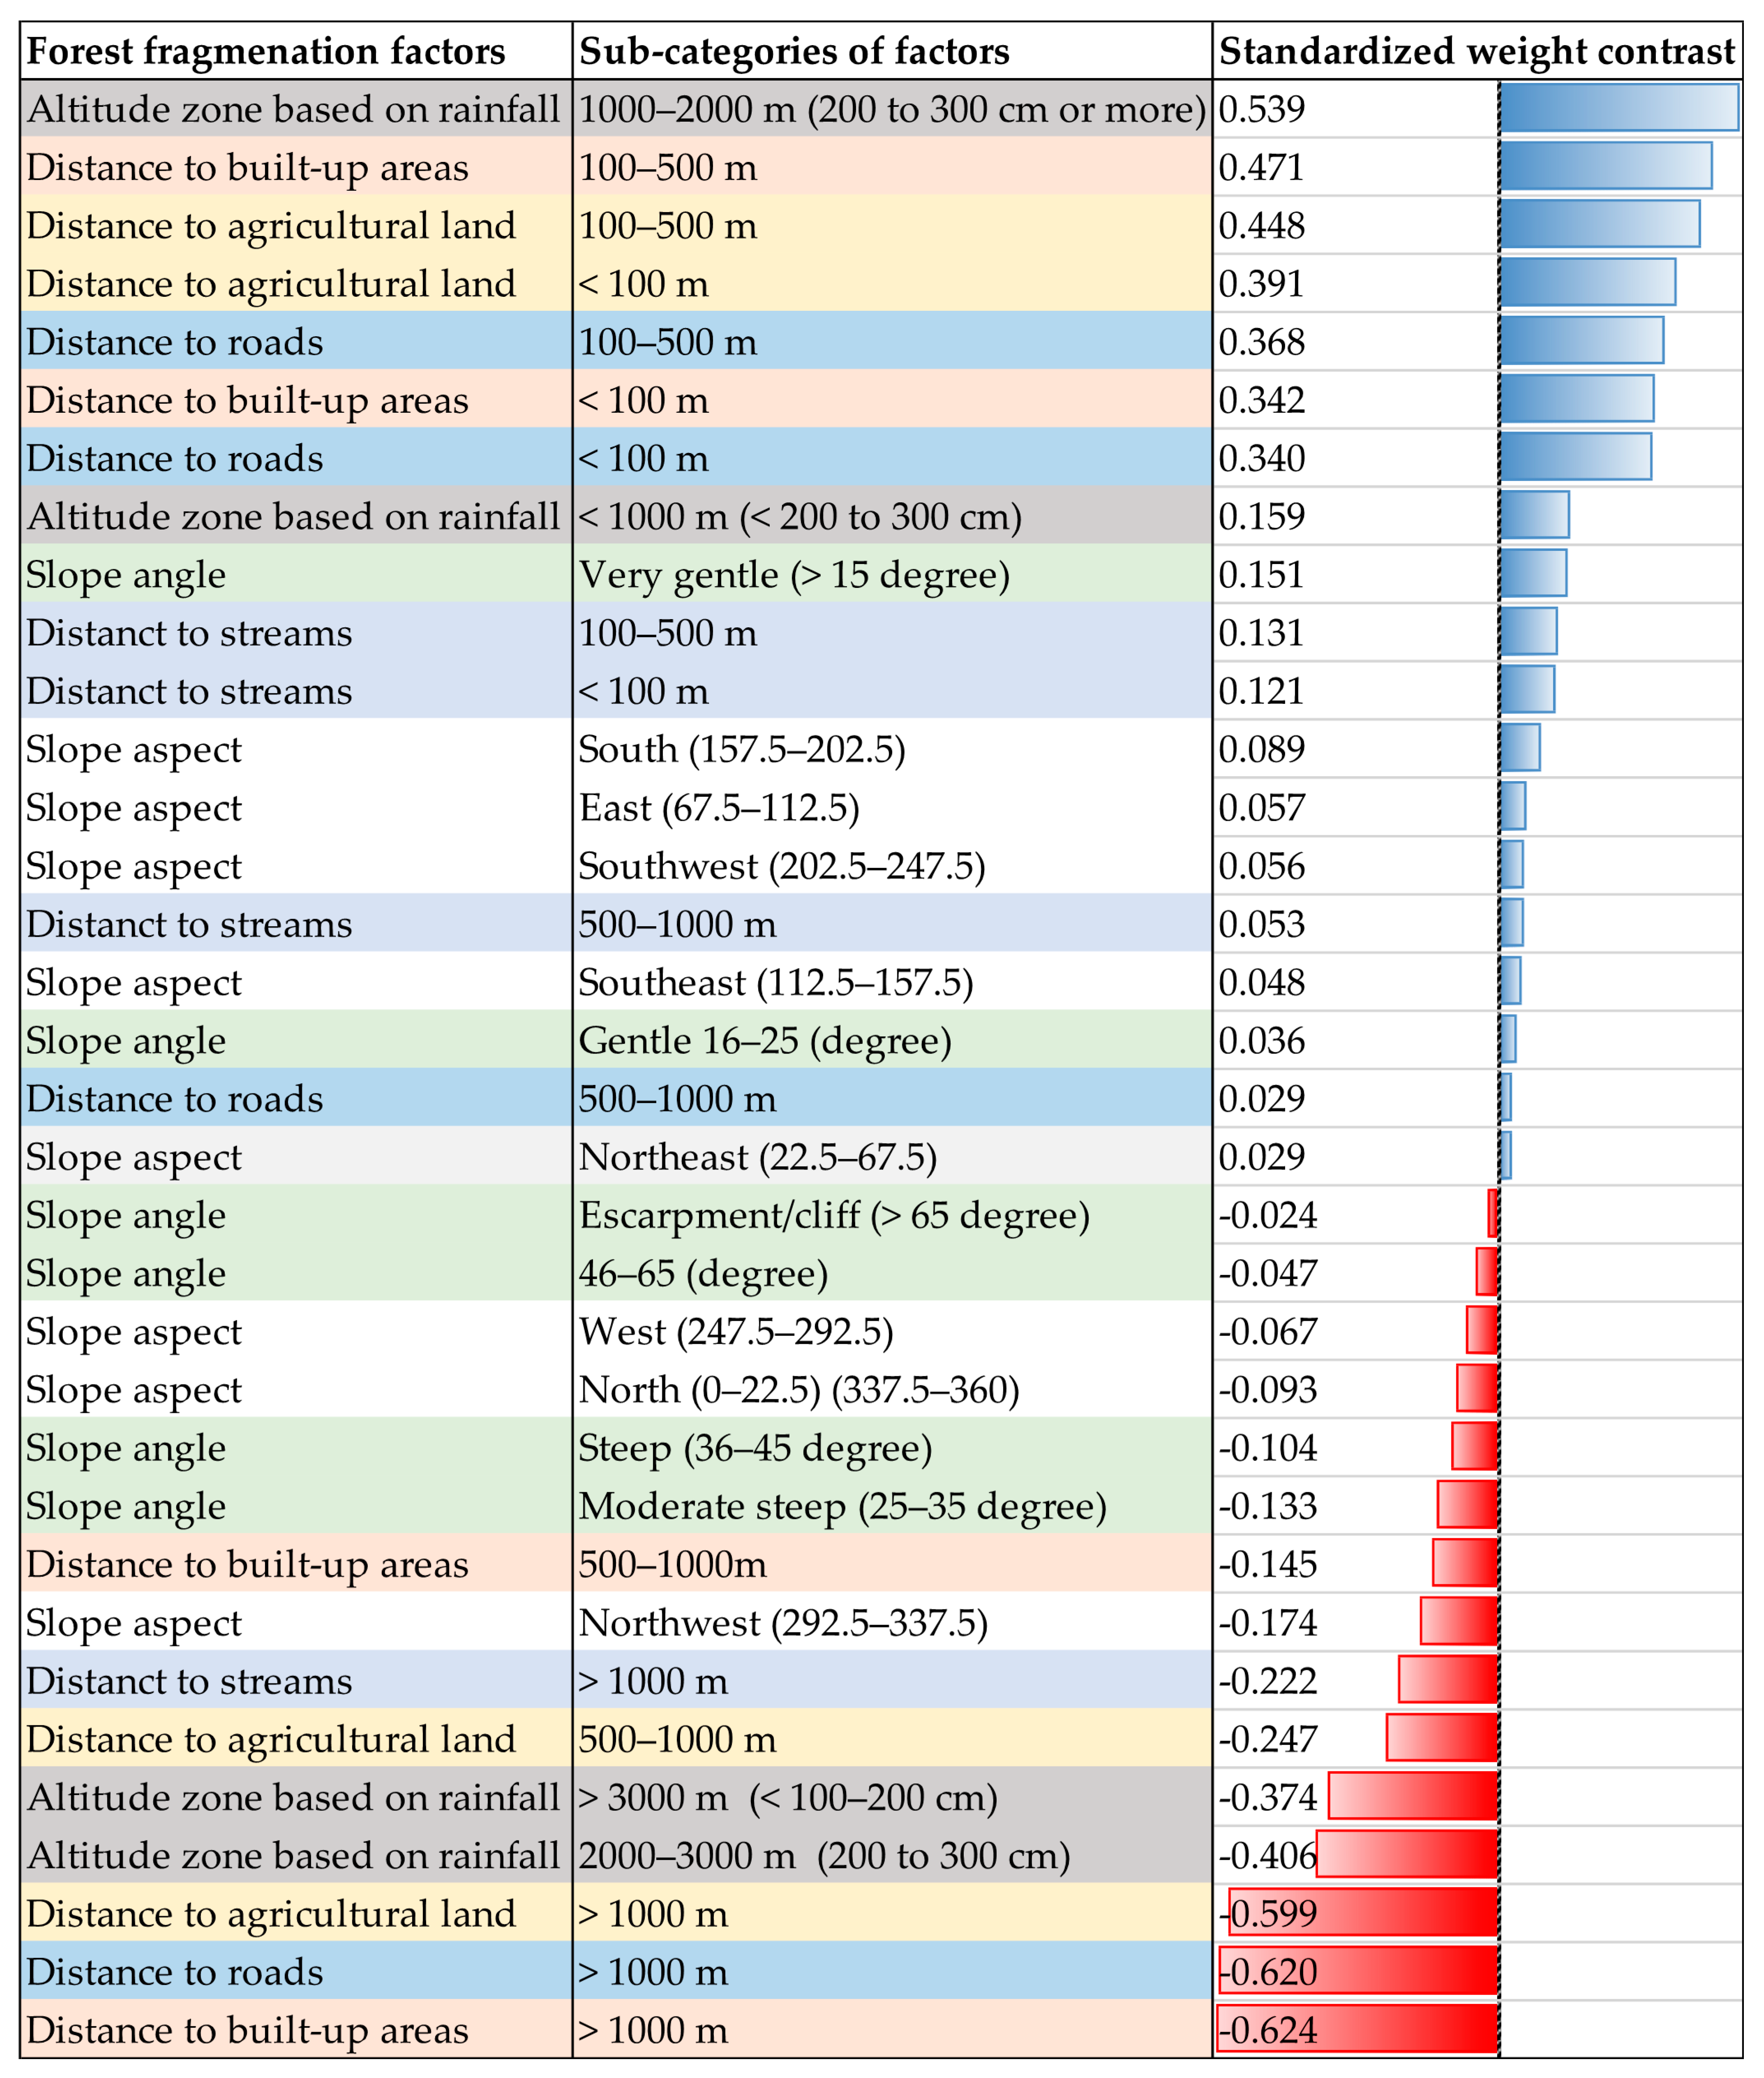
2.2.3. Role of Causative Factors on Forest Fragmentation
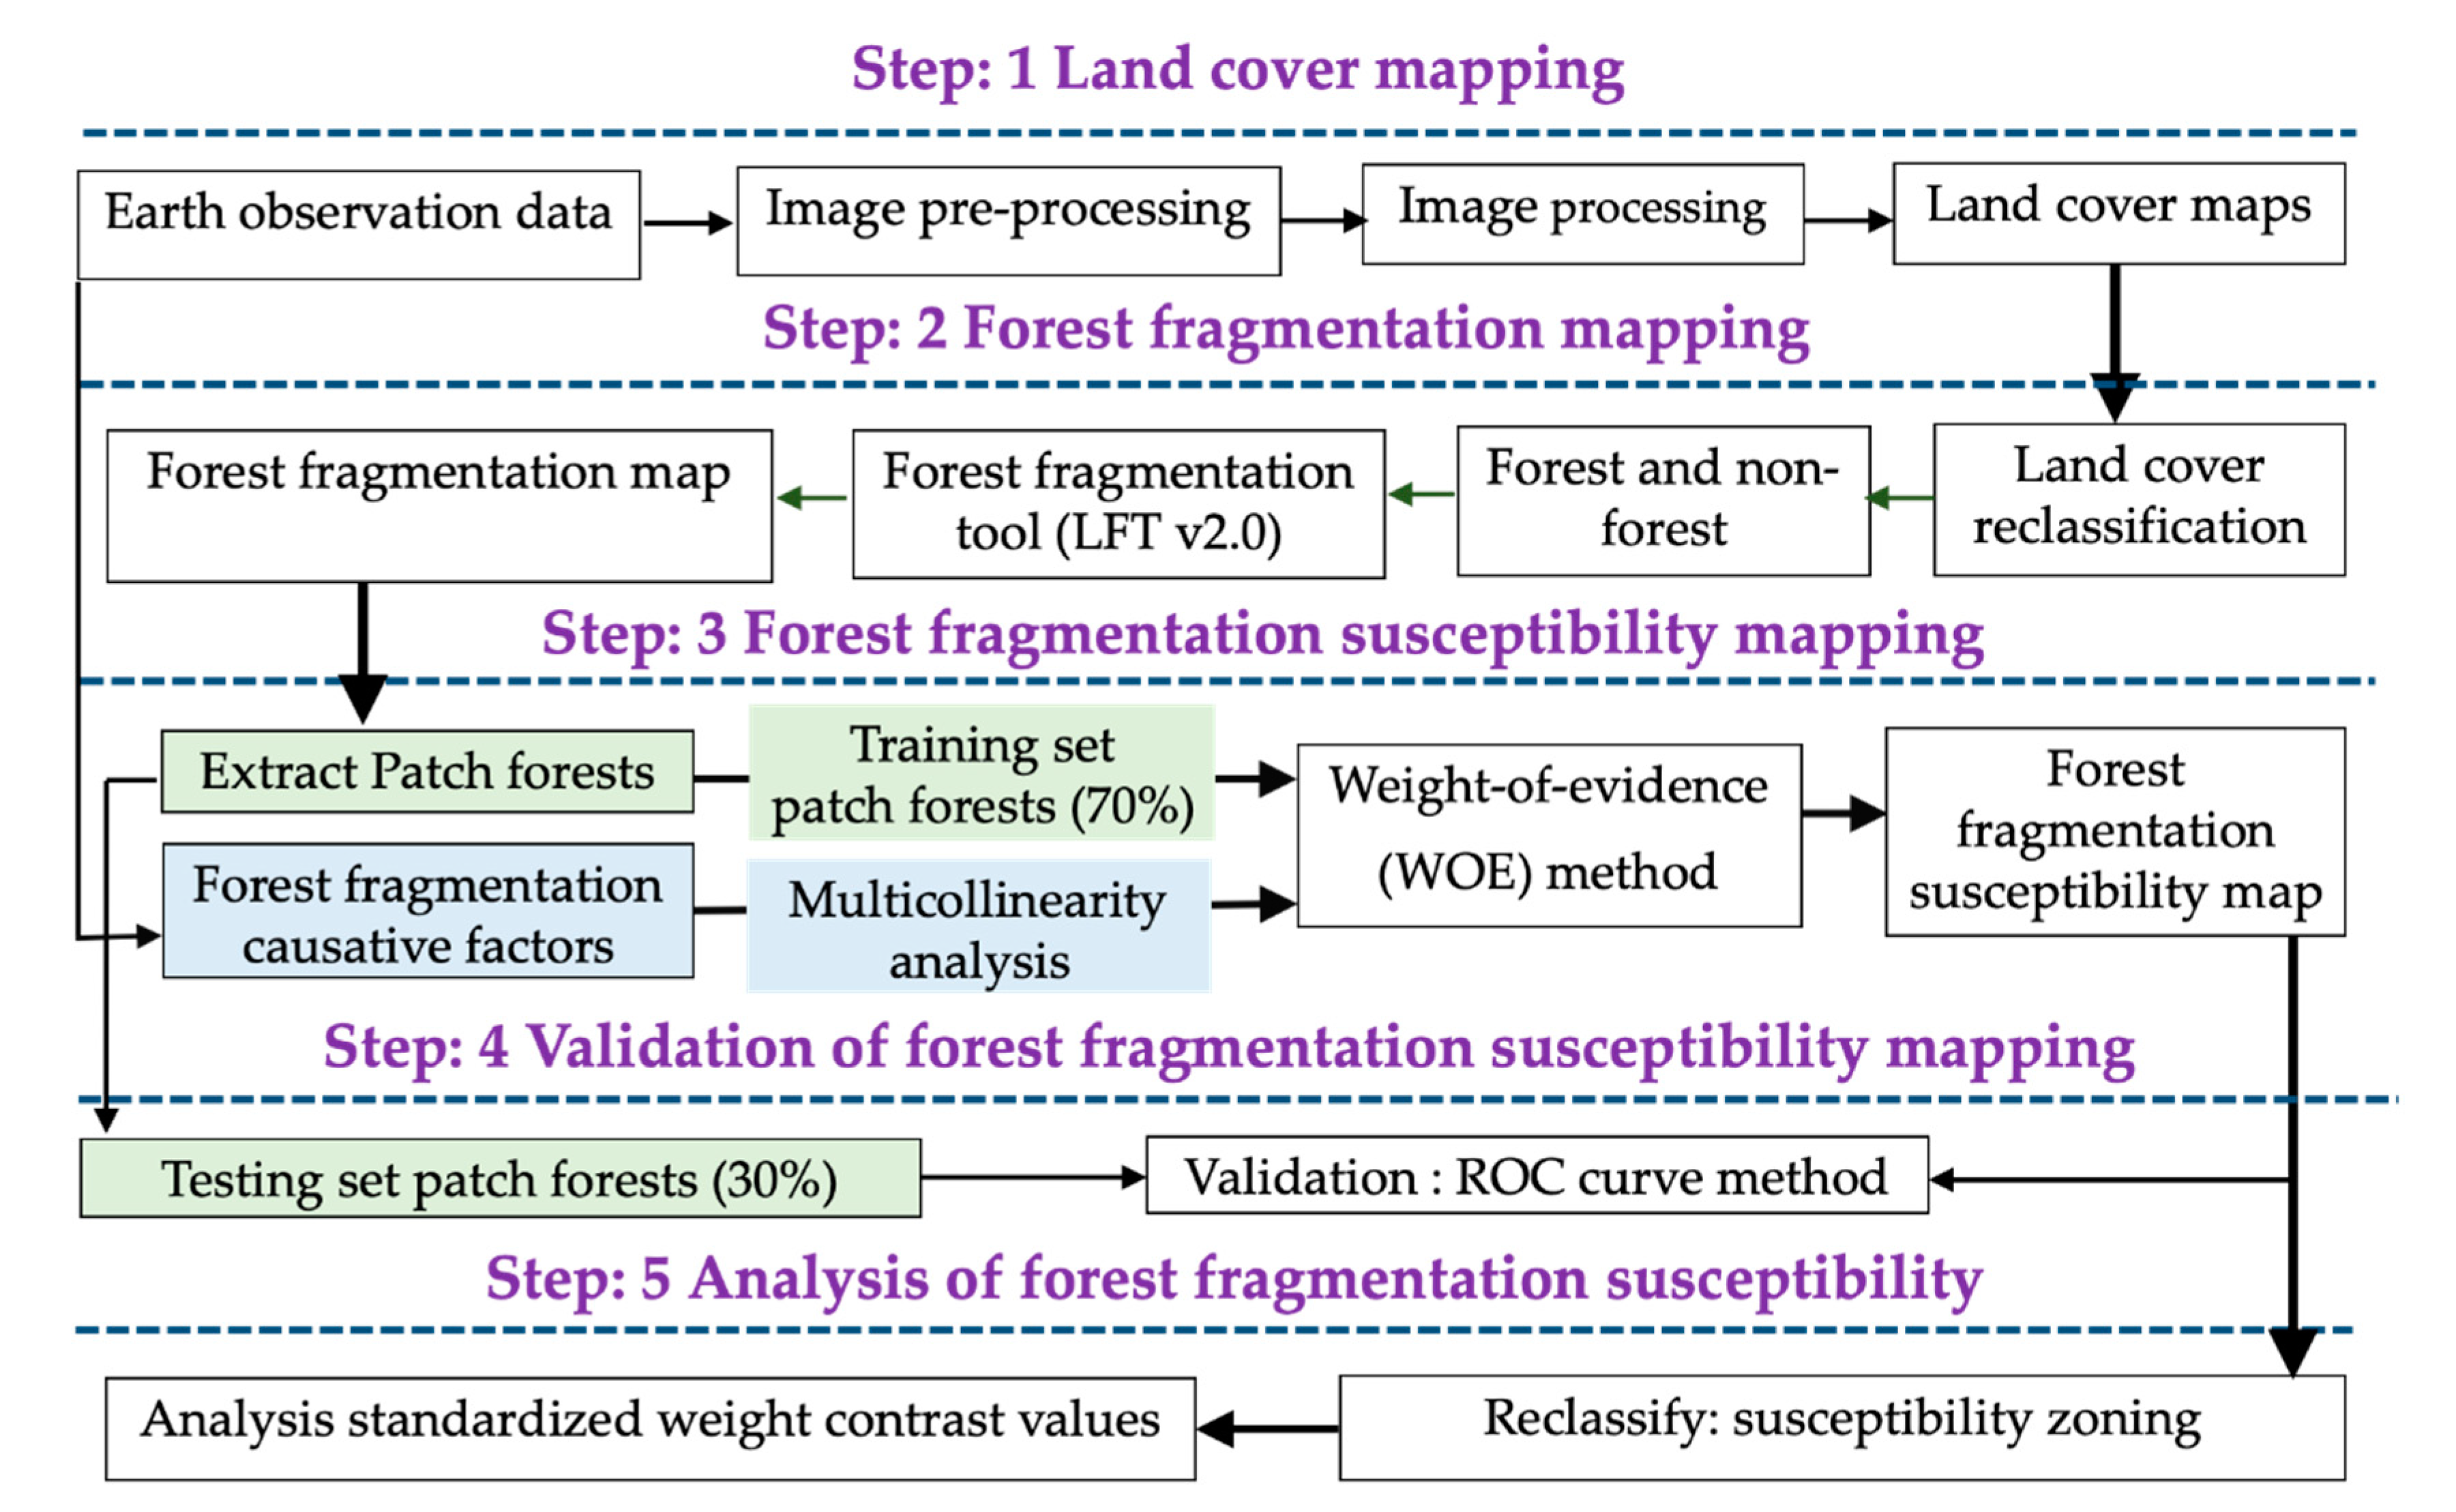
Since the study area is mountainous, we believe that both anthropogenic and natural factors are interlinked, and both these factors directly or indirectly affect forest cover and fragmentation patterns. The anthropogenic activities and forest cover are determined by characteristics of slope angle, slope aspects, and altitude. For example, the agricultural activities and safe infrastructure are highly concentrated on lower slopes, leading to forest conversion and fragmentation [21]. Although there are fewer agricultural activities and less infrastructure development on steeper slopes, forest loss and fragmentation can increase even on steeper slopes as a result of tree mortality due to landslides, floods, and forest fires. The anthropogenic activities and forest cover also vary depending on slope direction and altitude. For example, anthropogenic activities at higher altitudes are limited compared to lower altitudes due to microclimate conditions and limited accessibility, which eventually affect human activities and forest cover at higher altitudes. At the same time, slope direction affects forest growth and concentration of settlements due to the availability of sunlight. The concentration of anthropogenic activities such as built-up areas and agricultural lands near river channels is generally high on accessible slopes and at lower elevations, which can change forest cover and increase forest fragmentation [21]. Moreover, these anthropogenic disturbances and their continuous expansion can cause further encroachment of the natural forest landscape, which can lead to future forest fragmentation. Thus, these interlinked anthropogenic and natural factors can influence the connectivity, continuity, and quantity of forest cover in this study area.

2.3. Mapping Method

Figure 3 shows the overall integrated methodological framework for this study. Step 1: As described in the previous section, the land cover maps for the years 1998 and 2014 were derived on the basis of Landsat images using the supervised classification with the maximum likelihood method. Step 2: Then, all land cover maps were reclassified into forest and non-forest maps. After that, we applied the Landscape Fragmentation tool (LFT v2.0) to prepare forest fragmentation pattern maps. Subsequently, the patch forests were extracted from the forest fragmentation maps using an analyst tool in ArcGIS for further procedure. Step 3: Seven conditions factors were selected as an independent variable based on previous studies and fieldwork. Subsequently, a multicollinearity analysis was carried out to test the predictive ability of selected forest fragmentation causative factors using the Variance Inflation Factor (VIF) method before applying the WOE method. Then, patch forests were used to assign the weight value to each class of causative factors using the WOE method to produce a forest fragmentation susceptibility map. Step 4: The forest fragmentation susceptibility map was validated by relative operating characteristic (ROC) curve method to evaluate the model performance. Step 5: Finally, we analyzed the final forest fragmentation susceptibility map using a raster calculator and the reclassify tool in ArcGIS and the standardized weight contract value of causative factors. The details of the LFT v2.0 tool and the WOE method are described in the following sections.

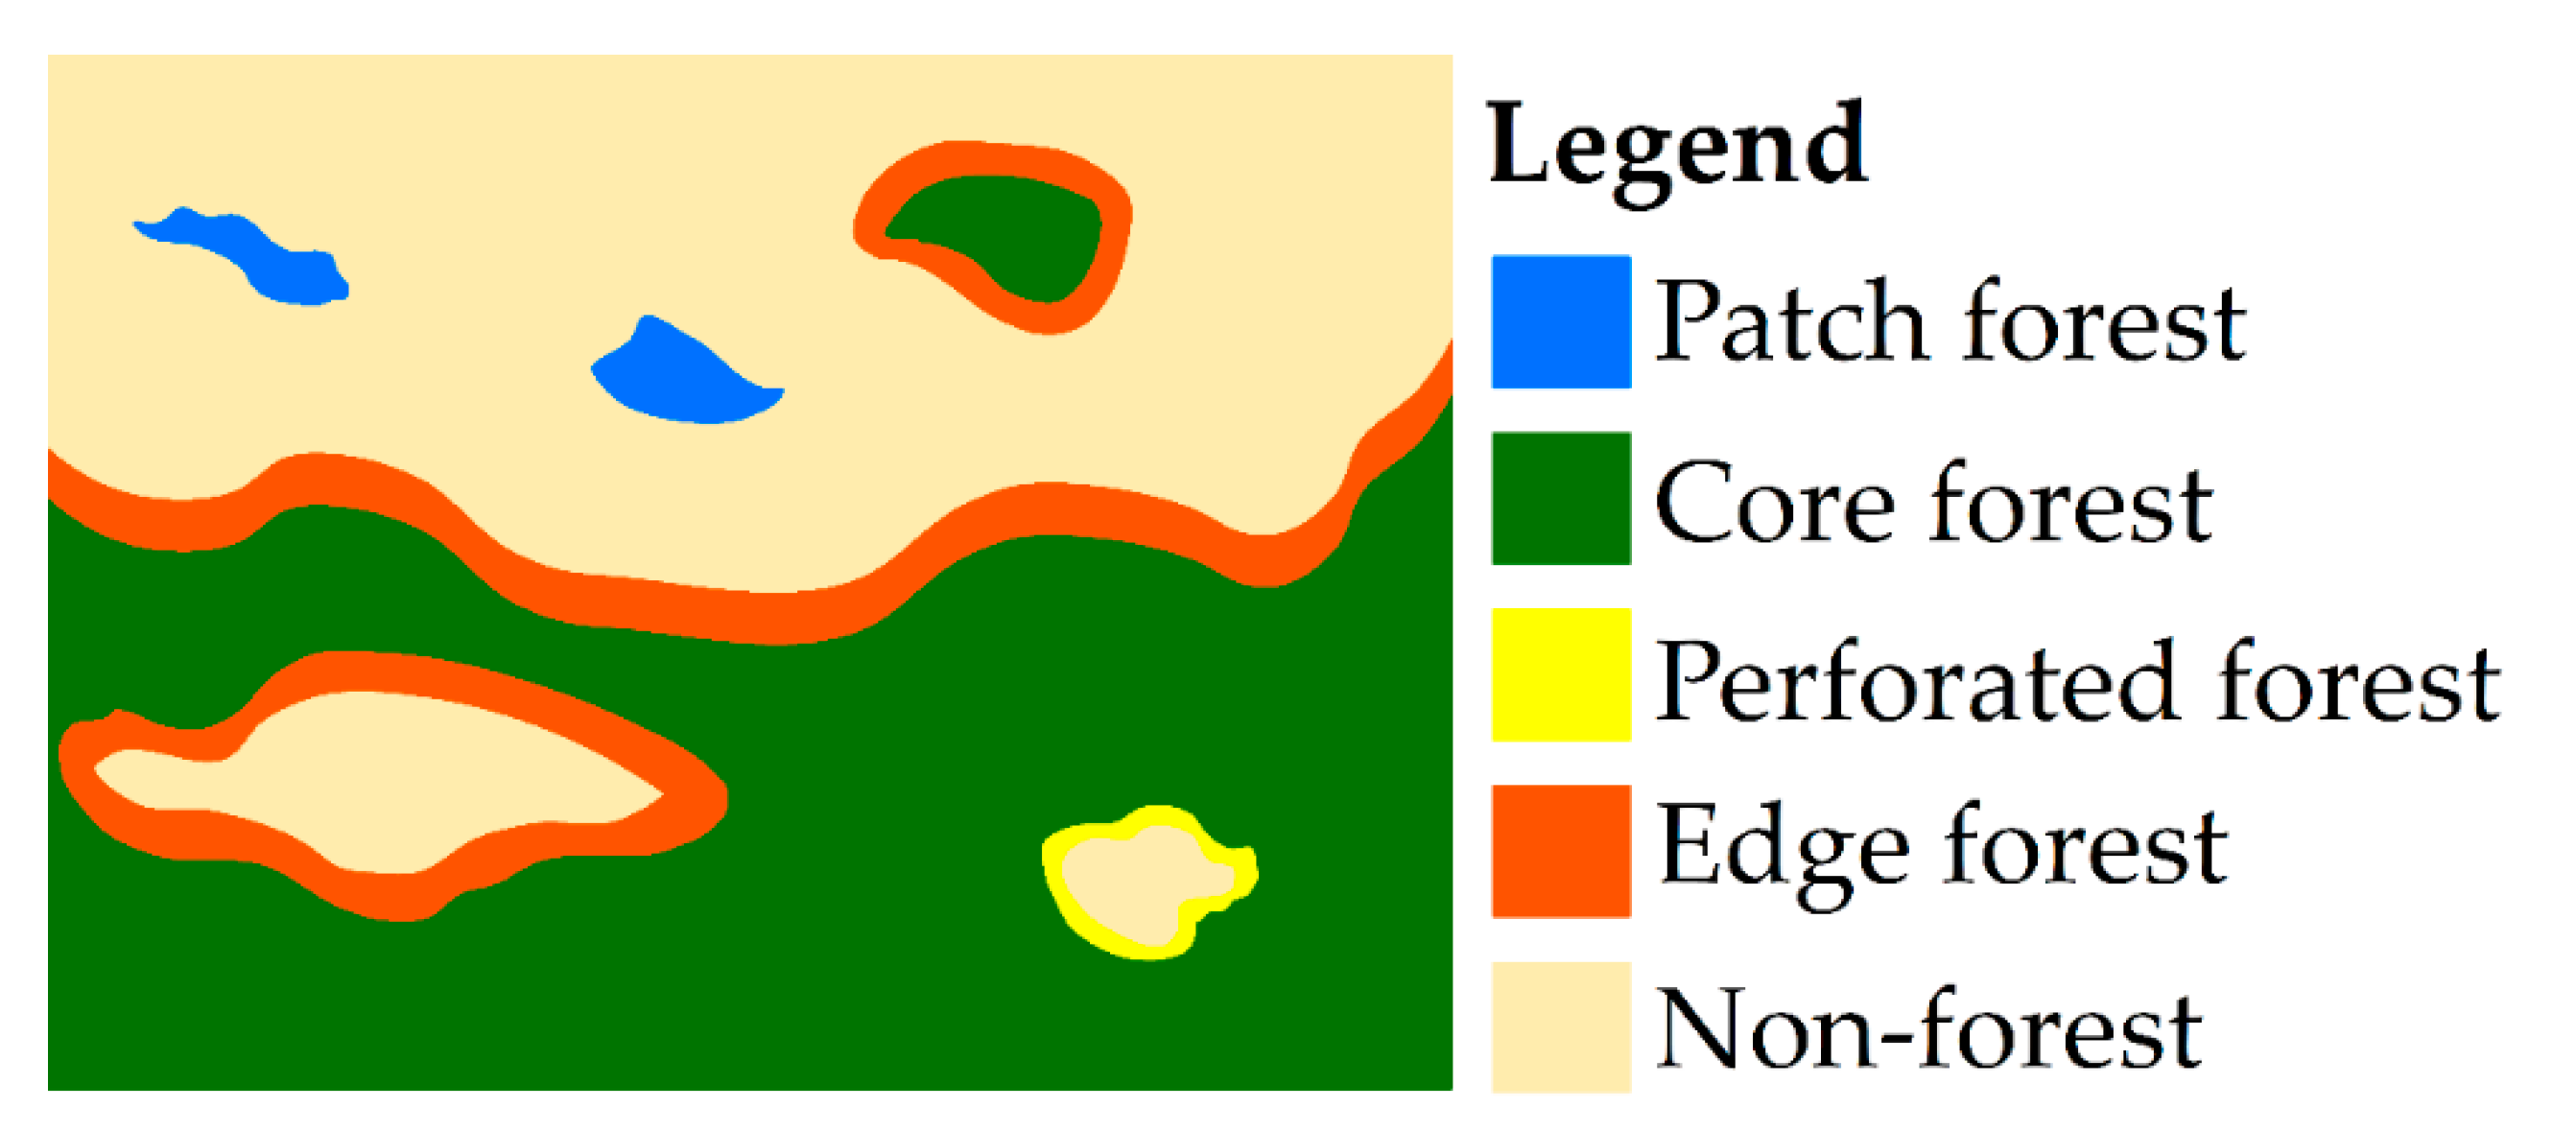
2.3.1. Landscape Fragmentation Analysis Tool

The Landscape Fragmentation Tool (LFT v2.0) is a helpful tool that runs in ArcGIS. The purpose of the LFT v2.0 tool is to map the types of forest fragmentation present in a land cover type of interest (i.e., forest) at the pixel level [21,47,48]. This improved method classifies forest fragmentation into five categories; (1) non-forest, (2) patch, (3) edge, (4) perforated, and (5) core forest [47]. Thus, the LFT v2.0 tool allows users to create a useful map of forest fragmentation and analyze it. Figure 4 shows a diagrammatic representation of four types of spatial patterns of forest fragmentation on an artificial map. In this study, the LFT v2.0 tool was used to extract the patch forests from forest fragmentation pattern maps. Figure 3 shows the overall process of the extraction of patch forests.

2.3.2. Multicollinearity Analysis

Multicollinearity analysis is needed to test the predictive of selected forest fragmentation causative factors before applying the model, i.e., the WOE method. Therefore, the Variance Inflation Factor (VIF) method was applied to identify any multicollinearity between the causative factors [55]. VIF measures the degree of intercorrelation between the predictive factors using the following equations:
VIF = 1 / ( 1 R 2 )
where R represents the multi-correlation coefficient between an individual causative factor and other causative factors. VIF greater than 5 indicates multicollinearity between causative factors [55], and therefore that causative factors should not be used in the model.

2.3.3. Weight-of-Evidence (WOE) Method

The WOE method is a quantitative, data-driven Bayesian modeling method that was initially developed to identify and explore mineral deposits [56]. Now, the WOE method is widely used in many scientific fields [57,58]. Recently, the WOE method has been widely applied for forest fire occurrence, deforestation susceptibility, and landslide susceptibility mapping [59,60,61,62,63]. We applied the WOE method to produce a forest fragmentation susceptibility map. The WOE method is used to model the degree of spatial association among each explanatory variable class and training sample by calculating the positive ( W + ) and negative weights ( W ), [56,58,64]. This method can produce a map of the expected probability of occurrence using spatial data, which has been applied by many researchers [57,58,59,60,61,62,63,64,65,66,67]. In this study, we applied the WOE method to obtain a forest fragmentation susceptibility map because it avoids the subjectivity of weights assigned to the causative factors.
The WOE method is based on the assumption that "the past is the key to the future”. In this study, we assumed that future forest fragmentation would occur under the same conditions that contributed to previous forest fragmentation and their spatial patterns. We assumed that the combinations of causative factors are conditionally independent of each other regarding the forest fragmentation process and their spatial patterns. We further presumed that the combination of causative factors might have resulted in the past forest fragmentation and its spatial patterns. Therefore, we used patch forests that occurred in the past to assign the standardized weight ( W s t d ) value to each class of causative factors. The value of W s t d determines the importance of the spatial relationship between factors affecting the patch forests. It also shows relative certainty of the posterior probability. To calculate the W s t d , we first calculate weight for each class of causative factor based on the presence ( W + ) or absence ( W ) of patch forests [63,64,65,66,67], which are defined as
W + = log e P { B | D } P { B | D ¯ }
W = log e P { B ¯ | D } P { B ¯ | D ¯ }
where P is the probability, B is the presence of the desired class of patch forest causative factor, B ¯   is the absence of the desired class of patch forest causative factor, D is the presence of patch forest and D ¯ is the absence of a patch forest. Subsequently, we calculated the difference between the two weights, denoted as the weight contrast (C), which is defined as
( C = W + W )
The variation and magnitude of the weight contract (C) reflect the spatial association between the causative factors and the patch forest. However, we calculated the standardized weight contrast ( W s t d ) for further improvement of this estimation. The standardized weight contrast ( W s t d ) is calculated as the ratio of C to its standard deviation, S(C). The S(C) (standard deviation) of positive and negative weights is computed as follows:
S ( C ) = S 2 W + + S 2 W
where S 2 W + and S 2 W are the variances of ( W + ) positive and ( W ) negative weights, respectively. The variances of positive and negative weights can be estimated through the following equations:
S 2 W + = 1 N { B A } + 1 B A ¯
S 2 W = 1 { B ¯ A } + 1 B ¯ A ¯
The standardized weight contrast ( W s t d ), i.e., the ratio of the contrast to its S(C) (standard deviation), is used to calculate the confidence:
W s t d = ( C S ( C ) )
If the standardized weight contrast ( W s t d ) is positive, the factor is favorable to forest fragmentation, and if the standardized weight contrast ( W s t d ) is negative, the factor is unfavorable to forest fragmentation. If it is close to zero, this indicates that the factor shows little relation to the forest fragmentation. The forest fragmentation susceptibility index (FFSI) map was constructed by summing the standardized ( ( W ) s t d ) weight contrasts of each causative factor as follows:
FFSI = Σ W s t d  
where W s t d = standardized weight contrast of each causative factor.

2.3.4. Validation of the Forest Fragmentation Susceptibility Map

We used the relative operating characteristic (ROC) curve method to evaluate model performance. The area under the curve (AUC) of the ROC predicts the occurrence or non-occurrence of an event [68]. Thus, it represents the quality of the probabilistic model [68,69]. An AUC value close to 1 indicates high accuracy, and an AUC value close to 0.5 indicates inaccuracy [63,68,69]. To assess the accuracy of the integrated model, we calculated the tested patch forests (30%) in various susceptibility categories. In this study, the success-rate curves were obtained using the IDRISI SELVA17.0 software.

3. Results

3.1. Multicollinearity Analysis
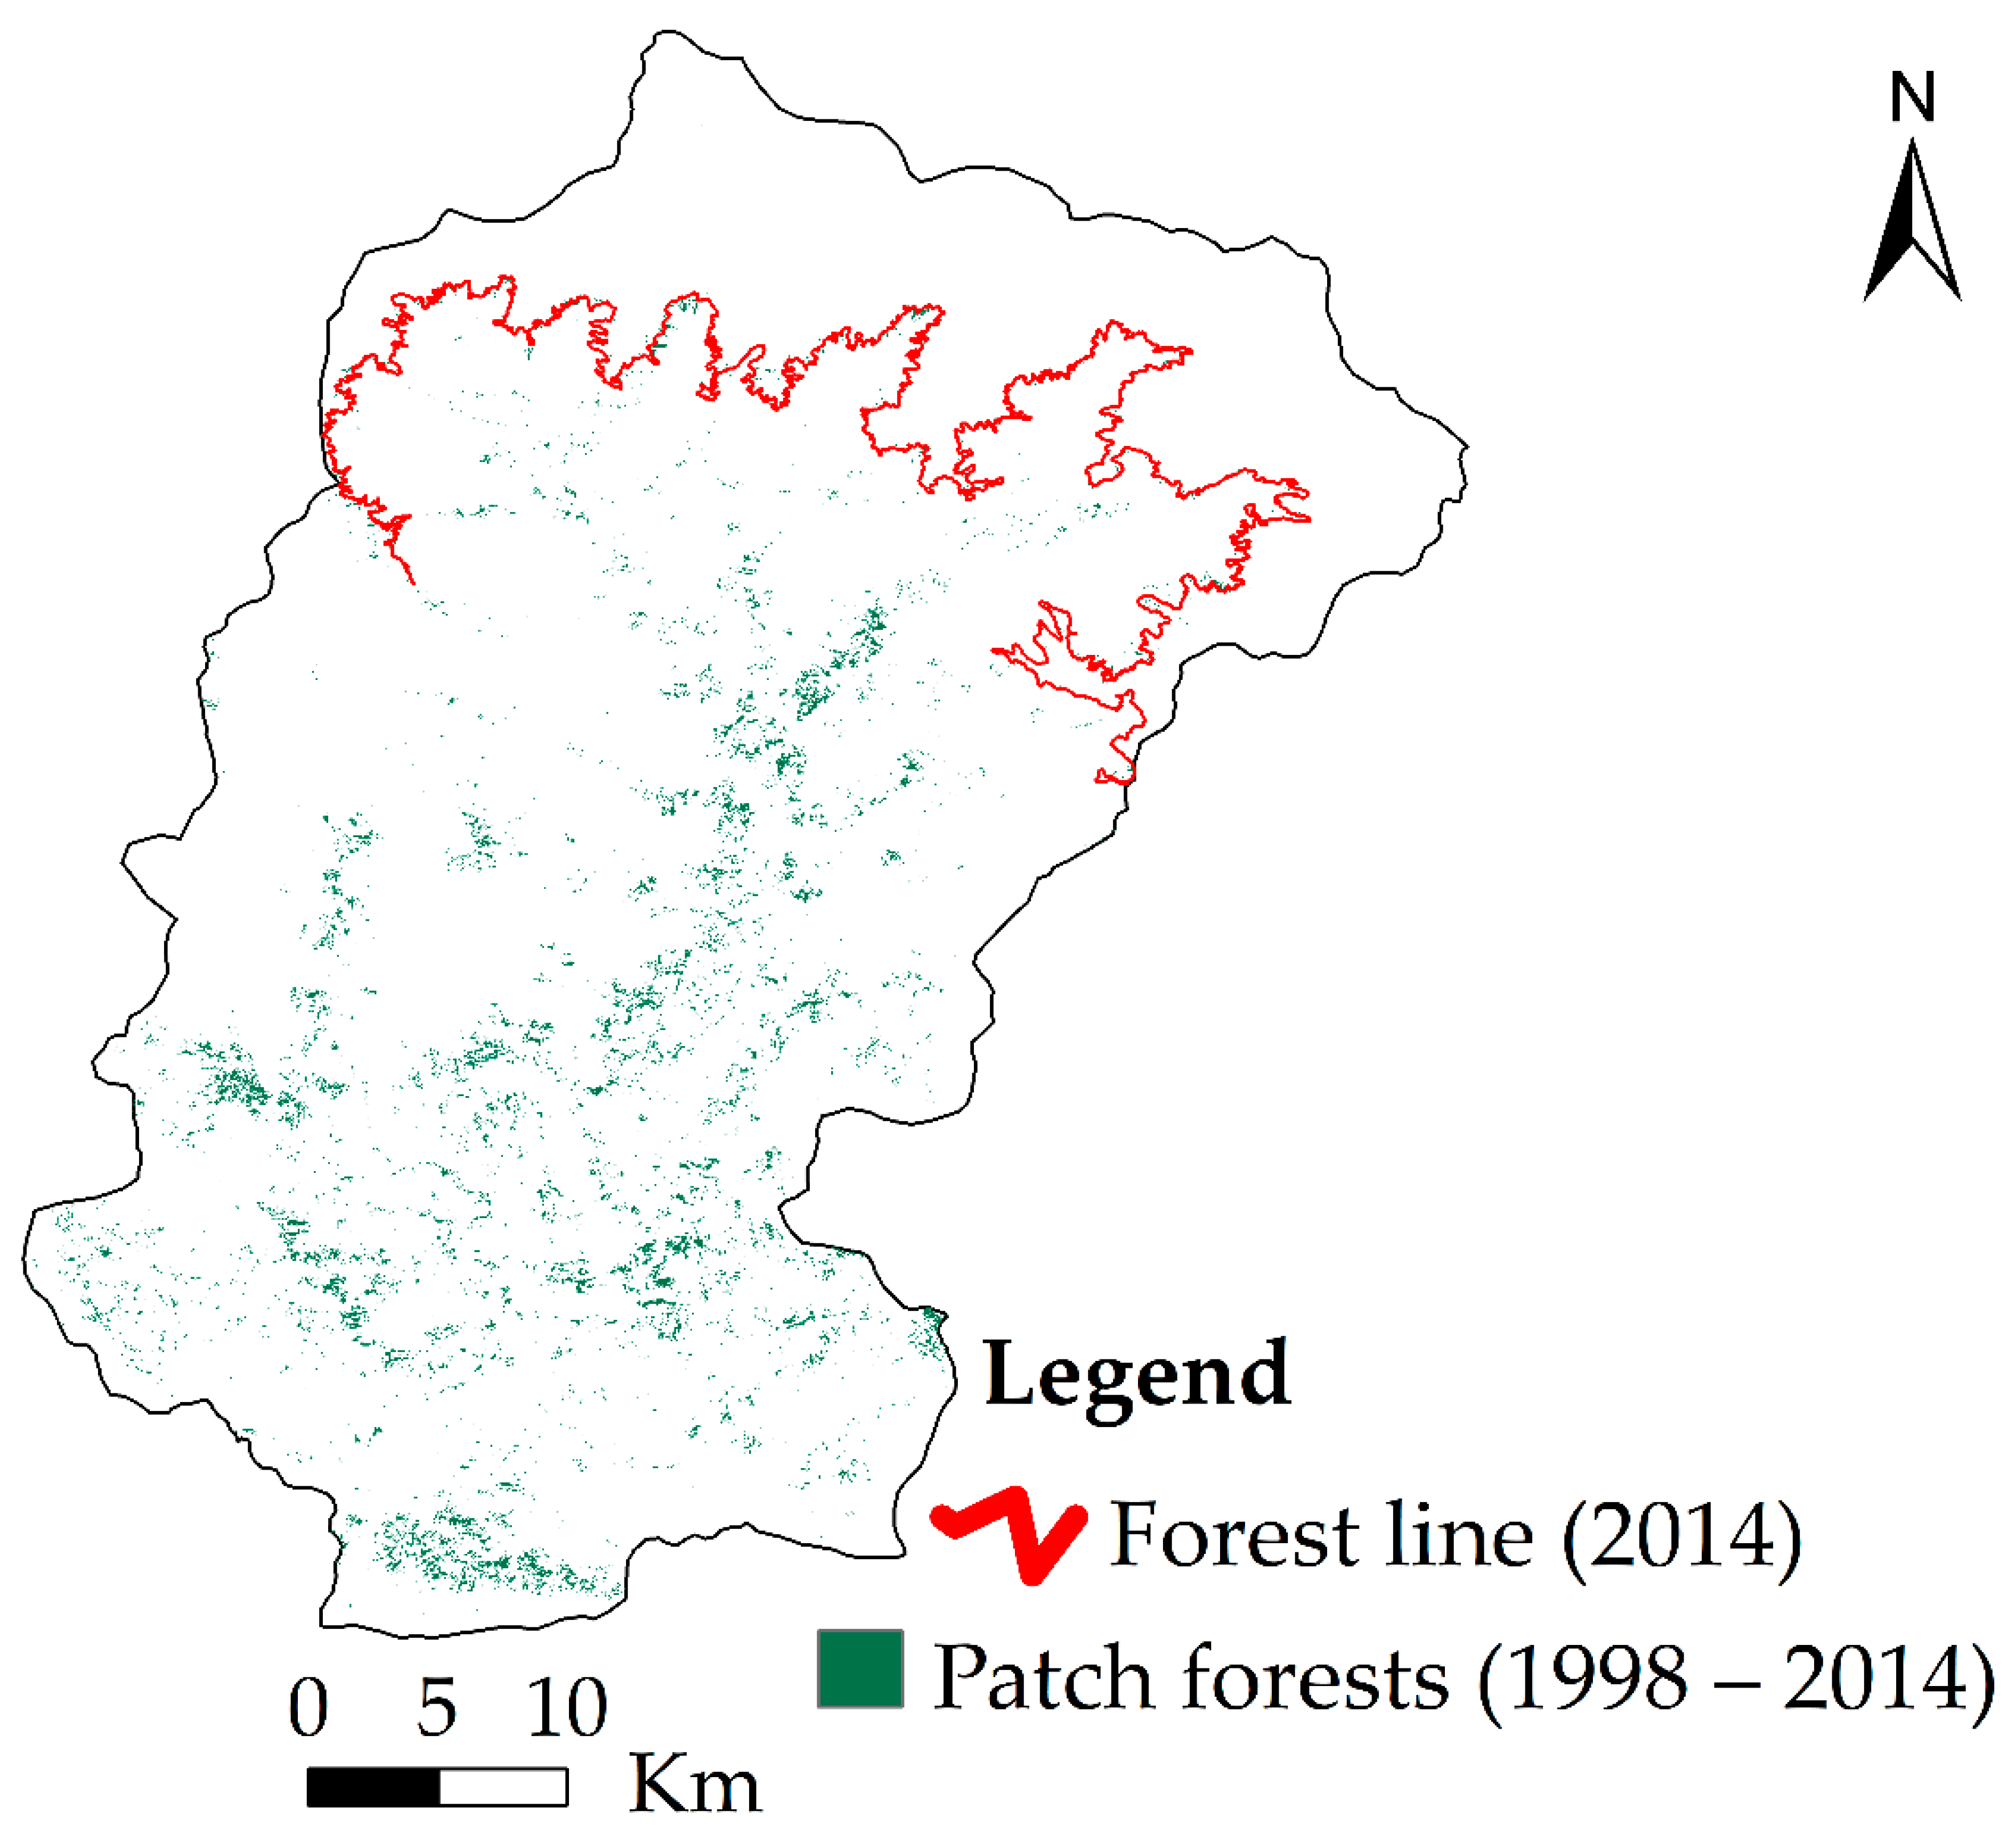
The VIF values of causative factors are less than 5, suggesting no collinearity among any of the selected causative factors (Table 1). Therefore, the seven selected causative factors of forest fragmentation are suitable for modeling forest fragmentation susceptibility.

3.2. Patch Forests

The patch forests were extracted from the forest fragmentation for the years 1998 and 2014, using the ArcGIS spatial analyst extension. The total area of extracted patch forests was about 71.57 km2, which is 3.70% of the total study area (1936.06 km2). Figure 5 shows the final output of the patch forests map of the Rudraprayag district.

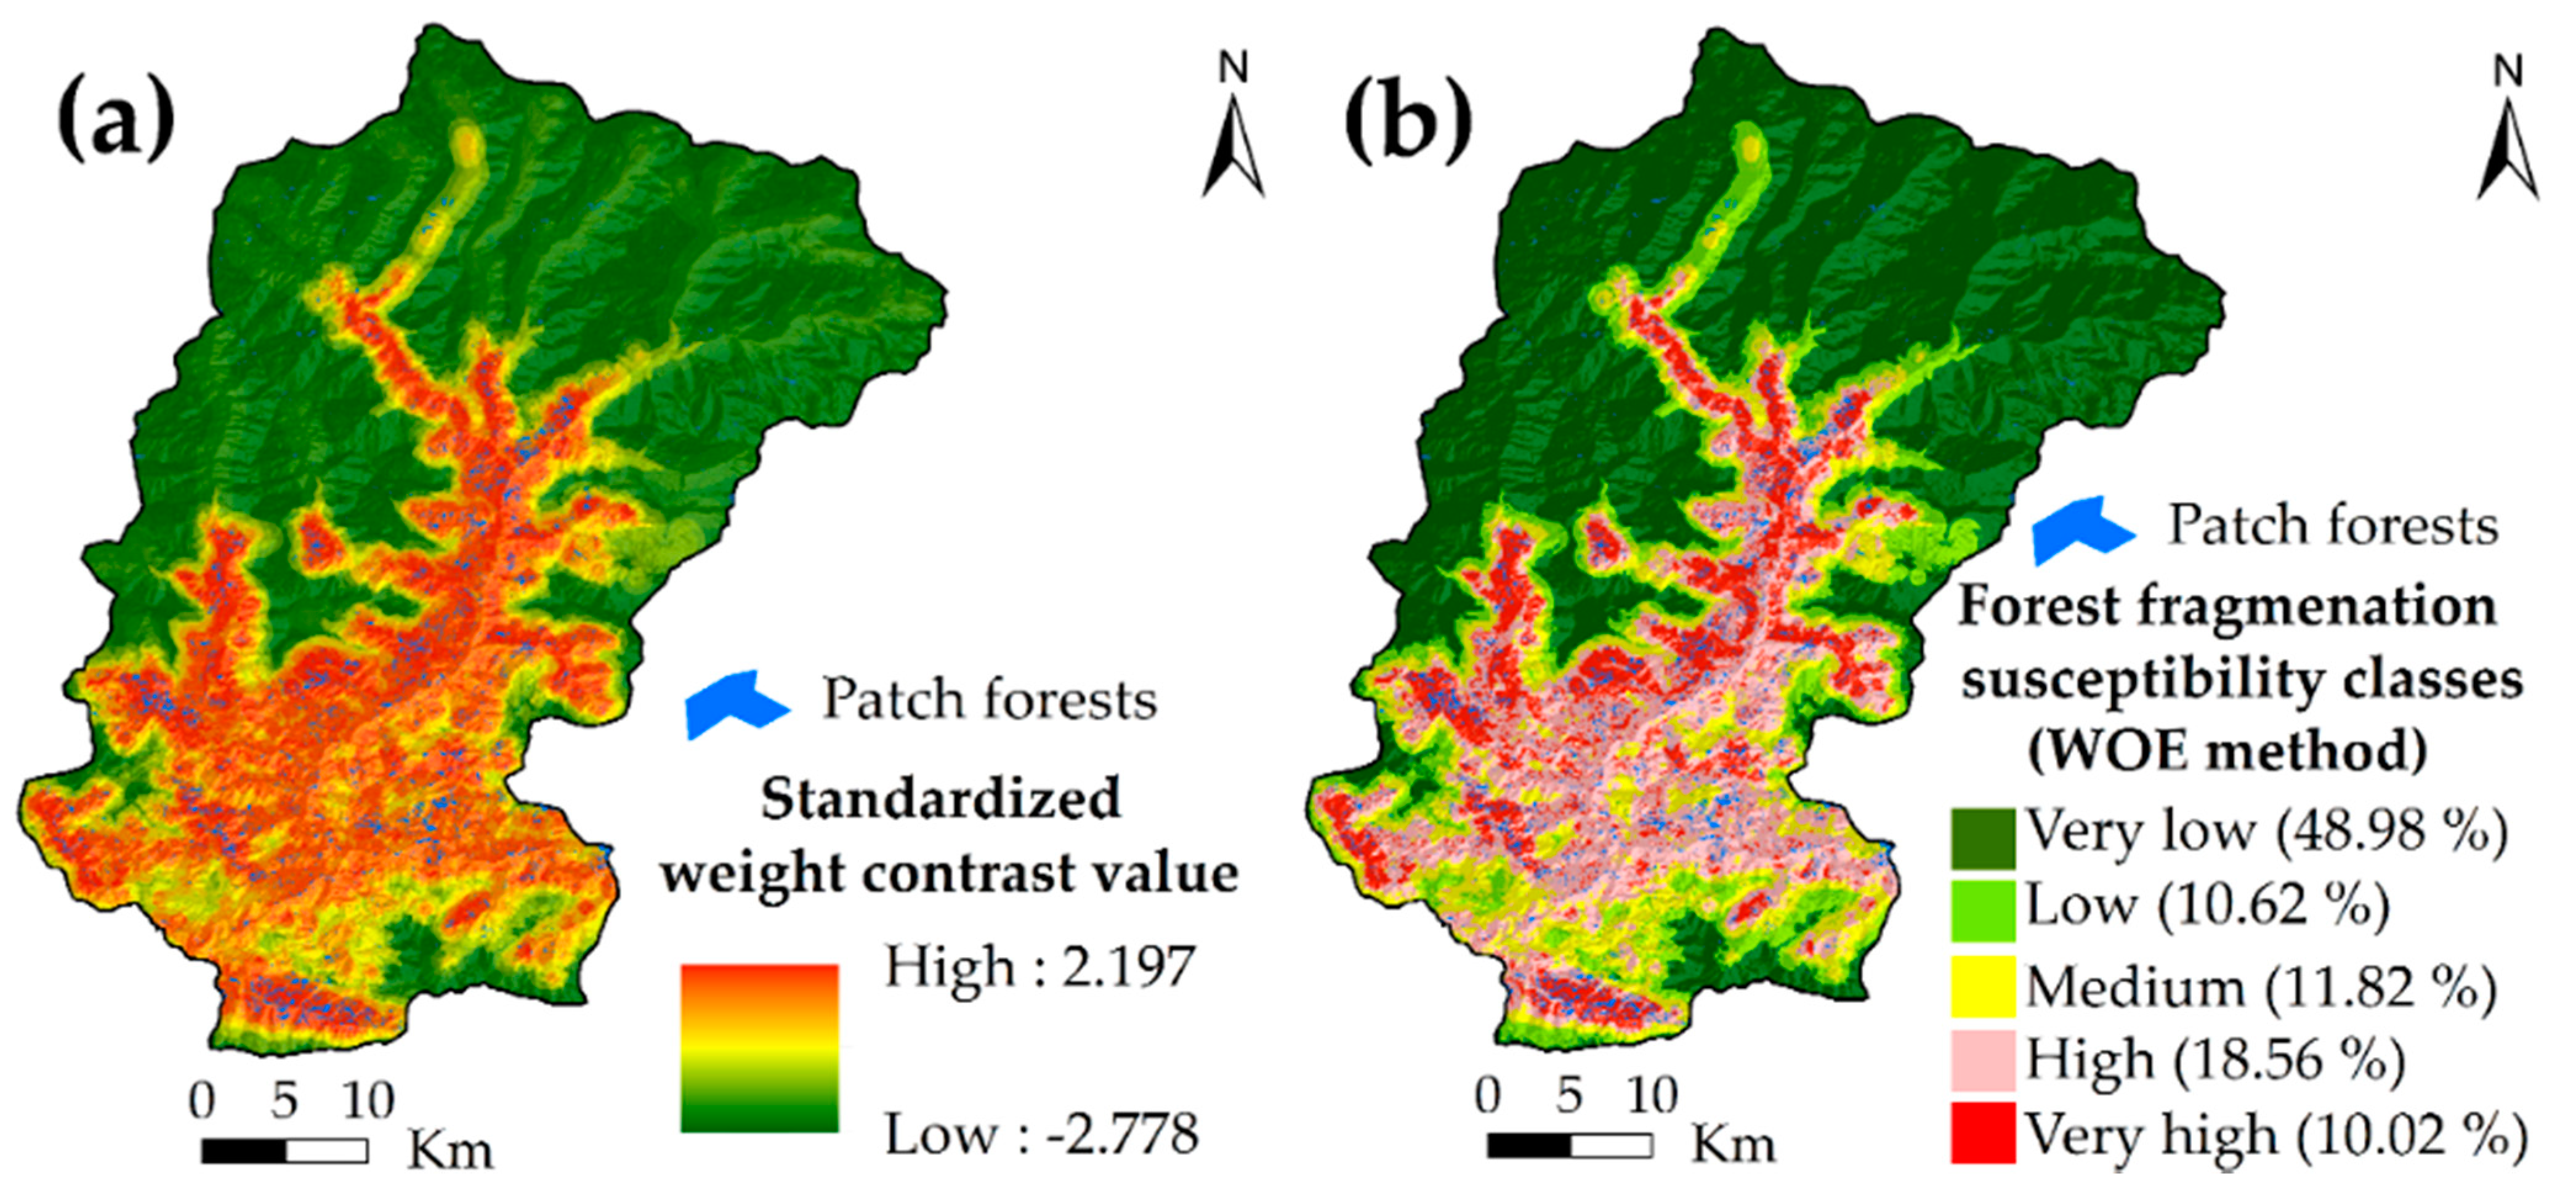
3.3. Forest Fragmentation Susceptibility Map

The forest fragmentation susceptibility map was derived based on patch forests and causative factors using the WOE method. The final map of forest fragmentation susceptibility in the Rudraprayag district is shown in Figure 6. Various mathematical methods are available to classify predictive degrees [63,69]. The forest fragmentation susceptibility map was classified into five levels by the natural interval break method using ArcGIS. The final output map of forest fragmentation susceptibility (Figure 6b) shows that 48.98% of the area has very low susceptibility, while 10.62%, 11.82%, 18.56%, and 10.02% of the area have low, medium, high, very high susceptibility, respectively. Our results reveal that around 40% of the study area is highly (medium to very high) susceptible to forest fragmentation, which covers most of the forest areas of this study area (Figure 6b).

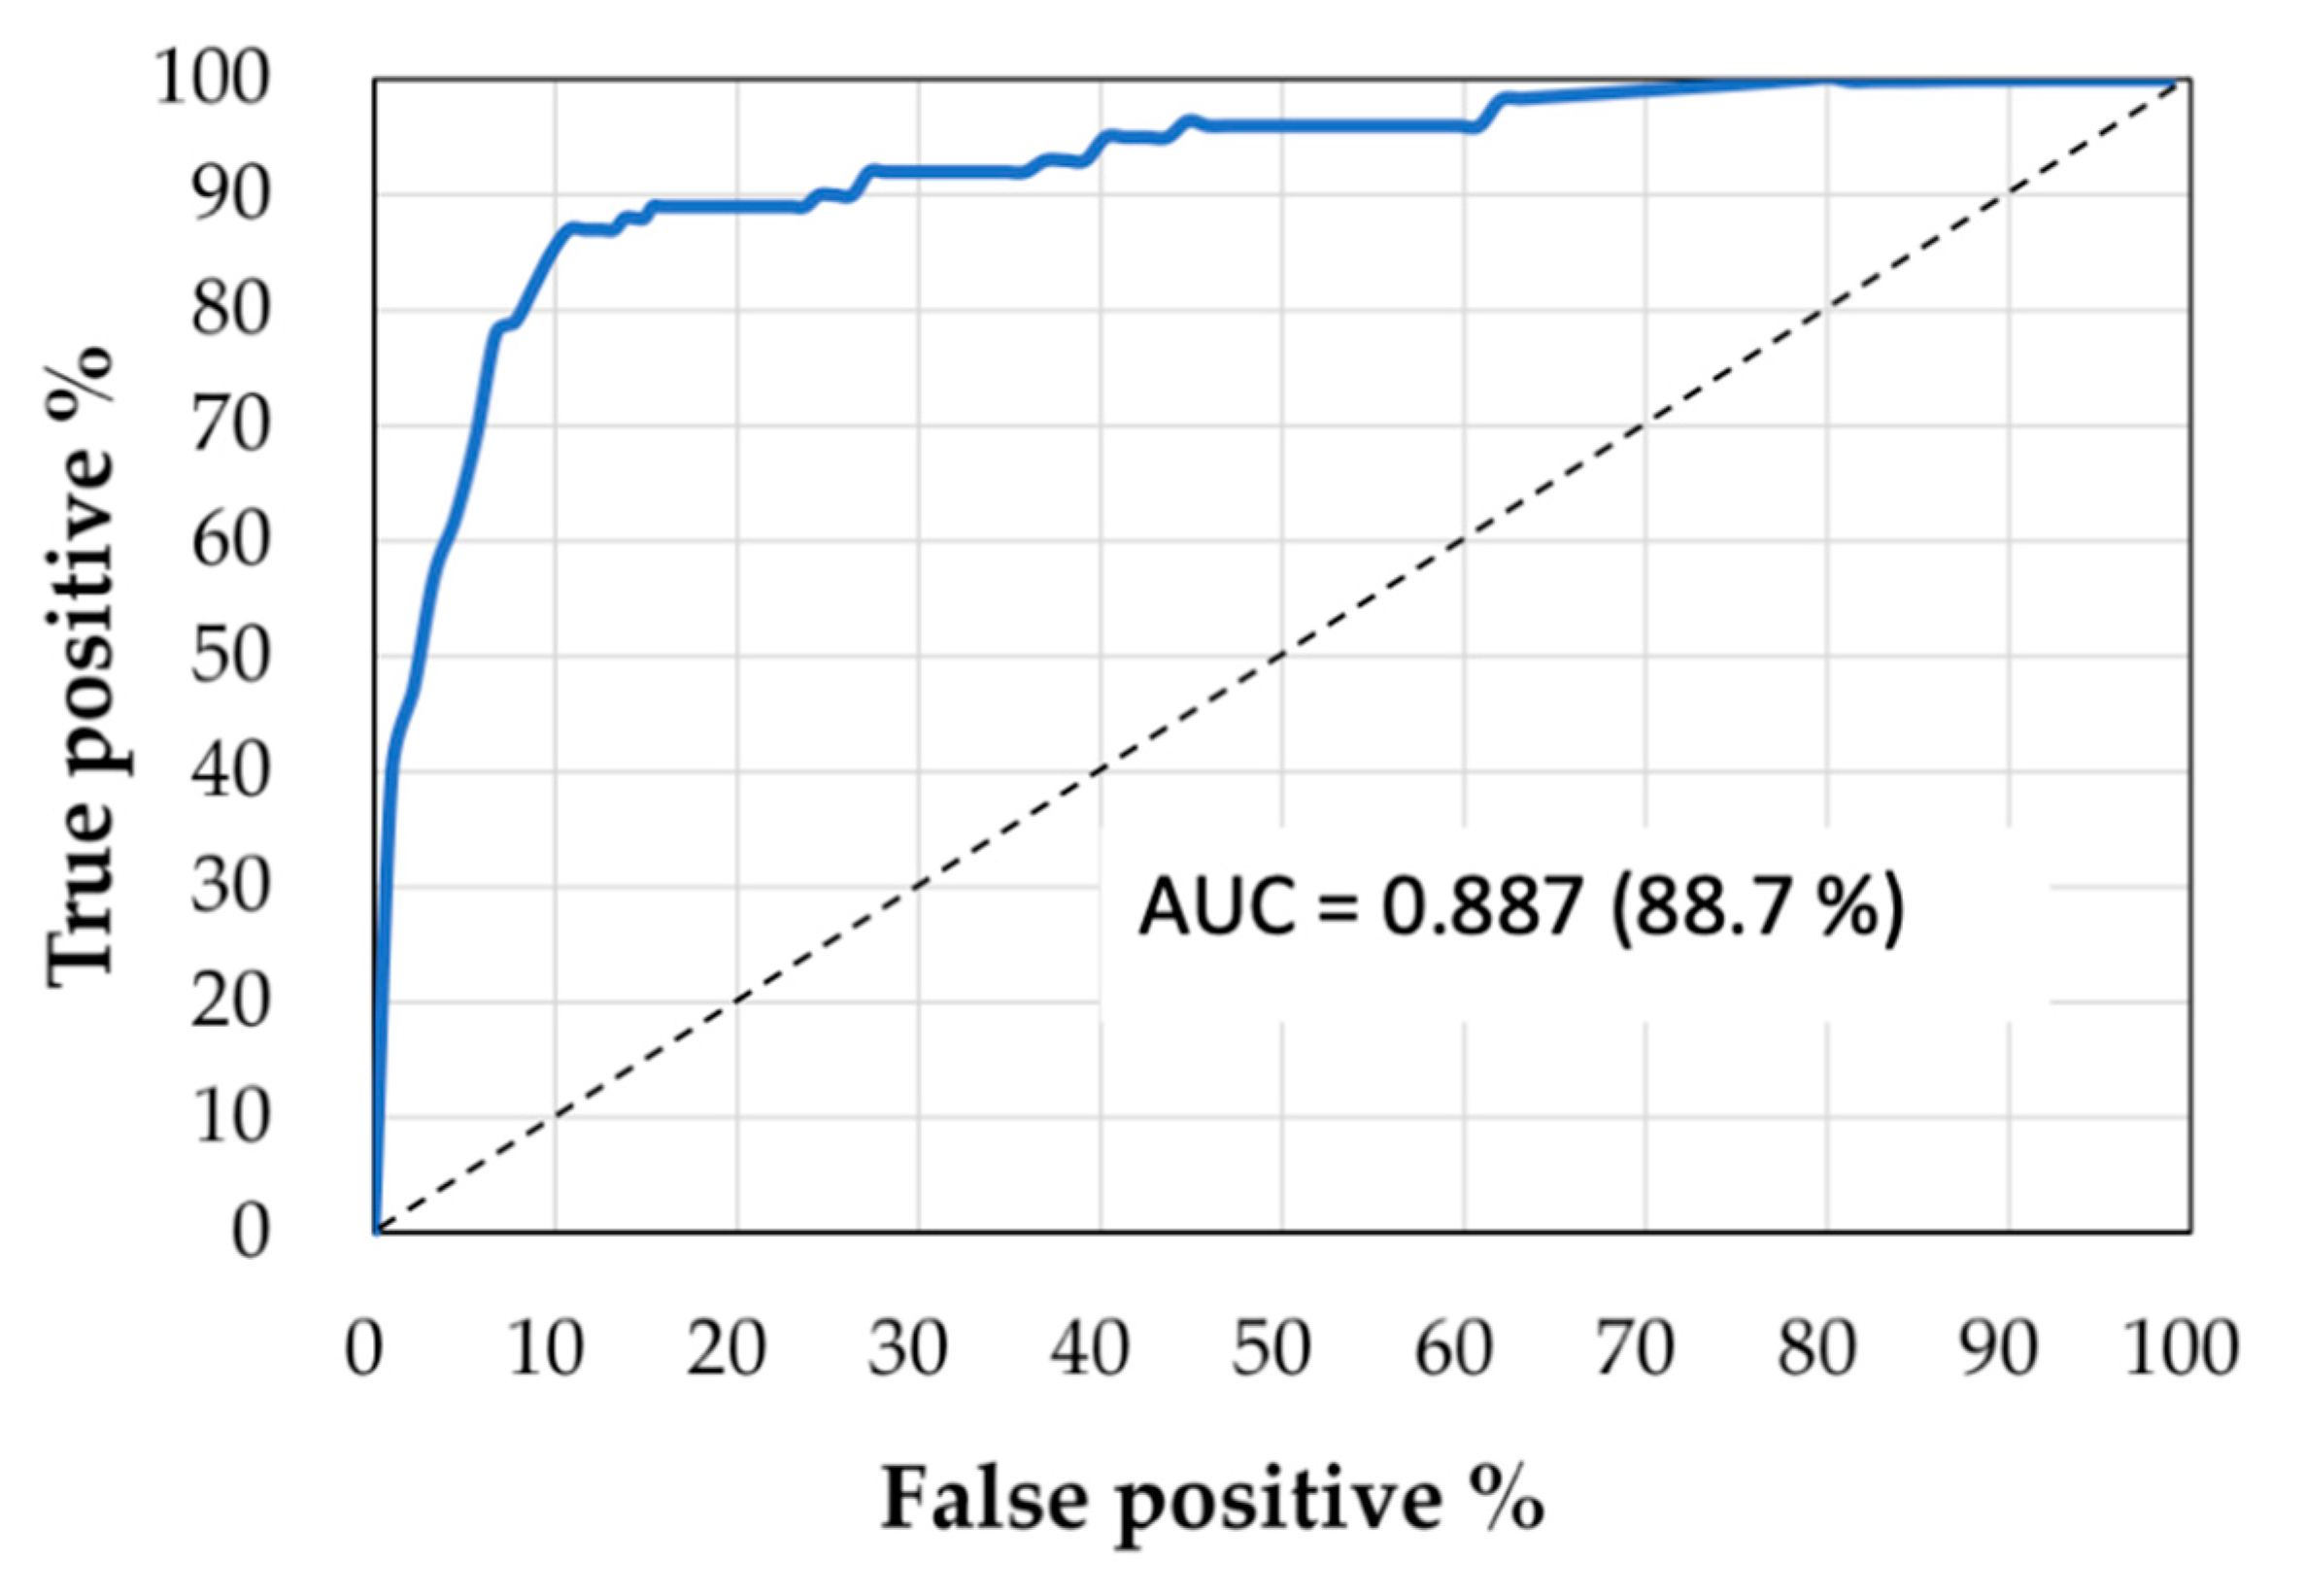
3.4. Validation of Forest Fragmentation Susceptibility Map

The area under the curve (AUC) of ROC illustrates that the integrated model gave the highest success rate. The integrated model achieved a prediction accuracy of 88.7% for susceptible areas to forest fragmentation. The ROC (AUC) curve for this study is shown in Figure 7.

3.5. Analysis of Forest Fragmentation Susceptibility

The results show that areas susceptible to forest fragmentation were primarily observed near built-up areas (less than 500 m), agricultural land (less than 500 m), roads (less than 1000 m), and streams (less than 500 m). The susceptibility map of forest fragmentation indicates that medium to very high susceptibilities are primarily concentrated in the lower to middle altitudes (less than 2000 m a.s.l.) (Figure 6 and Figure 8). Additionally, the susceptible areas to forest fragmentation were high in areas mainly south, east, southwest, and southeast directions and on very gentle and gentle slopes (less than 25 degrees) (Figure 2a and Figure 8). Overall, the results show that forest fragmentation is less likely to occur in higher altitude zones (more than 2000 m a.s.l.), whereas it is more likely to occur if proximity to built-up areas, roads, agricultural land, and streams is low (Figure 2 and Figure 8).

4. Discussion

4.1. Forest Fragmentation Susceptibility Mapping

Previous studies have measured or quantified the forest fragmentation process and their patterns at the patch, class, and landscape level, relying on multiple landscape metrics (landscape indices) or landscape tools (FRAGSTATS, LFTv2.0, Shape Metrics, Patch Analyst, PolyFrag, PyLandStats) [18,24,28,34,35,36,37,47,48,70,71]. However, there is no factor-based estimation of where forest fragmentation is likely to occur. For this purpose, we prepared a forest fragmentation susceptibility map for the first time by developing an integrated model and identified its causative factors in the forest landscape. This map is a factor-based estimation of forest fragmentation that avoids the uncertainty faced in landscape metrics. Our proposed integrated model is based upon the synergistic use of the earth observation data, forest fragmentation approach, patch forests, causative factors, and the weight-of-evidence (WOE) method in a GIS platform. We applied our model in the Rudraprayag district of the Indian Himalayan region as a case study. This model estimates the forest fragmentation susceptibility and can be applied easily in the GIS environment from the local to the global scale. Thus, our proposed integrated model is the first step towards understanding the likelihood of forest fragmentation occurring due to various anthropogenic and natural causative factors. We think this factor-based estimation of forest fragmentation susceptibility is critically vital for improving the integrity of the forest landscape and essential for long-term forest management strategy.
In this study, we used isolated patch forests as a proxy for degraded forests in our model, since these isolated patch forests are degraded forests caused by human modification and natural drivers in the Indian Himalayan region. Our previous study revealed that the forest fragmentation increased along with an increase in isolated patch forests due to the expansion of agricultural lands and built-up areas from 1976 to 2014 in this study area [21]. This previous study also highlighted that most of these patch forests are degraded patch forests situated in non-forest areas, which is not good for healthy forest landscapes [21]. In addition, tree mortality has increased in this study area due to natural disasters, which may lead to forest fragmentation [15,21,25,50]. Due to all these reasons, we think these remaining small and isolated patch forests will disappear in this study area if continuous forest conversion and loss occurs as a result of agricultural expansion, infrastructure development, and continuous natural hazards. Therefore, we used patch forests as a proxy for degraded forests caused by human modifications and natural drivers in the proposed model. For this purpose, we relied on the LFTv2.0, which provided four forest fragmentation patterns, including isolated patch forests, based upon a land cover map (forest and non-forest map), as defined by Vogt et al. [47] (Figure 4). Then we applied the WOE method for producing a map of the expected probability of forest fragmentation, i.e., forest fragmentation susceptibility map, by calculating patch forests and various anthropogenic and natural causative factors of forest fragmentation. The success rate of the forest fragmentation susceptibility map was checked against the testing set patch forests (30%). The integrated model achieved the highest prediction accuracy of 88.7% for susceptible areas to forest fragmentation. We think that the forest fragmentation susceptibility map of this study area is satisfactory for a regional study (study area 1936.06 km2) aiming to understand where and why forest landscape integrity is under threat due to forest fragmentation as a result of both anthropogenic and natural drivers. Thus, the forest fragmentation susceptibility map of this study will fill the necessary gap in minimizing forest fragmentation and improving the integrity of the forest landscape in the Indian Himalayan region.

4.2. Forest Fragmentation Susceptibility Analysis

Our study revealed that around 40% of the study area is highly susceptible to forest fragmentation. This study indicates that forest landscape integrity and rich biodiversity can be affected in the Indian Himalayan region. This study identified that built-up areas, agricultural activities, and roads are the major causative factors leading to forest fragmentation. This study also revealed that the forest fragmentation would occur mostly in the lower to middle altitude zones (less than 2000 m a.s.l.) (Figure 1, Figure 2c and Figure 8). This forest fragmentation is due to the large concentration of agricultural lands (Figure 2f), built-up areas (Figure 1 and Figure 2g), and roads (Figure 1 and Figure 2e) in the lower- to middle-altitude zones (1000–2000 m a.s.l.), indicating anthropogenic activities might influence forest cover in these zones (Figure 2c) and may lead to more forest fragmentation in this study area. In addition, the high-altitude zone (more than 3000 m a.s.l.) (Figure 2c) of the study area has low population density (Figure 1) than lower- and middle-altitudes zones (less than 2000 m a.s.l.) because the high-altitude zone of the study area is a protected area classified as a wildlife sanctuary (Figure 1). Additionally, the high-altitude zone of the study area (Figure 2c) has less forest cover because it is mainly covered by pasture, barren, and snow-covered land [21]. That is why the model results confirm that the high-altitude zone (Figure 2c) of the study area is less susceptible to forest fragmentation (Figure 5 and Figure 6b). The concentration of anthropogenic activities is high due to easy accessibility on gentle and very gentle slopes (less than 25 degrees) (Figure 2a). That is why our results also indicate that forest fragmentation susceptibility is very high on gentle and very gentle slopes (less than 25 degrees) (Figure 2a and Figure 8).
Although slope angle and elevation have played a significant role in controlling forest fragmentation in the study area (Figure 2a,c, and Figure 8), we think that forest fragmentation will increase at high-altitude zones (2000–3000 m a.s.l.) (Figure 2c) and steep slopes (25–45 degrees) (Figure 2a). We think this because our previous study indicated an upward movement of people to higher altitudes for agricultural activities and built-up areas [21]. For example, the southern boundary of the Kedarnath wildlife sanctuary (Figure 1), which is located at higher altitude, is facing pressure because the inhabitants of over 175 villages depend substantially on its resources for fuelwood, fodder, medicinal plants, and pastures for livestock grazing [21,52,53,72]. At the same time, the high-altitude zone of the study area is very famous for seasonal tourism (May to June and September to October). The Kedarnath temple is among the holiest pilgrimages for Hindu devotees and is near the Chorabari glacier at a high altitude (Figure 1). According to the data of Uttarakhand tourism, approximately 300,000 to 572,454 Indian people visited the Kedarnath temple in 2001 and 2012, respectively (https://uttarakhandtourism.gov.in) (accessed on 18 March 2021). Therefore, the wildlife sanctuary would be seriously threatened due to the continuous disturbance by human activities such as road development, hydro-power development, and tourism activities in the future [20,72]. As a result, the areas adjacent to the southern boundary of the Kedarnath wildlife sanctuary might experiences forest fragmentation in the future, which may change the continuity, quantity, and connectivity of the forest in the wildlife sanctuary.
Since most of the villages (Figure 1) and agriculture activities (Figure 2f) are concentrated near river channels (Figure 1 and Figure 2d), our results also indicate that forest fragmentation will most likely occur near major river channels (Figure 8). The slope aspect is a key contributing factor in human–environment interaction in mountainous terrain, where the availability and direction of sunlight plays a vital role in forest health and growth and human activities such as settlements and agriculture. We observed during our fieldwork that settlements and agricultural land in this study area are situated where the possibility of sunlight is high. That is why the model results confirm that susceptible areas to forest fragmentation will occur mainly in areas facing south, east, southwest, and southeast directions (Figure 2b and Figure 8). Thus, this integrated novel approach contributes to the comprehensive understanding of the underlying causative factors of forest fragmentation at the forest landscape level.
Since 1980, the Uttarakhand state of India, including this study area, has experienced the conversion of 44,868 hectares of forest land to non-forest use [21]. Additionally, recent forest conversion has been reported as a result of ongoing proposed development plans such as national highway and hydro-power projects. For example, in 2016, the Indian government started construction of the Char Dham National Highway in Uttarakhand state, which includes this study area (https://morth.nic.in/) (accessed on 20 September 2021). Thus, the study area will experience more forest fragmentation due to forest conversion, which will eventually affect the forest landscape integrity and rich biodiversity in the Indian Himalayan region. Therefore, there is an urgent need to create a buffer zone between natural forest and human activities and restore the degraded forest sites to avoid further forest fragmentation. As a result of this, negative effects of forest fragmentation such as carbon emissions at forest edge, structural and functional diversity of forest, habitat loss, shrinking of the wildlife area, and biodiversity loss can be minimized.

4.3. Implications Regarding Forest Types and Their Conservation

Identifying forest types and their species threatened due to forest fragmentation is vital for forest conservation. We analyzed forest fragmentation susceptibility and the new vegetation type map of India using the overlay method in ArcGIS to identify which forests are more likely to be under threat due to forest fragmentation. This new vegetation type map was prepared with 90% accuracy using 23.5-m spatial resolution satellite remote sensing data by Roy et al. [54] and is available through the web portal of Biodiversity Information System, India. Therefore, we further resampled the pixel size of the new vegetation type map to 30-m resolution and reclassified it into eight forest types, scrub, pasture, degraded forest (degraded formation forest), and non-forest classes. After that, we overlaid this new vegetation map of India [54] with the forest fragmentation susceptibility map (Figure 6b). Our study identified that Himalayan moist temperate and pine forests (Figure 9) are among the forests most threatened due to forest fragmentation in the future. Previous studies have indicated that the pine and oak trees are used for firewood, resin-tapping, and timber by 90% of the rural people in Uttarakhand state [73]. Additionally, the use of Himalayan temperate forests as fodder is high in the Indian Himalayan region [8,73]. This indicates the dependency on pine and Himalayan moist temperate forests for energy consumption, human well-being, and livelihood security. However, other vital forests such as oak (Quercus sp.), temperate coniferous, subalpine, sal (Shorea sp.), tropical sal mixed moist deciduous, and mixed plantation forests cannot be ignored, because of the continuous increase of anthropogenic activities and natural disasters in this study area. For example, Joshi et al. [1] studied ecosystem goods and the value provided by oak and pine forests of Uttarakhand state in India. Their study revealed that the value of the ecosystem goods from oak forests is greater than that from pine forests. Although forest conservation activities in India have a long history, starting with the Chipko Movement in Uttarakhand state in 1973, current forest conversion, loss, and dependency are still major concerns for socio-ecological sustainability. This study will help policymakers and forest planners achieve ecological restoration and maintain the rich biodiversity of this study area.

4.4. Limitations and Future Work

Forest loss is not always a result of deforestation, which means that other causes are also responsible for forest loss and can contribute to forest fragmentation. The Rudraprayag district is highly prone to natural hazards such as forest fire, landslide, and flood. For example, the study area faced a flash flood disaster due to heavy rain on 16/17 June 2013, which caused widespread destruction and forest loss [15,21,25,50]. These external natural hazards can further increase forest fragmentation, which would further deteriorate the overall forest landscape. However, this study could not use external drivers such as forest fires, floods, and landslides due to the lack of reliable and complete data, even though their potential influence may be important. Moreover, such external drivers of forest fragmentation can help reveal a better understanding of the forest fragmentation process and their susceptibility in the Indian Himalayan region at different scales.
We relied on the LFTv2.0 tool [47] to extract the degraded patch forests on the basis of land cover data. However, extraction of accurate patch forests might be challenging in high mountainous terrain like the Indian Himalayas due to cloud cover issues and low-resolution optical remote sensing satellite data. Therefore, high-resolution satellite data might be helpful for extracting accurate patch forests to achieve more accuracy of the model. In addition, it should be noted that the model performance depends on the quality of the data, scale, size of the study, and uncertainties associated with the digitization of the spatial data, which may even lead to large errors in subsequent analyses. Moreover, the pattern of forest fragmentation may vary at different scales and depends on the spatial scale or resolution of the data [74,75,76,77,78]. Although the WOE method can be used on spatial data for producing maps of the expected probability of occurrence, the accuracy of the WOE method can be compared with other quantitative or machine learning methods to achieve more prediction accuracy of forest fragmentation susceptibility modeling.
The role of forests is not only limited to socio-economic development, through their goods and services, but also an essential part of climate change mitigation. However, forest fragmentation has caused the degradation of the forest landscape and increased carbon emissions. Therefore, the loss of forest goods and services and loss of carbon sinks due to forest fragmentation can be further analyzed to minimize the negative impacts of forest fragmentation at local, regional, and national levels.

5. Conclusions

Forest landscape is under threat due to forest fragmentation, and the Indian Himalayan region is no exception. Therefore, this study prepared a forest fragmentation susceptibility map and identified the causative factors and susceptibility levels for each forest type in the forest landscape. This forest fragmentation susceptibility map is essential for minimizing further forest fragmentation and can help to improve the integrity of the forest landscape. For this purpose, we used patch forests as past evidence of completely degraded forests using the WOE method in our integrated model. We evaluated the applicability of this model in the Indian Himalayan region, a region with rich biodiversity and environmental significance on the Indian subcontinent. Our model achieved a prediction accuracy of 88.7%, indicating the good accuracy of the model. Our study revealed that around 40% of the study area is highly susceptible to forest fragmentation. This study identified that built-up areas, agricultural activities, roads, and streams are the major causative factors leading to forest fragmentation. This study also revealed that the forest fragmentation will occur mostly in the lower to middle altitude zones (less than 2000 m a.s.l.) of the study area. Additionally, forest fragmentation will likely occur in areas mainly facing in the south, east, southwest, and southeast directions, and on very gentle and gentle slopes (less than 25 degrees). This integrated approach also identified that Himalayan moist temperate and pine forests are likely to be those most affected by forest fragmentation. The results suggest that the study area will experience more forest fragmentation in the future, which will eventually affect the forest landscape integrity and rich biodiversity in the Indian Himalayan region.
The synergistic and combined use of earth observation data, forest fragmentation approach, causative factors, and statistical method in a GIS platform has provided a positive step toward gaining a comprehensive understanding of forest fragmentation susceptibility and its causative factors. Thus, the integrated model adopted in this study will be helpful in minimizing forest fragmentation and improving the integrity of the forest landscape through the implementation of rational forest restoration, reforestation, and afforestation schemes. This study will improve the information and research gap related to potential changes in forest fragmentation at the regional and national levels in India. This study approach can be applied to estimate future forest fragmentation in other biodiversity hotspots.

Author Contributions

Conceptualization, methodology, software, formal analysis, writing—original draft preparation, A.K.B.; writing—review and editing, A.K.B., H.S. and T.W. All authors have read and agreed to the published version of the manuscript.

Funding

This research received no external funding.

Institutional Review Board Statement

Not applicable.

Informed Consent Statement

Not applicable.

Data Availability Statement

Not applicable.

Acknowledgments

This study contributes to the Global Land Programme (GLP), a global research project of Future Earth. We acknowledge the free access of spatial data from BHUVAN, a geospatial platform developed by the Indian Space Research Organization (ISRO). This study was performed using ArcGIS 10.2, LFTv2.0, and IDRISI SELVA 17.0 software. We want to thank Nirmit Sakre, Rajkamal Kumar, Ajay Kumar Gurjar, Arun Mishra, Eshank Batar, and the local people of Rudraprayag district for their help during the fieldwork.

Conflicts of Interest

The authors declare no conflict of interest.

References

  1. Joshi, G.; Negi, G.C. Quantification and valuation of forest ecosystem services in the western Himalayan region of India. Int. J. Biodivers. Sci. Ecosyst. Serv. Manag. 2011, 7, 2–11. [Google Scholar] [CrossRef] [Green Version]
  2. Joshi, A.K.; Joshi, P.K. Forest Ecosystem Services in the Central Himalaya: Local Benefits and Global Relevance. Proc. Natl. Acad. Sci. India Sect. B Biol. Sci. 2019, 89, 785–792. [Google Scholar] [CrossRef]
  3. Rasul, G. The Role of the Himalayan Mountain Systems in Food Security and Agricultural Sustainability in South Asia. Int. J. Rural Manag. 2010, 6, 95–116. [Google Scholar] [CrossRef]
  4. Singh, J.S. Sustainable development of the Indian Himalayan region: Linking ecological and economic concerns. Curr. Sci. 2006, 90, 784–788. Available online: http://www.jstor.org/stable/24089189 (accessed on 18 March 2021).
  5. Rasul, G.; Karki, M.; Sah, R.P. The role of non-timber forest products in poverty reduction in India: Prospects and problems. Dev. Pract. 2008, 18, 779–788. [Google Scholar] [CrossRef]
  6. Rijal, A.; Carsten, S.-H.; Finn, H. Non-timber forest product dependency in the Central Himalyan foothills. Environ. Dev. Sustain. 2011, 13, 121–140. [Google Scholar] [CrossRef]
  7. Pandey, R.; Steve, H.; Gupta, A.K. Resource Availability Versus Resource Extraction in Forests: Analysis of Forest Fodder System in Forest Density Classes in Lower Himalayas, India. Small-Scale For. 2014, 13, 267–279. [Google Scholar] [CrossRef]
  8. Chakraborty, A.; Joshi, P.K.; Sachdeva, K. Capturing Forest dependency in the central Himalayan region: Variations between Oak (Quercus spp.) and Pine (Pinus spp.) dominated forest landscapes. Ambio 2018, 47, 504–522. [Google Scholar] [CrossRef] [PubMed]
  9. Chettri, N.; Sharma, E.; Deb, D.C.; Sundriyal, R.C. Impact of Firewood Extraction on Tree Structure, Regeneration and Woody Biomass Productivity in a Trekking Corridor of the Sikkim Himalaya. Mt. Res. Dev. 2002, 22, 150–158. [Google Scholar] [CrossRef] [Green Version]
  10. Tiwari, P.C. Land-use changes in Himalaya and their impact on the plains ecosystem: Need for sustainable land use. Land Use Policy 2000, 17, 101–111. [Google Scholar] [CrossRef]
  11. Sundriyal, R.C.; Sharma, E. Anthropogenic pressure on tree structure and biomass in the temperate forest of Mamlay watershed in Sikkim. For. Ecol. Manag. 1996, 81, 113–134. [Google Scholar] [CrossRef]
  12. Sharma, S.; Roy, P.S. Forest fragmentation in the Himalaya: A Central Himalayan case study. Int. J. Sustain. Dev. World Ecol. 2007, 14, 201–210. [Google Scholar] [CrossRef]
  13. Chakraborty, A.; Ghosh, A.; Sachdeva, K.; Joshi, P.K. Characterizing fragmentation trends of the Himalayan forests in the Kumaon region of Uttarakhand, India. Ecol. Inform. 2017, 38, 95–109. [Google Scholar] [CrossRef]
  14. Mishra, N.B.; Chaudhuri, G. Spatio-temporal analysis of trends in seasonal vegetation productivity across Uttarakhand, Indian Himalayas, 2000–2014. Appl. Geogr. 2015, 56, 29–41. [Google Scholar] [CrossRef]
  15. Pandit, M.K.; Sodhi, N.S.; Koh, L.P.; Bhaskar, A.; Brook, B.W. Unreported yet massive deforestation driving loss of endemic biodiversity in Indian Himalaya. Biodivers. Conserv. 2007, 16, 153–163. [Google Scholar] [CrossRef]
  16. Nagendra, H.; Munroe, D.K.; Southworth, J. From pattern to process landscape fragmentation and the analysis of land use/land cover change. Agric. Ecosyst. Environ. 2004, 101, 111–115. [Google Scholar] [CrossRef]
  17. Sharma, M. Assessing Forest fragmentation in north-western Himalaya: A case study from Ranikhet forest range, Uttarakhand, India. J. For. Res. 2017, 28, 319–327. [Google Scholar] [CrossRef]
  18. Lele, N.; Joshi, P.K.; Agrawal, S.P. Assessing Forest fragmentation in northeastern region (NER) of India using landscape matrices. Ecol. Indic. 2008, 8, 657–663. [Google Scholar] [CrossRef]
  19. Munsi, M.; Malaviya, S.; Oinam, G.; Joshi, P.K. A landscape approach for quantifying land-use and land-cover change (1976–2006) in middle Himalaya. Reg. Environ. Chang. 2010, 10, 145–155. [Google Scholar] [CrossRef]
  20. Sharma, M.; Areendran, G.; Raj, K.; Sharma, A.; Joshi, P.K. Multitemporal analysis of forest fragmentation in Hindu Kush Himalaya—a case study from Khangchendzonga Biosphere Reserve, Sikkim, India. Environ. Monit. Assess. 2016, 188, 596. [Google Scholar] [CrossRef]
  21. Batar, A.; Watanabe, T.; Kumar, A. Assessment of Land-Use/Land-Cover Change and Forest Fragmentation in the Garhwal Himalayan Region of India. Environments 2017, 4, 34. [Google Scholar] [CrossRef] [Green Version]
  22. Kumar, A.; Ram, J. Anthropogenic disturbances, and plant biodiversity in forests of Uttaranchal, central Himalaya. Biodivers. Conserv. 2005, 14, 309–331. [Google Scholar] [CrossRef]
  23. Pandit, M.K.; Kumar, V. Land-Use Change and Conservation Challenges in the Indian Himalaya. In Conservation Biology; John Wiley & Sons, Ltd.: Hoboken, NJ, USA, 2013; pp. 121–133. [Google Scholar] [CrossRef]
  24. Midha, N.; Mathur, P.K. Assessment of forest fragmentation in the conservation priority Dudhwa landscape, India using FRAGSTATS computed class level metrics. J. Indian Soc. Remote Sens. 2010, 38, 487–500. [Google Scholar] [CrossRef]
  25. Kala, C.P. Deluge, disaster and development in Uttarakhand Himalayan region of India: Challenges and lessons for disaster management. Int. J. Disaster Risk Reduct. 2014, 8, 143–152. [Google Scholar] [CrossRef]
  26. Collingham, Y.C.; Huntley, B. Impacts of Habitat Fragmentation and Patch Size upon Migration Rates. Ecol. Appl. 2000, 10, 131–144. [Google Scholar] [CrossRef]
  27. Fischer, J.; Lindenmayer, D.B. Landscape modification and habitat fragmentation: A synthesis. Glob. Ecol. Biogeogr. 2007, 16, 265–280. [Google Scholar] [CrossRef]
  28. Riitters, K.; Wickham, J.; O’Neill, R.; Jones, B.; Smith, E. Global-scale patterns of forest fragmentation. Conserv. Ecol. 2000, 4. Available online: https://www.ecologyandsociety.org/vol4/iss2/art3/ (accessed on 18 March 2021). [CrossRef]
  29. Laurance, W.F.; Heraldo, L.V.; Thomas, E.L. Forest loss and fragmentation in the Amazon: Implications for wildlife conservation. Oryx 2000, 34, 39–45. [Google Scholar] [CrossRef]
  30. Fahrig, L. Effects of Habitat Fragmentation on Biodiversity. Annu. Rev. Ecol. Evol. Syst. 2003, 34, 487–515. [Google Scholar] [CrossRef] [Green Version]
  31. Leal, I.R.; Filgueiras, B.K.; Gomes, J.P.; Iannuzzi, L.; Andersen, A.N. Effects of habitat fragmentation on ant richness and functional composition in Brazilian Atlantic Forest. Biodivers. Conserv. 2012, 21, 1687–1701. [Google Scholar] [CrossRef]
  32. Fischer, R.; Taubert, F.; Müller, M.S.; Groeneveld, J.; Lehmann, S.; Wiegand, T.; Huth, A. Accelerated Forest fragmentation leads to critical increase in tropical forest edge area. Sci. Adv. 2021, 7, 37. [Google Scholar] [CrossRef] [PubMed]
  33. Huebner, C.D.; Randolph, J.C.; Parker, G.R. Environmental Factors Affecting Understory Diversity in Second-Growth Deciduous Forests. Am. Midl. Nat. 1995, 134, 155–165. [Google Scholar] [CrossRef]
  34. Roy, P.S.; Kushwaha, S.P.; Murthy, M.S.; Roy, A.; Kushwaha, D.; Reddy, C.S.; Behera, M.D.; Mathur, V.B.; Padalia, H.; Saran, S.; et al. Biodiversity characterisation at landscape level: National assessment. In Biodiversity Characterisation at Landscape Level: National Assessment; Indian Institute of Remote Sensing: Dehradun, India, 2012; Volume 3, pp. 31–83. Available online: https://www.researchgate.net/publication/262372416_Biodiversity_Characterisation_at_Landscape_Level_National_Assessment (accessed on 18 March 2021).
  35. Reddy, C.S.; Sreelekshmi, S.; Jha, C.S.; Dadhwal, V.K. National assessment of forest fragmentation in India: Landscape indices as measures of the effects of fragmentation and forest cover change. Ecol. Eng. 2013, 60, 453–464. [Google Scholar] [CrossRef]
  36. O’Neill, R.V.; Krummel, J.R.; Gardner, R.E.; Sugihara, G.; Jackson, B.; DeAngelis, D.L.; Milne, B.T.; Turner, M.G.; Zygmunt, B.; Christensen, S.W.; et al. Indices of landscape pattern. Landsc. Ecol. 1998, 1, 153–162. [Google Scholar] [CrossRef]
  37. Jaeger, J.A.G. Landscape division, splitting index, and effective mesh size: New measures of landscape fragmentation. Landsc. Ecol. 2000, 15, 115–130. [Google Scholar] [CrossRef]
  38. Turner, M.G.; O’Neill, R.V.; Gardner, R.H.; Milne, B.T. Effects of changing spatial scale on the analysis of landscape pattern. Landsc. Ecol. 1989, 3, 153–162. [Google Scholar] [CrossRef]
  39. Brown, D.G.; Duh, J.D.; Scott, A.D. Estimating Error in an Analysis of Forest Fragmentation Change Using North American Landscape Characterization (NALC) Data. Remote Sens. Environ. 2000, 71, 106–117. [Google Scholar] [CrossRef]
  40. Tischendorf, L. Can landscape indices predict ecological processes consistently? Landsc. Ecol. 2001, 16, 235–254. [Google Scholar] [CrossRef]
  41. Millington, A.C.; Velez-Liendo, X.M.; Bradley, A.V. Scale dependence in multi-temporal mapping of forest fragmentation in Bolivia: Implications for explaining temporal trends in landscape ecology and applications to biodiversity conservation. ISPRS J. Photogramm. Remote Sens. 2003, 57, 289–299. [Google Scholar] [CrossRef]
  42. Bogaert, J. Lack of agreement on fragmentation metrics blurs correspondence between fragmentation experiments and predicted effects. Conserv. Ecol. 2003, 7, r6. [Google Scholar] [CrossRef] [Green Version]
  43. Neel, M.C.; McGarigal, K.; Cushman, S.A. Behavior of class-level landscape metrics across gradients of class aggregation and area. Landsc. Ecol. 2004, 19, 435–455. [Google Scholar] [CrossRef]
  44. Mander, Ü.; Müller, F.; Wrbka, T. Functional and structural landscape indicators: Upscaling and downscaling problems. Ecol. Indic. 2005, 4, 267–272. [Google Scholar] [CrossRef]
  45. Ewers, R.M.; Laurance, W.F. Scale-dependent patterns of deforestation in the Brazilian Amazon. Environ. Conserv. 2006, 33, 203–211. [Google Scholar] [CrossRef] [Green Version]
  46. Frazier, A.E.; Kedron, P. Landscape Metrics: Past Progress and Future Directions. Curr. Landsc. Ecol. Rep. 2017, 2, 63–72. [Google Scholar] [CrossRef] [Green Version]
  47. Vogt, P.; Riitters, K.H.; Estreguil, C.; Kozak, J.; Wade, T.G.; Wickham, J.D. Mapping Spatial Patterns with Morphological Image Processing. Landsc. Ecol. 2007, 22, 171–177. [Google Scholar] [CrossRef]
  48. Hurd, J.D.; Civco, D.L. Assessing Forest Fragmentation in Connecticut Using Multi- Temporal Land Cover. In Proceedings of the ASPRS Annual Conference, San Diego, CA, USA, 26–30 April 2010; Available online: https://clear.uconn.edu/publications/research/tech_papers/Hurd_et_al_ASPRS2010.pdf (accessed on 18 March 2021).
  49. Kumar, G. Geology of the Srinagar-Nandprayag area (Alaknanda Valley), Chamoli, Garhwal and Tehri Garhwal districts, Kumaun Himalaya, Uttar Pradesh. Him. Geol. 1975, 5, 29–59. Available online: https://ci.nii.ac.jp/naid/10026140513/en/ (accessed on 18 March 2021).
  50. Rautela, P.; Sajwan, K.S. Geological Investigations in Rudraprayag District with Special Reference to Mass Instability; Technical Reports; Department of Disaster Management, Disaster Mitigation and Management Centre (DMMC): Dehradun, India, 2014. Available online: http://dmmc.uk.gov.in/files/pdf/Rudraprayag_final.pdf (accessed on 18 March 2021).
  51. NICRA, National Innovations in Climate Resilient Agriculture. District Wise Agricultural Contingency Plans; Technical Reports. Central Research Institute for Dryland Agriculture (CRIDA), Indian Council of Agricultural Research (ICAR), Ministry of Agriculture, Government of India: New Delhi, India, 2009. Available online: http://www.nicra-icar.in/nicrarevised/index.php/state-wise-plan (accessed on 18 March 2021).
  52. Bhat, J.A.; Kumar, M.; Negi, A.K.; Todaria, N.P. Informants’ consensus on ethnomedicinal plants in Kedarnath Wildlife Sanctuary of Indian Himalayas. J. Med. Plants Res. 2013, 7, 148–154. [Google Scholar]
  53. Kittur, S. Assessment of spatial and habitat use overlap between Himalayan tahr and livestock in Kedarnath Wildlife Sanctuary, India. Eur. J. Wildl. Res. 2010, 56, 195–204. [Google Scholar] [CrossRef]
  54. Roy, P.S.; Behera, M.D.; Murthy, M.S.; Roy, A.; Singh, S.; Kushwaha, S.P.; Jha, C.S.; Sudhakar, S.; Joshi, P.K.; Reddy, C.S.; et al. New vegetation type map of India prepared using satellite remote sensing: Comparison with global vegetation maps and utilities. Int. J. Appl. Earth Obs. Geoinf. 2015, 39, 142–159. [Google Scholar] [CrossRef]
  55. Daoud, J.I. Multicollinearity and Regression Analysis. J. Phys. Conf. Ser. 2017, 949, 012009. [Google Scholar] [CrossRef]
  56. Bonham-Carter, G.F.; Agterberg, F.P.; Wright, D.F. Weights of evidence modelling: A new approach to mapping mineral potential. Comput. Methods Geosci. 1990, 171–183. [Google Scholar] [CrossRef]
  57. Duke, C.; Steele, J. Geology and lithic procurement in Upper Palaeolithic Europe: A weights-of-evidence based GIS model of lithic resource potential. J. Archaeol. Sci. 2010, 37, 813–824. [Google Scholar] [CrossRef]
  58. Sterlacchini, S.; Ballabio, C.; Blahut, J.; Masetti, M.; Sorichetta, A. Spatial agreement of predicted patterns in landslide susceptibility maps. Geomorphology 2011, 125, 51–61. [Google Scholar] [CrossRef]
  59. Lee, S.; Choi, J. Landslide susceptibility mapping using GIS and the weight-of-evidence model. Int. J. Geogr. Inf. Sci. 2004, 18, 789–814. [Google Scholar] [CrossRef]
  60. Dilts, T.E.; Sibold, J.S.; Biondi, F. A Weights-of-Evidence Model for Mapping the Probability of Fire Occurrence in Lincoln County, Nevada. Ann. Assoc. Am. Geogr. 2009, 99, 712–727. [Google Scholar] [CrossRef]
  61. Malek, Z.; Boerboom, L.; Glade, T. Future Forest Cover Change Scenarios with Implications for Landslide Risk: An Example from Buzau Subcarpathians, Romania. Environ. Manag. 2015, 56, 1228–1243. [Google Scholar] [CrossRef] [PubMed] [Green Version]
  62. Vakhshoori, V.; Zare, M. Landslide susceptibility mapping by comparing weight of evidence, fuzzy logic, and frequency ratio methods. Geomat. Nat. Hazards Risk 2016, 7, 1731–1752. [Google Scholar] [CrossRef]
  63. Batar, A.K.; Watanabe, T. Landslide Susceptibility Mapping and Assessment Using Geospatial Platforms and Weights of Evidence (WoE) Method in the Indian Himalayan Region: Recent Developments, Gaps, and Future Directions. ISPRS Int. J. Geo-Inf. 2021, 10, 114. [Google Scholar] [CrossRef]
  64. Bonham-Carter, G.F. Computer Methods in the Geosciences. In Geographic Information Systems for Geoscientists; 1994; Volume 13, Available online: https://www.sciencedirect.com/bookseries/computer-methods-in-the-geosciences/vol/13/suppl/C (accessed on 18 March 2021).
  65. Pourghasemi, H.R.; Pradhan, B.; Gokceoglu, C.; Mohammadi, M.; Moradi, H.R. Application of weights-of-evidence and certainty factor models and their comparison in landslide susceptibility mapping at Haraz watershed, Iran. Arab J. Geosci. 2013, 6, 2351–2365. [Google Scholar] [CrossRef]
  66. Regmi, N.R.; Giardino, J.R.; Vitek, J.D. Modeling susceptibility to landslides using the weight of evidence approach: Western Colorado, USA. Geomorphology 2010, 115, 172–187. [Google Scholar] [CrossRef]
  67. Fan, D.; Cui, X.M.; Yuan, D.B.; Wang, J.; Yang, J.; Wang, S. Weight of Evidence Method and Its Applications and Development. Procedia Environ. Sci. 2011, 11, 1412–1418. [Google Scholar] [CrossRef] [Green Version]
  68. Fawcett, T. An introduction to ROC analysis. Pattern Recognit. Lett. 2006, 27, 861–874. [Google Scholar] [CrossRef]
  69. Ayalew, L.; Yamagishi, H. The application of GIS-based logistic regression for land-slide susceptibility mapping in the Kakuda-Yahiko Mountains, Central Japan. Geomorphology 2005, 65, 15–31. [Google Scholar] [CrossRef]
  70. MacLean, M.G.; Congalton, R.G. A comparison of landscape fragmentation analysis programs for identifying possible invasive plant species locations in forest edge. Landsc. Ecol. 2015, 30, 1241–1256. [Google Scholar] [CrossRef]
  71. Bosch, M. PyLandStats: An open-source Pythonic library to compute landscape metrics. PLoS ONE 2019, 14, e0225734. [Google Scholar] [CrossRef] [Green Version]
  72. Misra, S.; Maikhuri, R.K.; Dhyani, D.; Rao, K.S. Assessment of traditional rights, local interference and natural resource management in Kedarnath Wildlife Sanctuary. Int. J. Sustain. Dev. World Ecol. 2009, 16, 404–416. [Google Scholar] [CrossRef]
  73. Sati, V.P.; Bandooni, S.K. Forests of Uttarakhand: Diversity, Distribution, Use Pattern and Conservation. ENVIS Bull. Himal. Ecol. 2018, 26, 21–27. Available online: http://gbpihedenvis.nic.in/Envis_Bulletin_Vol.26_2018.html (accessed on 20 September 2021).
  74. Wu, J. Effects of changing scale on landscape pattern analysis: Scaling relations. Landsc. Ecol. 2004, 19, 125–138. [Google Scholar] [CrossRef]
  75. Cattarino, L.; McAlpine, C.A.; Rhodes, J.R. Land-use drivers of forest fragmentation vary with spatial scale. Glob. Ecol. Biogeogr. 2014, 23, 1215–1224. [Google Scholar] [CrossRef] [Green Version]
  76. Wickham, J.; Riitters, K.H. Influence of high-resolution data on the assessment of forest fragmentation. Landsc. Ecol. 2019, 34, 2169–2182. [Google Scholar] [CrossRef] [Green Version]
  77. Geist, H.J.; Lambin, E.F. What Drives Tropical Deforestation? A Meta-Analysis of Proximate and Underlying Causes of Deforestation Based on Subnational Case Study Evidence. 2001. Available online: https://www.pik-potsdam.de/members/cramer/teaching/0607/Geist_2001_LUCC_Report.pdf (accessed on 18 March 2021).
  78. Lambin, E.F.; Turner, B.L.; Geist, H.J.; Agbola, S.B.; Angelsen, A.; Bruce, J.W.; Coomes, O.T.; Dirzo, R.; Fischer, G.; Folke, C.; et al. The causes of land-use and land-cover change: Moving beyond the myths. Glob. Environ. Chang. 2001, 11, 261–269. [Google Scholar] [CrossRef]
Figure 1. Location, extent, and characteristic of the study area.
Remotesensing 13 04090 g001
Figure 2. Maps of forest fragmentation causative factors for the study area: (a) slope angle; (b) slope aspect; (c) altitude zones; (d) distance to streams; (e) distance to roads; (f) distance to agricultural land; (g) distance to built-up areas.
Remotesensing 13 04090 g002aRemotesensing 13 04090 g002b
Figure 3. Overall integrated methodological framework for this study.
Remotesensing 13 04090 g003
Figure 4. An example of four types of spatial patterns of forest fragmentation on an artificial map adopted from Vogt et al. [47].
Remotesensing 13 04090 g004
Figure 5. The map of patch forests in the Rudraprayag district (1998–2014).
Remotesensing 13 04090 g005
Figure 6. Forest fragmentation susceptibility map showing the distribution of (a) range of all standardized weight contrast values, and (b) the level of the forest fragmentation susceptibility classes in the study area (study area = 1936.06 km2).
Remotesensing 13 04090 g006
Figure 7. The accuracy of the forest fragmentation susceptibility map under the ROC (AUC) curve using the IDRISI Selva 17.0.
Remotesensing 13 04090 g007
Figure 8. Ranking of forest fragmentation causative factors using standardized weight contrast value.
Remotesensing 13 04090 g008
Figure 9. Susceptibility levels of forest types based on forest fragmentation susceptibility map.
Remotesensing 13 04090 g009
Table 1. The multicollinearity analysis result of forest fragmentation causative factors.
Causative FactorsVIF
Slope angle1.413
Slope aspect1.575
Altitude zone1.831
Distance to streams1.713
Distance to roads1.986
Distance to agricultural land1.607
Distance to built-up areas1.638
Publisher’s Note: MDPI stays neutral with regard to jurisdictional claims in published maps and institutional affiliations.

