Article

Classifying Major Explosions and Paroxysms at Stromboli Volcano (Italy) from Space

1
Istituto Nazionale di Geofisica e Vulcanologia, Sezione di Catania, Osservatorio Etneo, 95125 Catania, Italy
2
Department of Mathematics and Computer Science, University of Palermo, 90123 Palermo, Italy
3
Department of Electrical, Electronic and Computer Engineering, University of Catania, 95125 Catania, Italy
*
Author to whom correspondence should be addressed.
Remote Sens. 2021, 13(20), 4080; https://doi.org/10.3390/rs13204080
Submission received: 21 August 2021 / Revised: 4 October 2021 / Accepted: 8 October 2021 / Published: 13 October 2021
(This article belongs to the Special Issue Application of Machine Learning in Volcano Monitoring)

Abstract

:
Stromboli volcano has a persistent activity that is almost exclusively explosive. Predominated by low intensity events, this activity is occasionally interspersed with more powerful episodes, known as major explosions and paroxysms, which represent the main hazards for the inhabitants of the island. Here, we propose a machine learning approach to distinguish between paroxysms and major explosions by using satellite-derived measurements. We investigated the high energy explosive events occurring in the period January 2018–April 2021. Three distinguishing features are taken into account, namely (i) the temporal variations of surface temperature over the summit area, (ii) the magnitude of the explosive volcanic deposits emplaced during each explosion, and (iii) the height of the volcanic ash plume produced by the explosive events. We use optical satellite imagery to compute the land surface temperature (LST) and the ash plume height (PH). The magnitude of the explosive volcanic deposits (EVD) is estimated by using multi-temporal Synthetic Aperture Radar (SAR) intensity images. Once the input feature vectors were identified, we designed a k-means unsupervised classifier to group the explosive events at Stromboli volcano based on their similarities in two clusters: (1) paroxysms and (2) major explosions. The major explosions are identified by low/medium thermal content, i.e., LSTI around 1.4 °C, low plume height, i.e., PH around 420 m, and low production of explosive deposits, i.e., EVD around 2.5. The paroxysms are extreme events mainly characterized by medium/high thermal content, i.e., LSTI around 2.3 °C, medium/high plume height, i.e., PH around 3330 m, and high production of explosive deposits, i.e., EVD around 10.17. The centroids with coordinates (PH, EVD, LSTI) are: Cp (3330, 10.7, 2.3) for the paroxysms, and Cme (420, 2.5, 1.4) for the major explosions.

1. Introduction

Stromboli volcano is a small island (less than 5 km wide) in the southern Tyrrhenian Sea (Italy), which has been continuously erupting for the past 2000 years [1]. Its activity is almost exclusively explosive, but lava flows do occur at times, most recently in 2014 and 2020 [2,3]. Its persistent but moderate explosive activity, termed “Strombolian”, is occasionally interrupted by explosive events that are more violent and represent the main hazard for the inhabitants of the island (less than 500 in winter, but more than 5000 in summer). The products of the most powerful explosive eruptions can damage the buildings [4] and even cause extensive vegetation fires [5]. Nevertheless, fatalities and injuries may also occur, such as in the summer 2019 [6]. To assess the hazards faced by communities living on the island, it is fundamental to detect the explosions of different magnitude and intensity and understand how to classify them. The classification being a paramount issue for a correct hazard assessment [7], in the last decades several classifications have been proposed. Barberi et al. [8] distinguished three types of eruptive activity on a growing scale: (1) a persistent, ordinary explosive activity of low intensity, (2) major explosions and (3) paroxysmal events.
The persistent activity at Stromboli is characterized by several hundreds of short explosive transients (<10 s) per day erupting small ash columns (<100 m) that normally have no impact on the local population [7]. Conversely, the more intense and powerful explosions correspond to greater magnitude (i.e., erupted volume; [9]) and intensity (i.e., instantaneous effusion rate; [10]), resulting in longer explosive transients and higher eruptive columns [7,11].
Generally, more than one crater in the summit area of Stromboli is active during major explosions, and these produce eruptive columns a few hundred meters high, with fallout of bombs and ash up to a maximum distance of about 1 km from the crater area. In most cases, the proximal area is affected by ballistic fallout of lithic blocks (up to decametric sizes), impacting the Pizzo Sopra La Fossa location (Figure 1) where tourists gather to observe the activity [8,12,13]. The volume of products ejected range from 102 to 103 m3 of tephra (fragmental pyroclastic materials that fall to the ground from eruption columns) [14,15].
Paroxysms are characterized by eruptive columns rising a few km above the craters and causing fires and damage to the populated villages on the lower flanks of the volcano, 2.0–2.5 km away from the summit craters [8,16,17,18,19]. These large-scale events typically consist of a cluster of explosions involving all active vents and ejecting meter-sized scoria bombs and blocks up to 2 km from the craters, and by greater volumes (from 104 to 105 m3) of emitted materials [8,20,21]. Usually, paroxysms cause considerable changes to the crater area, leaving a wider and deeper crater depression [8]. Furthermore, lava flows may be emitted right before [6,11], after [17], or during a paroxysm [22]. Often, hot avalanches or pyroclastic density currents (PDCs) caused by the opening of flank fissures [23], by the collapse of eruptive columns during paroxysms [6], by the collapse of small portions of the summit cone [24,25], by flank failure [26] or by the brecciation of lava flow fronts [23], spread along the steep and unstable Sciara del Fuoco (SdF; Figure 1) slope and over the sea surface [3,25]. More rarely, PDCs may affect the other slopes of the island [8,27].
Phenomena observed during Strombolian paroxysms may vary case by case [7]. For instance, large volumes (~105 m3) of PDC are often ejected along the Sciara del Fuoco during paroxysms, whereas they are normally absent during major explosions, and this is related to the greater heights reached by the eruptive column during paroxysms [28]. However, the threshold level distinguishing these categories is not fixed and has not been addressed so far. Conversely, lava flows may or may not be emitted before or after a paroxysm, thus being a process not always associated with paroxysmal events. Although the island has a modern and robust instrumental monitoring system, it does not provide a robust way to identify automatically the different sizes of the most intense explosions. For example, the typology of the most powerful explosive eruptions occurring at Stromboli in the period 2018–2020 have been distinguished between major explosions and paroxysm events using as discriminant factors either the area affected by large ballistic projectiles [29] or the magnitude of seismicity combined with the ground deformation, muzzle velocity, and height of the ash plume [7]. It is worth noting that some of the events were not uniquely defined (such as the 19 July 2020 episode) and a generally accepted classification combining all measurements has not been established yet.
Nowadays, a variety of sensors on board satellites is widely used to monitor volcanic activity from space allowing to characterize different volcanic phenomena, from lava flow mapping [30] to ash cloud tracking [31]. Moreover, recent improvements in the frequency, type and availability of satellite images mean it is now feasible to use a machine learning multi-parametric approach by taking into account different satellite data to obtain a reliable classification of the more powerful explosions. Here, we seek to address this task by integrating infrared and radar satellite data. It is worth noting that the detection capability of the satellite measurements themselves only provides a piece of information about the monitored phenomena. Thus, we have investigated the most powerful events occurring from January 2018 to April 2021 at Stromboli volcano by examining the land surface temperature (LST) time series derived by the daily Moderate Resolution Imaging Spectroradiometer (MODIS) LST product, the variable magnitude of volcanic deposits retrieved by using Sentinel-1 SAR amplitude data, and the maximum height reached by the eruptive column estimated by Spinning Enhanced Visible and Infrared Imager (SEVIRI) and Visible Infrared Imaging Radiometer Suite (VIIRS) data. Furthermore, we show that the satellite derived LST information gives an insight into the pre-eruptive phase of some of the investigated paroxysmal events. We designed a k-means unsupervised classifier, exploiting the functionalities of Google Earth Engine (GEE), which is a cloud computing platform for environmental data analysis from local to planetary scales, with fast access and processing of satellite data from different missions [32].

2. Materials

2.1. Record of the Most Powerful Explosions

Stromboli, the northeasternmost island of the Aeolian Archipelago (Tyrrhenian Sea, southern Italy; Figure 1), is a stratovolcano that extends to a depth of about 2000 m below sea level. Only the summit of the volcanic edifice emerges above sea level, reaching an elevation of 924 m [33]. The persistent explosive activity originates from several vents nested within the Crater Terrace, a small depression located at about 750 m of elevation on top of the Sciara del Fuoco. The Crater Terrace comprises three areas where a variable number of eruptive vents open (Figure 1): the NE Crater zone (NEC), Central Crater zone (CC) and SW Crater zone (SWC). Typical Strombolian explosions eject pyroclastic fragments to a height of a few tens of meters, which fall at a short distance from the eruptive vent.
Between January 2018 and April 2021, the mild Strombolian activity was interspersed with nineteen high-intensity explosive events producing fallout of heavy materials (blocks and pyroclastic material) on the upper part of the volcano and, occasionally, on the villages of Ginostra and Stromboli (Figure 1). These short-lived, violent eruptions of variable scale, were identified as either major explosions or paroxysmal events depending on their size, covering a wide spectrum in terms of recurrence, intensity, and magnitude [7,29].
The historical catalog of the last 140 years includes 180 higher energy explosions, conventionally classified as major explosions and paroxysms, with an average frequency ranging from 0.7 to 2.1 events per year [29]. However, the current annual rate of higher energy explosions is 2.8 events per year based on the last 10 years, and increased up to 5.7 events per year based on the last 3 years. In Table 1, the events from January 2018 to April 2021 are listed with their associated class as identified by Bevilacqua et al. [29] and Calvari et al. [7], and the INGV weekly bulletins. The volcanic activity of Stromboli is continuously and extensively monitored by the INGV, which publishes weekly bulletins at www.ct.ingv.it (accessed on 20 June 2020).

2.2. Satellite Data Sources

The satellite products used in this study are based on the outputs of the LST product from MODIS, radiometric measurements from SEVIRI and VIIRS, and microwave observations from Sentinel-1.
The Moderate Resolution Imaging Spectroradiometer (MODIS) is a key instrument on board of both satellites of Terra and Aqua missions of the NASA-centered international Earth Observing System (EOS). Terra and Aqua MODIS are viewing the entire Earth’s surface every 1 to 2 days, acquiring images in 36 spectral bands. We processed the level 2 LST and Emissivity product in GEE. In particular, Emissivity in bands 31 and 32 is estimated from land cover types and in the day/night algorithm, daytime and nighttime LSTs and surface emissivity are retrieved from pairs of day and night MODIS observations in seven TIR bands.
The Spinning Enhanced Visible and Infrared Imager (SEVIRI) is the main payload of the current Meteosat Geostationary (MSG) satellite operated by EUMETSAT. SEVIRI provides radiances within 12 spectral channels covering the visible to the infrared [34] with a 3 × 3 km nominal spatial resolution at the subsatellite point. The primary location of Meteosat is at 0°E above the equator, and SEVIRI has a temporal resolution of 15 min (four full disk images per hour).
The Visible Infrared Imaging Radiometer Suite (VIIRS) instrument is aboard the joint NASA/NOAA Suomi National Polar-orbiting Partnership (named Suomi NPP) satellite and the joint NASA/NOAA NOAA-20 satellite. The VIIRS Level 1 and Level 2 swath products are generated from the processing of 6 minutes of VIIRS data acquired during the NOAA-20 satellite overpass. The NOAA-20 product comprises 5 bands that are sensitive to visible, near-infrared (NIR), and thermal wavelengths. The spatial resolution of the instrument at viewing nadir is approximately 375 m for the I-bands, and 750 m for the DNB and the M-bands.
The Sentinel-1 mission of the Copernicus program of the European Space Agency (ESA) consists of two identical satellites equipped with C-band Synthetic Aperture Radar (SAR) instruments (frequency 5.33 GHz, wavelength 5.6 cm). The images are provided in dual or single polarizations, in four different operational modes, namely Stripmap (SM), Interferometric Wide swath (IW), Extra Wide swath (EW) and Wave (WV) modes. The spatial resolutions vary between 10 m and 40 m, depending on the selected mode. Sentinel-1 SAR images are made available at level-1C Ground Range Detected (GRD) in GEE, where they are already preprocessed based on the algorithms implemented by the Sentinel-1 Toolbox software [35].

3. Methods

Strombolian explosions of different magnitude and intensity do not fit easily into traditional styles of eruption [28] and the differentiation between paroxysms and major explosions on the basis of their intensity derives from measurements that are not always replicable (i.e., field surveys), so their classification is somewhat problematic and suffers from human subjectivity [7]. In recent years, machine learning (ML) methods have become common to solve classification problems by an automated processing in Earth and space sciences [36,37]. Machine learning methods can involve either supervised or unsupervised learning. Supervised learning techniques train machine learning algorithms using labeled data sets, which contain sample data that have been tagged with a target parameter. The algorithm uses a target to evaluate its accuracy in interpreting the training data. In unsupervised approaches, users feed unlabeled data to the algorithm, which tries to extract common features on its own based on data similarity.
The paroxysmal events do not occur often, i.e., about five events in the last 20 years [29], therefore the size of the training dataset would be insufficient to perform any supervised technique for their classification. Furthermore, some of the major events are not clearly classified by humans, thus, we designed a multivariate unsupervised classifier to automatically identify in an objective way an event as either major explosion or paroxysm. The justification behind the use of a multivariate approach lies in the fact that even individually less relevant features may become relevant when used in combination with other features and may allow a better separation among classes when used together [38], e.g., also a completely uncorrelated feature to the target can improve the separability between classes [38].
Since identifying distinct clusters through unsupervised methods depends closely on the input data, we use different independent data in order to obtain a straightforward classification that can be used any time an explosion occurs. We focus on the surface temperature time series over the volcanic summit area, the pre- and post-eruptive SAR intensity images, and satellite optical images acquired during each event and its corresponding atmospheric profile.
After collecting satellite data, we perform the feature extraction process [39], i.e., transforming raw data in informative features. In particular, we extract the magnitude of explosive volcanic deposits, a thermal index of the volcanic activity in the summit area, and the maximum plume height produced by the explosive events. Finally, the extracted features are fed to a k-means unsupervised classifier that learns to distinguish between the two classes.
The workflow of the proposed unsupervised classifier can be summarized in two main steps, as shown in Figure 2:
  • Feature extraction
  • K-means algorithm

3.1. Feature Extraction

The selected features encapsulate the important aspects within data and synthesize them, providing an input for the unsupervised classifier [40]. Thus, the first step is to extract features from raw satellite data able to classify the most powerful explosive events.

3.1.1. Land Surface Temperature

The direct volcanic activity involved with the higher energy explosive events could lead to changes of the surface temperature over the summit area of Stromboli. These land surface temperature (LST) changes may be due to different phenomena, such as the persistent and vigorous gas emissions at the craters [41,42], or the eruption and emplacement of lava flows [22], or the multiplication and intensification of Strombolian explosive activity [43]. These phenomena are often associated with the most intense explosions detectable even before the eruption starts. The 2003, 2007, and 2019 paroxysms were heralded by intermittent phases of increases in ordinary Strombolian explosions starting weeks to months before the events and long-term anomalies in the geophysical and geochemical signals [43,44,45]. Thus, we retrieved satellite-based LST estimates to investigate surface temperature changes over the summit area of Stromboli.
The MODIS LST product (MOD11A and MYD11A) is exploited for this purpose because it provides two night-time temperature measurements per day with spatial resolution of 1 km. MODIS LST is estimated by using the generalized split-window LST algorithm [46] that utilizes two TIR bands, namely 31 and 32. This method corrects for atmospheric effects based on the differential absorption in adjacent thermal infrared bands being less sensitive to the uncertainties in optical properties of the atmosphere. A linear form for the LST algorithm is used [46]:
T s = C + ( A 1 + A 2 1 ε ε + A 3 Δ ε ε 2   ) T 31 +   T 32 2 + ( B 1 + B 2 1 ε ε + B 3 Δ ε ε 2   ) T 31 +   T 32 2
where Ts is the effective radiometric surface temperature (i.e., land surface temperature), ε = 0.5   ( ε 31 + ε 32 ) and Δ ε = ε 31 ε 32 are the mean and the difference of surface emissivity in MODIS bands 31 and 32, T31 and T32 are brightness temperatures (BT) from bands 31 and 32. The coefficients C, Ai and Bi, i = 1, 2, 3 are given by interpolation on a set of multi-dimensional look-up tables (LUT) that can be found in [46].
We consider as an indicator of the thermal activity the LST magnitude calculated by subtracting the mean temperature from the maximum temperature measured over Stromboli Island [47]. For this purpose, we define a parameter that depends on LST in terms of both amplitude and duration. We have followed the approach proposed by Giudicepietro et al. [11] for the analysis of the Strombolian seismic signals related to volcanic dynamics. They obtained a robust parameter to represent the level of activity of Stromboli by using the amplitude and duration of the very long period seismic events. Thus, we firstly apply a smoothed 15-day moving average to the LST magnitude in order to get what we call Low Frequency Thermal Signal (LFTS), accounting for the long-term high thermal activity level before/during/after powerful explosions. The sliding window duration was chosen through a trial and error approach to obtain a good sensitivity to the LFTS signal variations. Then, we divide the entire time series in windows of 30 days and, for each time interval, we compute the max of the values; we call this parameter Land Surface Temperature Index (LSTI).
This is done to investigate the persistent long-term thermal activity level; thus, considering the same time interval duration, i.e., 30 days, higher average LST magnitude values are expected for powerful explosions than ordinary sporadic explosions and consequently higher LSTI values. Therefore, when temperature changes are not observed in the selected time window, i.e., the maximum of LST is comparable with the average value over the island, it means that sporadic, weak or no activities take place; in these cases, LSTI is low. When effusive activities take place, LFTS increases from the start of the volcanic activity and stays high until new lava flows cool; this means that LST magnitude may remain high for days and thus characterized by medium/high LSTI depending on how long the effusive activity lasts. When violent explosions take place, LST magnitude may start increasing either before the eruption starts or after due to the occurrence of several concurrent phenomena raising the thermal level at the summit Crater Terrace in the selected time window, such as very high radiative power, lava flows emissions before/during/after the event, ejections of incandescent materials. In both the latter cases, the maximum LFTS values in this time window will be high implying high/extreme LSTI values. It should be clear that this parameter does not univocally identify events that are not extreme, i.e., LSTI values for small effusive events may be comparable with major explosive events. This is the reason why it is not the only parameter used to discriminate between major explosion and paroxysm but, together with other features, it can help characterize such powerful events. Therefore, we select the LSTI feature to account for the surface temperature changes over the Crater Terrace expressed in Celsius degrees.

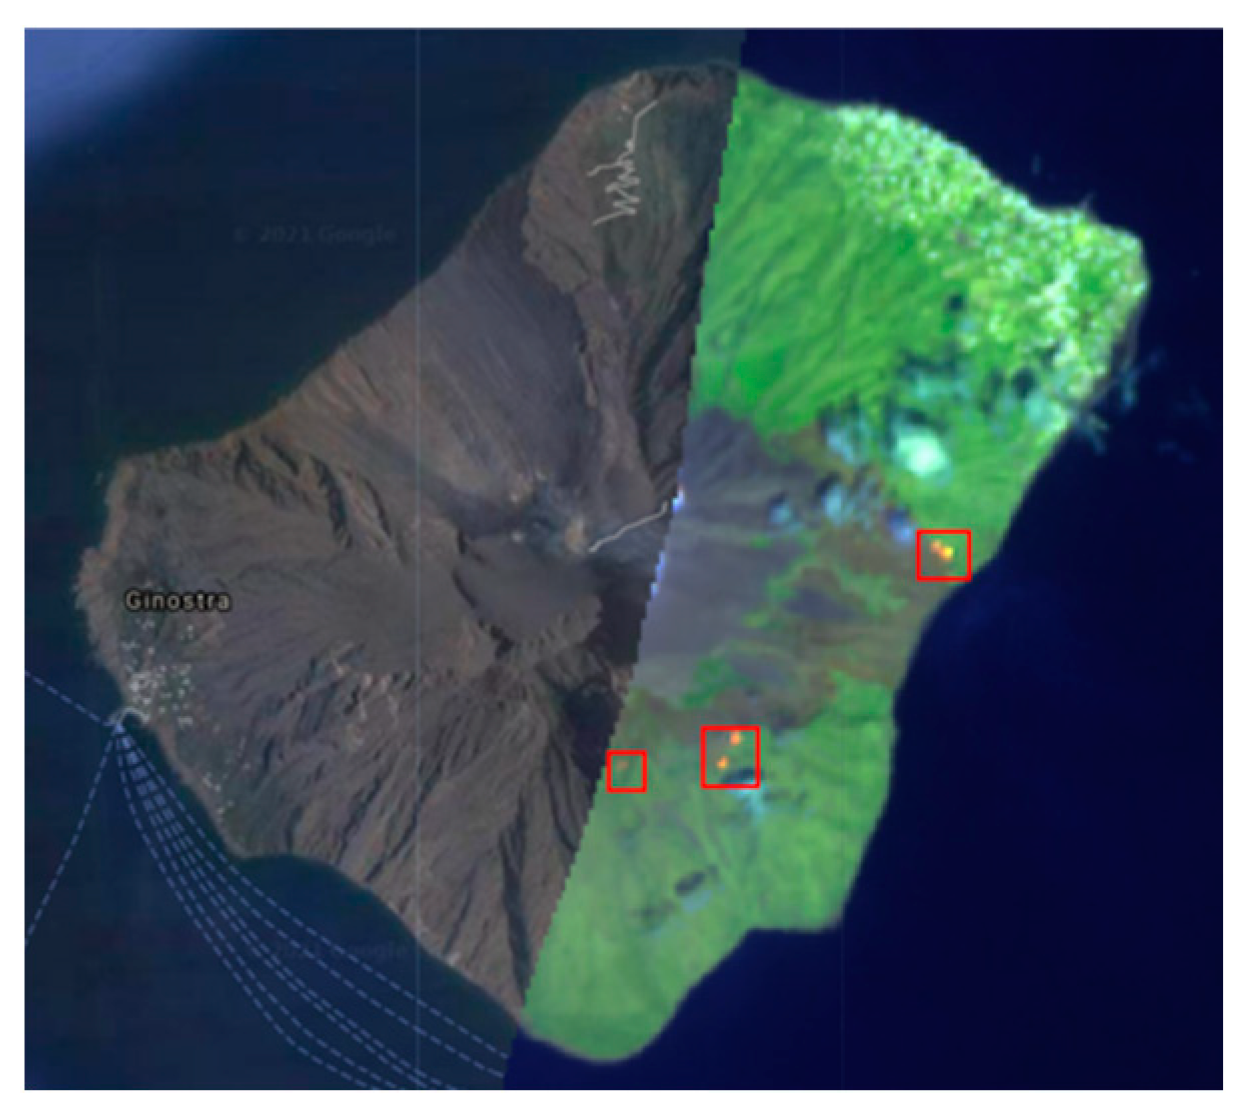
3.1.2. Explosive Volcanic Deposit
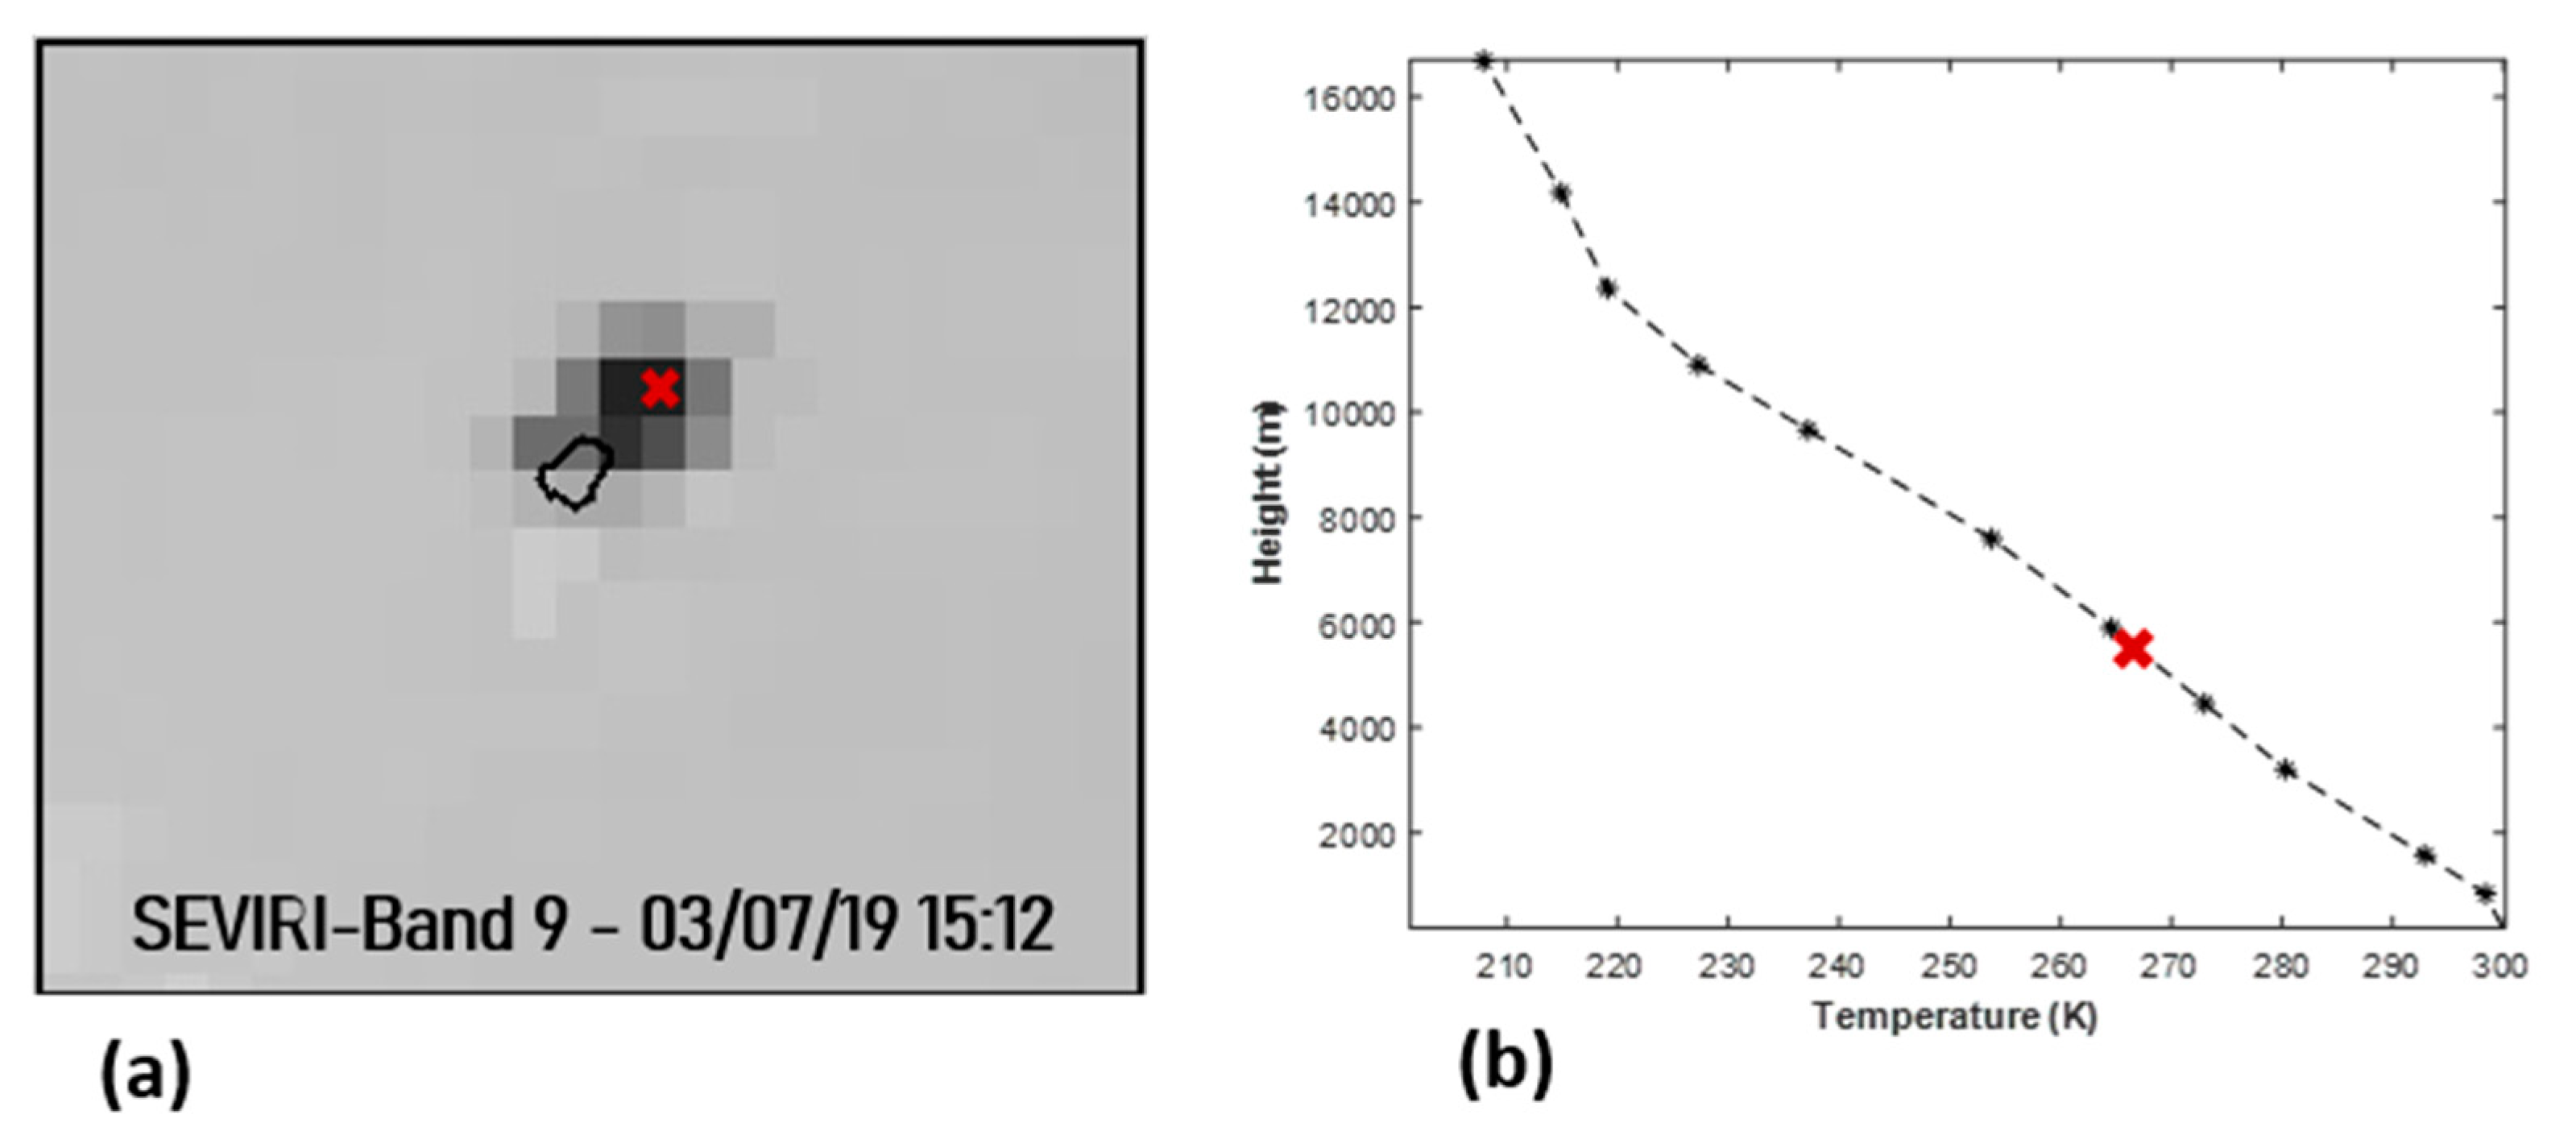
The higher energy explosions of Stromboli erupt large quantities of products that fall over a widespread area far from the summit craters. Synthetic aperture radar (SAR) images have proved a valuable data source in detecting surface changes due to the emplacement of explosive volcanic deposits, including pyroclastic flows, ballistics, tephra fallout, short lava flows, as well as post-emplacement alteration [48,49,50]. Each pixel of an image corresponds to a resolution element on the ground (typically sized on the scale of the SAR wavelength ranging from several centimeters to tens of centimeters), which receives and scatters back an electromagnetic signal emitted by the radar. A pixel is characterized by two values: the amplitude and the phase. To make good use of the information content (both amplitude and phase) provided by SAR backscattering signals, detection methods are based either on the evolution of the reflectivity, namely, the amplitude of the radar images, or on variations in the correlation of the signal, which is a measure of the phase change.
The phase difference between two subsequent radar acquisitions is often used to investigate deposition of volcanic materials on the surface (e.g., [51]). However, in areas where the land surface changes rapidly, e.g., due to the emplacement of volcanic deposits, the phase difference between neighboring pixels observed by Interferometric Synthetic Aperture Radar (InSAR) will appear random (incoherent), thus little information can be retrieved. On the other hand, amplitude results from the sum of all scatters within a ground resolution element, hence slight variations in the satellite viewing geometry with time lead to the sum of a slightly different set of scatters at each time step, thus leading to pixel-by-pixel speckle pattern. Nevertheless, by comparing amplitude variations in time, changes in observed radar amplitude can be used to detect areas that are affected by volcanic eruptions, even when the SAR phase is incoherent.
Pyroclastic flows, tephra fallout and mudflow deposits produced during a volcanic activity result in changes in surface roughness [48]. Usually, deposits made by meter-sized blocks, smaller clasts and coarse tephra, appear “rough” to the radar resulting in an increase in backscattering, while fine-grained tephra appears “smooth” to the radar [48,53] resulting in a decrease in backscattering. Besides, the effects of the local morphology changes also produce changes in backscattering [48,52].
New deposits may be revealed by radar amplitude if their surfaces are sufficiently different from the underlying or surrounding deposits. Changes in surface reflectivity between two radar images can be visualized easier when plotted as a ratio image [53]. Computing ratio images allows reducing radiometric errors [54] and decreases the effect of speckle [53,55]. The image ratio depends on the relative average radar backscattering changes between two SAR images [54]. It is worth noting that for a given pixel in a SAR image, the backscatter is dominated by the largest objects contained within that pixel [56,57]. Even a small proportion of coarse-grained tephra deposits could be enough to increase the surface roughness at radar wavelengths. In these cases, the changes will appear greater in the pixels containing the largest objects, so that the maximum value of the change image will be related to the largest detected object.
We thus use Sentinel-1 SAR amplitude data to assess the magnitude of explosive volcanic deposits. As a change image, we use the amplitude ratio in order to reduce speckle noise while increasing changes in areas of high amplitude [48,54]. Therefore, we build a time series where each value at a given time t is obtained dividing the first available SAR intensity image recorded after the time t by the SAR intensity image recorded at the time t. In particular, in order to avoid misleading results due to changes not related to volcanic activities, e.g., vegetation changes occurring on the island and changes in the dielectric constant due to the presence of the sea, we investigated only the area of the Sciara del Fuoco. When a powerful explosion occurs, the amplitude ratio that is computed by using post-eruptive and pre-eruptive images will contain pixels with higher values since larger and coarser deposits are supposed to be emplaced. On the other hand, values smaller than one mean that erosion occurred and materials were removed. The latter information could thus be used to detect the material that is eroded and collapsed during an intense event, such as the inner crater removal during a paroxysm [6,8].
Sentinel-1 SAR amplitude data are gathered from the GEE collection “COPERNICUS/S1_GRD_FLOAT” that includes the Ground Range Detected (GRD) scenes, already processed for thermal noise removal, radiometric calibration and terrain correction. We used a local adaptive median filter that uses local statistics to detect SAR speckle noise and to replace it with a local median value. In comparison with established filters, it was found that the local adaptive median filter outperformed others in achieving the best balance between speckle suppression and image detail preservation [58]. Single polarization data (‘VV’) is used [48,49] with descending pass since descending-pass image changes are stronger [48]. This feature based on the Sentinel-1 SAR measurement is named Explosive Volcanic Deposit (EVD) from now on. It is an adimensional parameter being the maximum of the ratio of two SAR intensity images.

3.1.3. Plume Height

The height of the eruptive column (i.e., the height of the ash plume rising by buoyancy from the crater rim) is related to the magnitude of the explosion and thus to the volume of erupted products [59], and as such is a key discriminant between events of different magnitude and intensity. The plume produced during an explosion reaches greater heights during powerful events such as paroxysms [28]. Thus, we derived the volcanic cloud top altitude by means of satellite infrared images. For this purpose, we use the brightness temperature of the cloud surface at 10.8 µm [60,61]. Assuming a thermal equilibrium between the plume top height and the atmosphere, we acquire the brightness temperature Tp in the Thermal InfraRed (TIR) wavelength of the plume pixels and compare it with the atmospheric temperature-altitude profile on Stromboli at the same time of satellite acquisition. We use the atmospheric temperature-altitude profile obtained from the National Centers for Environmental Prediction (NCEP)/National Center for Atmospheric Research (NCAR) Reanalysis Project (available at http://www.esrl.noaa.gov/psd/data/reanalysis/reanalysis.shtml, accessed on 20 June 2020). This technique is known as the Cloud Top Temperature [62] and relies on several assumptions: (i) the cloud must be optically thick (thickness τ > 5; where τ is a dimensionless quantity that indicates how transparent is a cloud) so that the brightness temperature is representative of the true cloud surface temperature; (ii) the ash particles must be in thermal equilibrium with the temperature of the ambient air; (iii) this method is only applicable to tropospheric emissions since the atmospheric temperature profile above the tropopause is not monotonic [63].
All the available SEVIRI satellite TIR images were taken into account. Although SEVIRI is available every 15 min, it has a low spatial resolution, thus in order to obtain a good level of detail in terms of spatial resolution, when available, the VIIRS data acquired at 375 m spatial resolution were used too. A linear interpolation was performed by locating Tp within the temperature profile. Equation (2) shows how the maximum plume height PH was estimated using the interpolation technique [64]:
P H = Z 1 + T p T 1 T 2 T 1 ( Z 2 Z 1 )
where T1 and T2 are the temperatures within the profile that bound Tp, with T1 being the temperature at the highest (e.g., furthest from the ground) bounding level, while Z1 and Z2 are the corresponding heights of the bounding temperatures, T1 and T2.

3.2. K-Means Clustering

Extracted feature vectors can become inputs for a variety of different techniques of machine learning. We use cluster analysis (CA) to classify the most powerful explosions of Stromboli. Cluster analysis is an unsupervised learning technique aimed at grouping similar data while separating different ones, where similarity is evaluated quantitatively using a distance function in the space of feature vectors. The clustering algorithms can be distinguished into hierarchical and non-hierarchical. In the former, a tree-like structure is built to represent the relations between clusters, while in the latter, new clusters are formed by merging or splitting existing ones without following a tree-like structure but simply grouping the data in order to maximize or minimize some evaluation criteria.
CA includes a vast class of algorithms. We have chosen the non-hierarchical k-means algorithm because it is simple and efficient [65,66,67]. It is an iterative procedure that partitions data into a predetermined number of clusters [68]. Firstly, inside the feature space, cluster centroids are randomly initialized and observations are assigned to the nearest centroid according to a Euclidean distance. Secondly, cluster centroids are updated with the mean location within their cluster. These steps are repeated until an optimal convergence is reached. We have used the k-means++ algorithm for cluster center initialization using a heuristic to find centroid seeds for k-means clustering. According to Arthur and Vassilvitskii [69], k-means++ improves the running time of Lloyd’s algorithm [70] and the quality of the final solution. k-means++ algorithm achieves faster convergence to a lower sum of within-cluster, sum-of-squares point-to-cluster-centroid distances, than Lloyd’s algorithm.
A challenge in applying the k-means algorithm is determining the number (k) of clusters to partition our dataset. When available, a priori knowledge is used to inform the choice of k. Our goal being to classify major explosions and paroxysms, we set k = 2 number of clusters, namely “major explosion” and “paroxysm” clusters.

4. Results

Once all the features are retrieved, a z-score normalization is performed to scale the data and reduce variability across arrays [71]. Then, an input vector made by the concatenation of the three normalized parameters PH, EVD, and LSTI is built for each violent explosion (listed in Table 1) occurring at Stromboli between January 2018 and April 2021, x = (PH, EVD, LSTI). The input vectors are then concatenated together getting the input matrix X, an n × m matrix where n is the number of event samples, i.e., n = 19 in this case, and m is the number of distinguishing features, i.e., m = 3 namely PH, EVD, and LSTI. Optical and Radar satellite images used to obtain EVD and PH values for each investigated volcanic explosion are listed in Table 2.
The LST derived features for all the monitored events are shown in Figure 3, where both the LFTS (Figure 3a) and LSTI (Figure 3b) are reported. It is worth noting that these estimates are affected by any volcanic phenomena that leads to persistent increase in temperature over the summit area, particularly lava flow emissions. Thus, mid/high values of LSTI are found for time intervals when emission of lava occur, such as January-February 2020 (see INGV weekly bulletin).
The magnitude of explosive deposits retrieved for all the investigated events are shown in Figure 3c. Each value at a given time t is the EVD value derived dividing the first available SAR intensity image recorded after t by the SAR intensity image recorded at the time t. The explosive deposits associated with the investigated eruptive events listed in Table 1 are shown as red dots.
The maximum heights PH reached by the eruptive columns, derived from SEVIRI and VIIRS images, are reported in Table 3. In the case a satellite-based estimate cannot be retrieved due to sensor limits, e.g., in presence of low and transparent volcanic clouds, the values from the INGV weekly bulletins on the monitoring activity were considered. Note that the events with missing information on the plume due to the detectability limit of SEVIRI, are confirmed to be characterized by lower plume height compared with the estimated value of 3 July 2019 event (INGV weekly bulletins).
Below, we focus on one event of each class, namely 3 July 2019 paroxysm and 10 November 2020 major explosion. The descriptions of the temporal evolution of the two events were derived from INGV bulletins and from Calvari et al. [7].

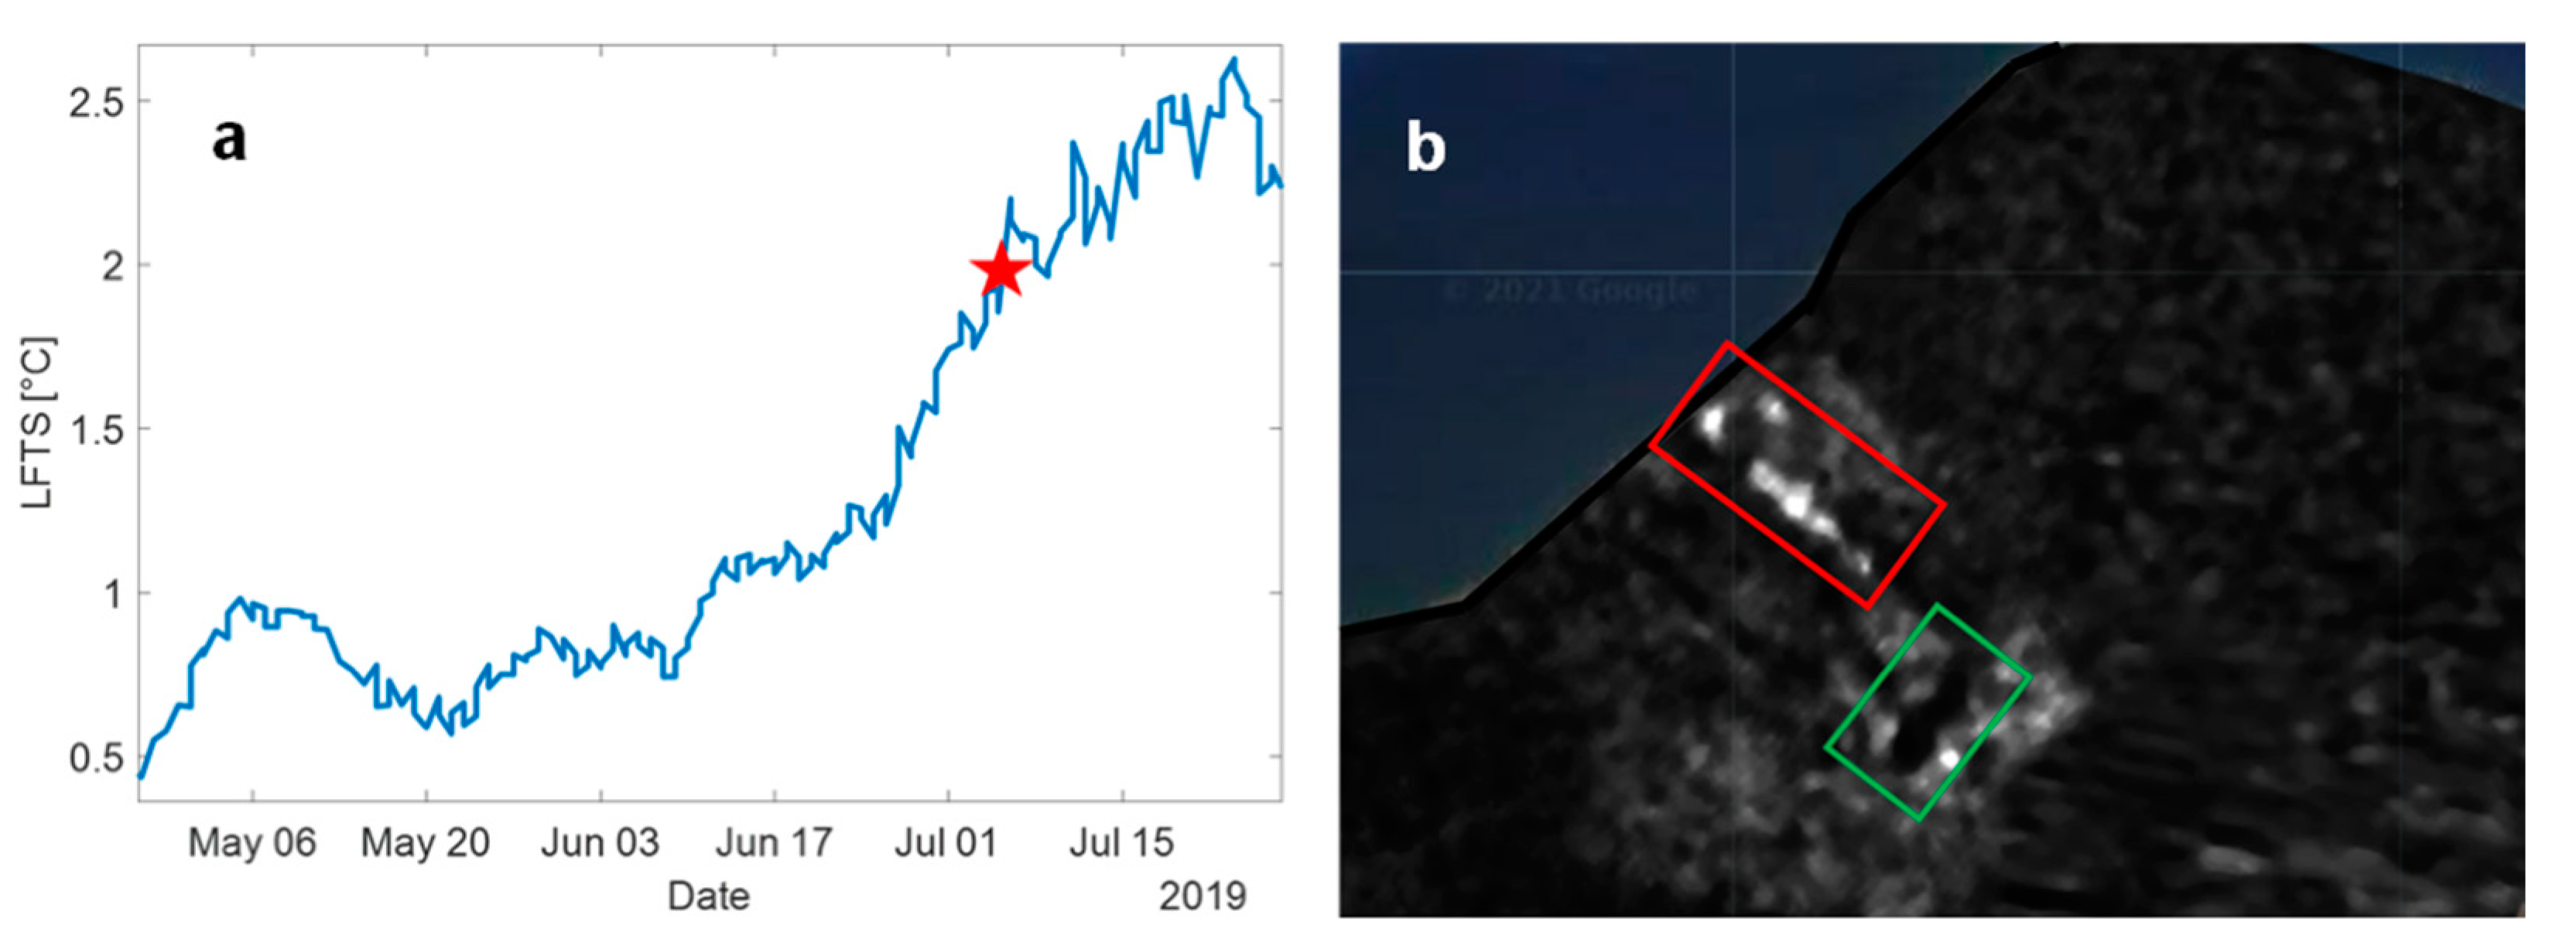
4.1. The 3 July 2019 Paroxysm

The 3 July 2019 event, one of the most violent explosions occurring at Stromboli volcano, was preceded by a significant increase in the intensity of explosive activity at all the summit vents. At 13:59 a strong explosion from the South West Crater (SWC) was followed by lava flow output along the upper part of the Sciara del Fuoco. A small vent opened at the base of North East Crater (NEC), widening and feeding a lava flow that started spreading along the Sciara del Fuoco from 14:02:40. Several lava flows from this vent overlapped the previous flows, spreading downslope. In the meantime, at 14:43:10 another small lava flow started from the Central Crater (CC), slowly spreading south within the Crater Terrace, followed by flows from the two NEC vents, and eventually joining with another flow erupted from the SWC vent. The maximum velocity of the jet, estimated at 101.92 m s−1, was recorded after 6 s of gradual increase due to the initial horizontal expansion of the jet [7]. The main phase of the paroxysm involved the whole crater area. The column collapse produced two pyroclastic flows that spread north-west along the Sciara del Fuoco and over the sea surface for several hundred meters, and caused a significant widening of the Crater Terrace [7]. In Figure 4a, a zoomed graph of the LFST is reported to highlight the increase begun before the 3 July 2019 paroxysm, for which LSTI = 2.63 °C.
The explosive deposits were assessed by using the amplitude ratio of two Sentinel-1 SAR descending intensity images. We used the 26 June 2019 and 08 July 2019 images as the pre-eruptive and post-eruptive respectively. The pixel by pixel ratio of the recorded images of the two dates is shown in Figure 4b. The red rectangle indicates the presence of new materials deposited after the eruption, while the green rectangle indicates the erosion of material after the eruption with respect to the pre-eruptive image. The gray color scale indicates the intensity of the backscattered signal from lower (black) to higher (white). The maximum value detected by Sentinel-1 SAR is EVD = 12.5.
The plume height has been retrieved by using the BT channel at 10.8 um of SEVIRI image acquired on 3 July 2019 at 15:00 UTC resulting in Tp = 264 K, while from the atmospheric profiles we obtain Z1 = 4450 m, T1 = 274 m, Z2 = 5888 m, T2 = 263.8 K. The top plume height PH is estimated at 5.86 km in accordance with Equation (2) (Figure 5b).

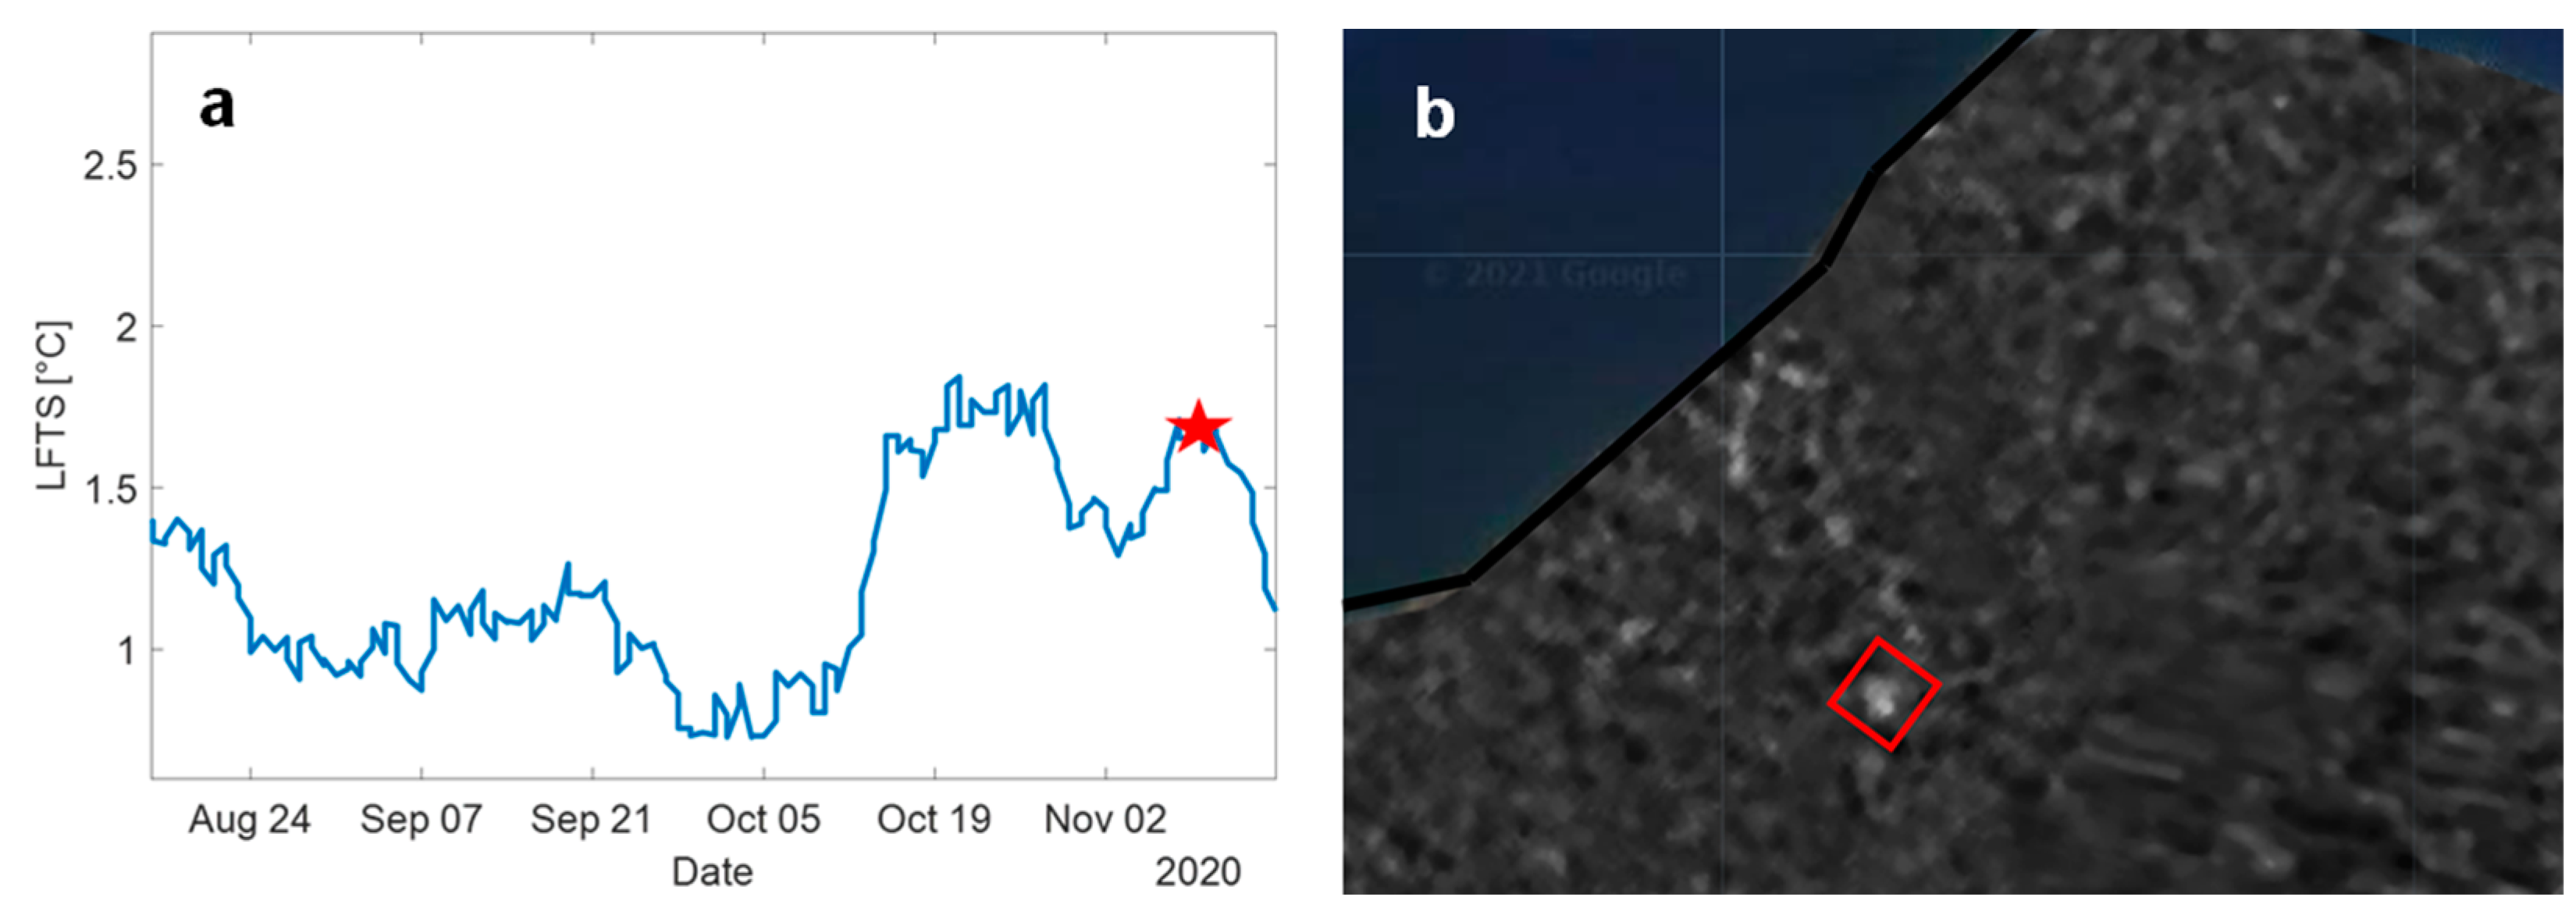
4.2. The 10 November 2020 Major Explosion

The 10 November 2020 episode started from the SWC at 20:04:21, forming an eruptive cloud reaching up to 600 m above the crater rim [7]. The explosive event then expanded to the NEC, forming a jet propagating horizontally and causing a wide spatter fallout on the upper Sciara del Fuoco, and eventually expanding to the Central Crater producing a low fountaining with little or no fallout outside the crater. The duration of the first pulse was 20 s, and the muzzle velocity of the ejecta was 54.50 m s−1 [7]. The index related to the temperature, as shown in Figure 3, is LSTI = 1.82 °C and a zoom of the LFTS is shown in Figure 6a.
The explosive deposits were assessed by using the ratio between the pre-eruptive Sentinel-1 SAR descending intensity image of 5 November 2020 and the post-eruptive intensity image of 11 November 2020. The pixel by pixel image ratio is shown in Figure 6b. The gray color scale indicates the intensity of the backscattered signal from lower (black) to higher (white). The maximum value detected by Sentinel-1 SAR is EVD = 2.28. The plume height was retrieved by using the INGV bulletin, as the plume was not detectable by using SEVIRI images, thus PH = 600 m.

4.3. Explosive Events Classification

Using the values of three distinguishing features PH, EVD and LSTI, the input matrix X was populated for all 19 event samples (Table 3). Then, the input matrix X of dimension [19 × 3] was given to the k-means classifier that grouped the investigated events as is shown in Figure 7. Three events are clustered together in one class, whereas the remaining sixteen events are grouped in the other one. The cluster identified by the centroid with higher coordinates is representative of the more intensive explosions and is named “Paroxysm”, the other one characterized by the centroid with lower coordinates is named “Major Explosion”. The centroids are found by coordinates (PH, EVD, LSTI): Cp = [3330, 10.7, 2.3] for the paroxysms, and Cme = [420, 2.5, 1.4] for the major explosions. The three violent explosions classified as paroxysms are the 3 July 2019, 28 August 2019 and 16 November 2020 events, while the major explosions include the other sixteen episodes listed in Table 1.

5. Discussion

Unsupervised learning captures the eruptive patterns characterizing the most powerful explosions at Stromboli. By combining the information provided from independent features for each event, a unique assignment to a specific representative class is automatically performed based on satellite data.
On one hand, results show that the major explosions are characterized by low/medium thermal content, i.e., LSTI around 1.4 °C, low plume height, i.e., PH around 420 m, and low production of explosive deposits, i.e., EVD around 2.5. However, the two events occurring on 13 and 15 July 2019 are distant (named eccentric) from the other major explosions in LSTI dimension. This happens because these events occur at a time very close to the 3 July 2019 paroxysm and all share similar LSTI values. During this paroxysmal phase, lava is erupted for days thus both LFTS and LSTI have high values for the entire period. Nevertheless, these events are classified as major explosions since the other features, i.e., PM and EVD, have characteristic values for this class.
On the other hand, results show that paroxysms are extreme events characterized mainly by medium/high thermal content, i.e., LSTI around 2.3 °C, medium/high plume height, i.e., PH around 3330 m, and high production of explosive deposits, i.e., EVD around 10.17. Some events may differ in the way they show up as happened for the powerful explosion occurring on 16 November 2020. It has weaker LSTI and PH than the 3 July and 28 August 2019 paroxysms, but very high values of EVD, leading the k-means algorithm to classify the 16 November 2020 event as a paroxysm (Figure 8). It is noteworthy that this event was preceded by significant ground deformation with the upward tilting of the northeast outer flank of the cone and characterized by the failure of the north portion of the Crater Terrace and by a lateral blast [7], thus EVD has a much larger value than those of major explosions.
The variable phenomenology of the most powerful explosions highlights the importance of using as many parameters as possible to characterize an event well rather than using a single measurement, enabling the classifier to provide an objective measure of the monitored explosion. It is worth noting that our results are in general agreement with the typologies shown in Table 1. However, the 19 July 2020 volcanic event that was not uniquely classified [7;29], is classified here as “Major Explosion”; whereas the 16 November 2020 event that was uniquely classified as “Major Explosion”, is classified here as “Paroxysm”. This observation is coherent with the fact that such event was violent and powerful ([7]; INGV weekly bulletin) with the plume height reaching a higher value compared with major explosions, and which generated/caused a pyroclastic density current that reached the sea and a landslide that was clearly detected by SAR, i.e., high EVD value (see Table 3). Besides powerful explosive events, low/medium LSTI and medium/high EVD values may also be found in case of lava flow emissions as is shown in Figure 3, e.g., February-March 2020 events. That is why these features cannot be considered individually as the only distinguishing factors characterizing an explosive event.
Among the identified paroxysms, the most extreme one occurred on 3 July 2019, as indicated by all the investigated features. The LFTS appears to increase weeks before the paroxysm started (Figure 4a). Pre-eruptive long-term (years) variations in MODIS Band 31 median radiant temperature have already been observed in different volcanoes before magmatic and phreatic eruptions [72]. In these cases, the large-scale (tens of square kilometers) changes of surface temperature provided an early indicator of renewed volcanic activity. Similarly, the significant long-term (from weeks to months) LFTS variations preceding the 3 July 2019 paroxysm can be an early detection of pre-eruptive conditions driving the most violent explosive eruptions.
This behavior is coherent with the changes observed in the parameters related to the dynamics of very long period (VLP) seismic events associated with Strombolian explosive activity, which were interpreted as due to the temporal evolution of the explosive source, indicating higher gas emissions at the summit craters, starting at least one month before the 3 July 2019 paroxysm [11,73]. This analysis pointed to a critical role of the gas as well as of the coexistence of two magma-types (with different gas content and porphyricity) for the eruptive dynamics of Stromboli [73].
It should be pointed out that LFTS remains high between the 3 July 2019 and 28 August 2019 events as a result of the on-going effusive eruption, and that the 28 August 2019 explosive event ended the July-August 2019 effusive phase [73]. Then the LFTS signal returned to lower values. This sudden drop is consistent with the interpretation that after the 3 July 2019 eruption the transitory conditions that enabled pressurization in the shallow conduit were not stabilized until the 28 August 2019 paroxysm, when a complete restoration of the gas flux recharge/discharge ratio in the volcanic conduit occurred together with a return to the ordinary volcanic activity [73]. This is also coherent with the high thermal content characterizing the events on 13 July 2019 and 15 July 2019. On the other hand, no evident long-term gradual changes in LFTS have been observed in other events, e.g., 10 November 2020 major explosion (Figure 6a).
Different values of the plume height of the 3 July 2019 event were estimated in the previous studies and reports. The maximum plume height was computed ranging: from 4 km [7], to 7 km [60], and about 8.4 km [6]. Here, we found a value of PH = 5.86 km, very close to the estimate of 6 km obtained with numerical simulations [43].
Besides the high detected EVD estimate, the change detection image in Figure 4b also shows the areas that were eroded during the 3 July 2019 paroxysm. In particular, the portion of the Crater Terrace that has been eroded appears as a dark area (green rectangle in Figure 4b). Thus, the bright areas include both the pyroclastic deposit emitted during the paroxysmal eruption and part of the Crater Terrace eroded that fell down on the slope during the explosion. The distribution of the deposits was well-documented through field surveys [43] and is in good agreement with the deposits detected in Figure 4b. The 3 July 2019 paroxysm deposited a 0.3–1 m (0.4 m average) thick continuous deposit on the Pizzo area upon which a discontinuous layer of 0.5–3 m-sized spatter bombs was laid. Tephra fallout deposits ranging from ash-sized to bomb-sized pyroclasts were dispersed towards south west and a continuous, coarse-grained (10–50 cm) pumice bombs deposit, up to 0.7 m thick in the proximal sector, covered the upper west flank down to 500 m a.s.l. [43].
Lastly, since the 3 July 2019 paroxysm was an exceptional and powerful event, fires broke out at some distance from the craters [5]. Thus, we have processed Sentinel-2 Multi-Spectral Instrument (MSI) images again to detect thermal anomalies. We have used the data collected on 4 July 2019 at 09:49 UTC to acquire the False Color image made by B12 (SWIR)—B11 (SWIR)—B4 (RED) bands shown in Figure 9. Although the satellite pass does not cover the whole of Stromboli Island, fires in the southern and eastern areas are clearly visible, thus confirming the violence of this paroxysm.

6. Conclusions

The different sizes, covering a broad variability in intensity and magnitude, of the most intense explosive eruptions at Stromboli volcano from January 2018 to April 2021 were classified by combining satellite imagery and machine learning techniques. Modern satellites provide wide coverage with high resolution signals, generating large datasets. These remote sensing observations allowed us to obtain information on the monitored phenomena not retrievable by using only ground-based sensors, i.e., thermal cameras of the monitoring network. In particular, spatial mapping of the explosive volcanic deposits ejected during such events is derived from SAR images. Furthermore, the Sentinel-1 SAR amplitude signal has proved to be a valuable means not only to detect explosive volcanic deposits ejected during intense explosive events, but also to gain insights into the collapsed portion of the Crater Terrace.
We highlighted the importance of the information borne by the LST signal from two viewpoints. On one hand, it reveals changes due to the explosive source leading to intense paroxysmal explosions weeks before the event begins. This can be a first indicator of subsurface processes driving the most powerful explosions that can be tracked through satellite-based infrared observations with high temporal resolution. These findings give new insights into the importance of surface temperature variations to anticipate the most powerful eruptions that are not easy to forecast through traditional geophysical and geochemical measurements. On the other hand, the LST magnitude level can be used to characterize the most powerful events together with other satellite-derived features.
We demonstrated the capability of machine learning algorithms in distinguishing the most powerful explosions at Stromboli using a variety of satellite data. An unsupervised k-means classifier is proposed to automatically recognize explosive events as either paroxysms or major explosions based on the information related to the surface temperature of the summit area, the height reached by the plume and the magnitude of explosive deposits including pyroclastic flows, ballistics, and tephra fallout. Centroids are defined for both clusters, thus providing the main values of features that are characteristic for each class of explosive eruption. These results indicate that machine learning algorithms combined with satellite data have the potential to form an automated system to detect the intensity of explosive eruptions, also in remote and inaccessible volcanoes.

Author Contributions

Conceptualization, C.C. and C.D.N.; methodology, C.C. and C.D.N.; software, C.C.; validation, C.C.; resources, C.D.N.; data curation, E.A. and F.T.; writing—original draft preparation, C.C. and C.D.N.; writing—review and editing, C.C., E.A., F.T., S.C., and C.D.N.; supervision, C.D.N. and S.C.; project administration, C.D.N.; funding acquisition, C.D.N. and S.C. All authors have read and agreed to the published version of the manuscript.

Funding

This research was partially funded by the Project FIRST-–ForecastIng eRuptive activity at Stromboli volcano: timing, eruptive style, size, intensity, and duration, INGV-–Progetto Strategico Dipartimento Vulcani 2019, (Delibera n. 144/2020).

Data Availability Statement

The European Space Agency and NASA provided high-quality open-access data to the scientific community and Google Earth Engine platform facilitated the access to and the processing of the archive of publicly available satellite imagery.

Acknowledgments

This work was developed within the framework of the Laboratory of Technologies for Volcanology (TechnoLab) at the INGV in Catania (Italy). We are grateful to EUMETSAT for SEVIRI data (https://data.eumetsat.int, accessed on 20 June 2020), to the National Aeronautics and Space Administration (NASA) for MODIS data (modis.gsfc.nasa.gov, accessed on 20 June 2020), to the National Oceanic and Atmospheric Administration (NOAA) for VIIRS data (https://www.bou.class.noaa.gov/, accessed on 20 June 2020), and to the Sentinel Hub services (https://scihub.copernicus.eu/, accessed on 20 June 2020) for Copernicus Sentinel data. The English style was corrected by Stephan Conway.

Conflicts of Interest

The authors declare no conflict of interest. The authors declare that they have no known competing financial interests or personal relationships that could have appeared to influence the work reported in this paper.

References

  1. Rosi, M.; Bertagnini, A.; Landi, P. Onset of the persistent activity at Stromboli Volcano (Italy). Bull. Volcanol. 2000, 62, 294–300. [Google Scholar] [CrossRef]
  2. Di Traglia, F.; Calvari, S.; D’Auria, L.; Nolesini, T.; Bonaccorso, A.; Fornaciai, A.; Esposito, A.; Cristaldi, A.; Favalli, M.; Casagli, N. The 2014 effusive eruption at Stromboli: New insights from in-situ and remote sensing measurements. Remote Sens. 2018, 10, 2035. [Google Scholar] [CrossRef] [Green Version]
  3. Calvari, S.; Di Traglia, F.; Ganci, G.; Giudicepietro, F.; Macedonio, G.; Cappello, A.; Nolesini, T.; Pecora, E.; Bilotta, G.; Centorrino, V.; et al. Overflows and Pyroclastic Density Currents in March-April 2020 at Stromboli Volcano Detected by Remote Sensing and Seismic Monitoring Data. Remote Sens. 2020, 12, 3010. [Google Scholar] [CrossRef]
  4. Rosi, M.; Bertagnini, A.; Harris, A.J.L.; Pioli, L.; Pistolesi, M.; Ripepe, M. A case history of paroxysmal explosion at Stromboli: Timing and dynamics of the April 5, 2003 event. Earth Planet. Sci. Lett. 2006, 243, 594–606. [Google Scholar] [CrossRef]
  5. Areu-Rangel, O.S.; Bonasia, R.; Di Traglia, F.; Del Soldato, M.; Casagli, N. Flood Susceptibility and Sediment Transport Analysis of Stromboli Island after the 3 July 2019 Paroxysmal Explosion. Sustainability 2020, 12, 3268. [Google Scholar] [CrossRef] [Green Version]
  6. Giordano, G.; De Astis, G. The summer 2019 basaltic Vulcanian eruptions (paroxysms) of Stromboli. Bull. Volcanol. 2021, 83, 1. [Google Scholar] [CrossRef]
  7. Calvari, S.; Giudicepietro, F.; Di Traglia, F.; Bonaccorso, A.; Macedonio, G.; Casagli, N. Variable Magnitude and Intensity of Strombolian Explosions: Focus on the Eruptive Processes for a First Classification Scheme for Stromboli Volcano (Italy). Remote Sens. 2021, 13, 944. [Google Scholar] [CrossRef]
  8. Barberi, F.; Rosi, M.; Sodi, A. Volcanic hazard assessment at Stromboli based on review of historical data. Acta Vulcanol. 1993, 3, 173–187. [Google Scholar]
  9. Walker, G.P.L. Explosive volcanic eruptions—A new classification scheme. Geol. Rudsch. 1973, 62, 431–446. [Google Scholar] [CrossRef]
  10. Harris, A.J.L.; Dehn, J.; Calvari, S. Lava effusion rate definition and measurement: A review. Bull. Volcanol. 2007. [Google Scholar] [CrossRef]
  11. Giudicepietro, F.; López, C.; Macedonio, G.; Alparone, S.; Bianco, F.; Calvari, S.; De Cesare, W.; Delle Donne, D.; Di Lieto, B.; Esposito, A.M.; et al. Geophysical precursors of the July-August 2019 paroxysmal eruptive phase and their implications for Stromboli volcano (Italy) monitoring. Sci. Rep. 2020, 10, 10296. [Google Scholar] [CrossRef]
  12. Andronico, D.; Corsaro, R.A.; Cristaldi, A.; Polacci, M. Characterizing high energy explosive eruptions at Stromboli volcano using multidisciplinary data: An example from the 9 January 2005 explosion. J. Volcanol. Geotherm. Res. 2008, 176, 541–550. [Google Scholar] [CrossRef]
  13. Calvari, S.; Büttner, R.; Cristaldi, A.; Dellino, P.; Giudicepietro, F.; Orazi, M.; Peluso, R.; Spampinato, L.; Zimanowski, B.; Boschi, E. The 7 September 2008 Vulcanian explosion at Stromboli volcano: Multi-parametric characterization of the event and quantification of the ejecta. J. Geophys. Research. Solid Earth 2012, 117, B05201. [Google Scholar] [CrossRef]
  14. Bertagnini, A.; Coltelli, M.; Landi, P.; Pompilio, M.; Rosi, M. Violent explosions yield new insights into dynamics of Stromboli volcano. EOS Trans. Am. Geophys. Union 1999, 80, 633–636. [Google Scholar] [CrossRef]
  15. Andronico, D.; Pistolesi, M. The November 2009 paroxysmal explosions at Stromboli. J. Volcanol. Geotherm. Res. 2010, 196, 120–125. [Google Scholar] [CrossRef]
  16. Rittmann, A. Der ausbruch des Stromboli am 11 September 1930. Z. Vulkanol. 1931, 14, 47–77. [Google Scholar]
  17. Calvari, S.; Spampinato, L.; Lodato, L. The 5 April 2003 vulcanian paroxysmal explosion at Stromboli volcano (Italy) from field observations and thermal data. J. Volcanol. Geotherm. Res. 2006, 149, 160–175. [Google Scholar] [CrossRef]
  18. Calvari, S.; Lodato, L.; Steffke, A.; Cristaldi, A.; Harris, A.J.L.; Spampinato, L.; Boschi, E. The 2007 Stromboli flank eruption: Chronology of the events, and effusion rate measurements from thermal images and satellite data. J. Geophys. Research. Solid Earth 2010, 115, B04201. [Google Scholar] [CrossRef] [Green Version]
  19. Bonaccorso, A.; Calvari, S.; Linde, A.; Sacks, S.; Boschi, E. Dynamics of the shallow plumbing system investigated from borehole strainmeters and cameras during the 15 March 2007 Vulcanian paroxysm at Stromboli volcano. Earth Planet. Sci. Lett. 2012, 357–358, 249–256. [Google Scholar] [CrossRef]
  20. Pistolesi, M.; Rosi, M.; Pioli, L.; Renzulli, A.; Bertagnini, A.; Andronico, D. The Paroxysmal Event and Its Deposits. In The Stromboli Volcano: An Integrated Study of the 2002–2003 Eruption; Geophysical Monograph Series; Calvari, S., Inguaggiato, S., Puglisi, G., Ripepe, M., Rosi, M., Eds.; AGU: Washington, DC, USA, 2008; Volume 182, pp. 317–330. [Google Scholar]
  21. Pistolesi, M.; Delle Donne, D.; Pioli, L.; Rosi, M.; Ripepe, M. The 15 March 2007 explosive crisis at Stromboli volcano, Italy: Assessing physical parameters through a multidisciplinary approach. J. Geophys. Res. Solid Earth. 2011, 116, B12206. [Google Scholar] [CrossRef]
  22. Giudicepietro, F.; Calvari, S.; Alparone, S.; Bianco, F.; Bonaccorso, A.; Bruno, V.; Caputo, T.; Cristaldi, A.; D’Auria, L.; De Cesare, W.; et al. Integration of Ground-Based Remote-Sensing and In Situ Multidisciplinary Monitoring Data to Analyze the Eruptive Activity of Stromboli Volcano in 2017–2018. Remote Sensing. 2019, 11, 1813. [Google Scholar] [CrossRef] [Green Version]
  23. Calvari, S.; Spampinato, L.; Lodato, L.; Harris, A.J.L.; Patrick, M.R.; Dehn, J.; Burton, M.R.; Andronico, D. Chronology and complex volcanic processes during the 2002–2003 flank eruption at Stromboli volcano (Italy) reconstructed from direct observations and surveys with a handheld thermal camera. J. Geophys. Research. Solid Earth 2005, 110, B02201. [Google Scholar] [CrossRef] [Green Version]
  24. Calvari, S.; Intrieri, E.; Di Traglia, F.; Bonaccorso, A.; Casagli, N.; Cristaldi, A. Monitoring crater-wall collapse at active volcanoes: A study of the 12 January 2013 event at Stromboli. Bull. Volcanol. 2016, 78, 39. [Google Scholar] [CrossRef]
  25. Di Traglia, F.; Nolesini, T.; Ciampalini, A.; Solari, L.; Frodella, W.; Bellotti, F.; Fumagalli, A.; De Rosa, G.; Casagli, N. Tracking morphological changes and slope instability using spaceborne and ground-based SAR data. Geomorphology 2018, 300, 95–112. [Google Scholar] [CrossRef]
  26. Bonaccorso, A.; Calvari, S.; Garfì, G.; Lodato, L.; Patané, D. December 2002 flank failure and tsunami at Stromboli volcano inferred by volcanological and geophysical observations. Geophys. Res. Lett. 2003, 30, 1941–1944. [Google Scholar] [CrossRef]
  27. Di Roberto, A.; Bertagnini, A.; Pompilio, M.; Bisson, M. Pyroclastic density currents at Stromboli volcano (Aeolian Islands, Italy): A case study of the 1930 eruption. Bull. Volcanol. 2014, 76, 827. [Google Scholar] [CrossRef]
  28. Rosi, M.; Pistolesi, M.; Bertagnini, A.; Landi, P.; Pompilio, M.; Di Roberto, A. Stromboli volcano, Aeolian Islands (Italy): Present eruptive activity and hazards. Geol. Soc. Lond. 2013, 37, 473–490. [Google Scholar] [CrossRef]
  29. Bevilacqua, A.; Bertagnini, A.; Pompilio, M.; Landi, P.; Del Carlo, P.; Di Roberto, A.; Aspinall, W.; Neri, A. Major explosions and paroxysms at Stromboli (Italy): A new historical catalog and temporal models of occurrence with uncertainty quantification. Sci. Rep. 2020, 10, 1–18. [Google Scholar] [CrossRef] [PubMed]
  30. Ganci, G.; Cappello, A.; Bilotta, G.; Del Negro, C. How the variety of satellite remote sensing data over volcanoes can assist hazard monitoring efforts: The 2011 eruption of Nabro volcano. Remote Sens. Environ. 2020, 236, 111426. [Google Scholar] [CrossRef]
  31. Folch, A.; Costa, A.; Macedonio, G. FALL3D: A computational model for transport and deposition of volcanic ash. Comput. Geosci. 2009, 35, 1334–1342. [Google Scholar] [CrossRef]
  32. Gorelick, N.; Hancher, M.; Dixon, M.; Ilyushchenko, S.; Thau, D.; Moore, R. Google Earth Engine: Planetary-scale geospatial analysis for everyone. Remote Sens. Environ. 2017, 202, 18–27. [Google Scholar] [CrossRef]
  33. Romagnoli, C. Characteristics and morphological evolution of the Aeolian volcanoes from the study of submarine portions. Geol. Soc. Lond. Mem. 2013, 37, 13–26. [Google Scholar] [CrossRef]
  34. Schmetz, J.; Pili, P.; Tjemkes, S.; Just, D.; Kerkmann, J.; Rota, S.; Ratier, A. An Introduction to Meteosat Second Generation (MSG). Bull. Am. Meteorol. Soc. 2002, 83, 977–992. [Google Scholar] [CrossRef]
  35. Karamanolakis, G.; Hsu, D.; Gravano, L. Weakly Supervised Attention Networks for Fine-Grained Opinion Mining and Public Health; Association for Computational Linguistics (ACL): Stroudsburg, PA, USA, 2019; pp. 1–10. [Google Scholar]
  36. Corradino, C.; Bilotta, G.; Cappello, A.; Fortuna, L.; Del Negro, C. Combining Radar and Optical Satellite Imagery with Machine Learning to Map Lava Flows at Mount Etna and Fogo Island. Energies 2021, 14, 197. [Google Scholar] [CrossRef]
  37. Corradino, C.; Ganci, G.; Cappello, A.; Bilotta, G.; Hérault, A.; Del Negro, C. Mapping Recent Lava Flows at Mount Etna Using Multispectral Sentinel-2 Images and Machine Learning Techniques. Remote Sens. 2019, 11, 1916. [Google Scholar] [CrossRef] [Green Version]
  38. Guyon, I.; Elisseeff, A. An Introduction to Feature Extraction. In Feature Extraction; Studies in Fuzziness and Soft Computing; Guyon, I., Nikravesh, M., Gunn, S., Zadeh, L.A., Eds.; Springer: Berlin/Heidelberg, Germany, 2006; Volume 207. [Google Scholar] [CrossRef] [Green Version]
  39. Janssens, O.; Van de Walle, R.; Loccufier, M.; Van Hoecke, S. Deep learning for infrared thermal image based machine health monitoring. IEEE/ASME Trans. Mechatron. 2017, 23, 151–159. [Google Scholar] [CrossRef] [Green Version]
  40. Cárdenas-Peña, D.; Orozco-Alzate, M.; Castellanos-Dominguez, G. Selection of time-variant features for earthquake classification at the Nevado-del-Ruiz volcano. Comput. Geosci. 2013, 51, 293–304. [Google Scholar] [CrossRef]
  41. Aiuppa, A.; Burton, M.; Allard, P.; Caltabiano, T.; Giudice, G.; Gurrieri, S.; Liuzzo, M.; Salerno, G. First observational evidence for the CO2-driven origin of Stromboli’s major explosions. Solid Earth 2011, 2, 135–142. [Google Scholar] [CrossRef] [Green Version]
  42. Métrich, N.; Bertagnini, A.; Pistolesi, M. Paroxysms at Stromboli Volcano (Italy): Source, Genesis and Dynamics. Front. Earth Sci. 2021, 9, 593339. [Google Scholar] [CrossRef]
  43. Andronico, D.; Del Bello, E.; D’Oriano, C.; Landi, P.; Pardini, F.; Scarlato, P.; de’ Michieli Vitturi, M.; Taddeucci, J.; Cristaldi, A.; Ciancitto, F.; et al. Uncovering the eruptive patterns of the 2019 double paroxysm eruption crisis of Stromboli volcano. Nat. Commun. 2021, 12, 4213. [Google Scholar] [CrossRef] [PubMed]
  44. Burton, M.R.; Calvari, S.; Spampinato, L.; Lodato, L.; Pino, N.A.; Marchetti, E.; Murè, F. Volcanic and Seismic Activity at Stromboli Preceding the 2002–2003 Eruption. In The Stromboli Volcano: An Integrated Study of the 2002–2003 Eruption; Geophysical Monograph Series; Calvari, S., Inguaggiato, S., Puglisi, G., Ripepe, M., Rosi, M., Eds.; AGU: Washington, DC, USA, 2008; Volume 182, pp. 93–104. [Google Scholar]
  45. Aiuppa, A.; Bertagnini, A.; Métrich, N.; Moretti, R.; Di Muro, A.; Liuzzo, M.; Tamburello, G. A model of degassing for Stromboli volcano. Earth Planet. Sci. Lett. 2010, 295, 195–204. [Google Scholar] [CrossRef]
  46. Wan, Z.; Dozier, J. A generalized split-window algorithm for retrieving land-surface temperature from space. IEEE Trans. Geosci. Remote Sens. 1996, 34, 892–905. [Google Scholar]
  47. Rajasekar, U.; Weng, Q. Urban heat island monitoring and analysis using a non-parametric model: A case study of Indianapolis. ISPRS J. Photogramm. Remote Sens. 2009, 64, 86–96. [Google Scholar] [CrossRef]
  48. Wadge, G.; Cole, P.; Stinton, A.; Komorowski, J.C.; Stewart, R.; Toombs, A.C.; Legendre, Y. Rapid topographic change measured by high-resolution satellite radar at Soufriere Hills Volcano, Montserrat: 2008–2010. J. Volcanol. Geotherm. Res. 2011, 199, 142–152. [Google Scholar] [CrossRef]
  49. Di Traglia, F.; Intrieri, E.; Nolesini, T.; Bardi, F.; Del Ventisette, C.; Ferrigno, F.; Frangioni, S.; Frodella, W.; Gigli, G.; Lotti, A.; et al. The ground-based InSAR monitoring system at Stromboli volcano: Linking changes in displacement rate and intensity of persistent volcanic activity. Bull. Volcanol. 2014, 76, 786. [Google Scholar] [CrossRef]
  50. Arnold, D.W.D.; Biggs, J.; Wadge, G.; Mothes, P. Using satellite radar amplitude imaging for monitoring syn-eruptive changes in surface morphology at an ice-capped stratovolcano. Remote Sens. Environ. 2018, 209, 480–488. [Google Scholar] [CrossRef] [Green Version]
  51. Pinel, V.; Poland, M.; Hooper, A. Volcanology: Lessons learned from Synthetic Aperture Radar imagery. J. Volcanol. Geotherm. Res. 2014, 289, 81–113. [Google Scholar] [CrossRef]
  52. Dierking, W. Quantitative roughness characterization of geological surfaces and implications for radar signature analysis. IEEE Trans. Geosci. Remote Sens. 1999, 37, 2397–2412. [Google Scholar] [CrossRef] [Green Version]
  53. Wadge, G.; Scheuchl, B.; Stevens, N.F. Spaceborne Radar Measurements of the Eruption of Soufriere Hills Volcano, Montserrat. In The Eruption of the Soufriére Hills Volcano, Montserrat, from 1995 to 1999; Druitt, T.H., Kolelaar, B.P., Eds.; Geological Society London Memoirs: London, UK, 2002; Volume 21, pp. 583–594. [Google Scholar] [CrossRef]
  54. Rignot, E.J.; van Zyl, J.J. Change detection techniques for ERS-1 SAR data. IEEE Trans. Geosci. Remote Sens. 1993, 31, 896–906. [Google Scholar] [CrossRef] [Green Version]
  55. Bovolo, F.; Bruzzone, L. A Context-Sensitive Technique Based on Support Vector Machines for Image Classification. In Pattern Recognition and Machine Intelligence; PReMI, 2005; Lecture Notes in Computer Science; Pal, S.K., Bandyopadhyay, S., Biswas, S., Eds.; Springer: Berlin/Heidelberg, Germany, 2005; Volume 3776. [Google Scholar] [CrossRef] [Green Version]
  56. Ferretti, A.; Prati, C.; Rocca, F. Nonlinear subsidence rate estimation using permanent scatterers in differential SAR interferometry, IEEE Trans. Geosci. Remote Sens. 2000, 38, 2202–2212. [Google Scholar] [CrossRef] [Green Version]
  57. Hooper, A.; Zebker, H.; Segal, P.; Kampes, B. New method for measuring deformation on volcanoes and other natural terrains using InSAR persistent scatterers. Geophys. Res. Lett. 2004, 31, L23611. [Google Scholar] [CrossRef]
  58. Qiu, F.; Berglund, J.; Jensen, J.R.; Thakkar, P.; Ren, D. Speckle noise reduction in SAR imagery using a local adaptive median filter. GIScience Remote Sens. 2004, 41, 244–266. [Google Scholar] [CrossRef] [Green Version]
  59. Sparks, R.S.J.; Bursik, M.I.; Carey, S.N.; Gilbert, J.S.; Glaze, L.S.; Sigurdsson, H.; Woods, A.W. Volcanic Plumes. John Wiley & Sons: Chichester, UK, 1997; p. 574. ISBN 0-471-93901-3. [Google Scholar]
  60. Corradini, S.; Guerrieri, L.; Stelitano, D.; Salerno, G.; Scollo, S.; Merucci, L.; Prestifilippo, M.; Musacchio, M.; Silvestri, M.; Lombardo, V.; et al. Near real-time monitoring of the Christmas 2018 Etna eruption using SEVIRI and products validation. Remote Sens. 2020, 12, 1336. [Google Scholar] [CrossRef] [Green Version]
  61. Calvari, S.; Bilotta, G.; Bonaccorso, A.; Caltabiano, T.; Cappello, A.; Corradino, C.; Del Negro, C.; Ganci, G.; Neri, M.; Pecora, E.; et al. The VEI 2 Christmas 2018 Etna eruption: A small but intense eruptive event or the starting phase of a larger one? Remote Sens. 2020, 12, 905. [Google Scholar] [CrossRef] [Green Version]
  62. Grainger, R.G.; Peters, D.M.; Thomas, G.E.; Smith, A.J.A.; Siddans, R.; Carboni, E.; Dudhia, A. Measuring volcanic plume and ash properties from space. Geol. Soc. Lond. Spec. Publ. 2013, 380, 293–320. [Google Scholar] [CrossRef] [Green Version]
  63. Gouhier, M.; Deslandes, M.; Guéhenneux, Y.; Hereil, P.; Cacault, P.; Josse, B. Operational Response to Volcanic Ash Risks Using HOTVOLC Satellite-Based System and MOCAGE-Accident Model at the Toulouse VAAC. Atmosphere 2020, 11, 864. [Google Scholar] [CrossRef]
  64. Pavolonis, M.J.; Sieglaff, J. GOES-R Advanced Baseline Imager (ABI) Algorithm Theoretical Basis Document for Volcanic Ash (Detection and Height); Version 3.0; NOAA NESDIS, Cent. for Satell. Appl. and Res.: College Park, MD, USA, 2012; 71p. [Google Scholar]
  65. Aghabozorgi, S.; Shirkhorshidi, A.S.; Wah, T.Y. Time-series clustering–A decade review. Inf. Syst. 2015, 53, 16–38. [Google Scholar] [CrossRef]
  66. Berkhin, P. A Survey of Clustering Data Mining Techniques. In Grouping Multidimensional Data; Springer: Berlin/Heidelberg, Germany, 2006; pp. 25–71. [Google Scholar]
  67. Di Giuseppe, M.G.; Troiano, A.; Patella, D.; Piochi, M.; Carlino, S. A geophysical k-means cluster analysis of the Solfatara-Pisciarelli volcano-geothermal system, Campi Flegrei (Naples, Italy). J. Appl. Geophys. 2018, 156, 44–54. [Google Scholar] [CrossRef]
  68. MacQueen, J. Some Methods for Classification and Analysis of Multivariate Observations. In Proceedings of the Fifth Berkeley Symposium on Mathematical STATISTICS and Probability, University of California Press, Oakland, CA, USA; 1967; Volume 1, pp. 281–297. [Google Scholar]
  69. Arthur, D.; Vassilvitskii, S. K-means++: The Advantages of Careful Seeding; Technical Report; University of Stanford: Stanford, CA, USA, 2006; pp. 1–11. [Google Scholar]
  70. Lloyd, S.P. Least squares quantization in PCM. IEEE Trans. Inf. Theory 1982, 28, 129–137. [Google Scholar] [CrossRef]
  71. Singh, D.; Singh, B. Investigating the impact of data normalization on classification performance. Appl. Soft Comput. 2020, 97, 105524. [Google Scholar] [CrossRef]
  72. Girona, T.; Realmuto, V.; Lundgren, P. Large-scale thermal unrest of volcanoes for years prior to eruption. Nat. Geosci. 2021, 14, 238–241. [Google Scholar] [CrossRef]
  73. Viccaro, M.; Cannata, A.; Cannavò, F.; De Rosa, R.; Giuffrida, M.; Nicotra, E.; Petrelli, M.; Sacco, G. Shallow conduit dynamics fuel the unexpected paroxysms of Stromboli volcano during the summer 2019. Sci. Rep. 2021, 11, 266. [Google Scholar] [CrossRef] [PubMed]
Figure 1. (a) Google map of southern Italy, with the red circle showing the position of Stromboli volcano, at the NE end of the Aeolian Archipelago. (b) Stromboli Island with the position of active craters. NEC = NE Crater zone; CC = Central Crater zone; SWC = SW Crater zone, all of them located within the summit Crater Terrace located at ~750 m above sea level. Sciara del Fuoco is a horseshoe-shaped depression formed by several landslides in the NW sector of the volcano, which is 1700 m wide, and extends underwater to a depth over 2000 m.
Remotesensing 13 04080 g001
Figure 2. Workflow of the unsupervised classifier showing the transformation from satellite raw data to descriptive features that are then fed to the k-means algorithm. It provides a binary outcome, i.e., zero for Major Explosions and one for Paroxysms.
Remotesensing 13 04080 g002
Figure 3. Time series of LFTS (a), LSTI (b), and EVD (c) values calculated from January 2018 to April 2021. (a,b) The red stars indicate the explosive events listed in Table 1. (c) EVD is computed for each Sentinel-1 acquisition (blue dots). EVD values corresponding to the investigated eruptive events are shown as red dots.
Remotesensing 13 04080 g003
Figure 4. (a) LFTS zoomed in the time interval from May to July 2019. The star highlights the 3 July 2019 paroxysmal event. (b) Change detection image showing explosive deposits and eroded area detected by using the ratio of Sentinel-1 SAR descending images. The amplitude ratio is calculated between the pre-eruptive image of 26 June 2019 and the post-eruptive intensity image of 8 July 2019. The red rectangle indicates the brighter pixels that are related to the biggest materials deposited (widespread pyroclastic density current, ballistics and tephra fallout) during the eruption, whereas the green rectangle indicates the darker pixels related to the removal of materials due to the crater area erosion after the eruption.
Remotesensing 13 04080 g004
Figure 5. Plume Height retrieved by using SEVIRI Band 9 image of 3 July 2019 15:12 UTC (a) and the atmospheric profile from NCAR/NCEP for 3 July 2019 at 12:00 UTC (b). The red x indicates the value corresponding to the minimum pixel value of the BT image in (a) and the corresponding retrieved height value in (b).
Remotesensing 13 04080 g005
Figure 6. (a) LFTS zoomed in the time interval from August to November 2020. The star highlights the 10 November 2020 major event. (b) Change detection image showing explosive deposits by using the ratio of Sentinel-1 SAR descending images. The amplitude ratio is calculated between the pre-eruptive image of 5 November 2020 and the post-eruptive intensity image of 11 November 2020. The red square indicates the brighter pixels that are related to the biggest materials deposited after the eruption.
Remotesensing 13 04080 g006
Figure 7. Classification of the eruptive events at Stromboli volcano by using k-means classifier. The dots are the input vectors for each explosive eruption, colored green if classified as Major Explosions and red if classified as Paroxysms. Centroids for each cluster are shown with a cross.
Remotesensing 13 04080 g007
Figure 8. Sequence of thermal images acquired from the camera of the INGV monitoring network at Stromboli during the 16 November 2020 paroxysm.
Remotesensing 13 04080 g008
Figure 9. Fires detected at Stromboli after the 3 July 2019 paroxysm. False Color image made by B12-B11-B4 bands from Sentinel-2 MSI image acquired on 4 July 2019 at 09:49 UTC.
Remotesensing 13 04080 g009
Table 1. List of the powerful eruptive events from January 2018 to April 2021 with the classes derived from Calvari et al. [7], Bevilacqua et al. [29] and the INGV weekly bulletins. Major Explosion (ME), Paroxysm (PA), Not Available (NA) in the case no information is provided. Date and time in dd/mm/yyyy hh:mm:ss format. Time is expressed in UTC.
NumberEventClassReferences
107/03/2018 12:48:13MEINGV bulletin, Bevilacqua et al. [29]
218/03/2018 19:27:28MEINGV bulletin, Bevilacqua et al. [29]
324/04/2018 09:05:10MEINGV bulletin, Bevilacqua et al. [29]
426/04/2018 22:53:50MEINGV bulletin, Bevilacqua et al. [29]
518/08/2018 15:08:30MEINGV bulletin, Bevilacqua et al. [29]
606/12/2018 15:20:00MEINGV bulletin, Bevilacqua et al. [29]
725/06/2019 23:03:08MEINGV bulletin, Bevilacqua et al. [29], Calvari et al. [7]
803/07/2019 14:45:43PAINGV bulletin, Bevilacqua et al. [29], Calvari et al. [7]
913/07/2019 20:33:00MEINGV bulletin, Calvari et al. [7]
1015/07/2019 19:09:00MEINGV bulletin, Calvari et al. [7]
1128/08/2019 10:17:20PAINGV bulletin, Bevilacqua et al. [29], Calvari et al. [7]
1229/08/2019 20:43:18MEINGV bulletin, Calvari et al. [7]
1319/07/2020 03:00:42ME/PABevilacqua et al. (2020), Calvari et al. [7]
1413/08/2020 14:50:28MEINGV bulletin, Calvari et al. [7]
1510/11/2020 20:04:21MEINGV bulletin, Calvari et al. [7]
1616/11/2020 09:17:45MEINGV bulletin, Calvari et al. [7]
1721/11/2020 00:33:17MEINGV bulletin, Calvari et al. [7]
1806/12/2020 05:12:44MEINGV bulletin, Calvari et al. [7]
1901/03/2021 01:33:00MEINGV bulletin
Table 2. Optical and Radar satellite images used for each investigated volcanic explosion. Date and time in dd/mm/yyyy hh:mm:ss format. Time is expressed in UTC.
EventOptical Satellite ImagesS1-SAR
Pre-Eruptive
S1-SAR
Post-Eruptive
07/03/2018 12:48:13SEVIRI Band 9–07/03/18 12:57 03/03/2018 05:0409/03/2018 05:04
18/03/2018 19:27:28SEVIRI Band 9–18/03/18 19:27 15/03/2018 05:0421/03/2018 05:04
24/04/2018 09:05:10SEVIRI Band 9–24/04/18 09:12 20/04/2018 05:0426/04/2018 05:04
26/04/2018 22:53:50SEVIRI Band 9–26/04/18 22:57 26/04/2018 05:0402/05/2018 05:04
18/08/2018 15:08:30SEVIRI Band 9–18/08/18 15:12 18/08/2018 05:0424/08/2018 05:04
06/12/2018 15:20:00SEVIRI Band 9–06/12/18 15:27 04/12/2018 05:0410/12/2018 05:04
25/06/2019 23:03:08SEVIRI Band 9–25/06/19 23:12 20/06/19 05:0326/06/20 05:04
03/07/2019 14:45:43SEVIRI Band 9–03/07/19 15:12 26/06/19 05:0408/07/19 05:04
13/07/2019 20:33:00SEVIRI Band 9–13/07/19 20:42 08/07/2019 05:0414/7/2019 05:04
15/07/2019 19:09:00SEVIRI Band 9–15/07/19 19:27 14/07/2019 05:0420/7/2019 05:04
28/08/2019 10:17:20VIIRS Band I5–28/08/19 12:1425/08/19 05:0431/08/19 05:03
29/08/2019 20:43:18SEVIRI Band 9–29/08/19 20:5725/08/19 05:0431/08/19 05:03
19/07/2020 03:00:42SEVIRI Band 9–19/07/20 04:12 14/07/20 05:0420/07/20 05:03
13/08/2020 14:50:28SEVIRI Band 9–13/08/20 15:12 13/08/2020 05:0419/8/2020 05:04
10/11/2020 20:04:21SEVIRI Band 9–10/11/20 20:12 05/11/20 05:0411/11/20 05:04
16/11/2020 09:17:45SEVIRI Band 9–16/11/20 09:27 11/11/20 05:0417/11/20 05:03
21/11/2020 00:33:17SEVIRI Band 9–21/10/20 00:42 17/11/2020 05:0423/11/2020 05:04
06/12/2020 05:12:44SEVIRI Band 9–16/11/20 05:27 05/12/20 05:0411/12/20 05:03
01/03/2021 01:33:00 SEVIRI Band 9–01/03/21 01:57 27/02/2021 05:045/3/2021 05:04
Table 3. List of the input features and classification outcome between “paroxysm” and “major explosion” for each eruptive event at Stromboli volcano. Date and time in dd/mm/yyyy hh:mm:ss format. Time is expressed in UTC.
NumberEventPH (m)EVD (a.u.)LSTI (°C)Class
107/03/2018 12:48:133504.240.9Major Explosion
218/03/2018 19:27:282506.850.9Major Explosion
324/04/2018 09:05:105001.360.88Major Explosion
426/04/2018 22:53:505001.740.88Major Explosion
518/08/2018 15:08:305001.901.6Major Explosion
606/12/2018 15:20:005002.251.51Major Explosion
725/06/2019 23:03:085003.111.58Major Explosion
803/07/2019 14:45:43586012.512.63Paroxysm
913/07/2019 20:33:001100.982.63Major Explosion
1015/07/2019 19:09:003801.762.63Major Explosion
1128/08/2019 10:17:2031407.212.44Paroxysm
1229/08/2019 20:43:183507.211.17Major Explosion
1319/07/2020 03:00:427501.661.67Major Explosion
1413/08/2020 14:50:285501.111.54Major Explosion
1510/11/2020 20:04:216002.291.82Major Explosion
1616/11/2020 09:17:45100012.431.82Paroxysm
1721/11/2020 00:33:17800.891.06Major Explosion
1806/12/2020 05:12:443001.231.06Major Explosion
1901/03/2021 01:33:005001.511.6Major Explosion
Publisher’s Note: MDPI stays neutral with regard to jurisdictional claims in published maps and institutional affiliations.

