Abstract
Vegetation greenness dynamics in arid and semi-arid regions are sensitive to climate change, which is an important phenomenon in global climate change research. However, the driving mechanism, particularly for the longitudinal and latitudinal changes in vegetation greenness related to climate change, has been less studied and remains poorly understood in arid and semi-arid areas. In this study, we investigated changes in vegetation greenness and the vegetation greenness line (the mean growing season normalized difference vegetation index (NDVI) = 0.1 contour line) and its response to climate change based on AVHRR-GIMMS NDVI3g and the fifth and latest global climate reanalysis dataset from 1982 to 2015 in the arid and semi-arid transition zone of the Mongolian Plateau (ASTZMP). The results showed that the mean growing season NDVI increased from the central west to east, northeast, and southeast in ASTZMP. The vegetation greenness line migrated to the desert during 1982–1994, to the grassland during 1994–2005, and then to the desert during 2005–2015. Vegetation greenness was positively correlated with precipitation and negatively correlated with temperature. The latitudinal variation of the vegetation greenness line was mainly affected by the combination of precipitation and temperature, while the longitudinal variation was mainly affected by precipitation. In summary, precipitation was a key climatic factor driving rapid changes in vegetation greenness during the growing season of the transition zone. These results can provide meaningful information for research on vegetation coverage changes in arid and semi-arid regions.
1. Introduction
Vegetation greenness dynamics are important for understanding changes in ecosystem structure and function [1]. Satellite data show a persistent and widespread increase in greening throughout the growing season, represented by over 25–50% of the global vegetated area [2]. This trend is strikingly prominent in China and India, mainly in forests and croplands [3]. However, this type of greening is mostly due to changes in land-use management rather than natural environmental changes. Compared with forests and croplands, grasslands, particularly in arid and semi-arid transition zones, are more sensitive to natural environmental changes, such as climate change. Global climate change is rapidly altering the dynamics of terrestrial vegetation, and the vegetation responds to climate change in both explicit and subtle ways [4,5]. In the context of continuous warming, temperature, precipitation, and other factors in different regions are different, and the influence of climate change on vegetation varies among different regions [6]. Therefore, exploring the spatiotemporal pattern of vegetation greenness and discussing the driving role of climate factors has become one of the main topics of current global change research [1,7,8]. Many previous studies have shown that vegetation greening varies with climate change globally [1,9] and regionally [10,11]. However, the underlying mechanisms of longitudinal and latitudinal changes in vegetation greenness related to climate change are not yet well understood in arid and semi-arid areas.
Global vegetation average growth conditions have continued to improve since the 1980s with warming [1,12], especially in the mid and high latitudes of the Northern Hemisphere [13]. However, this trend in vegetation greening is spatially and temporally heterogeneous [14]. Moreover, the greenness of vegetation in Central Asia [10], East Asia [15], and China [11,16] has also increased. In contrast, browning occurred in northern Eurasia [7], southwestern United States [17], and Central Asia [18]. Although many studies have focused on the changes in vegetation greenness and vegetation coverage in different regions, the temporal and spatial variations of the vegetation greenness line (the contour line of the annual normalized difference vegetation index (NDVI) = 0.1) remain poorly understood.
Temperature and precipitation are the most important climatic factors that influence vegetation growth and development [19]. The influence of temperature and precipitation on vegetation varies across regions. Temperature exerted the greatest influence on changes in vegetation greenness at the global scale [20], especially in the northern mid and high latitudes [21,22]. Air temperature is also a limiting factor for vegetation greenness in semi-arid areas [23]. Although increasing temperature contributed to the NDVI increase in China, precipitation is a stronger driver of NDVI at a regional scale [24]. However, recent analyses [25] found a decreasing correlation, as well as a negative correlation, between temperature and vegetation growth in the Northern Hemisphere during 1996–2012. Previous studies have also evidenced that vegetation is very sensitive to precipitation changes [26,27], and vegetation greenness increases with precipitation, especially in arid and semi-arid areas [28]. The heat demand of vegetation varies with the availability of precipitation, indicating the indirect impact of precipitation on vegetation growth [29]. A comprehensive analysis to quantify the contribution of temperature, precipitation, and solar radiation on vegetation growth was conducted by Li et al. [30]. In the alpine region, warming and wetting facilitate vegetation variation along elevation gradients [31], along with the impacts of rising temperatures on biodiversity and ecological structure [32]. Bao et al. [33] determined that the amount of precipitation during the growing season was a key factor controlling vegetation dynamics in the Mongolian Plateau.
The Mongolian Plateau is a special geographical location with a complex climate system, fragile ecosystem, and aspects that are highly sensitive to environmental changes, highlighting its important and unique position in the study of global change [33,34]. Many previous studies have analyzed vegetation variation and its responses to climate change in the Mongolian Plateau [33,34,35,36]. However, few studies have addressed vegetation greenness and its variations in the arid and semi-arid transition zone of the Mongolian Plateau (ASTZMP), in addition to their responses to climate change. The ASTZMP is expected to be among the most sensitive areas to directional changes in climate, and it can have important effects on vegetation greenness. Therefore, it is critical to understand the relationship between climate and vegetation greenness on a broad scale. In this study, we used the Global Inventor Modeling and Mapping Studies (GIMMS) NDVI3g datasets produced by the National Aeronautics and Space Administration (NASA) and the fifth and latest global climate reanalysis (ERA-5) datasets produced by the European Centre for Medium-Range Weather Forecasts (ECMWF) to analyze the variations in vegetation and vegetation greenness lines and their responses to climate change in the ASTZMP. The main goals of this study were as follows: (1) to investigate the vegetation dynamics in ASTZMP over the period 1982–2015, (2) to analyze the variations in vegetation greenness lines, and (3) to evaluate the response of vegetation and vegetation greenness lines to climatic changes in ASTZMP during 1982–2015.
2. Materials and Methods
2.1. Study Area
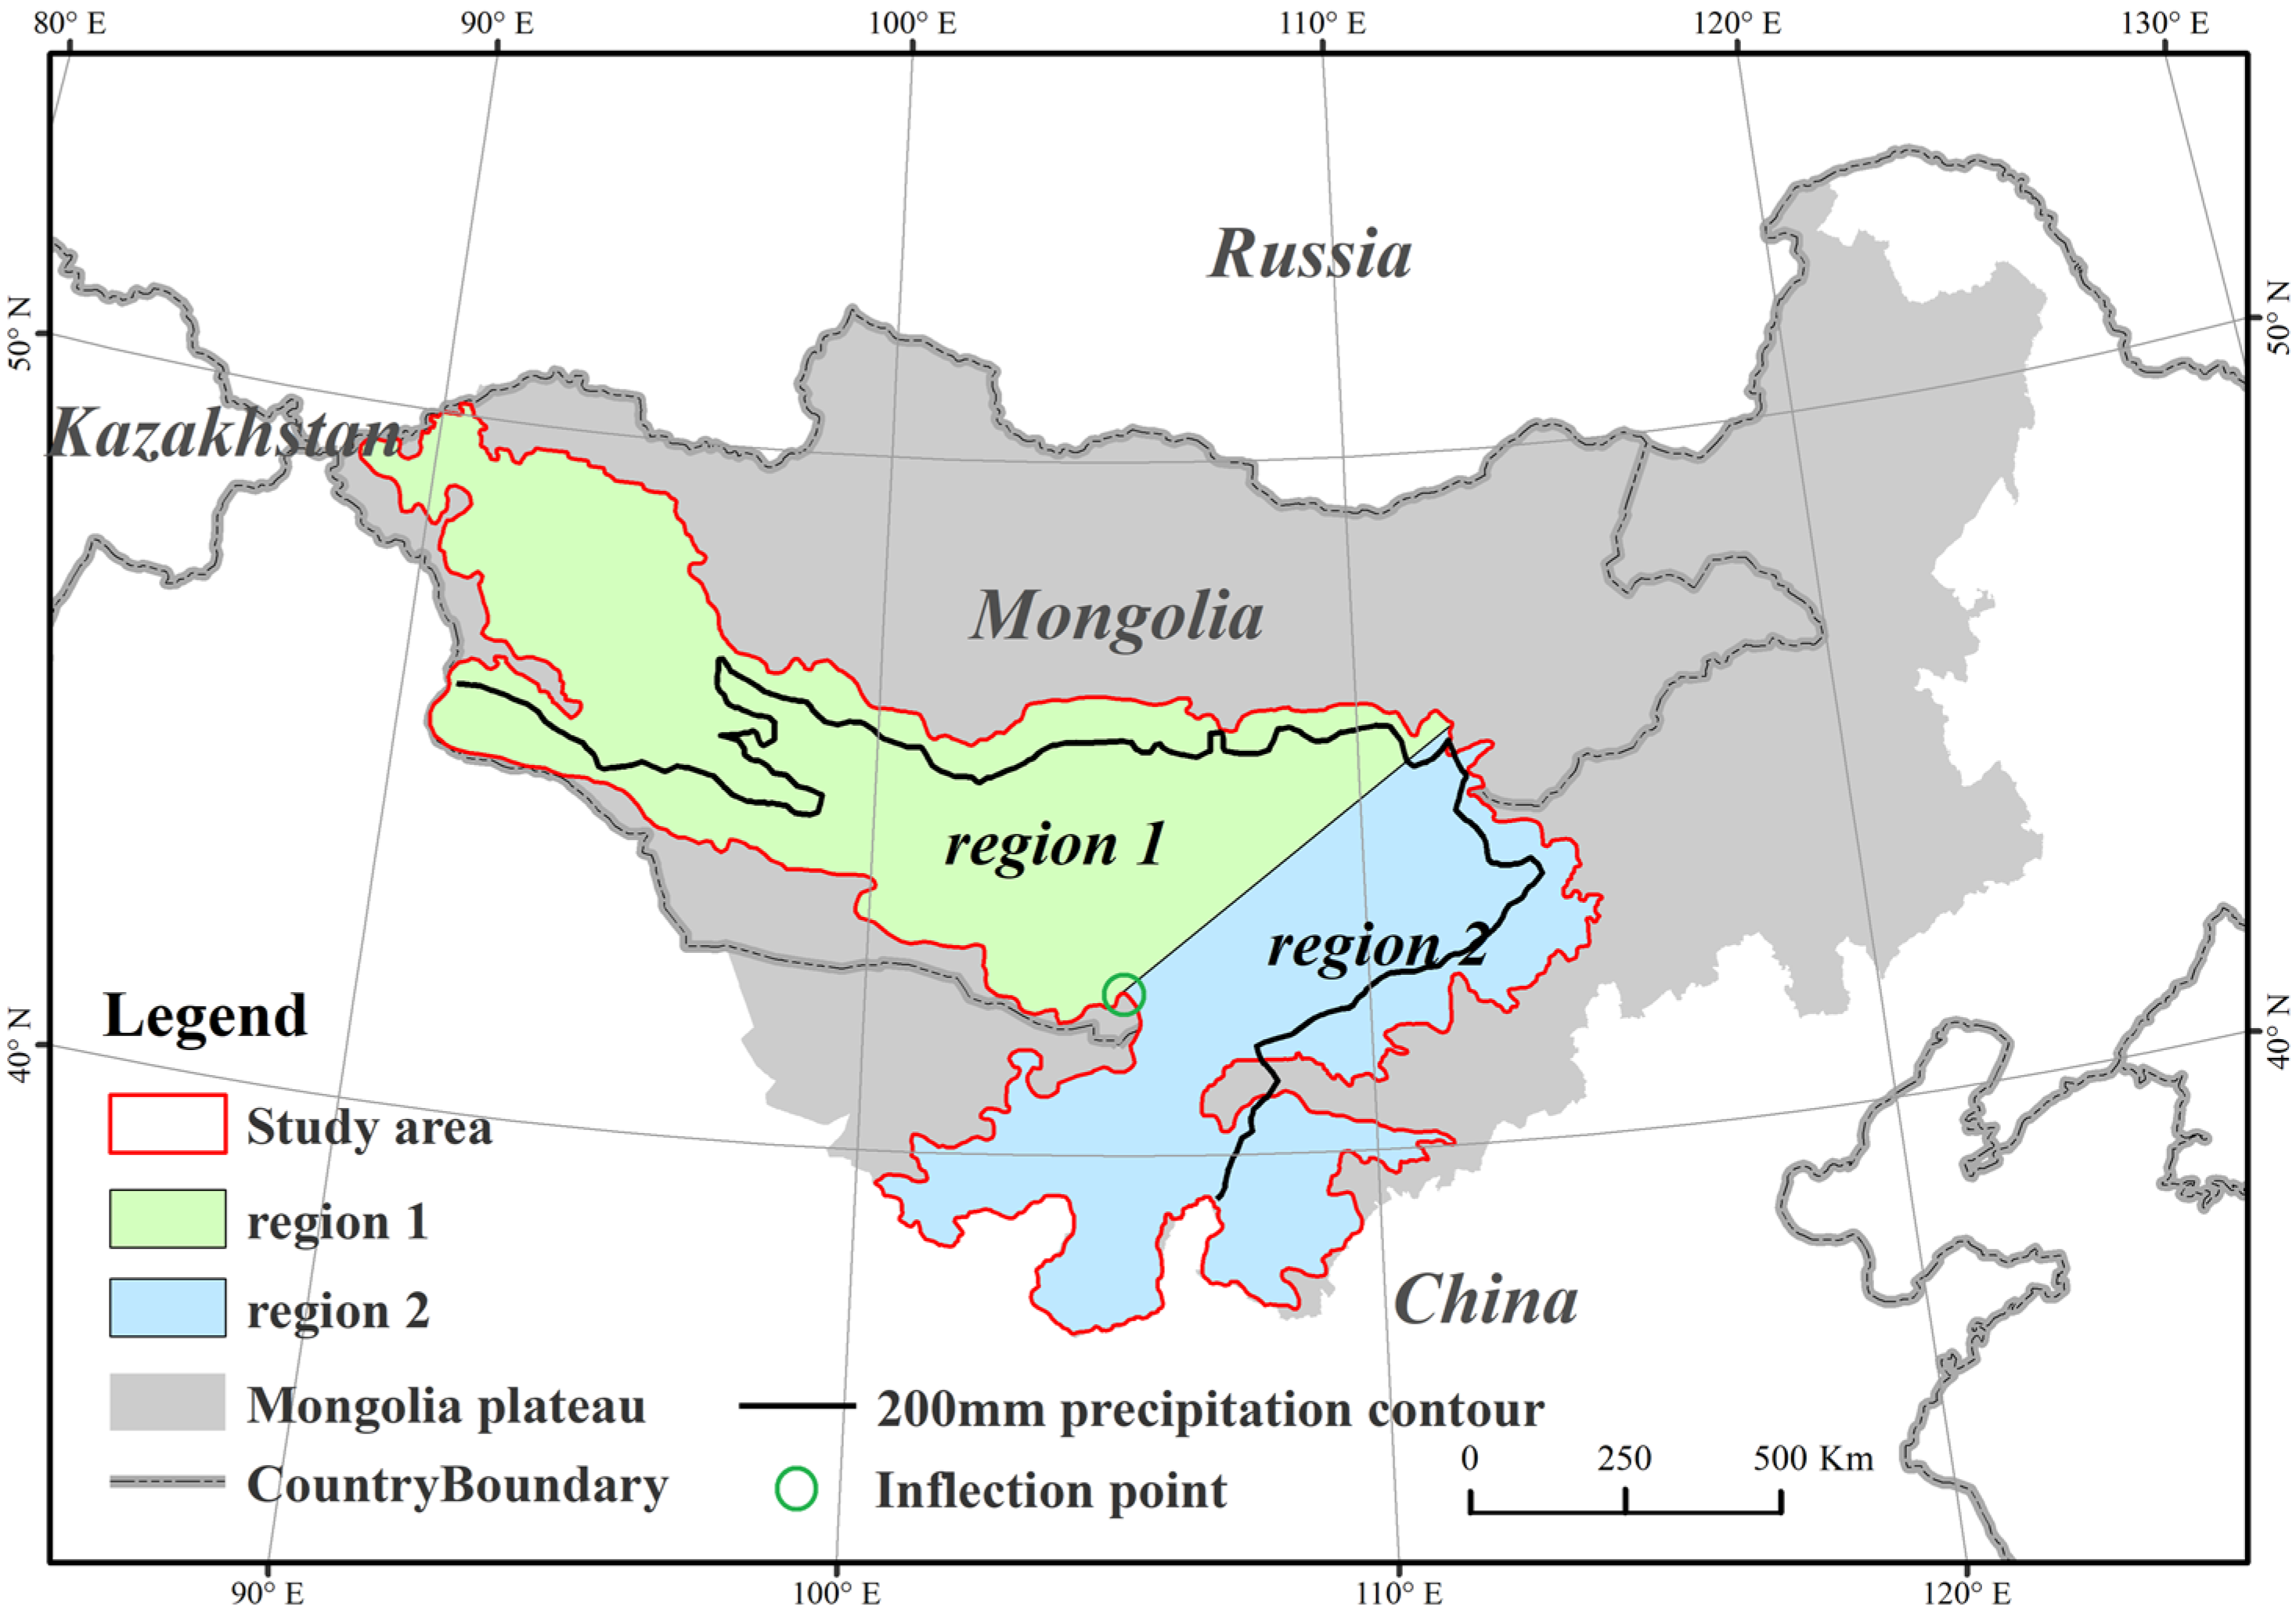
The Mongolian Plateau is located in the inland plateau of Central Asia, covering the entire Mongolian People’s Republic and the Inner Mongolia Autonomous Region of China. We defined the boundary between arid and semi-arid areas in the Mongolian Plateau using a multi-annual average precipitation threshold of 200 mm [15,37]. First, we used 200 mm precipitation threshold to extract the corresponding NDVI value at the pixel scale. Second, we sorted the extracted NDVI values from small to large and selected the NDVI value range of 5–95%, and the value was from 0.065 to 0.261. Finally, pixels from 0.065 to 0.261 in the average NDVI from 1982 to 2015 were selected as the study area. Therefore, the largest closed region in this range was selected as ASTZMP, the study area (ASTZMP), with a total area of 1.98 × 10⁶ km2. The study area was divided into two sub-regions according to the shape of the vegetation greenness line (NDVI = 0.1), indicating the latitudinal and longitudinal changes in the vegetation greenness line, respectively (explained in Section 2.2.2) (Figure 1). ASTZMP is the transition zone between the Gobi Desert and desert grassland, with warm summers and cold winters belonging to a temperate continental climate. The average temperature of the growing season, April–October [7], is approximately 14.0 °C, and the regional average precipitation in the study area during the growing season is approximately 165 mm.
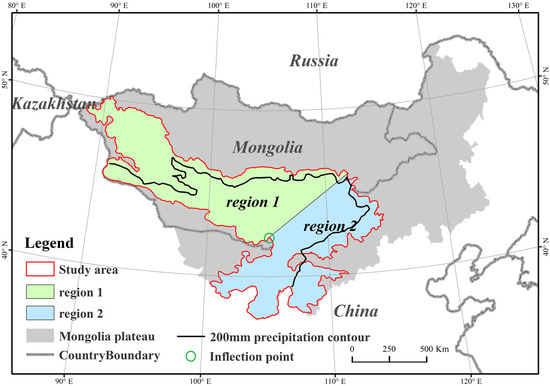
Figure 1.
Location of the study area. The vegetation greenness line of Region1 is roughly parallel to the latitude line, and Region 2 is roughly parallel to the longitudinal line.
2.2. Data and Methods
2.2.1. Data Source
Vegetation greenness refers to above-ground green biomass or vegetation green degree, etc. [31]. The NDVI is typically used to detect vegetation greenness [31,38]. The NDVI data (from 1982 to 2015) used in this study were derived from an updated version of the GIMMS NDVI3g dataset, which has a spatial resolution of 0.083° × 0.083° and a temporal resolution of 15 days (https://ecocast.arc.nasa.gov/data/pub/gimms/3g.v1/ (accessed on 20 December 2020)). The GIMMS NDVI3g data have been extensively corrected for cloud cover, aerosols, sensor degradation, navigational drift, solar zenith angle, and viewing angle effects due to satellite drift and volcanic aerosols [39]. GIMMS NDVI data have been used in previous studies to analyze desertification, vegetation greenness, and phenology [40]. To further decrease the effects of atmospheric and aerosol scattering, we used the maximum value composite (MVC) method to develop a monthly NDVI. Then, the NDVI values from April to October were averaged to obtain the average NDVI during the growing season. These calculations were performed using the Raster Calculator of Map Algebra mode in ArcGIS10.8 software developed by Environmental Systems Research Institute (ESRI) of USA.
The climate data (i.e., precipitation and temperature) used in this study were obtained from the latest global climate reanalysis dataset (ERA5) (https://cds.climate.copernicus.eu/cdsapp/search (accessed on 20 December 2020)). ERA5 is currently available for the period from 1979 to the present at a spatial resolution of 0.25° × 0.25° and provides many atmospheric, land–surface, and sea-state parameters on an hourly basis. Compared with ERA-Interim, the ERA5 4D-Var data assimilation system in the Integrated Forecasting System (IFS Cycle 41r2) was improved with many modifications, representing a decade of research and development in modeling and data assimilation. In this study, we used ERA5 climate data (monthly mean air temperature and precipitation at two meters above the surface) for 1982–2015. To be consistent with the spatial resolution of the vegetation data, the ERA5 climate data were resampled to 0.083° by the bilinear resampling of ArcGIS 10.5 software.
2.2.2. Definition of Vegetation Greenness Line and Its Migration
Because regions with NDVI below 0.1 were categorized as bare land or non-vegetated areas [10,13,41,42], the vegetation coverage region was defined as pixels with NDVI ≥ 0.1. The NDVI 0.1 contour line (i.e., bare soil line) is located in the climatologically fixed desert boundary. The demarcation point of 0.1 was identified as a general threshold to distinguish vegetated from unvegetated areas [42]. Therefore, the vegetation greenness line was defined as the NDVI = 0.1 contour line in the growing season. This vegetation greenness line was considered as the boundary between the desert and desert grasslands in this study.
Furthermore, the study area was divided into two sub-regions according to the shape of the vegetation greenness line. Based on the inflection point of the western boundary, the study area was divided into two sub-regions by drawing a dividing line from this inflection point toward the NE direction at a 45° angle. Specifically, the vegetation greenness line of Region1 was roughly parallel to the latitude line, and the shift along the longitudinal direction was not obvious; therefore, we mainly analyzed the latitudinal change of the vegetation greenness line in Region1. The vegetation greenness line of Region2 was roughly parallel to the longitudinal line, and the shift along the latitudinal direction was not obvious; therefore, we mainly analyzed the longitudinal change of the vegetation greenness line in Region2. We used the weighted average location method to characterize the migration of the vegetation greenness line. The center point of the vegetation greenness line is the average longitude (latitude) of the vegetation greenness line in this study. We first extracted the X direction (Region2 vegetation greenness line) and Y direction (Region1 vegetation greenness line) coordinates (X-Coord and Y-Coord) of all discrete points (pixels) on the vegetation greenness line. Then, we calculated the average value of these discrete points X-Coord and Y-Coord, and the weighted average position of the vegetation greenness line can be obtained. Therefore, we can see the latitudinal change of the vegetation greenness line in area 1, and the longitudinal line of the vegetation greenness line in area 2.
2.2.3. Vegetation Dynamics Trend Analysis
In this study, a simple linear regression analysis was used to calculate the trend (slope) for the regional mean NDVI as well as for the NDVI in each pixel.
where n is the length of the time series, which was 34 years (1982–2015) in this study, i is the year, and MNDVIi is a mean NDVI value of the ith growing season. To further detect the spatial characteristics of vegetation growth trends, the linear trend for each pixel was also examined. A p value < 0.05 was taken as evidence that the change trend was significant [33,43].
2.2.4. Analysis of the Vegetation Greenness and Vegetation Greenness Line in Relation to Climate Change
A spatial correlation was applied to examine the effects of climate change on vegetation greenness. In this study, a pixel-by-pixel spatial correlation analysis (significance level 0.05) was used to estimate the relationship between NDVI and temperature and precipitation variables.
To understand the vegetation greenness line’s response to climate change (temperature and precipitation), Pearson correlation analysis (significance level 0.05) and regression analysis were used to estimate the relationship between the vegetation greenness line and climate change. When calculating the correlation between vegetation greenness lines and climate change, we calculated the weighted average latitude and longitude of the vegetation greenness line according to Section 2.2.2, and then calculated the latitude and longitude of the vegetation greenness line for correlation analysis with temperature and precipitation.
Path analysis is a form of multiple regression statistical analysis that is used to evaluate causal models by examining the relationships between a dependent variable and two or more independent variables. Using this method, one can estimate both the magnitude and significance of the causal connections between variables. In this study, based on path analysis [44,45], we calculated the direct, indirect, and combined effects of temperature and precipitation during the growing season on vegetation greenness. This includes the direct effect of temperature on NDVI, the indirect effect of temperature via precipitation on NDVI, the direct effect of precipitation on NDVI, and the indirect effect of precipitation via temperature on NDVI. The direct impact of temperature (or precipitation) on vegetation greenness was calculated when the impact of precipitation (or temperature) changes was not considered. In addition, the change in temperature (or precipitation) will cause precipitation (or temperature) change and affect vegetation greenness, which is considered to be the indirect influence of temperature (or precipitation) on vegetation greenness. The combined effects of temperature (or precipitation) on vegetation greenness include both direct and indirect effects.
To facilitate the comparison of indicators of different units and magnitudes, we first used the Z-score standardization method [46] to standardize the vegetation greenness, average temperature, and precipitation as follows:
where Xstad is the standardized value, is the average value in the entire region from 1982 to 2015, and σ is the standard deviation.
The direct effect of temperature (At) and precipitation (Ap) on NDVI was then obtained according to the following multiple linear regression:
where ε refers to the residual error, and NDVIstad, Tstad, and Pstad are the standardized values of vegetation greenness, temperature, and precipitation, respectively.
The indirect effects of temperature and precipitation were acquired according to Equations (4) and (5):
where rtp is the correlation coefficient between temperature and precipitation, and Atp and Apt represent the indirect effects of temperature and precipitation on NDVI, respectively.
According to the path analysis, the correlation coefficient is equal to the sum of the direct and indirect path coefficients.
where rt-ndvi and rp-ndvi represent the correlation coefficient of average temperature, precipitation, and vegetation greenness—that is, the combined effects of average temperature and precipitation on vegetation greenness.
3. Results
3.1. Spatiotemporal Patterns of Vegetation Greenness in ASTZMP
3.1.1. Vegetation Greenness Dynamics
The regional spatial average NDVI value fluctuated greatly during 1982–2015 and experienced an increasing–decreasing–increasing trend for the whole study area (Figure 2a). The spatial average NDVI increased at a rate of 0.0011 per year (p = 0.07) during 1982–1994 and significantly decreased (−0.0014 per year, p < 0.05) from 1994 to 2005. Subsequently, the NDVI increased at a rate of 0.0008 per year (p = 0.10) during 2005–2015. The changes in the regional spatial average NDVI could be due to changes in the number of pixels with NDVI ≥ 0.1 in this study. Therefore, we analyzed the changes in the number of pixels with NDVI ≥ 0.1, which were remarkably consistent with the spatial average NDVI changes (Figure 2a). The spatial average NDVI was significantly positively correlated (r = 0.726, p < 0.001) with the number of pixels with NDVI ≥ 0.1, showing an increasing linear trend in NDVI of 0.00067 per 1000 pixels (Figure 2b).
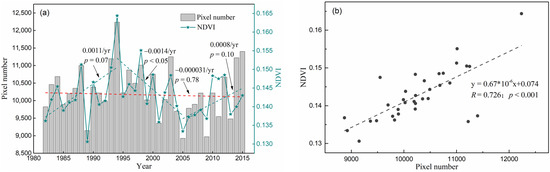
Figure 2.
Interannual changes in spatial average NDVI and number of grids with NDVI ≥ 0.1 (a) and regression relationship between NDVI and number of pixels with NDVI ≥ 0.1 (b) of the growing season in ASTZMP during 1982–2015.
3.1.2. Spatial Pattern of Mean NDVI and Local Changes in NDVI
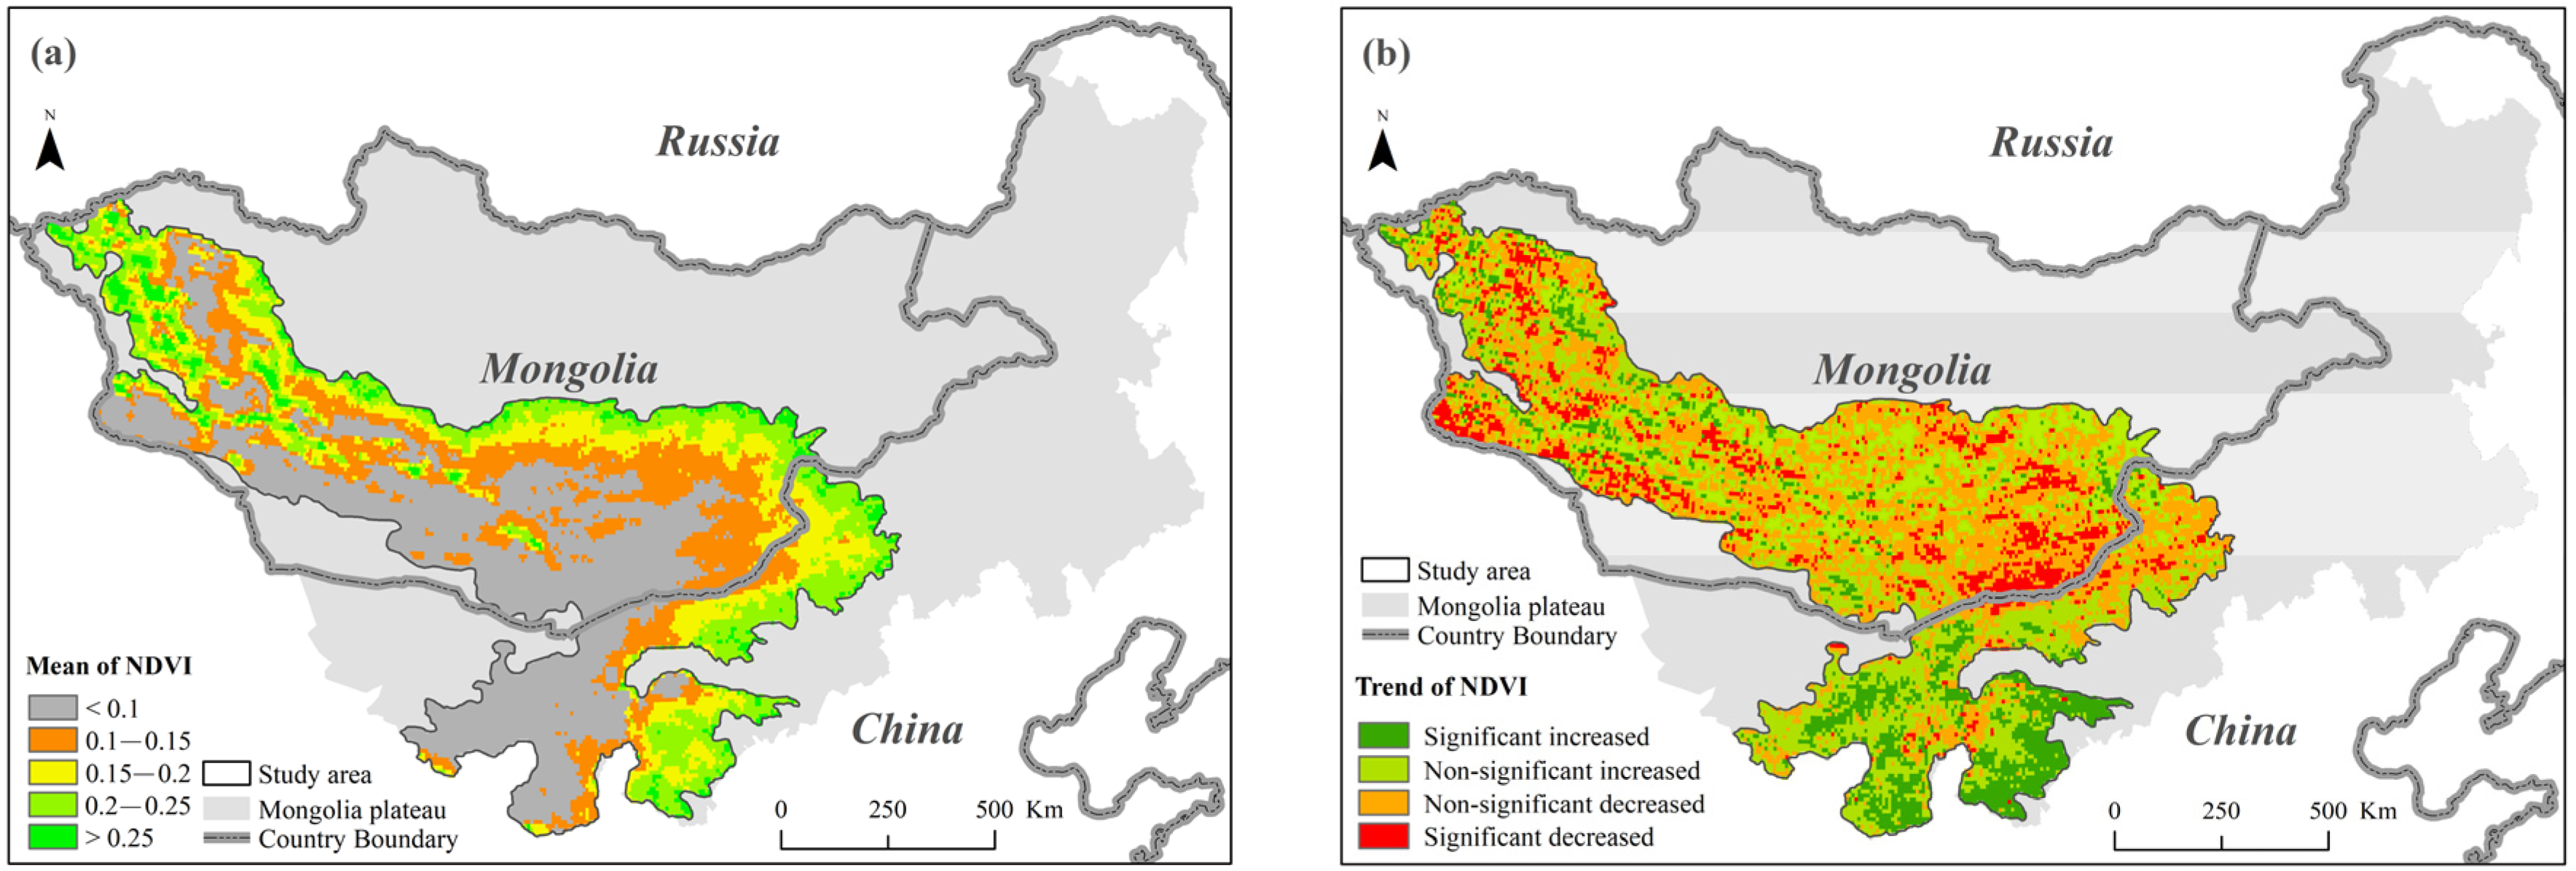
During 1982–2015, pixels with a large mean growing season NDVI were located throughout the northern, northeastern, and eastern regions of the ASTZMP, whereas small mean growing season NDVI values were located throughout the western, southwestern, and southern regions (Figure 3a). The mean growing season NDVI value increased from west to east, south to north, and southwest to northeast. Pixels with NDVI < 0.1, accounting for 37.33% of the study area, were mainly distributed in the central and western regions. Pixels with 0.1 < NDVI < 0.15 and 0.15 < NDVI < 0.2 were mainly distributed in the central of the study area, accounting for 23.12% and 16.73%, respectively. Large mean growing season NDVI (0.2 < NDVI < 0.25 and NDVI > 0.25) were mainly distributed in the east and northwest, accounting for 17.04% and 5.78%, respectively. A significant (p < 0.05) increase in NDVI occurred in 12.63% of all pixels, mainly distributed in the south of the ASTZMP (i.e., the study area in China) (Figure 3b). This indicates that the arid and semi-arid transition zone in China became green. In contrast, pixels with a significant (p < 0.05) decrease in NDVI (accounting for 11.49% of all pixels) were primarily located in Mongolia (Figure 3b). The majority of ASTZMP (76.88%) showed no changes (p > 0.05) in the local NDVI over the study period.

Figure 3.
Spatial patterns (a) and trends (b) of the mean growing season NDVI during 1982–2015.
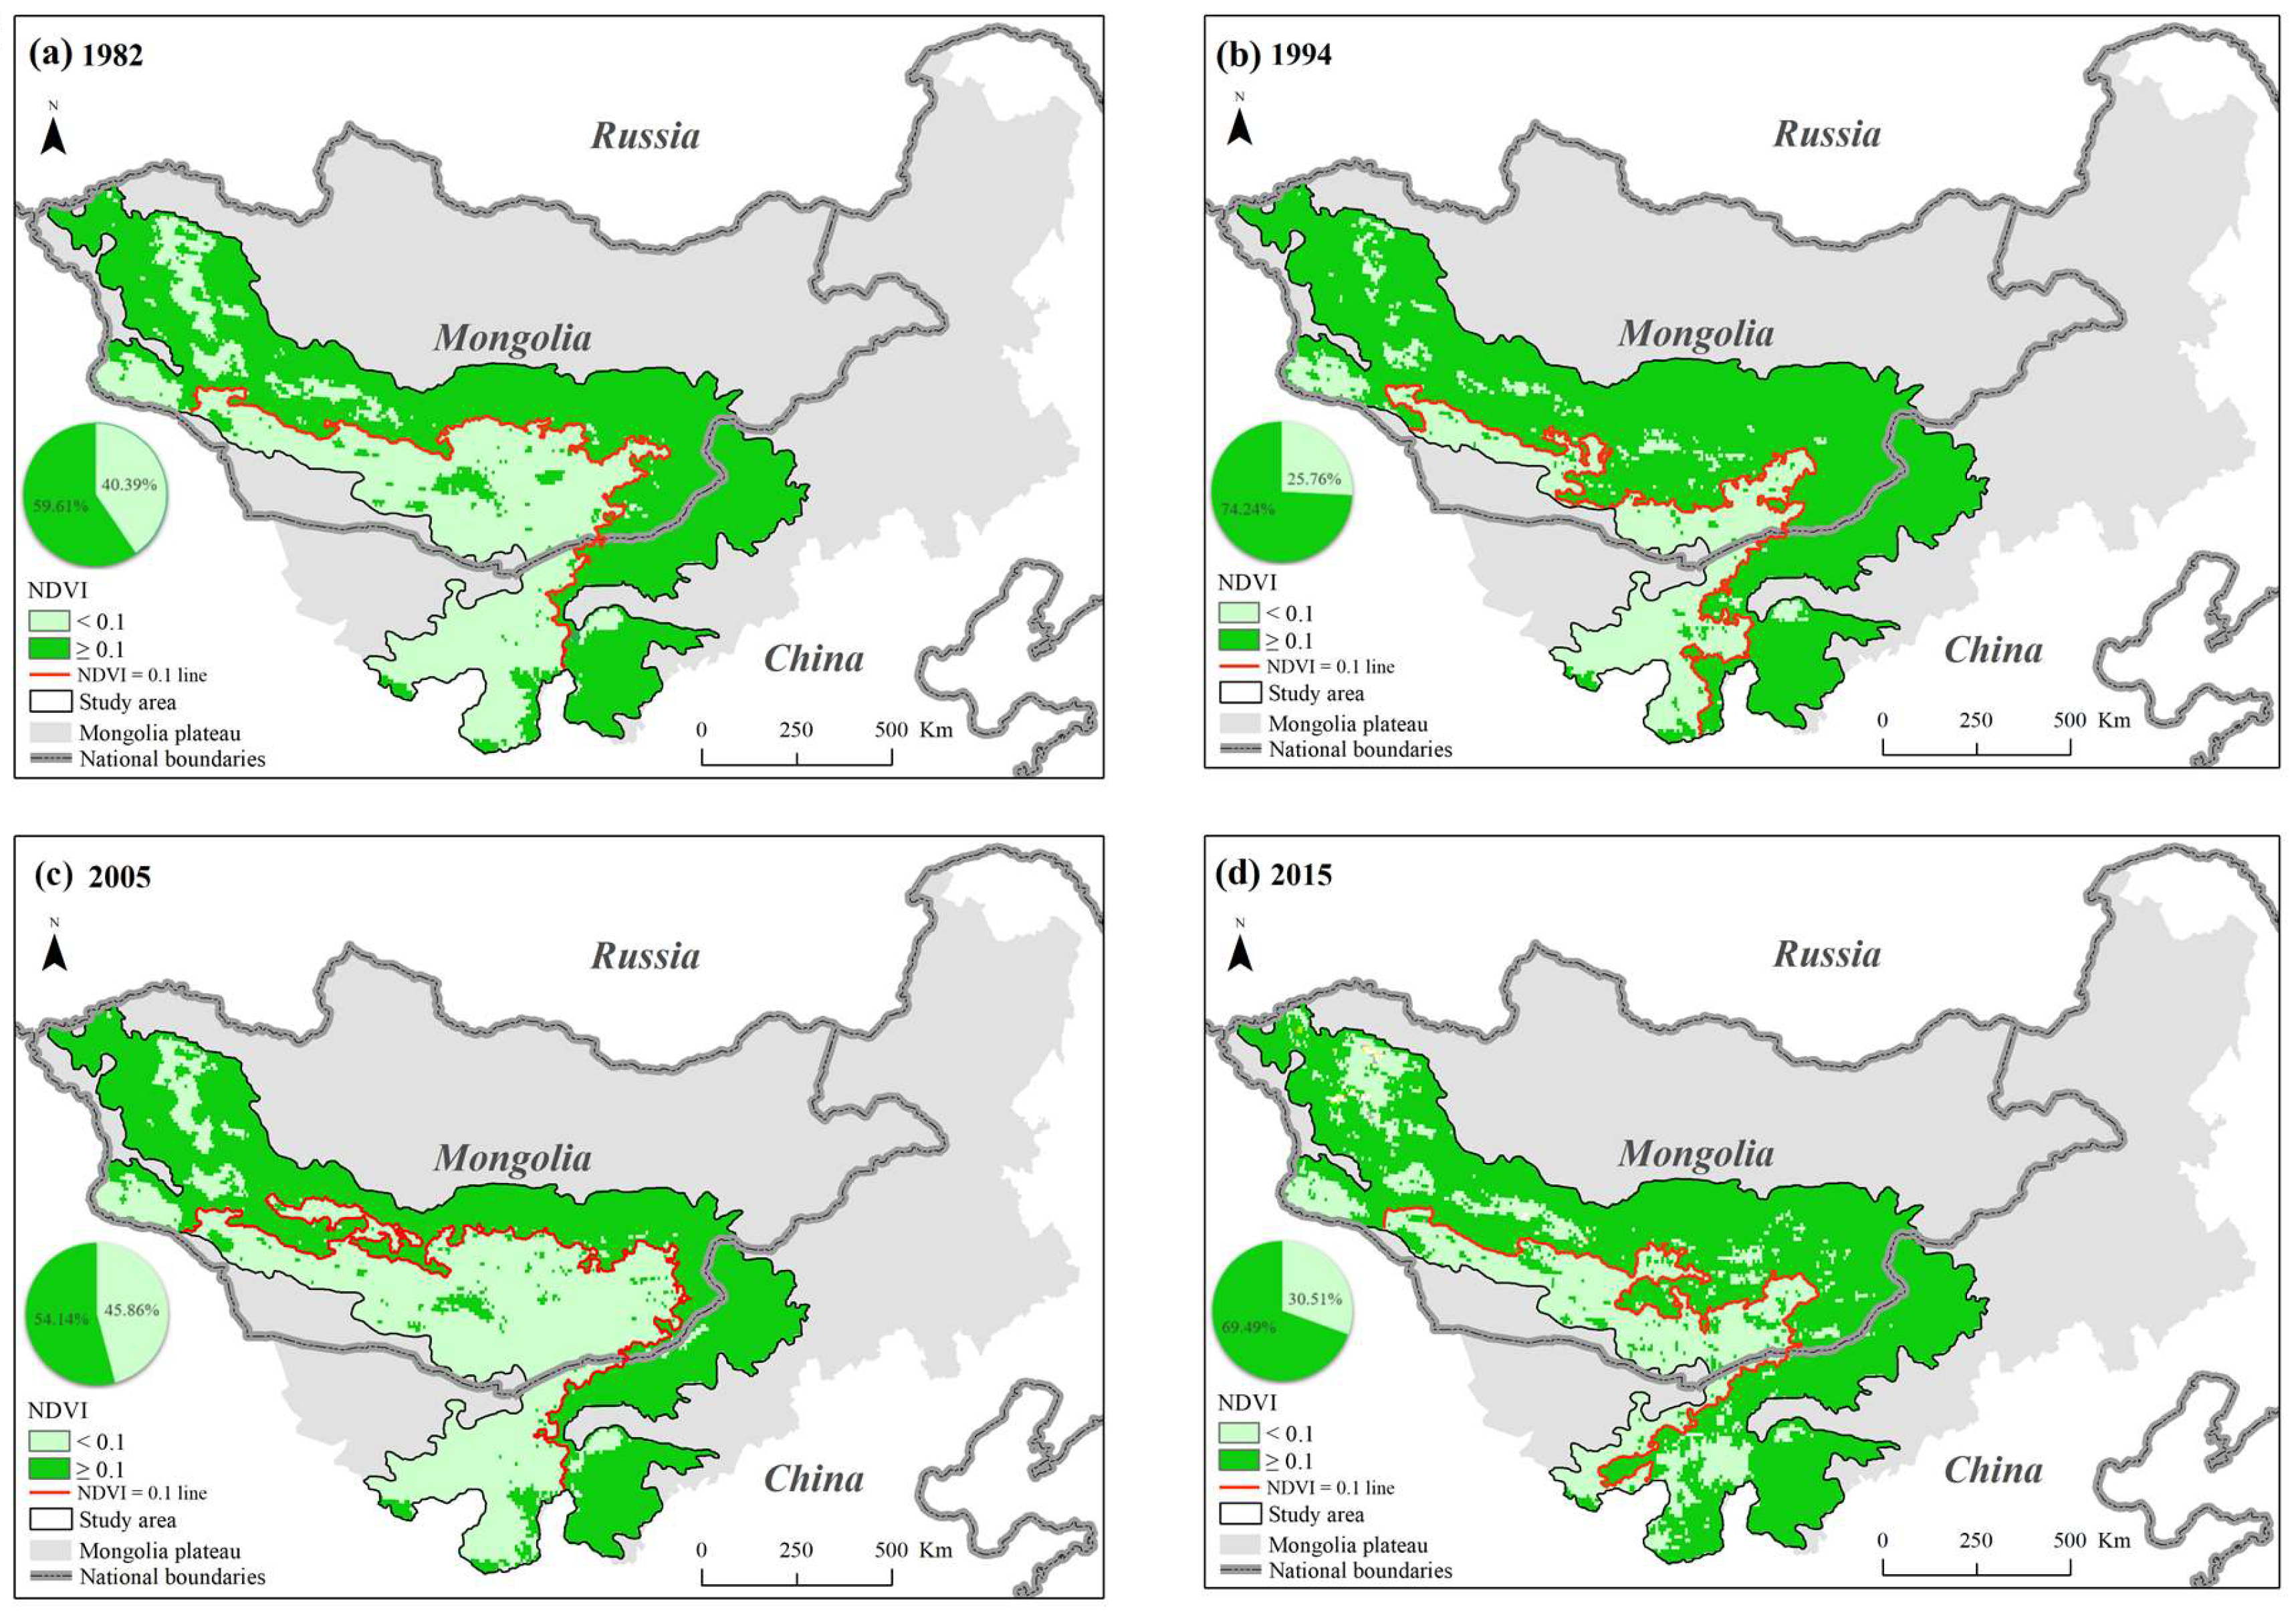
To more intuitively show the dynamics of the changes in the spatial pattern of greenness, we analyzed the spatial distribution of vegetation coverage areas (annual mean growing season mean NDVI ≥ 0.1) and non-vegetation areas (annual mean growing season NDVI < 0.1) in the study area for 1982, 1994, 2005, and 2015 (Figure 4). In 1982, the vegetation coverage areas were distributed in the northwest, north, as well as in the northeast, east, and southeast of the study area, accounting for 59.61% of the total area (Figure 4a). The vegetation coverage area increased significantly to 74.24% in 1994 and decreased to 54.14% in 2005 (Figure 4b,c). The decreasing vegetation coverage area was mainly located in the central study area during the ten years between these data points. The vegetation coverage area in 2005 then increased again to 69.49% in 2015, mainly because the existing vegetation increased in abundance, enough to go over the 0.10 threshold in the central and southern areas during this period (Figure 4d).
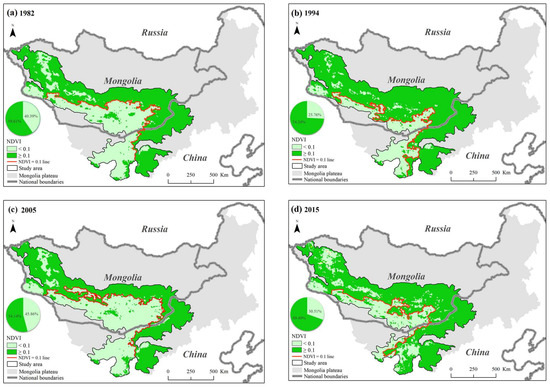
Figure 4.
Spatial distribution of vegetation area (annual mean growing season NDVI ≥ 0.1) and non-vegetation area (annual mean growing season NDVI < 0.1) in 1982 (a), 1994 (b), 2005 (c), and 2015 (d).
3.2. Changes of the Vegetation Greenness Line
The spatial patterns of the vegetation greenness line in five-year increments from 1982 to 2015 in the ASTZMP are shown in Figure 5. For Region1, the change in the vegetation greenness line toward the north was not obvious, whereas the change toward the south was relatively larger, especially when the vegetation greenness line moved to the southernmost point in 2015. In Region2, the longitudinal fluctuations of the vegetation greenness line were relatively greater than the latitudinal changes in Region1. The longitudinal vegetation greenness line had been migrating a large space toward the sandy land in 2015 in Region2 (Figure 5).
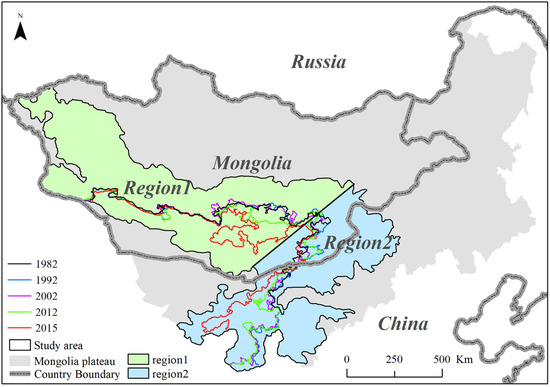
Figure 5.
Spatial changes of vegetation greenness line during 1982–2015 in ASTZMP.
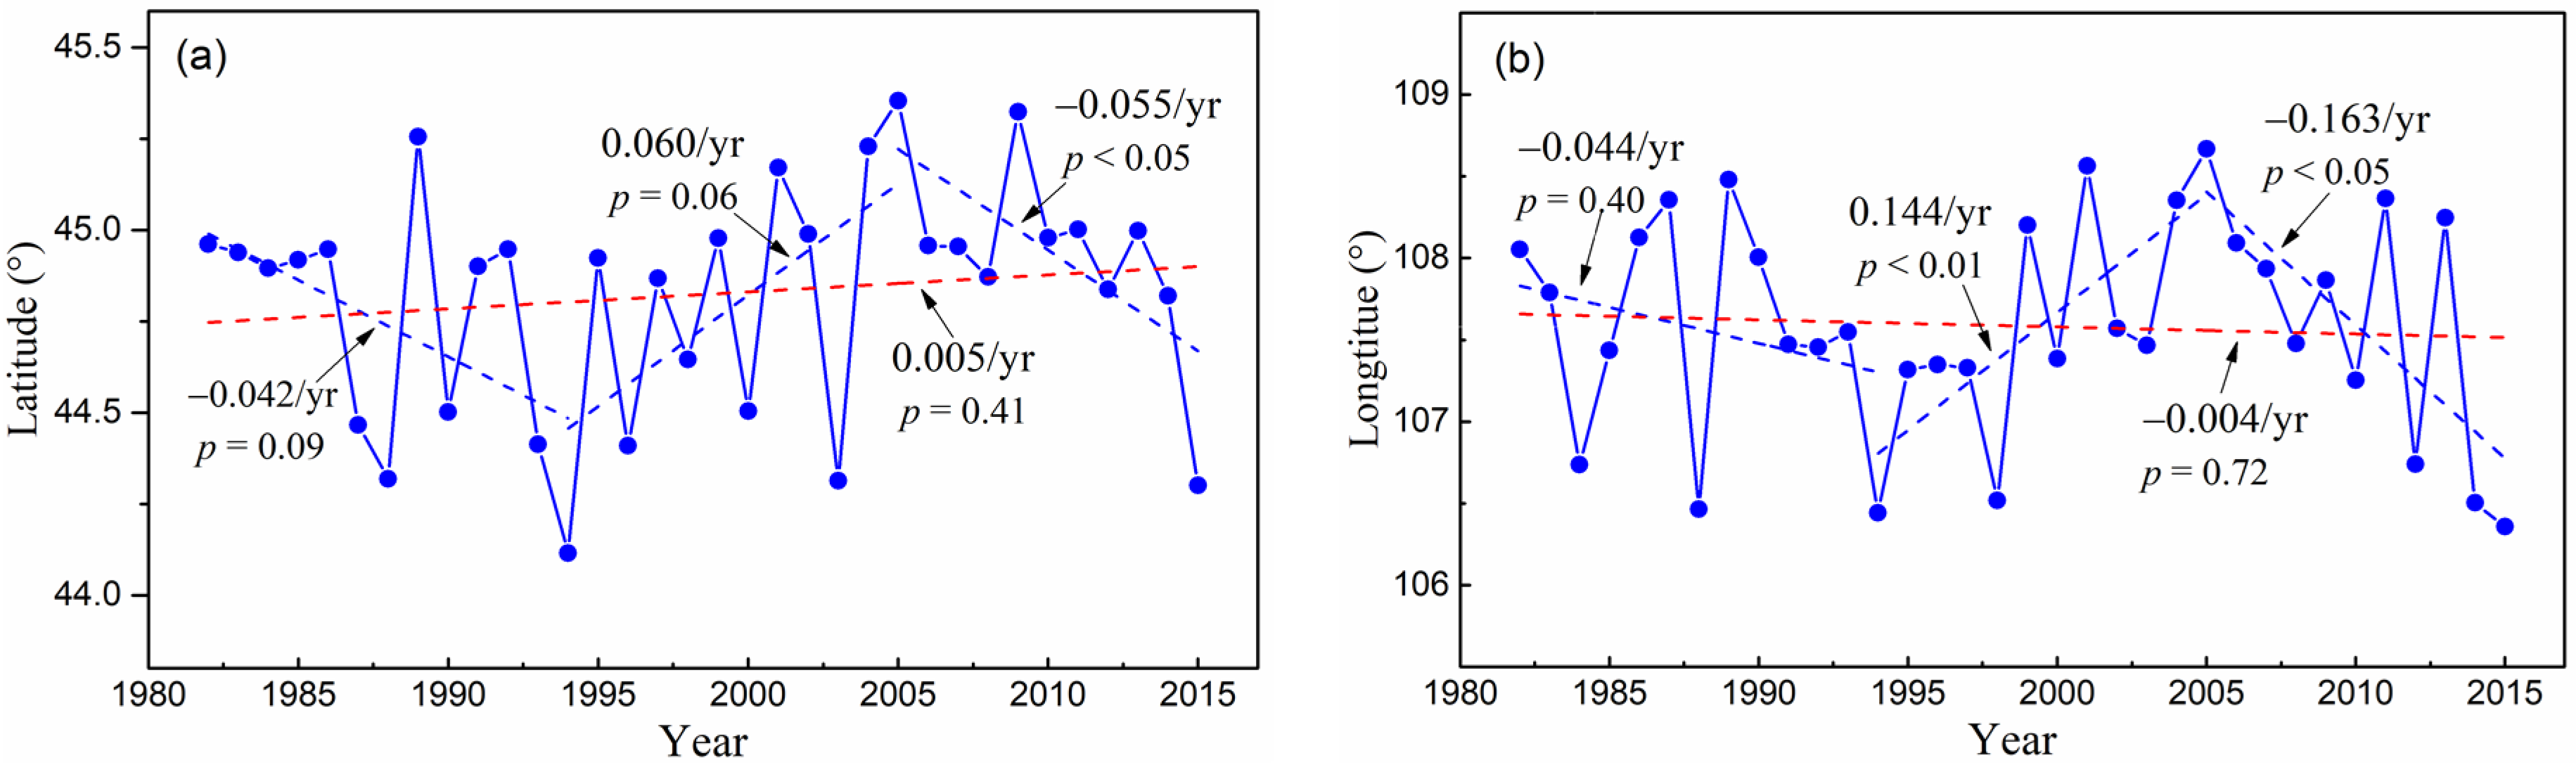
To quantify the latitudinal and longitudinal changes in the vegetation greenness line, we analyzed changes in the latitude (Region1) and longitude (Region2) at the center point of the vegetation greenness line (Figure 6a,b). Significant interannual variations in latitude (Region1) and longitude (Region2) were observed in the study area. Although the latitudinal change in the vegetation greenness line was not significant (p > 0.05) in Region1 during 1982–2015, we identified three stages showing distinct changes (Figure 6a). The vegetation greenness line migrated southward at a rate of 0.042° per year (p = 0.09) in Region1 during 1982–1994. From 1994 to 2005, the latitudinal vegetation greenness line migrated back to the north at a rate of 0.060° per year (p = 0.06) in Region1. However, the latitudinal vegetation greenness line migrated significantly southward again at a rate of 0.055° per year (p < 0.05) in Region1 during 2005–2015. The longitudinal vegetation greenness line moved westward by −0.004° per year during 1982–2015 (Figure 6b). In addition, we analyzed the changes in the vegetation greenness line in three stages. The westward migration of the longitudinal vegetation greenness line was non-significant (0.044° per year, p = 0.40) in 1982–1994, but the vegetation greenness line migrated significantly back eastward at a rate of 0.144° per year (p < 0.01) between 1994 and 2005 in Region2. The change in the vegetation greenness line was the fastest among the three stages, with a change of 0.163° per year (p < 0.05) toward the west sandy area during 2005–2015.

Figure 6.
Changes in the latitude (a) and longitude (b) of the center point of the vegetation greenness line in ASTZMP during 1982–2015.
3.3. Effects of Climate Change on Vegetation Greenness
3.3.1. Effects of Climate Change on Vegetation NDVI
The NDVI was negatively correlated with temperature in most areas in ASTZMP, and the area with a significant negative correlation (p < 0.05) was mainly distributed in the central and northern ASTZMP (Figure 7a). Most pixels showed a positive correlation between NDVI and precipitation in the study area, and the area with a significant positive correlation (p < 0.05) was also mainly distributed in the central and northern ASTZMP (Figure 7b). Only a small part of the south and north ASTZMP showed a non-significant negative correlation (p > 0.05) between NDVI and precipitation. More pixels showed a significant NDVI–precipitation correlation compared to a significant NDVI–temperature correlation. Moreover, the NDVI–precipitation correlation was stronger than the NDVI–temperature correlation. Therefore, the NDVI was more correlated to precipitation than the temperature in the ASTZMP.
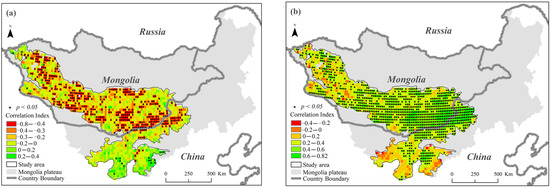
Figure 7.
Spatial distribution of the correlation coefficient of NDVI with temperature (a) and precipitation (b), respectively. The stippling indicates significant correlation (p < 0.05).
Based on the statistics of the multiple linear regression equation (Equation (3)) for the entire study area (F = 17.066, p < 0.001), Region1 (F = 17.331, p < 0.001) and Region2 (F = 5.935, p < 0.01), the path analysis process was effective. Overall, the direct effect of temperature on the number of pixels with NDVI ≥ 0.1 was positive (although non-significant, p ≥ 0.05), implying that temperature increase (decrease) was beneficial (harmful) for vegetation growth (Table 1). However, the indirect effects of temperature on the number of pixels with NDVI ≥ 0.1 were negative, implying that the decrease in precipitation caused by temperature increases the growing season’s limited vegetation growth, whereas the opposite trend was observed for increasing precipitation (indirect effects: −0.50, p ≥ 0.05). Overall, increasing temperature inhibited vegetation growth during the growing season (combined effects: −0.40, p ≥ 0.05). The direct effects of precipitation on the number of pixels with NDVI ≥ 0.1 were significantly positive (p < 0.01), indicating that an increase in precipitation was beneficial for vegetation growth. However, the decrease in temperature caused by precipitation increases in the growing season slightly inhibited vegetation growth (indirect effects: −0.06, p ≥ 0.05). Therefore, increasing precipitation significantly increased vegetation growth throughout the study area (combined effects: 0.71, p < 0.01). In Region1, the effects of temperature and precipitation on the number of pixels with NDVI ≥ 0.1 were the same as those in the entire study area. In Region2, the direct, indirect, and combined effects of temperature on the number of pixels with NDVI ≥ 0.1 were negative (p ≥ 0.05). However, the direct, indirect, and combined effects of precipitation were significantly positive (p < 0.01), implying that an increase (decrease) in precipitation was beneficial (harmful) for vegetation growth.

Table 1.
Direct, indirect, and combined effects of temperature and precipitation on number of pixels with NDVI ≥ 0.1 in the growing season.
3.3.2. Effects of Climate Change on Vegetation Greenness Line
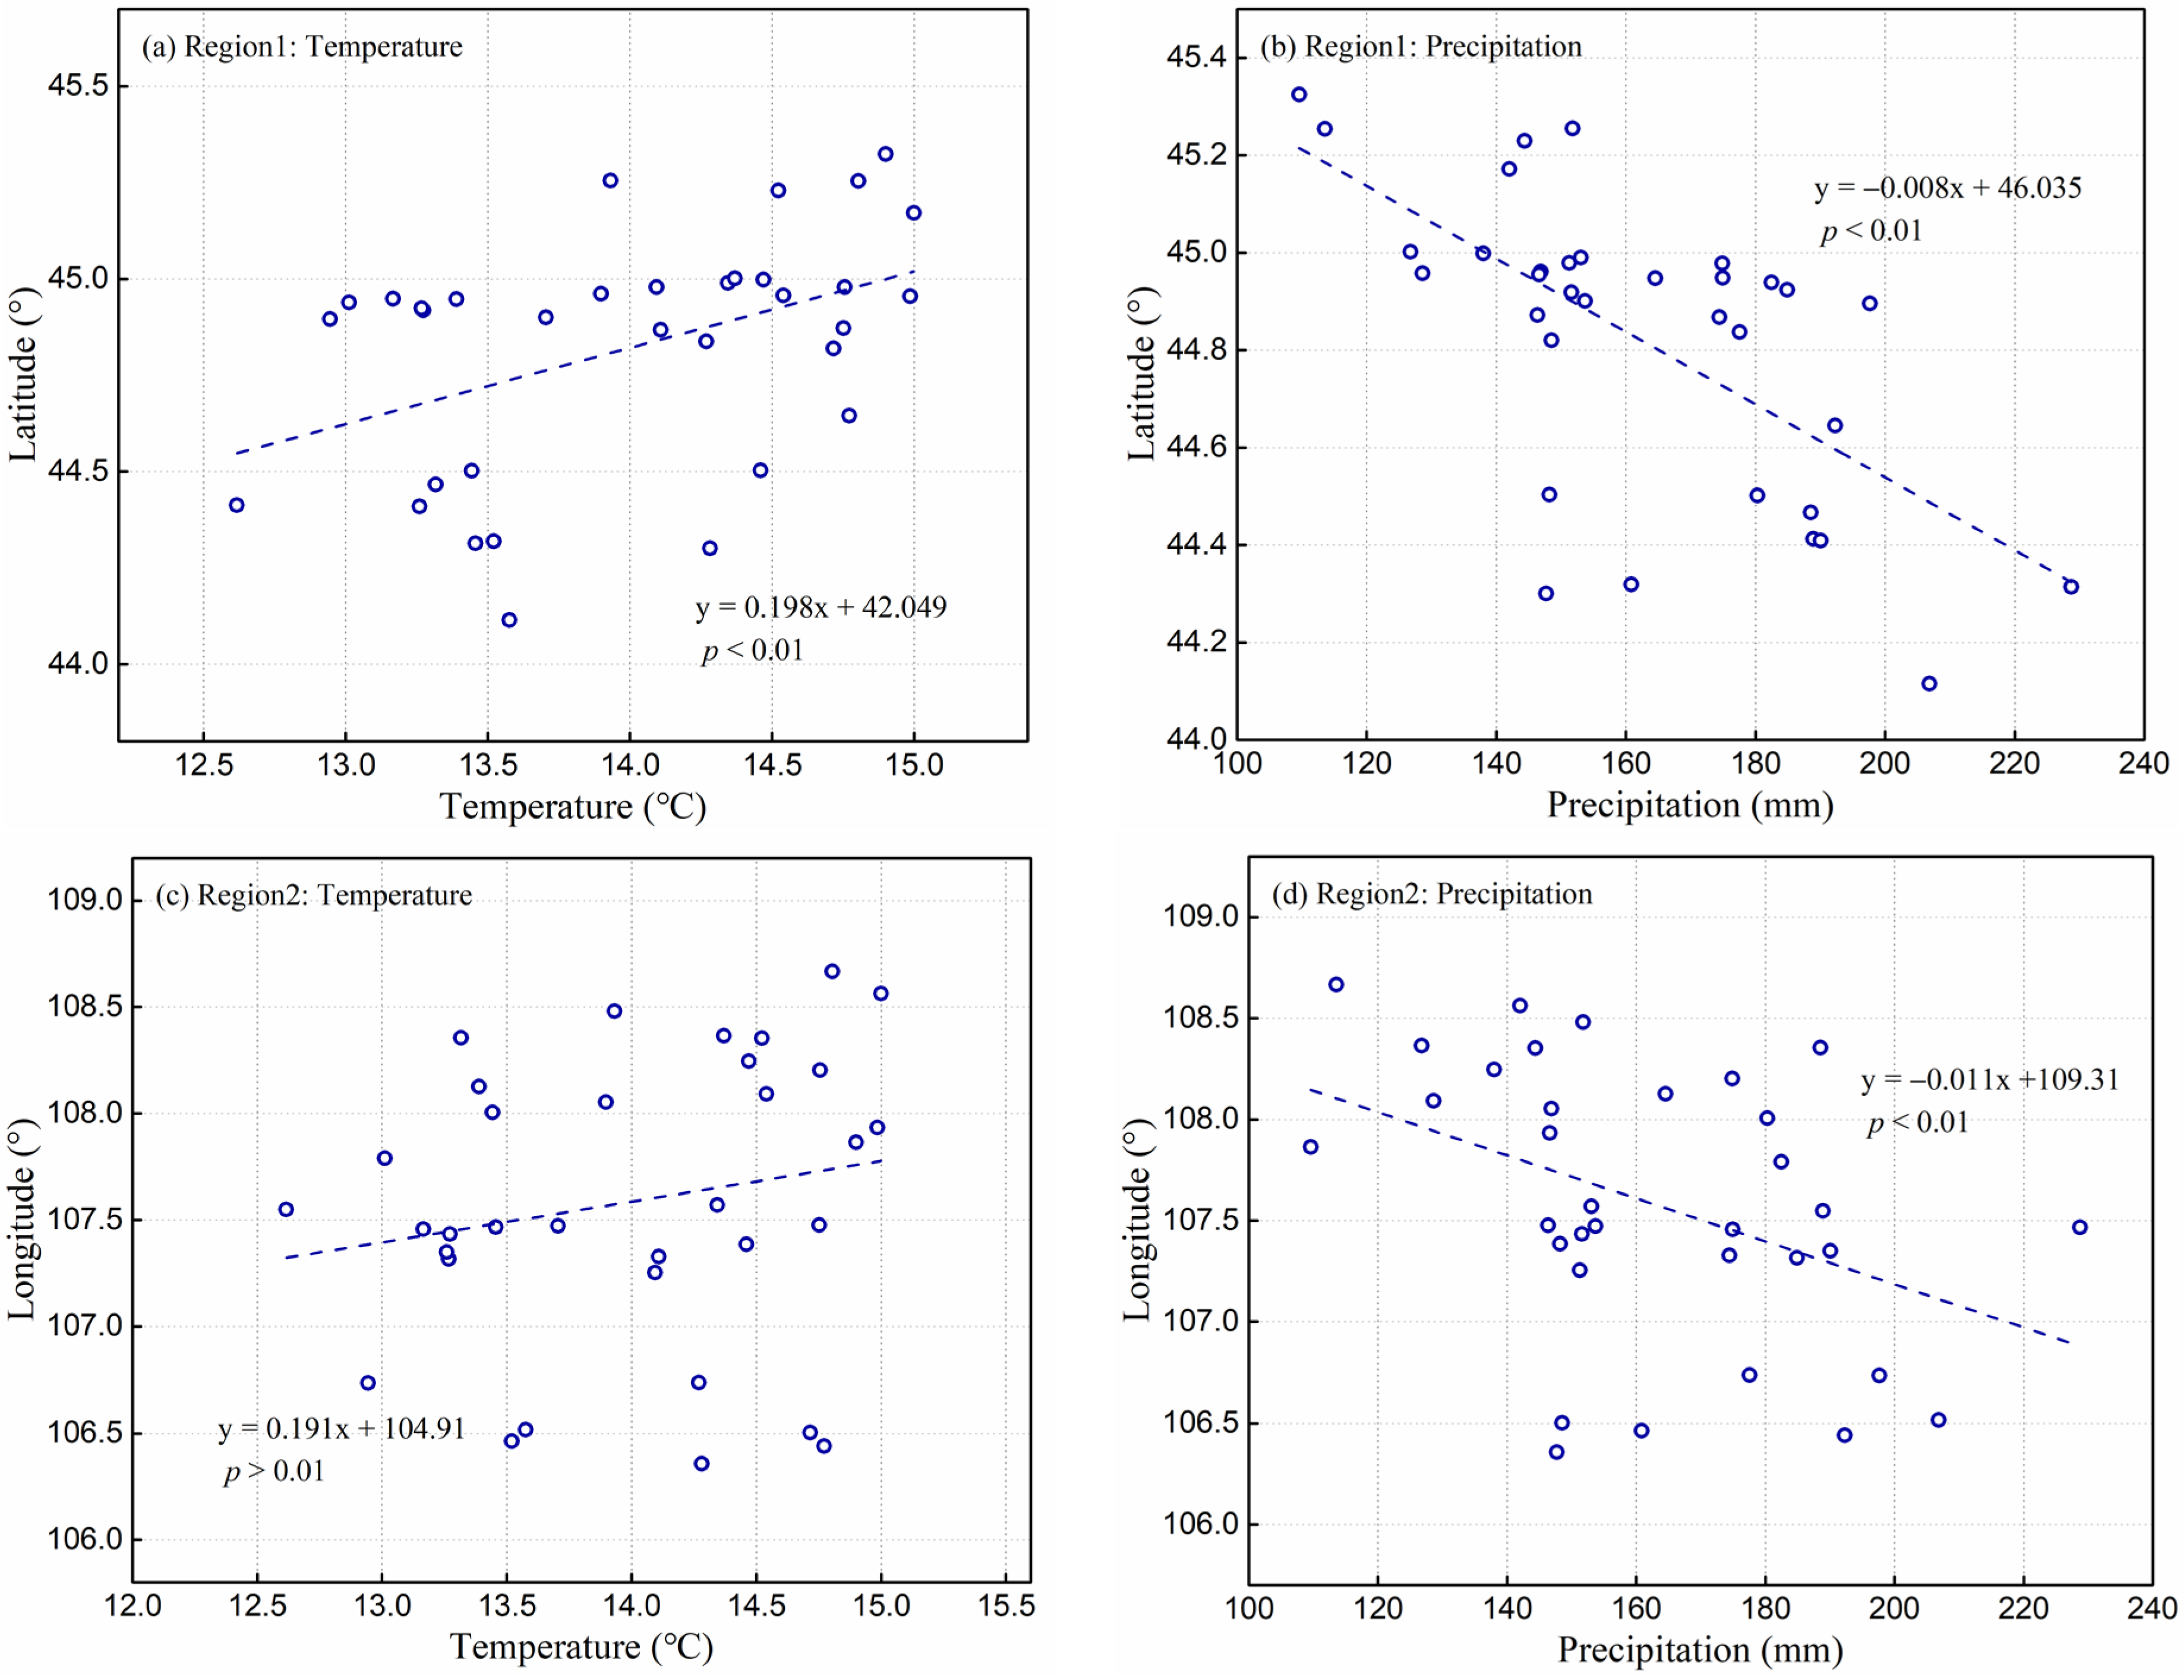
In Region1, the latitudinal change in the vegetation greenness line was significantly positively correlated with the growing season temperature (p < 0.01) and significantly negatively correlated with precipitation in the growing season (p < 0.01) (Table S1 and Figure 8b). Moreover, the vegetation greenness line shifted northward ~0.2° per 1 °C warming (p < 0.01) (Figure 8a) and shifted southward ~0.4° due to a 50 mm increase in precipitation (p < 0.01) (Figure 8b). In Region2, the longitudinal change in the vegetation greenness line was not significantly correlated with the growing season temperature (p > 0.01) (Table S1 and Figure 8c), but a significant negative correlation with precipitation in the growing season (p < 0.01) (Table S1 and Figure 8d) was observed. The increasing precipitation caused a significant westward shift (toward the desert) of the vegetation greenness line in Region2, with a trend of 0.55° per 50 mm (p < 0.01) (Figure 8d).
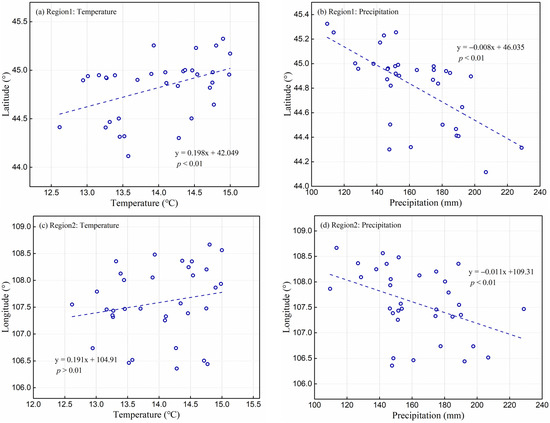
Figure 8.
Regression relationship between the latitude (a,b) and longitude (c,d) of the vegetation greenness line with temperature and precipitation in the growing season, respectively.
4. Discussion
Our results indicate that the spatial distributions of the mean growing season NDVI notably increased from the central west to the east, northeast, and southeast areas of the study area. This is because the west ASTZMP adjoins the desert, and the east ASTZMP adjoins the desert grassland, and the vegetation greenness increases from the desert to the grassland. The spatial average NDVI increased before 1994 and after 2005 but significantly decreased during 1994–2005. This is consistent with the findings that vegetation greening occurred on the Mongolian Plateau before the mid to late 1990s, and vegetation browning occurred afterward [33]. The trend reversal in NDVI was also observed in Eurasia and North America, where increasing NDVI trends have been stalled or reversed since the mid or late 1990s [7,19]. The changes in the area with NDVI ≥ 0.1 were remarkably consistent with the spatial average NDVI changes in the ASTZMP (Figure 2b). Therefore, the change in the number of pixels with NDVI ≥ 0.1 will lead to a change in the spatial average NDVI in the study area.
We observed interannual variation in the latitude (for Region1) and longitude (for Region2) of the vegetation greenness line in ASTZMP in this study. In fact, the boundary location of the Gobi Desert experienced significant interannual changes during 1982–1990 [37]. Although the latitudinal and longitudinal changes in the vegetation greenness line were not significant (p > 0.05) during 1982–2015, we identified three stages with distinct changes. The vegetation greenness line underwent a process of forward (desert), backward (grassland), and forward (desert) migration. This change was consistent with the change in the growing season NDVI in the ASTZMP. During 1982–1994 and 2005–2015, the vegetation greenness line migrated to the desert at the same time when the vegetation greened. This may be attributed to the decrease in temperature and increase in precipitation in the study area during this period (Figure 7 and Figure S1). However, during 1994–2005, when the vegetation browned, the greenness line of vegetation moved back to the grassland. This may be mainly caused by the increase in temperature and decrease in precipitation (Figure 7 and Figure S1).
The influence of temperature and precipitation on vegetation growth is complicated because of the interaction between climatic factors and variations across regions. For example, in the northeast of Inner Mongolia, increased precipitation induces a temperature decrease, which is unfavorable for vegetation growth [5]. In addition, increasing global temperatures have led to a decrease in precipitation in northern China, resulting in unfavorable vegetation growth [47]. The temperature was found to be the main driver of changing vegetation in northern Japan, Korea, Democratic People’s Republic of Korea, northeast and central China, northern Mongolia, and northern Kazakhstan [48]. This may be the case because the areas are mostly distributed in areas with cold or humid climates, where heat resources are very limited, and an increase in temperature could boost forest growth by lengthening the growing period and enhancing photosynthesis. Due to different growth environments, the vegetation dynamics for different vegetation and grassland types responded differently to climate change. Our results showed that NDVI was negatively correlated with temperature and positively correlated with precipitation. The area with a significant correlation between NDVI and precipitation was larger than that between NDVI and temperature, especially for Region2, where the NDVI was almost not correlated with temperature (Figure 7). Therefore, precipitation had more important effects on vegetation growth than temperature, especially in Region2. Moreover, the increase in precipitation counteracted the negative effect of temperature warming on vegetation growth, resulting in an increase in vegetation greenness in arid and semi-arid areas [27,28]. In addition to the impact of climate on vegetation changes, the impact of human activities on vegetation changes in some parts of the study area is also obvious. For example, the trends of NDVI show more increases in China than in Mongolia (Figure 3b). This may be related to Chinese environmental protection and land rehabilitation projects in these areas. Some studies have also found that the vegetation coverage in Inner Mongolia has improved since the implementation of China’s vegetation restoration programs, such as seasonal enclosures, grazing rotation, and the Grain for Green program [33,49]. Studies have found that the effects of biodiversity indicators, topography, sunshine duration, elevation, and land cover on vegetation growth were comparable in size to effects of other important drivers related to climate change [48,50]. In this study, we only considered the effects of temperature and precipitation on vegetation greenness. In future studies, we will consider the effects of biodiversity, topography, sunshine duration, elevation, and land cover on vegetation greenness.
Our results showed that warming during the growing season has an inhibitory effect on vegetation growth, and increasing precipitation is beneficial for vegetation growth (Table 1 and Table S2). The increase in temperature during the growing season increases the demand for atmospheric water, causing increased water stress conditions, inhibiting photosynthesis, and impairing vegetation growth; the reverse is observed with decreased temperatures. Xie et al. (2014) also found that the warming of the growing season in the Three-North Shelter Forest Program area is not conducive to vegetation growth, and the increase in precipitation promotes the growth of vegetation greenness [46]. Further research based on path analysis found that the warming of the growing season not only directly inhibited the growth of vegetation but also indirectly inhibited vegetation growth by reducing precipitation.
The migration of the vegetation greenness isoline is affected by climatic factors, such as precipitation and temperature [31]. Our results showed that the latitudinal variation of the vegetation greenness line was mainly affected by precipitation and temperature during the growing season, while the longitudinal variation was mainly affected by precipitation during the growing season. This coincides with the natural law of the latitudinal and longitudinal precipitation gradients in the study area. Because the study area spans arid and semi-arid regions, vegetation growth in the latitudinal direction is affected by both temperature and precipitation. Our study only analyzed the influence of precipitation and temperature on vegetation greenness variations; we did not consider other potential drivers of vegetation greenness variations, such as evapotranspiration, soil moisture, and human activities. Therefore, future work should consider the contributions of these factors to variations in vegetation greenness.
5. Conclusions
In this study, we investigated the variations in vegetation greenness and vegetation greenness in the growing season and their response to climatic changes in the typical vulnerable ecosystem of the Mongolian Plateau. The spatial distributions of the mean growing season NDVI increased from the central west to the east, northeast, and southeast of the study area. The NDVI trends show a greater increase in greenness in China than in Mongolia. This may be related to Chinese environmental protection and land rehabilitation projects in these areas. From 1994 to 2005, the vegetation browning and vegetation greenness lines migrated to grassland, while in 1982–1994 and 2005–2015, the vegetation greening and vegetation greenness lines migrated to desert. When the influence of precipitation change was not considered, the warming promoted vegetation growth, but the decrease of precipitation caused by warming in the growing season led to an inhibition effect. Precipitation and temperature both had more effects on vegetation growth in Region1, while precipitation had more important effects than the temperature in Region2. The latitudinal variation of the vegetation greenness line was mainly affected by precipitation and temperature, while the longitudinal variation was mainly affected by precipitation during the growing season.
Supplementary Materials
The following are available online at https://www.mdpi.com/article/10.3390/rs13204066/s1. Figure S1: Interannual changes of temperature (a) and precipitation (b) in ASTZMP., Table S1: Correlation between the latitude and longitude of vegetation greenness line with the temperature and precipitation in the growing season, respectively. Table S2: Direct, indirect, and combined effects of mean temperature and precipitation on vegetation greening in the growing season.
Author Contributions
R.N.: conceptualization, methodology, and writing—original draft. L.N.: review and editing. H.D.: conceptualization, supervision, and inspection. H.S.H.: investigation and validation. Y.S.: investigation and validation. S.Z.: investigation. L.H.: methodology. Y.Y.: methodology. Z.W.: conceptualization, supervision, and inspection. All authors have read and agreed to the published version of the manuscript.
Funding
This study was supported by the Joint Fund of National Natural Science Foundation of China (grant number U19A2023), the Science and Technology Development Plan of Jilin Province (grant number 20190201291JC), the Natural Science Foundation of Jilin Scientific Institute (grant number 20180520087JH), and the Fundamental Research Funds for the Central Universities (2412020FZ002, 2412020XK002).
Institutional Review Board Statement
Not applicable.
Informed Consent Statement
Not applicable.
Data Availability Statement
Not applicable.
Conflicts of Interest
The authors declare no conflict of interest.
References
- Pan, N.; Feng, X.; Fu, B.; Wang, S.; Ji, F.; Pan, S. Increasing global vegetation browning hidden in overall vegetation greening: Insights from time-varying trends. Remote Sens. Environ. 2018, 214, 59–72. [Google Scholar] [CrossRef]
- Zhu, Z.; Piao, S.; Myneni, R.B.; Huang, M.; Zeng, Z.; Canadell, J.G.; Ciais, P.; Sitch, S.; Friedlingstein, P.; Arneth, A.; et al. Greening of the Earth and its drivers. Nat. Clim. Chang. 2016, 6, 791–795. [Google Scholar] [CrossRef]
- Chi, C.; Park, T.; Wang, X.; Piao, S.; Xu, B.; Chaturvedi, R.K.; Fuchs, R.; Brovkin, V.; Ciais, P.; Fensholt, R.; et al. China and India lead in greening of the world through land-use management. Nat. Sustain. 2019, 2, 122–129. [Google Scholar]
- Peters, G.P.; Andrew, R.M.; Boden, T.; Canadell, J.G.; Ciais, P.; Quéré, C.; Marland, G.; Raupach, M.R.; Wilson, C. The challenge to keep global warming below 2 °C. Nat. Clim. Chang. 2012, 3, 4–6. [Google Scholar] [CrossRef]
- Chuai, X.W.; Huang, X.J.; Wang, W.J.; Bao, G. NDVI, temperature and precipitation changes and their relationships with different vegetation types during 1998–2007 in Inner Mongolia, China. Int. J. Climatol. 2013, 33, 1696–1706. [Google Scholar] [CrossRef]
- He, G.; Zhen, X.; Li, Z.; Shen, W.; Han, J.; Zhang, L.; Li, X.; Zhang, R. Influence of Variations of Hydrothermal Conditions on Normalized Difference Vegetation Index in Typical Temperature Zones Along the East Coast of China. Front. Earth Sci. 2020, 8, 574101. [Google Scholar] [CrossRef]
- Piao, S.; Wang, X.; Ciais, P.; Zhu, B.; Wang, T.; Liu, J. Changes in satellite-derived vegetation growth trend in temperate and boreal Eurasia from 1982 to 2006. Glob. Chang. Biol. 2011, 17, 3228–3239. [Google Scholar] [CrossRef]
- Tai, X.; Epstein, H.E.; Li, B. Elevation and Climate Effects on Vegetation Greenness in an Arid Mountain-Basin System of Central Asia. Remote Sens. Environ. 2020, 12, 1665. [Google Scholar] [CrossRef]
- Jong, R.D.; Verbesselt, J.; Schaepman, M.E.; Bruin, S.D. Trend changes in global greening and browning: Contribution of short-term trends to longer-term change. Glob. Chang. Biol. 2012, 18, 642–655. [Google Scholar] [CrossRef]
- Li, Z.; Chen, Y.; Li, W.; Deng, H.; Fang, G. Potential impacts of climate change on vegetation dynamics in Central Asia. J. Geophys. Res. Atmos. 2015, 120, 12345–12356. [Google Scholar] [CrossRef]
- Meng, Z.; Liu, M.; Gao, C.; Zhang, Y.; She, Q.; Long, L.; Tu, Y.; Yang, Y. Greening and browning of the coastal areas in mainland China: Spatial heterogeneity, seasonal variation and its influential factors. Ecol. Indic. 2020, 110, 105888. [Google Scholar] [CrossRef]
- Myneni, R.B.; Keeling, C.D.; Tucker, C.J.; Asrar, G.; Nemani, R.R. Increased plant growth in the northern high latitudes from 1981 to 1991. Nature 1997, 386, 698–702. [Google Scholar] [CrossRef]
- Zhou, L.; Tucker, C.J.; Kaufmann, R.K.; Slayback, D.; Shabanov, N.V.; Myneni, R.B. Variations in northern vegetation activity inferred from satellite data of vegetation index during 1981 to 1999. J. Geophys. Res. 2001, 106, 20069–20083. [Google Scholar] [CrossRef]
- Feng, X.; Fu, B.; Zhang, Y.; Pan, N.; Zeng, Z.; Tian, H.; Lyu, Y.; Chen, Y.; Ciais, P.; Wang, Y.; et al. Recent leveling off of vegetation greenness and primary production reveals the increasing soil water limitations on the greening Earth. Sci. Bull. 2021, 66, 1462–1471. [Google Scholar] [CrossRef]
- Jeong, S.; Ho, C.; Jeong, J. Increase in vegetation greenness and decrease in springtime warming over east Asia. Geophys. Res. Lett. 2009, 36. [Google Scholar] [CrossRef]
- Xu, G.; Zhang, H.; Chen, B.; Zhang, H.; Innes, J.L.; Wang, G.; Yan, J.; Zheng, Y.; Zhu, Z.; Myneni, R.B. Changes in Vegetation Growth Dynamics and Relations with Climate over China’s Landmass from 1982 to 2011. Remote Sens. 2014, 6, 3263–3283. [Google Scholar] [CrossRef] [Green Version]
- Zhang, X.; Goldberg, M.; Tarpley, D.; Friedl, M.A.; Morisette, J.; Kogan, F.; Yu, Y. Drought-induced vegetation stress in southwestern North America. Environ. Res. Lett. 2010, 5, 024008. [Google Scholar] [CrossRef]
- Mohammat, A.; Wang, X.; Xu, X.; Peng, L.; Yang, Y.; Zhang, X.; Myneni, B.R.; Piao, S. Drought and spring cooling induced recent decrease in vegetation growth in Inner Asia. Agric. For. Meteorol. 2013, 178-179, 21–30. [Google Scholar] [CrossRef]
- Wang, X.; Piao, S.; Ciais, P.; Li, J.; Friedlingstein, P.; Koven, C.D.; Chen, A. Spring temperature change and its implication in the change of vegetation growth in North America from 1982 to 2006. Proc. Natl. Acad. Sci. USA 2011, 108, 1240–1245. [Google Scholar] [CrossRef] [PubMed] [Green Version]
- Chen, C.; He, B.; Yuan, W.; Guo, L.; Zhang, Y. Increasing interannual variability of global vegetation greenness. Environ. Res. Lett. 2019, 14, 124005. [Google Scholar] [CrossRef]
- Ichii, K.; Kawabata, A.; Yamaguchi, Y. Global correlation analysis for NDVI and climatic variables and NDVI trends: 1982-1990. Int. J. Remote Sens. 2002, 23, 3873–3878. [Google Scholar] [CrossRef]
- Liu, Z.; Notaro, M.; Kutzbach, J.; Liu, N. Assessing Global Vegetation–Climate Feedbacks from Observations. J. Clim. 2006, 19, 787–814. [Google Scholar] [CrossRef]
- Fensholt, R.; Langanke, T.; Rasmussen, K.; Reenberg, A.; Prince, S.D.; Tucker, C.J.; Scholes, R.J.; Le, Q.B.; Bondeau, A.; Eastman, R. Greenness in semi-arid areas across the globe 1981–2007—An Earth Observing Satellite based analysis of trends and drivers. Remote Sens. Environ. 2012, 121, 144–158. [Google Scholar] [CrossRef]
- Piao, S.; Fang, J.; Ji, W.; Guo, Q.; Ke, J.; Tao, S. Variation in a satellite-based vegetation index in relation to climate in China. J. Veg. Sci. 2004, 15, 219–226. [Google Scholar] [CrossRef]
- Wang, T.; Liu, D.; Piao, S.; Wang, Y.; Wang, X.; Guo, H.; Lian, X.; Burkhart, J.F.; Ciais, P.; Huang, M.; et al. Emerging negative impact of warming on summer carbon uptake in northern ecosystems. Nat. Commun 2018, 9, 5391. [Google Scholar] [CrossRef]
- Sun, W.; Song, X.; Mu, X.; Gao, P.; Wang, F.; Zhao, G. Spatiotemporal vegetation cover variations associated with climate change and ecological restoration in the Loess Plateau. Agric. For. Meteorol. 2015, 209–210, 87–99. [Google Scholar] [CrossRef]
- Xu, X.; Chen, H.; Levy, J.K. Spatiotemporal vegetation cover variations in the Qinghai-Tibet Plateau under global climate change. Sci. Bull. 2008, 53, 915–922. [Google Scholar] [CrossRef] [Green Version]
- Zhang, B.; Wu, P.; Zhao, X.; Wang, Y.; Gao, X. Changes in vegetation condition in areas with different gradients (1980–2010) on the Loess Plateau, China. Environ. Earth Sci. 2013, 68, 2427–2438. [Google Scholar] [CrossRef]
- Fu, Y.H.; Piao, S.; Zhao, H.; Jeong, S.J.; Wang, X.; Vitasse, Y.; Ciais, P.; Janssens, I.A. Unexpected role of winter precipitation in determining heat requirement for spring vegetation green-up at northern middle and high latitudes. Glob. Chang. Biol. 2014, 20, 3743–3755. [Google Scholar] [CrossRef]
- Li, L.; Zhang, Y.; Wu, J.; Li, S.; Zhang, B.; Zu, J.; Zhang, H.; Ding, M.; Paudel, B. Increasing sensitivity of alpine grasslands to climate variability along an elevational gradient on the Qinghai-Tibet Plateau. Sci. Total Environ. 2019, 678, 21–29. [Google Scholar] [CrossRef] [PubMed]
- An, S.; Zhu, X.; Shen, M.; Wang, Y.; Cao, R.; Chen, X.; Yang, W.; Chen, J.; Tang, Y. Mismatch in elevational shifts between satellite observed vegetation greenness and temperature isolines during 2000–2016 on the Tibetan Plateau. Glob. Chang. Biol. 2018, 24, 5411–5425. [Google Scholar] [CrossRef] [PubMed]
- Saikkonen, K.; Taulavuori, K.; Hyvnen, T.; Gundel, P.E.; Helander, M. Climate change-driven species’ range shifts filtered by photoperiodism. Nat. Clim. Chang. 2012, 2, 239–242. [Google Scholar] [CrossRef]
- Bao, G.; Qin, Z.; Bao, Y.; Zhou, Y.; Li, W.; Sanjjav, A. NDVI-Based Long-Term Vegetation Dynamics and Its Response to Climatic Change in the Mongolian Plateau. Remote Sens. 2014, 6, 8337–8358. [Google Scholar] [CrossRef] [Green Version]
- Zhang, X.; Hu, Y.; Zhuang, D.; Qi, Y.; Ma, X. NDVI spatial pattern and its differentiation on the Mongolian Plateau. J. Geogr. Sci. 2009, 19, 403–415. [Google Scholar] [CrossRef]
- Zhao, X.; Hu, H.; Shen, H.; Zhou, D.; Zhou, L.; Myneni, R.B.; Fang, J. Satellite-indicated long-term vegetation changes and their drivers on the Mongolian Plateau. Landsc. Ecol. 2015, 30, 1599–1611. [Google Scholar] [CrossRef]
- Bai, Y.; Yang, Y.; Jiang, H. Intercomparison of AVHRR GIMMS3g, terra MODIS, and SPOT-VGT NDVI products over the Mongolian plateau. Remote Sens. 2019, 11, 2030. [Google Scholar] [CrossRef] [Green Version]
- Yu, F.; Price, K.P.; Ellis, J.; Feddema, J.J.; Shi, P. Interannual variations of the grassland boundaries bordering the eastern edges of the Gobi Desert in central Asia. Int. J. Remote Sens. 2004, 25, 327–346. [Google Scholar] [CrossRef]
- Li, P.; Zhu, D.; Wang, Y.; Liu, D. Elevation dependence of drought legacy effects on vegetation greenness over the Tibetan Plateau. Agric. For. Meteorol. 2020, 295, 108190. [Google Scholar] [CrossRef]
- Tucker, C.; Pinzon, J.; Brown, M.; Slayback, D.; Pak, E.; Mahoney, R.; Vermote, E.; El Saleous, N. An extended AVHRR 8-km NDVI dataset compatible with MODIS and SPOT vegetation NDVI data. Int. J. Remote Sens. 2005, 26, 4485–4498. [Google Scholar] [CrossRef]
- Wang, J.B.; Dong, J.W.; Liu, J.Y.; Huang, M.; Li, G.C.; Running, S.W.; Smith, W.K.; Harris, W.; Saigusa, N.; Kondo, H.; et al. Comparison of Gross Primary Productivity Derived from GIMMS NDVI3g, GIMMS, and MODIS in Southeast Asia. Remote Sens. 2014, 6, 2108–2133. [Google Scholar] [CrossRef] [Green Version]
- Fang, J.; Piao, S.; He, J.; Ma, W. Vegetation activity in China has increased in the last 20 years. Sci. China 2003, 33, 554–565. [Google Scholar]
- Jeong, S.-J.; Ho, C.-H.; Brown, M.E.; Kug, J.-S.; Piao, S. Browning in desert boundaries in Asia in recent decades. J. Geophys. Res. Atmos. 2011, 116, D02103. [Google Scholar] [CrossRef] [Green Version]
- Piao, S.; Fang, J.; Zhou, L.; Guo, Q.; Henderson, M.; Ji, W.; Li, Y.; Tao, S. Interannual variations of monthly and seasonal normalized difference vegetation index (NDVI) in China from 1982 to 1999. J. Geophys. Res.: Atmos. 2003, 108. [Google Scholar] [CrossRef]
- Huang, F.; Mo, X.; Lin, Z.; Hu, S. Dynamics and responses of vegetation to climatic variations in Ziya-Daqing basins, China. Chinese Geogr. Sci. 2016, 26, 478–494. [Google Scholar] [CrossRef] [Green Version]
- Zhang, G.; Liu, G.; Zhang, P.; Yi, L. Influence of vegetation parameters on runoff and sediment characteristics in patterned Artemisia capillaris plots. J. Arid Land 2014, 6, 352–360. [Google Scholar] [CrossRef]
- Xie, S.; Mo, X.; Hu, S.; Chen, X. Responses of vegetation greenness to temperature and precipitation in the Three-North Shelter Forest Program. Geogr. Res. 2020, 39, 152–165. [Google Scholar] [CrossRef]
- Kang, X.; Congwen, Z.; Jinhai, H. Impact of the surface air temperature warming around Lake Baikal on trend of summer precipitation in North China in the past 50 years. Plateau Meteorol. 2011, 30, 309–317. [Google Scholar]
- Lamchin, M.; Lee, W.-K.; Jeon, S.W.; Wang, S.W.; Lim, C.H.; Song, C.; Sung, M. Long-term trend and correlation between vegetation greenness and climate variables in Asia based on satellite data. Sci. Total Environ. 2018, 618, 1089–1095. [Google Scholar] [CrossRef]
- Mu, S.; Zhou, S.; Chen, Y.; Li, J.; Ju, W.; Odeh, I. Assessing the impact of restoration-induced land conversion and management alternatives on net primary productivity in Inner Mongolian grassland, China. Glob. Chang. Biol. 2013, 108, 29–41. [Google Scholar] [CrossRef]
- Oehri, J.; Schmid, B.; Schaepman-Strub, G.; Niklaus, P.A. Biodiversity promotes primary productivity and growing season lengthening at the landscape scale. Proc. Natl. Acad. Sci. USA 2017, 114, 10160–10165. [Google Scholar] [CrossRef] [Green Version]


Publisher’s Note: MDPI stays neutral with regard to jurisdictional claims in published maps and institutional affiliations. |
© 2021 by the authors. Licensee MDPI, Basel, Switzerland. This article is an open access article distributed under the terms and conditions of the Creative Commons Attribution (CC BY) license (https://creativecommons.org/licenses/by/4.0/).