Article

Expansion and Evolution of a Typical Resource-Based Mining City in Transition Using the Google Earth Engine: A Case Study of Datong, China

1
College of Hydrology and Water Resources, Hohai University, Nanjing 210098, China
2
Center for Geospatial Intelligence and Watershed Science, Hohai University, Nanjing 210098, China
3
Laboratory of Computational Social Science, Nankai University, Tianjin 300350, China
4
Zhou Enlai School of Government, Nankai University, Tianjin 300350, China
*
Author to whom correspondence should be addressed.
Remote Sens. 2021, 13(20), 4045; https://doi.org/10.3390/rs13204045
Submission received: 25 August 2021 / Revised: 29 September 2021 / Accepted: 6 October 2021 / Published: 10 October 2021
(This article belongs to the Special Issue Applications of Remote Sensing Imagery for Urban Areas)

Abstract

:
China’s resource-based cities have made tremendous contributions to national and local economic growth and urban development over the last seven decades. Recently, such cities have been in transition from resource-centered development towards human-oriented urbanization to meet the requirements of long-term sustainability for the natural environment and human society. A good understanding of urban expansion and evolution as a consequence of urbanization has important implications for future urban and regional planning. Using a series of remote sensing (RS) images and geographical information system (GIS)-based spatial analyses, this research explores how a typical resource-based mining city, Datong, has expanded and evolved over the last two decades (2000–2018), with a reflection on the role of urban planning and development policies in driving the spatial transformation of Datong. The RS images were provided and processed by the Google Earth Engine (GEE) platform. Spatial cluster analysis approaches were employed to examine the spatial patterns of urban expansion. The results indicate that the area of urban construction land increased by 132.6% during the study period, mainly along with the Chengqu District, the Mining Area, and in the southeast of the Nanjiao District, where most new towns are located. Reflection on the factors that influence urban expansion shows that terrain, urban planning policies, and social economy are driving Datong’s urban development.

Graphical Abstract

1. Introduction

Since its reform and opening-up policy in 1978, China has experienced rapid urbanization leading to a remarkable urban population growth and urban land expansion. By the end of 2019, 60.6% of Chinese people lived in urban areas—tripling the proportion in 1979—and 162 (out of a total 297) cities at prefectural level and above had a population larger than one million [1]. Meanwhile, China’s overall built-up urban area expanded to 60312.5 km2 by 2019, about 2.8 times that of 1999 [1,2]. Many Chinese cities have transformed from socialist planned industrial production bases to global cities through decentralization, marketization, and globalization [3,4,5]. However, growth also means that they are challenged by traffic congestion, environmental degradation, and increased demands for services such as education, housing, and healthcare. Sustainable urban planning is central to addressing the dilemma between urban growth and environmental protection, where land use is critical [6]. Therefore, an understanding of how urbanization is transforming urban spatial structure, particularly urban land layout in Chinese cities, is the key to efficient urban management and planning towards sustainable urban development.
Given the inherent spatial nature of urban expansion, remote sensing (RS) images (e.g., Landsat, DMSP/OLS, NPP/VIIRS, etc.) and geographical information system (GIS)-based spatial analyses (e.g., expansion speed and direction, spatial autocorrelation analysis, compactness index, fractal dimension, the migration process of the centroid, etc.) have been widely applied in the research of urbanization, particularly urban land changes, worldwide [7,8]. Most of China’s urban studies using RS and GIS technology focus on typical large cities and urban agglomerations, such as Nanjing [9], Hangzhou [10], the Jing-Jin-Ji Metropolitan Region (Beijing, Tianjin and Hebei/Shijiazhuang) [11], the Yangtze River Delta (YRD) [12], the Pearl River Delta (PRD) [13], and the Yellow River Basin [14], while studies on small and medium-sized cities, particularly those which are resource-based, are under-researched.
China has many cities that are rich in a variety of natural resources, such as coal (e.g., Datong, Huainan, Yulin, etc.), forestry (e.g., Yichun, etc.), and oil and gas (e.g., Daqing, Puyang, Karamay, etc.). After several decades of resource-dependent economic growth, many resource-based cities face the dilemma of resource exhaustion and seek a transition to new modes of development. As a traditional coal mining city, Datong has been attempting to loosen its dependence on coal and introduce more environmentally friendly industries such as tourism and logistics services. Hence, of interest in this research is an understanding of how the urban spatial structure of Datong has changed and evolved during this transition over the last two decades.
Further, traditional RS image analyses are constrained by the computing capacity of the software (e.g., ENVI, eCognition, and ERDAS) and the hosting computers. In a typical RS images analysis workflow, the image files must be downloaded first from the data provider to a local computer before any further work can be carried out, which can be very time-consuming for large-scale and multi-period studies including hundreds of frames of images. With recent advances in computing technology, the adoption of cloud computing in RS image analysis is increasing [15,16,17]. In the field of RS, the Google Earth Engine (GEE) (https://earthengine.google.com, accessed on 1 September 2021) has become a popular cloud computing platform for satellite image processing and analysis [18]. Jointly developed by Google, the United States Geological Survey (USGS), and Carnegie Mellon University, the GEE offers instant free access to a vast amount of the Earth’s observation data including images from Landsat, MODIS, and Sentinel, as well as several data products on topics like climate and soil, which simplifies the process of image acquisition, processing, and analysis [19,20].
Currently, the GEE has been applied in many RS based studies, including vegetation change monitoring [21,22], water surface area change and lake dynamics [23,24], planting area change for rice and other crops [25,26], ecological environment quality monitoring [16], land use/cover change monitoring [27,28], among many others. The GEE has also been increasingly adopted in the studies of urban expansion. For example, utilizing the GEE and Landsat data, Zhang et al. [29] studied the spatiotemporal characteristics of urban expansion in the Guangdong-Hong Kong-Macao Greater Bay Area during 1986–2017, and found that the urban area in 2017 was about 13 times that of 1986. Also using Landsat data, Shatnawi et al. [30] studied the spatiotemporal changes of land use/cover and the expansion of construction land in northern Jordan from 2010 to 2015. Applying the random forest classifier and time-series change detection methods to the Landsat data, Cao et al. [31] monitored the urban expansion of China’s largest archipelago (Zhoushan Archipelago) from 1986 to 2017.
To this end, this research aims to explore how Datong, a typical resource-based mining city, has expanded and evolved over the last two decades (2000–2018) utilizing the GEE platform and spatial analysis approaches, with a reflection on the role of urban planning and development policies in driving its spatial transformation. The next section introduces the study area, data and the research methods. Then, the results are presented in Section 3. This is followed by a discussion of the potential factors that have driven the identified urban land use changes. The paper concludes with major findings.

2. Materials and Methods
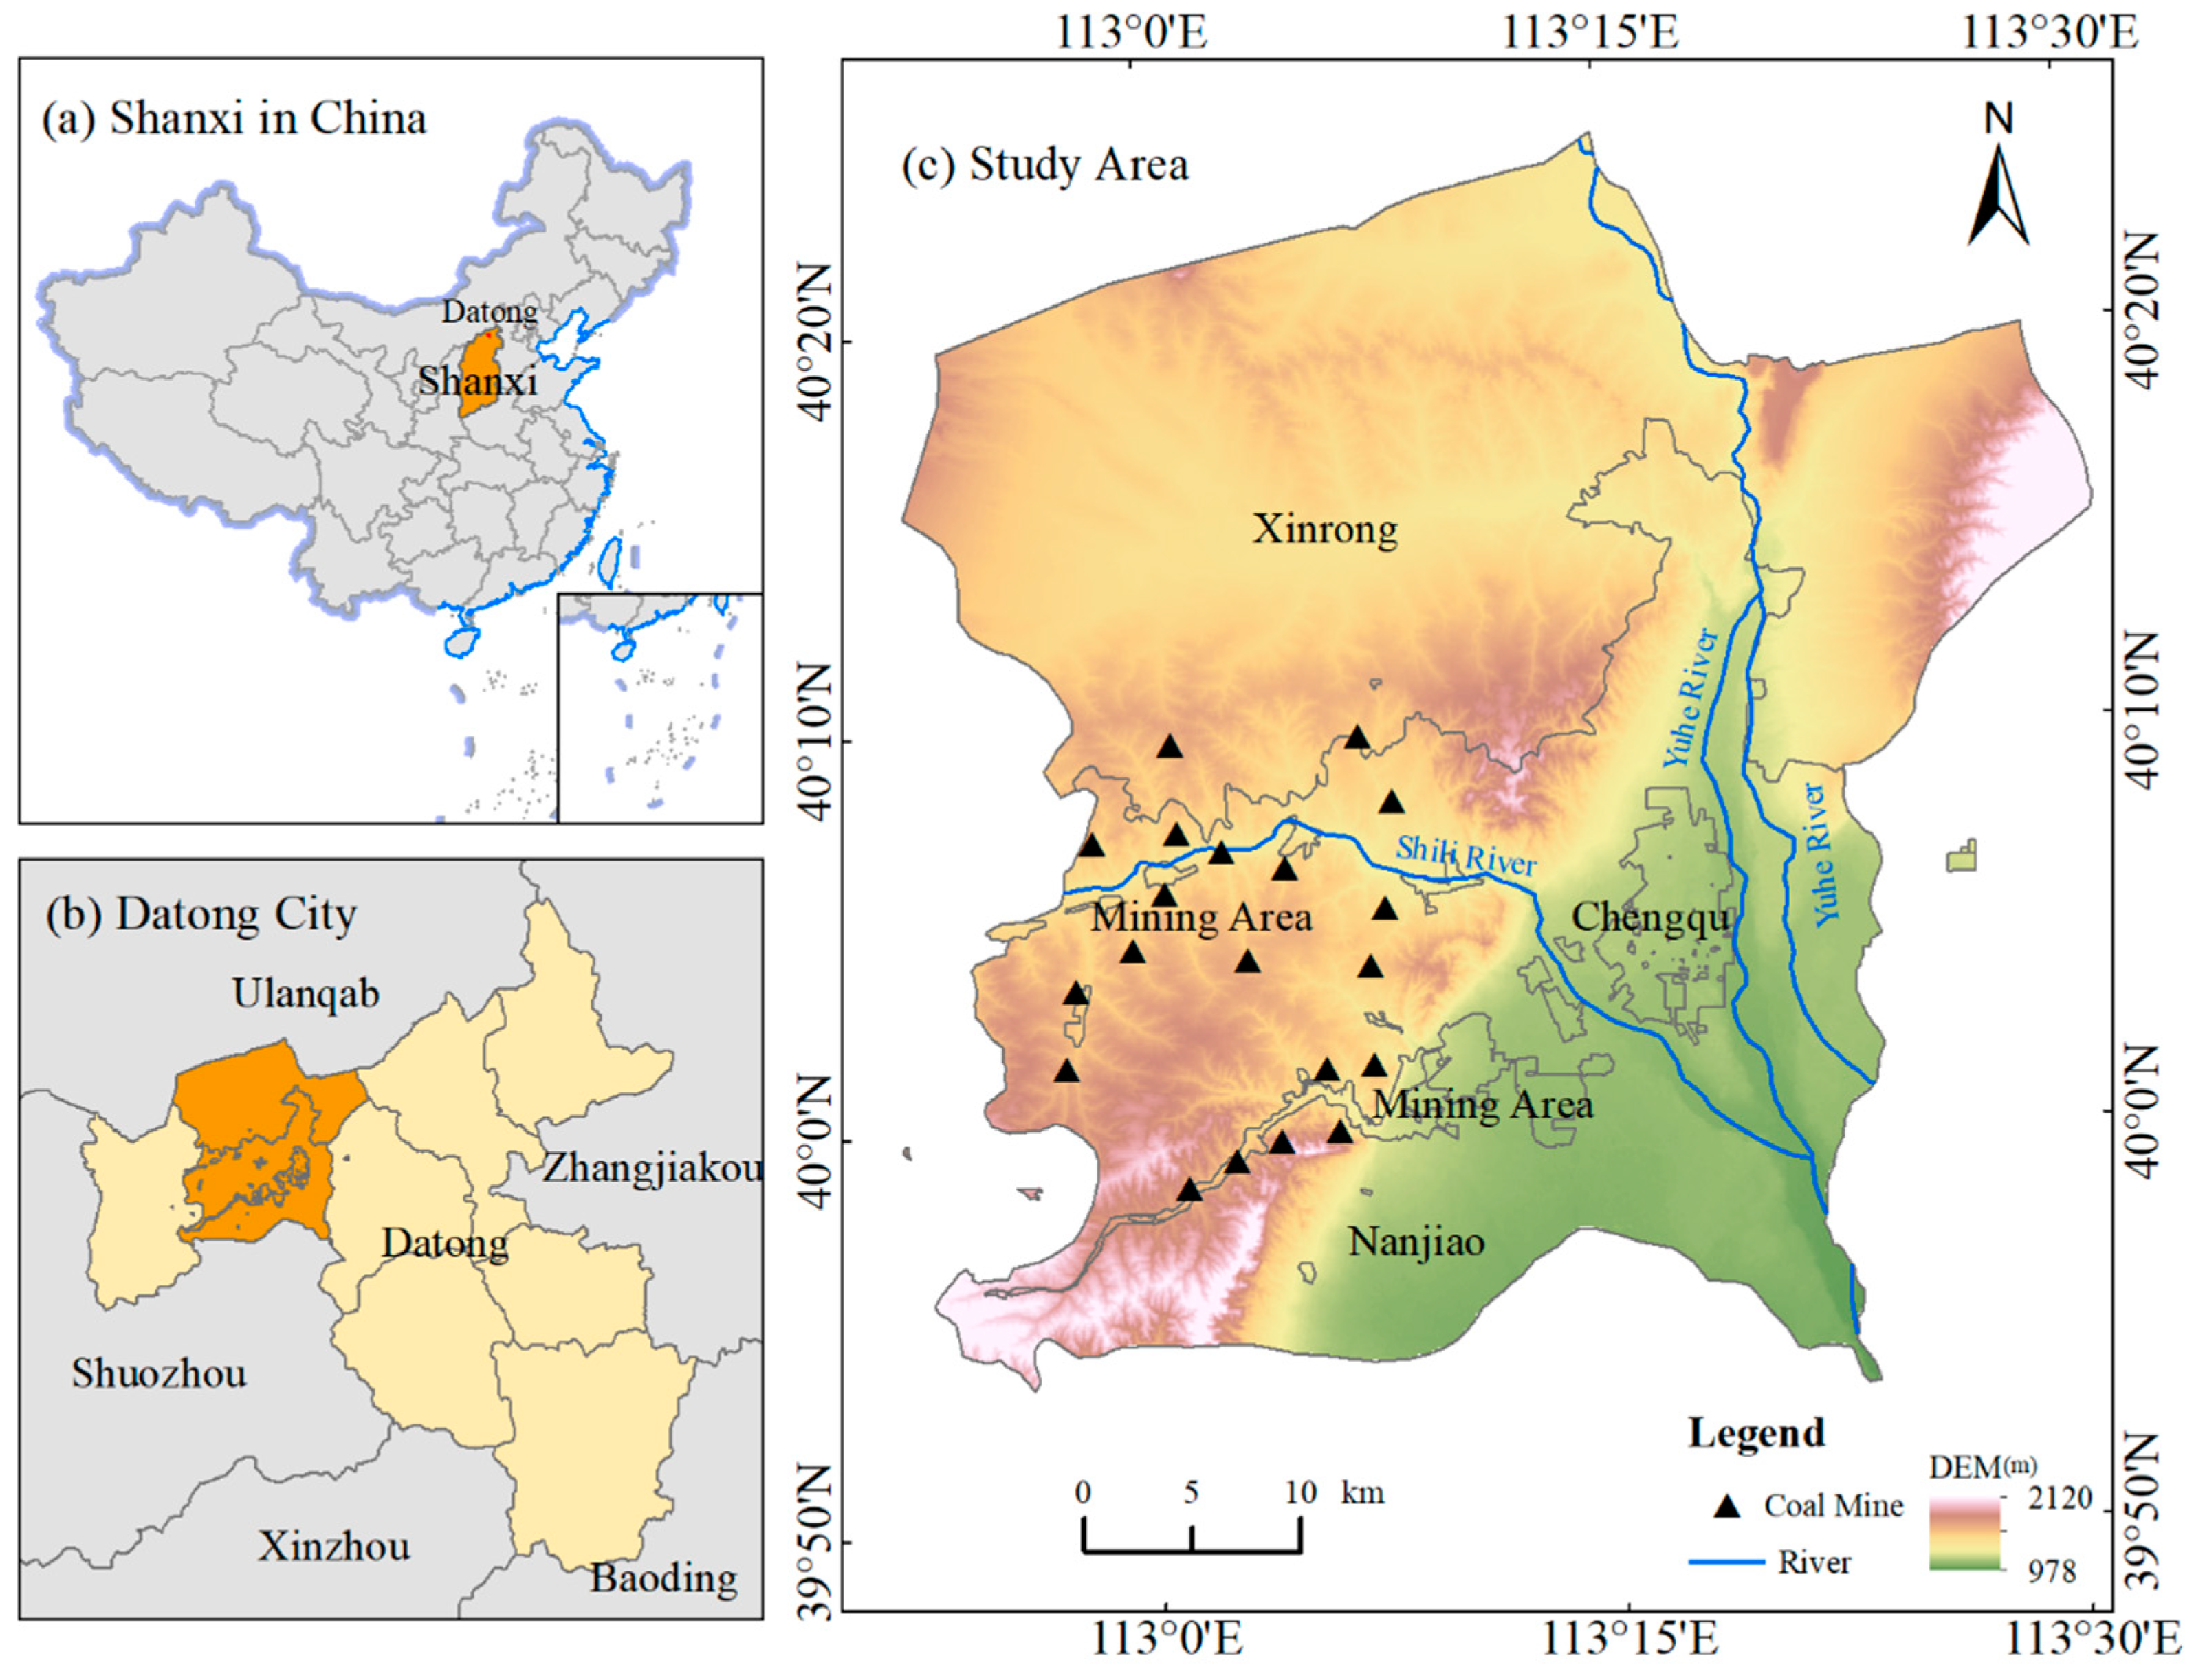
2.1. Study Area

Datong is a city, located in the northernmost part of Shanxi Province, China. It is a typical coal resource-based city. The location of the study area is shown in Figure 1. Before adjusting administrative divisions in 2018, Datong City had jurisdiction over four districts and seven counties, with a total population of 3.4 million, among which urban population has a share of 62.9% [32]. Since the city and population of Datong are concentrated in the urban area, and the development of Chengqu and the Mining Area has typical urban characteristics, this research considers four urban districts of Datong: Chengqu, the Mining Area, Nanjiao, and Xinrong, which had a total population of 1.8 million (71.5% urban population) in 2017 [32]. The four districts account for 14.7% of the total area of Datong (14112km2 is the total area), but account for 52.1% of the total GDP of the city in 2017 [32].

2.2. Data Source and Processing

The data used in this research included images from Landsat-5 TOA and Landsat-8 TOA, which were obtained from the GEE platform (https://code.earthengine.google.com, accessed on 22 September 2020) that selected the images with the lowest cloud cover for every year between 2000 and 2018. Because no data of Datong from Landsat-5 and Landsat-8 were available for the year 2012, and the Landsat-7 image from 2012 showed severely slanted stripes, the land cover information is missing for that year. Based on the current situation of land use in Datong, the research results of peer experts, and the emphasis of this study on urban expansion, the classification system of land use was determined as construction land, forest, cultivated land, water and bareland [33]. The framework of the study is shown in Figure 2.
The classification method adopted the Classification and Regression Tree (CART) proposed by Breiman [34], which is fast in operation, high in accuracy, simple in model structure, and has been proved to be effective in land use classification and information extraction by a large number of empirical studies [35,36,37]. The CART algorithm was performed directly on the GEE platform, and used the default parameters to train the classifier. In addition to the inherent spectral bands of Landsat, considering that the research was mainly aimed at urban expansion, the Normalized Difference Build Index (NDBI) was used to perform the extraction of construction land [38]. With reference to the Google Earth images, about 170–300 training samples were selected for classification in each image through manual visual interpretation. Specifically, 70% of the training samples of each year were used for land use classification, and 30% were used for the confusion matrix verification. The classification accuracy is shown in Table 1, which meets the requirement of the USGS and, thus, can be considered satisfactory in practice. According to the correspondence between the Kappa statistical value range and the classification accuracy proposed by Landis et al. [39] (i.e., 0.6–0.8 is good and 0.8–1.0 is very good), the Kappa statistical value in the study area was limited by the sample quality for some years by less than 0.8, but met research needs.

2.3. Data Analysis

2.3.1. Statistical Analysis

Three descriptive statistics are adopted here to measure the changes of construction land over the study period: the Urban Growth Index (UGI) [40], the Urbanization Development Index (UDI) [41], and the rose diagram. UGI quantifies the speed of urban expansion; UDI quantifies the size of urban development and the rose diagram depicts the direction of urban expansion.
The UGI is defined as the annual growth rate of construction land, which can be calculated with Equation (1) as follows:
U G I t , t + Δ t = U t + Δ t U t Δ t
where t is the beginning year of a period and Δt is the number of years in that period;   U t + Δ t and U t are the areas of construction land in years t + Δ t and t, respectively.
The UDI refers to the share of the construction land in a district in a particular year, which can be computed with Equation (2) as follows:
U D I k t = U k t A k t × 100 %
where U k t is the area of the construction land area of the kth district in year t; and A k t is the total land area of the kth district in the same year.

2.3.2. Expansion Direction Analysis

The direction of urban expansion can be represented by the changes of the centers of a mass transfer model over a time period [42]. The coordinates of the center can be defined by Equations (3) and (4):
X t = k x k t A k t k A k t
Y t = k y k t A k t k A k t
where ( X t , Y t ) represents the geographic location of the center of the construction land in year t;   A k t represents the area of the kth construction land patch in year t; and ( x k , y k ) are the coordinates of the center of the kth construction land patch in year t.

2.3.3. Spatial Cluster Analyses

Spatial cluster analyses are employed here to explore whether there is a clustering trend in the spatial distribution of construction land, as well as to identify the locations of clusters of construction land if such a trend exists. Specifically, two spatial autocorrelation indicators are used in this research: one is a global measure (the Moran’s I) and the other is a local measure (the local Moran’s I), both of which are common approaches for spatial cluster analysis. While the former can detect the global spatial clustering pattern, the latter can identify the locations of local clusters [43,44]. The mathematical formulations of the two statistics are expressed as in (5)–(7).
I = i = 1 n ( x i x ¯ ) j = 1 n w i j ( x j x ) S 2 i = 1 n j = 1 n w i j
I i = ( x i x ¯ ) S 2 j = 1 n w i j ( x j x ¯ )
S 2 = 1 n i = 1 n ( x i x ¯ )
where I is the Moran’s I and I i is the local Moran’s I; n is the total number of land units; x i and x j are the proportions of construction land in land units i and j, respectively; x ¯ represents the average proportion of construction land in each land unit; and w i j is the spatial weight matrix indicating the spatial relationship between land units i and j.
The value of I varies from −1 to 1, with values closer to −1 indicating more disperse patterns, and values closer to 1 indicating more clustering patterns. The land unit i is in a high-high value local cluster if the values of local Moran’s of i and its neighboring land units are high. That is, both i and its surrounding land units have high percentages of construction land. Accordingly, we can have high-high, high-low, low-high and low-low value clusters [45].

3. Results

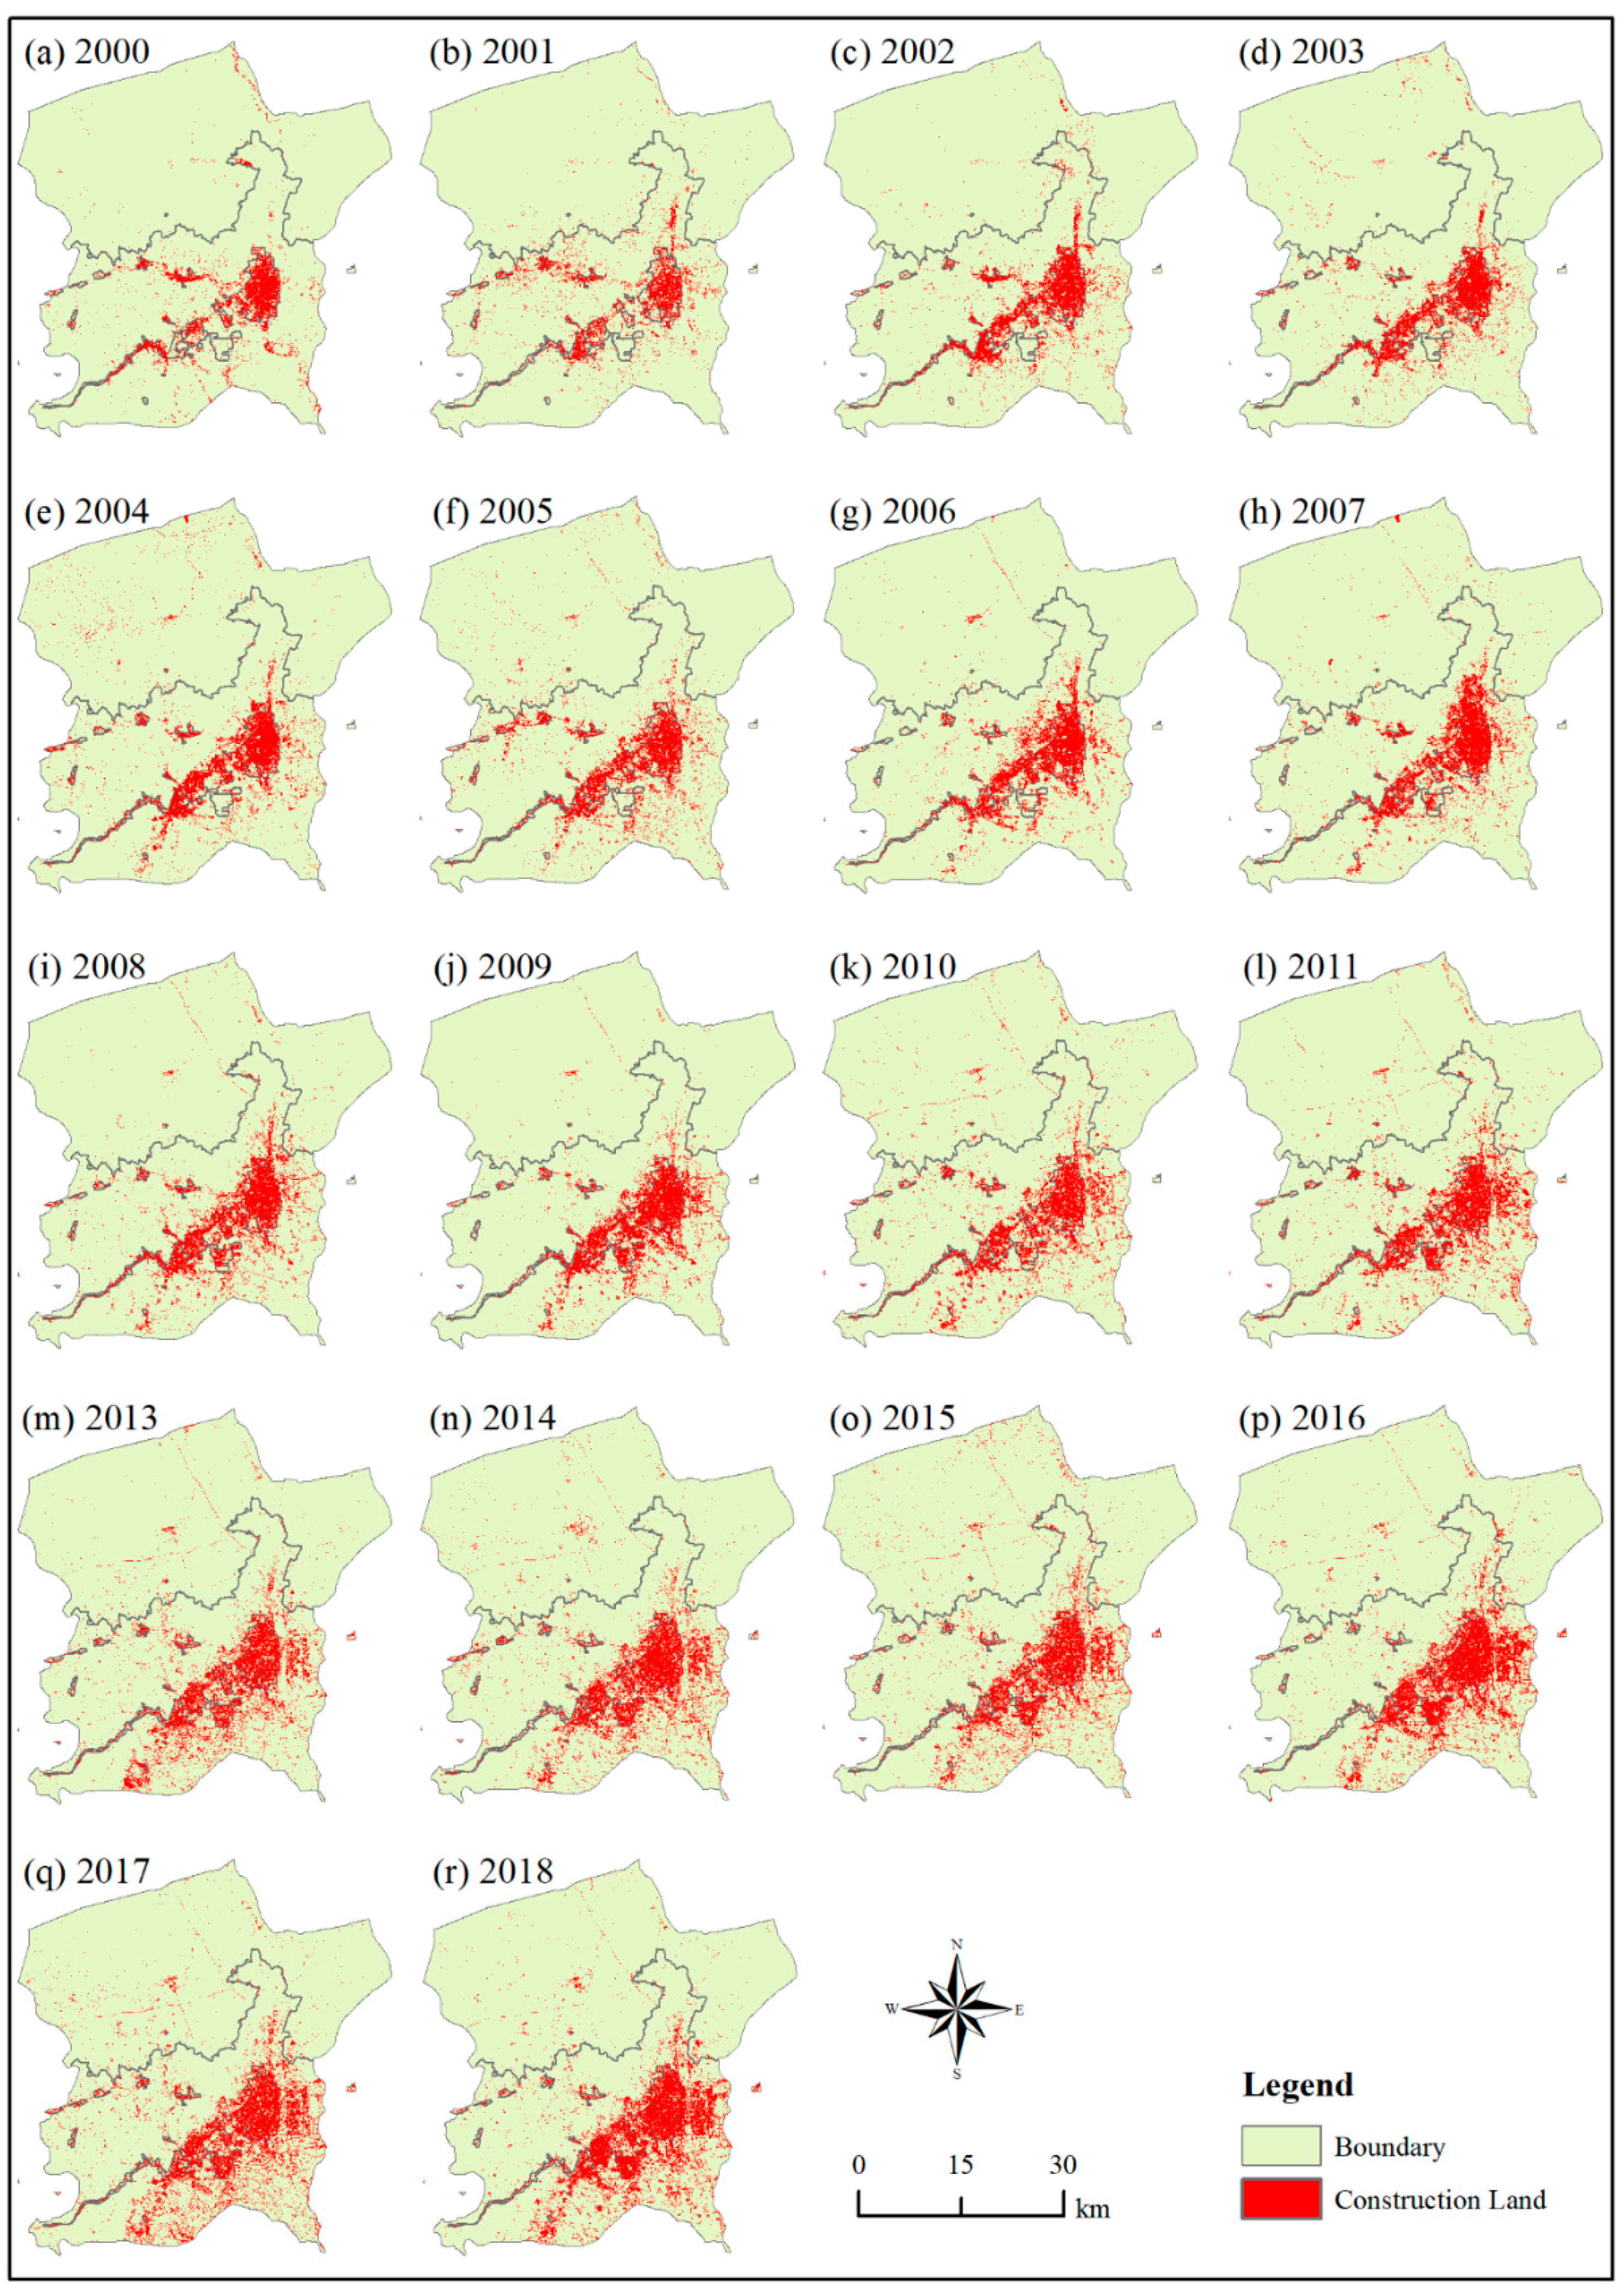
3.1. Changes of Urban Construction Land

The spatial distribution of extracted construction land for each year in the study pe-riod (except year 2012) is depicted by Figure 3. During 2000–2018, construction land was concentrated in Chengqu, the Mining Area, and Nanjiao, and expanded to the southeast of Nanjiao. From 2000 to 2005, the construction land was relatively slow and the expansion was not apparent, which was concentrated in Chengqu and the Mining Area. From 2006 to 2009, Nanjiao, adjacent to the east of Chengqu, gradually developed, and the rudiment of the new district east of the Yuhe River was revealed in 2009. From 2010 to 2018, the construction land expanded significantly to Nanjiao, which had a certain scale in 2016. From the perspective of the distribution and development in each district, construction land developed earlier in Chengqu and the Mining Area, and Chengqu has always been the core area with the most concentrated distribution of construction land. After 2002, construction land in Nanjiao began to expand gradually. However, in the past two decades, the construction land in Xinrong was the lowest and also scattered, with little overall change.
Figure 4 shows the temporal changes of construction land area during 2000–2018. The overall construction land area reached 214.25 km2 in 2018, with an increase of 132.6% compared with 92.12 km2 in 2000. Among the four districts, only Nanjiao had a steady trend in the growth of construction land, from 42.30 km2 in 2000 to 137.51 km2 in 2018. For Chengqu, there was a slight decrease (i.e., from 35.39 km2 to 34.18 km2) of construction land from 2006 to 2010. Except for a slight decrease in 2006 (i.e., from 18.60 km2 to 17.18 km2), the construction land in the Mining Area kept increasing, with an increase of 11.77 km2. Xinrong had the lowest distribution of construction land, which was only 3.90 km2 in 2000. There was also a small decrease (i.e., from 5.83 km2 to 5.09 km2) in 2006. However, after four years of development, the construction land in Xinrong increased rapidly and reached 10.65 km2 in 2018.
The values of UGI are given in Table 2. It can be observed that for the entire study area, the expansion of construction land during 2000–2003 and 2014–2018 was much faster than the years between those two periods. The speed of urban expansion kept decreasing during the first three periods (i.e., 2000–2003, 2003–2006, and 2006–2010)—from 9.66 km2/year to 4.71 km2/year—but started increasing during the fourth period (2010–2014)—from 4.71 km2/year to 8.00 km2/year. Regarding the urban expansion in the four districts, each district presented different characteristics.
Chengqu expanded at the fastest rate during 2000–2003, reaching 1.00 km2/year. However, the speed gradually decreased in the following two periods (i.e., 2003–2006 and 2006–2010), and showed negative growth from 0.47 km2/year to 0.40 km2/year during 2006–2010. In the two periods after 2010 (i.e., 2010–2014 and 2014–2018), it gradually recovered to a faster growth rate, from 0.78 km2/year to 0.62 km2/year.
The speed of urban expansion in the Mining Area showed a state of obvious fluctuation. The rapid expansion of the city was 1.35 km2/year at first, followed by a negative growth during 2003–2006, but reached the highest growth rate of 1.65 km2/year during 2006–2010, and then the development rate sharply dropped to 0.02 km2/year, and recovered to 0.61 km2/year during 2014–2018.
Nanjiao was the fastest growing of the four districts. In the first three periods (i.e., 2000–2003, 2003–2006, and 2006–2010), the growth rate showed a gradual downward trend from 6.66 km2/year to 2.13 km2/year, and in the next two periods (i.e., 2010–2014 and 2014–2018), the growth rate gradually increased from 5.01 km2/year to 7.69 km2/year.
The development speed of Xinrong was similar to that of the Mining Area, showing a state of fluctuation. The first two periods (i.e., 2003–2006 and 2006–2010) witnessed rapid growth and then negative growth, from 0.64 km2/year to −0.25 km2/year. However, it reached the maximum growth rate of 1.33 km2/year during 2006–2010, then slowed down, and showed a negative growth rate of −0.05 km2/year during 2014–2018.
The values of UDI are given in Table 3. It can be observed that for the entire study area, the share of construction land grew steadily from 4.45% to 10.35%. From 2014 to 2018, the construction land area proportion increased greatly from 8.63% to 10.35%. From the perspective of the four districts, the share of construction land area in the different districts is obviously different.
The share of construction land in Chengqu was much higher than that of the other three districts. In 2000, the construction land accounted for 65.36% of the total area. Although the construction land has increased or decreased since then, it has always been above 70%. In 2018, it reached 82.84%, and the growth rate reached 17.48% in the last two decades.
The share of construction land in the Mining Area is second only to Chengqu. During 2000–2003, construction land developed rapidly, with the area proportion growing from 32.30% to 41.33%. However, there was a slight decline to 38.17% in 2006, and then it steadily increased to 58.46% from 2010 to 2018, with an overall increase of 26.16%.
The share of construction land in Nanjiao was lower than that in Chengqu and the Mining Area, but it grew steadily. In 2014, construction land accounted for more than 10%—from 4.33% to 10.93%. Furthermore, in 2018, it reached 14.07%, with an overall increase of 9.74%.
Xinrong had the lowest share of construction land and the slowest development. In 2000, construction land accounted for only 0.39%, and after nearly two decades of development, the area accounted for only 1.06%.

3.2. Directions of Urban Expansion

The directions of urban expansion are shown in Figure 5. The centroid of the study area is used as the center of the rose diagram. The study area is divided into 16 even sectors around the centroid. The values on the axis represent the UDI of each year. Figure 4 indicates urban expansion towards the southeast during the study period, with slight increases in the construction land in the southwest. There was no significant urban expansion in the northern part of the study area at all. In general, the study area mainly expanded within Chengqu and towards the southeast of Nanjiao. This is consistent with the temporal variations of the spatial distribution of construction land in Figure 2.
In the SEE direction, construction land developed rapidly (from 7.24% to 19.37%). In this direction, most of the new areas were distributed east of the Yuhe River. According to the spatial distribution of construction land in Figure 2, the construction land in this area showed an embryonic form in 2009 and developed to a certain scale in 2014.
In the SE direction, the share of construction land was always the highest in the same period (from 10.48% to 22.49%), but there was a slight decrease in 2010 (from 13.37% to 13.20%). In 2000, the construction land was mainly distributed in Chengqu and the Mining Area in the southeast of the study area, and the initial proportion of Chengqu had reached 65.36%. Moreover, the construction land in some areas of Nanjiao adjacent to the east and south of Chengqu had been continuously expanded since 2006, resulting in the share of construction land in the whole southeast always being the highest.
In the SSE direction, the distribution of construction land was relatively small during 2000–2010, accounting for only 3.63% in 2000. However, with the continuous development of Nanjiao, the share of construction land reached 17.77% in 2018.
In the S direction, the share of construction land ranged from 5.35% to 15.96%. Different from the previous three directions (i.e., SEE, SE, and SEE), the center of this area was a part of the Mining Area, and there was a slight decline in construction land in the Mining Area from 2003 to 2006. Although Nanjiao was in a state of expansion, the share of construction land in this direction eventually decreased slightly (from 10.13% to 9.70%).
In the SSW direction, there was a belt-shaped distribution of the Mining Area and parts of Nanjiao, and the urban size was relatively small. Only a small amount of construction land was distributed in the Mining Area and south of Nanjiao, and the expansion is not notable—from 4.56% to 6.62%.
By calculating the coordinates of the centroid of the urban construction land in each period, the migration process of the urban construction land in the study area can be determined. It can be seen from Figure 6 that, despite the urban centroid moving 612.38 m to the east of the study area from 2003 to 2006, and 615.02 m to the southwest of the study area from 2006 to 2010, the urban centroid moved 103.92 m, 970.77 m, and 878.43 m to the southeast in the other three periods. On the whole, the centroid of urban construction in the study area moved 2498.22 m to the southeast from 2000 to 2018, and the urban area expanded to the southeast of Nanjiao.

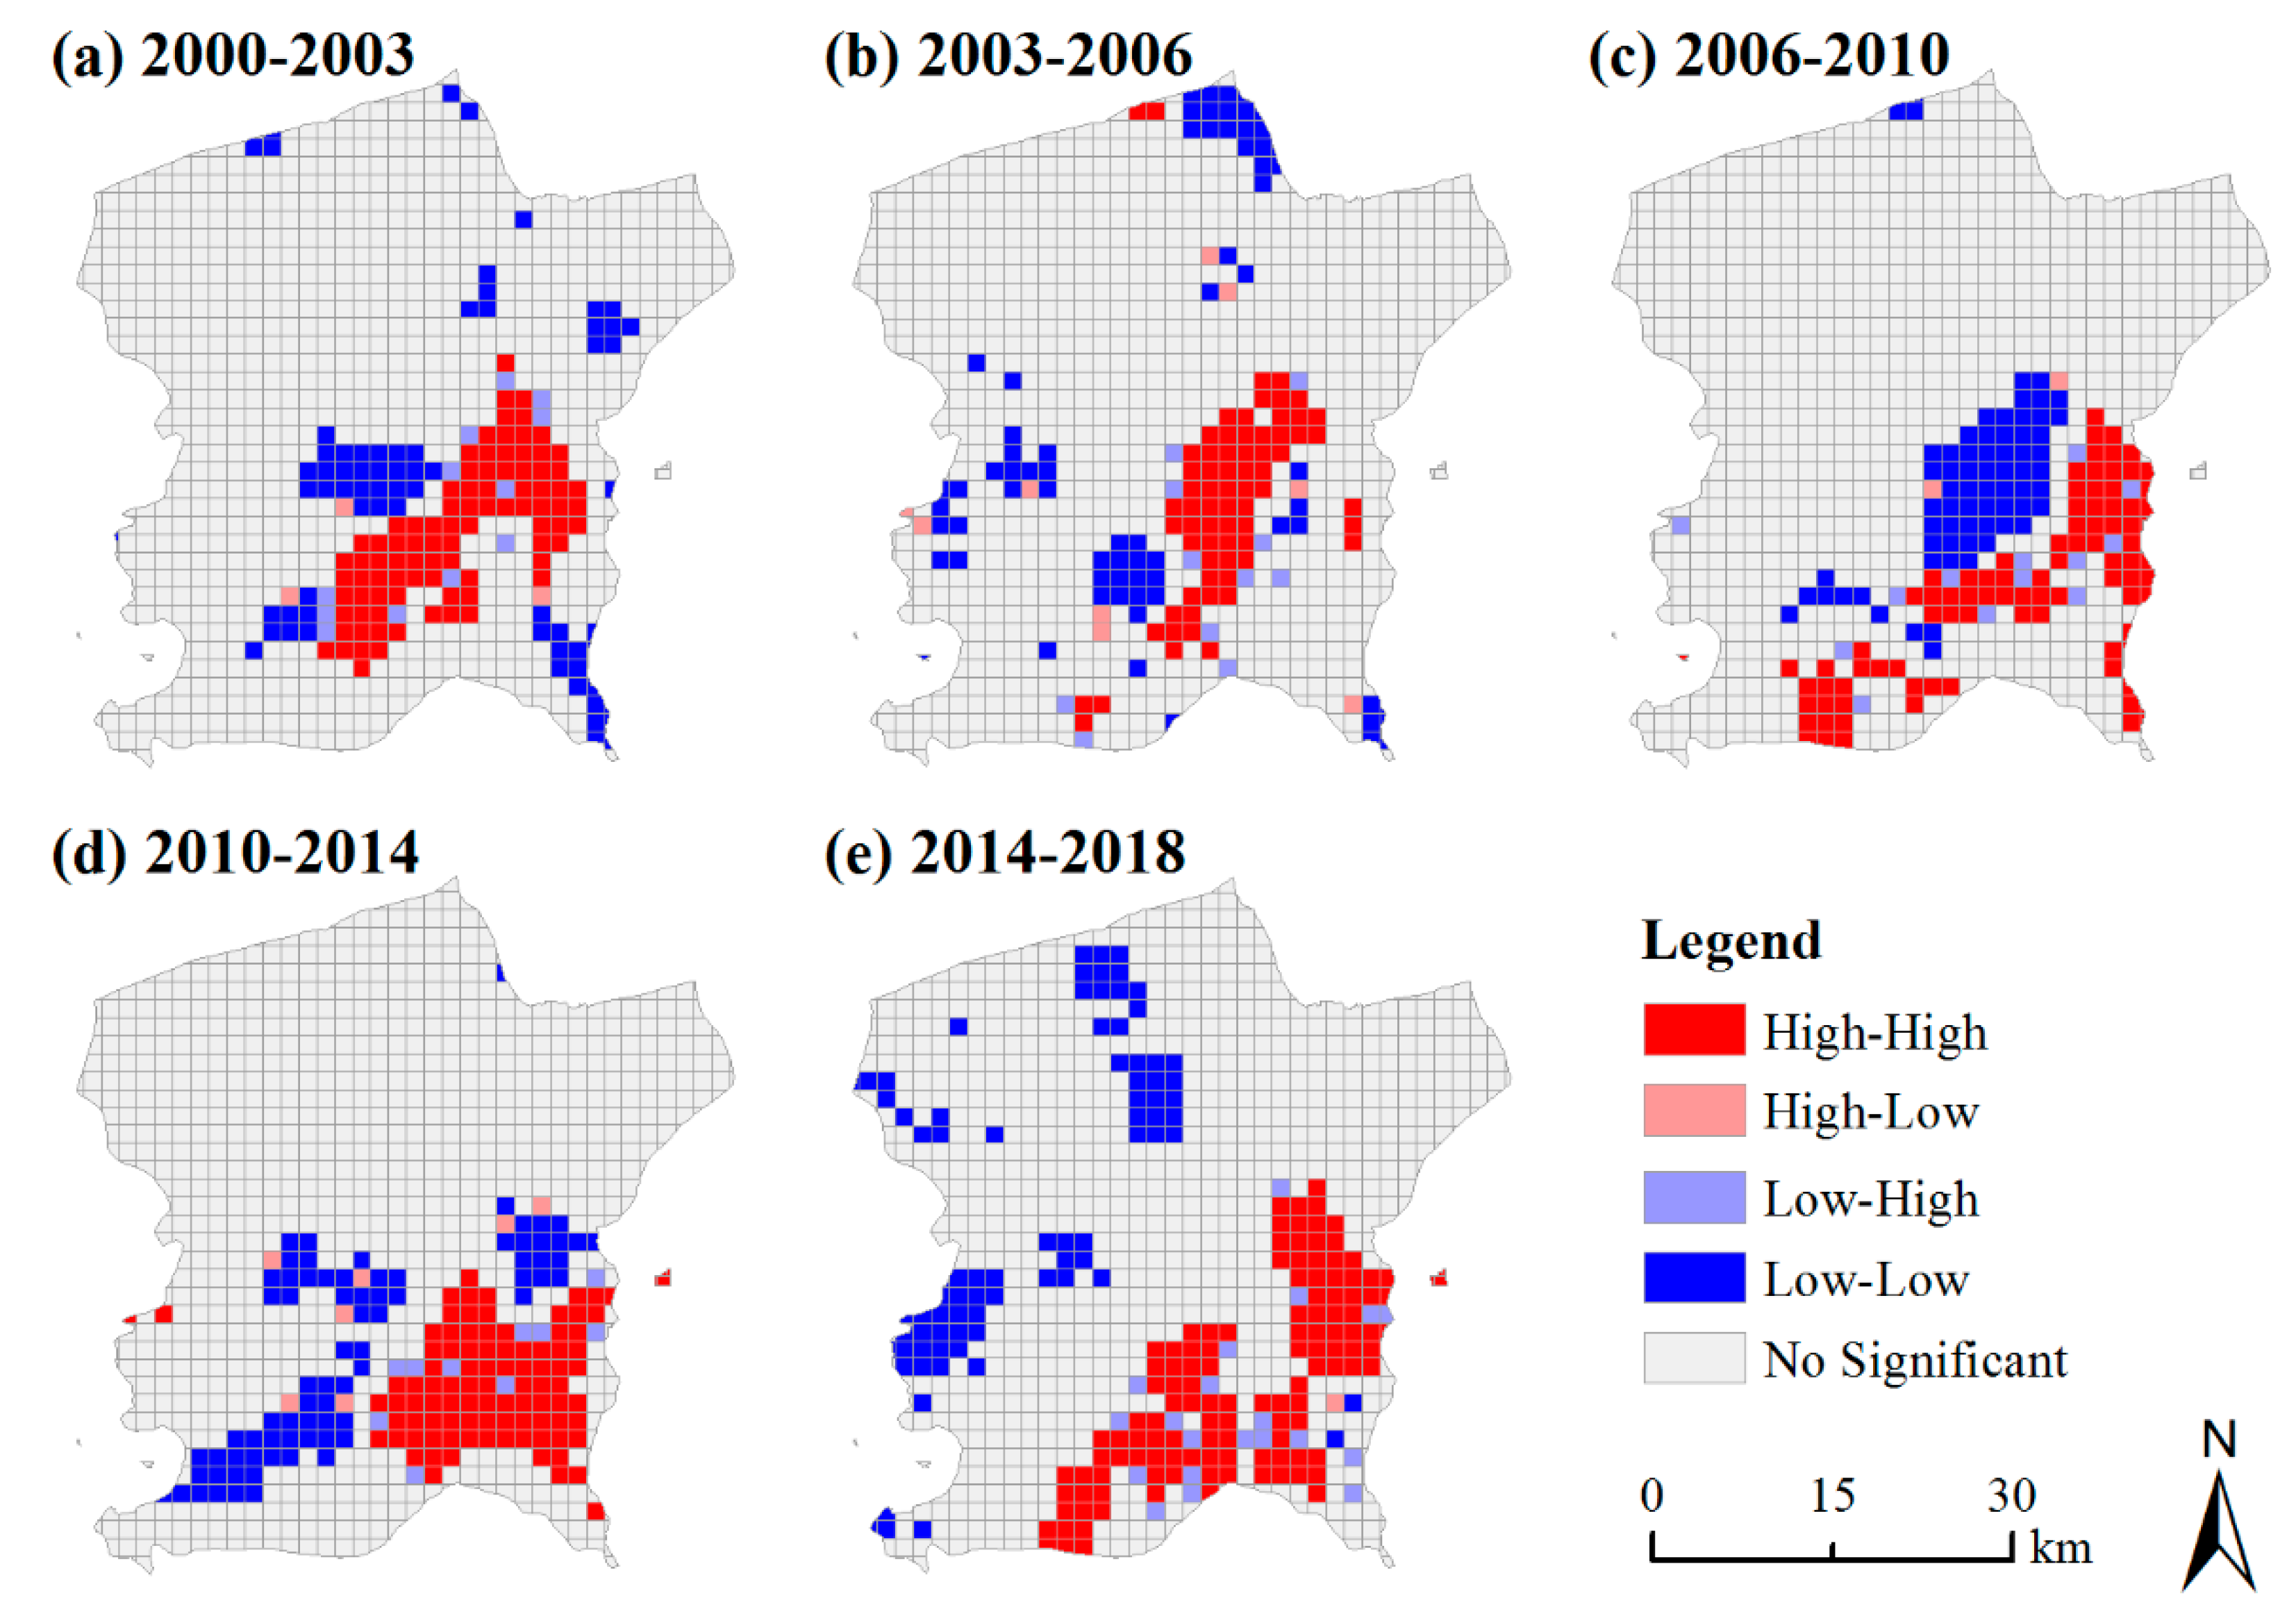
3.3. Spatial Patterns of Urban Expansion

For the spatial cluster analysis, the study area was discretized into a lattice dataset consisting of a set of 1.5 km × 1.5 km grid cells, with each having the percentage of construction land as its attribute. The values of the Moran’s I, as well as the associated statistical significance, are presented in Table 4. It can be seen that all the Moran’s Is are very high—larger than 0.8—and statistically significant, indicating that the construction land had a clustering trend over the space during the study period. Among the six years under consideration, the construction land in the year 2000 had the strongest concentration trend, and the construction land in the year 2010 had the relatively weakest clustering trend. In other words, the clustering trend of construction land declined in general during 2000–2010 and increased from 2014.
Further, the spatial cluster location of construction land growth is shown in Figure 7. In general, the hot spots of construction land growth are concentrated in Chengqu and the southeast of Nanjiao. During 2000–2003, the high-high value clusters of the growth of construction land were concentrated in Chengqu, the Mining Area, and the central area of Nanjiao, while the low-low value clusters appeared in the north of the Mining Area. During 2003–2014, Chengqu and the Mining Area successively intersected with low-low value clusters (i.e., Chengqu during 2006–2010, and the Mining Area during 2003–2006 and 2010–2014), indicating that when the city developed to a certain scale, the growth hotspot of construction land would shift over time. During this period (i.e., 2003–2014), new high-high value clusters of construction land appeared in the eastern and southeastern areas of Nanjiao, indicating that the center of urban development was gradually shifting to new areas in Nanjiao. During 2014–2018, there was no significant change in Chengqu or the Mining Area, and the high-high value clusters continued to transfer to the eastern and southeastern areas of Nanjiao. However, during the research period, most areas of Xinrong hadn’t changed significantly, with the northern and central areas showing l low-low value cluster during 2003–2006 and 2014–2018, respectively. The overall growth of construction land is consistent with the spatial distribution rule in Figure 2.

4. Discussion

Urban expansion is an extremely complex process, which is a comprehensive result of the interaction of nature, society, and economy. Considering many factors, the factors of urban expansion in the four districts of Datong City may include terrain, urban planning policies, and social economy.
Regarding terrain, as one of the important factors affecting the distribution of land-use patterns in mountainous and hilly areas, it has a huge impact on human production and life [46]. According to the research results on the impact of terrain on urban development patterns, construction land directly related to human activities is mainly concentrated in areas with relatively low elevation, slope, and topographic relief [47,48]. The terrain in the study area was high in the northwest and low in the southeast, and mountainous and hilly areas were mostly distributed in the west, north, and northeast. In the past two decades, the construction land distribution in Xinrong has been relatively small and scattered, and growth has not been apparent: the overall construction land has increased by 122.13 km2, but Xinrong has only increased by 6.75 km2. The relatively low-lying Chengqu and the southeast of Nanjiao have become the main directions of urban development.
Urban development is greatly influenced by the government in China [49]. The government guides economic market growth and urban planning through real-time relevant policies. Datong has long been dependent on the development of coal resources. In the 21st century, with the reduction of coal resources, urban transformation and development are imminent. The Datong City Master Plan (2006–2020) puts forward some suggestions on the reconstruction and development of Yudong and Kouquan, aiming to build Datong into a national historical and cultural city, and a clean energy city [50]. In 2008, the reconstruction of the old city began, leading to the relocation of a large number of residents in Chengqu [51]. According to data published by Datong Daily in 2016, the renovation in Chengqu involves 74 old residential areas, with a total of 23,283 households [52]. During this period, the development speed of urban construction land slowed down (i.e., during 2006–2010, UGI was −0.40 km2/year and UDI dropped from 74.55% to 71.18%), and the urban area expanded to a new district (Yudong) in the eastern part of Chengqu, leading to an obvious urban cluster in Yudong in 2009. At the same time, there was an evident decline in the development of construction land in the Mining Area in 2006, and there was no significant change in growth except for a few hot spots during 2014–2018. In 2018, the State Council of China approved the adjustment of Datong’s administrative divisions and abolished the Mining Area. To some extent, the clampdown on the Mining Area indicated the end of the era of Datong’s sole reliance on coal resources [53].
According to the integrity of the Datong Statistical Yearbook and the comparison of image data years, the study area’s statistical data and each district’s statistical data were finally selected to analyze urban expansion from the social economy perspective. In this study, the construction land area was set as the dependent variable, and multiple potential driving factors were selected as independent variables (i.e., total population, employed persons in urban units, gross regional product, gross secondary industry product, gross tertiary industry product, gross industrial product, number of industrial enterprises, gross industrial output value, investment in fixed assets, local fiscal revenue, local fiscal expenditure). The stepwise regression analysis method was used to establish the model [54]; R2 = 0.970, adjusted R2 = 0.968, which passed the significance test of 0.05, and the fitting effect were good. It can be seen from the regression results that the main factors affecting the construction land area in the study area were the total population, gross industrial product, and number of industrial enterprises, and the standard coefficients were 0.370, 0.418, and 0.335, respectively. From the results of the correlation analysis, the correlation coefficients between the construction land area and total population, gross industrial product, and number of industrial enterprises were 0.832, 0.774, and 0.682, respectively, and passed the significance test of 0.01. The total population of the study area increased by 453,300 people from 2001 to 2017, and the industrial GDP accounted for more than 79.00% of the GDP of the secondary industry, especially 92.56% in 2007. The increase of population and the development and changes of industrial enterprises, to some extent, led to the increase of construction land needed by people for production and living, thus leading to urban expansion.

5. Conclusions

In recent years, urban expansion has been a hot topic. However, most scholars focus their research on metropolises, which leads to a lack of research on the development law of small and medium-sized cities, especially coal resource-based cities in a transition period. Therefore, this study took four typical districts in Datong as examples, based on the GEE platform, using RS and GIS spatial analysis methods to explore the spatial-temporal evolution characteristics of construction land in the past two decades (2000–2018).
The research shows that, construction land was concentrated in Chengqu and the Mining Area in 2000 and, on this basis, it continued to expand to the southeast of Nanjiao. Terrain, urban planning, and social economy (total population, gross industrial product and number of industrial enterprises) are the main factors influencing urban expansion. On the whole, the characteristics of the changes in the construction land in the study area are basically consistent with the urban development planning of Datong City to protect the ancient city wall and the transformation of mining enterprises. The law of urban development obtained in this study can provide a more scientific decision-making basis for the subsequent urban development of Datong, conducive to the rational planning of new urban and urban transformation. At the same time, the works of this study can be applied to the extraction and analysis of historical remote sensing images of other similar cities. Moreover, based on a grasp of the law of urban development, decision makers can optimize the future development patterns of cities more scientifically.

Author Contributions

Conceptualization, M.X., X.Z., X.S. and T.S.; methodology, X.Z., M.X. and Y.Y.; software, M.X. and Y.Y.; validation, M.X.; formal analysis, X.Z., M.X. and Y.Y.; investigation, X.Z., M.X. and Y.Y.; resources, X.Z., X.S. and T.S.; data curation, M.X.; writing—original draft preparation, M.X.; writing—review and editing, X.Z.; visualization, M.X.; supervision, X.Z.; project administration, X.Z., X.S. and T.S. All authors have read and agreed to the published version of the manuscript.

Funding

This article was written as part of the work of the Centre for Sustainable, Healthy and Learning Cities and Neighbourhoods (SHLC), which is funded via UK Research and Innovation, and administered through the Economic and Social Research Council, as part of the UK Government’s Global Challenges Research Fund. Project Reference: ES/P011020/1.

Institutional Review Board Statement

Not applicable.

Informed Consent Statement

Not applicable.

Data Availability Statement

Not applicable.

Acknowledgments

We thank the journal’s editors and reviewers for their kind comments and valuable suggestions to improve the quality of this paper.

Conflicts of Interest

The authors declare no conflict of interest.

References

  1. NBSC. China Statistical Yearbook-2020; China Statistic Press: Beijing, China, 2020.
  2. NBSC. China Statistical Yearbook-2000; China Statistic Press: Beijing, China, 2000.
  3. Gu, C.; Wei, Y.D.; Cook, I.G. Planning Beijing: Socialist city, transitional city, and global city. Urban. Geogr. 2015, 36, 905–926. [Google Scholar] [CrossRef]
  4. Wei, Y.D. Regional Development in China: States, Globalization and Inequality; Routledge: London, UK, 2000. [Google Scholar]
  5. Wu, F. Emerging Chinese Cities: Implications for Global Urban Studies. Prof. Geogr. 2016, 68, 338–348. [Google Scholar] [CrossRef]
  6. Healey, P. Urban Complexity and Spatial Strategies: Towards a Relational Planning for Our Times; Routledge: London, UK, 2006. [Google Scholar]
  7. Masek, J.G.; Lindsay, F.E.; Goward, S.N. Dynamics of urban growth in the Washington DC metropolitan area, 1973–1996, from Landsat observations. Int. J. Remote Sens. 2000, 21, 3473–3486. [Google Scholar] [CrossRef]
  8. Morshed, N.; Yorke, C.; Zhang, Q. Urban Expansion Pattern and Land Use Dynamics in Dhaka, 1989–2014. Prof. Geogr. 2016, 69, 1–16. [Google Scholar] [CrossRef]
  9. Chen, J.; Gao, J.; Chen, W. Urban land expansion and the transitional mechanisms in Nanjing, China. Habitat Int. 2016, 53, 274–283. [Google Scholar] [CrossRef]
  10. Cao, Y.; Zhang, X.L.; Fu, Y.; Lu, Z.W.; Shen, X.Q. Urban spatial growth modeling using logistic regression and cellular automata: A case study of Hangzhou. Ecol. Indic. 2020, 113, 106200. [Google Scholar] [CrossRef]
  11. Wu, W.; Zhao, S.; Zhu, C.; Jiang, J. A comparative study of urban expansion in Beijing, Tianjin and Shijiazhuang over the past three decades. Landsc. Urban. Plan. 2015, 134, 93–106. [Google Scholar] [CrossRef]
  12. Sun, W.; Shan, J.; Wang, Z.; Wang, L.; Lu, D.; Jin, Z.; Yu, K. Geospatial analysis of urban expansion using remote sensing methods and data: A case study of Yangtze River Delta, China. Complexity 2020, 2020, 3239471. [Google Scholar] [CrossRef]
  13. Seto, K.C.; Fragkias, M. Quantifying spatiotemporal patterns of urban land-use change in four cities of China with time series landscape metrics. Landsc. Ecol. 2005, 20, 871–888. [Google Scholar] [CrossRef]
  14. Wohlfart, C.; Mack, B.; Liu, G.; Kuenzer, C. Multi-faceted land cover and land use change analyses in the Yellow River Basin based on dense Landsat time series: Exemplary analysis in mining, agriculture, forest, and urban areas. Appl. Geogr. 2017, 85, 73–88. [Google Scholar] [CrossRef]
  15. Zhou, Q. Climatic data analysis and computer data simulation of inland cities based on cloud computing and remote sensing images. Arab. J. Geosci. 2021, 14, 1010. [Google Scholar] [CrossRef]
  16. Huang, H.; Chen, W.; Zhang, Y.; Qiao, L.; Du, Y. Analysis of ecological quality in Lhasa Metropolitan Area during 1990–2017 based on remote sensing and Google Earth engine platform. J. Geogr. Sci. 2021, 31, 265–280. [Google Scholar] [CrossRef]
  17. Beaton, A.; Whaley, R.; Corston, K.; Kenny, F. Identifying historic river ice breakup timing using MODIS and Google Earth Engine in support of operational flood monitoring in Northern Ontario. Remote Sens. Environ. 2019, 224, 352–364. [Google Scholar] [CrossRef]
  18. Liu, Z.; Liu, H.; Luo, C.; Yang, H.; Meng, X.; Ju, Y.; Guo, D. rapid extraction of regional-scale agricultural disasters by the standardized monitoring model based on Google Earth engine. Sustainability 2020, 12, 6497. [Google Scholar] [CrossRef]
  19. Scheip, C.M.; Wegmann, K.W. HazMapper: A global open-source natural hazard mapping application in Google Earth Engine. Nat. Hazards Earth Syst. Sci. 2021, 21, 1495–1511. [Google Scholar] [CrossRef]
  20. Tamiminia, H.; Salehi, B.; Mahdianpari, M.; Quackenbush, L.; Adeli, S.; Brisco, B. Google Earth Engine for geo-big data ap-plications: A meta-analysis and systematic review. ISPRS J. of Photogramm. 2020, 164, 152–170. [Google Scholar] [CrossRef]
  21. Xie, Z.; Phinn, S.R.; Game, E.T.; Pannell, D.J.; Hobbs, R.J.; Briggs, P.R.; McDonald-Madden, E. Using Landsat observations (1988–2017) and Google Earth Engine to detect vegetation cover changes in rangelands—A first step towards identifying degraded lands for conservation. Remote Sens. Environ. 2019, 232, 111317. [Google Scholar] [CrossRef]
  22. Brovelli, M.A.; Sun, Y.; Yordanov, V. Monitoring forest change in the Amazon using multi-temporal remote sensing data and machine learning classification on Google Earth engine. ISPRS Int. J. Geo-Inform. 2020, 9, 580. [Google Scholar] [CrossRef]
  23. Yang, X.; Chen, Y.; Wang, J. Combined use of Sentinel-2 and Landsat 8 to monitor water surface area dynamics using Google Earth engine. Remote Sens. Lett. 2020, 11, 687–696. [Google Scholar] [CrossRef]
  24. Weekley, D.; Li, X. Tracking multidecadal lake water dynamics with landsat imagery and topography/bathymetry. Water Resour. Res. 2019, 55, 8350–8367. [Google Scholar] [CrossRef]
  25. Luo, C.; Liu, H.-J.; Lu, L.-P.; Liu, Z.-R.; Kong, F.-C.; Zhang, X.-L. Monthly composites from Sentinel-1 and Sentinel-2 images for regional major crop mapping with Google Earth Engine. J. Integr. Agric. 2021, 20, 1944–1957. [Google Scholar] [CrossRef]
  26. Dong, J.; Xiao, X.; Menarguez, M.A.; Zhang, G.; Qin, Y.; Thau, D.; Biradar, C.; Moore, B., III. Mapping paddy rice planting area in northeastern Asia with Landsat 8 images, phenology-based algorithm and Google Earth Engine. Remote Sens. Environ. 2016, 185, 142–154. [Google Scholar] [CrossRef] [Green Version]
  27. Zeng, H.; Wu, B.; Wang, S.; Musakwa, W.; Tian, F.; Mashimbye, Z.E.; Poona, N.; Syndey, M. A synthesizing land-cover classification method based on Google Earth engine: A case study in Nzhelele and Levhuvu Catchments, South Africa. Chin. Geogr. Sci. 2020, 30, 397–409. [Google Scholar] [CrossRef]
  28. Zhang, D.-D.; Zhang, L. Land cover change in the central region of the Lower Yangtze river based on landsat imagery and the Google Earth engine: A case study in Nanjing, China. Sensors 2020, 20, 2091. [Google Scholar] [CrossRef] [PubMed] [Green Version]
  29. Zhang, J.; Yu, L.; Li, X.; Zhang, C.; Shi, T.; Wu, X.; Yang, C.; Gao, W.; Li, Q.; Wu, G. Exploring annual urban expansions in the Guangdong-Hong Kong-Macau Greater Bay area: Spatiotemporal features and driving factors in 1986–2017. Remote Sens. 2020, 12, 2615. [Google Scholar] [CrossRef]
  30. Shatnawi, N.; Weidner, U.; Hinz, S. Monitoring urban expansion as a result of refugee fluxes in north jordan using remote sensing techniques. J. Urban. Plan. Dev. 2020, 146, 04020026. [Google Scholar] [CrossRef]
  31. Cao, W.; Zhou, Y.; Li, R.; Li, X.; Zhang, H. Monitoring long-term annual urban expansion (1986–2017) in the largest archipelago of China. Sci. Total Environ. 2021, 776, 146015. [Google Scholar] [CrossRef]
  32. Datong City Statistics Bureau; National Bureau of Statistics Datong Investigation Team. Datong Statistical Yearbook (2018); China Statistic Press: Beijing, China, 2018.
  33. Chen, J.; Chen, J.; Liao, A.P.; Cao, X.; Chen, L.J.; Chen, X.H.; Peng, S.; Han, G.; Zhang, H.W.; He, C.Y.; et al. Concepts and key techniques for 30m globale land cover mapping. Acta Geod. Cartogr. Sin. 2014, 43, 551–557. (In Chinese) [Google Scholar]
  34. Breiman, L.; Friedman, J.; Stone, C.J.; Olshen, R.A. Classification and Regression Trees; Chapman and Hall: New York, NY, USA, 1984. [Google Scholar]
  35. Wei, S. Mapping cropland abandonment in mountainous areas using an annual land-use trajectory approach. Sustainability 2019, 11, 5951. [Google Scholar]
  36. Sang, X.; Guo, Q.; Wu, X.; Fu, Y.; Xie, T.; He, C.; Zang, J. Intensity and stationarity analysis of land use change based on CART algorithm. Sci. Rep. 2019, 9, 12279. [Google Scholar] [CrossRef] [Green Version]
  37. Hu, Y.F.; Shang, L.J.; Zhang, Q.L.; Wang, Z.H. Land change patterns and driving mechanism in Beijing Since 1990 based on GEE platform. Remote Sens. Technol. Appl. 2018, 33, 573–583. (In Chinese) [Google Scholar]
  38. Zha, Y.; Gao, J.; Ni, S. Use of normalized difference built-up index in automatically mapping urban areas from TM imagery. Int. J. Remote Sens. 2003, 24, 583–594. [Google Scholar] [CrossRef]
  39. Landis, J.R.; Koch, G.G. The measurement of observer agreement for categorical data. Biometrics 1977, 33, 159–174. [Google Scholar] [CrossRef] [PubMed] [Green Version]
  40. Li, Z.L.; Kuang, W.H.; Zhang, S. Remote sensing monitoring and spatiotemporal pattern of land use/cover change in built-up area of Tianjin in the past 70 years. Remote Sens. Technol. Appl. 2020, 35, 527–536. (In Chinese) [Google Scholar]
  41. Li, S.; He, Y.; Xu, H.; Zhu, C.; Dong, B.; Lin, Y.; Si, B.; Deng, J.; Wang, K. Impacts of urban expansion forms on ecosystem services in urban agglomerations: A case study of Shanghai-Hangzhou Bay urban agglomeration. Remote Sens. 2021, 13, 1908. [Google Scholar] [CrossRef]
  42. Wang, H.; Zhang, B.; Liu, Y.; Liu, Y.; Xu, S.; Zhao, Y.; Chen, Y.; Hong, S. Urban expansion patterns and their driving forces based on the center of gravity-GTWR model: A case study of the Beijing-Tianjin-Hebei urban agglomeration. J. Geogr. Sci. 2020, 30, 297–318. [Google Scholar] [CrossRef]
  43. Moran, P.A.P. Notes on continuous stochastic phenomena. Biometrika 1950, 37, 17–23. [Google Scholar] [CrossRef]
  44. Pan, P.; Sun, Y.; Ouyang, X.; Zang, H.; Rao, J.; Ning, J. Factors affecting spatial variation in vegetation carbon density in Pinus massoniana Lamb. Forest in Subtropical China. Forests 2019, 10, 880. [Google Scholar] [CrossRef] [Green Version]
  45. Anselin, L. Local indicators of spatial association—LISA. Geogr. Anal. 1995, 27, 93–115. [Google Scholar] [CrossRef]
  46. Ha, K.; Ding, Q.L.; Men, M.X.; Xu, H. Spatial distribution of land use and its relationship with terrain factors in hilly area. Geogr. Res. 2015, 34, 909–921. (In Chinese) [Google Scholar]
  47. Zhao, M.; Cheng, W.; Liu, Q.; Wang, N. Spatiotemporal measurement of urbanization levels based on multiscale units: A case study of the Bohai Rim Region in China. J. Geogr. Sci. 2016, 26, 531–548. [Google Scholar] [CrossRef] [Green Version]
  48. Luan, W.; Li, X. Rapid urbanization and its driving mechanism in the Pan-Third Pole region. Sci. Total Environ. 2021, 750, 141270. [Google Scholar] [CrossRef]
  49. Tian, L.; Li, Y.; Yan, Y.; Wang, B. Measuring urban sprawl and exploring the role planning plays: A shanghai case study. Land Use Policy 2017, 67, 426–435. [Google Scholar] [CrossRef]
  50. Central People’s Government of the People’s Republic of China. Available online: http://www.gov.cn/zhengce/con-tent/2008-03/28/content_5507.htm (accessed on 16 July 2021). (In Chinese)
  51. Pan, H. Preparations for the protection and restoration of the ancient city. Datong Daily, 23 May 2008. (In Chinese) [Google Scholar]
  52. Wang, Y. The city plans to transform 74 old residential areas in urban areas this year. Datong Daily, 15 March 2016. (In Chinese) [Google Scholar]
  53. Li, C.; Sun, T.; Zhai, L.; Yuan, K. City profile: Datong, China. Environ. Urban. ASIA 2019, 10, 176–192. [Google Scholar] [CrossRef]
  54. Yang, Q. RS and GIS-based urban expansion in Nantong area, China: Pattern, characteristic and dring force variance. Remote Sens. Technol. Appl. 2011, 26, 365–374. (In Chinese) [Google Scholar]
Figure 1. Study area: (a) Location of Shanxi Province; (b) Location of Datong and the study area; (c) The four urban districts within the study. Data source: DEM: http://www.gscloud.cn (accessed on 1 September 2021). Base map: http://bzdt.ch.mnr.gov.cn (accessed on 1 September 2021).
Remotesensing 13 04045 g001
Figure 2. Framework of the study: (a) Datasets; (b) Construction land extraction on the GEE platform; (c) Spatio-temporal analysis; (d) Driving factors analysis.
Remotesensing 13 04045 g002
Figure 3. Distribution of construction land during 2000–2018: (a) 2000; (b) 2001; (c) 2002; (d) 2003; (e) 2004; (f) 2005; (g) 2006; (h) 2007; (i) 2008; (j) 2009; (k) 2010; (l) 2011; (m) 2013; (n) 2014; (o) 2015; (p) 2016; (q) 2017; (r) 2018.
Remotesensing 13 04045 g003
Figure 4. Changes in the area of construction land from 2000 to 2018.
Remotesensing 13 04045 g004
Figure 5. Directions of construction land expansion during 2000–2018.
Remotesensing 13 04045 g005
Figure 6. The migration process of the centroid of construction land during 2000–2018.
Remotesensing 13 04045 g006
Figure 7. Local spatial clusters: (a) 2000–2003; (b) 2003–2006; (c) 2006–2010; (d) 2010–2014; (e) 2014–2018.
Remotesensing 13 04045 g007
Table 1. Data source and classification accuracy.
YearData TypeData IDOverall Accuracy (%)Kappa
2000Landsat 5 TOALT05_125032_2000050695.49%0.89
2001Landsat 5 TOALT05_125032_2001110194.29%0.70
2002Landsat 5 TOALT05_125032_2002090197.62%0.89
2003Landsat 5 TOALT05_125032_2003081997.30%0.86
2004Landsat 5 TOALT05_125032_2004080595.62%0.79
2005Landsat 5 TOALT05_125032_2005092593.36%0.68
2006Landsat 5 TOALT05_125032_2006082796.31%0.78
2007Landsat 5 TOALT05_125032_2007091596.67%0.81
2008Landsat 5 TOALT05_125032_2008090196.68%0.80
2009Landsat 5 TOALT05_125032_2009092096.51%0.77
2010Landsat 5 TOALT05_125032_2010070596.57%0.79
2011Landsat 5 TOALT05_125032_2011052197.37%0.81
2013Landsat 8 TOALC08_125032_2013062796.48%0.74
2014Landsat 8 TOALC08_125032_2014091897.00%0.82
2015Landsat 8 TOALC08_125032_2015080496.07%0.77
2016Landsat 8 TOALC08_125032_2016102597.33%0.82
2017Landsat 8 TOALC08_125032_2017082596.66%0.83
2018Landsat 8 TOALC08_125032_2018103195.96%0.79
Table 2. Values of UGI (km2/year).
2000–20032003–20062006–20102010–20142014–2018
Chengqu1.000.47−0.400.780.62
Mining Area1.35−0.471.650.020.61
Nanjiao6.665.302.135.017.69
Xinrong0.64−0.251.330.11−0.05
Study Area9.665.054.715.928.88
Table 3. Values of UDI (%).
200020032006201020142018
Chengqu65.3671.6274.5571.1877.6682.84
Mining Area32.3041.3338.1752.8353.0158.46
Nanjiao4.336.378.008.8710.9314.07
Xinrong0.390.580.511.041.081.06
Study Area4.455.856.587.498.6310.35
Table 4. Values of Moran’s I of construction land during 2000–2018.
200020032006201020142018
Value of Moran’s I0.99610.82200.83340.81390.86780.8656
p-value0.000.000.000.000.000.00
Publisher’s Note: MDPI stays neutral with regard to jurisdictional claims in published maps and institutional affiliations.

