Abstract
To proactively respond to changes in droughts, technologies are needed to properly diagnose and predict the magnitude of droughts. Drought monitoring using satellite data is essential when local hydrogeological information is not available. The characteristics of meteorological, agricultural, and hydrological droughts can be monitored with an accurate spatial resolution. In this study, a remote sensing-based integrated drought index was extracted from 849 sub-basins in Korea’s five major river basins using multi-sensor collaborative approaches and multivariate dimensional reduction models that were calculated using monthly satellite data from 2001 to 2019. Droughts that occurred in 2001 and 2014, which are representative years of severe drought since the 2000s, were evaluated using the integrated drought index. The Bayesian principal component analysis (BPCA)-based integrated drought index proposed in this study was analyzed to reflect the timing, severity, and evolutionary pattern of meteorological, agricultural, and hydrological droughts, thereby enabling a comprehensive delivery of drought information.
1. Introduction
Droughts, along with floods, are some of the most common and inevitable natural disasters faced by human beings [1,2,3,4]. Therefore, many researchers have been trying to monitor and predict droughts accurately, and the development of drought monitoring techniques based on satellite remote sensing (RS) data (as a representative method) has garnered special interest in recent years [4,5,6,7,8,9]. The onset and magnitude of drought in the region is still a challenge for researchers because of a lack of ground meteorological observatories [4]. However, satellite-based RS data partially solve the problem by providing information in a fast and cost-effective way. The advantage of RS-based monitoring using satellite data is that it is possible to monitor droughts in large areas and ungauged basins, and we can utilize multiple satellite imagery data to have accurate results; therefore, monitoring drought by using satellites has proven to be an efficient and reliable tool [6,10,11,12,13].
There are four kinds of droughts in the academic sense: meteorological, agricultural, hydrological droughts, and their socioeconomic impacts [2,14,15,16]. A meteorological drought is caused by a deficit through the shortage of rainfall and is mainly a short-term drought event [6]. An agricultural drought is determined based on the vitality of vegetation and the pattern of quantitative changes in soil moisture; it indicates short or medium-term drought situations [6,13]. A hydrological drought is commonly a mid or long-term drought condition; this drought identification is made based on a shortage of water resources required by human-environmental systems, such as river discharge, efficient water levels of dams, and reservoir storage [17]. A socioeconomic drought consists of a wide range that takes meteorological, agricultural, and hydrological droughts into account and is characterized by the temporal and spatial processes of water demand and supply [18].
A variety of drought indicators that help prevent disasters and reduce and allocate water resources have been developed to quantify different drought conditions, such as severity, duration, and frequency [3,5,17,19,20,21,22,23,24,25]. The standardized precipitation index (SPI; [19]) and the Palmer drought severity index (PDSI; [26]) are the most commonly used meteorological drought indices. The SPI standardization concept was also applied to other drought indices, such as the standardized runoff index (SRI; [20]) and standardized soil moisture index (SSI [22]).
Because RS technology provides an alternative approach for analyzing drought events across a wide range of regions, many studies have introduced RS-based drought indices [5,7,23,24,27]. Zhang and Jia [27] proposed the microwave integrated drought index (MIDI) to monitor meteorological drought over semi-arid regions and the continental United States of America. Cunha et al. [23] calculated the normalized differences vegetation index (NDVI) and land surface temperature (LST) data to monitor the effects of drought on vegetation in real-time. Sur et al. [24] analyzed Korea’s drought conditions through a comparative analysis of the existing drought indices (SPI and PDSI) based on a satellite image-based drought index from 2004 to 2013. It was confirmed that the results of the evaporative stress index (ESI), and the energy-based water definition index (EWDI) showed high applicability for severe drought situations since 2010. Cong et al. [5] selected three widely used satellite drought indices as indicators suitable for drought monitoring in northeastern China and investigated the spatiotemporal patterns and trends of rainfall and drought; the indices were normalized monthly precipitation anomaly percentage (NPA), vegetation health index (VHI), and normalized vegetation supply water index (NVSWI). Zhang et al. [28] combined the global land data assimilation system version 2 (GLDAS-2) soil moisture data and NDVI with crop phenology data and assessed drought evolution and crop growth. Sur et al. [7] developed a new agricultural drought index called the agricultural dry condition index (ADCI) by combining various hydrometeorological variables and verified the applicability of the ADCI on the yield of paddy and arable crops in Korea.
Through the review of previous studies, we can assume that information can be integrated from multi-sensor satellite data and multivariate analyses to effectively achieve comprehensive drought assessment goals. In addition to providing information based on different drought conditions (meteorological, agricultural, and hydrological), it is necessary to develop and apply an integrated drought index that considers complex factors that can provide comprehensive information about droughts and the required proactive response to drought situations. Inspired by this idea, our study seeks to diagnose complex droughts by using multi-sensor collaborative approaches and multivariate dimensional reduction models. In this study, we proposed an integrated drought assessment method to comprehensively convey drought information to the public and conducted statistical simulations to determine spatial sensitivity to various types of droughts to provide tailored information on local drought responses in a changing climate.
2. Materials and Methods
2.1. Multi-Sensor Drought Indices
2.1.1. Standardized Precipitation Index (SPI)
The SPI is a drought index developed with the idea that it is initiated by a decrease in precipitation, thereby causing water shortage (compared to the relative water demand). In other words, it was developed from the above assumption that decreased precipitation has different effects on groundwater, reservoir storage, soil moisture, and river runoff. The SPI is an efficient way to calculate the impact of individual water sources on droughts by setting time units accumulated over a given period of time (over 1, 3, 6, and 12 months), and calculating the drought index by using the amount of precipitation on a time basis [19,28]. The SPI is also recommended by the World Meteorological Organization (WMO) for tracking meteorological droughts [21,25].
2.1.2. Agricultural Dry Condition Index (ADCI)
The ADCI is an agricultural drought index that takes into account the vegetation conditions, soil moisture, and LST of the affected region. First, the vegetation condition index (VCI) is applied for vegetation analysis. Sur et al. [7] proposed the ADCI as a new agricultural drought index, which is a combination of the three indices mentioned above (SMSI, VCI, and TCI). The cause of the agricultural drought was developed based on the concept of reducing the vitality of vegetation due to the lack of soil moisture and overheating of the surface temperature caused by high temperatures, developing into agricultural drought as this phenomenon continues. The ADCI can be calculated by using the Equation (1) given below:
The VCI is a suitable index for agricultural drought monitoring, such as temporal and spatial vegetation changes and the onset and intensity of drought [29,30]. Kogan [29] developed the VCI, which was standardized using the maximum and minimum values of the NDVI developed based on the notion that droughts do not provide normal water supply to plants (Equation (2)).
where and represent the minimum and maximum values of NDVI for the entire period of the pixel. The following is the LST-related index, called the temperature condition index (TCI), which is an index developed by Kogan [29] based on the fact that LST affects the stress of vegetation and is one of the drought factors that affect soil moisture. The TCI is a standard LST that uses the maximum and minimum LST values and as shown in the following equation (Equation (3)).
Finally, soil moisture needs to be considered for determining the ADCI. The soil moisture saturation index (SMSI) assumes that soil moisture is directly proportional to thermal inertia (TI). One of TI’s simple approximations is the apparent thermal inertia (ATI), which can be derived in Equation (4); note that we assume that the solar energy is uniform.
where is the land surface albedo and and are the surface temperatures during day and night, respectively. The SMSI can be calculated using the ATI, as shown in the following equation (Equation (5)).
2.1.3. Water Budget-Based Drought Index (WBDI)
The water budget-based drought index (WBDI), which was proposed by Sur et al. [18], was developed by adopting the water balance perspective and by using precipitation and evaporation as input variables. The evaporation of water balance is caused primarily by changing the state of water, which is achieved by changing the temperature [31]. The WBDI is defined as the difference between precipitation and evaporation as surface runoff and sub-surface runoff in the water budget equation, as given below (Equation (6)):
where P is the precipitation (mm), E is actual evaporation (mm), dS is soil moisture change (mm), and R is the potential runoff (mm). The above results are treated as possible runoff in the basin and expressed in an index, as given below (Equation (6)):
where z denotes the standardization. Instead of monitoring the current precipitation and drought conditions through evaporation, the WBDI, estimated by using the water balance formula, defines a hydrological drought through potential (near future) runoff, thereby adopting a short-term prognosis approach.
2.2. Study Area and Remote Sensing Data
In this study, we used the moderate resolution imaging spectroradiometer (MODIS), precipitation estimation from remotely sensed information using an artificial neural network climate data record (PERSIANN-CDR), and global precipitation measurement (GPM) integrated multi-satellite retrievals for GPM (GPM IMERG) to calculate various drought indices. Through the MODIS satellite, the LST (MOD11A1), NDVI (MOD13A3), actual evapotranspiration (AET; MOD16A2), and albedo (MCD43B2) data from 2001 to 2019 were collected (Table 1). To obtain the precipitation data, we used the PERSIANN-CDR data from 1983 to 1997 that was generated by the center for hydrometeorology and remote sensing (CHRS) at the University of California in Irvine; the data were obtained before the tropical rainfall measuring mission (TRMM). The TRMM data from 1998 were utilized, and among many data, the gridded TRMM3B42 data were collected until 2014 (at the end of TRMM’s life), which was provided by the National Aeronautics and Space Administration (NASA) [32]. Following 2014, we used data from GPM IMERG that obtained data until 2019 to calculate the meteorological drought index [33]. Among the GPM IMERG data, the data after the last four months of the calibration were used to enhance the reliability of the precipitation data. Due to the different spatial and time resolutions of the collected data, the spatial resolution was set at 1 × 1 km and the time resolution was considered to be monthly, which is consistently reprocessed. The main areas of this study were the five major rivers of the Korean Peninsula, and we analyzed 849 sub-basins (Figure 1).

Table 1.
Remote sensing (RS) data used in this study.
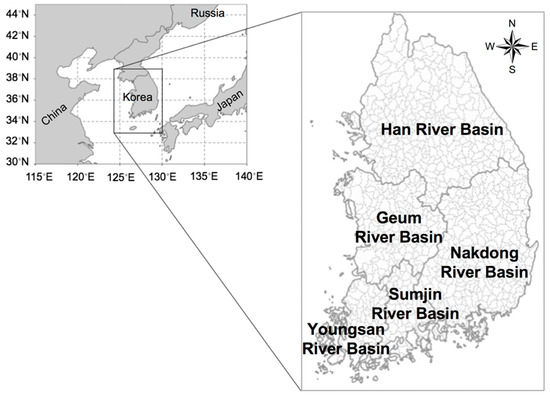
Figure 1.
Geographical location of the five major river basins and the 849 sub-basins in Korea.
2.3. Integrated Drought Monitoring with Multi-Sensor Based Statistical Simulations
The types of RS data, mainly used for drought monitoring, depend on the type of satellite used; however, data such as precipitation, vegetation, surface temperature, soil moisture, and evaporation are mostly used. The data can be used individually. However, drought phenomena may not be sufficient for drought analysis based on a single indicator because it is related to a number of variables [34]. However, it may be more useful to combine information in the form of an appropriate drought index for more accurate monitoring of complex drought phenomena.
Hao and AghKouchak [23,34] proposed the multivariate standardized drought index (MSDI) based on a copula distribution or nonparametric joint distribution for a bivariate model of precipitation and soil moisture. However, with recent advances in technology, the size and complexity of data tend to increase. Such complexity makes it difficult to detect the dependence between the response variable and covariates because of the enormous number of available covariates [35]. To resolve these problems, an approach to reducing the number of covariates (through dimension reduction) is being used. Principal component analysis (PCA) is a tool that is commonly used for dimension reduction [36] and is a feature transformation method that directly transforms the variables (in dimension reduction methods) without losing much of the data’s inherent attribution information. In this study, for the three different multi-variables acquired from the satellite data, an integrated drought index is calculated through the application of the Bayesian PCA (BPCA; [37,38]) and intentionally biased bootstrap (IBB; [39]) simulation for characterizing three aspects of meteorological (using SPI), agricultural (using ADCI), and hydrological (using WBDI) droughts. The BPCA approach can estimate the intrinsic dimensionality of the multi-dimensional dataset with missing data, which is suitable for application to satellite data, and has been evaluated as an accurate and robust model [37,38,40]. The BPCA analysis is performed by using the following three procedures: principal component (PC) regression, Bayesian estimation, and an expectation-maximization (EM)-like repetitive algorithm [38].
The IBB applied for statistical simulation of drought indices is a kind of weighted bootstrap that follows constraints that are designed to select resampling probabilities and conditionally applied to data; this helps to improve the statistical performance and minimizes the distance of weighted distributions [39,41]. This study employed the IBB to evaluate regional drought changes in meteorological (SPI), agricultural (ADCI), and hydrological (WBDI) droughts and analyzed the relative sensitivity of each drought index to the RS-based integrated drought index (RSIDI) calculated by using the BPCA (Figure 2). The IBB applied in this study is described as follows.
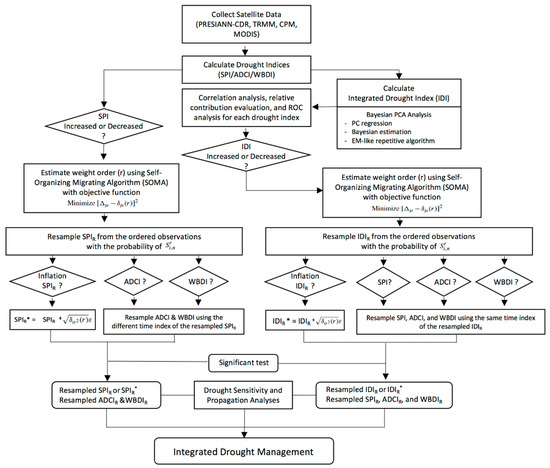
Figure 2.
Procedure of intentionally biased bootstrap (IBB) analysis for integrated drought management.
The IBB simulation re-samples the observations Xi to n replacement (e.g., bootstrapping) by intentionally increasing or decreasing the data by as much as δμ. The data Xi are increasingly ordered by assigning different weights Wi,n according to the magnitudes of the observations, as given below:
where i = 1, 2, 3, …, n, and the data matrix is rearranged in the same order as the ordered Xi. The assigned weight Wi,n represents the probability of selection for Xi data in the IBB simulation. The intentional change of increase or decrease (δμ) can be calculated as given in Equation (9).
Equation (9) can be generalized with a weight order (r) as Equation (11).
The selection of the weight order (r) can be performed by using the self-organizing migrating algorithm (SOMA; [42]) with the following objective function (Equation (12)):
Note that if r < 0, then δμ(r) < 0, which implies a drier state, and if r > 0, then δμ(r) > 0, which implies a wetter state. When r < 0, lower values indicating the dry state are resampled more frequently than higher values indicating the humid state, causing δμ(r) to decrease. In addition, to objectively determine the accuracy of drought monitoring using three satellite-based drought indices, this study conducted a receiver operation characteristics (ROC) analysis. The ROC analysis was performed to evaluate the validity of the RSIDI calculations using the three drought indices (SPI, ADCI, and WBDI). The range of drought indices used in this study is given in Table 2.

Table 2.
Range of the drought indices used in this study.
3. Results
In this study, the RSIDI was extracted for 849 sub-basins over the five major Korean river basins using a BPCA-based combination model for the three drought indices for 2001–2019. As a result of the evaluation of the proportion of variation (POV) of the three drought indices by region, the BPCA-based RSIDI explained the average POV (68.9%) of the 849 sub-basins (Han River basin: 68.1%, Nakdong River basin: 68.7%, Geum River basin: 71.3%, Youngsang River basin: 71.7%, and Sumjin River basin: 71.0%), showing a high POV, especially in the southern part of the country. In addition, the calculated RSIDI showed a relatively high correlation with SPI (median: 0.96) and WBDI (median: 0.96). In the case of the ADCI (maximum: 0.91, median: 0.53), the correlation with RSIDI was broad in the region and showed a relatively weak correlation in some areas of the Han and Nadkong River basins; however, on an average, the correlation was 0.53 (p-value < 0.001) in 849 sub-basins, indicating that the RSIDI can provide robust and comprehensive integrated drought information by maintaining the inherent characteristics of the three drought indices (Figure 3). By resolving the system equations for each drought index, it has been shown that the relative contribution of the RSIDI to each time-series can be assessed. Figure 4 illustrates the relative contribution of each drought index to the Gojicheon stream (#10011) of the Han River basin.
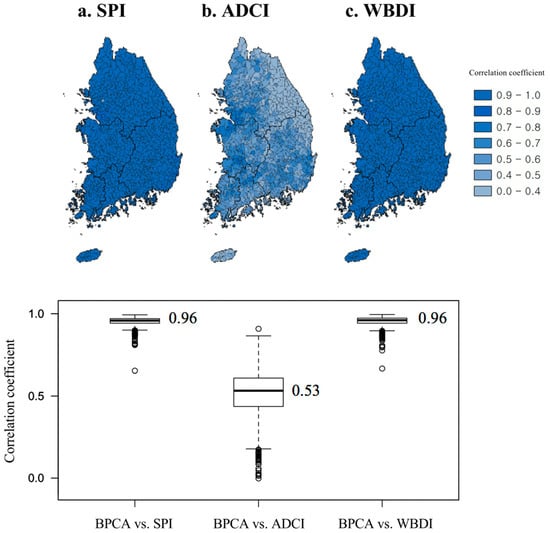
Figure 3.
Results of correlation analysis with RS-based integrated drought index (RSIDI) through Bayesian PCA (BPCA); (a) SPI (standardized precipitation index), (b) ADCI (agricultural dry condition index), and (c) WBDI (water budget-based drought index). The lower panel in the figure results from the analysis of the correlation of 849 sub-basins summarized in the boxplot and is illustrated by each applied drought index namely, SPI, ADCI, and WBDI.
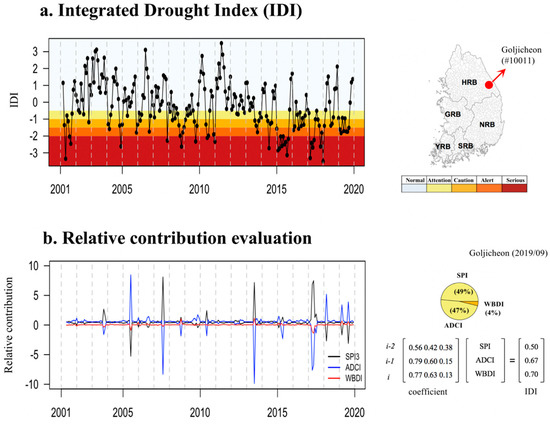
Figure 4.
Time series of integrated drought index (IDI) for 2001–2019 in the Gojicheon stream in the Han River basin. (a) IDI index and (b) relative contribution evaluation.
In the following section, the droughts in 2001 and 2014, which are the representative severe drought years of severe droughts that have occurred since the 2000s, were assessed using the RSIDI produced by multi-sensor satellite data and multivariate analysis. The application of integrated drought monitoring based on satellite data was evaluated through spatial-temporal variability analysis between the RSIDI and other drought indices using the ROC analysis to test the accuracy of the models. In addition, the onset, intensity, and evolution patterns of droughts were compared to each drought index, and the applicability of the RSIDI was evaluated through an IBB simulation.
3.1. Drought Impact Assessment and Drought Monitoring
The RSIDI was evaluated for the 2001 drought (Figure 5 and Figure 6). The severe spring drought in 2001 began in the fall of 2000 and lasted until the spring of 2001. In spring, when the agricultural water demand was the highest due to the rice planting, the supply of agricultural water was insufficient, causing serious agricultural damages. In most parts of the Korean Peninsula, less than 50% of the average annual rainfall was recorded, and in some areas, only 10 to 30% of the average annual rainfall resulted in the most extensive agricultural drought damage in June [43]. The drought that occurred in 2001 was mostly resolved after more than 150 mm of rainfall since mid-June.
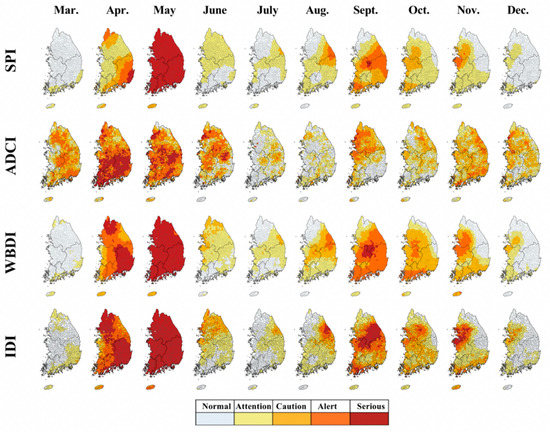
Figure 5.
Spatial change of each drought index: SPI, ADCI, WBDI, and IDI (integrated drought index) for the 2001 drought.
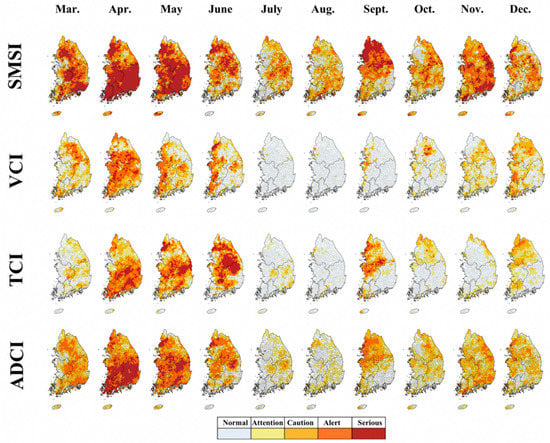
Figure 6.
Spatial change of each drought index: SMSI (soil moisture saturation index), VCI (vegetation condition index), TCI (temperature condition index), and ADCI for the 2001 drought.
The SPI and WBDI illustrate the drought from April to May was a serious event, and the drought centered in the central region since September also appears to be approaching the serious stage (Figure 5). The ROC analysis between the RSIDI and three drought indices also showed that the WBDI had the highest with 0.90, followed by SPI at 0.78, and ADCI at 0.65. For ADCI, the observed indicators showed significant spatial variation compared to the other drought indices, and in the 2000 drought, the effects of changes in the SMSI resulted in a weaker or earlier drought peak than those observed in cases of other drought indices (Figure 6). These features appear to be more sensitive to short-term droughts as the ADCI applied in this study was used only for the surface soil moisture.
Figure 7 and Figure 8 show the results of the evaluation of the 2014 drought. In 2014, a drought occurred around the Han River basin; in the same year, the Gangwon Province had 70% of the average annual rainfall and the Gyeonggi Province area around Seoul had 59%, which was less compared to the previous years’ average annual rainfall. In particular, in 2014, a dry monsoon phenomenon occurred in which a drought that began in spring (due to the El Niño phenomenon) continued to cause no rainfall or a significantly lower amount of rainfall [44]. The rainfall between June 2014 and July 2014 was 48% (compared to the average in the past years), and the national water storage level also dropped significantly to 64% over the previous year. In August, the average water level of multi-purpose dams in Korea was only 36.1%. The droughts lasted until 2015, resulting in less than 70% of the average rainfall, and the hydrological droughts, with reservoirs in many multipurpose dams, reached dangerous levels [45]. Similar to the results of 2001, the RSIDI obtained could effectively describe the time and spatial occurrence patterns of the SPI and the WBDI, while the ADCI was analyzed to have delayed drought due to changes in SMSI. The ROC statistical analysis also confirmed that WBDI was highest and ADCI was relatively low in 2014 (SPI: 0.81, ADCI: 0.61, WBDI: 0.88). Through evaluation of past droughts, the RSIDI explained the three drought characteristics (meteorological, agricultural, and hydrological) well and confirmed the applicability of the integrated drought index through ROC analysis.
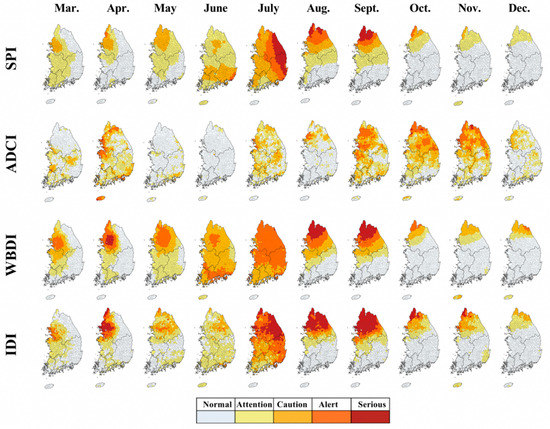
Figure 7.
Spatial change of each drought index: SPI (standardized precipitation index), ADCI (agricultural dry condition index), WBDI (water budget-based drought index), and IDI (integrated drought index) for the 2014 drought.
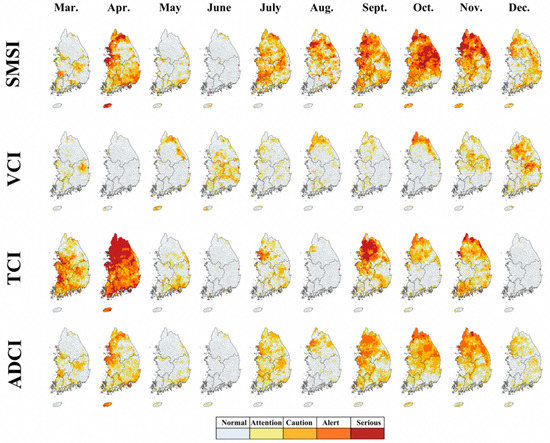
Figure 8.
Spatial change of each drought index: SMSI, VCI, TCI, and ADCI for the 2014 drought.
3.2. Drought Transition Evaluation by Statistical Simulations
This study simulated the impact on the spatiotemporal distribution of different drought conditions, such as agricultural and hydrological perspectives, by altering the intended difference of δμ(r) (Equation (11)) of the meteorological drought index (SPI) 1000 times to represent the changes in SPI. As δμ(r) was intentionally changed, all the sub-basins experienced various changes in their ADCI and WBDI. Figure 9 shows that statistical simulations indicate that the changes in the state of agricultural (ADCI) and hydrological (WBDI) droughts correspond to the changes in meteorological drought (SPI). In addition, the results of the IBB simulation for up to three months of a lagged analysis were shown in Figure 10. Natural disasters, including droughts, are managed in four stages (Attention, Caution, Alert, and Serious) in Korea. In this study, the changes in other drought conditions were identified by intentionally changing the meteorological drought condition by using a IBB simulation.
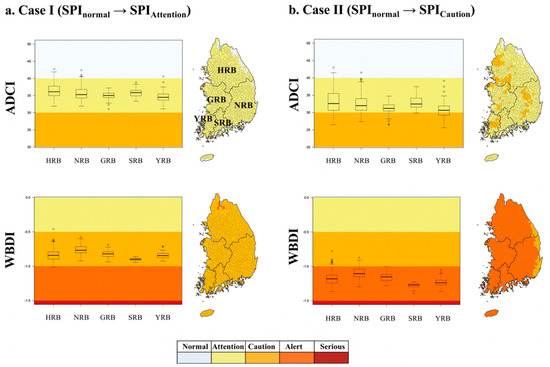
Figure 9.
Drought condition changes in intentionally biased bootstrap (IBB) simulation. (a) Case I (SPInormal → SPIAttention) and (b) Case II (SPInormal → SPICaution). The simulation results for the five basin areas are provided in the boxplot, and the results for the change in drought conditions are indicated in color in the map.
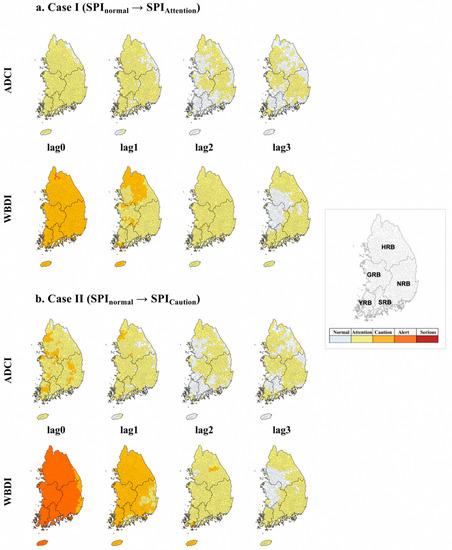
Figure 10.
Drought condition changes in IBB simulation of ADCI and WBDI. (a) Case I (SPInormal → SPIAttention) and (b) Case II (SPInormal → SPICaution). The simulation results for the five basin areas for up to three months are colored in the map.
First, when the meteorological drought (SPI) conditions were simulated from a stage of Normal to a stage of Attention (Figure 9a and Figure 10a), the ADCI conditions, except for some parts of the Han River basin, showed a stage of Attention (96.6%, 820 out of 849 sub-basins). According to the results of the one-month delay, the ADCI status in parts of the Han and Nakdong River basins changed to Normal; however, 77.1% of the entire basin (45.8% of the two-month delay) was still in a stage of Attention. Over time, the ADCI conditions have shifted from a state of Attention to Normal in the southwestern part of the Han, Youngsang River, and Sumjin River basins. Even if the SPI conditions are simulated from the Normal stage to a stage of Attention, the results of the SPI are similar to those of time and space, and there are many sub-basins that are converted to the Normal stage over time. When the meteorological drought (SPI) conditions were simulated from the Normal stage to a stage of Caution (Figure 9b and Figure 10b), excluding the parts of the Han River basin, more than 98.6% showed the ADCI to be in the Attention stage and 15.9% showed a stage of Caution. According to the results of the one-month delay, the ADCI in the northern parts of the Han River was still in a state of Caution; however, 88.5% of the entire basin was in the stage of Attention. Over time, the ADCI conditions shifted from a state of Attention to Normal in the southwestern parts of the Han, Youngsan, and Sumjin River basins. Although the mid-term drought (SPI6) was simulated from a Normal stage to a stage of Attention, changes in the spatiotemporal pattern of the ADCI were similar to the results obtained for SPI3, in which the scope of Attention conditions was reduced, and the number of sub-basins converted to “Normal” over time increased in the southern parts of the country.
For WBDI, when the SPI drought conditions were simulated from Normal to a stage of Attention, the WBDI conditions, excluding the Han River basins, showed a stage of Alert (99.2%, 842 out of 849 sub-basins). As a result of the one-month delay, the WBDI status shifted from 75.7% of the total basin to a state of Attention, but 50.7% of the Han River basin and some areas of the Geum and Youngsan River basins were still in Caution levels. Over time, the WBDI conditions tended to shift from a state of Attention to Normal in the southwestern parts of the Han and Geum River basins. The SPI drought conditions were simulated from Normal to Caution; more than 93.8% of the total basins showed their WBDI in a stage of Caution. Over time, the WBDI status shifted to a Normal state around the southwestern Han and Geum River basins.
When the drought conditions of the RSIDI were simulated from Normal to Attention (Figure 11a), in all three drought indices (SPI, ADCI, and WBDI), the drought conditions shifted to a state of Attention, confirming that the RSIDI expressed the overall drought in space effectively. If drought conditions were simulated from Normal to Caution, the SPI results showed that 78.6% of the total basins were in the same state as drought conditions in the RSIDI. However, we inferred that the Han River basin was relatively insensitive due to its status of Attention. Compared to the drought conditions of the SPI, the drought conditions of the ADCI and WBDI were shown to be mitigated by one level in the Han River and some areas of the Nakdong River, and the spatial conditions changed in the two drought indices (ADCI and WBDI) were similar.
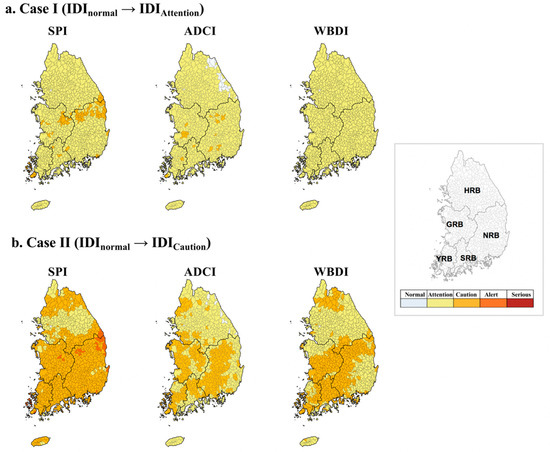
Figure 11.
Drought condition changes in IBB simulation. (a) Case I (IDInormal → IDIAttention) and (b) Case II (IDInormal → IDICaution). The simulation results for the five basin areas for up to three months are colored in the map.
4. Discussion and Conclusions
As climate change accelerates due to global warming, changes in hydrological cycles occur significantly, and water use and prediction of water resources may become difficult. In particular, in Korea, chronic drought has occurred continuously since the 1990s during the transition from winter to spring [46]. To cope with these droughts, technologies to identify and predict the magnitude of spatiotemporal droughts are required. Drought monitoring using satellite data will be essential to secure spatial resolution for accurate and spatial droughts when ground-based hydrometeorological data are not available, as well as monitoring the different characteristics of meteorological, agricultural, and hydrological droughts.
Korea’s drought-related affairs are mainly handled by the Korea Meteorological Administration (KMA), Ministry of Agriculture, Food and Rural Affairs (MAFRA), Ministry of Environment (MOE), Ministry of Land, Infrastructure, and Transport (MOLIT), and the Ministry of Public Safety and Security (MPSS) [47]. The KMA diagnoses precipitation and drought in drought areas by assessing the SPI and PDSI and provides this information to the local governments. The MAFRA analyzes agricultural water through the soil moisture index (SMI), reservoir drought index (RDI), and integrated agricultural drought index. The MOLIT monitors dam water; the MOE monitors emergency water resources and water quality according to the drought stage and implements the appropriate countermeasures. The MPSS oversees the drought situation when it becomes extreme. However, some point out that the current drought measurement indices of different agencies are different in drought management, causing confusion and making it difficult to respond to drought proactively. Different ministries have different standards for determining the degree of drought. Additionally, it is not sufficient for a single drought indicator to characterize all the complex drought evolution processes [22]. The development and application of an integrated drought index are necessary to take into account the complex factors related to water use, such as the meteorological, agricultural, and hydrological perspectives. Thus, this study proposed an RS-based integrated drought index that was extracted from 849 sub-basins in Korea’s five major river basins using multi-sensor collaborative approaches and multivariate dimensional reduction models, calculated through monthly satellite data. Droughts in 2001 and 2014, representative years of severe drought since the 2000s, were evaluated using the integrated drought index, and statistical simulations were used to diagnose the sensitivity and transition of drought. The BPCA-based integrated drought index proposed in this study was analyzed to reflect the timing, severity, and evolutionary pattern of meteorological, agricultural and hydrological droughts, enabling comprehensive delivery of drought information. Although the results relied on limited observations, it is expected that drought hotspot analyses and statistical simulations using IBB and BPCA-based RSIDI will identify the drought characteristics of the sub-basin, thereby promoting their use in preemptive drought response through drought prediction and early warning.
Drought monitoring and accurate drought forecasting are still the main challenges in a relatively changing environment that has a long lead-time and natural and artificial factors. Therefore, future works to improve drought monitoring and prediction require further research, such as high-quality data assimilation, improving model development through major processes related to droughts, selecting or predicting optimal ensembles, and hybrid drought forecasting.
Author Contributions
Conceptualization, Resources, Formal analysis, Writing—original draft, J.-S.K. and S.-Y.P.; Conceptualization, Methodology, Writing—review & editing, J.-H.L.; Writing—review & editing, J.C., S.C. and T.-W.K. All authors have read and agreed to the published version of the manuscript.
Funding
This research was supported by the Korea Environment Industry & Technology Institute (KEITI) through the Water Management Research Program, which is funded by the Korea Ministry of Environment (MOE) (Grant No. 79616). We also appreciate the support of the State Key Laboratory of Water Resources and Hydropower Engineering Science, Wuhan University.
Conflicts of Interest
The authors declare no conflict of interest.
References
- Zarafshani, K.; Sharafi, L.; Azadi, H.; Van Passel, S. Vulnerability Assessment Models to Drought: Toward a Conceptual Framework. Sustainability 2016, 8, 588. [Google Scholar] [CrossRef]
- Kim, J.S.; Seo, G.S.; Jang, H.W.; Lee, J.H. Correlation analysis between Korean spring drought and large-scale teleconnection patterns for drought forecasting. KSCE J. Civ. Eng. 2017, 21, 458–466. [Google Scholar] [CrossRef]
- Yue, Y.; Shen, S.; Wang, Q. Trend and variability in droughts in Northeast China based on the reconnaissance drought index. Water 2018, 10, 318. [Google Scholar] [CrossRef]
- Qaiser, G.; Tariq, S.; Adnan, S.; Latif, M. Evaluation of a composite drought index to identify seasonal drought and its associated atmospheric dynamics in Northern Punjab, Pakistan. J. Arid Environ. 2021, 185, 104332. [Google Scholar] [CrossRef]
- Cong, D.; Zhao, S.; Chen, C.; Duan, Z. Characterization of droughts during 2001–2014 based on remote sensing: A case study of Northeast China. Ecol. Inf. 2017, 39, 56–67. [Google Scholar] [CrossRef]
- Park, S.Y.; Sur, C.; Kim, J.S.; Lee, J.H. Evaluation of multi-sensor satellite data for monitoring different drought impacts. Stoch. Environ. Res. Risk Assess. 2018, 32, 2551–2563. [Google Scholar] [CrossRef]
- Sur, C.; Park, S.Y.; Kim, T.W.; Lee, J.H. Remote sensing-based agricultural drought monitoring using hydrometeorological variables. KSCE J. Civ. Eng. 2019, 23, 5244–5256. [Google Scholar] [CrossRef]
- Abuzar, M.K.; Shafiq, M.; Mahmood, S.A.; Irfan, M.; Khalil, T.; Khubaib, N. Drought risk assessment in the khushab region of Pakistan using satellite remote sensing and geospatial methods. Int. J. Econ. Environ. Geol. 2019, 10, 48–56. [Google Scholar] [CrossRef]
- Zhong, R.; Chen, X.; Lai, C.; Wang, Z.; Lian, Y.; Yu, H.; Wu, X. Drought monitoring utility of satellite-based precipitation products across mainland China. J. Hydrol. 2019, 568, 343–359. [Google Scholar] [CrossRef]
- Carlson, T.N.; Gillies, R.R.; Perry, E.M. A method to make use of thermal infrared temperatureand NDVI measurements to infer surface soil water content and fractional vegetation cover. Remote Sens. Rev. 1994, 9, 161–173. [Google Scholar] [CrossRef]
- Tadesse, T.; Demisse, G.B.; Zaitchik, B.; Dinku, T. Satellite-based hybrid drought monitoring tool for prediction of vegetation condition in Eastern Africa: A case study for Ethiopia. Water Resour. Res. 2014, 50, 2176–2190. [Google Scholar] [CrossRef]
- Enenkel, M.; Steiner, C.; Mistelbauer, T.; Dorigo, W.; Wagner, W.; See, L. A combined satellite-derived drought indicator to support humanitarian aid organizations. Rem. Sens. 2016, 8, 340. [Google Scholar] [CrossRef]
- Wang, J.; Xu, X.; Ding, S.; Zeng, J.; Spurr, R.; Liu, X.; Chance, K.; Mishchenko, M. A numerical testbed for remote sensing of aerosols, and its demonstration for evaluating retrieval synergy from a geostationary satellite constellation of GEO-CAPE and GOES-R. J. Quant. Spectrosc. Radiat. Transfer. 2014, 146, 510–528. [Google Scholar] [CrossRef]
- Wilhite, D.A. Drought Monitoring and Early Warning: Concepts, Progress and Future Challenges; World Meteorological Organization: Geneva, Switzerland, 2006; p. 1006. [Google Scholar]
- Huang, S.; Huang, Q.; Leng, G.; Liu, S. A nonparametric multivariate standardized drought index for characterizing socioeconomic drought: A case study in the Heihe River Basin. J. Hydrol. 2016, 542, 875–883. [Google Scholar] [CrossRef]
- Wu, Z.; Mao, Y.; Li, X.; Lu, G.; Lin, Q.; Xu, H. Exploring spatiotemporal relationships among meteorological, agricultural, and hydrological droughts in Southwest China. Stoch Environ. Res. Risk Assess. 2016, 30, 1033–1044. [Google Scholar] [CrossRef]
- Sur, C.; Park, S.Y.; Kim, J.S.; Lee, J.H. Prognostic and diagnostic assessment of hydrological drought using water and energy budget-based indices. J. Hydrol. 2020, 591, 125549. [Google Scholar] [CrossRef]
- Guo, Y.; Huang, S.; Huang, Q.; Wang, H.; Fang, W.; Yang, Y.; Wang, L. Assessing socioeconomic drought based on an improved multivariate standardized reliability and resilience index. J. Hydrol. 2019, 568, 904–918. [Google Scholar] [CrossRef]
- McKee, T.B.; Doesken, N.J.; Kleist, J. The relationship of drought frequency and duration to time scales. In Proceedings of the 8th Conference on Applied Climatology, Anaheim, CA, USA, 17–22 January 1993; Volume 17, pp. 179–183. [Google Scholar]
- Shukla, S.; Wood, A.W. Use of a standardized runoff index for characterizing hydrologic drought. Geophys. Res. Lett. 2008, 35, 1100. [Google Scholar] [CrossRef]
- Hayes, M.; Svoboda, M.; Wall, N.; Widhalm, M. The Lincoln declaration on drought indices: Universal meteorological drought index recommended. Bull. Am. Meteorol. Soc. 2011, 92, 485–488. [Google Scholar] [CrossRef]
- Hao, Z.; AghaKouchak, A. A nonparametric multivariate multi-index drought monitoring framework. J. Hydrometeor. 2014, 15, 89–101. [Google Scholar] [CrossRef]
- Cunha, A.P.M.; Alvalá, R.C.; Nobre, C.A.; Carvalho, M. A Monitoring vegetative drought dynamics in the Brazilian semiarid region. Agric. Meteorol. 2015, 2014, 494–505. [Google Scholar] [CrossRef]
- Sur, C.; Hur, J.; Kim, K.; Choi, W.; Choi, M. An evaluation of satellite-based drought indices on a regional scale. Int. J. Remote Sens. 2015, 36, 5593–5612. [Google Scholar] [CrossRef]
- Li, J.; Zhou, S.; Hu, R. Hydrological drought class transition using SPI and SRI time series by loglinear regression. Water Resour. Manage. 2016, 30, 669–684. [Google Scholar] [CrossRef]
- Palmer, W. Meteorological Drought, Weather Bureau Research Paper 45; U.S. Weather Bureau: Washington, DC, USA, 1965; p. 58.
- Zhang, A.; Jia, G. Monitoring meteorological drought in semiarid regions using multi-sensor microwave remote sensing data. Remote Sens. Environ. 2013, 134, 12–23. [Google Scholar] [CrossRef]
- Zhang, X.; Chen, N.; Li, J.; Chen, Z.; Niyogi, D. Multi-sensor integrated framework and index for agricultural drought monitoring. Remote Sens. Environ. 2017, 188, 141–163. [Google Scholar] [CrossRef]
- Kogan, F.N. Application of vegetation index and brightness temperature for drought detection. Adv. Space Res. 1995, 15, 91–100. [Google Scholar] [CrossRef]
- Kogan, F.N. Operational space technology for global vegetation assessment. Bull. Am. Meteorol. Soc. 2001, 82, 1949–1964. [Google Scholar] [CrossRef]
- Oki, T.; Kanae, S. Global hydrological cycles and world water resources. Science 2006, 313, 1068–1072. [Google Scholar] [CrossRef]
- Huffman, G.J.; Adler, R.F.; Bolvin, D.T.; Gu, G.; Nelkin, E.J.; Bowman, K.P.; Hong, Y.; Stocker, E.F.; Wolff, D.B. The TRMM Multi-Satellite Precipitation Analysis: Quasi-Global, Multi-Year, Combined-Sensor Precipitation Estimates at Fine Scale. J. Hydrometeor. 2007, 8, 38–55. [Google Scholar] [CrossRef]
- McKee, T.B. Drought monitoring with multiple time scales. In Proceedings of the 9th Conference, Applied Climatology, Dallas, TX, USA, 15–20 January 1995; pp. 233–236. [Google Scholar]
- Hao, Z.; AghaKouchak, A. Multivariate Standarized Drought Index: A prametric multi-index model. Adv. Water Resour. 2013, 57, 12–18. [Google Scholar] [CrossRef]
- Ma, Y.Y.; Zhu, L.P. A Review on Dimension Reduction. Int. Stat. Rev. 2012, 81, 134–150. [Google Scholar] [CrossRef] [PubMed]
- Jolliffe, I.T. Principal Component Analysis, 2nd ed.; Springer Science Business Media: Berlin, Germany, 2002. [Google Scholar]
- Oba, S.; Sato, M.A.; Takemasa, I.; Monden, M.; Matsubara, K.I.; Ishii, S. A Bayesian missing value estimation method for gene expression profile data. Bioinformatics 2003, 19, 2088–2096. [Google Scholar] [CrossRef] [PubMed]
- Lai, W.Y.; Kuok, K.K. A Study on Bayesian Principal Component Analysis for Addressing Missing Rainfall Data. Water Resour. Manag. 2019, 33, 2615–2628. [Google Scholar] [CrossRef]
- Lee, T. Climate change inspector with intentionally biased bootstrapping (CCIIBB ver. 1.0)–methodology development. Geosci. Model. Dev. 2017, 10, 525–536. [Google Scholar] [CrossRef]
- Bouveyron, C.; Latouche, P.; Mattei, P.A. Exact dimensinality selection for Bayesian PCA. Scand. J. Statist. 2020, 47, 196–211. [Google Scholar] [CrossRef]
- Heng, C.; Lee, T.; Kim, J.-S.; Xiong, L. Influence analysis of central and Eastern Pacific El Niños to seasonal rainfall patterns over China using the intentional statistical simulations. Atmos. Res. 2020, 233, 104706. [Google Scholar] [CrossRef]
- Zelinka, I. SOMA—self-organizing migrating algorithm. In New Optimization Techniques in Engineering; Springer: Berlin/Heidelberg, Germany, 2004; pp. 167–217. [Google Scholar]
- Baek, S.G.; Jang, H.W.; Kim, J.S.; Lee, J.H. Agricultural drought monitoring using the satellite-based vegetation index, Korea Water Resources Association. J. Korea Water Resour. Assoc. 2016, 49, 305–314. (In Korean) [Google Scholar] [CrossRef]
- Lee, J.H.; Jang, H.W. Comparison on Characteristics and Historical Drought Events of summer drought in 2014. Korea Disaster Prevention Association. J. Disaster Prev. 2014, 16, 46–56. (In Korean) [Google Scholar]
- Ministry of Land, Infrastructure and Transport (MLIT). 2015 Drought Impact Investigation Report; Korea Ministry of Land, Infrastructure and Transport (MLIT): Sejong City, Korea, 2015. (In Korean) [Google Scholar]
- Bae, H.; Ji, H.; Lim, Y. Characteristics of drought propagation in South Korea: Relationship between meteorological, agricultural, and hydrological droughts. Nat. Hazards. 2019, 99, 1–16. [Google Scholar] [CrossRef]
- Hong, I.P.; Lee, J.H.; Cho, H.S. National drought management framework for drought preparedness in Korea (lessons from the 2014–2015 drought). Water Policy 2016, 18, 89–106. [Google Scholar] [CrossRef]
Publisher’s Note: MDPI stays neutral with regard to jurisdictional claims in published maps and institutional affiliations. |
© 2021 by the authors. Licensee MDPI, Basel, Switzerland. This article is an open access article distributed under the terms and conditions of the Creative Commons Attribution (CC BY) license (http://creativecommons.org/licenses/by/4.0/).