A New Urban Functional Zone-Based Climate Zoning System for Urban Temperature Study


Abstract

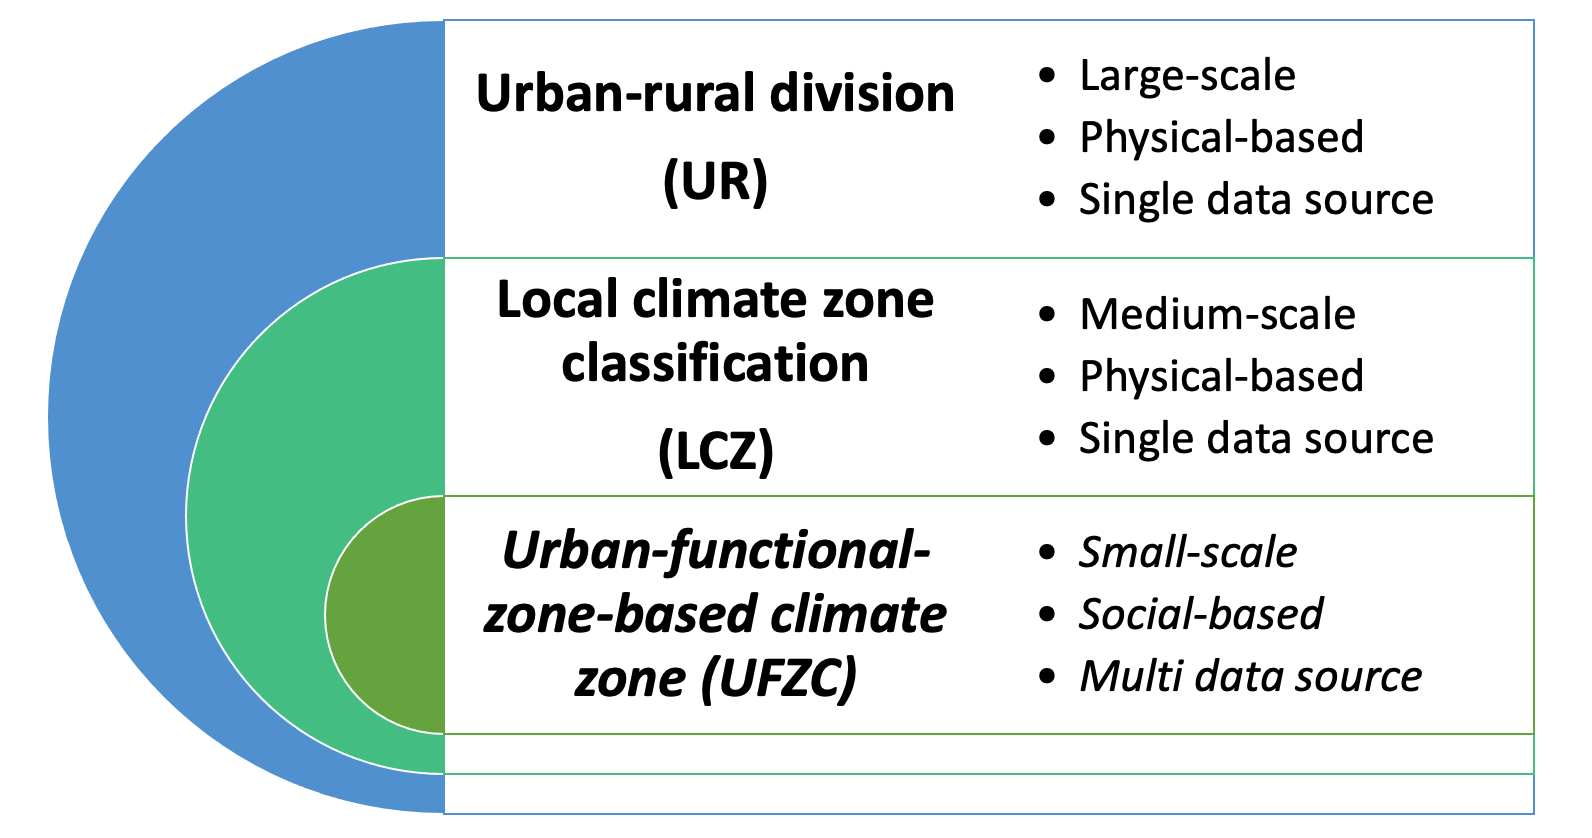
1. Introduction
2. Methodology
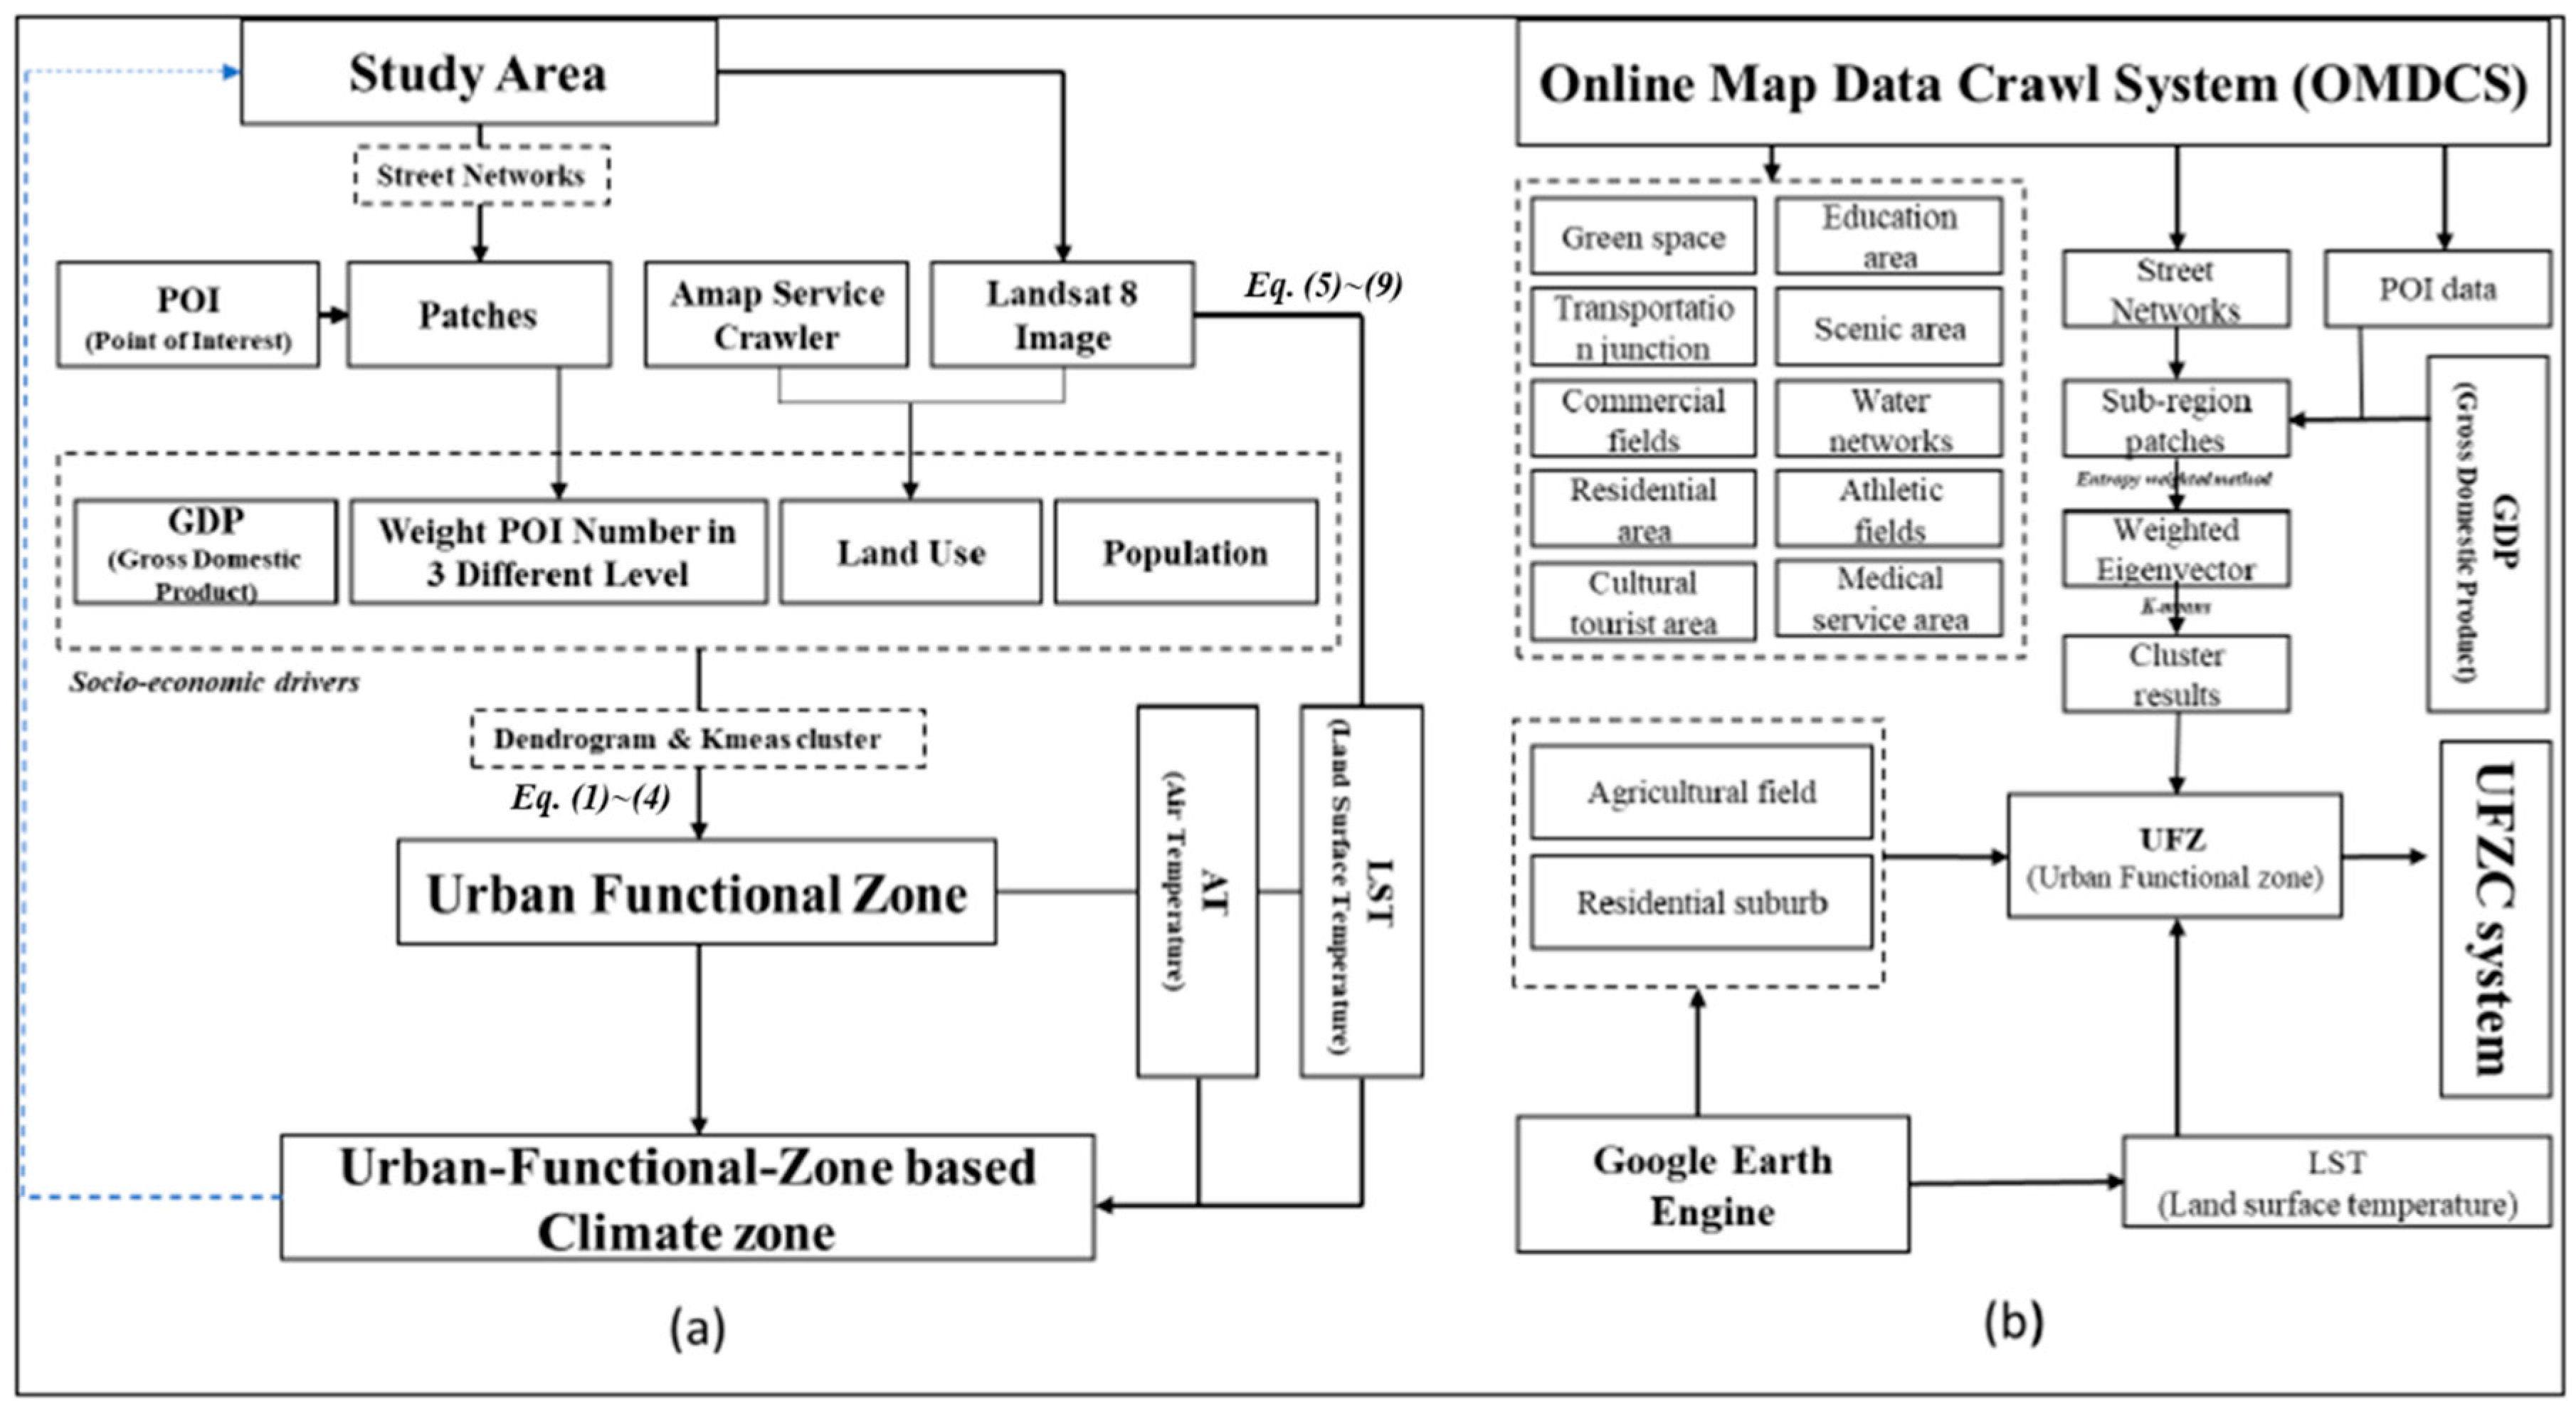
2.1. Identification Framework of Urban Functional Zone-Based Urban Temperature (UFZC)
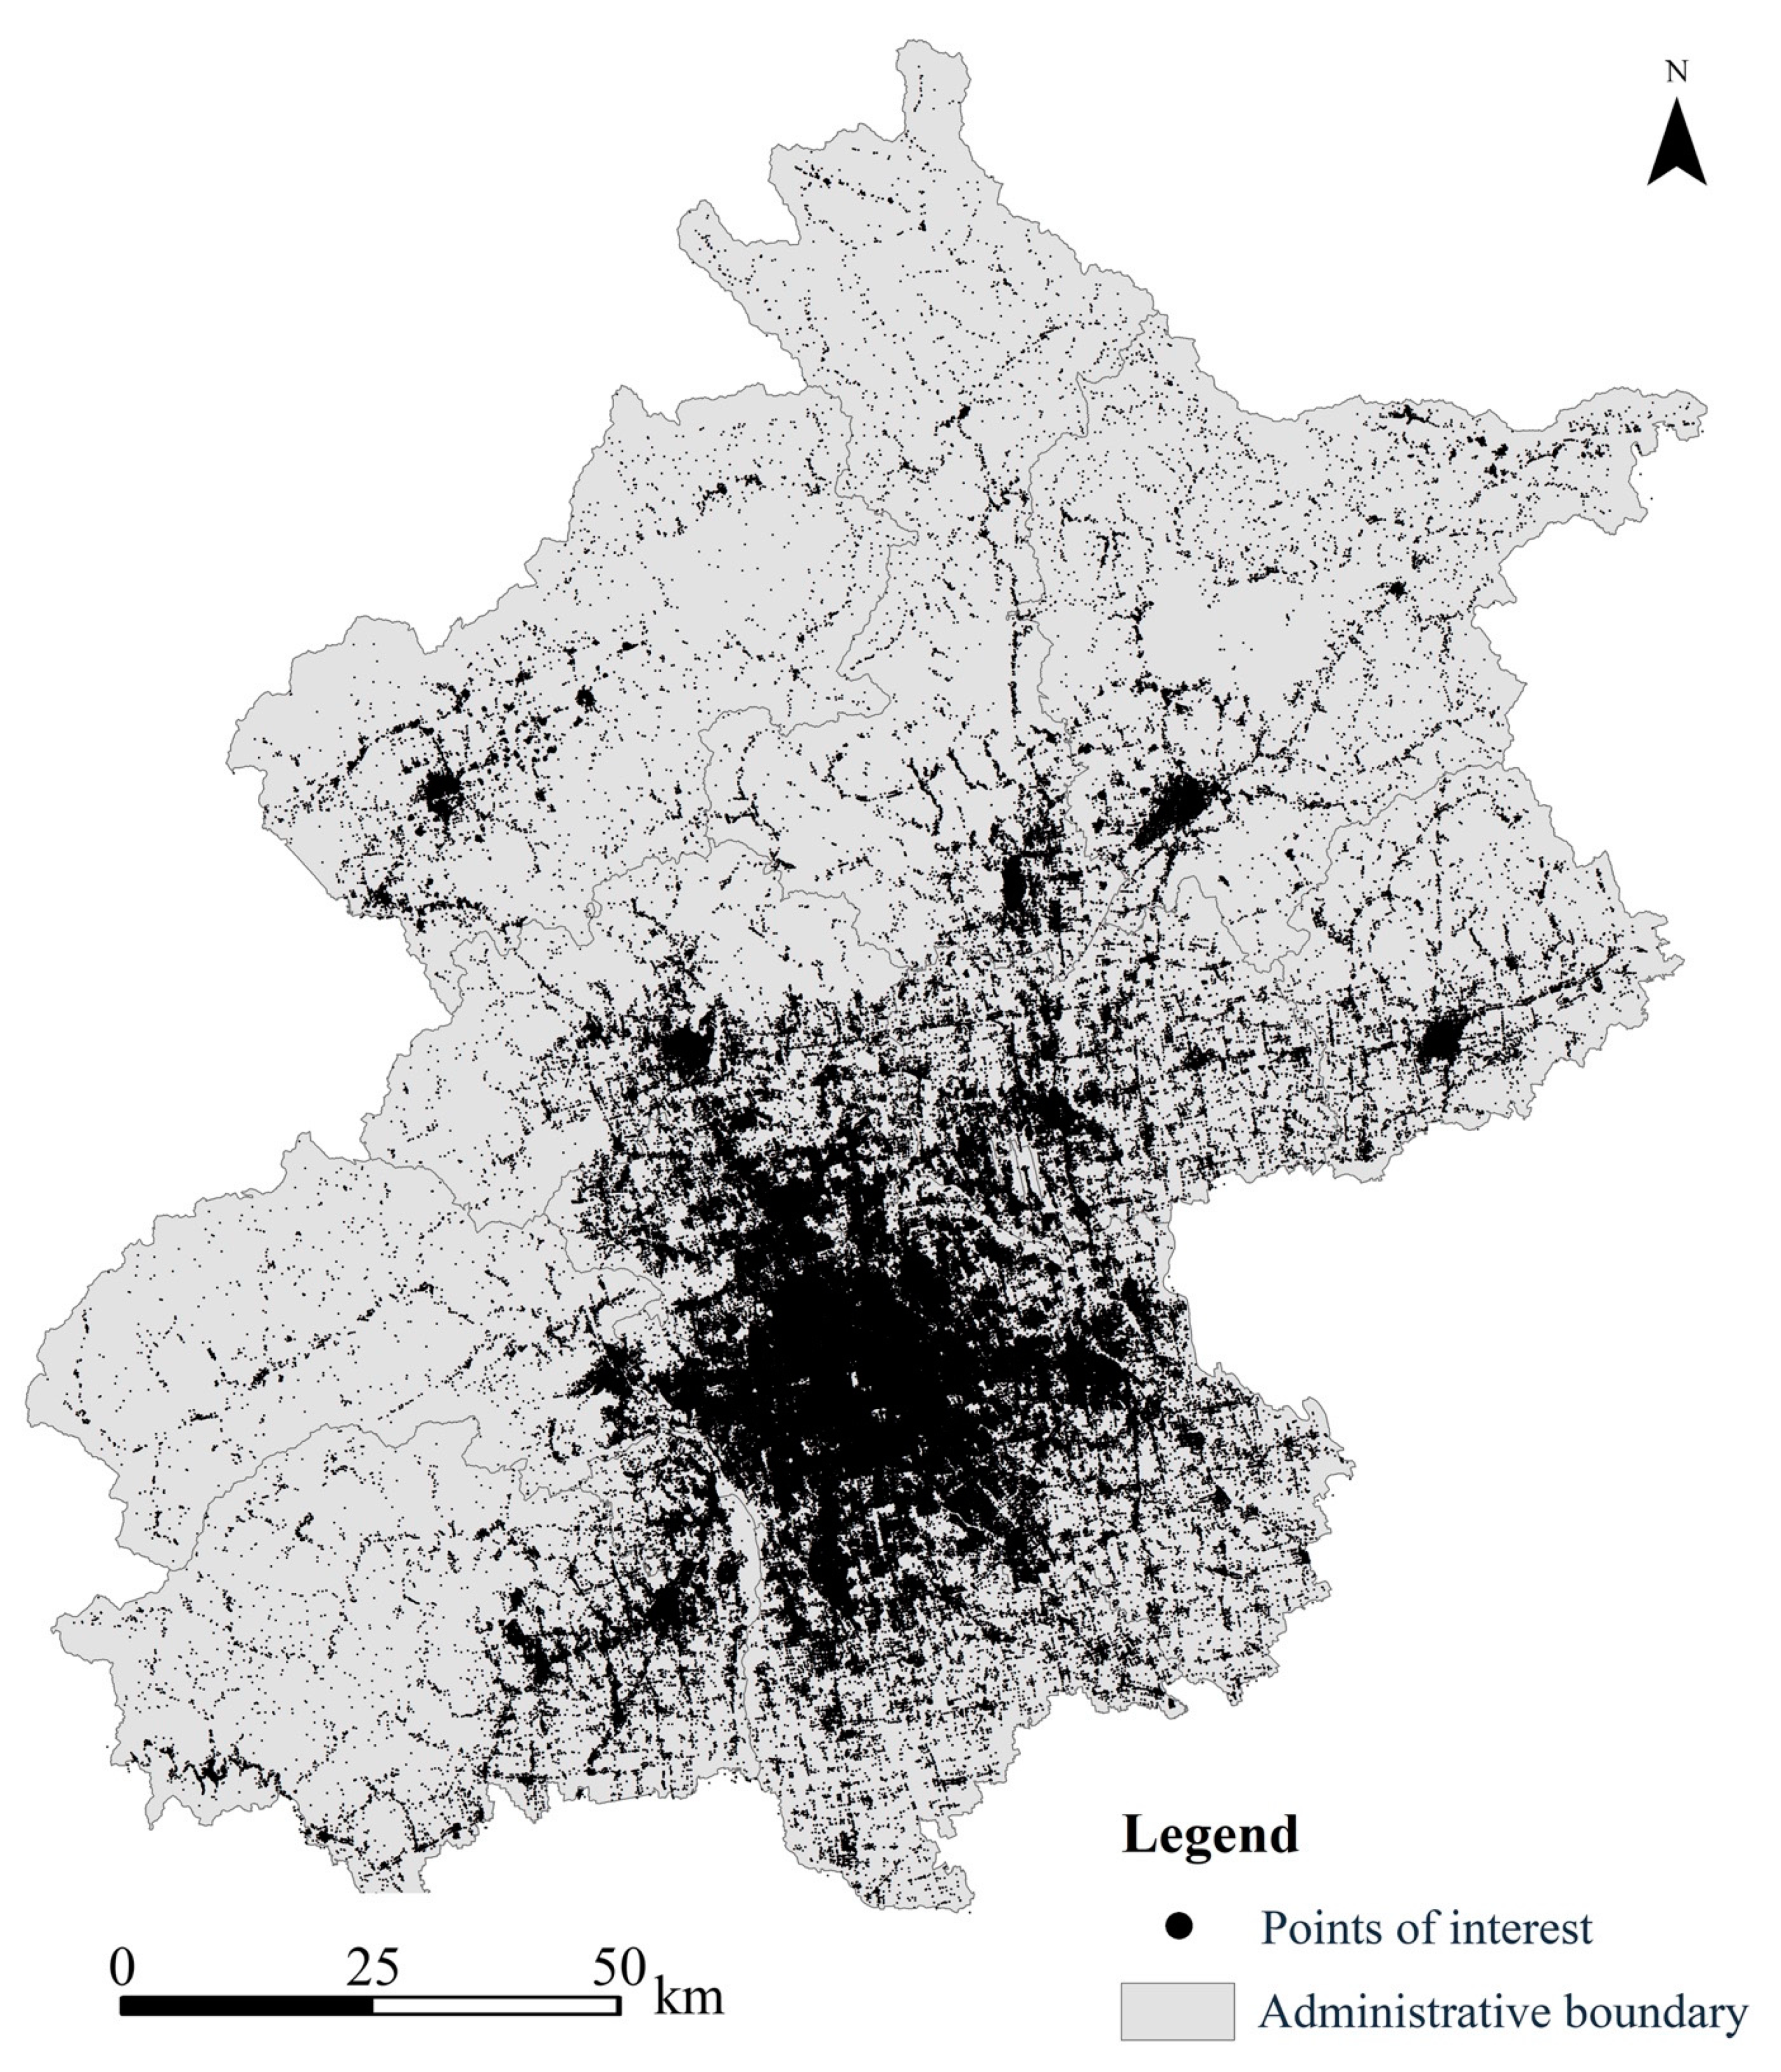
2.2. Point of Interest (POI) Data Processes
- Step 1: The POI data will be standardized in level 3 according to the following methods. Each sub-area patch is a matrix of the number of POI categories:where yij is the standardized matrix data, min(xj)/344 max(xj) is the minimum and maximum values, xij is the amount of POI category in level 3.
- Step 2: Calculate the entropy of the POI type in level 3. The entropy of information is an important factor to measure the weight of evaluation metrics. The large entropy of information indicates that the information provided by the metrics in the comprehensive score is large and the weight is high. The equation below indicates how to calculate the entropy of information.where n is the amount of the POI data on one dimension, yij is the standardized data, and suppose when yij = 0, pij = 0.
- Step 3: Calculate the weight of different types of POIs in one dimension in level 3. After calculating the information entropy, the entropy theory is used to determine the weight of each category in level 3, which reflects the importance of subcategories in the evaluation system.where k is a constant, k = 1/ln(m), m is the amount of the sub-region.
- Step 4: Repeat the same process for Level 2 and Level 1 based on the results of the previous. Then we can obtain the weighted amount of POI in level 1 of each sub-region.
- Step 5: Regarding the weight amount of POI of each sub-region and GDP data, we can cluster the sub-region patches by K-means and Dendrogram Cluster methods. Finally, we can obtain the similarity among sub-region patches.
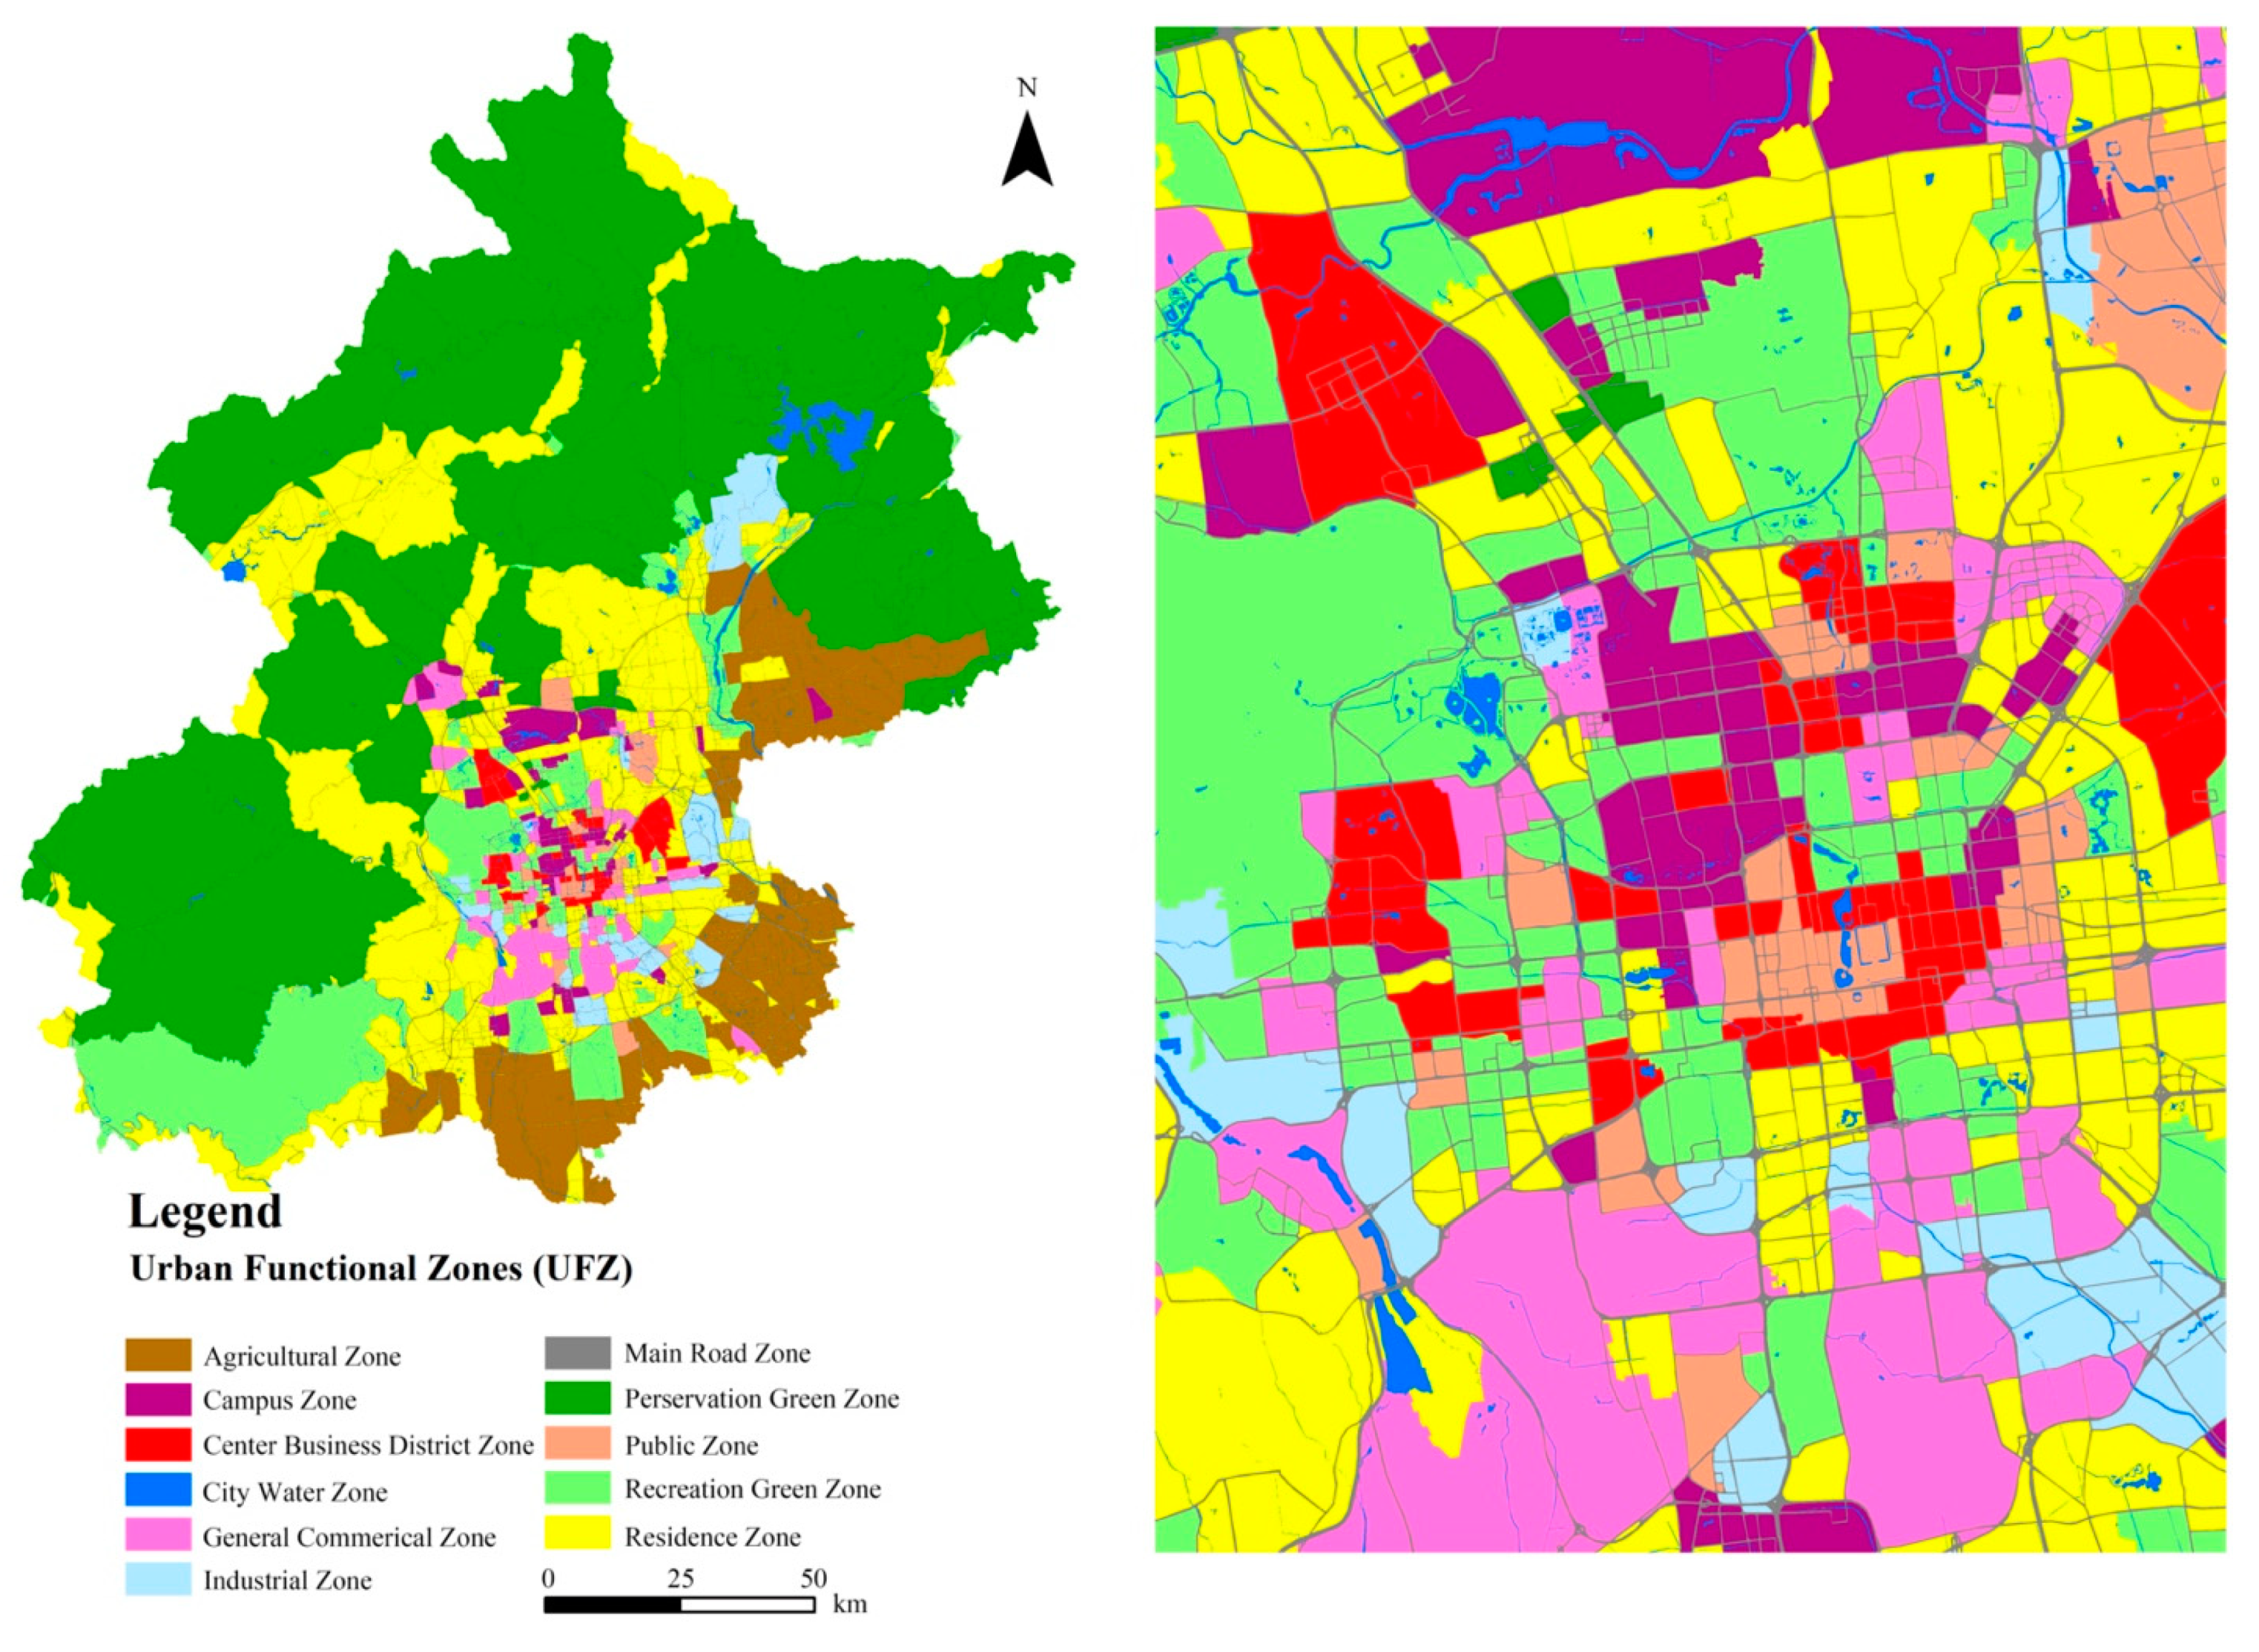
- Step 6: Based on the land-use polygon shapefile and POI 363 features, we identified the UFZs.
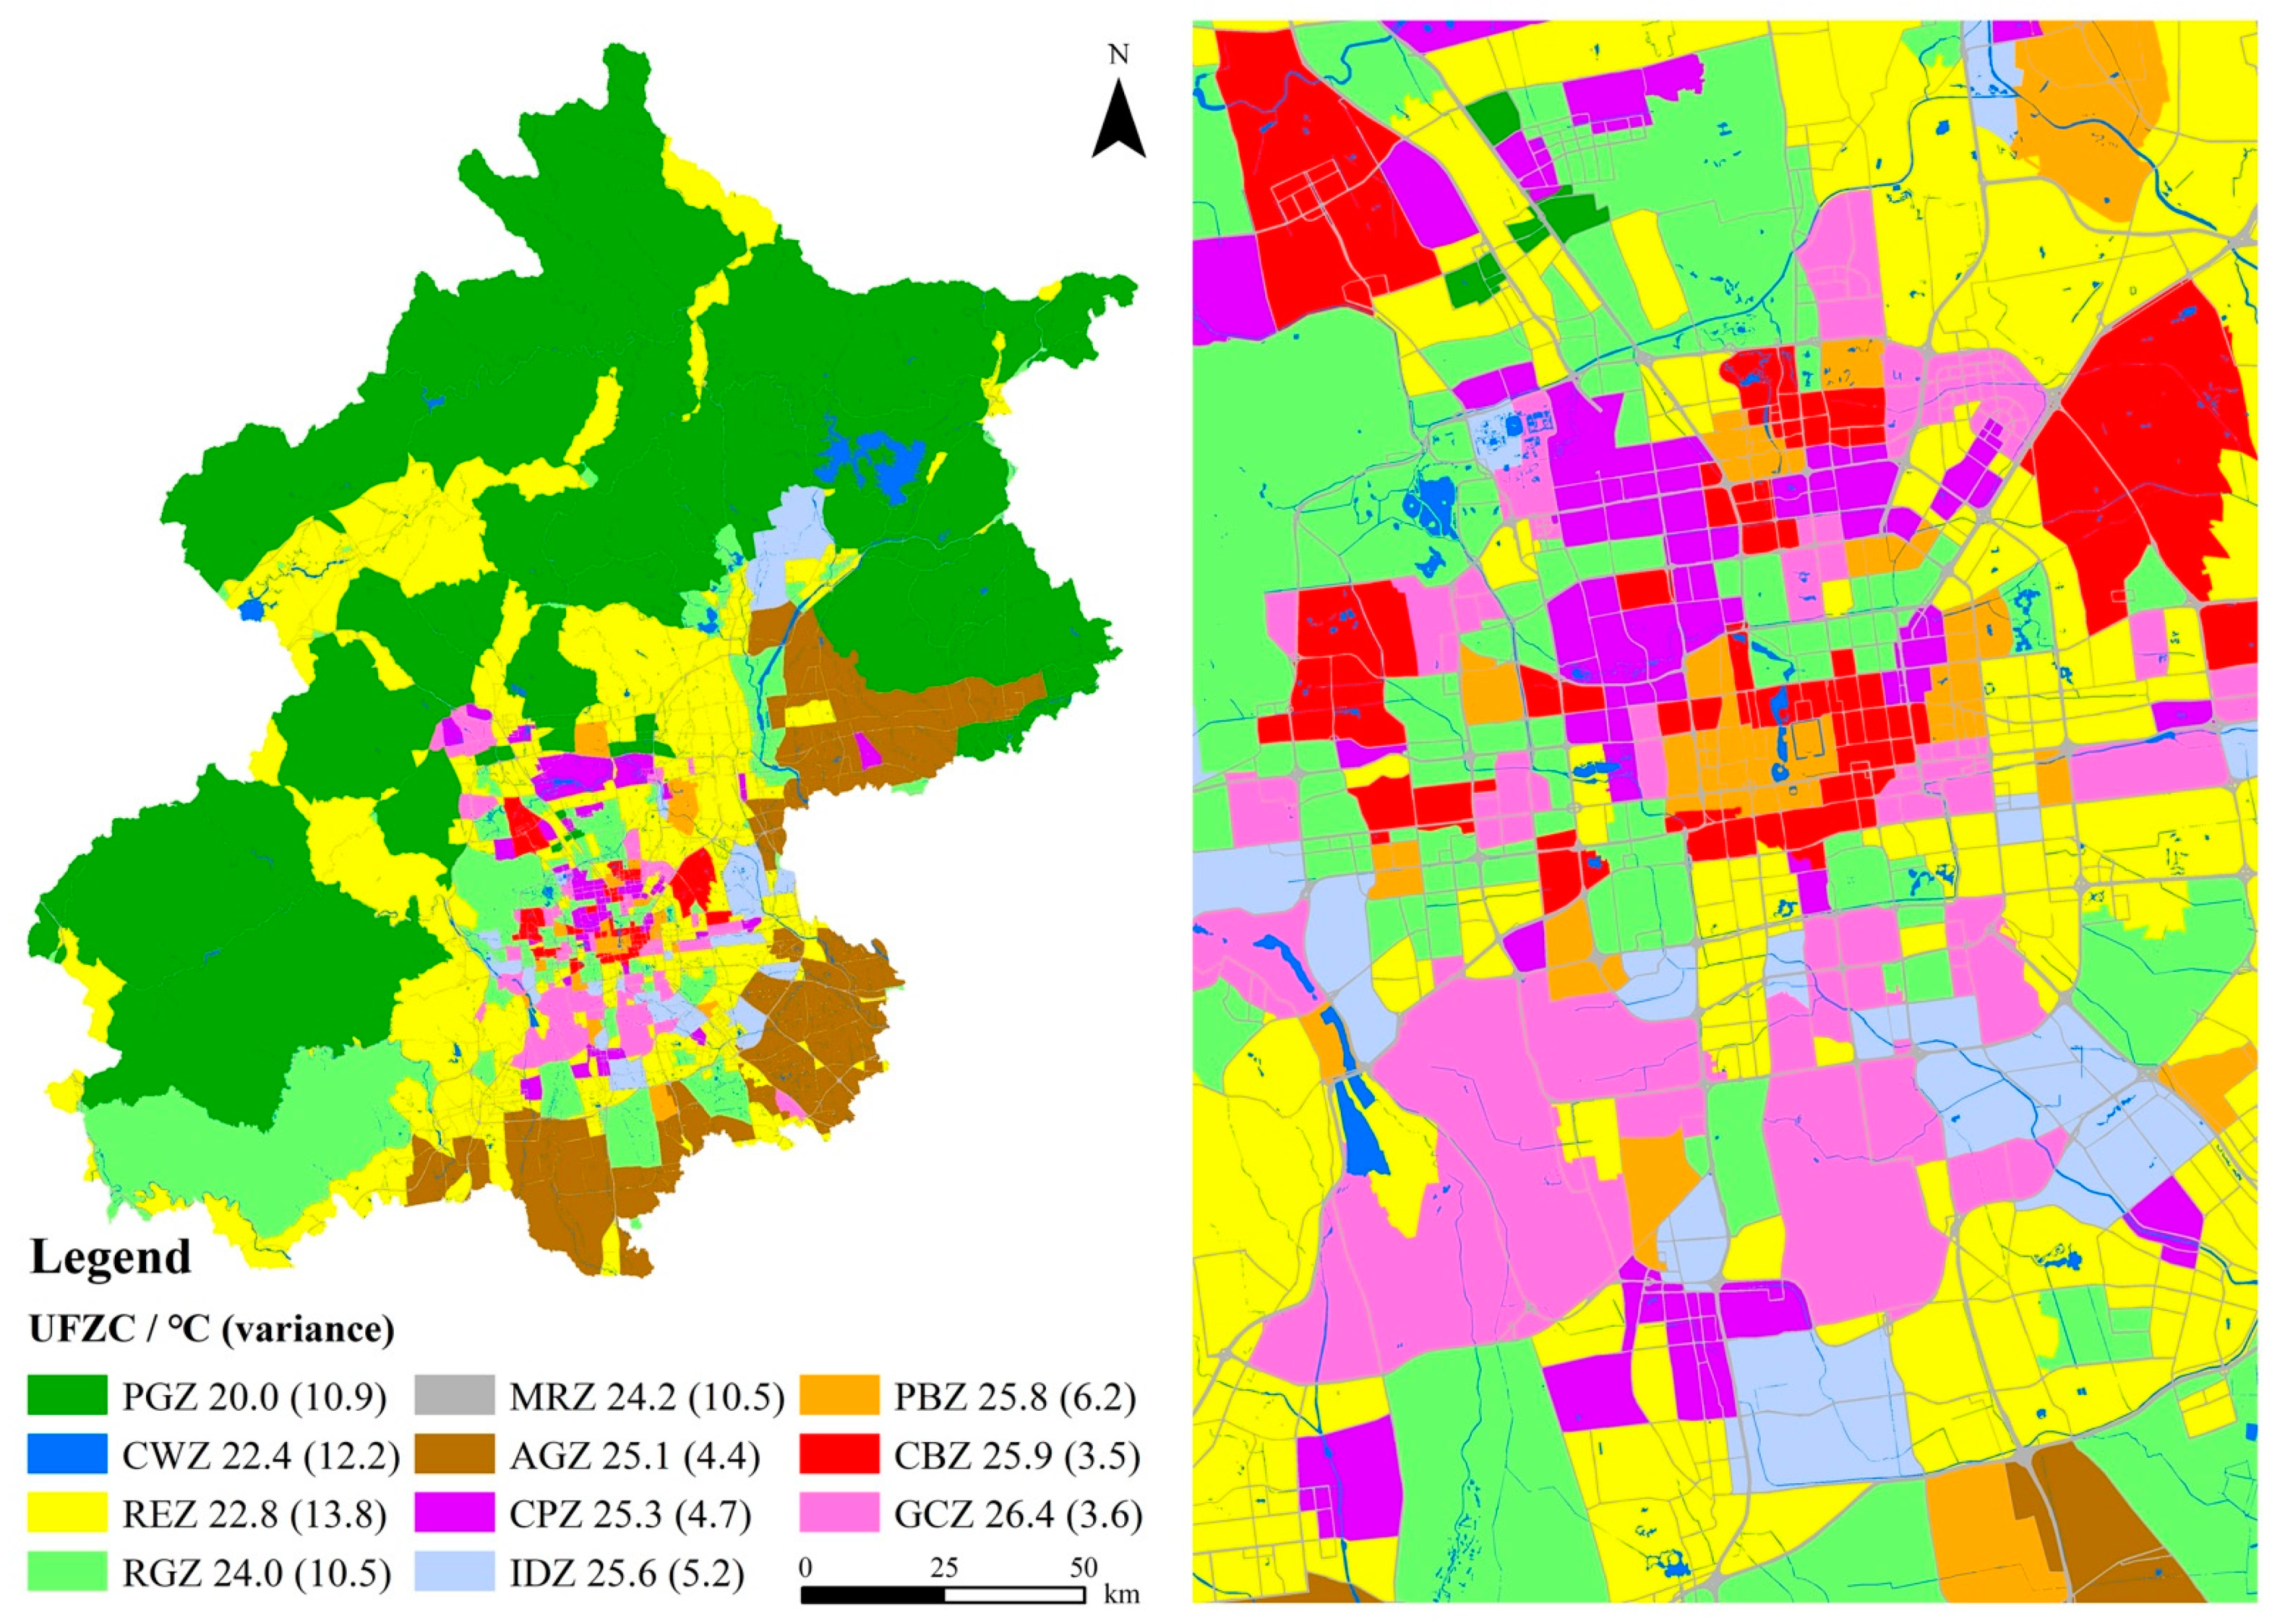
2.3. Land Surface Temperature Acquisition of UFZs
3. Case Study
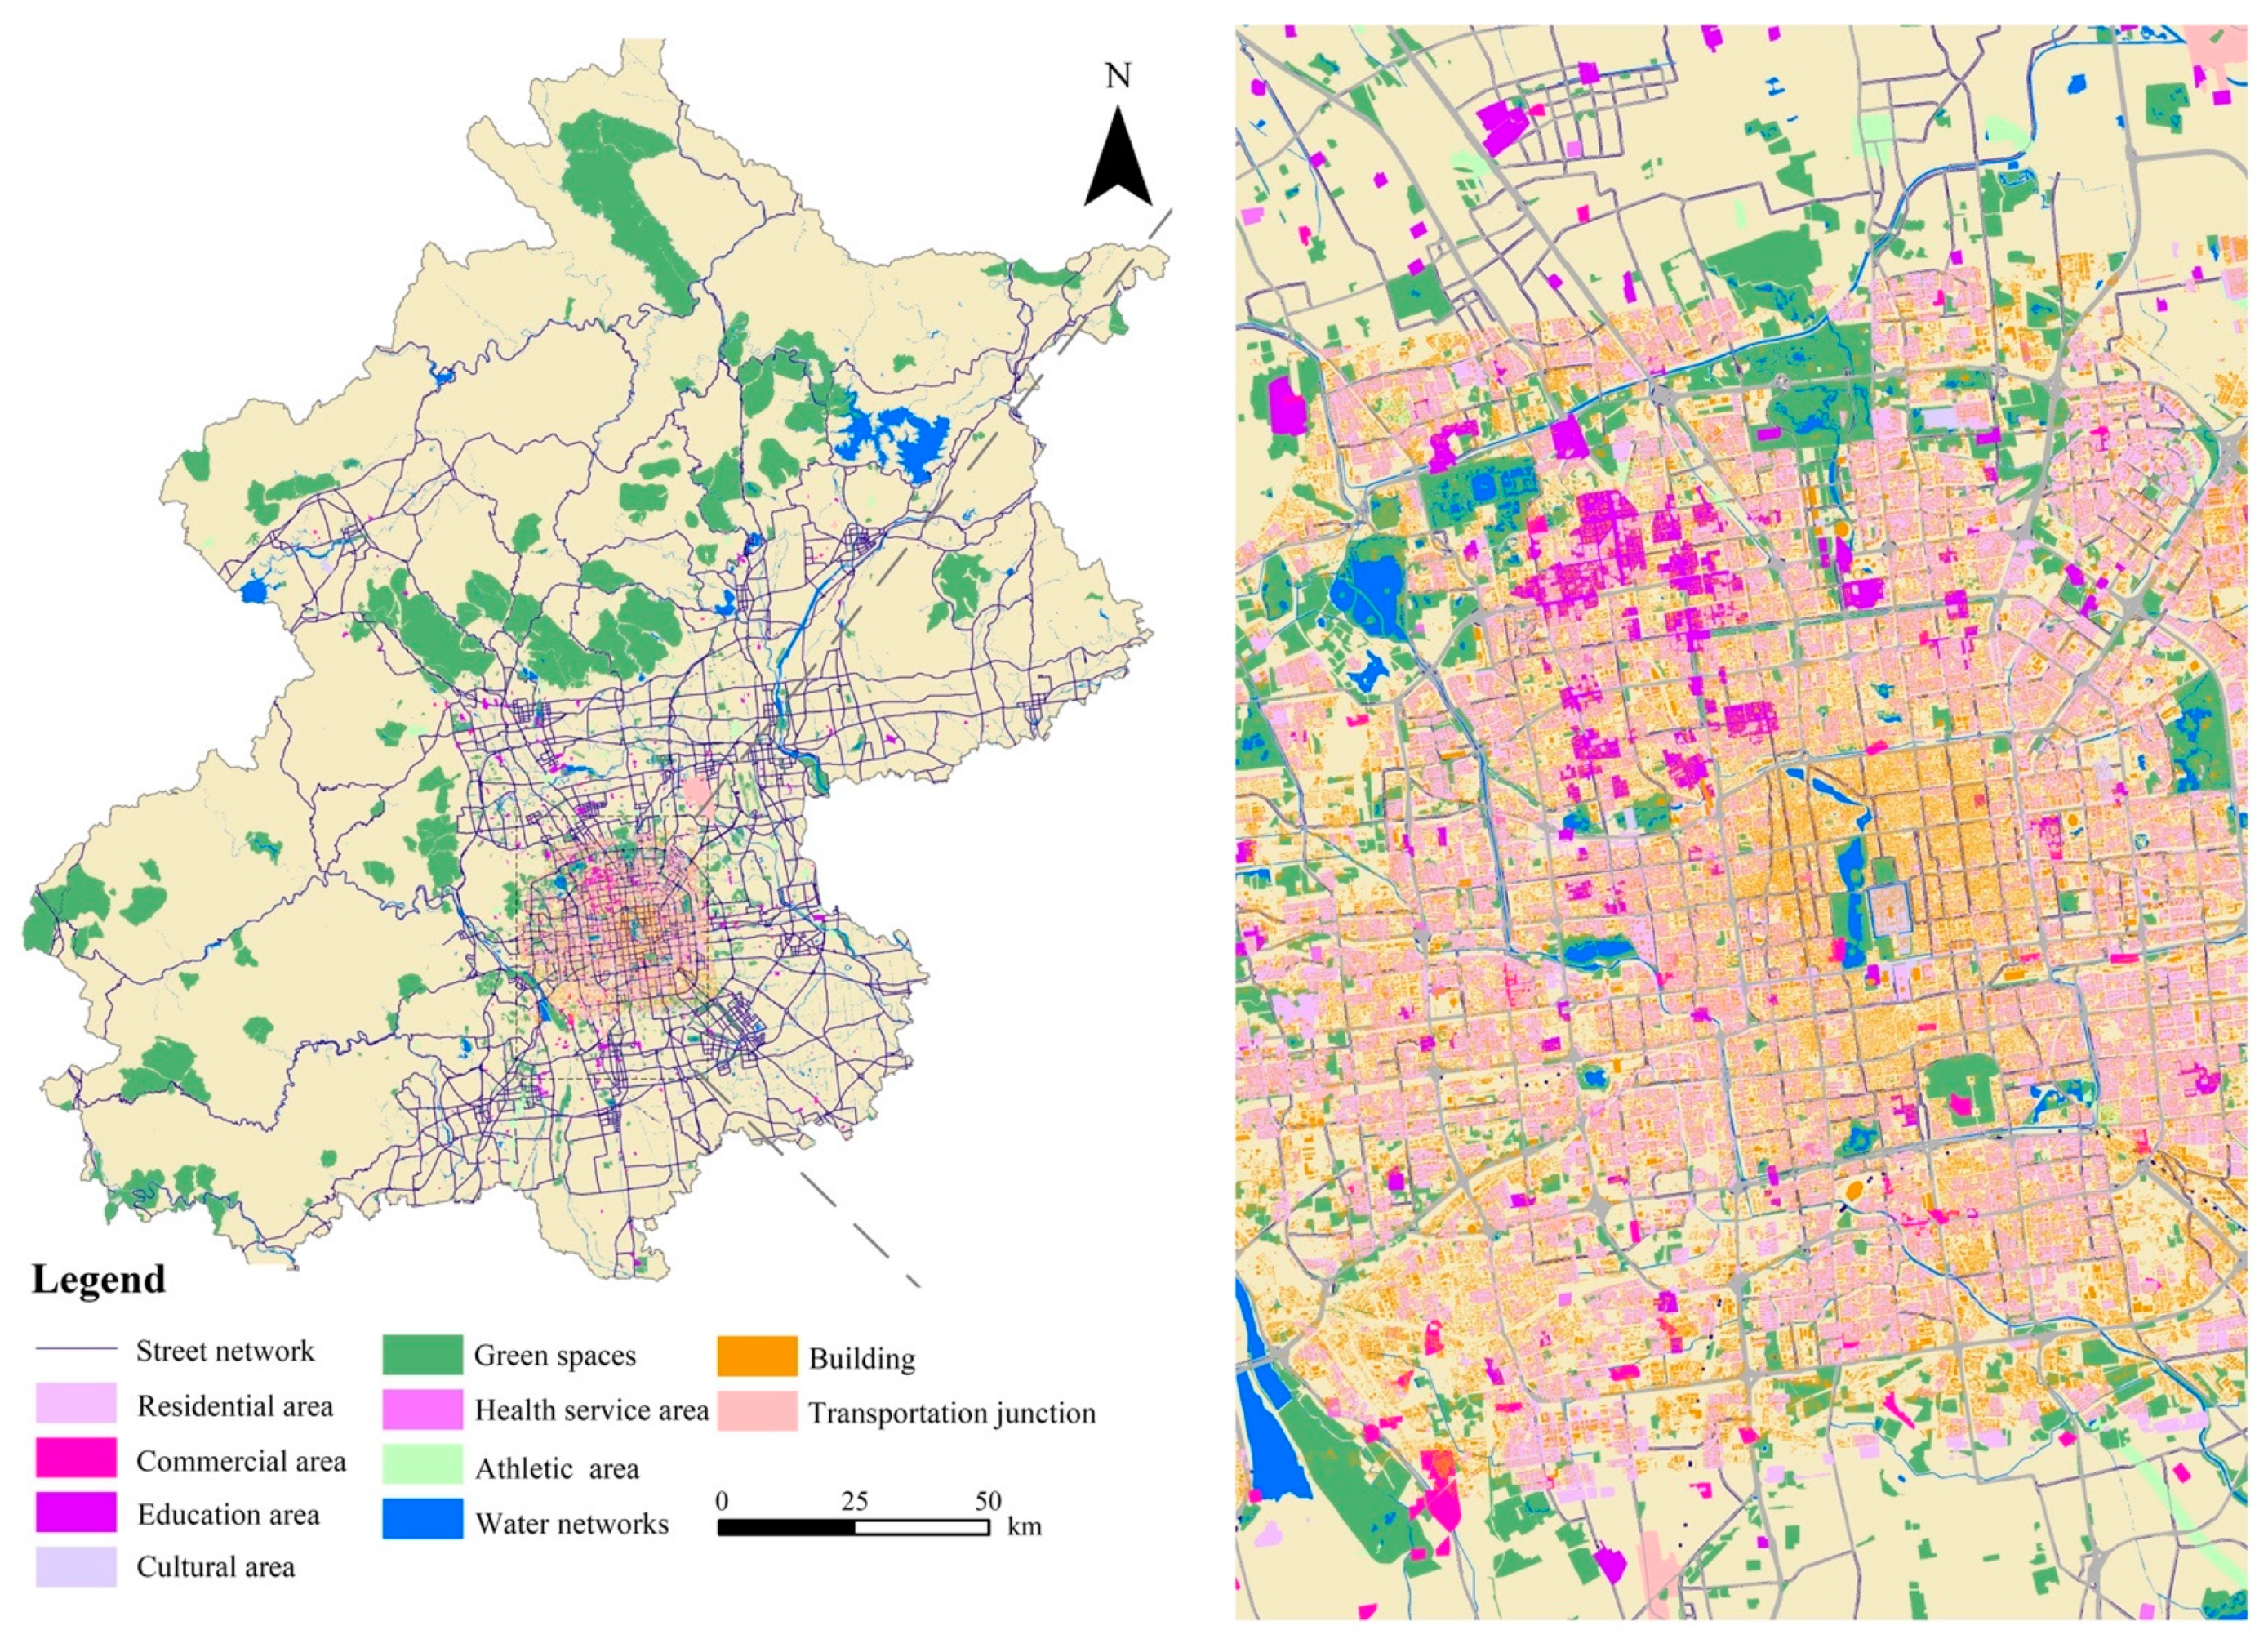
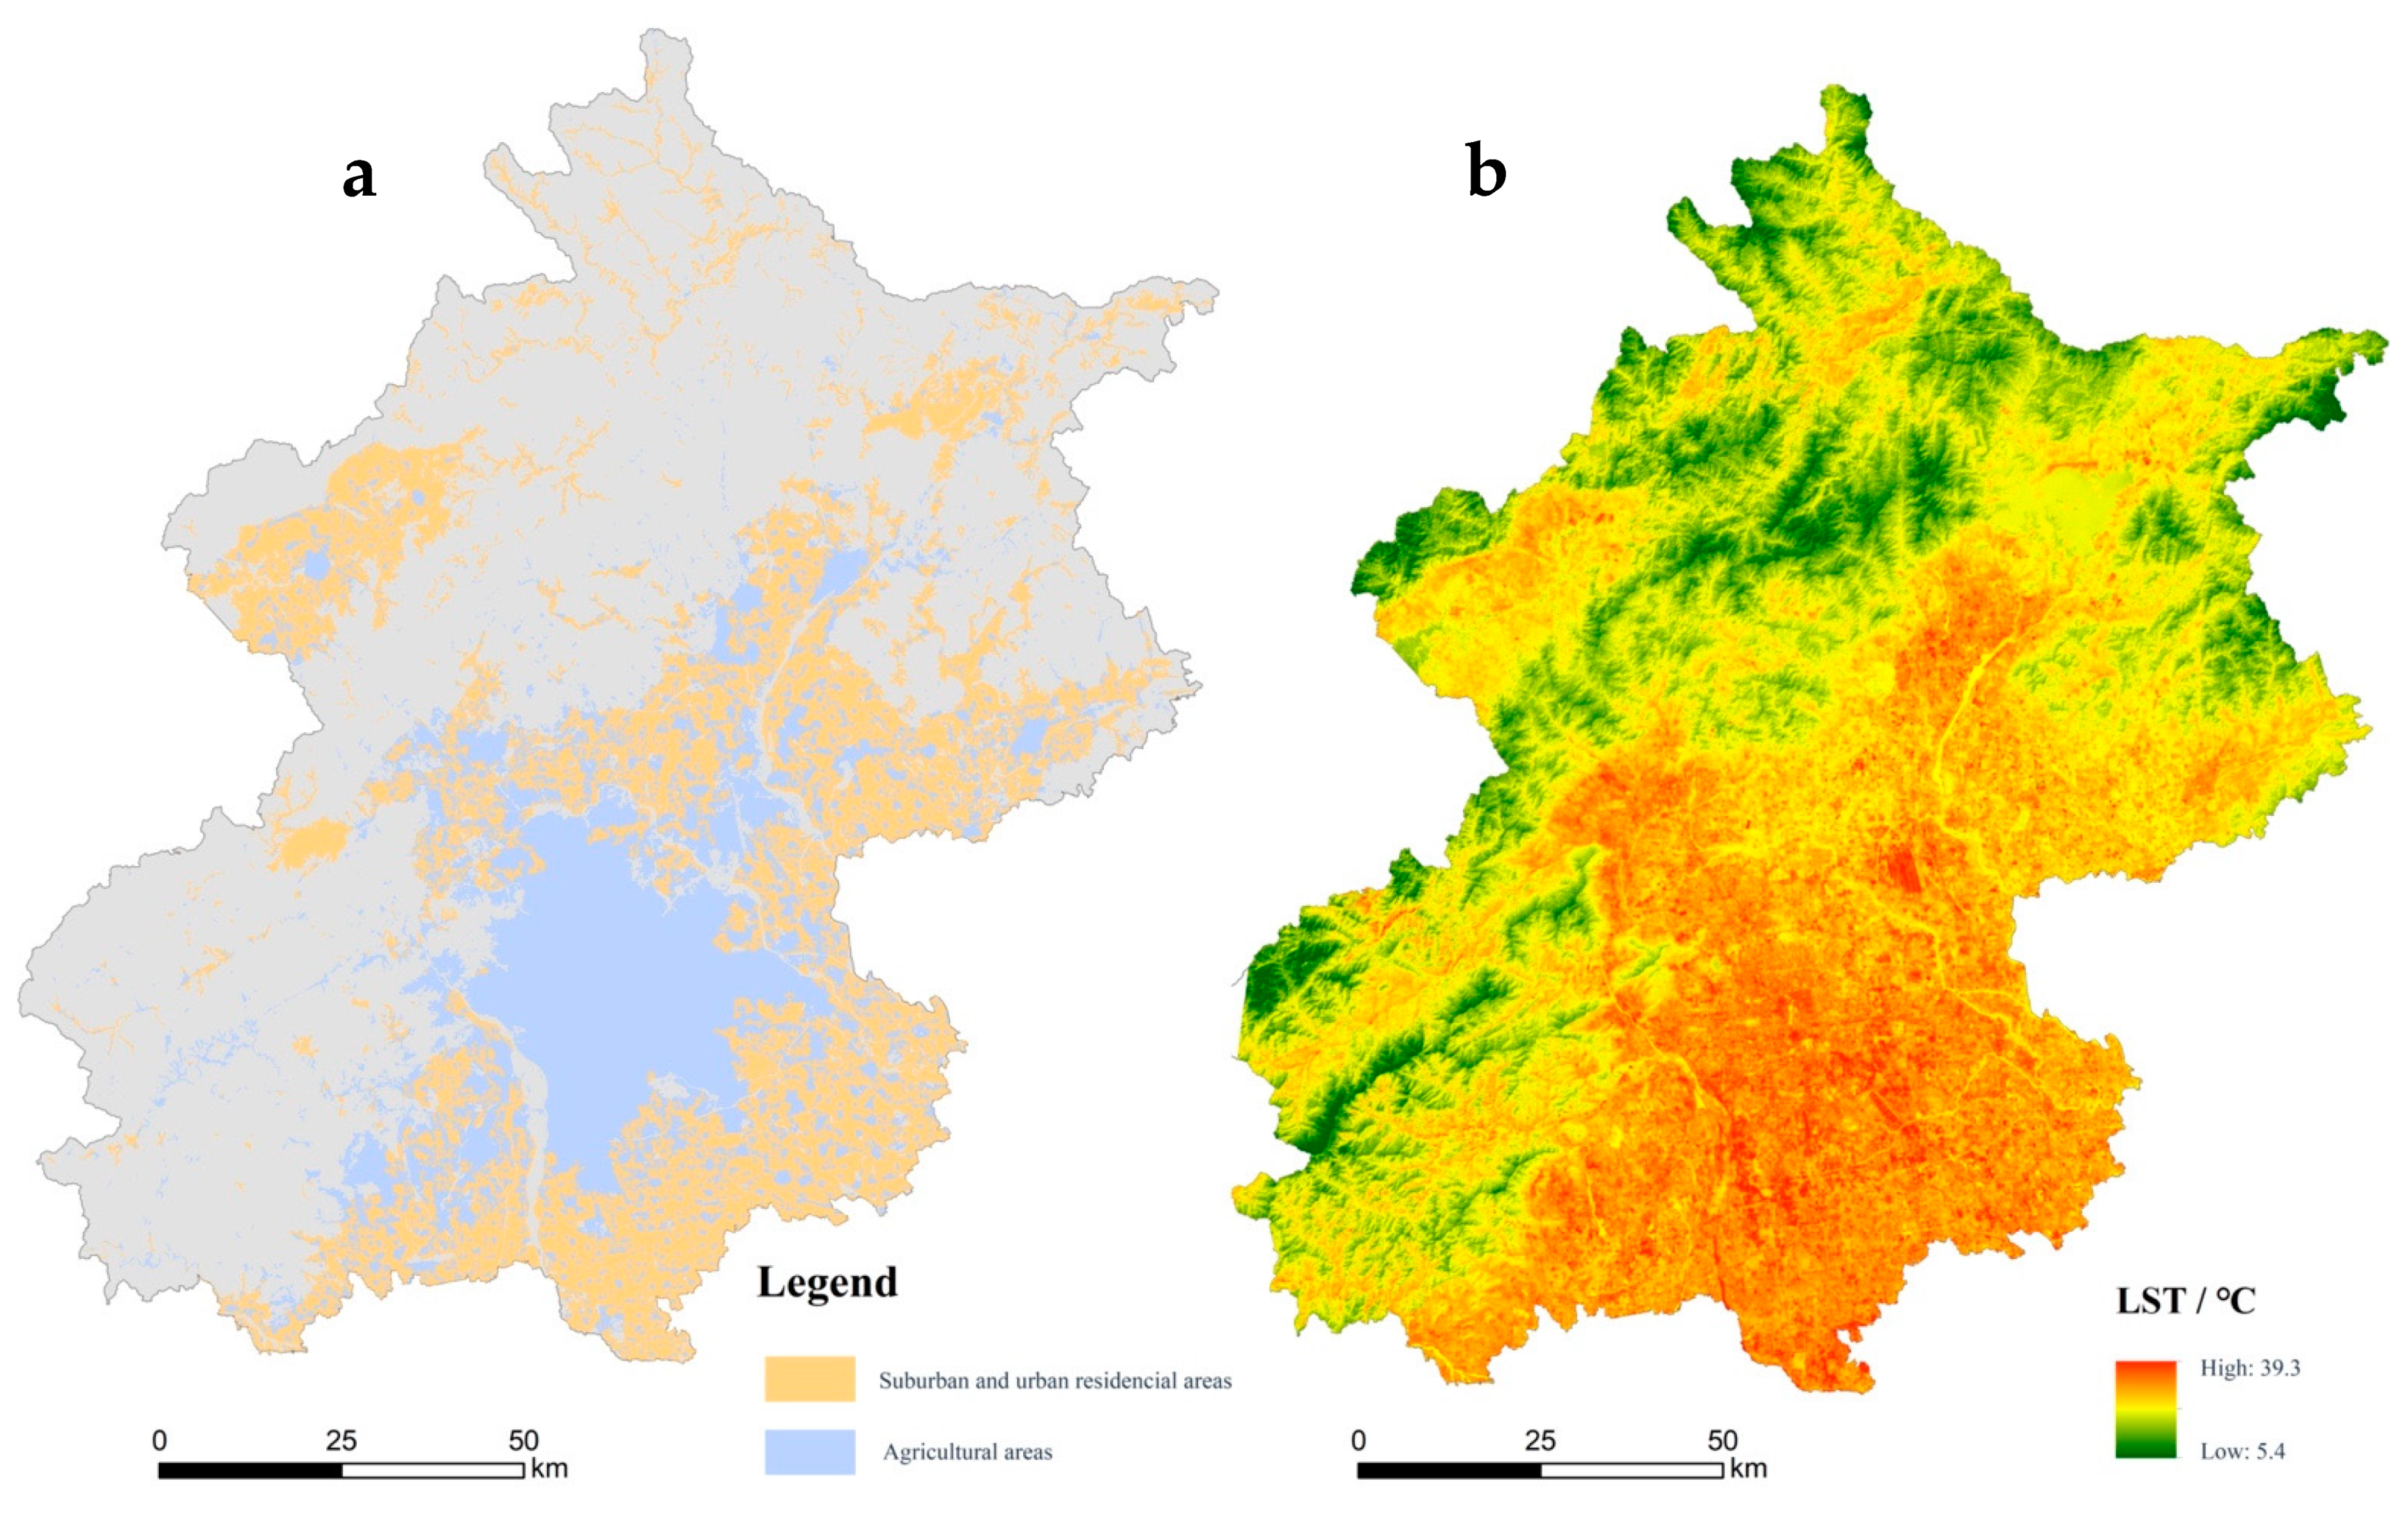
3.1. Study Area
3.2. Data Source and Processing
3.3. Results
4. Discussion
4.1. Advantages of UFZC Classification
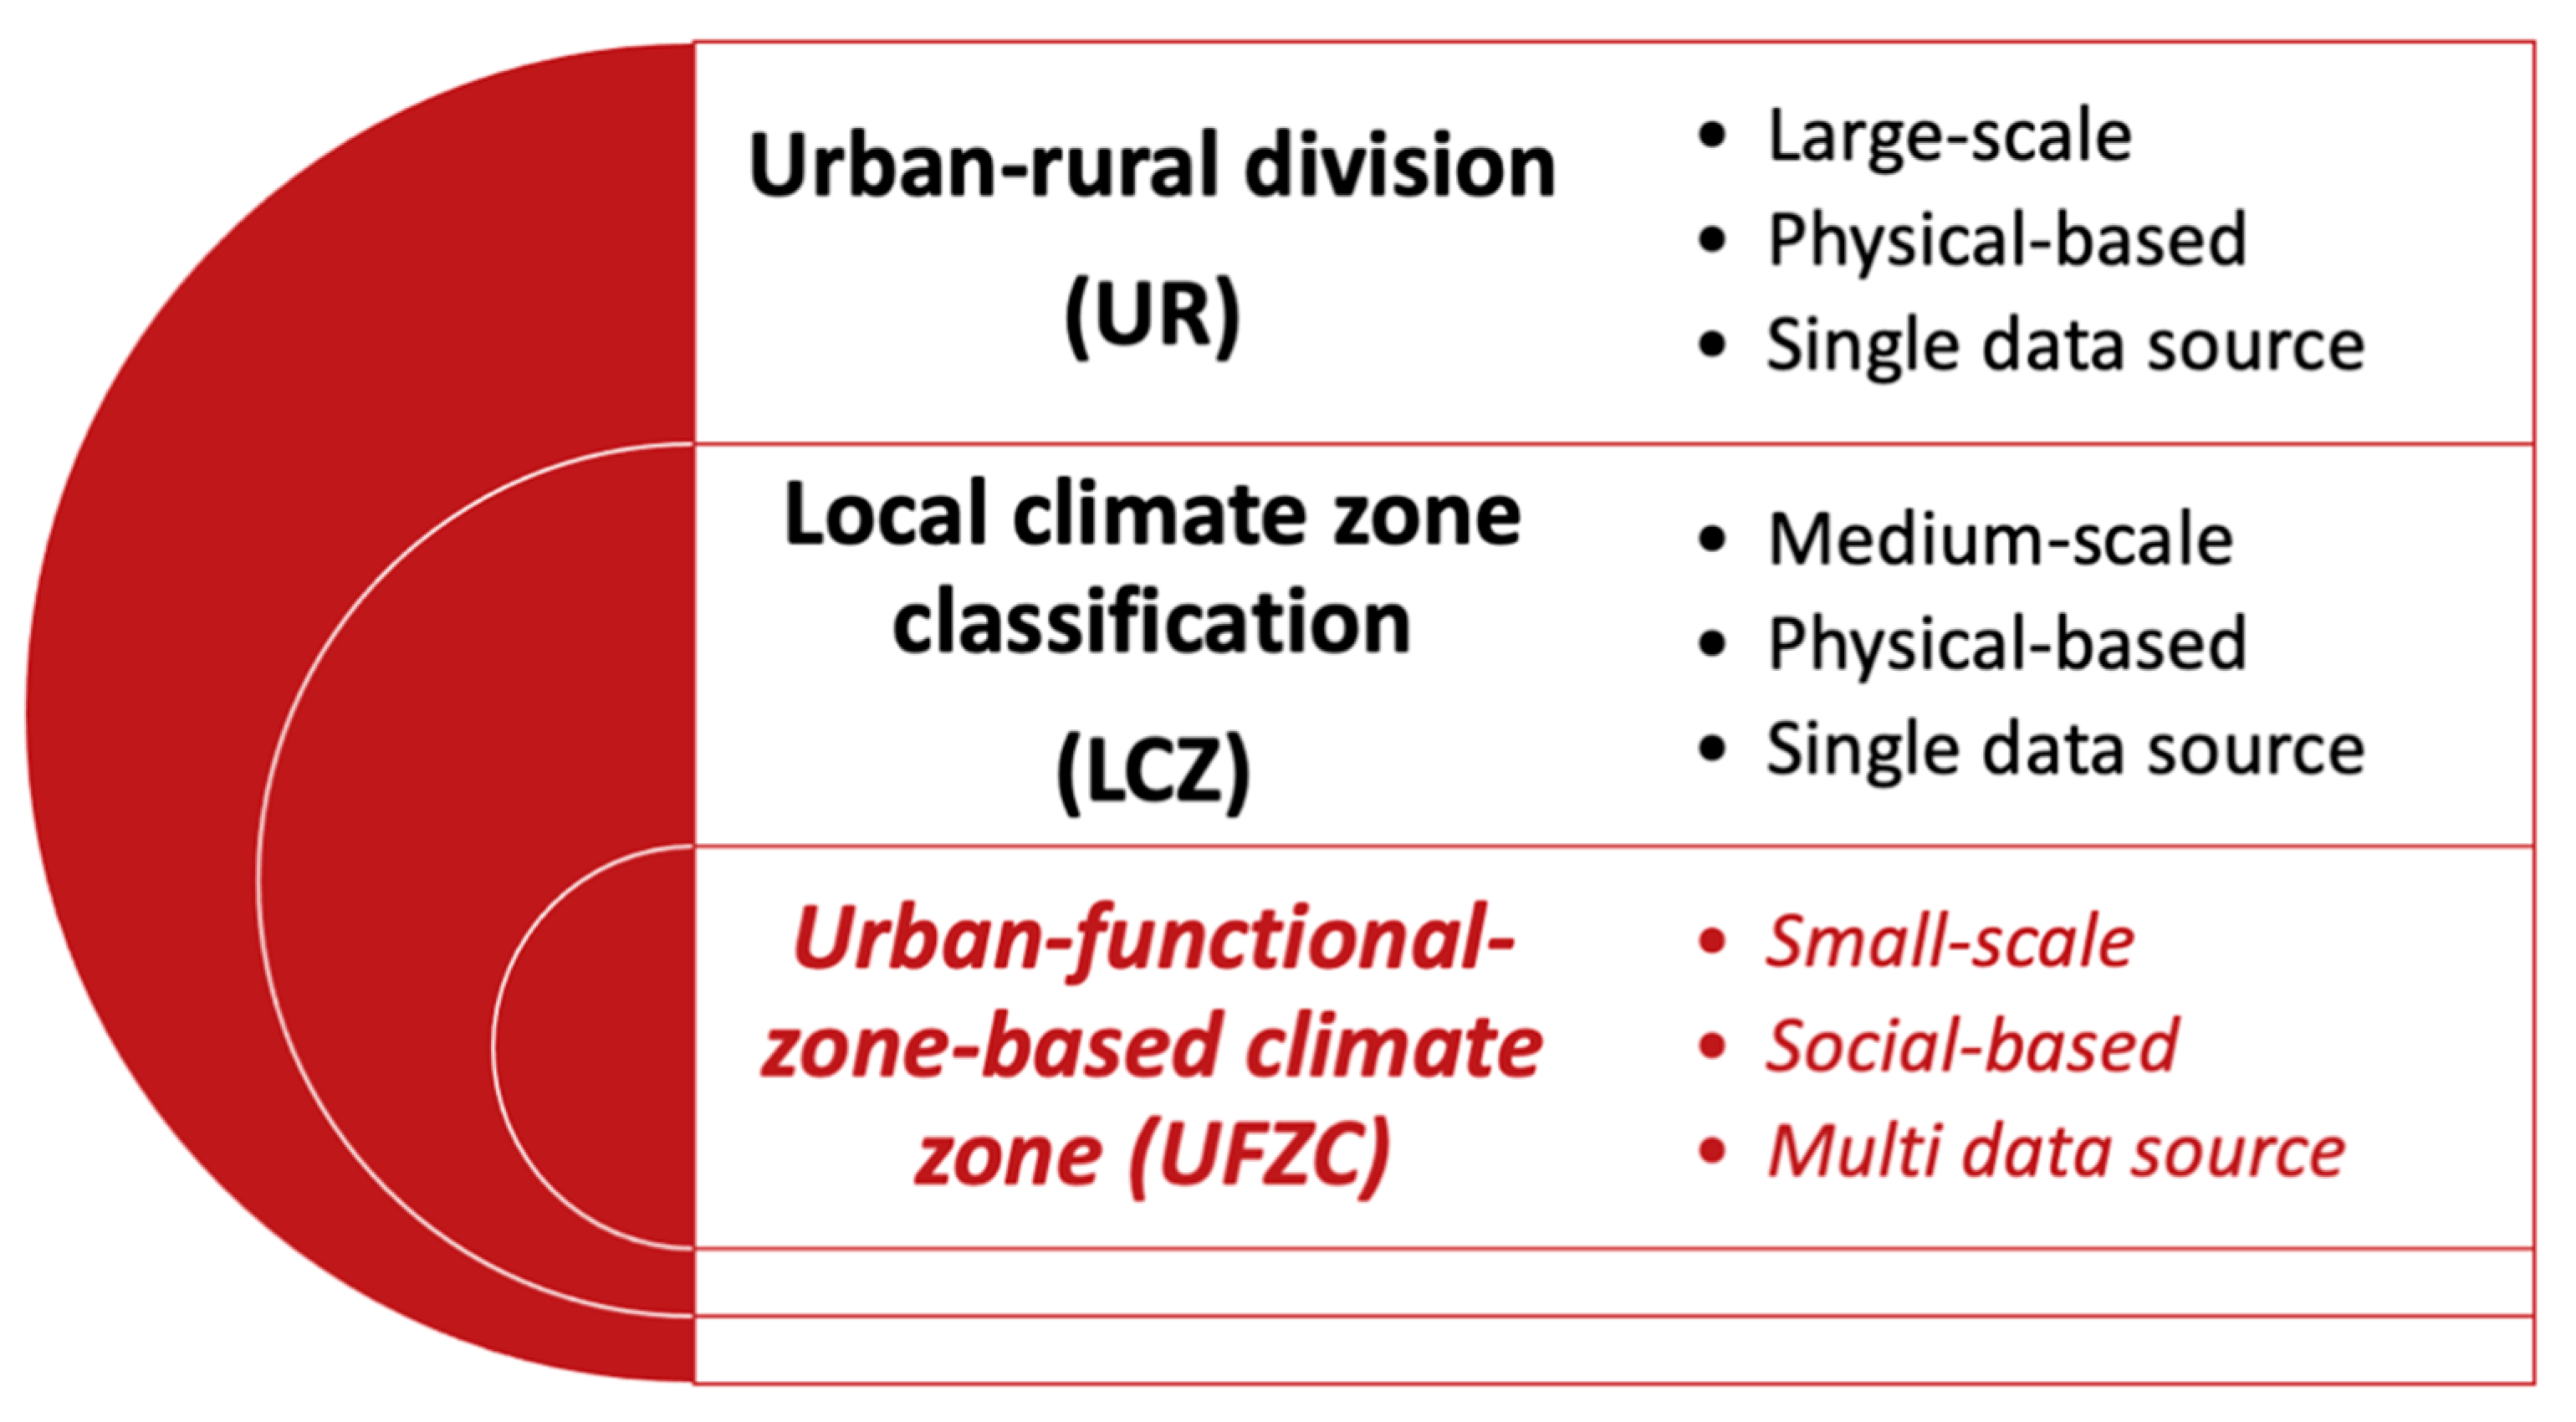
4.1.1. Theoretical Comparison
4.1.2. Technical Comparison
4.1.3. Application Comparison
4.2. Limitations of UFZC System and Further Studies
5. Conclusions
Supplementary Materials
Author Contributions
Funding
Institutional Review Board Statement
Informed Consent Statement
Data Availability Statement
Acknowledgments
Conflicts of Interest
References
- Oke, T.R.; Mills, G.; Christen, A.; Voogt, J.A. Urban Climates; Cambridge University Press: Cambridge, UK, 2017. [Google Scholar]
- Oke, T.R. Boundary Layer Climates; Routledge: London, UK; New York, NY, USA, 2002. [Google Scholar]
- Yu, Z.; Xu, S.; Zhang, Y.; Jørgensen, G.; Vejre, H. Strong contributions of local background climate to the cooling effect of urban green vegetation. Sci. Rep. 2018, 8, 6798. [Google Scholar] [CrossRef] [PubMed]
- Santamouris, M. On the energy impact of urban heat island and global warming on buildings. Energy Build. 2014, 82, 100–113. [Google Scholar] [CrossRef]
- Forman, R.T. Urban Ecology: Science of Cities; Cambridge University Press: Cambridge, UK, 2014. [Google Scholar]
- Akbari, H.; Kolokotsa, D. Three decades of urban heat islands and mitigation technologies research. Energy Build. 2016, 133, 834–842. [Google Scholar] [CrossRef]
- Ward, K.; Lauf, S.; Kleinschmit, B.; Endlicher, W. Heat waves and urban heat islands in Europe: A review of relevant drivers. Sci. Total Environ. 2016, 569, 527–539. [Google Scholar] [CrossRef]
- Cao, C.; Lee, X.; Liu, S.; Schultz, N.; Xiao, W.; Zhang, M.; Zhao, L. Urban heat islands in China enhanced by haze pollution. Nat. Commun. 2016, 7, 12509. [Google Scholar] [CrossRef]
- Santamouris, M.; Ban-Weiss, G.; Osmond, P.; Paolini, R.; Synnefa, A.; Cartalis, C.; Muscio, A.; Zinzi, M.; Morakinyo, T.E.; Ng, E.; et al. Progress in urban greenery mitigation science–assessment methodologies advanced technologies and impact on cities. J. Civ. Eng. Manag. 2018, 24, 638–671. [Google Scholar] [CrossRef]
- Luan, X.; Yu, Z.; Zhang, Y.; Wei, S.; Miao, X.; Huang, Z.Y.; Teng, S.N.; Xu, C. Remote Sensing and Social Sensing Data Reveal Scale-Dependent and System-Specific Strengths of Urban Heat Island Determinants. Remote Sens. 2020, 12, 391. [Google Scholar] [CrossRef]
- Sobstyl, J.M.; Emig, T.; Qomi, M.J.A.; Ulm, F.J.; Pellenq, R.J.M. Role of City Texture in Urban Heat Islands at Nighttime. Phys. Rev. Lett. 2018, 120, 108701. [Google Scholar] [CrossRef]
- Yu, Z.; Yao, Y.; Yang, G.; Wang, X.; Vejre, H. Spatiotemporal patterns and characteristics of remotely sensed regional heat islands during the rapid urbanization (1995–2015) of Southern China. Sci. Total Environ. 2019, 674, 242–254. [Google Scholar] [CrossRef]
- Yu, Z.; Yang, G.; Zuo, S.; Jørgensen, G.; Koga, M.; Vejre, H. Critical review on the cooling effect of urban blue-green space: A threshold-size perspective. Urban For. Urban Green. 2020, 49. [Google Scholar] [CrossRef]
- Stewart, I.D.; Oke, T.R. Local climate zones for urban temperature studies. Bull. Am. Meteorol. Soc. 2012, 93, 1879–1900. [Google Scholar] [CrossRef]
- Stewart, I.D.; Oke, T.R.; Krayenhoff, E.S. Evaluation of the ‘local climate zone’scheme using temperature observations and model simulations. Int. J. Climatol. 2014, 34, 1062–1080. [Google Scholar] [CrossRef]
- Xu, Y.; Ren, C.; Cai, M.; Edward, N.Y.Y.; Wu, T. Classification of local climate zones using ASTER and Landsat data for high-density cities. IEEE J. Sel. Top. Appl. Earth Obs. Remote Sens. 2017, 10, 3397–3405. [Google Scholar] [CrossRef]
- Bechtel, B.; Alexander, P.J.; Böhner, J.; Ching, J.; Conrad, O.; Feddema, J.; Mills, G.; See, L.; Stewart, I. Mapping local climate zones for a worldwide database of the form and function of cities. ISPRS Int. J. Geo-Inf. 2015, 4, 199–219. [Google Scholar] [CrossRef]
- Yu, Z.; Yao, Y.; Yang, G.; Wang, X.; Vejre, H. Strong contribution of rapid urbanization and urban agglomeration development to regional thermal environment dynamics and evolution. For. Ecol. Manag. 2019, 446, 214–225. [Google Scholar] [CrossRef]
- Stewart, I.D. A systematic review and scientific critique of methodology in modern urban heat island literature. Int. J. Climatol. 2011, 31, 200–217. [Google Scholar] [CrossRef]
- Montgomery, M.R. The urban transformation of the developing world. Science 2008, 319, 761–764. [Google Scholar] [CrossRef]
- Ren, C.; Cai, M.; Wang, R.; Xu, Y.; Ng, E. Local climate zone (LCZ) classification using the world urban database and access portal tools (WUDAPT) method: A case study in Wuhan and Hangzhou. In Proceedings of the 4th International Conference Countermeasure Urban Heat Islands, Singapore, 30 May–1 June 2016. [Google Scholar]
- Ellefsen, R. Mapping and measuring buildings in the canopy boundary layer in ten US cities. Energy Build. 1991, 16, 1025–1049. [Google Scholar] [CrossRef]
- Loridan, T.; Grimmond, C.S.B. Characterization of energy flux partitioning in urban environments: Links with surface seasonal properties. J. Appl. Meteorol. Climatol. 2012, 51, 219–241. [Google Scholar] [CrossRef]
- Wilmers, F. Effects of vegetation on urban climate and buildings. Energy Build. 1990, 15, 507–514. [Google Scholar] [CrossRef]
- Zhao, L.; Lee, X.; Smith, R.B.; Oleson, K. Strong contributions of local background climate to urban heat islands. Nature 2014, 511, 216–219. [Google Scholar] [CrossRef] [PubMed]
- Foley, J.A.; DeFries, R.; Asner, G.P.; Barford, C.; Bonan, G.; Carpenter, S.R.; Chapin, F.S.; Coe, M.T.; Daily, G.C.; Gibbs, H.K. Global consequences of land use. Science 2005, 309, 570–574. [Google Scholar] [CrossRef] [PubMed]
- Fan, H.; Yu, Z.; Yang, G.; Liu, T.Y.; Liu, T.Y.; Hung, C.H.; Vejre, H. How to cool hot-humid (Asian) cities with urban trees? An optimal landscape size perspective. Agric. For. Meteorol. 2019, 265, 338–348. [Google Scholar] [CrossRef]
- Zhao, S.; Liu, S.; Zhou, D. Prevalent vegetation growth enhancement in urban environment. Proc. Natl. Acad. Sci. USA 2016, 113, 6313–6318. [Google Scholar] [CrossRef] [PubMed]
- Du, H.; Wang, D.; Wang, Y.; Zhao, X.; Qin, F.; Jiang, H.; Cai, Y. Influences of land cover types, meteorological conditions, anthropogenic heat and urban area on surface urban heat island in the Yangtze River Delta Urban Agglomeration. Sci. Total Environ. 2016, 571, 461–470. [Google Scholar] [CrossRef]
- Sun, R.; Wang, Y.; Chen, L.J. A distributed model for quantifying temporal-spatial patterns of anthropogenic heat based on energy consumption. J. Clean. Prod. 2018, 170, 601–609. [Google Scholar] [CrossRef]
- Li, B.; Gasser, T.; Ciais, P.; Piao, S.; Tao, S.; Balkanski, Y.; Hauglustaine, D.; Boisier, J.-P.; Chen, Z.; Huang, M. The contribution of China’s emissions to global climate forcing. Nature 2016, 531, 357. [Google Scholar] [CrossRef]
- Sun, R.; Lü, Y.; Chen, L.; Yang, L.; Chen, A. Assessing the stability of annual temperatures for different urban functional zones. Build. Environ. 2013, 65, 90–98. [Google Scholar] [CrossRef]
- Song, J.; Lin, T.; Li, X.; Prishchepov, A. Mapping urban functional zones by integrating very high spatial resolution remote sensing imagery and points of interest: A case study of Xiamen, China. Remote Sens. 2018, 10, 1737. [Google Scholar] [CrossRef]
- Yuan, N.J.; Zheng, Y.; Xie, X.; Wang, Y.; Zheng, K.; Xiong, H. Discovering urban functional zones using latent activity trajectories. IEEE Trans. Knowl. Data Eng. 2015, 27, 712–725. [Google Scholar] [CrossRef]
- Liu, Y.; Liu, X.; Gao, S.; Gong, L.; Kang, C.; Zhi, Y.; Chi, G.; Shi, L. Social Sensing: A New Approach to Understanding Our Socioeconomic Environments. Ann. Assoc. Am. Geogr. 2015, 105, 512–530. [Google Scholar] [CrossRef]
- Raghupathi, W.; Raghupathi, V. Big data analytics in healthcare: Promise and potential. Health Inf. Sci. Syst. 2014, 2, 3. [Google Scholar] [CrossRef]
- Liu, X.; He, J.; Yao, Y.; Zhang, J.; Liang, H.; Wang, H.; Hong, Y. Classifying urban land use by integrating remote sensing and social media data. Int. J. Geogr. Inf. Sci. 2017, 31, 1675–1696. [Google Scholar] [CrossRef]
- Fang, C.; Zhou, C.; Gu, C.; Chen, L.; Li, S. A proposal for the theoretical analysis of the interactive coupled effects between urbanization and the eco-environment in mega-urban agglomerations. J. Geogr. Sci. 2017, 27, 1431–1449. [Google Scholar] [CrossRef]
- Zhou, D.; Bonafoni, S.; Zhang, L.; Wang, R. Remote sensing of the urban heat island effect in a highly populated urban agglomeration area in East China. Sci. Total Environ. 2018, 628, 415–429. [Google Scholar] [CrossRef] [PubMed]
- Gorelick, N.; Hancher, M.; Dixon, M.; Ilyushchenko, S.; Thau, D.; Moore, R. Google Earth Engine: Planetary-scale geospatial analysis for everyone. Remote Sens. Environ. 2017, 202, 18–27. [Google Scholar] [CrossRef]
- Delgado, A.; Romero, I. Environmental conflict analysis using an integrated grey clustering and entropy-weight method: A case study of a mining project in Peru. Environ. Model. Softw. 2016, 77, 108–121. [Google Scholar] [CrossRef]
- Zou, Z.-H.; Yun, Y.; Sun, J.-N. Entropy method for determination of weight of evaluating indicators in fuzzy synthetic evaluation for water quality assessment. J. Environ. Sci. 2006, 18, 1020–1023. [Google Scholar] [CrossRef]
- Rubinstein, R. The Cross-Entropy Method for Combinatorial and Continuous Optimization. Methodol. Comput. Appl. Probab. 1999, 1, 127–190. [Google Scholar] [CrossRef]
- Yu, Z.; Guo, X.; Jørgensen, G.; Vejre, H. How can urban green spaces be planned for climate adaptation in subtropical cities? Ecol. Indic. 2017, 82, 152–162. [Google Scholar] [CrossRef]
- Jiménez-Muñoz, J.C.; Sobrino, J.A.; Skoković, D.; Mattar, C.; Cristóbal, J. Land surface temperature retrieval methods from Landsat-8 thermal infrared sensor data. IEEE Geosci. Remote Sens. Lett. 2014, 11, 1840–1843. [Google Scholar] [CrossRef]
- Sekertekin, A.; Bonafoni, S. Sensitivity Analysis and Validation of Daytime and Nighttime Land Surface Temperature Retrievals from Landsat 8 Using Different Algorithms and Emissivity Models. Remote Sens. 2020, 12, 2776. [Google Scholar] [CrossRef]
- Van De Griend, A.A.; Owe, M. On the relationship between thermal emissivity and the normalized difference vegetation index for natural surfaces. Int. J. Remote Sens. 2007, 14, 1119–1131. [Google Scholar] [CrossRef]
- Carlson, T.N.; Ripley, D.A. On the relation between NDVI, fractional vegetation cover, and leaf area index. Remote Sens. Environ. 1997, 62, 241–252. [Google Scholar] [CrossRef]
- Vanhellemont, Q. Combined land surface emissivity and temperature estimation from Landsat 8 OLI and TIRS. ISPRS J. Photogramm. Remote Sens. 2020, 166, 390–402. [Google Scholar] [CrossRef]
- Environmental Systems Research Institute. ArcGIS Desktop, Release 10.2; Environmental Systems Research Institute: Redlands, CA, USA, 2014. [Google Scholar]
- Van Rossum, G.; Drake, F.L. Python 3 Reference Manual; CreateSpace Independent Publishing Platform: Scotts Valley, CA, USA, 2009. [Google Scholar]
- JetBrains. Pycharm IDE, 2017.2.3; JetBrains: Prague, Czech Republic, 2017. [Google Scholar]
- Peng, J.; Xie, P.; Liu, Y.; Ma, J. Urban thermal environment dynamics and associated landscape pattern factors: A case study in the Beijing metropolitan region. Remote Sens. Environ. 2016, 173, 145–155. [Google Scholar] [CrossRef]
- Qiao, Z.; Tian, G.; Xiao, L. Diurnal and seasonal impacts of urbanization on the urban thermal environment: A case study of Beijing using MODIS data. ISPRS J. Photogramm. Remote Sens. 2013, 85, 93–101. [Google Scholar] [CrossRef]
- Sun, R.; Chen, L. Effects of green space dynamics on urban heat islands: Mitigation and diversification. Ecosyst. Serv. 2017, 23, 38–46. [Google Scholar]
- Kuang, W.; Liu, Y.; Dou, Y.; Chi, W.; Chen, G.; Gao, C.; Yang, T.; Liu, J.; Zhang, R. What are hot and what are not in an urban landscape: Quantifying and explaining the land surface temperature pattern in Beijing, China. Landsc. Ecol. 2015, 30, 357–373. [Google Scholar] [CrossRef]
- Tian, G.; Wu, J.; Yang, Z. Spatial pattern of urban functions in the Beijing metropolitan region. Habitat. Int. 2010, 34, 249–255. [Google Scholar] [CrossRef]
- Seneviratne, S.I.; Luthi, D.; Litschi, M.; Schar, C. Land-atmosphere coupling and climate change in Europe. Nature 2006, 443, 205–209. [Google Scholar] [CrossRef] [PubMed]
- Peng, J.; Ma, J.; Liu, Q.; Liu, Y.; Hu, Y.; Li, Y.; Yue, Y. Spatial-temporal change of land surface temperature across 285 cities in China: An urban-rural contrast perspective. Sci. Total Environ. 2018, 635, 487–497. [Google Scholar] [CrossRef] [PubMed]
- Lin, Z.; Xu, H. A study of urban heat island intensity based on “local climate zones”: A case study in Fuzhou, China. In Proceedings of the 2016 4th International Workshop on Earth Observation and Remote Sensing Applications (EORSA), Guangzhou, China, 4–6 July 2016; IEEE: Piscataway, NJ, USA, 2016; pp. 250–254. [Google Scholar]
- Kotharkar, R.; Bagade, A. Evaluating urban heat island in the critical local climate zones of an Indian city. Landsc. Urban Plan. 2018, 169, 92–104. [Google Scholar] [CrossRef]
- Brousse, O.; Martilli, A.; Foley, M.; Mills, G.; Bechtel, B. WUDAPT, an efficient land use producing data tool for mesoscale models? Integration of urban LCZ in WRF over Madrid. Urban Clim. 2016, 17, 116–134. [Google Scholar] [CrossRef]


| Data Type | Description |
|---|---|
| Green space | The urban green space, including city parks, greenbelts, residential green, perseveration green. |
| Education area | Research Institutes, Universities, vocational schools, junior-senior high schools, elementary schools. |
| Residential quarter | Residential quarters. |
| Transportation junction | Airports, railway stations, coach stations. |
| Scenic area | City parks, historical sites, cultural and natural scenic resorts. |
| Cultural tourist area | Cultural scenic resorts |
| Medical and health service area | General hospitals, specialist clinics, community hospitals. |
| Athletic fields | Basketball fields, golf courses, football fields, gym, and sports clubs. |
| Commercial fields | Shopping mall, furniture markets, commodity wholesale market centers, etc. |
| Water networks | Urban water, lakes, reservoirs. |
| Buildings | Building boundary polygons. |
| Street networks | Expressways, ring-roads, trunk roads, and other level roads. |
| Urban Functional Zone | Abbreviation | Explanation of Division |
|---|---|---|
| Residence Zone | REZ | Impervious, construction material; typical urban communities including multiple family houses and high buildings. |
| Campus Zone | CPZ | Areas for schools, colleges, institutes, government, hospitals, embassies, military bases, etc. |
| Center Business District Zone | CBZ | The concentration of commercial and business. Such as headquarters of insurance, banking, and software companies. It is normally located in the city center. |
| General Commercial Zone | GCZ | General commercial activities, such as shops, hotels, wholesale markets, etc. |
| Agricultural Zone | AGZ | Crops, gardens, and other herbaceous vegetation. |
| Industrial Zone | IDZ | The concentration of factories, workshop, and warehouses. |
| City Water Zone | CWZ | All areas of open water, including rivers, reservoirs, and lakes. |
| Recreation Green Zone | RGZ | Urban parks, golf courses, soccer fields, and other recreation areas. |
| Preservation Green Zone | PGZ | Successional distribution of trees, shrubs, and brushes, such as shelter-forest, isolation belt, urban forest, etc. Natural and manmade grassland. |
| Public Zone | PBZ | City large-scale square, airports, railway stations, coach stations. |
| Main Road Zone | MRZ | Streets, main roads, etc. |
Publisher’s Note: MDPI stays neutral with regard to jurisdictional claims in published maps and institutional affiliations. |
© 2021 by the authors. Licensee MDPI, Basel, Switzerland. This article is an open access article distributed under the terms and conditions of the Creative Commons Attribution (CC BY) license (http://creativecommons.org/licenses/by/4.0/).
Share and Cite
Yu, Z.; Jing, Y.; Yang, G.; Sun, R. A New Urban Functional Zone-Based Climate Zoning System for Urban Temperature Study. Remote Sens. 2021, 13, 251. https://doi.org/10.3390/rs13020251
Yu Z, Jing Y, Yang G, Sun R. A New Urban Functional Zone-Based Climate Zoning System for Urban Temperature Study. Remote Sensing. 2021; 13(2):251. https://doi.org/10.3390/rs13020251
Chicago/Turabian StyleYu, Zhaowu, Yongcai Jing, Gaoyuan Yang, and Ranhao Sun. 2021. "A New Urban Functional Zone-Based Climate Zoning System for Urban Temperature Study" Remote Sensing 13, no. 2: 251. https://doi.org/10.3390/rs13020251
APA StyleYu, Z., Jing, Y., Yang, G., & Sun, R. (2021). A New Urban Functional Zone-Based Climate Zoning System for Urban Temperature Study. Remote Sensing, 13(2), 251. https://doi.org/10.3390/rs13020251