Mapping Large-Scale Mangroves along the Maritime Silk Road from 1990 to 2015 Using a Novel Deep Learning Model and Landsat Data


Abstract
1. Introduction
2. Materials
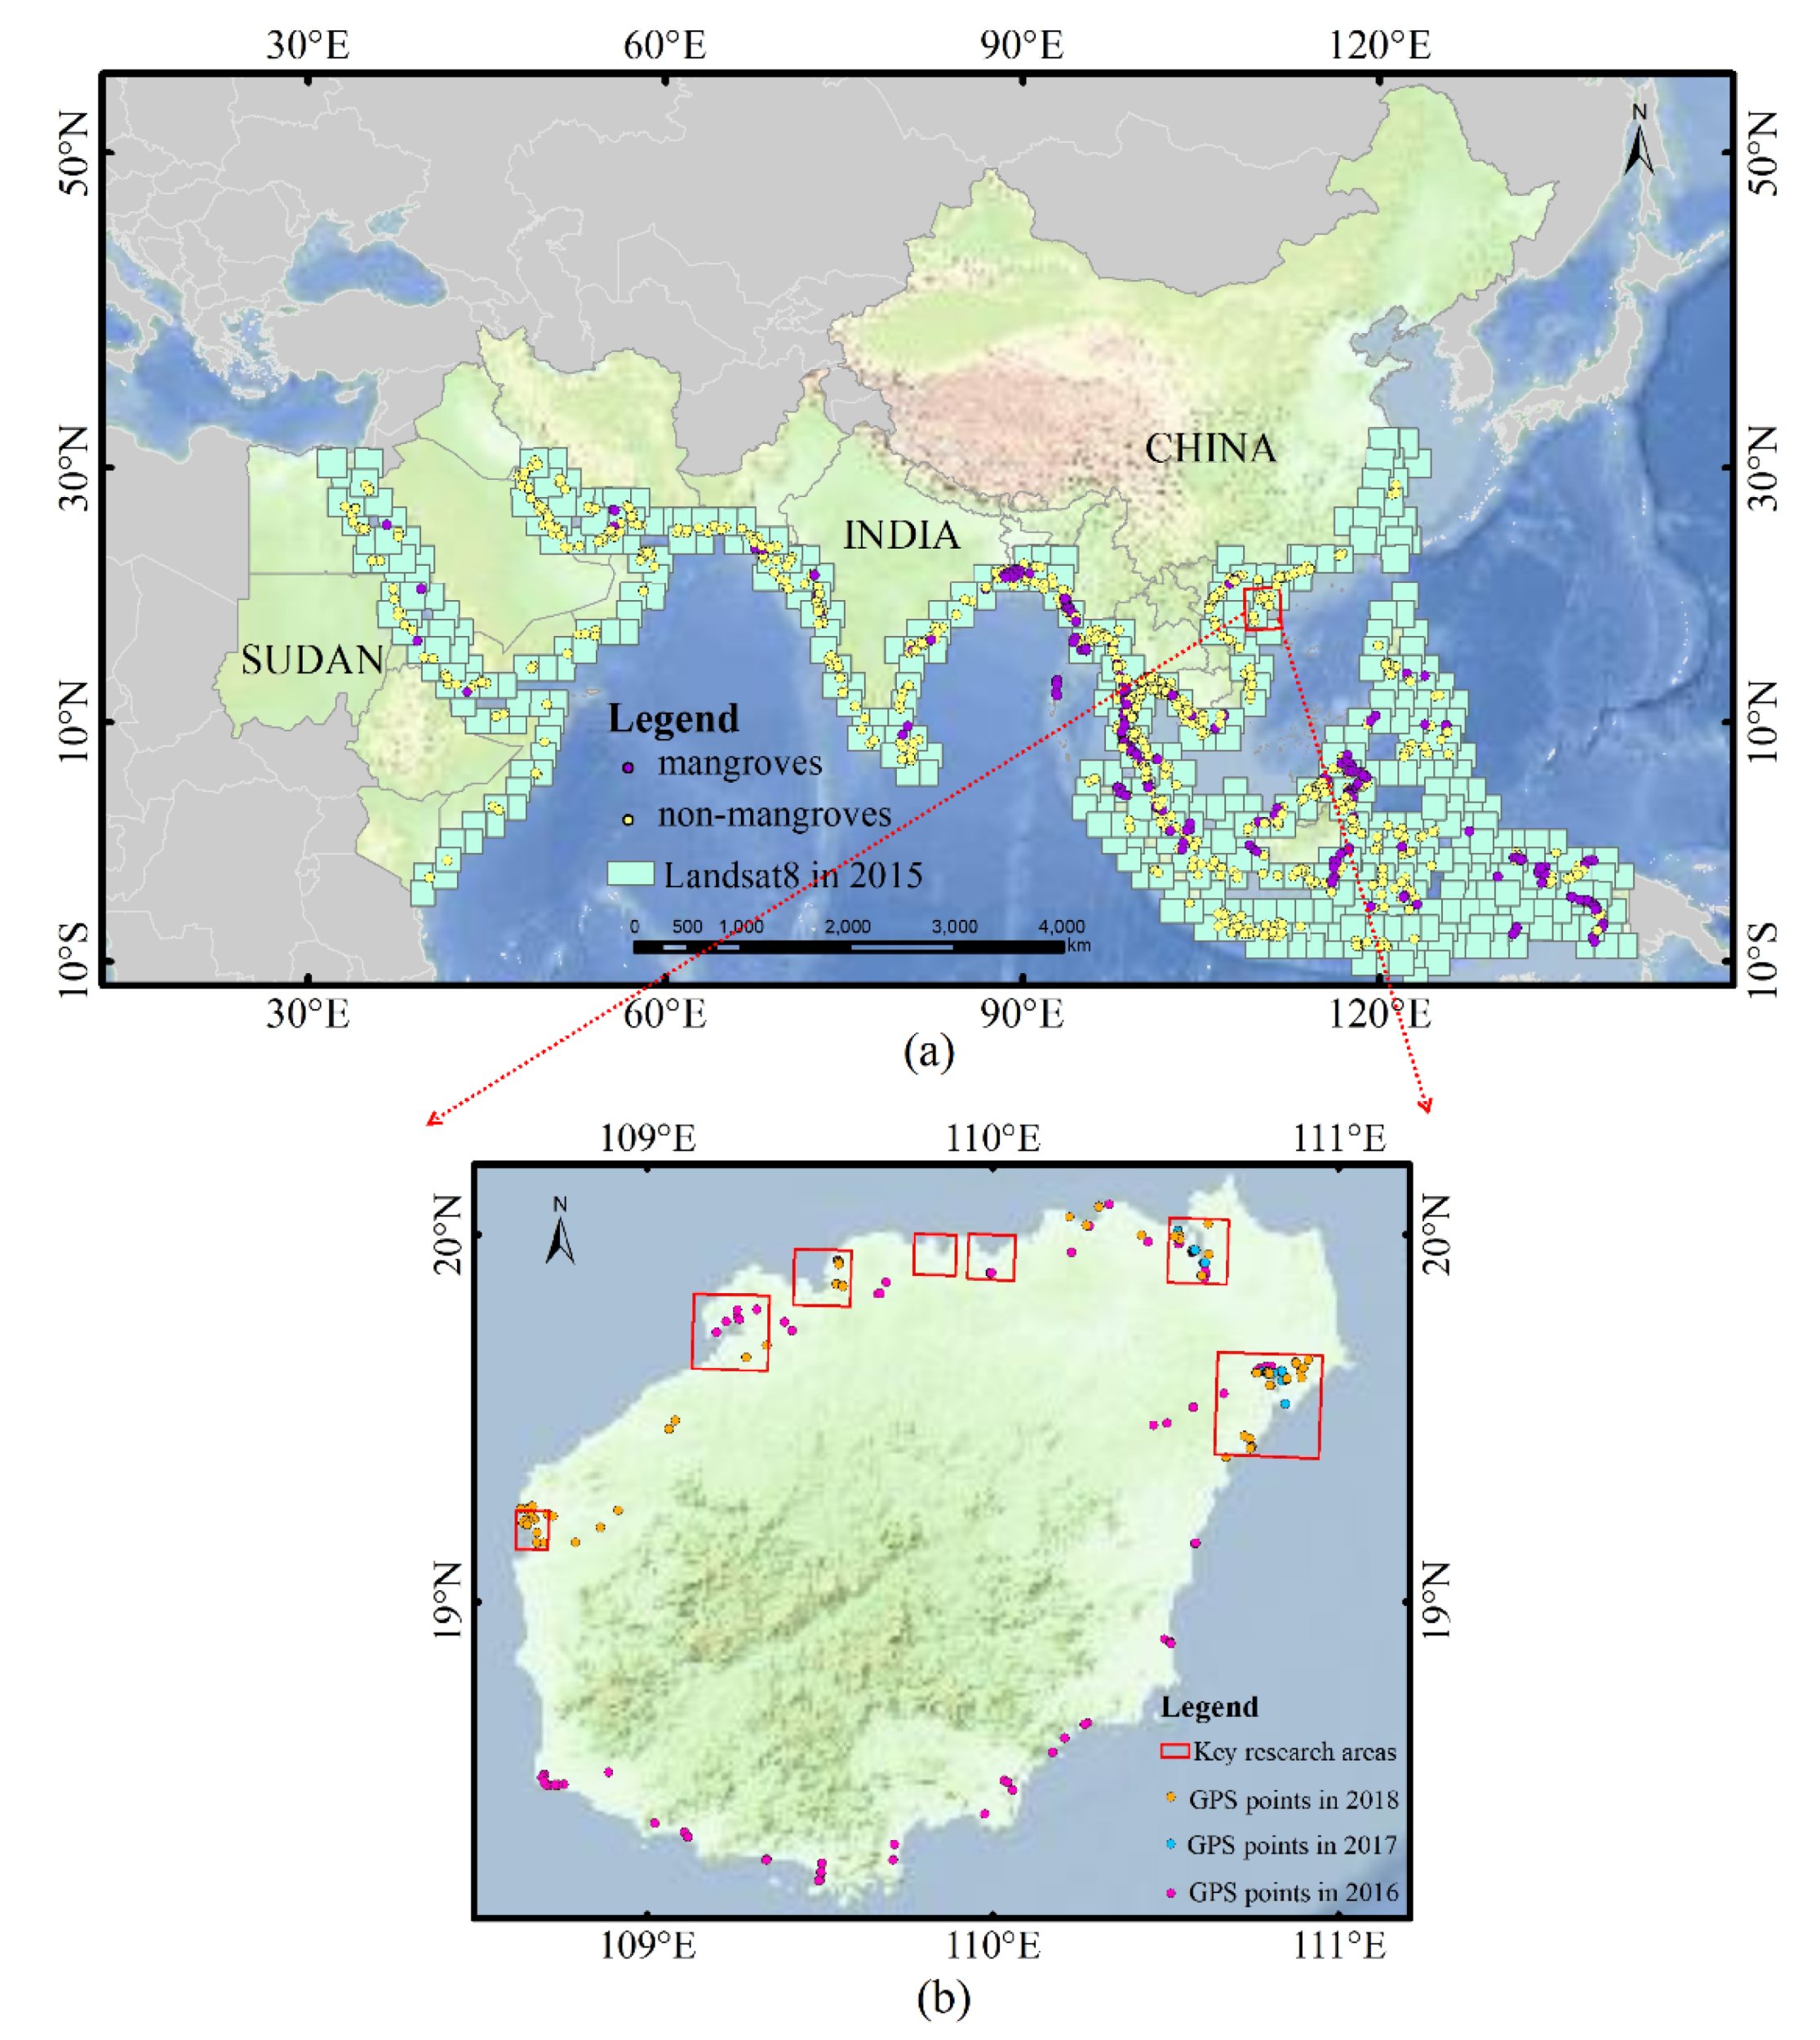
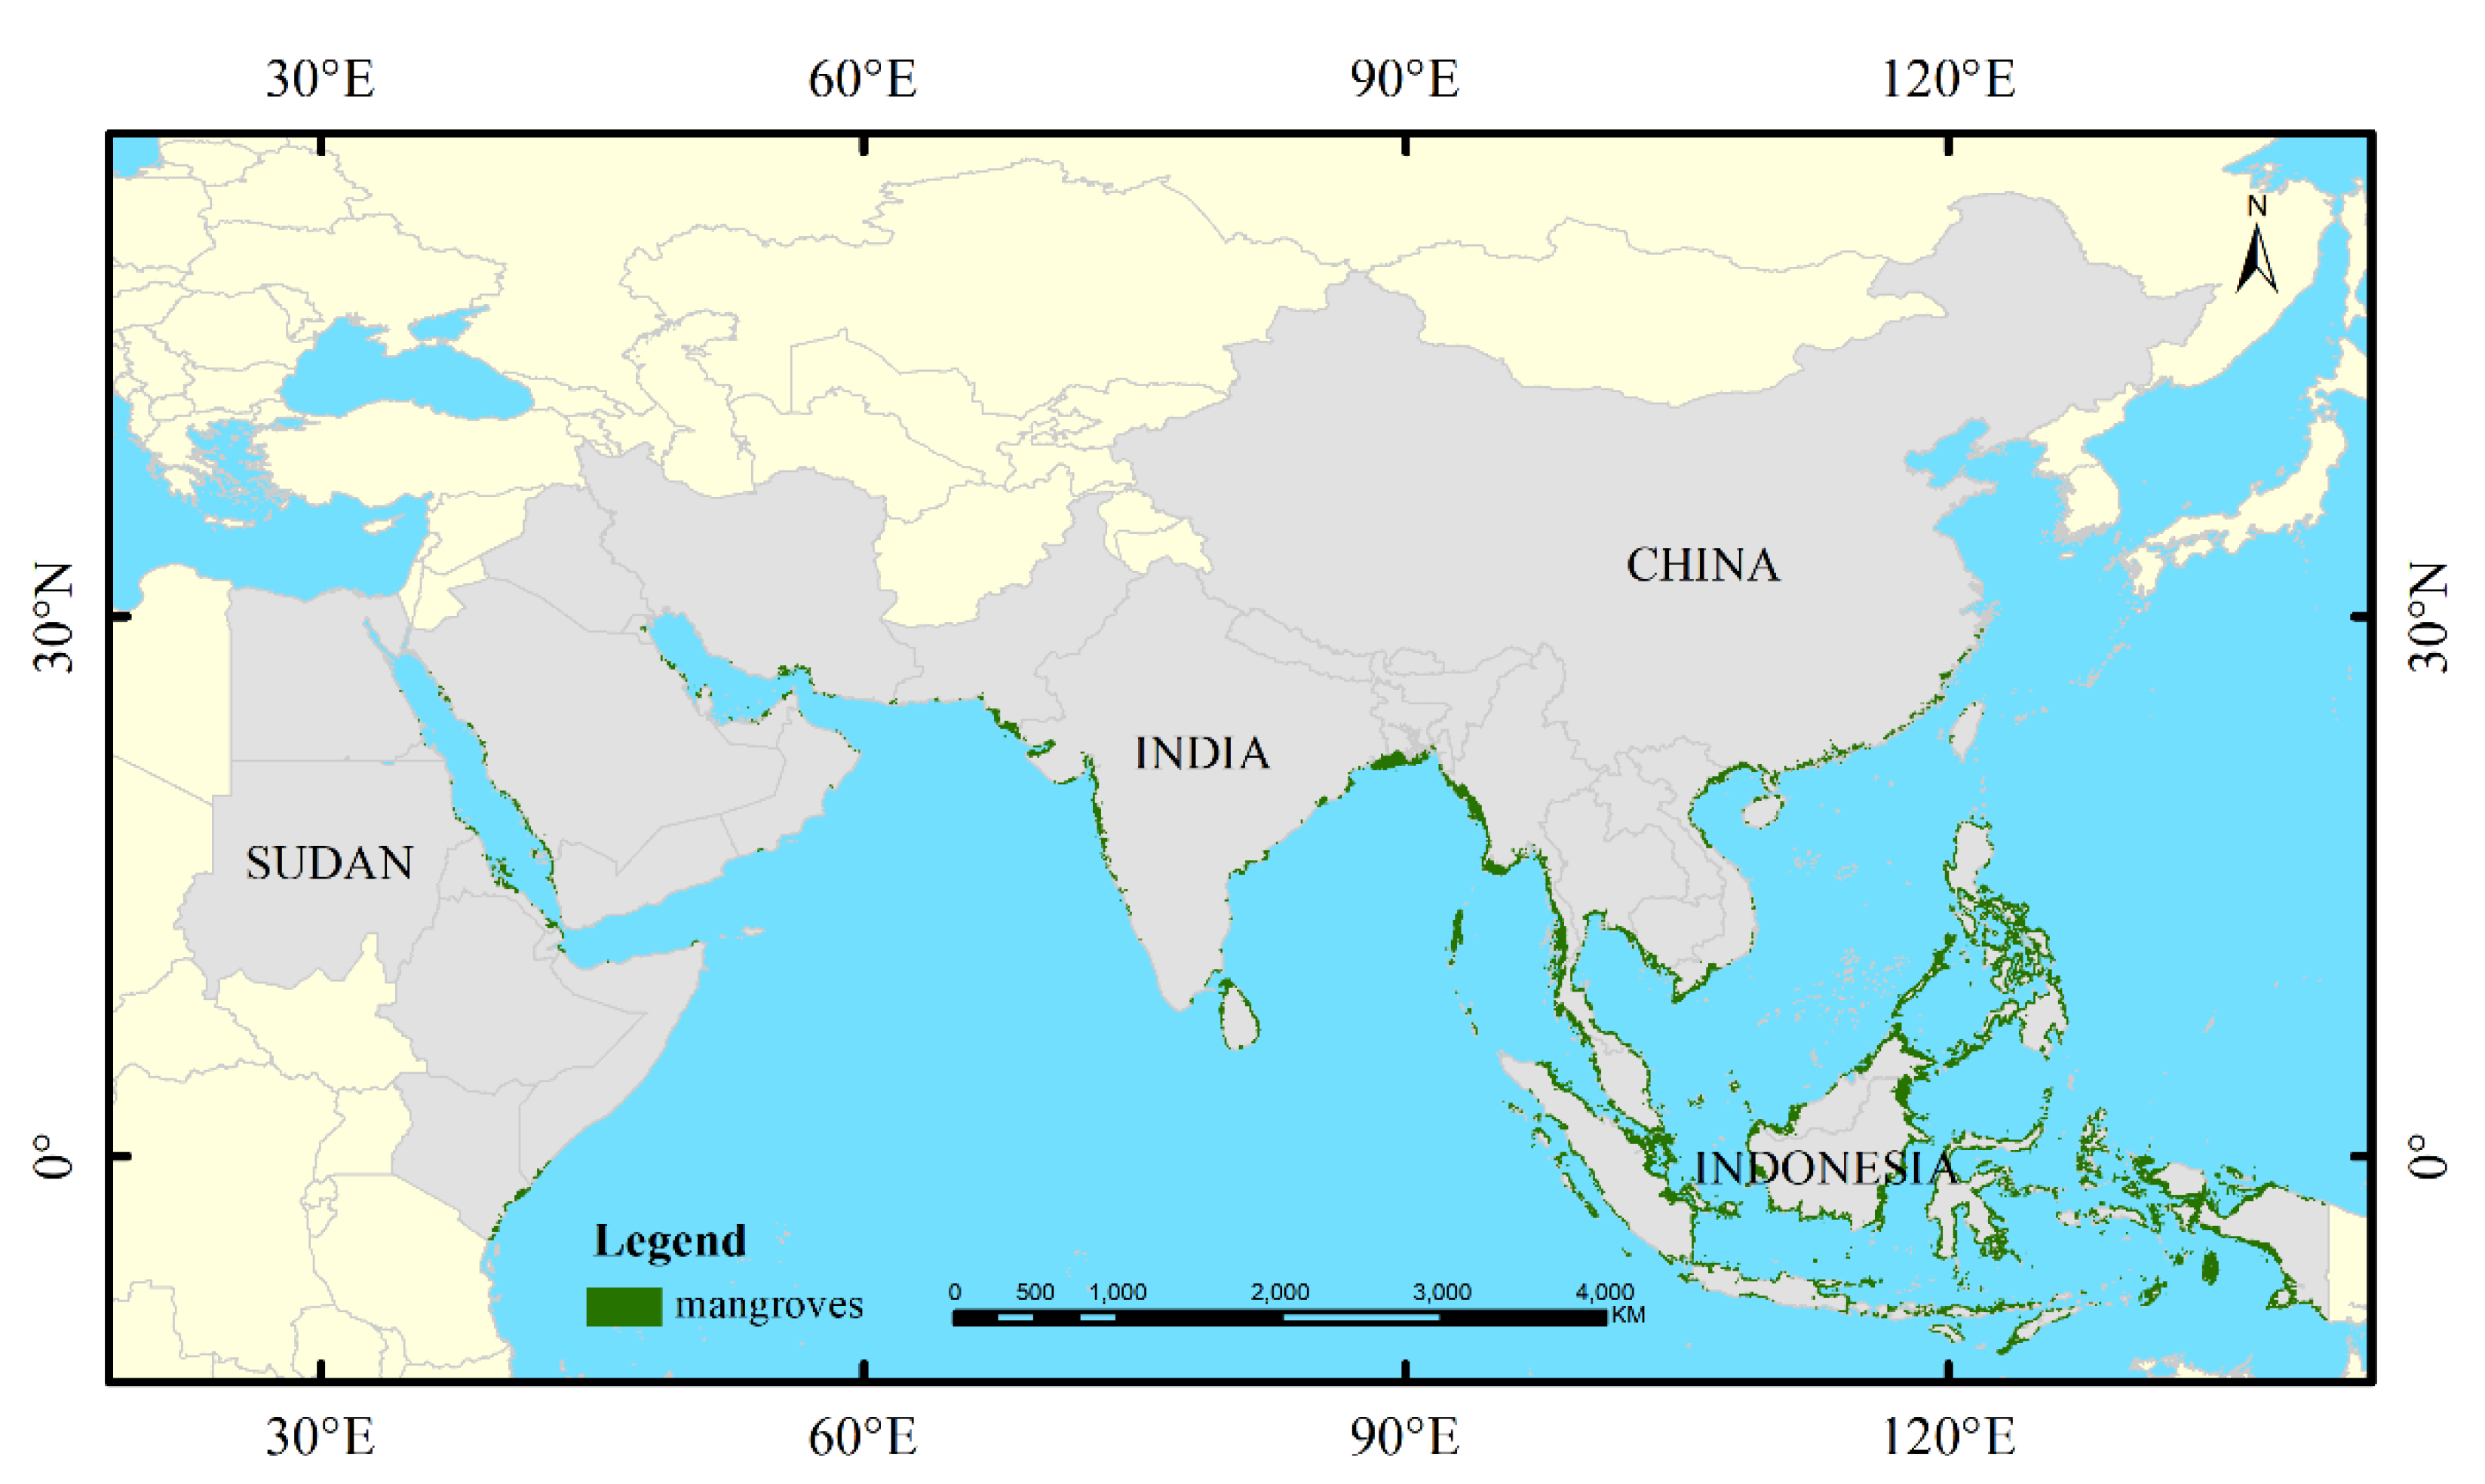
2.1. Study Area
2.2. Landsat Data and Pre-Processing
2.3. Training and Validation Data for Models
2.4. Sample of Accuracy Assessment
3. Methods
3.1. U-Net
3.2. Capsules-Unet
3.3. Accuracy Assessment
4. Results and Discussion
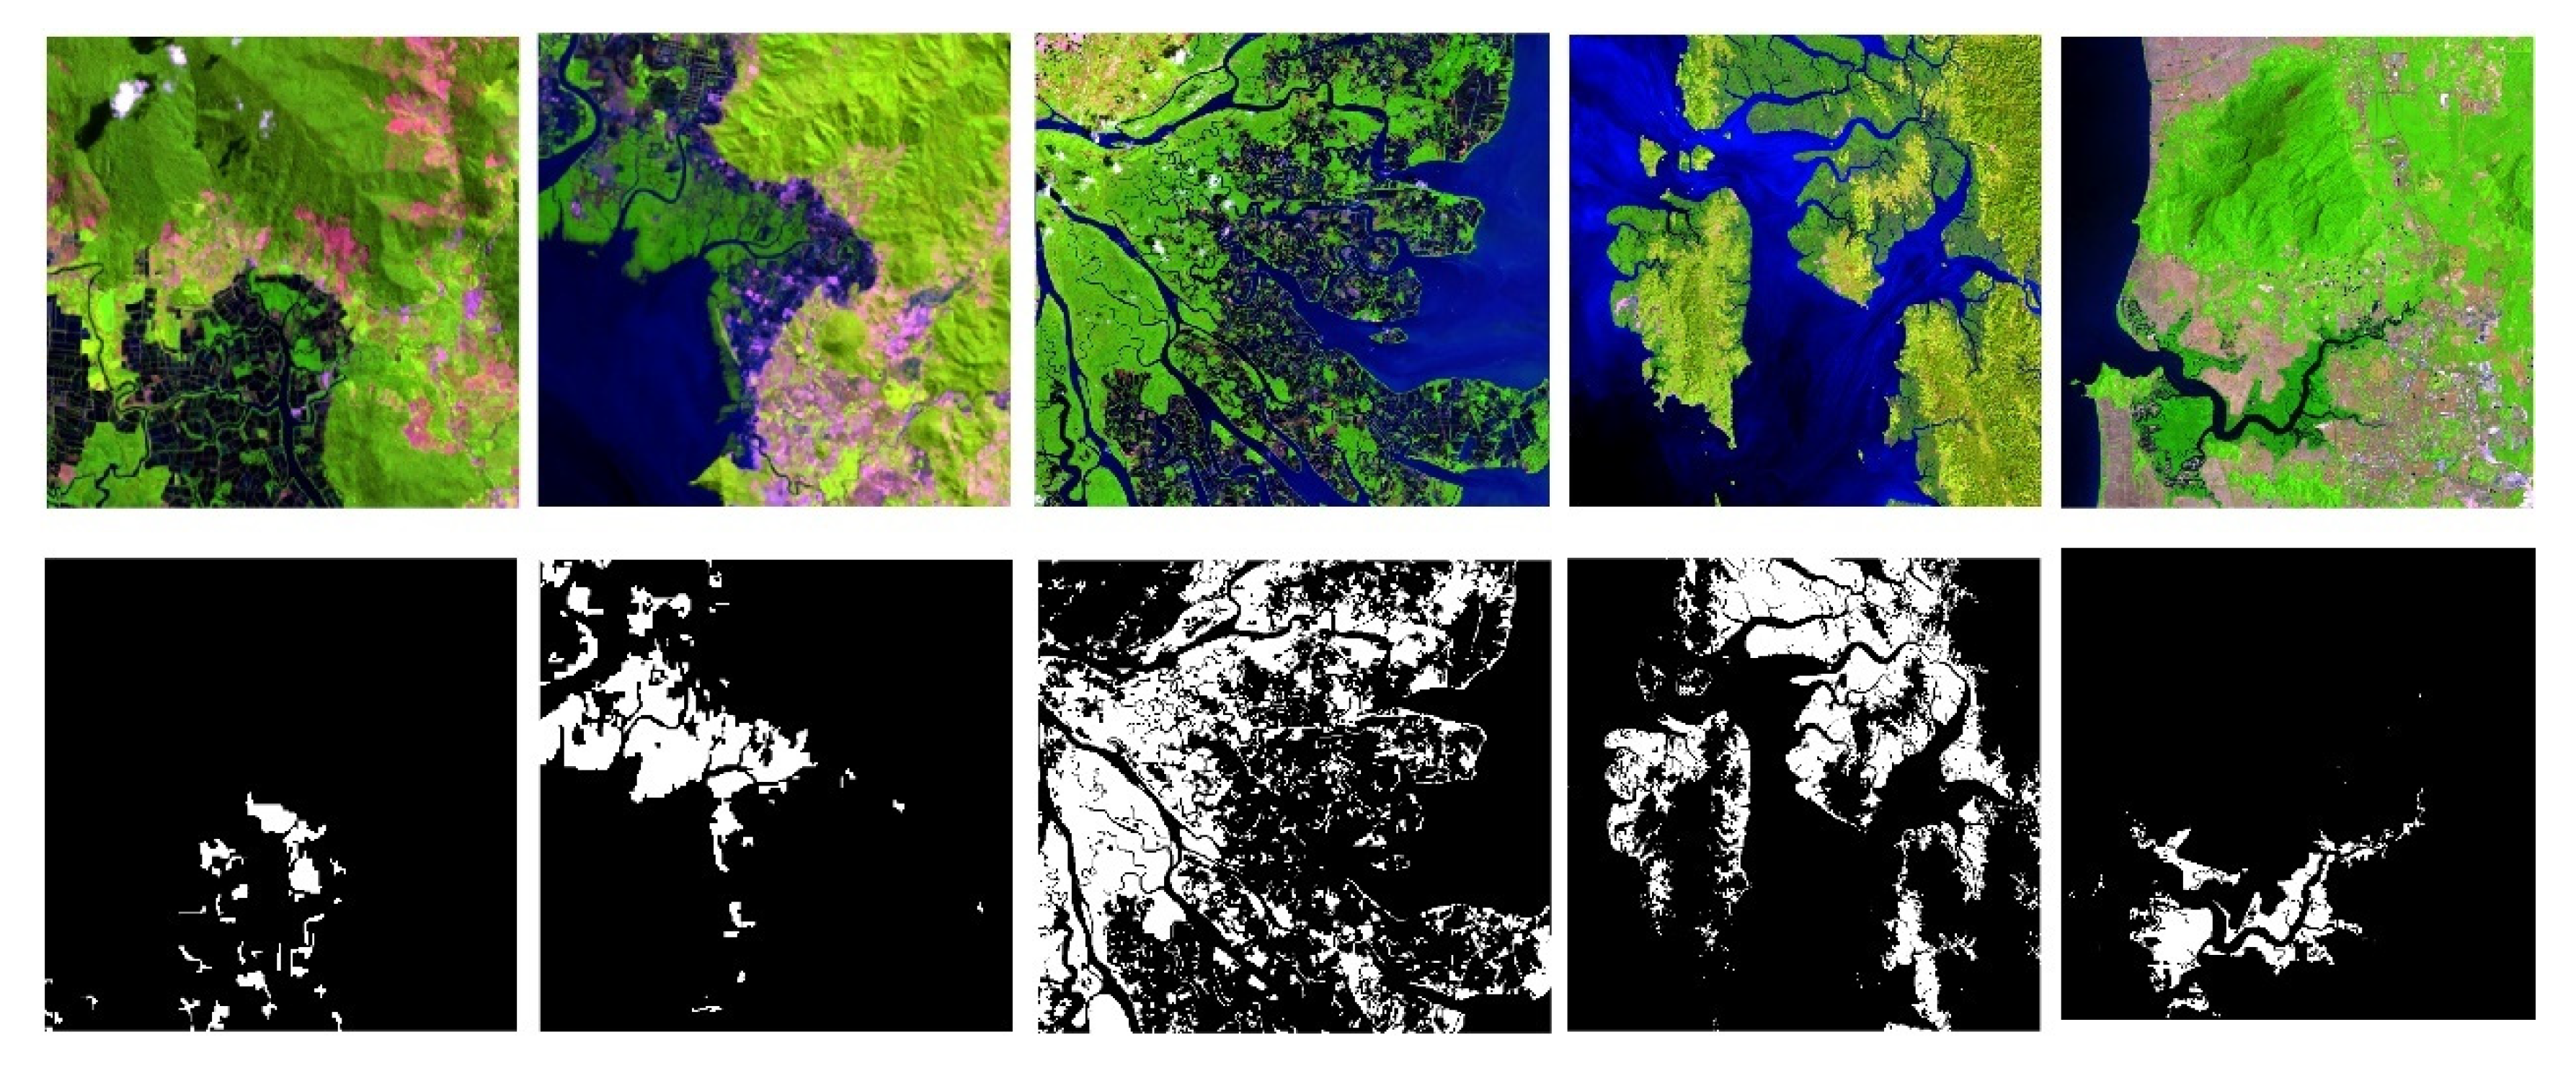
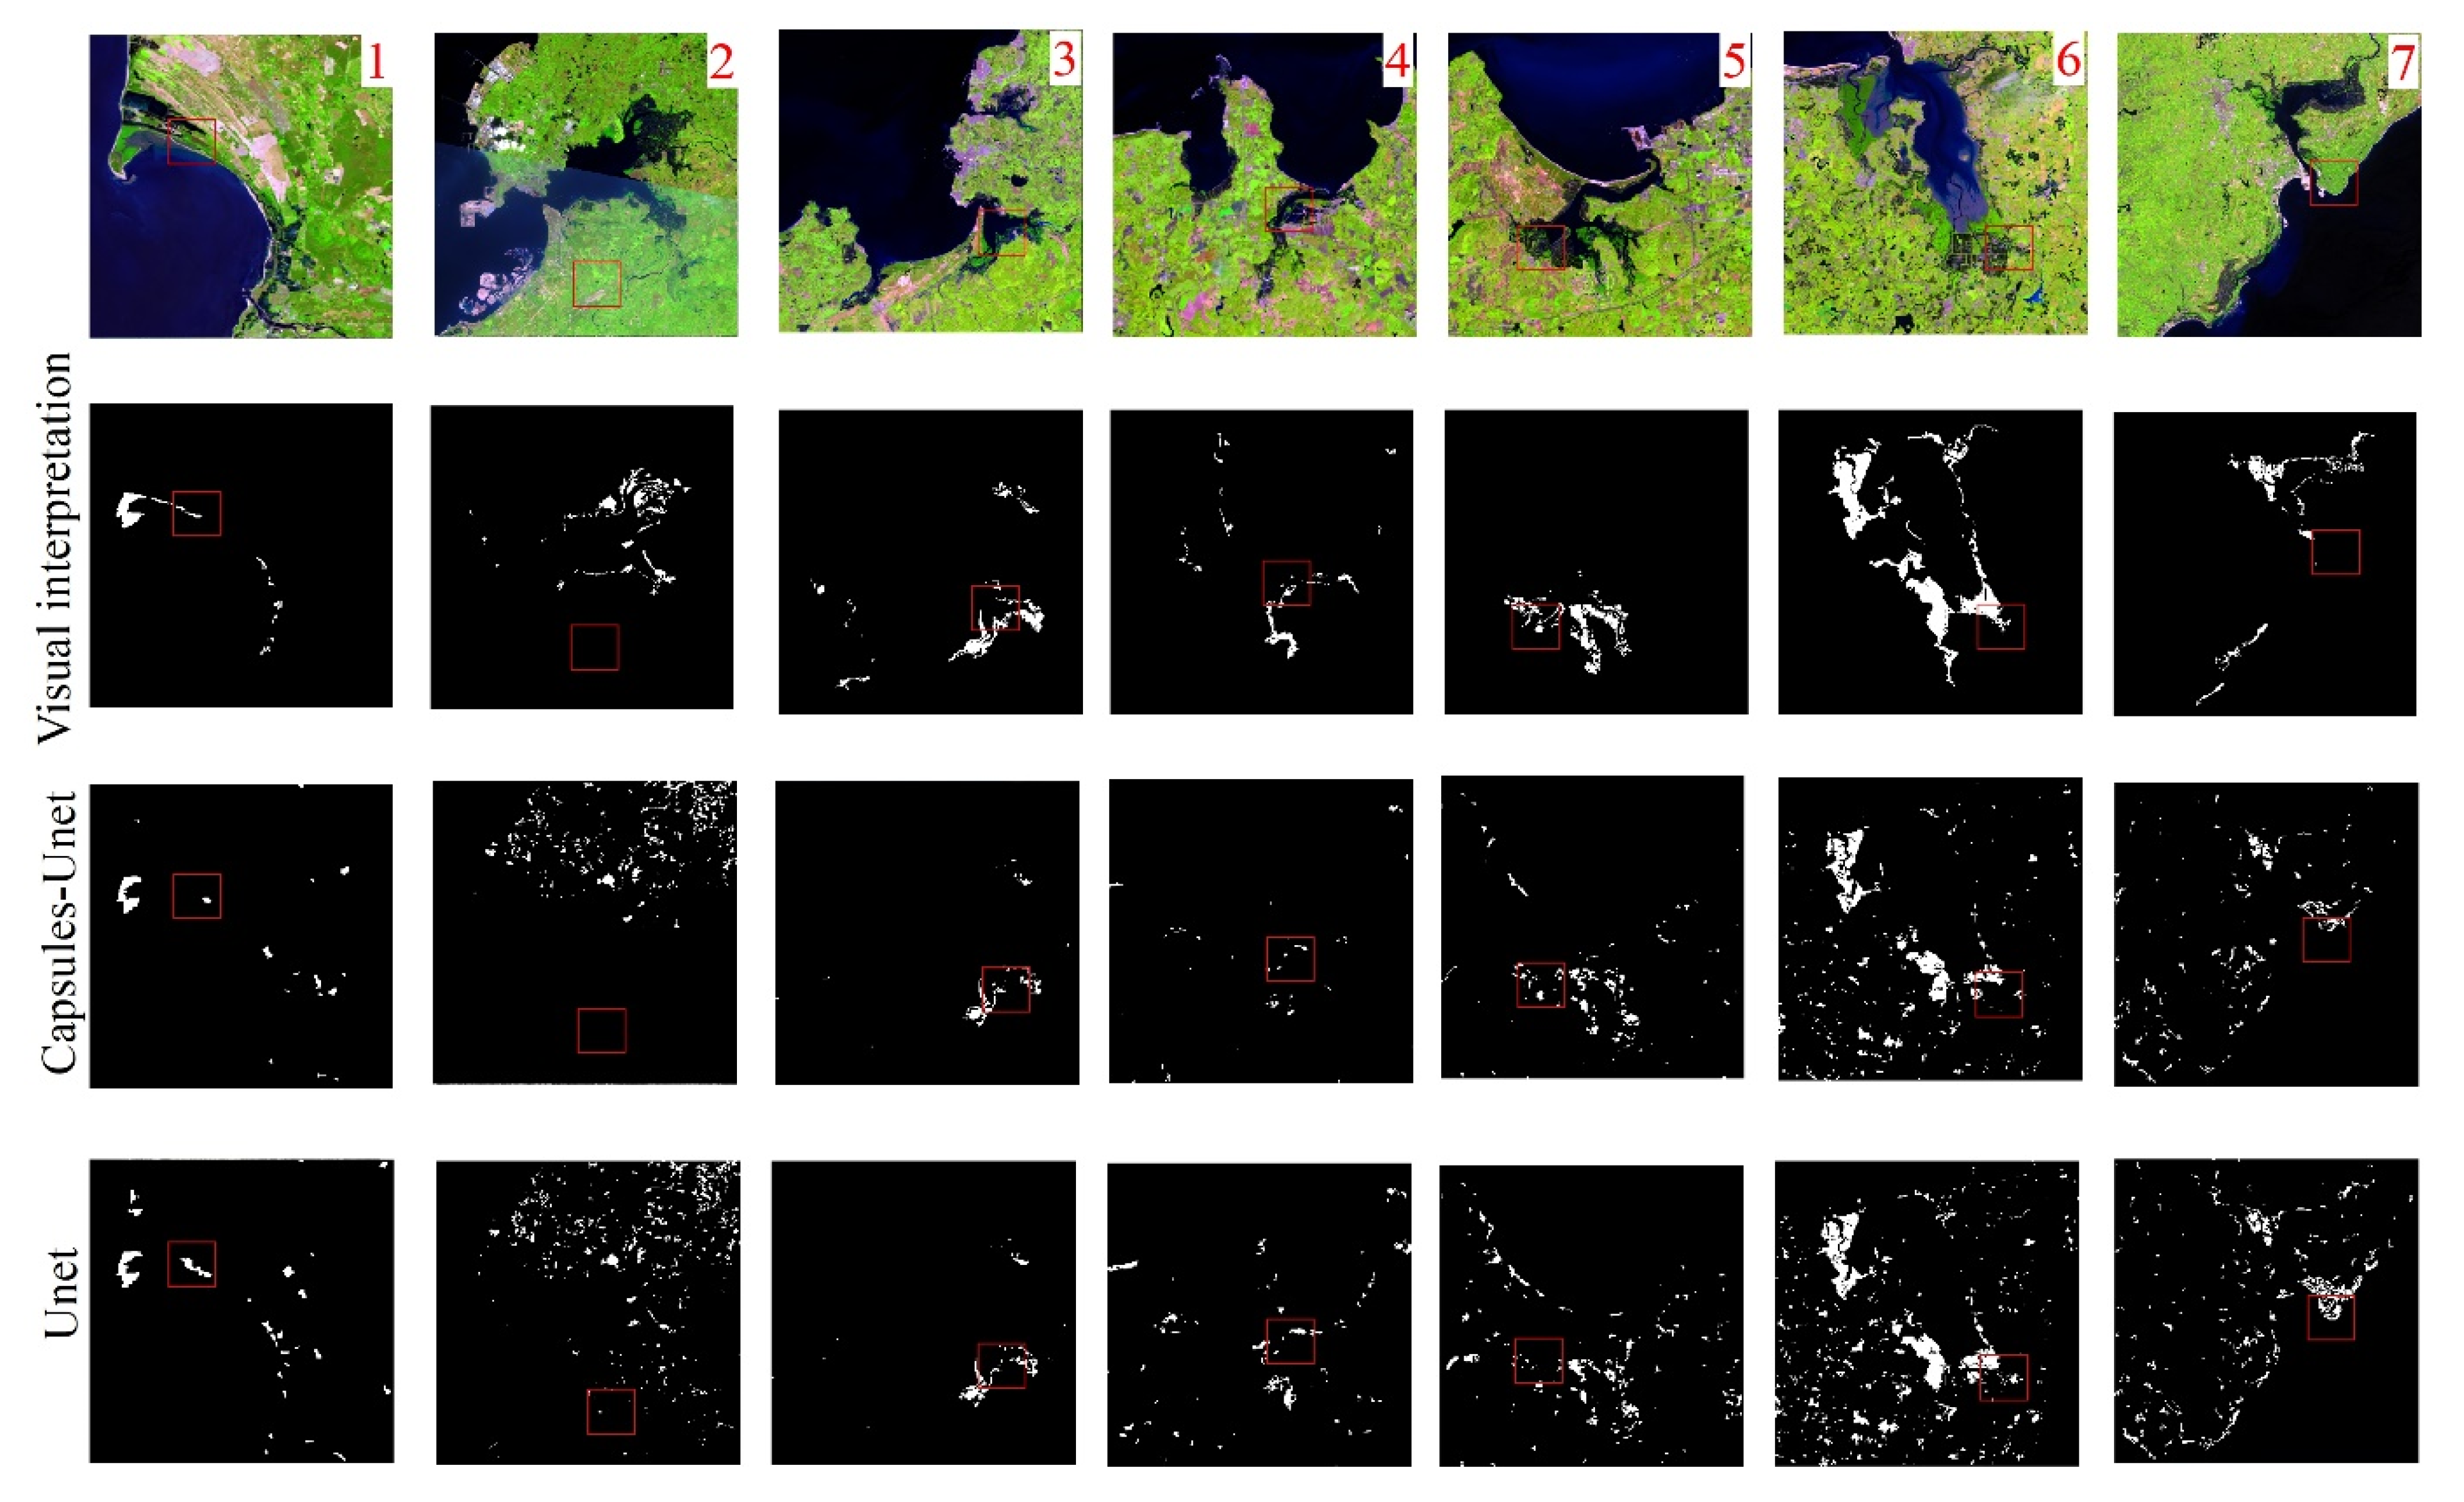
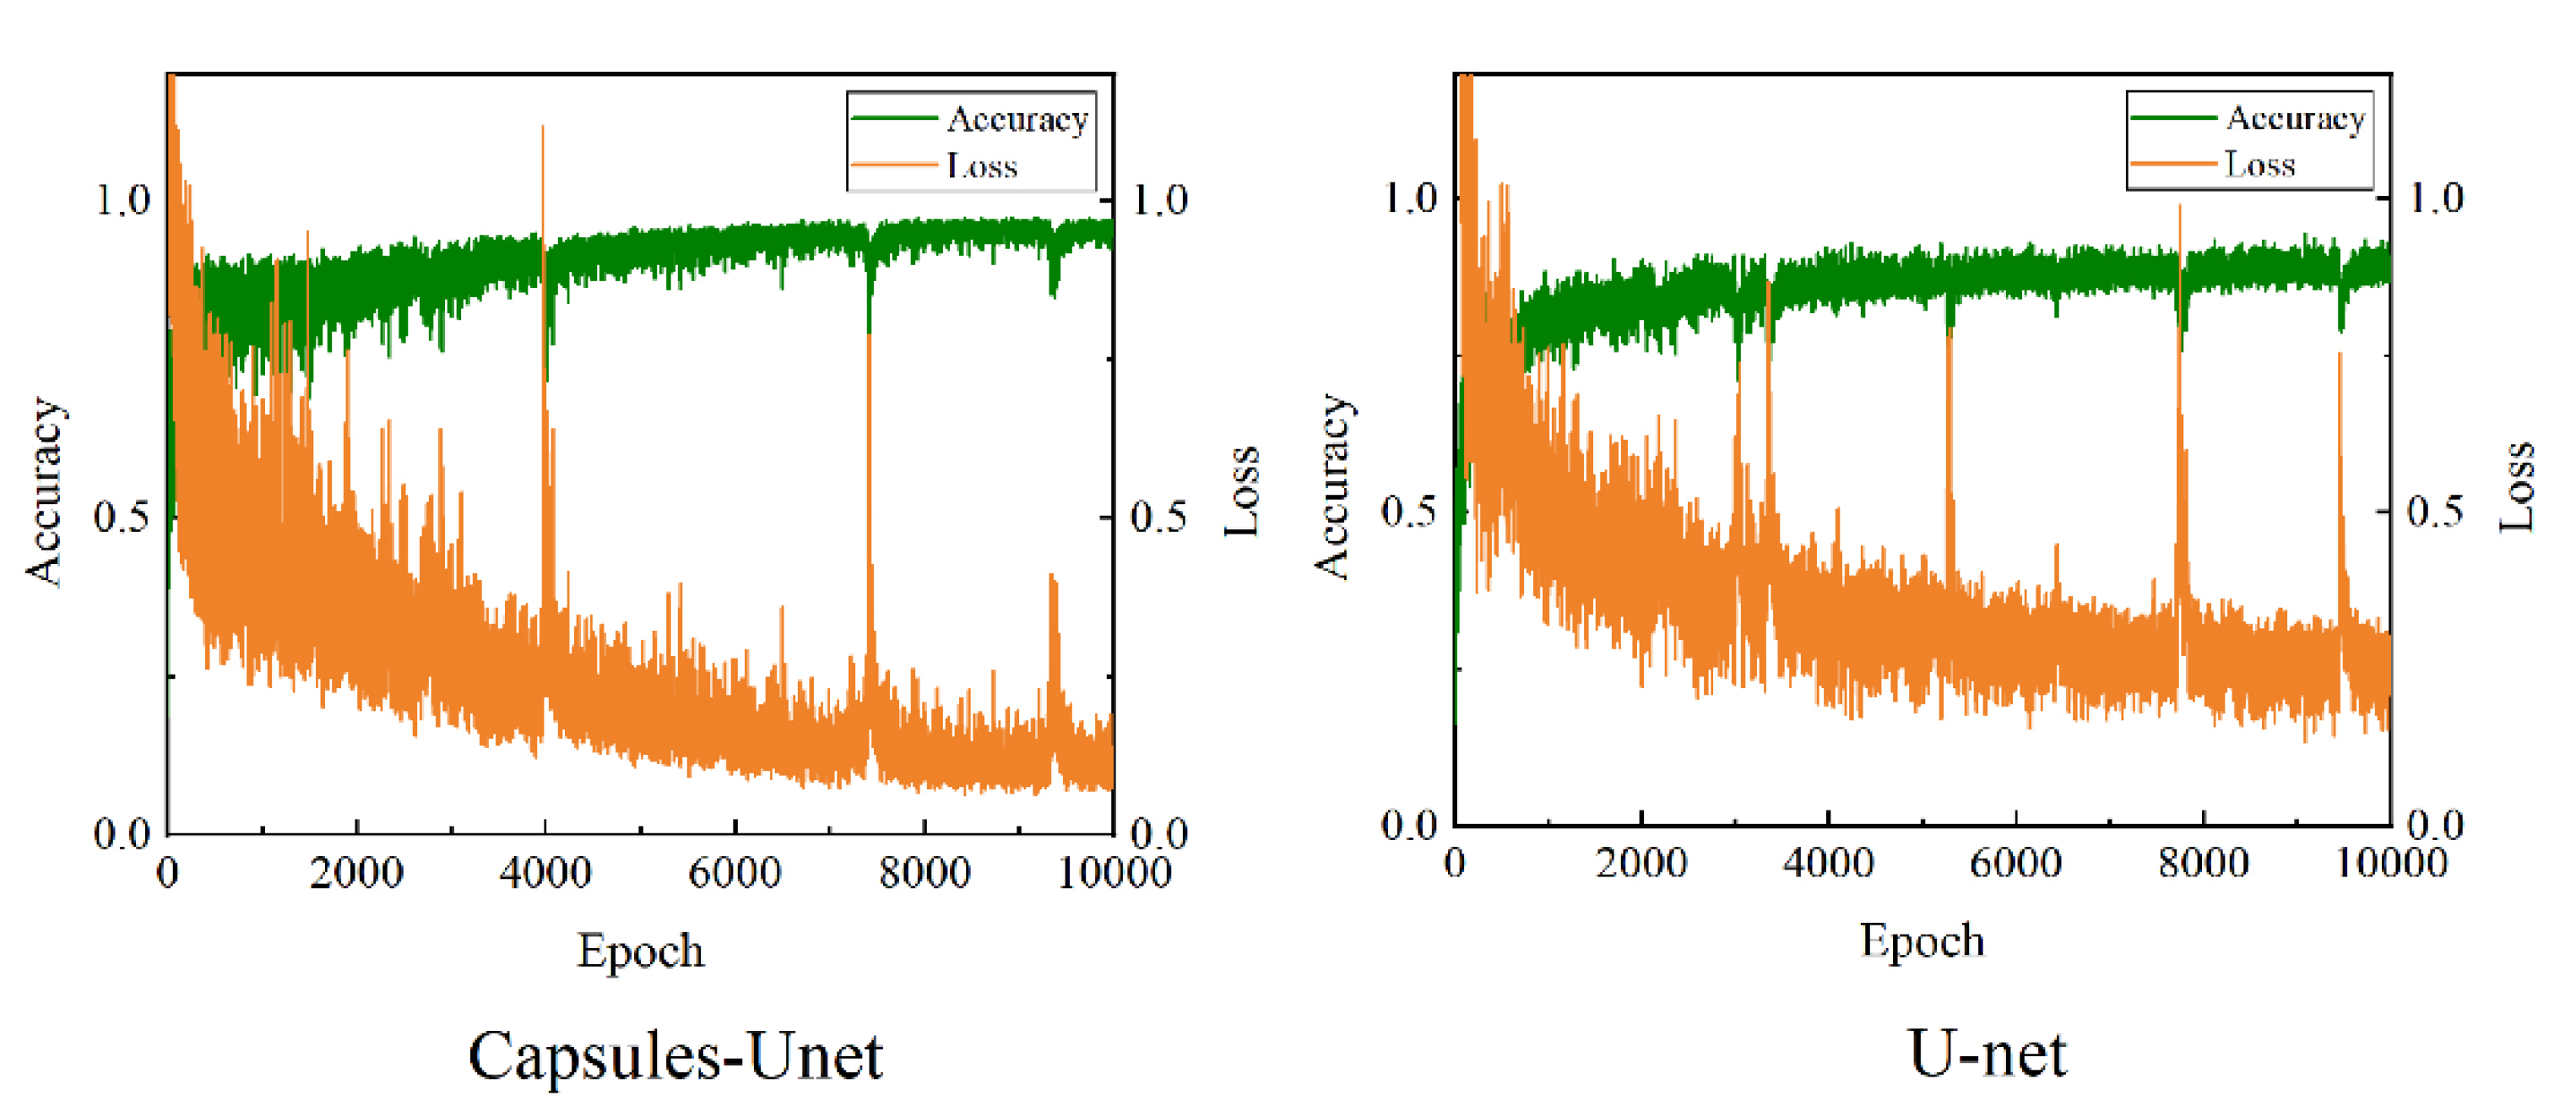
4.1. Validation of the Model
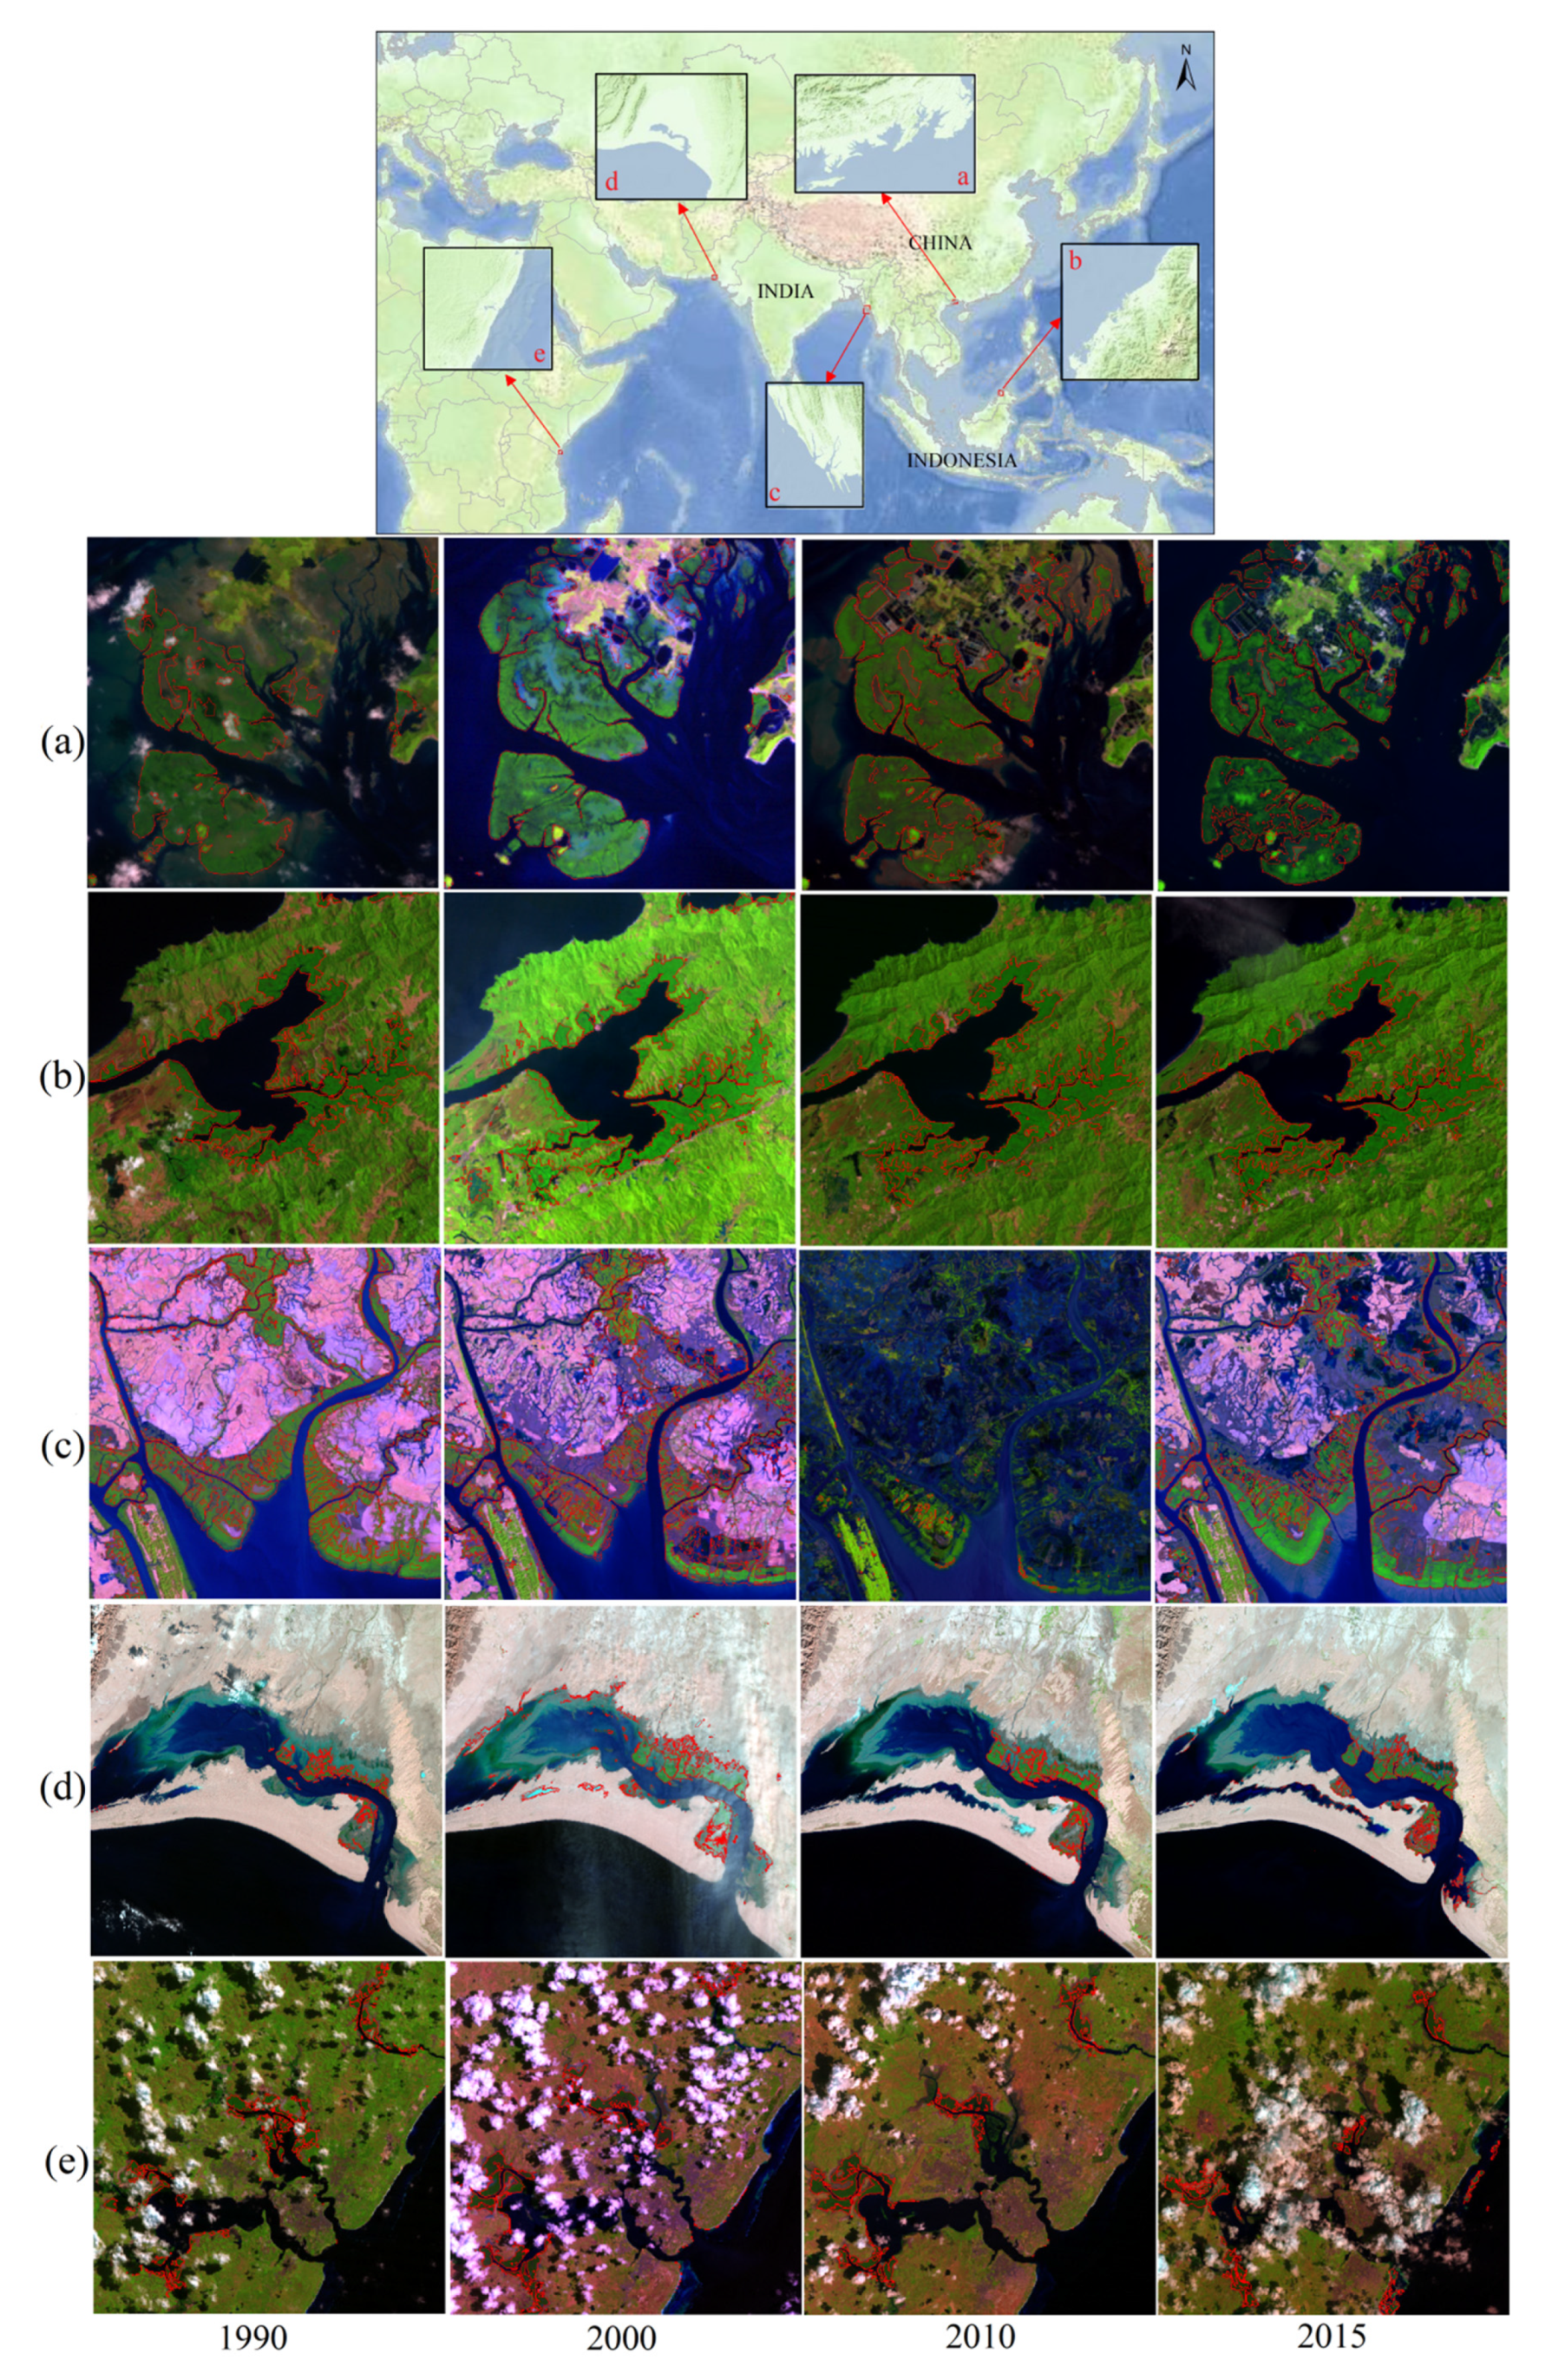
4.2. Classification Results of the Maritime Silk Road
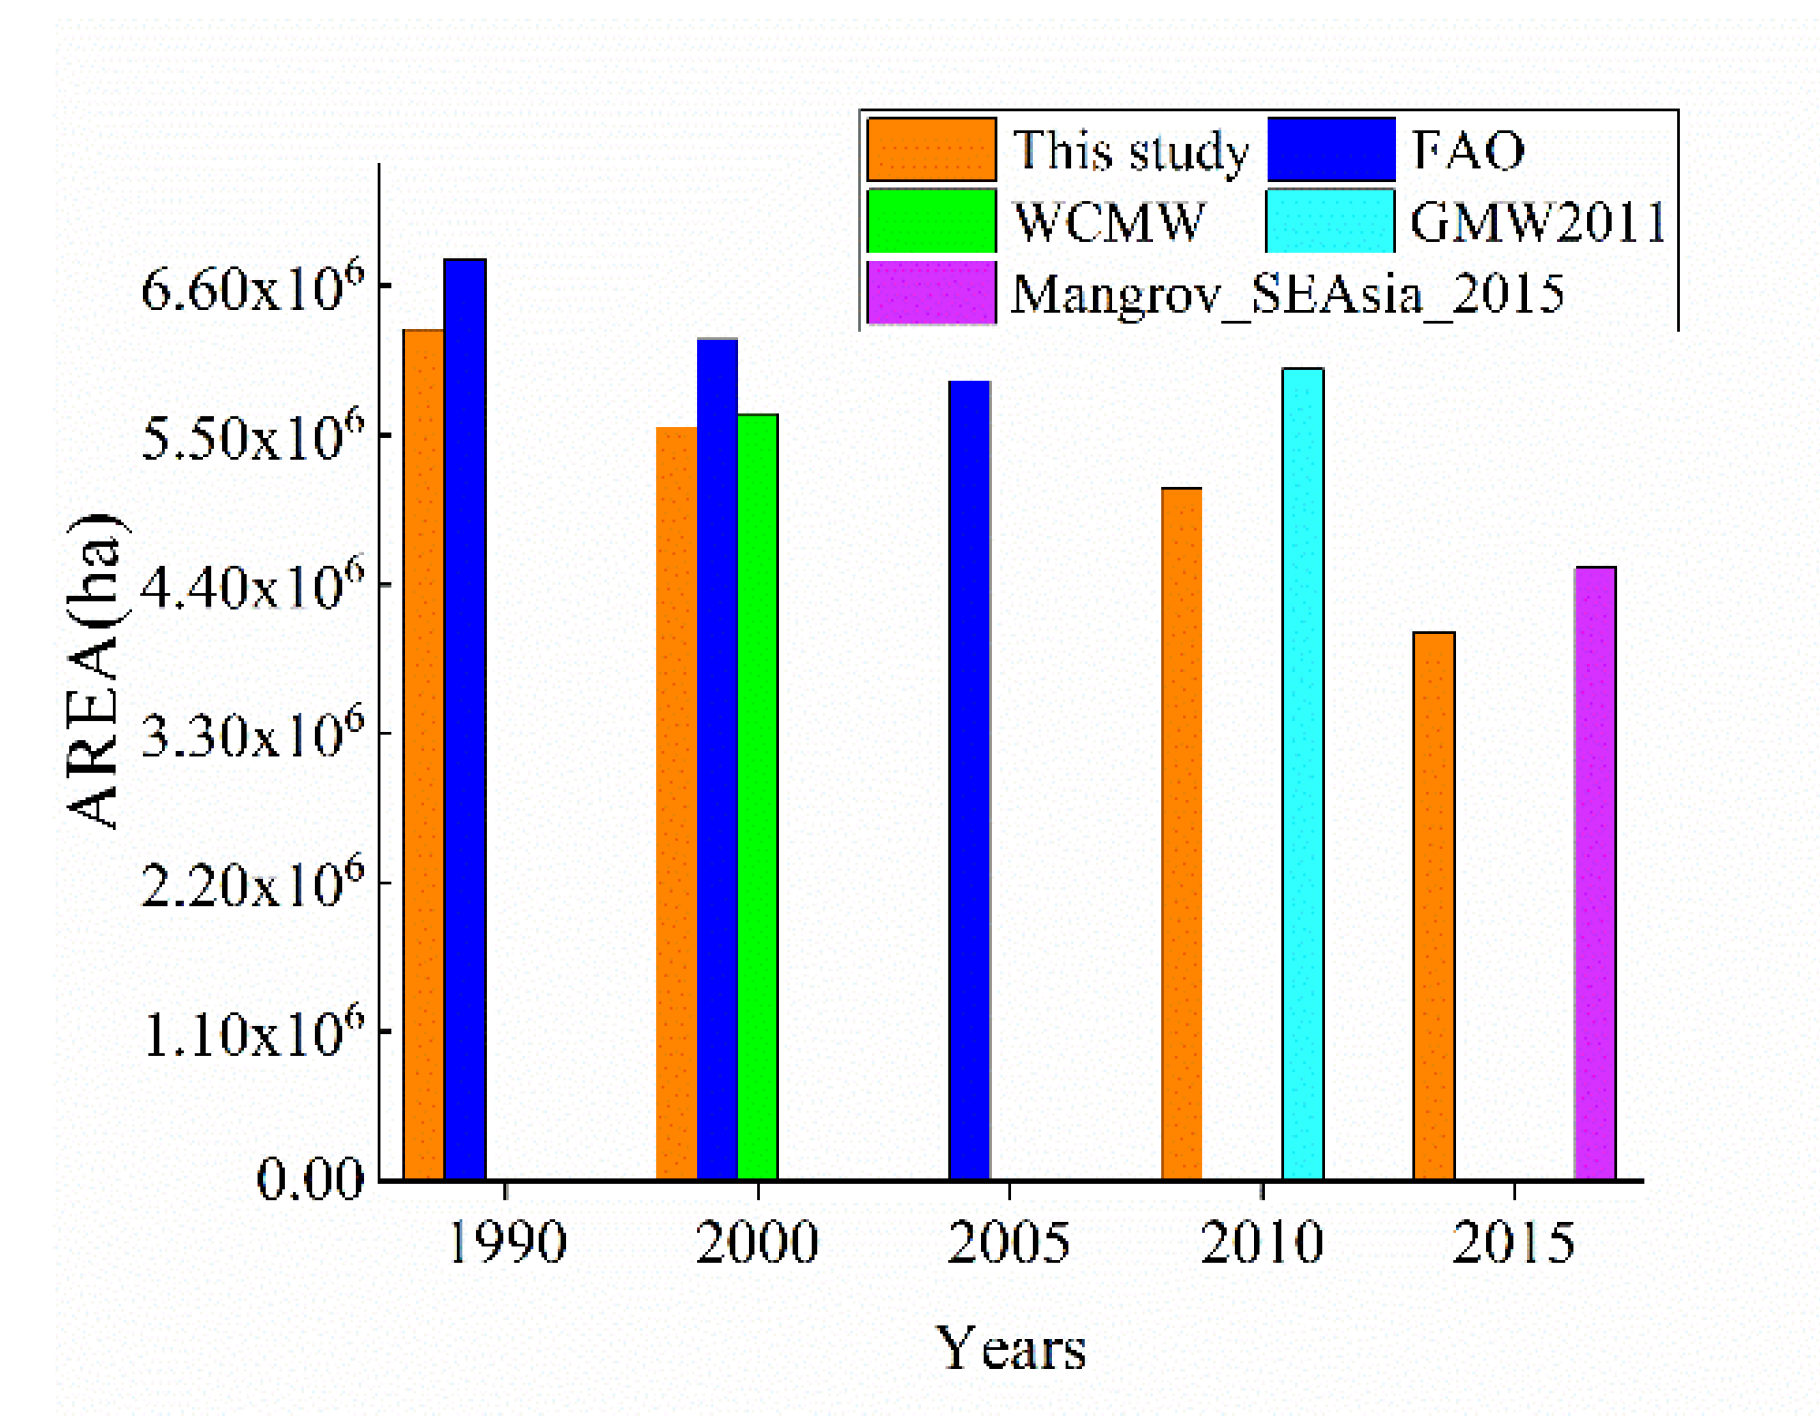
4.3. Comparison and Analysis with Other Data Sets
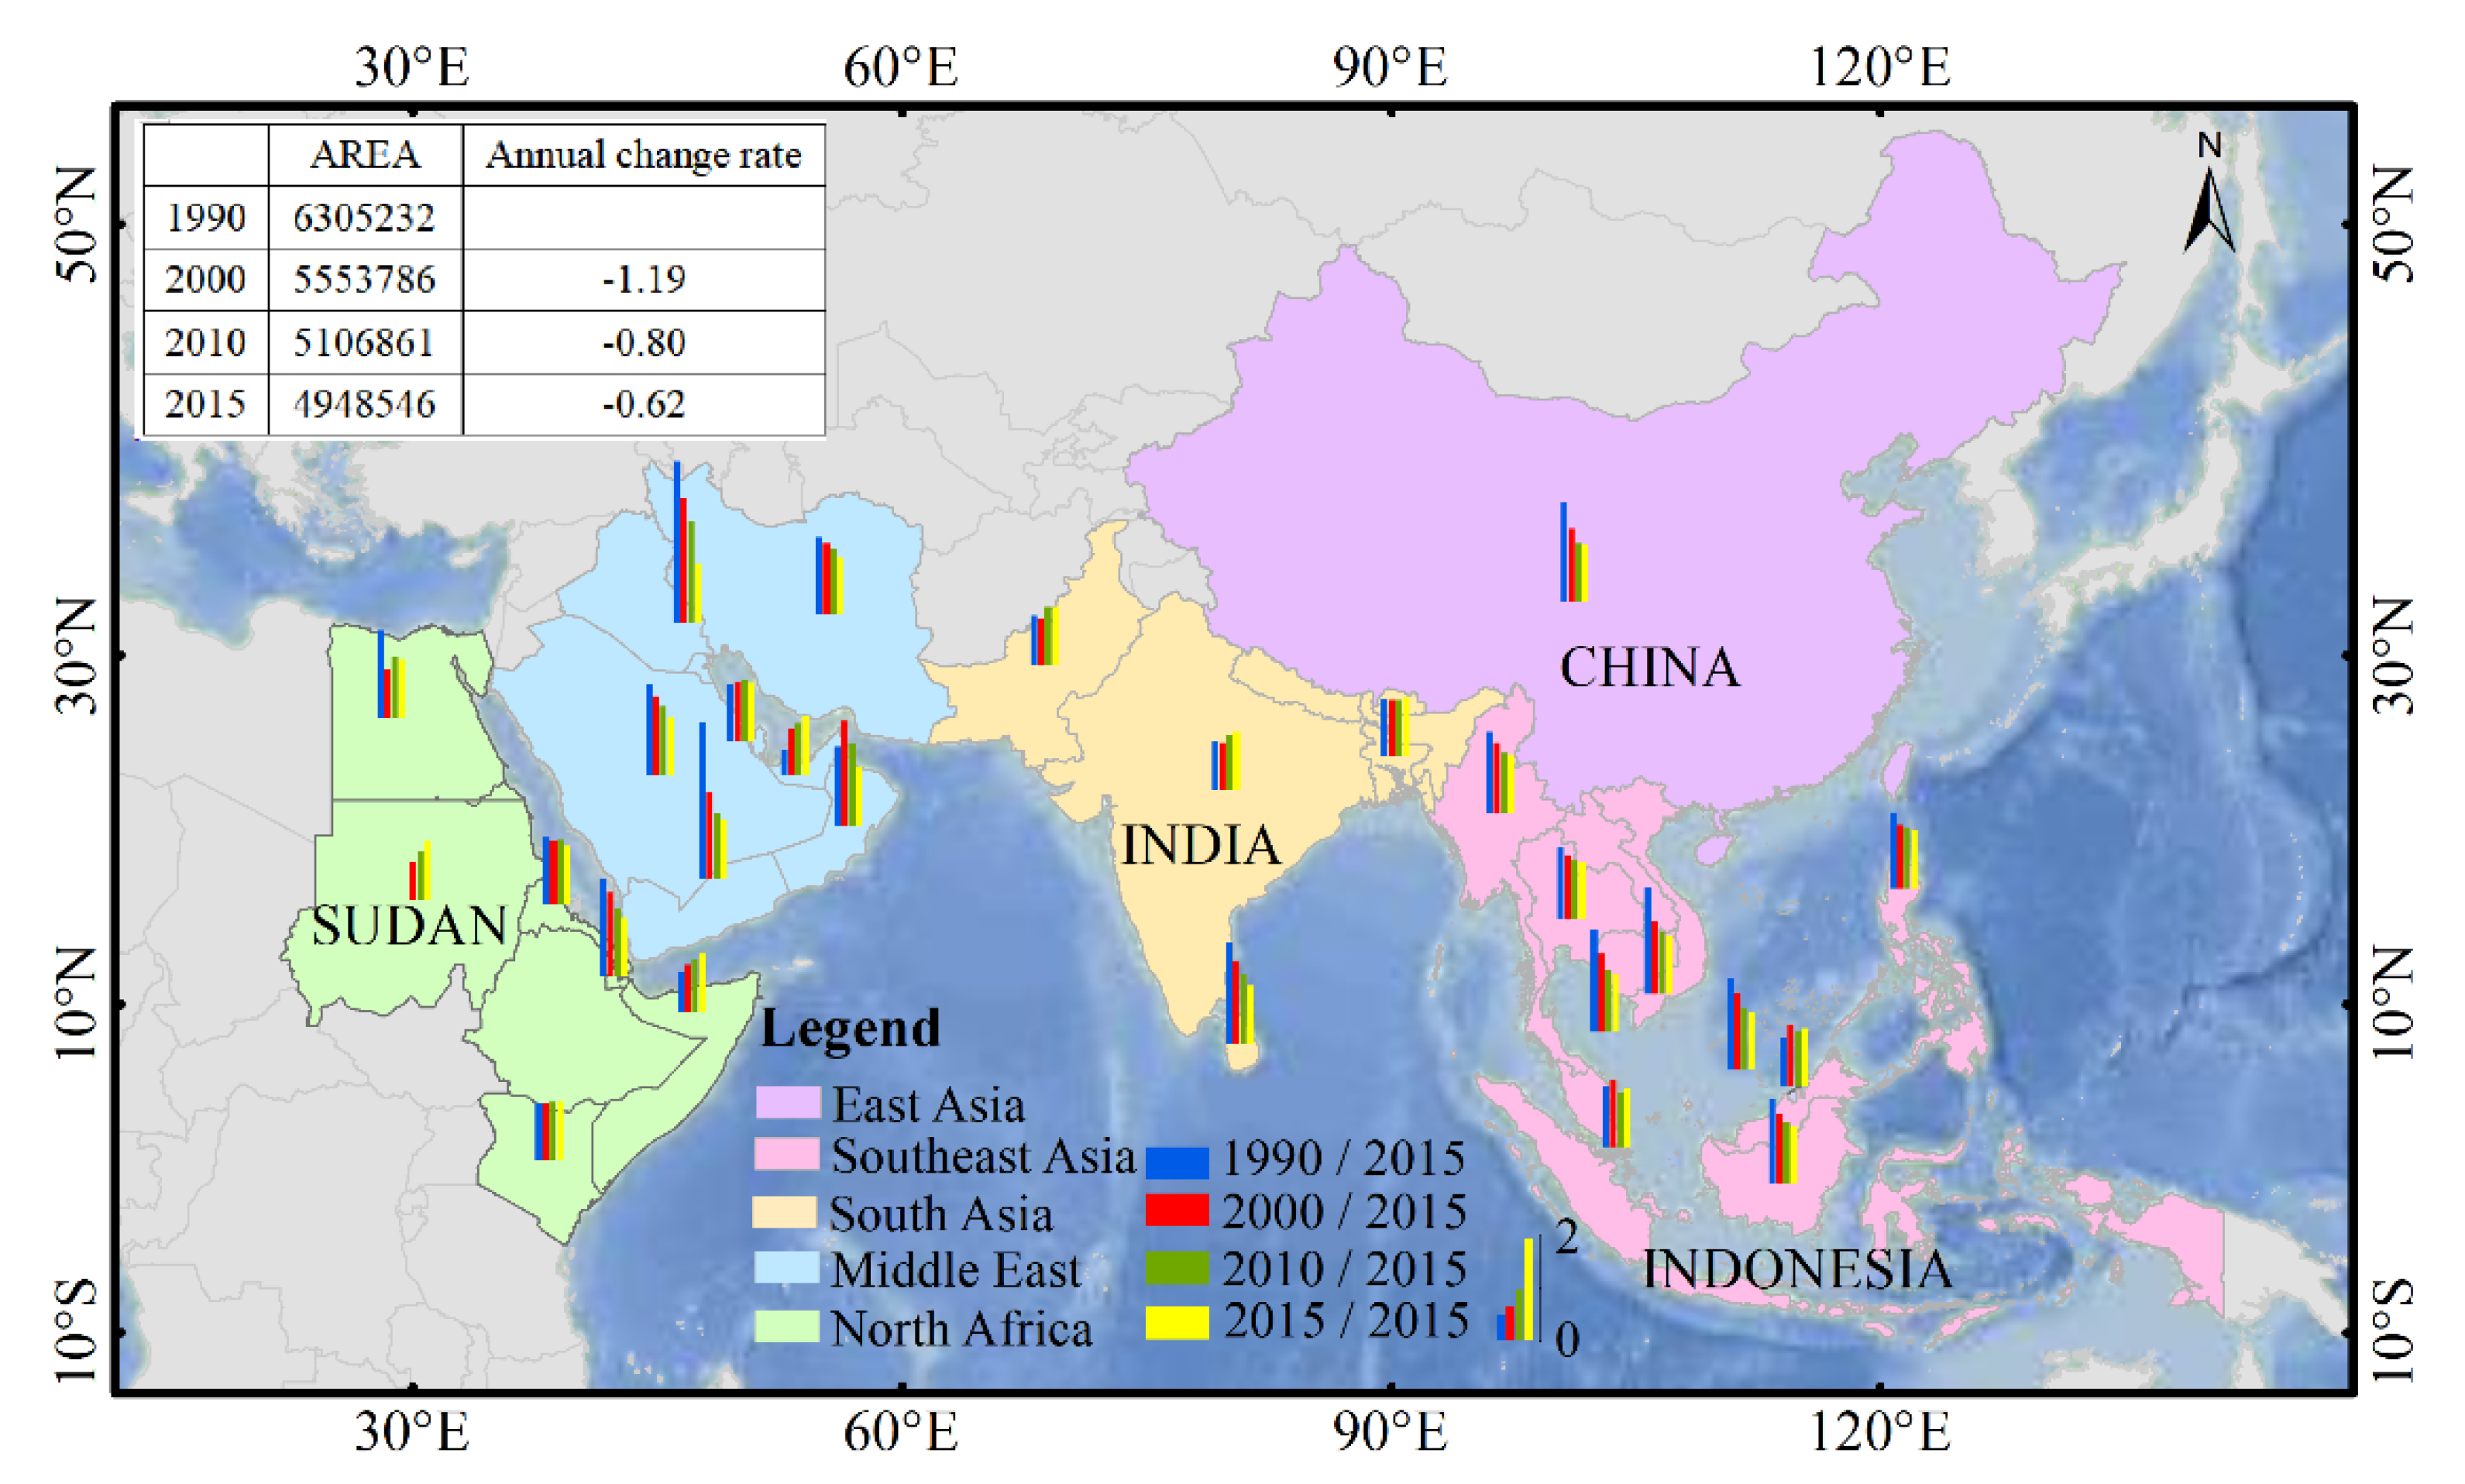
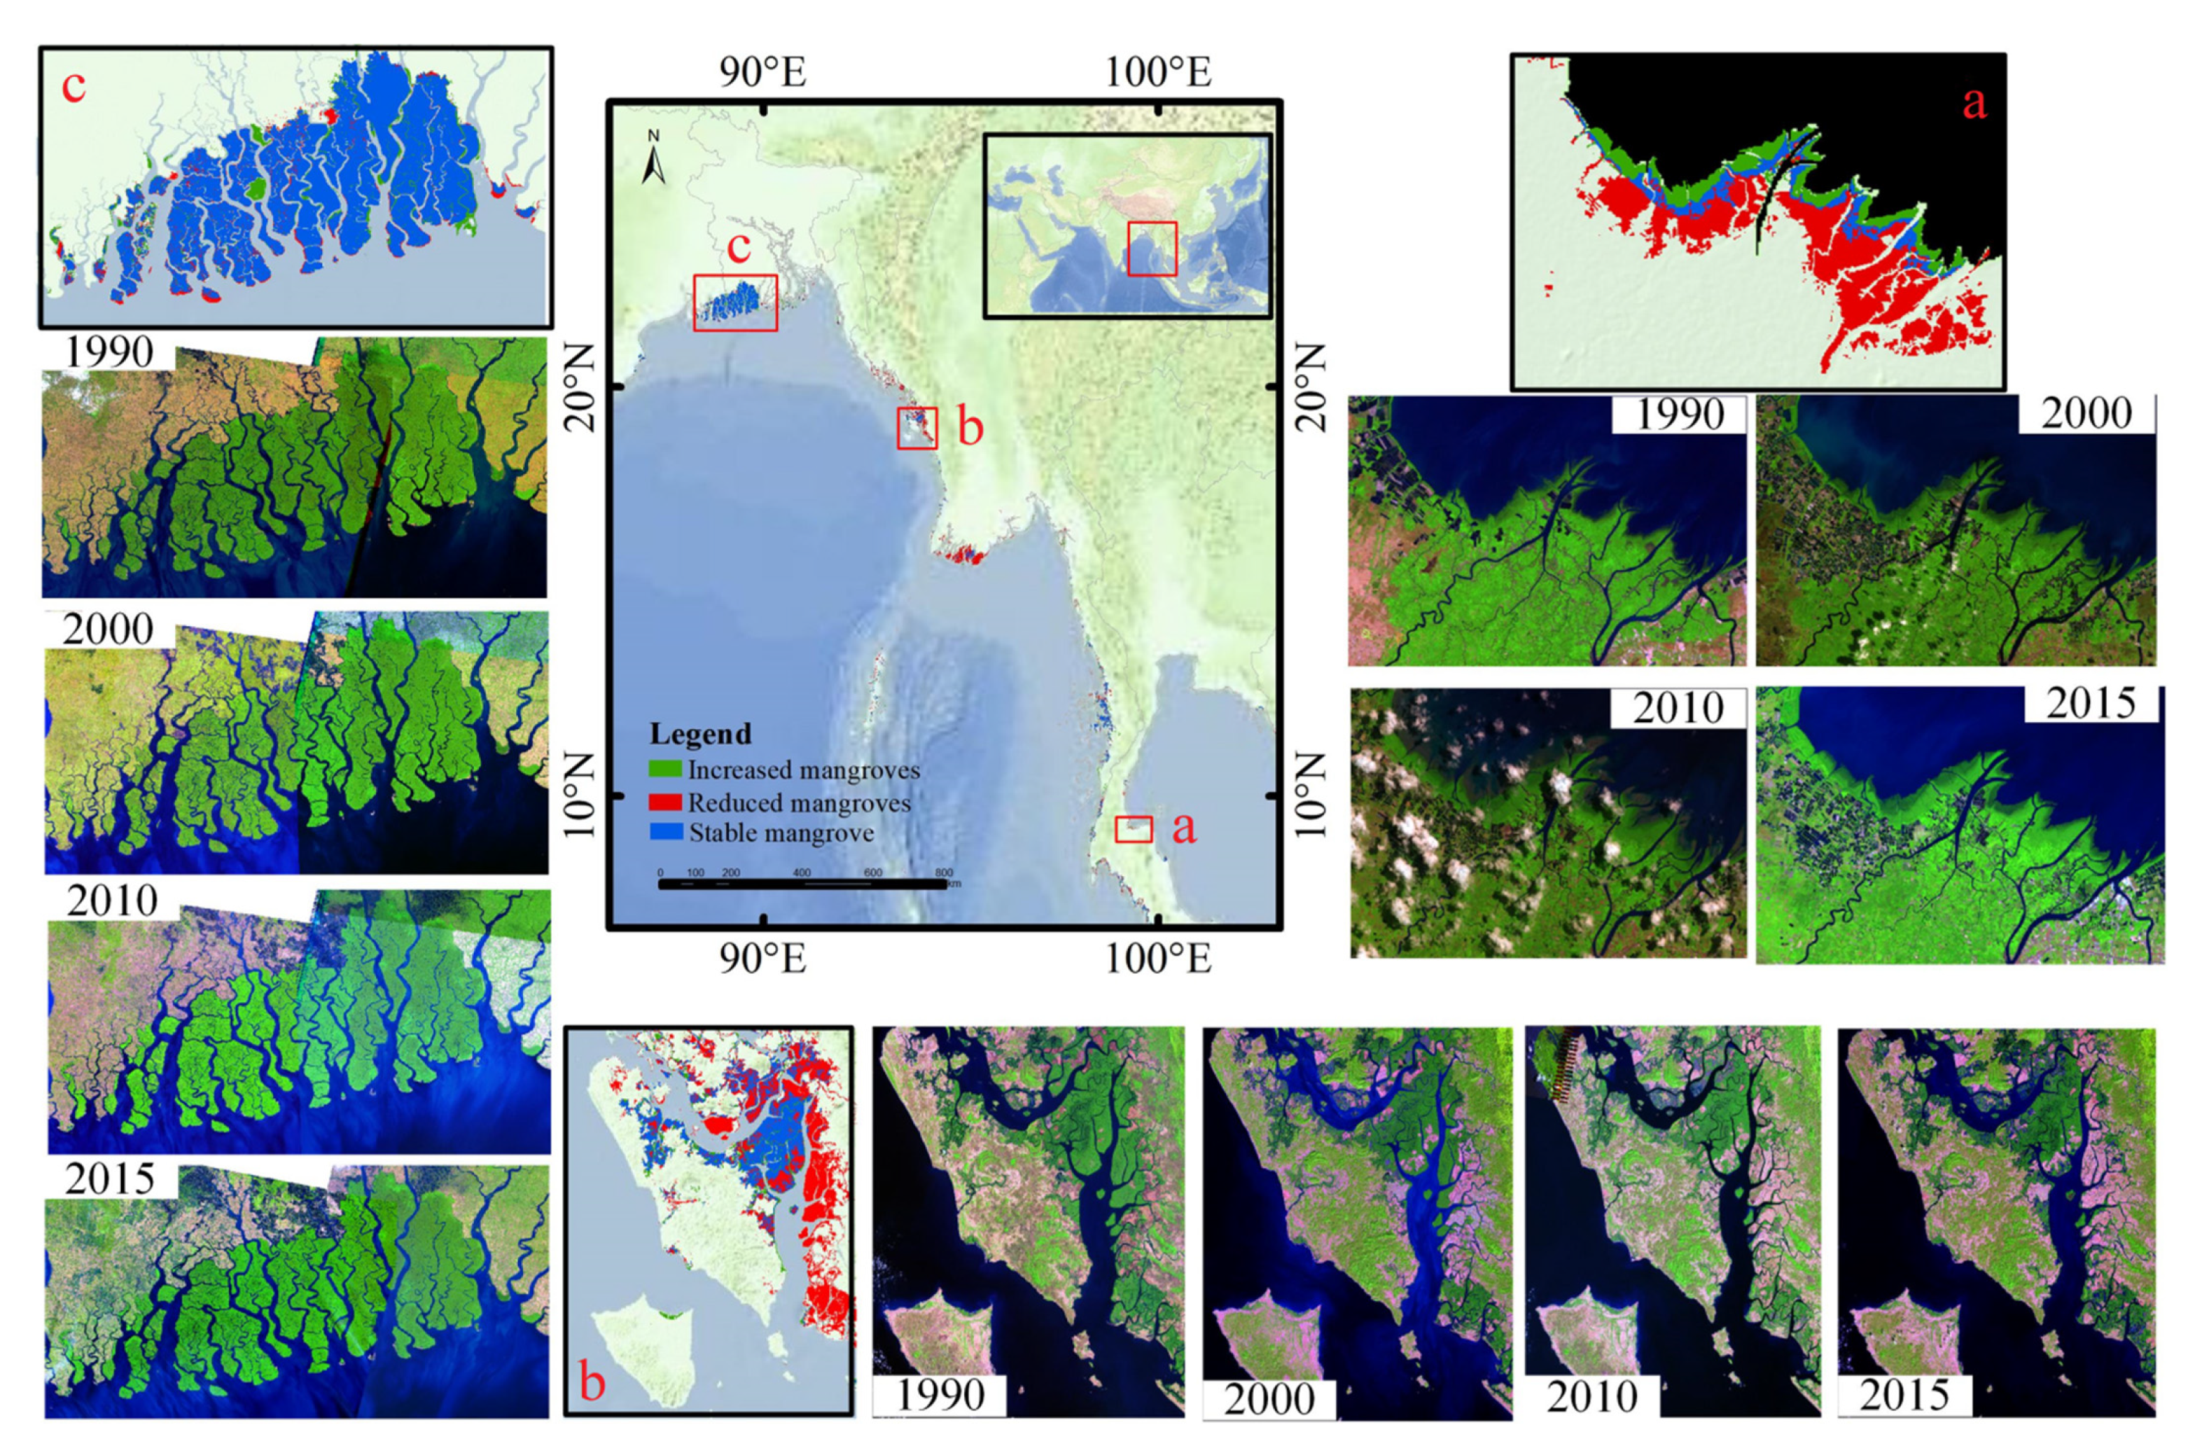
4.4. The Distribution and Dynamics of Mangrove Areas
5. Conclusions
Author Contributions
Funding
Data Availability Statement
Acknowledgments
Conflicts of Interest
Appendix A

| Country/Area | 1990 (ha) | 2000 (ha) | 2005 (ha) | 2010 (ha) | 2015 (ha) | Average Annual Rate of Change in This Study | ||||||||
|---|---|---|---|---|---|---|---|---|---|---|---|---|---|---|
| FAO | This Study | FAO | WCMC | This Study | FAO | GMW2011 | This Study | Mangrove_SEAsia_2015 | This Study | 1990–2000 | 2000–2010 | 2010–2015 | ||
| East Asia | China | 38,344 | 32,871 | 22,955 | 17,925 | 2180 | 22,480 | 17,179 | 19,325 | 14,397 | 19,144 | −2.64 | −2.00 | −0.18 |
| South-East Asia | Vietnam | 213,500 | 200,038 | 157,500 | 215,529 | 135,837 | 157,500 | 158,218 | 116,672 | 120,693 | 109,590 | −3.20 | −1.41 | −1.21 |
| Cambodia | 82,400 | 67,713 | 73,600 | 47,572 | 52,080 | 69,200 | 59,141 | 41,850 | 52,929 | 38,430 | −2.30 | −1.96 | −1.63 | |
| Thailand | 250,200 | 275,749 | 244,100 | 245,120 | 246,080 | 240,000 | 224,464 | 225,390 | 412,570 | 223,630 | −1.07 | −0.84 | −0.15 | |
| Malaysia | 642,000 | 372,908 | 589,500 | 558,580 | 463,216 | 565,000 | 530,654 | 422,260 | 705,237 | 443,698 | 2.42 | −0.88 | 1.01 | |
| Singapore | 500 | 613 | 500 | 582 | 682 | 500 | 599 | 550 | 263 | 591 | 1.12 | −1.93 | 1.49 | |
| Brunei | - | 25,296 | - | 11,089 | 21,300 | - | 15,075 | 17,184 | 17,032 | 15,983 | −1.57 | −1.93 | −1.39 | |
| Philippines | 273,000 | 344,338 | 250,000 | 259,037 | 285,950 | 240,000 | 289,042 | 277,973 | 112,681 | 262,094 | −1.69 | −0.27 | −1.14 | |
| Indonesia | 3,500,000 | 3,293,611 | 3,150,000 | 2,707,623 | 2,744,310 | 2,900,000 | 3,183,529 | 2,434,750 | 2,580,486 | 2,256,321 | −1.66 | −1.12 | −1.46 | |
| Myanmar | 536,100 | 666,540 | 516,700 | 507,579 | 578,570 | 507,000 | 509,226 | 491,152 | 508,515 | 476,745 | −1.31 | −0.51 | −0.58 | |
| South Asia | Bangladesh | 460,000 | 510,008 | 476,000 | 445,679 | 506,133 | 476,000 | 440,257 | 500,970 | - | 520,850 | −0.07 | −0.10 | 0.79 |
| India | 467,000 | 321,610 | 448,200 | 486,846 | 309,450 | 448,000 | 380,062 | 356,583 | - | 383,566 | −0.37 | 1.52 | 1.51 | |
| Sri Lanka | 9300 | 24,714 | 9000 | 21,564 | 20,320 | 8800 | 23,805 | 17,010 | - | 14,330 | −1.77 | −1.62 | −3.15 | |
| Pakistan | 207,000 | 82,447 | 158,000 | 50,748 | 77,405 | 157,000 | 64,327 | 97,543 | - | 97,264 | −0.61 | 2.60 | −0.05 | |
| Middle East | Iranian | 22,500 | 6817 | 19,100 | 12,099 | 6260 | 19,000 | 7868 | 5772 | - | 5124 | −0.81 | −0.78 | −2.23 |
| Kuwait | - | 526 | - | 0 | 404 | 5 | 0 | 330 | - | 189 | −2.31 | −1.83 | −8.54 | |
| Saudi Arabia | 20,000 | 12,547 | 20,000 | 8117 | 10,885 | 20,000 | 7501 | 9400 | - | 7973 | −1.32 | −1.36 | −3.03 | |
| Qatar | 500 | 610 | 500 | 407.3 | 624 | 500 | 442 | 644 | - | 616 | 0.22 | 0.32 | −0.86 | |
| United Arab Emirates | 3800 | 3020 | 4000 | 11,071 | 5663 | 4100 | 7654 | 6321 | - | 7185 | 8.74 | 1.16 | 2.72 | |
| Oman | 2000 | 395 | 1000 | 265 | 523 | 1000 | 162 | 409 | - | 291 | 3.24 | −2.17 | −5.77 | |
| Yemen | 950 | 605 | 900 | 1071 | 336 | 900 | 1313 | 253 | - | 225 | −4.44 | −2.47 | −2.21 | |
| North Africa | Egypt | 500 | 89 | 500 | 34 | 49 | 500 | 202 | 61 | - | 59 | −4.49 | 2.44 | −0.65 |
| Sudan | 500 | 0 | 500 | 280 | 442 | 500 | 356 | 559 | - | 668 | - | 2.64 | 3.89 | |
| Eritrea | 6500 | 6926 | 6400 | 4969 | 6585 | 6400 | 7526 | 6683 | - | 6051 | −0.49 | 0.14 | −1.89 | |
| Djibouti | 1000 | 663 | 1000 | 551 | 570 | 1000 | 520 | 457 | - | 395 | −1.40 | −1.98 | −2.71 | |
| Somali | 8600 | 4479 | 7800 | 2134 | 5300 | 7300 | 2472 | 5874 | - | 6512 | 1.83 | 1.08 | 2.27 | |
| Kenya | 52,000 | 50,099 | 50,000 | 39,948 | 50,632 | 50,000 | 58,059 | 50,886 | - | 51,022 | 0.01 | 0.05 | 0.05 | |
References
- Thomas, N. The Global Mangrove Watch (GMW): Mapping global mangrove baseline and time-series changes in extent with ALOS PALSAR. In Proceedings of the IGARSS 2015—2015 IEEE International Geoscience and Remote Sensing Symposium, Milan, Italy, 26–31 July 2015. [Google Scholar]
- Shahbudin, S.; Zuhairi, A.; Kamaruzzaman, B.Y. Impact of coastal development on mangrove cover in Kilim river, Langkawi Island, Malaysia. J. For. Res. 2012, 23, 185–190. [Google Scholar] [CrossRef]
- Tang, W.; Zheng, M.; Zhao, X.; Shi, J.; Yang, J.; Trettin, C. Big Geospatial Data Analytics for Global Mangrove Biomass and Carbon Estimation. Sustainability 2018, 10, 472. [Google Scholar] [CrossRef]
- Barua, P.; Rahman, S. Sustainable Livelihood of Vulnerable Communities in Southern Coast of Bangladesh through the Utilization of Mangroves. Asian J. Water Environ. Pollut. 2019, 16, 59–67. [Google Scholar] [CrossRef]
- Chandra, G. Observation and Monitoring of Mangrove Forests Using Remote Sensing: Opportunities and Challenges. Remote Sens. 2016, 8, 783. [Google Scholar]
- Makowski, C.; Finkl, C.W. Erratum to: Threats to Mangrove Forests: Hazards, Vulnerability, and Management. In Threats to Mangrove Forests; Springer: Berlin, Germeny, 2018. [Google Scholar]
- Wang, L.; Jia, M.; Yin, D.; Tian, J. A review of remote sensing for mangrove forests: 1956–2018. Remote Sens. Environ. 2019, 231, 111223. [Google Scholar] [CrossRef]
- Carugati, L.; Gatto, B.; Rastelli, E.; Lo Martire, M.; Coral, C.; Greco, S.; Danovaro, R. Impact of mangrove forests degradation on biodiversity and ecosystem functioning. Sci. Rep. 2018, 8, 13298. [Google Scholar] [CrossRef]
- Spalding, M. World Atlas of Mangroves; Routledge: New York, NY, USA, 2010. [Google Scholar]
- Yao-Dong, D.U.; Xu-Hua, C.; Xian-Wei, W.; Hui, A.; Hai-Lai, D.; Jian, H.; Xiao-Xuan, W. A Review of Assessment and Adaptation Strategy to Climate Change Impacts on the Coastal Areas in South China. Adv. Clim. Chang. Res. 2013, 4, 201–207. [Google Scholar] [CrossRef]
- Rivera-Monroy, V.H.; Danielson, T.M.; Castañeda-Moya, E.; Marx, B.D.; Travieso, R.; Zhao, X.; Farfan, L.M. Long-term demography and stem productivity of Everglades mangrove forests (Florida, USA): Resistance to hurricane disturbance. For. Ecol. Manag. 2019, 440, 79–91. [Google Scholar] [CrossRef]
- Simard, M.; Fatoyinbo, L.; Smetanka, C.; Rivera-Monroy, V.H.; Castañeda-Moya, E.; Thomas, N.; Vander Stocken, T. Mangrove canopy height globally related to precipitation, temperature and cyclone frequency. Nat. Geosci. 2019, 12, 40–45. [Google Scholar] [CrossRef]
- Pranchai, A.; Jenke, M.; Berger, U. Well-intentioned, but poorly implemented: Debris from coastal bamboo fences triggered mangrove decline in Thailand. Mar. Pollut. Bull. 2019, 146, 900–907. [Google Scholar] [CrossRef]
- Gandhi, S.; Jones, T. Identifying Mangrove Deforestation Hotspots in South Asia, Southeast Asia and Asia-Pacific. Remote Sens. 2019, 11, 728. [Google Scholar] [CrossRef]
- Thant, Y.M.; Kanzaki, M.; Ohta, S.; Than, M.M. Carbon sequestration by mangrove plantations and a natural regeneration stand in the Ayeyarwady Delta, Myanmar. Tropics 2012, 21, 1–10. [Google Scholar] [CrossRef]
- Bryan-Brown, D.N.; Connolly, R.M.; Richards, D.R.; Adame, F.; Friess, D.A.; Brown, C.J. Global trends in mangrove forest fragmentation. Sci. Rep. 2020, 10, 7117. [Google Scholar] [CrossRef]
- Giri, C.; Ochieng, E.; Tieszen, L.L.; Zhu, Z.; Singh, A.; Loveland, T.; Masek, J.; Duke, N. Status and distribution of mangrove forests of the world using earth observation satellite data: Status and distributions of global mangroves. Glob. Ecol. Biogeogr. 2011, 20, 154–159. [Google Scholar] [CrossRef]
- Sreelekshmi, S.; Nandan, S.B.; Sreejith, V.K.; Radhakrishnan, C.K.; Suresh, V.R. Mangrove species diversity, stand structure and zonation pattern in relation to environmental factors—A case study at Sundarban delta, east coast of India. Reg. Stud. 2020, 35, 101111. [Google Scholar] [CrossRef]
- Thomas, N.; Lucas, R.; Bunting, P.; Hardy, A.; Rosenqvist, A.; Simard, M. Distribution and drivers of global mangrove forest change, 1996–2010. PLoS ONE 2017, 12, e0179302. [Google Scholar] [CrossRef] [PubMed]
- Bhattarai, B. Assessment of mangrove forests in the Pacific region using Landsat imagery. J. Appl. Remote Sens. 2011, 5, 3509. [Google Scholar] [CrossRef]
- Worthington, T.A.; Ermgassen, P.S.E.Z.; Friess, D.A. A global biophysical typology of mangroves and its relevance for ecosystem structure and deforestation. Sci. Rep. 2020, 10, 14652. [Google Scholar] [CrossRef]
- Mondal, P.; Liu, X.; Fatoyinbo, T.E.; Lagomasino, D. Evaluating Combinations of Sentinel-2 Data and Machine-Learning Algorithms for Mangrove Mapping in West Africa. Remote Sens. 2019, 11, 2928. [Google Scholar] [CrossRef]
- Yancho, J.M.M.; Jones, T.G.; Gandhi, S.R.; Ferster, C.; Lin, A.; Glass, L. The Google Earth Engine Mangrove Mapping Methodology (GEEMMM). Remote Sens. 2020, 12, 3758. [Google Scholar] [CrossRef]
- Cavanaugh, K.C.; Osland, M.J.; Bardou, R.; Hinojosa-Arango, G.; López-Vivas, J.M.; Parker, J.D.; Rovai, A.S. Sensitivity of mangrove range limits to climate variability. Glob. Ecol. Biogeogr. 2018, 27, 925–935. [Google Scholar] [CrossRef]
- Liao, J.; Zhen, J.; Zhang, L.; Metternicht, G. Understanding Dynamics of Mangrove Forest on Protected Areas of Hainan Island, China: 30 Years of Evidence from Remote Sensing. Sustainability 2019, 11, 5356. [Google Scholar] [CrossRef]
- Gupta, K.; Mukhopadhyay, A.; Giri, S.; Chanda, A.; Majumdar, S.D.; Samanta, S.; Hazra, S. An Index for discrimination of mangroves from non-mangroves using LANDSAT 8 OLI imagery. MethodsX 2018, 5, 1129–1139. [Google Scholar] [CrossRef] [PubMed]
- Kamal, M.; Phinn, S.; Johansen, K.; Adi, N.S. Estimation of mangrove leaf area index from ALOS AVNIR-2 data (A comparison of tropical and sub-tropical mangroves). In Proceedings of the Advances of Science and Technology for Society: Proceedings of the 1st International Conference on Science and Technology 2015 (ICST-2015), Yogyakarta, Indonesia, 11–13 July 2016. [Google Scholar]
- Alam, S.M.R.; Hossain, M.S. A Rule-Based Classification Method for Mapping Saltmarsh Land-Cover in South-Eastern Bangladesh from Landsat-8 OLI. Can. J. Remote Sens. 2020, 1–25. [Google Scholar] [CrossRef]
- Heumann, B.W. An Object-Based Classification of Mangroves Using a Hybrid Decision Tree—Support Vector Machine Approach. Remote Sens. 2011, 3, 2440–2460. [Google Scholar] [CrossRef]
- Wang, T.; Zhang, H.; Lin, H.; Fang, C. Textural-Spectral Feature-Based Species Classification of Mangroves in Mai Po Nature Reserve from Worldview-3 Imagery. Remote Sens. 2015, 8, 24. [Google Scholar] [CrossRef]
- Shimu, S.A.; Aktar, M.; Afjal, M.I.; Nitu, A.M.; Uddin, M.P.; Al Mamun, M. NDVI Based Change Detection in Sundarban Mangrove Forest Using Remote Sensing Data. In Proceedings of the 2019 4th International Conference on Electrical Information and Communication Technology (EICT), Khulna, Bangladesh, 20–22 December 2019. [Google Scholar]
- Luo, Y.M.; Ouyang, Y.; Zhang, R.C.; Feng, H.M. Multi-Feature Joint Sparse Model for the Classification of Mangrove Remote Sensing Images. ISPRS Int. J. Geo-Inf. 2017, 6, 177. [Google Scholar] [CrossRef]
- Zhang, H.; Wang, T.; Liu, M.; Jia, M.; Lin, H.; Chu, L.M.; Devlin, A.T. Potential of Combining Optical and Dual Polarimetric SAR Data for Improving Mangrove Species Discrimination Using Rotation Forest. Remote Sens. 2018, 10, 467. [Google Scholar] [CrossRef]
- Giri, C.; Long, J.; Abbas, S.; Murali, R.M.; Qamer, F.M.; Pengra, B.; Thau, D. Distribution and dynamics of mangrove forests of South Asia. J. Environ. Manag. 2015, 148, 101–111. [Google Scholar] [CrossRef]
- Chen, B.; Xiao, X.; Li, X.; Pan, L.; Doughty, R.; Ma, J.; Giri, C. A mangrove forest map of China in 2015: Analysis of time series Landsat 7/8 and Sentinel-1A imagery in Google Earth Engine cloud computing platform. ISPRS J. Photogramm. Remote Sens. 2017, 131, 104–120. [Google Scholar] [CrossRef]
- Hinton, G.E.; Osindero, S.; Teh, Y.W. A Fast Learning Algorithm for Deep Belief Nets. Neural Comput. 2006, 18, 1527–1554. [Google Scholar] [CrossRef] [PubMed]
- Satyanarayana, B.; Mohamad, K.A.; Idris, I.F.; Husain, M.-L.; Dahdouh-Guebas, F. Assessment of mangrove vegetation based on remote sensing and ground-truth measurements at Tumpat, Kelantan Delta, East Coast of Peninsular Malaysia. Int. J. Remote Sens. 2011, 32, 1635–1650. [Google Scholar] [CrossRef]
- Satyanarayana, B.; Koedam, N.; Smet, K.D.; Nitto, D.D.; Dahdouh-Guebas, F. Long-term mangrove forest development in sri lanka: Early predictions evaluated against outcomes using VHR remote sensing and VHR ground-truth data. Mar. Ecol. Prog. 2012, 443, 51–63. [Google Scholar] [CrossRef]
- Leempoel, K.; Satyaranayana, B.; Bourgeois, C.; Zhang, J.; Chen, M.; Wang, J.; Dahdouh-Guebas, F. Dynamics in mangroves assessed by high-resolution and multi-temporal satellite data: A case study in Zhanjiang Mangrove National Nature Reserve (ZMNNR), P. R. China. Biogeosciences 2013, 10, 5681–5689. [Google Scholar] [CrossRef]
- Chen, S.; Wang, H.; Xu, F.; Jin, Y.Q. Target Classification Using the Deep Convolutional Networks for SAR Images. IEEE Trans. Geosci. Remote Sens. 2016, 54, 4806–4817. [Google Scholar] [CrossRef]
- Zhao, W.; Du, S. Spectral-spatial feature extraction for hyperspectral image classification: A dimension reduction and deep learning approach. IEEE Trans. Geosci. Remote Sens. 2016, 54, 4544–4554. [Google Scholar] [CrossRef]
- Xu, Z.; Xu, X.; Wang, L.; Yang, R.; Pu, F. Deformable ConvNet with Aspect Ratio Constrained NMS for Object Detection in Remote Sensing Imagery. Remote Sens. 2017, 9, 1312. [Google Scholar] [CrossRef]
- Krizhevsky, A.; Sutskever, I.; Hinton, G. ImageNet Classification with Deep Convolutional Neural Networks; NIPS. Curran Associates Inc.: Lake Tahoe, NV, USA, 2012. [Google Scholar]
- Dubey, A.; Naik, N.; Parikh, D.; Raskar, R.; Hidalgo, C.A. Deep Learning the City: Quantifying Urban Perception at a Global Scale. In Proceedings of the European Conference on Computer Vision (ECCV), Amsterdam, Netherlands, 11–14 October 2016; Springer International Publishing: Cham, Switzerland, 2016. [Google Scholar]
- Mohammadi, M.; Al-Fuqaha, A.; Guizani, M.; Oh, J.S. Semi-supervised Deep Reinforcement Learning in Support of IoT and Smart City Services. IEEE Internet Things J. 2017, 5, 624–635. [Google Scholar] [CrossRef]
- Guo, Y.; Chen, E.; Guo, Y.; Li, Z.; Xu, K. Deep highway unit network for land cover type classification with GF-3 SAR imagery. In Proceedings of the 2017 SAR in Big Data Era: Models, Methods and Applications (BIGSARDATA), Beijing, China, 13–14 November 2017. [Google Scholar]
- Guo, Y.; Chen, E.; Li, Z.; Li, Z.; Xu, K. Convolutional Highway Unit Network for Large-Scale Classification with GF-3 Dual-Pol Sar Data. In Proceedings of the IGARSS 2018—2018 IEEE International Geoscience and Remote Sensing Symposium, Valencia, Spain, 22–27 July 2018. [Google Scholar]
- Yiming, C.; Yanbing, P.; Jianfei, G. New Semantic Segmentation of Remote Sensing Image Based on Deep Learning; Computer & Digital Engineering: Wuhan, China, 2019. [Google Scholar]
- Liu, D.; Wen, B.; Jiao, J.; Xianming, L.; Zhangyang, W.; Thomas, S.H. Connecting Image Denoising and High-Level Vision Tasks via Deep Learning. IEEE Trans. Image Process. 2020, 29, 3695–3706. [Google Scholar] [CrossRef]
- Cai, X.; Song, B.; Fang, Z. Exemplar based regular texture synthesis using LSTM. Pattern Recognit. Lett. 2019, 128, 226–230. [Google Scholar] [CrossRef]
- Hu, F.; Li, L.; Zhang, Z.L.; Wang, J.Y.; Xu, X.F. Emphasizing Essential Words for Sentiment Classification Based on Recurrent Neural Networks. J. Comput. Sci. Technol. 2017, 32, 785–795. [Google Scholar] [CrossRef]
- Guo, W.; Wu, R.; Chen, Y.; Zhu, X. Deep Learning Scene Recognition Method Based on Localization Enhancement. Sensors 2018, 18, 3376. [Google Scholar] [CrossRef] [PubMed]
- Niu, Y.; Lu, Z.; Wen, J.R.; Tao, X.; Shih-Fu, C. Multi-Modal Multi-Scale Deep Learning for Large-Scale Image Annotation. IEEE Trans. Image Process. 2017, 28, 1720–1731. [Google Scholar] [CrossRef]
- Zhang, L.; Zhang, L.; Du, B. Deep Learning for Remote Sensing Data: A Technical Tutorial on the State of the Art. IEEE Geosci. Remote Sens. Mag. 2016, 4, 22–40. [Google Scholar] [CrossRef]
- Wichmann, A.; Agoub, A.; Schmidt, V.; Kada, M. RoofN3D: A Database for 3D Building Reconstruction with Deep Learning. Photogramm. Eng. Remote Sens. 2019, 85, 435–443. [Google Scholar] [CrossRef]
- Pleoianu, A.I.; Stupariu, M.S.; Sandric, I.; Stupariu, I.; Drǎgu, L. Individual Tree-Crown Detection and Species Classification in Very High-Resolution Remote Sensing Imagery Using a Deep Learning Ensemble Model. Remote Sens. 2020, 12, 2426. [Google Scholar] [CrossRef]
- Lian, R.; Huang, L. DeepWindow: Sliding Window Based on Deep Learning for Road Extraction from Remote Sensing Images. IEEE J. Sel. Top. Appl. Earth Obs. Remote Sens. 2020, 13, 1905–1916. [Google Scholar] [CrossRef]
- Faza, S.; Nababan, E.B.; Efendi, S.; Basyuni, M.; Rahmat, R.F. An initial study of deep learning for mangrove classification. IOP Conf. Ser. Mater. Sci. Eng. 2018, 420, 012093. [Google Scholar] [CrossRef]
- Iovan, C.; Kulbicki, M.; Mermet, E. Deep Convolutional Neural Network for Mangrove Mapping. In Proceedings of the 2020 IEEE International Geoscience and Remote Sensing Symposium, Waikoloa, HI, USA, 19–24 July 2020. [Google Scholar]
- Hinton, G.E.; Krizhevsky, A.; Wang, S.D. Transforming Auto-Encoders. In Proceedings of the Artificial Neural Networks & Machine Learning-ICANN-International Conference on Artificial Neural Networks, Lausanne, Switzerland, 11–14 September 2012; Springer: Berlin/Heidelberg, Germany, 2012. [Google Scholar]
- Yang, X.; Li, X.; Ye, Y.; Lau, R.Y.K.; Huang, X. Road Detection and Centerline Extraction Via Deep Recurrent Convolutional Neural Network U-Net. IEEE Trans. Geosci. Remote Sens. 2019, 57, 7209–7220. [Google Scholar] [CrossRef]
- Guo, Y.; Liao, J.; Shen, G. A Deep Learning Model with Capsules Embedded for High Resolution Image Classification. IEEE J. Sel. Top. Appl. Earth Obs. Remote Sens. 2020, 14, 214–223. [Google Scholar] [CrossRef]
- Zhen, J.; Liao, J.; Shen, G. Mapping Mangrove Forests of Dongzhaigang Nature Reserve in China Using Landsat 8 and Radarsat-2 Polarimetric SAR Data. Sensors 2018, 18, 4012. [Google Scholar] [CrossRef] [PubMed]
- Thakkar, V.; Tewary, S.; Chakraborty, C. Batch Normalization in Convolutional Neural Networks—A comparative study with CIFAR-10 data. In Proceedings of the 2018 Fifth International Conference on Emerging Applications of Information Technology (EAIT), Kolkata, India, 12–13 January 2018. [Google Scholar]
- Namozov, A.; Cho, Y.I. An Improvement for Medical Image Analysis Using Data Enhancement Techniques in Deep Learning. In Proceedings of the 2018 International Conference on Information and Communication Technology Robotics (ICT-ROBOT), Busan, Korea, 6–8 September 2018. [Google Scholar]
- Bunting, P.; Rosenqvist, A.; Lucas, R.M.; Rebelo, L.M.; Hilarides, L.; Thomas, N.; Hardy, A.; Itoh, T.; Shimada, M.; Finlayson, C.M. The Global Mangrove Watch—A New 2010 Baseline of Mangrove Extent. Remote Sens. 2018, 10, 1669. [Google Scholar] [CrossRef]
- Zhang, Z.; Liu, Q.; Wang, Y. Road Extraction by Deep Residual U-Net. IEEE Geosci. Remote Sens. Lett. 2017, 15, 749–753. [Google Scholar] [CrossRef]
- Hemeleers, L.; Koedam, N.; Dahdouh-Guebas, F. World-wide mangrove distribution and degradation. In Proceedings of the Symposium African Botany, Brussels, Belgium, 27 March 2009; p. 86. [Google Scholar]
- FAO. The World’s Mangroves 1980–2005; FAO Forestry Paper; FAO: Rome, Italy, 2008; pp. 703–704. [Google Scholar]
- Lv, T.; Zhou, X.; Liu, C.; Tao, Z.; Trisurat, Y. Data set of mangrove spatial distribution in Southeast Asia [DB/OL]. Glob. Res. Data Publ. Repos. 2015. [Google Scholar] [CrossRef]
- Li, C. Remote Sensing Information Extraction and Spatial Evolution Mechanism of Mangrove; Science Press: Beijing, China, 2013. [Google Scholar]
- Zhang, H.; Li, D.; Wang, J.; Zhou, H.; Li, Y. Long time-series remote sensing analysis of the periodic cycle evolution of the inlets and ebb-tidal delta of Xincun Lagoon, Hainan Island, China. ISPRS J. Photogramm. Remote Sens. 2020, 165, 67–85. [Google Scholar] [CrossRef]
- Lucas, R.; Kerchove, R.V.D.; Otero, V.; Lagomasino, D.; Dahdouh-Guebas, F. Structural characterisation of mangrove forests achieved through combining multiple sources of remote sensing data. Remote Sens. Environ. 2020, 237, 111543. [Google Scholar] [CrossRef]
- Ma, C.; Ai, B.; Zhao, J. Change Detection of Mangrove Forests in Coastal Guangdong during the Past Three Decades Based on Remote Sensing Data. Remote Sens. 2019, 11, 921. [Google Scholar] [CrossRef]
- Richards, D.R.; Friess, D.A. Rates and drivers of mangrove deforestation in Southeast Asia, 2000–2012. Proc. Natl. Acad. Sci. USA 2015, 113, 344–349. [Google Scholar] [CrossRef]
- Hao, L.; Yi, M.A.; Guang-Bo, R. Remote sensing monitoring of the mangrove forests resources of Kra Isthmus in Thailand. Mar. Environ. Sci. 2016, 35, 725–731. [Google Scholar]
- Estoque, R.C.; Myint, S.W.; Chuyuan, W.; Xu, X.; Huang, H. Assessing environmental impacts and change in Myanmar’s mangrove ecosystem service value due to deforestation (2000–2014). Glob. Chang. Biol. 2018, 24, 5391–5410. [Google Scholar] [CrossRef]
- Wu, P.; Zhang, J.; Yi, M.A.; Ren, G.B. Remote Sensing Monitoring and Analysis of the Dynamics of Mangrove Resources in Thailand from 1980 to 2015. Adv. Mar. Sci. 2018, 36, 86–96. [Google Scholar]
- Ilman, M.; Dargusch, P.; Dart, P.; Onrizal. A historical analysis of the drivers of loss and degradation of Indonesia’s mangroves. Land Use Policy 2016, 54, 448–459. [Google Scholar] [CrossRef]
- Brown, B.; Yuniati, W.; Ahmad, R.; Soulsby, I. Observations of Natural Recruitment and Human Attempts at Mangrove Rehabilitation after Seismic (Tsunami and Earthquake) Events in Simeulue Island and Singkil Lagoon, Aceh, Indonesia; Springer International Publishin: Cham, Switzerland, 2015. [Google Scholar]
- Ramakrishnan, R.; Gladston, Y.; Kumar, N.L.; Rajput, P.; Rajawat, A.S. Impact of 2004 co-seismic coastal uplift on the mangrove cover along the North Andaman Islands. Reg. Environ. Chang. 2020, 20, 6. [Google Scholar] [CrossRef]
- Luojia, H.; Wenyu, L.; Bing, X. Monitoring mangrove forest change in China from 1990 to 2015 using Landsat-derived spectral-temporal variability metrics. Int. J. Appl. Earth Obs. Geoinf. 2018, 73, 88–98. [Google Scholar]
- Kumar, R.C.S.; Kumar, G.T.R.; Renjith, K.R.; Manju, K.R.; Chandramohanakumar, M.N.A. Spatial Variability and Contamination of Heavy Metals in the Inter-Tidal Systems of a Tropical Environment. Int. J. Environ. Res. 2010, 4, 691–700. [Google Scholar]
- Saravanan, S.; Jegankumar, R.; Selvaraj, A.; Jacinth, J.J.; Parthasarathy, K.S.S. Utility of Landsat Data for Assessing Mangrove Degradation in Muthupet Lagoon, South India. In Coastal Zone Management; Elsevier: Amsterdam, The Netherlands, 2019; pp. 471–484. [Google Scholar]
- Salik, K. Impact of Climate Change on Mangrove Ecosystem in South Asia; LAP LAMBERT Academic Publishing: Saarbrücken, Germany, 2016. [Google Scholar]
- Kamboj, R.D.; Das, L. The Dynamics of Mangrove Cover in India: Based on Assessment done by Forest Survey of India from 1987 to 2017. Indian For. 2019, 145, 607–613. [Google Scholar]
- Quader, M.A.; Agrawal, S.; Kervyn, M. Multi-decadal land cover evolution in the Sundarban, the largest mangrove forest in the world. Ocean Coast. Manag. 2017, 139, 113–124. [Google Scholar] [CrossRef]
- Little, D.I. Mangrove Restoration and Mitigation after Oil Spills and Development Projects in East Africa and the Middle East. In Threats to Mangrove Forests; Springer: Cham, Switzerland, 2018. [Google Scholar]
- Murray, N.J.; Phinn, S.R.; Dewitt, M.; Ferrari, R.; Fuller, R.A. The global distribution and trajectory of tidal flats. Nature 2019, 565, 222–225. [Google Scholar] [CrossRef]
- Saber, G.; Sina, S.M.; Amir, R.; Christos, A.D.; Abolfazl, N. Phytomanagement of trace metals in mangrove sediments of Hormozgan, Iran, using gray mangrove (Avicennia marina). Environ. Sci. Pollut. Res. 2018, 25, 28195–28205. [Google Scholar]
- Mafi, D. Adverse effects of climate change on mangroves and requisite approaches to increase resistance of these ecosystems. In Proceedings of the 2nd International Conference & 3rd National Conference on New Technologies Application in Engineering, Mashhad, Iran, 25 February 2016. [Google Scholar]
- Jerath, M.; Bhat, M.; Rivera-Monroy, V.H.; Castaneda-Moya, E.; Simard, M.; Twilley, R.R. The role of economic, policy, and ecological factors in estimating the value of carbon stocks in Everglades mangrove forests, South Florida, USA. Environ. Sci. Policy 2016, 66, 160–169. [Google Scholar] [CrossRef]


| Capsules-Unet | U-Net | ||||||||||||
|---|---|---|---|---|---|---|---|---|---|---|---|---|---|
| OA (%) | Kappa | F1 | Mangroves (%) | Non-Mangroves (%) | OA (%) | Kappa | F1 | Mangroves (%) | Non-Mangroves (%) | ||||
| 1 UA | 2 PA | 1 UA | 2 PA | 1 UA | 2 PA | 1 UA | 2 PA | ||||||
| 86 | 0.73 | 0.86 | 83 | 90 | 89 | 82 | 81 | 0.62 | 0.79 | 74 | 85 | 84 | 77 |
| Number of Layers | Number of Parameter | Running Time | FLOPS | |
|---|---|---|---|---|
| Capsules-Unet | 13 | ~5.6 M | ~48 h | ~2.1 G |
| U-net | 19 | ~30.1 M | ~38 h | ~0.87 G |
| Mangroves (%) | Non-Mangroves (%) | OA (%) | Kappa | F1 | |||
|---|---|---|---|---|---|---|---|
| 1 UA | 2 PA | 1 UA | 2 P A | ||||
| 1990 | 90.1 | 60.8 | 86.1 | 97.3 | 86.9 | 0.64 | 0.72 |
| 2000 | 89.6 | 63.3 | 86.8 | 97.0 | 87.3 | 0.66 | 074 |
| 2010 | 89.6 | 56.1 | 84.9 | 97.4 | 85.7 | 0.61 | 0.69 |
| 2015 | 86.3 | 71.3 | 89.4 | 95.5 | 88.7 | 0.71 | 0.78 |
Publisher’s Note: MDPI stays neutral with regard to jurisdictional claims in published maps and institutional affiliations. |
© 2021 by the authors. Licensee MDPI, Basel, Switzerland. This article is an open access article distributed under the terms and conditions of the Creative Commons Attribution (CC BY) license (http://creativecommons.org/licenses/by/4.0/).
Share and Cite
Guo, Y.; Liao, J.; Shen, G. Mapping Large-Scale Mangroves along the Maritime Silk Road from 1990 to 2015 Using a Novel Deep Learning Model and Landsat Data. Remote Sens. 2021, 13, 245. https://doi.org/10.3390/rs13020245
Guo Y, Liao J, Shen G. Mapping Large-Scale Mangroves along the Maritime Silk Road from 1990 to 2015 Using a Novel Deep Learning Model and Landsat Data. Remote Sensing. 2021; 13(2):245. https://doi.org/10.3390/rs13020245
Chicago/Turabian StyleGuo, Yujuan, Jingjuan Liao, and Guozhuang Shen. 2021. "Mapping Large-Scale Mangroves along the Maritime Silk Road from 1990 to 2015 Using a Novel Deep Learning Model and Landsat Data" Remote Sensing 13, no. 2: 245. https://doi.org/10.3390/rs13020245
APA StyleGuo, Y., Liao, J., & Shen, G. (2021). Mapping Large-Scale Mangroves along the Maritime Silk Road from 1990 to 2015 Using a Novel Deep Learning Model and Landsat Data. Remote Sensing, 13(2), 245. https://doi.org/10.3390/rs13020245