Abstract
This study presents a new ensemble framework to predict landslide susceptibility by integrating decision trees (DTs) with the rotation forest (RF) ensemble technique. The proposed framework mainly includes four steps. First, training and validation sets are randomly selected according to historical landslide locations. Then, landslide conditioning factors are selected and screened by the gain ratio method. Next, several training subsets are produced from the training set and a series of trained DTs are obtained by using a DT as a base classifier couple with different training subsets. Finally, the resultant landslide susceptibility map is produced by combining all the DT classification results using the RF ensemble technique. Experimental results demonstrate that the performance of all the DTs can be effectively improved by integrating them with the RF ensemble technique. Specifically, the proposed ensemble methods achieved the predictive values of 0.012–0.121 higher than the DTs in terms of area under the curve (AUC). Furthermore, the proposed ensemble methods are better than the most popular ensemble methods with the predictive values of 0.005–0.083 in terms of AUC. Therefore, the proposed ensemble framework is effective to further improve the spatial prediction of landslides.
1. Introduction
Landslides are one of the most serious natural disasters in the world, causing a large number of casualties each year [1]. Therefore, it is crucial to perform landslide susceptibility mapping (LSM) to prevent and reduce damages. In recent decades, many methods on landslide susceptibility analysis have been proposed and can be mainly divided into two groups, i.e., qualitative and quantitative [2]. Qualitative methods have been widely used for LSM, such as weighted linear combination [3], multi-criteria evaluation [4] and ordered weighted averaging [5]. Quantitative methods mainly depend on the relationship between influencing factors and landslide occurrences and can be grouped into two categories, i.e., physically-based methods and data-driven approaches. Physically-based methods assess landslide susceptibility based on simplified physically modeling strategy [6], while data-driven approaches develop a functional relationship between conditioning factors and the past and historical landslide events [7], including weights of evidence [8,9,10], frequency ratio [11], random forest [12,13], artificial neural network (ANN) [14,15], convolutional neural networks [16,17], and support vector machine (SVM) [18,19,20].
Nowadays, the ensemble framework has become a hot issue in the field of machine learning and pattern recognition [21]. Many studies validated that the combined paradigm is better than individual classifiers [22,23,24]. The ensemble techniques have been also used in LSM and obtained better prediction results than traditional classifiers [25,26]. Specifically, the popular ensemble techniques of AdaBoost, Bagging, Dagging, and MultiBoost were proposed in the early period and obtained reliable prediction performance [27,28,29,30,31]. For instance, Chen et al. [32] proposed a new ensemble technique that integrates an adaptive neuro-fuzzy inference system (ANFIS) with three metaheuristic optimization for LSM. As an improved method of the Interactive Dichotomize 3 tree algorithm, J48 DT splits information by calculating standardized data gain and can handle particular characteristics, missing feature estimations and varying feature costs [33]. The J48 DT with the AdaBoost, Bagging, and rotation forest ensemble techniques were proposed to evaluate landslide susceptibility [30], which achieved satisfying prediction results. Therefore, the ensemble methods are very promising for predicting landslide-prone areas.
The Three Gorges Reservoir area stretches along the Yangtze River is characterized with very complex geological conditions, which are highly vulnerable to landslide occurrences and seriously threaten peoples’ lives and property. To perform landslide spatial prediction, several contributions have made remarkable achievement in the past few years, including logistic regression (LR) [34], SVM [35], and ANN [36], but studies on the application of machine learning methods in the Three Gorges Reservoir area are still very rare. Furthermore, different ensemble techniques have different advantages and disadvantages in combining multiple single classifiers, and thus selecting an appropriate base classifier is of great significant, which can affect final landslide susceptibility results. The literature mentioned previously only compared the performance of different ensemble methods when integrating with a same base classifier, but they rarely explore the integration capability of the selected ensemble method when coupling with different base classifiers.
Therefore, the main goal of this work is to assess and compare the performance of a novel ensemble framework by integrating different base classifiers with the same ensemble technique for LSM. It should be noted that the DTs are selected as the base classifiers because spatial prediction of landslides can be partitioned into a set of similar sub-problems with specific decision rules to which the same tactics can be used to solve the entire prediction problem. The selected DTs includes alternating decision tree (ADT), forest by penalizing attributes (FPA), functional tree (FT), logistic model tree (LMT), and Hoeffding tree (VFDT). Meanwhile, the rotation forest (RF) ensemble technique is used in the proposed ensemble framework because the DTs are sensitive to rotation of the feature axes in the RF structure [37]. To validate the effectiveness of the proposed framework, several statistical criteria including the receiver operating characteristic (ROC) curve, area under curve (AUC), overall accuracy (OA), and Matthews correlation coefficient (MCC) technique were used to assess and compare the proposed ensemble methods with the DTs to predict landslide occurrence in the Three Gorges Reservoir area. Furthermore, to validate the robust integration capability of RF and DTs, the proposed framework was compared with three benchmark methods: multilayer perceptron neural networks with RF (MLPNNs+RF) [29], naïve Bayes with RF (NB+RF) [38] and radial basis function neural network with RF (RBFNN+RF) [39]. It should be noted that the ArcGIS environment was used for data preparation and the Weka software was applied for model construction and evaluation.
2. Study Area and Accessible Data
2.1. Description of Study Area
The study area is located in China and has an area of 446.32 km2 and its altitude is in the range of 80–2000 m mean sea level (Figure 1). The Zigui-Badong section of the Three Gorges reservoir is in the subtropical monsoon climate zone and the study area has sufficient rainfall and humidity. During 2001–2010, the annual average precipitation in Zigui and Badong Counties is 944.5 and 1069.2 mm, respectively. Abundant rainfall is one of the main conditioning factors for the frequent occurrence of geological disasters in the reservoir area [40].
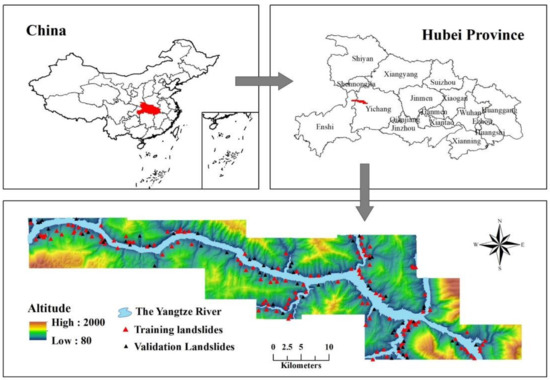
Figure 1.
Location of the study area with landslide locations.
2.2. Preparation of the Database
Historical landslide locations were employed to construct relevant landslide susceptibility models. Consequently, an accurate landslide inventory map is particularly important for LSM. In this study, a total of 196 landslide locations were identified through field surveys, historical landslide records and Google Earth images visual interpretation, and the distribution of the landslide locations is shown in Figure 1. To construct the landslide susceptibility models, the training and validation sets are required. In this work, the 196 landslide locations were randomly divided into two parts: 70% (137 locations) were used as training samples and the remaining 59 landslide locations for validation. To predict non-landslide areas, the same number (137 and 59) of non-landslide locations was randomly selected to construct the training and validation sets for prediction.
The selection of conditioning factors is an important step of LSM. There are many conditioning factors that trigger landslides [1]. In this study, 20 landslide conditioning factors were selected based on expert knowledge and literature review [35,41,42,43,44,45], including altitude, aspect, catchment area, catchment slope, curvature, distance to rivers, slope, slope form, terrain position index (TPI), terrain ruggedness index (TRI), terrain surface convexity (TSC), terrain surface texture (TST), topographic wetness index (TWI), lithology, distance to faults, land use, rainfall, magnitude, normalized difference vegetation index (NDVI), and normalized difference water index (NDWI). Table 1 shows the information of landslide conditioning factors.

Table 1.
Information of the landslide conditioning factors.
3. Methodology
The proposed framework is based on the integration of DTs and the RF ensemble technique. The flowchart is illustrated in Figure 2 and three main steps in this framework as follows:
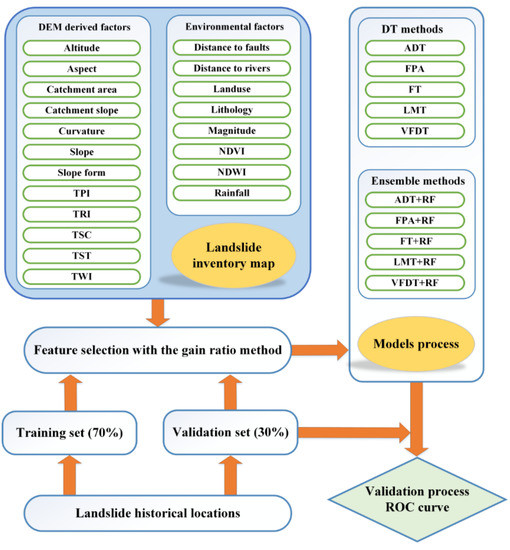
Figure 2.
The flowchart of the proposed ensemble framework. The terrain position index (TPI), terrain ruggedness index (TRI), terrain surface convexity (TSC), terrain surface texture (TST), topographic wetness index (TWI), normalized difference vegetation index (NDVI), and normalized difference water index (NDWI) are landslide conditioning factors. The alternating decision tree (ADT), forest by penalizing attributes (FPA), functional tree (FT), logistic model tree (LMT), and Hoeffding tree (VFDT) are base classifiers. RF is the rotation forest ensemble technique.
- (1)
- Data acquisition and preprocessing. In this work, historical landslide events and landslide conditioning factors are acquired to perform spatial prediction of landslide occurrence. Specifically, the historical landslide locations are produced by past landslide records and remote sensing images. Meanwhile, a series of related conditioning factors are selected for LSM and screened using the GR method. Afterwards, these data are resampled with the same grid size. Finally, the training and validation sets are produced for constructing and testing landslide prediction methods.
- (2)
- Construct prediction methods and produce landslide susceptibility maps. The ensemble framework is first performed to optimize the original datasets using the training set. Then, the base classifier of DT is applied to the screened datasets for spatial prediction of landslides. Next, the RF ensemble technique is used for landslide susceptibility modeling. Finally, landslide susceptibility maps are obtained using the constructed prediction methods.
- (3)
- Verification and comparison. The predictive performance of the proposed ensemble framework is evaluated using the objective criteria of ROC and AUC.
3.1. Gain Ratio Method
Gain ratio (GR) is a widely applied factors selection method in LSM. It can determine the importance of each landslide conditioning factor through assigning a weight to each feature based on its capability [51]. Let T be a training set and n the total of instances, the GR on attribute X is briefly calculated as follows.
where is the information gain of attribute X and is inferred the split information value. and are calculated by following equations:
where is the prior probability and m represents the number of values of attribute X. The is the expect information entropy of data set T and is defined as follows:
The final calculated average merit (AM) reveals the importance of conditioning factors to the occurrence of landslides.
3.2. Decision Tree Base Classifiers
3.2.1. Alternating Decision Tree
It is known that the AdaBoost algorithm is an important machine learning technique [52]. Thus, it is natural to combine the techniques of boosting and DTs to obtain reliable classifiers, whose results are based on majority voting over several DTs. For instance, two popular boosting DTs of CART and C4.5 have been widely used. However, the interpretation of these classifiers is a challenging problem. The ADT is a combination of DTs with boosting that produce classification rules that are easier to interpret [53].
3.2.2. Forest by Penalizing Attributes
Recently, a novel decision forest approach of FPA was presented [54]. This approach has the following advantages. First, a series of high-precision DTs can be obtained by this approach using not only a subset of but all non-class attributes in a dataset. Second, penalties are imposed to those attributes that are used in the current tree to produce the following trees to encourage better diversity. Finally, this approach is capable of gradually increasing weights from the attributes that have not been validated in the following tree(s). Consequently, this approach can ensure the optimized prediction accuracy.
3.2.3. Functional Tree
The main idea of the FT framework is to build multivariate trees for classification and regression problems [55]. In this framework, both functional decision and leaf nodes are produced for prediction problems when growing and pruning the tree, respectively. As the behavior of FT, the employment of functional decision and leaf nodes can be considered as a bias and variance reduction process, respectively. Furthermore, it is favorable for multivariate methods to use linear functions both at decision nodes and leaves, especially for large datasets.
3.2.4. Logistic Model Tree
The LMT, integrating standard DT classifier and LR function, is a classification tree method which is evaluated more efficiently than simple LR of C4.5 model. [56]. In the LMT algorithm, a DT is defined as a tree structure with the LR functions at the leaves. This approach employs the LogitBoost and C4.5 algorithms for building an LR function at each node and pruning, respectively. The LogitBoost is capable of providing a novel strategy for choosing the attributes involved in the LR function.
3.2.5. Hoeffding Tree
The Hoeffding tree is an incremental DT induction algorithm that is capable of learning from large data streams based on the assumption that the data distribution is fixed over time [57]. It grows incrementally a DT based on the theoretical guarantees of the Hoeffding bound, which can measure the number of observations that can compute statistics with a specified accuracy. This theoretical advantage can ensure that this algorithm can demonstrate better performance than other incremental DT methods and cost less computational time.
3.3. Rotation Forest Ensemble
RF is a classifier ensemble method using independently trained DTs [58] which aims at constructing accurate and diverse classifiers. Different from the idea of random forest, each tree in RF is trained on the entire dataset in a rotated feature space. In the tree-induced prediction methods, the clusters are always parallel to the feature axes. Thus, any rotation of the axes may produce a very different tree.
Assuming that M represents the number of DTs, RF trains M DTs independently and uses a new different dataset whose features are extracted for each tree. Let be a sample characterized with n attributes, be the ensemble of M classifiers, X and N × n matrix denote the training instances and the feature set, respectively. The RF algorithm is briefly introduced as follows:
- (1)
- To construct the training set for the RF algorithm, the feature set with n features is randomly divided into K subsets, and thus each feature subset consists of features.
- (2)
- To apply the feature selection algorithm of principle component analysis (PCA) on each feature subset and obtain a series of principle components (PCs) of (i = 1, 2, …, M; j = 1, 2, …, K).
- (3)
- Repeat the previous steps to obtain the K sets of PC coefficients and put these PC coefficients into the Matrix R as follows:
- (4)
- Multiply the original dataset X with this Matrix (5) to obtain the new feature dataset and the base classifier is trained using this feature dataset.
- (5)
- Repeat the previous steps to obtain trained base classifiers.
- (6)
- For a given unknown sample for prediction, each base classifier produces a class probability value, and all the class probabilities are combined to obtain the final prediction probability.
It should be noted that different features can be obtained by the feature set with various ways for partition. Therefore, RF can construct accurate and diverse classifiers for landslide prediction.
3.4. Model Evaluation Criteria
The performance of prediction methods is commonly assessed using the ROC curve technique [59]. It is constructed by plotting two values which are true positive (TP) rate and false positive (FP) rate [60,61]. Furthermore, the area under ROC curve (AUC) has been often applied to quantitatively assess the performance of LSM methods [62,63,64]. More specifically, a LSM method is confirmed good if the AUC value is near to 1 [65,66]. Meanwhile, two statistical criteria of OA and MCC were also used in our experiments as follows:
where TP and TN (true negative) denote the number of landslide and non-landslide samples that are correctly classified, whereas FP and FN (false negative) represent the number of non-landslide and landslide instances that are misclassified, respectively. In addition, the Chi Square test is another crucial statistical approach that is widely applied to assess the significant difference among expected models [67]. The statistical indexes of Chi-square and p values are calculated and ranked. If the Chi-square value is higher than the standard value of 3.841 and p value is smaller than 0.05, the difference among the methods is significant [68].
4. Results
4.1. Analysis of Landslide Conditioning Factors
4.1.1. Importance Evaluation of Landslide Conditioning Factors
In this work, the predictive ability of all the landslide conditioning factors were obtained before constructing landslide susceptibility framework. Generally, a factor with higher AM value is confirmed important to landslide susceptibility modelling. In present study, the factor with AM value of zero is removed for further analysis. The AM value of each conditioning factors is shown in Figure 3. It can be observed that distance to rivers and altitude have the highest prediction capability with the AM values of 0.3624 and 0.2744, respectively, indicating that the two factors are more significant than the other factors. Most of the other factors have the AM values between 0.0105 and 0.1006, including NDWI, NDVI, land use, TST, distance to faults, TWI, TRI, lithology, curvature, catchment area, TSC, TPI, slope, catchment slope, slope form and magnitude. In addition, the AM values of the remaining factors are positive but less than 0.01, indicating that little contribution is provided to the methods by aspect and rainfall. Therefore, all the conditioning factors were used for the subsequent steps of LSM.
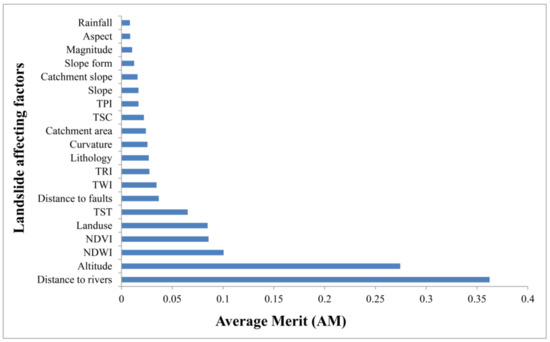
Figure 3.
Average merit (AM) values for the landslide conditioning factor.
4.1.2. Conditioning Factors Analyses Using Frequency Ratio
The results of spatial relationship between landslide locations and related conditioning factors using the frequency ratio (FR) model are shown in Appendix A Table A1. The frequency ratio method can evaluate the sub-classes of specific factors and provide useful instructions for decision-makers to understand the conditioning factors related to landslides and make better policies [11,16,30]. The higher FR value shows that landslide hazards are more prone to occur in corresponding zone [69]. Specifically, with regard to altitude, the class of <300 m has the highest FR value of 4.08, whereas the other classes have lower probability for landslide occurrence because the FR values are near to 0. The FR analysis of the aspect factor proved that the slopes facing northwest, south and north have more potential for landslide occurrence than those facing other orientations. The higher FR values of 1.61 and 1.31 were obtained in the class of 9000–25,000 m2 and 0.3–0.5 for the catchment area and catchment slope factors, respectively, indicating higher spatial relationship with landslide occurrence. As for curvature, the class of (–0.05)–0.15 has the highest FR value of 1.21, indicating that the slopes with the other classes in terms of curvature are not responsible for landslides in this area. For magnitude, the FR values decreases as the magnitude increases. For distance to faults, we can observe that the area is more prone to landslide occurrence when its location is 3600–5400 m away from the faults. Distance to rivers is a critical factor because landslides often occur on both sides of the Yangtze River. It is obvious that landslide occurrences decrease with increasing distance to rivers. Furthermore, the possibility of landslides is greatly increased when the distance to rivers is less than 560 m, which can be verified by the highest FR value of this class (<560 m). For land use, the residential areas are responsible for landslides due to the highest FR value of this class. For lithology, it can be concluded from Table A1 that the F class has highest probability of landslide occurrence with the highest FR value of 1.88. In the case of NDVI, the class of 0.1–0.5 is responsible for landslide because this class obtains the highest FR value of 3.94. With respect to NDWI, we can observe that the class of –0.4–0.3 has high spatial relationship with landslide occurrence. Rainfall is another crucial factor that influences slope stability; thus, the 1030–1060 mm class gets the highest FR value of 1.08.
The 10–20° class of the slope factor has the highest spatial relationship with landslide occurrence due to its highest FR value. Slope form plays a key role in analyzing the stability of landslides. It is observed that the class of GE/V is responsible for landslide occurrence with the highest FR value of 2.79. For TPI factor, more than 50% of landslides occurred in the −5–2 class. Results regarding TRI revealed that the FR value decreases as the TRI value increases and the class of <7 has the highest possibility of landslide occurrence with the FR value of 1.27. As for TST and TWI, the classes of <23 and 3.6–4.2 are highly susceptibility to landslides occurrence. The spatial relationship between landslide locations and TSC shows that the <42 class has the highest spatial relationship with FR values of 2.27.
4.2. Model Validation
In our experiments, all landslide models were constructed using the training set and the parameters were optimized through the trial-and-error process. Some related parameters of these methods were set up as shown in Table 2. Once the methods were built, the final landslide susceptibility map based on these methods were prepared in an ArcGIS environment. In order to better describe the susceptibility level of the study area, we used the natural break algorithm to divide the whole study area into five susceptibility classes [46,70]. Figure 4 presents landslide susceptibility maps of different methods and depicts the distribution of each susceptible class. It can be observed that all the DTs and DT+RF ensemble methods have similar spatial distributions. Specifically, the susceptibility class varies from very high to very low as distance to rivers increases. Furthermore, very high susceptible zones locate in the areas with lower altitude, indicating that these areas have great contribution to landslide occurrence. Landslide density is defined as the percentage of landslide pixels divided by the percentage of susceptible class pixels [71], and it was used to evaluate the effectiveness of landslide susceptibility maps. We can conclude from Table 3 that the very high susceptible class has the highest landslide density, followed by high, moderate, low, and very low susceptibility classes. Moreover, all the ensemble methods achieved higher very high landslide density values than corresponding base classifier.
Table 2.
Related parameters of the methods used in this study.
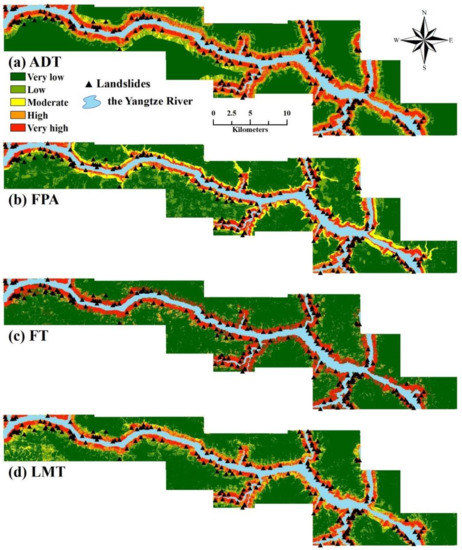
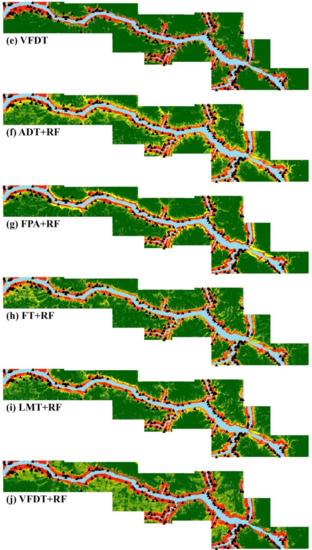
Figure 4.
Landslide susceptibility maps of different prediction method. (a) ADT, (b) FPA, (c) FT, (d) LMT, (e) VFDT, (f) ADT+RF, (g) FPA+RF, (h) FT+RF, (i) LMT+RF, and (j) VFDT+RF.
Table 3.
Landslide density of different susceptibility maps.
Table 4 lists the OA and MCC value of all the methods. It can be seen that all the ensemble methods achieved better performance than corresponding DT classifiers in terms of OA and MCC. In particular, the FT+RF method achieved the highest improvement of 7.63% than FT model in terms of OA, followed by the ADT+RF (2.54%), LMT+RF (1.7%), VFDT+RF (0.88%), and FPA+RF (0.85%) methods, respectively. The same trend can be seen in terms of MCC that the FT+RF methods achieved the highest improvement of 0.152, followed by the ADT+RF (0.049), LMT+RF (0.035), VFDT+RF (0.019), and FPA+RF (0.017) methods.
Table 4.
Performance of different methods.
The ROC curves using the validation set are illustrated in Figure 5. For the DTs in Figure 5a, the VFDT method achieved the highest AUC value of 0.892, followed by the LMT, ADT, FPA, and FT methods with the AUC values of 0.884, 0.871, 0.858, and 0.779, respectively. For the ensemble methods in Figure 5b, both the VFDT+RF and FPA+RF methods obtained the highest AUC value of 0.907, followed by the ADT+RF, FT+RF and LMT+RF methods with the AUC values of 0.903, 0.900, and 0.896, respectively. It can be seen that the VFDT method obtained better prediction result than that of the other DTs. When this base classifier is integrated with the RF ensemble technique, the best prediction performance was achieved using the VFDT+RF method as well. Furthermore, all the DTs can be improved when integrating them with the RF ensemble technique because the ensemble methods are more efficient than the DTs. In particular, the FT+RF method achieved the greatest improvement over FT (0.121) in terms of AUC, followed by the FPA+RF (0.049), ADT+RF (0.032), VFDT+RF (0.015) and LMT+RF (0.012) methods. Table 5 lists the results of Chi-square test between DTs and ensemble methods. It can be seen that there is a significant difference between the DTs and the corresponding ensemble methods because the Chi-square and p values of these pair models ideally satisfied the specified threshold values previously mentioned.
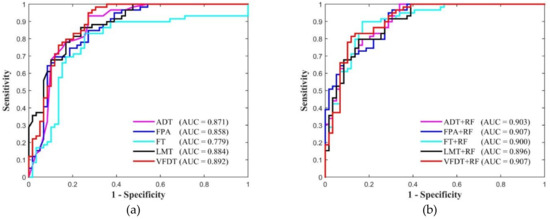
Figure 5.
The ROC curves for all the methods using the verification set. (a) DTs and (b) RF-based ensemble methods.
Table 5.
Chi-square values and significant levels of all the methods.
4.3. Comparation with Benchmark Methods
To further validate the effectiveness of the ensemble framework, three state-of-the-art RF-based ensemble methods of RBFNN+RF, MLPNNs+RF and NB+RF were selected for comparison. The three benchmark methods have been successfully used in LSM [29,38,39]. The resultant maps of these methods and the corresponding ROC curves are shown in Figure 6 and Figure 7, respectively. In terms of prediction performance, all the proposed ensemble methods were better than the three ensemble methods because the DTs are sensitive to rotation of the feature axes of the RF structure, which can result in more accurate results.
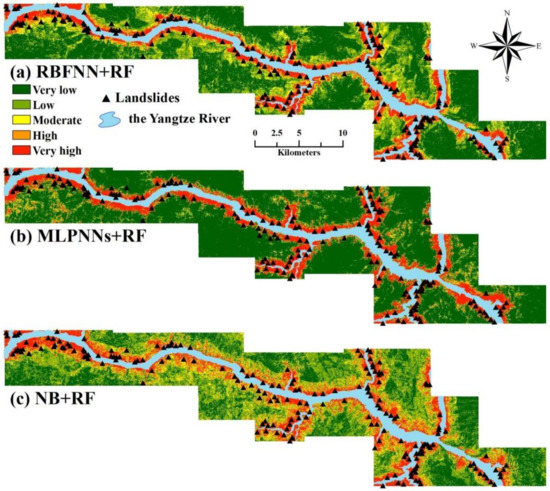
Figure 6.
Landslide susceptibility maps for different state-of-the-art ensemble methods. (a) RBFNN+RF, (b) MLPNNs+RF, and (c) NB+RF.
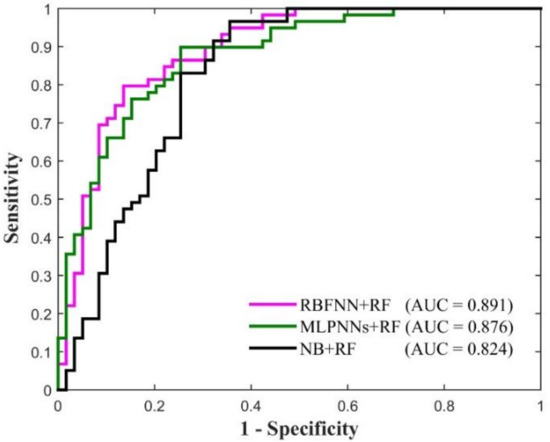
Figure 7.
The ROC curves for different popular ensemble methods using the verification set.
4.4. Parameter Analysis
As mentioned in Section 3.3, the PCA algorithm was originally used in the RF ensemble technique to rotate the axes rather than reducing dimensionality. In fact, other linear transformations may realize the same function in the RF algorithm, such as nonparametric discriminant analysis (NDA), Gaussian random projections (GRP), sparse random projections (SRP), and random subset (RS). To evaluate the performance of these feature extraction approaches on the prediction results, we construct several RF ensemble techniques for comparison. Figure 8 shows the AUC values of the ensemble methods with different feature extraction methods. Specifically, for the ADT+RF, LMT+RF, and VFDT+RF methods, each of them with PCA achieved higher AUC values than that with GRP, SRP and RS, respectively. The FPA+RF method with SRP obtained the highest AUC value of 0.914, which is only 0.007 higher than that of the FPA+RF method with PCA. Moreover, the FT+RF method with PCA, GRP and SRP obtained the same AUC value of 0.901, which means that any of these feature extraction approaches can result in a satisfactory prediction accuracy. Based on the above analysis, the PCA algorithm is an appropriate choice for the performance of the RF ensemble technique.
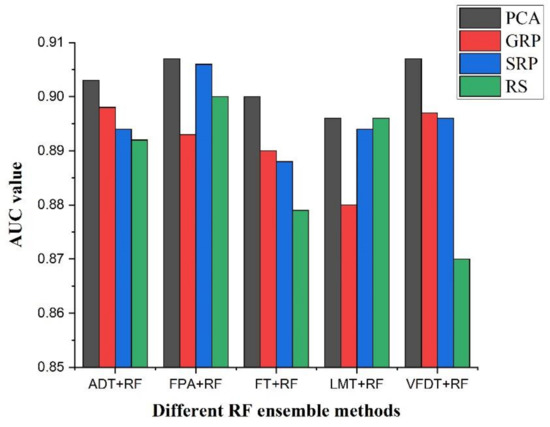
Figure 8.
The AUC value of four RF ensemble methods with different feature selection methods.
5. Discussion
Recently, many machine learning techniques have been developed for landslide susceptibility modelling, including LR [14], SVM [72], and ANN [73]. Among them, ensemble methods are very effective to combine weak classifiers to obtain better prediction performance [24,30,39]. To the best of our knowledge, there is no comparative study of a generalized ensemble framework by integrating the same ensemble technique with different base classifiers. In this study, the main goal of this study is to compare and evaluate the performance of a novel ensemble framework by integrating five DTs with the RF ensemble technique for LSM at the Three Gorges Reservoir area. Before analyzing landslide susceptibility, it is significant to evaluate the predictive capability of 20 conditioning factors. Zhou et al. [36] implemented the landslide susceptibility analysis in the Three Gorges Reservoir area and indicated that the factors of altitude and distance to rivers are much more important than other factors, which was in agreement with our results. The altitude and distance to rivers are important factors that influence the occurrence and development of landslides, especially in the Three Gorges Reservoir area. The Yangtze River runs through the entire study area, and the reservoirs construction induce a large number of landslide hazard. Furthermore, in the study area, areas with lower altitude are usually close to the mainstream of the Yangtze river. The periodically fluctuation of water level strongly influences the rock and soil mass near the bank slope. Therefore, the factors of altitude and distance to rivers play an important role in the occurrence of landslides. Moreover, Peng et al [35] concluded that rainfall was relatively uniform in the same Three Gorges Reservoir area and had little importance to landslide occurrence, which is in consistent with current study. Specifically, The GR results demonstrated that the altitude and distance to rivers factors obtain much higher AM value than the other conditioning factors. Furthermore, the FR results showed that the <300 m class of altitude and the <560 m class of distance to rivers achieved the highest FR values, accounting for over 83% and 88% of landslide locations, respectively. The main reason on these observations is that the areas located in a lower altitude are very close to the Yangtze River. Meanwhile, the water level of the Three Gorges Reservoir unusually has significant increases and periodic fluctuations, which seriously affect the stability of bank slopes [42,74].
In our experiments, all the proposed ensemble methods can achieve a better performance than the traditional DTs, since the proposed ensemble framework can effectively improve predictive capability by avoiding over-fitting and reducing variance and bias, which is accord with the previous studies [30,39,44]. Comparison of the performance of all models indicated that ensemble methods have 0.012–0.121 and 0.85%–7.63% improvement than base classifier in terms of AUC and OA values, respectively. Although the improvement seems to be limited, but from Table 3 we can confirm that all the models is significant on providing susceptibility maps. Moreover, the result of significance analysis also demonstrated that ensemble methods is statistical difference with corresponding base classifiers, which proved that ensemble methods is instructive for decision makers to prefer those ensemble methods than DT classifiers. Specifically, the FT+RF method obtained the greatest performance improvement among all the proposed methods, since the FT model can reduce bias by using functional decision and has a better combination capability with the RF ensemble technique than the other DT base classifiers, which demonstrated that selecting an optimal base classifier is critical for applying ensemble technique. The RF ensemble method has been proved as a preeminent technique that integrated tree-related classifiers in the field of LSM [30,39,75]. Moreover, several previous studies applied RF ensemble integrated with other base classifiers of RBFNN, MLPNNs, and NB, respectively [29,38,39], which obtained relatively good results. However, the result of present study shows that our proposed five ensemble frameworks all achieved better accuracy than RBFNN+RF, MLPNNs+RF, and NB+RF in terms of AUC. It is reasonable because RF can optimize the dataset and train the base classifier in a rotated feature space, and the selected DTs are very sensitive to rotation of the feature axes in RF architecture. Therefore, the DTs can perform better in combination with RF and improve its performance.
6. Conclusions
This article proposes a novel ensemble framework by integrating DTs with the RF ensemble technique to produce landslide susceptibility maps. RF ensemble technique can accurately portray the landslide susceptibility distribution of the Three Gorges Reservoir area of China. The final susceptibility maps were produced using the DTs of ADT, FPA, FT, LMT, and VFDT and their ensembles, which were based on 20 conditioning factors and landslide inventory map. Experiment results demonstrated that all the DT-based classifiers can be improved by the RF ensemble technique with 0.012–0.121, 0.85–7.63%, and 0.017–0.152 in terms of AUC, OA, and MCC, respectively. Specifically, FT obtained the highest performance improvement and exhibits the best integration ability than other DT base classifiers. Moreover, all the proposed ensemble methods achieved better performance against the state-of-the-art RF ensemble methods in terms of AUC, which demonstrated that the RF ensemble technique has better integration capability with DT classifiers. That comparison also confirmed that selecting an appropriate base classifier is of great significant for ensemble technique to perform landslide susceptibility analysis. In conclusion, the proposed ensemble framework is effective for landslide disaster management and assessment. In the future, our studies will be made by investigating more efficient ensemble prediction methods.
Author Contributions
Z.F. and Y.W. implemented all the proposed classification method and conducted the experiments. Z.F. finished the first draft, G.D. and Y.W. supervised the research and contributed to the editing and review of the manuscript. L.P. discussed some key issues on the proposed model and provided very useful suggestions for improving our work. All authors have read and agreed to the published version of the manuscript.
Funding
This research was funded by National Natural Science Foundation of China, grant number 61271408 and 41602362; the Open Fund of Hubei Key Laboratory of Intelligent Robot (Wuhan Institute of Technology), grant number HBIR 202002; Hubei Provincial Educational Science Planning Project, grant number 2019GA090; Hubei Province Technology Innovation Project, grant number 2019AAA045; Hubei Provincial Undergraduate Training Programs for Innovation and Entrepreneurship, grant number S201910490051; Survey Project from China Vocational Education Association of Hubei Province, grant number HBZJ2020016.
Institutional Review Board Statement
Not applicable.
Informed Consent Statement
Not applicable.
Data Availability Statement
Data sharing is not applicable to this article.
Acknowledgments
The authors are grateful for the data and materials provided by the Headquarters for Prevention and Control of Geological Disasters in the Three Gorges Reservoir. Also, the authors would like to thank the handling editors and the three anonymous reviewers for their valuable comments and suggestions, which significantly improved the quality of this paper.
Conflicts of Interest
The authors declare no conflict of interest.
Appendix A
Table A1.
Spatial relationship between each landslide conditioning factor and landslides using FR model.
Table A1.
Spatial relationship between each landslide conditioning factor and landslides using FR model.
| Factors | Class | No. of Landslide | Percentage of Landslide % | No. of Pixels in Domain | Percentage of Domain % | FR |
|---|---|---|---|---|---|---|
| Altitude (m) | <300 | 164 | 83.67 | 103,566 | 20.50 | 4.08 |
| 300–600 | 32 | 16.33 | 208,846 | 41.34 | 0.39 | |
| 600–900 | 0 | 0.00 | 133,188 | 26.36 | 0.00 | |
| 900–1000 | 0 | 0.00 | 17,855 | 3.53 | 0.00 | |
| 1000–2000 | 0 | 0.00 | 41,790 | 8.27 | 0.00 | |
| Aspect | Flat | 0 | 0.00 | 2749 | 0.54 | 0.00 |
| North | 34 | 17.35 | 77,236 | 15.29 | 1.13 | |
| Northeast | 25 | 12.76 | 64,499 | 12.77 | 1.00 | |
| East | 20 | 10.20 | 57,824 | 11.44 | 0.89 | |
| Southeast | 15 | 7.65 | 51,996 | 10.29 | 0.74 | |
| South | 27 | 13.78 | 62,269 | 12.32 | 1.12 | |
| Southwest | 18 | 9.18 | 54,352 | 10.76 | 0.85 | |
| West | 26 | 13.27 | 73,462 | 14.54 | 0.91 | |
| Northwest | 31 | 15.82 | 60,858 | 12.05 | 1.31 | |
| Catchment area (m2) | 900–9000 | 113 | 57.65 | 361,223 | 71.49 | 0.81 |
| 9000–25,000 | 75 | 38.27 | 120,329 | 23.82 | 1.61 | |
| >25,000 | 8 | 4.08 | 23,693 | 4.69 | 0.87 | |
| Catchment slope (°) | < 0.3 | 35 | 17.86 | 110,803 | 21.93 | 0.81 |
| 0.3–0.5 | 143 | 72.96 | 281,154 | 55.65 | 1.31 | |
| > 0.5 | 18 | 9.18 | 113,288 | 22.42 | 0.41 | |
| Curvature (°/100 m) | <–0.25 | 2 | 1.02 | 26,532 | 5.25 | 0.19 |
| -0.25–0.05 | 39 | 19.90 | 129,494 | 25.63 | 0.78 | |
| -0.05–0.15 | 132 | 67.35 | 280,986 | 55.61 | 1.21 | |
| >0.15 | 23 | 11.73 | 68,233 | 13.50 | 0.87 | |
| Magnitude (MS) | <1.4 | 97 | 49.49 | 211,196 | 41.80 | 1.18 |
| 1.4–1.7 | 76 | 38.78 | 195,731 | 38.74 | 1.00 | |
| >1.7 | 23 | 11.73 | 98,318 | 19.46 | 0.60 | |
| Distance to faults (m) | <1200 | 48 | 24.49 | 129,597 | 25.65 | 0.95 |
| 1200–2400 | 44 | 22.45 | 137,238 | 27.16 | 0.83 | |
| 2400–3600 | 42 | 21.43 | 113,788 | 22.52 | 0.95 | |
| 3600–5400 | 57 | 29.08 | 96,751 | 19.15 | 1.52 | |
| >5400 | 5 | 2.55 | 27,871 | 5.52 | 0.46 | |
| Land use | Residential | 43 | 21.94 | 26,063 | 5.16 | 4.25 |
| Forest | 5 | 2.55 | 70,400 | 13.93 | 0.18 | |
| Water | 29 | 14.80 | 86,629 | 17.15 | 0.86 | |
| Shrub | 11 | 5.61 | 106,239 | 21.03 | 0.27 | |
| Farmland | 108 | 55.10 | 215,914 | 42.73 | 1.29 | |
| Lithology | A | 4 | 2.04 | 36,276 | 7.18 | 0.28 |
| B | 8 | 4.08 | 83,547 | 16.54 | 0.25 | |
| C | 4 | 2.04 | 12,109 | 2.40 | 0.85 | |
| D | 10 | 5.10 | 68,380 | 13.53 | 0.38 | |
| E | 57 | 29.08 | 119,492 | 23.65 | 1.23 | |
| F | 57 | 29.08 | 78,188 | 15.48 | 1.88 | |
| G | 56 | 28.57 | 107,253 | 21.23 | 1.35 | |
| NDVI | <0.1 | 10 | 5.10 | 13,832 | 2.74 | 1.86 |
| 0.1–0.5 | 39 | 19.90 | 25,492 | 5.05 | 3.94 | |
| 0.5–0.7 | 76 | 38.78 | 112,911 | 22.35 | 1.74 | |
| >0.7 | 71 | 36.22 | 353,052 | 69.88 | 0.52 | |
| NDWI | <−0.6 | 99 | 50.51 | 413,436 | 81.83 | 0.62 |
| −0.6–−0.4 | 64 | 32.65 | 63,499 | 12.57 | 2.60 | |
| −0.4–0.3 | 26 | 13.27 | 18,352 | 3.63 | 3.65 | |
| >0.3 | 7 | 3.57 | 9998 | 1.98 | 1.80 | |
| Rainfall (mm/yr) | <980 | 83 | 42.35 | 243,656 | 48.23 | 0.88 |
| 980–1000 | 6 | 3.06 | 29,800 | 5.90 | 0.52 | |
| 1000–1030 | 47 | 23.98 | 160,937 | 31.85 | 0.75 | |
| 1030–1060 | 44 | 22.45 | 105,453 | 20.87 | 1.08 | |
| >1060 | 16 | 8.16 | 43,003 | 8.51 | 0.96 | |
| Distance to rivers (m) | <560 | 173 | 88.27 | 129,924 | 25.72 | 3.43 |
| 560–890 | 18 | 9.18 | 63,275 | 12.52 | 0.73 | |
| 890–1450 | 4 | 2.04 | 98,029 | 19.40 | 0.11 | |
| >1450 | 1 | 0.51 | 214,017 | 42.36 | 0.01 | |
| Slope (°) | <10 | 10 | 5.10 | 39,238 | 7.77 | 0.66 |
| 10–20 | 80 | 40.82 | 154,434 | 30.57 | 1.34 | |
| 20–30 | 74 | 37.76 | 173,889 | 34.42 | 1.10 | |
| 30–40 | 27 | 13.78 | 97,336 | 19.27 | 0.72 | |
| 40–50 | 5 | 2.55 | 31,630 | 6.26 | 0.41 | |
| 50–60 | 0 | 0.00 | 7419 | 1.47 | 0.00 | |
| >60 | 0 | 0.00 | 1299 | 0.26 | 0.00 | |
| Slope form | V/V | 67 | 34.18 | 144,923 | 28.68 | 1.19 |
| GE/V | 9 | 4.59 | 8311 | 1.64 | 2.79 | |
| X/V | 23 | 11.73 | 56,096 | 11.10 | 1.06 | |
| V/GR | 8 | 4.08 | 17,748 | 3.51 | 1.16 | |
| GE/GR | 1 | 0.51 | 3038 | 0.60 | 0.85 | |
| X/GR | 11 | 5.61 | 15,352 | 3.04 | 1.85 | |
| V/X | 23 | 11.73 | 69,636 | 13.78 | 0.85 | |
| GE/X | 5 | 2.55 | 12,208 | 2.42 | 1.06 | |
| X/X | 49 | 25.00 | 177,933 | 35.22 | 0.71 | |
| TPI | <−15 | 2 | 1.02 | 19,483 | 3.86 | 0.26 |
| −15–5 | 35 | 17.86 | 91,128 | 18.04 | 0.99 | |
| −5–2 | 99 | 50.51 | 186,356 | 36.88 | 1.37 | |
| 2–10 | 56 | 28.57 | 158,197 | 31.31 | 0.91 | |
| >10 | 4 | 2.04 | 50,081 | 9.91 | 0.21 | |
| TRI | <7 | 58 | 29.59 | 117,952 | 23.35 | 1.27 |
| 7–14 | 113 | 57.65 | 270,695 | 53.58 | 1.08 | |
| 14–21 | 21 | 10.71 | 88,865 | 17.59 | 0.61 | |
| 21–28 | 4 | 2.04 | 19,126 | 3.79 | 0.54 | |
| >28 | 0 | 0.00 | 8607 | 1.70 | 0.00 | |
| TSC | <42 | 20 | 10.20 | 22,695 | 4.49 | 2.27 |
| 42–49 | 82 | 41.84 | 133,494 | 26.42 | 1.58 | |
| 49–54 | 68 | 34.69 | 219,694 | 43.48 | 0.80 | |
| >54 | 26 | 13.27 | 129,362 | 25.60 | 0.52 | |
| TST | <23 | 68 | 34.69 | 80,958 | 16.02 | 2.17 |
| 23–29 | 81 | 41.33 | 171,818 | 34.01 | 1.22 | |
| 29–35 | 43 | 21.94 | 176,691 | 34.97 | 0.63 | |
| >35 | 4 | 2.04 | 75,778 | 15.00 | 0.14 | |
| TWI | <3 | 12 | 6.12 | 99,599 | 19.71 | 0.31 |
| 3–3.6 | 83 | 42.35 | 216,121 | 42.78 | 0.99 | |
| 3.6–4.2 | 86 | 43.88 | 147,164 | 29.13 | 1.51 | |
| 4.2–6.6 | 15 | 7.65 | 38,306 | 7.58 | 1.01 | |
| >6.6 | 0 | 0.00 | 4055 | 0.80 | 0.00 |
References
- Reichenbach, P.; Rossi, M.; Malamud, B.; Mihir, M.; Guzzetti, F. A Review of Statistically-Based Landslide Susceptibility Models. Earth Sci. Rev. 2018, 180, 60–91. [Google Scholar] [CrossRef]
- Hussin, H.Y.; Zumpano, V.; Reichenbach, P.; Sterlacchini, S.; Micu, M.; van Westen, C.; Bălteanu, D. Different Landslide Sampling Strategies in a Grid-Based Bi-Variate Statistical Susceptibility Model. Geomorphology 2016, 253, 508–523. [Google Scholar] [CrossRef]
- Akgun, A.; Dag, S.; Bulut, F. Landslide Susceptibility Mapping for a Landslide-Prone Area (Findikli, Ne of Turkey) by Likelihood-Frequency Ratio and Weighted Linear Combination Models. Environ. Geol. 2008, 54, 1127–1143. [Google Scholar] [CrossRef]
- Pradhan, A.M.S.; Kim, Y.T. Evaluation of a Combined Spatial Multi-Criteria Evaluation Model and Deterministic Model for Landslide Susceptibility Mapping. Catena 2016, 140, 125–139. [Google Scholar] [CrossRef]
- Feizizadeh, B.; Blaschke, T.; Nazmfar, H. Gis-Based Ordered Weighted Averaging and Dempster–Shafer Methods for Landslide Susceptibility Mapping in the Urmia Lake Basin, Iran. Int. J. Digit. Earth 2014, 7, 688–708. [Google Scholar] [CrossRef]
- Anagnostopoulos, G.G.; Burlando, P. An Object-Oriented Computational Framework for the Simulation of Variably Saturated Flow in Soils, Using a Reduced Complexity Model. Environ. Model. Softw. 2012, 38, 191–202. [Google Scholar] [CrossRef]
- Van Westen, C.J.; Castellanos, E.; Kuriakose, S.L. Spatial Data for Landslide Susceptibility, Hazard, and Vulnerability Assessment: An Overview. Eng. Geol. 2008, 102, 112–131. [Google Scholar] [CrossRef]
- Ilia, I.; Tsangaratos, P. Applying Weight of Evidence Method and Sensitivity Analysis to Produce a Landslide Susceptibility Map. Landslides 2016, 13, 379–397. [Google Scholar] [CrossRef]
- Guri, P.K.; Patel, R.C. Spatial Prediction of Landslide Susceptibility in Parts of Garhwal Himalaya, India, Using the Weight of Evidence Modelling. Environ. Monit. Assess. 2015, 187, 324. [Google Scholar] [CrossRef]
- Hong, H.; Tsangaratos, P.; Ilia, I.; Liu, J.; Zhu, A.-X.; Chen, W. Application of Fuzzy Weight of Evidence and Data Mining Techniques in Construction of Flood Susceptibility Map of Poyang County, China. Sci. Total Environ. 2018, 625, 575–588. [Google Scholar] [CrossRef]
- Pawluszek-Filipiak, K.; Oreńczak, N.; Pasternak, M. Investigating the Effect of Cross-Modeling in Landslide Susceptibility Mapping. Appl. Sci. 2020, 10, 6335. [Google Scholar] [CrossRef]
- Hong, H.; Miao, Y.; Liu, J.; Zhu, A.-X. Exploring the Effects of the Design and Quantity of Absence Data on the Performance of Random Forest-Based Landslide Susceptibility Mapping. Catena 2019, 176, 45–64. [Google Scholar] [CrossRef]
- Dou, J.; Yunus, A.P.; Bui, D.T.; Merghadi, A.; Sahana, M.; Zhu, Z.; Chen, C.-W.; Khosravi, K.; Yang, Y.; Pham, B.T. Assessment of Advanced Random Forest and Decision Tree Algorithms for Modeling Rainfall-Induced Landslide Susceptibility in the Izu-Oshima Volcanic Island, Japan. Sci. Total Environ. 2019, 662, 332–346. [Google Scholar] [CrossRef] [PubMed]
- Aditian, A.; Kubota, T.; Shinohara, Y. Comparison of Gis-Based Landslide Susceptibility Models Using Frequency Ratio, Logistic Regression, and Artificial Neural Network in a Tertiary Region of Ambon, Indonesia. Geomorphology 2018, 318, 101–111. [Google Scholar] [CrossRef]
- Chen, W.; Pourghasemi, H.R.; Zhao, Z. A Gis-Based Comparative Study of Dempster-Shafer, Logistic Regression and Artificial Neural Network Models for Landslide Susceptibility Mapping. Geocarto Int. 2017, 32, 367–385. [Google Scholar] [CrossRef]
- Wang, Y.; Fang, Z.; Hong, H. Comparison of Convolutional Neural Networks for Landslide Susceptibility Mapping in Yanshan County, China. Sci. Total Environ. 2019, 666, 975–993. [Google Scholar] [CrossRef]
- Fang, Z.; Wang, Y.; Peng, L.; Hong, H. Integration of Convolutional Neural Network and Conventional Machine Learning Classifiers for Landslide Susceptibility Mapping. Comput. Geosci. 2020, 139, 104470. [Google Scholar] [CrossRef]
- Huang, Y.; Zhao, L. Review on Landslide Susceptibility Mapping Using Support Vector Machines. Catena 2018, 165, 520–529. [Google Scholar] [CrossRef]
- Kumar, D.; Thakur, M.; Dubey, C.S.; Shukla, D.P. Landslide Susceptibility Mapping & Prediction Using Support Vector Machine for Mandakini River Basin, Garhwal Himalaya, India. Geomorphology 2017, 295, 115–125. [Google Scholar]
- Bui, D.T.; Tuan, T.A.; Hoang, N.; Thanh, N.Q.; Nguyen, D.B.; van Liem, N.; Pradhan, B. Spatial Prediction of Rainfall-Induced Landslides for the Lao Cai Area (Vietnam) Using a Hybrid Intelligent Approach of Least Squares Support Vector Machines Inference Model and Artificial Bee Colony Optimization. Landslides 2017, 14, 447–458. [Google Scholar]
- Kittler, J. Multiple Classifier Systems. In Soft Computing Approach to Pattern Recognition and Image Processing; World Scientific: Singapore, 2002; pp. 3–22. [Google Scholar]
- Yan, F.; Zhang, Q.; Ye, S.; Ren, B. A Novel Hybrid Approach for Landslide Susceptibility Mapping Integrating Analytical Hierarchy Process and Normalized Frequency Ratio Methods with the Cloud Model. Geomorphology 2019, 327, 170–187. [Google Scholar] [CrossRef]
- Choubin, B.; Moradi, E.; Golshan, M.; Adamowski, J.; Sajedi-Hosseini, F.; Mosavi, A. An Ensemble Prediction of Flood Susceptibility Using Multivariate Discriminant Analysis, Classification and Regression Trees, and Support Vector Machines. Sci. Total Environ. 2019, 651, 2087–2096. [Google Scholar] [CrossRef] [PubMed]
- Termeh, S.; Vahid, R.; Kornejady, A.; Pourghasemi, H.R.; Keesstra, S. Flood Susceptibility Mapping Using Novel Ensembles of Adaptive Neuro Fuzzy Inference System and Metaheuristic Algorithms. Sci. Total Environ. 2018, 615, 438–451. [Google Scholar] [CrossRef] [PubMed]
- Pham, B.T.; Bui, D.T.; Prakash, I.; Dholakia, M.B. Rotation Forest Fuzzy Rule-Based Classifier Ensemble for Spatial Prediction of Landslides Using Gis. Nat. Hazards 2016, 83, 97–127. [Google Scholar] [CrossRef]
- Fang, Z.; Wang, Y.; Peng, L.; Hong, H. A Comparative Study of Heterogeneous Ensemble-Learning Techniques for Landslide Susceptibility Mapping. Int. J. Geogr. Inf. Sci. 2021, 35, 321–347. [Google Scholar] [CrossRef]
- Truong, X.; Mitamura, M.; Kono, Y.; Raghavan, V.; Yonezawa, G.; Do, T.; Bui, D.T.; Lee, S. Enhancing Prediction Performance of Landslide Susceptibility Model Using Hybrid Machine Learning Approach of Bagging Ensemble and Logistic Model Tree. Appl. Sci. 2018, 8, 1046. [Google Scholar] [CrossRef]
- Bui, D.T.; Ho, T.; Pradhan, B.; Pham, B.; Nhu, V.; Revhaug, I. Gis-Based Modeling of Rainfall-Induced Landslides Using Data Mining-Based Functional Trees Classifier with Adaboost, Bagging, and Multiboost Ensemble Frameworks. Environ. Earth Sci. 2016, 75, 1101. [Google Scholar]
- Pham, B.T.; Bui, D.T.; Prakash, I.; Dholakia, M.B. Hybrid Integration of Multilayer Perceptron Neural Networks and Machine Learning Ensembles for Landslide Susceptibility Assessment at Himalayan Area (India) Using Gis. Catena 2017, 149, 52–63. [Google Scholar] [CrossRef]
- Hong, H.; Liu, J.; Bui, D.T.; Pradhan, B.; Acharya, T.D.; Pham, B.T.; Zhu, A.-X.; Chen, W.; Ahmad, B.B. Landslide Susceptibility Mapping Using J48 Decision Tree with Adaboost, Bagging and Rotation Forest Ensembles in the Guangchang Area (China). Catena 2018, 163, 399–413. [Google Scholar] [CrossRef]
- Kadavi, P.; Lee, C.-W.; Lee, S. Application of Ensemble-Based Machine Learning Models to Landslide Susceptibility Mapping. Remote Sens. 2018, 10, 1252. [Google Scholar] [CrossRef]
- Chen, W.; Panahi, M.; Pourghasemi, H.R. Performance Evaluation of Gis-Based New Ensemble Data Mining Techniques of Adaptive Neuro-Fuzzy Inference System (Anfis) with Genetic Algorithm (Ga), Differential Evolution (De), and Particle Swarm Optimization (Pso) for Landslide Spatial Modelling. Catena 2017, 157, 310–324. [Google Scholar] [CrossRef]
- Bhargava, N.; Sharma, G.; Bhargava, R.; Mathuria, M. Decision Tree Analysis on J48 Algorithm for Data Mining. Int. J. Adv. Res. Comput. Sci. Softw. Eng. 2013, 3, 188–198. [Google Scholar]
- Bai, S.-B.; Jian, W.; Guo-Nian, L.; Ping-Gen, Z.; Sheng-Shan, H.; Su-Ning, X. Gis-Based and Data-Driven Bivariate Landslide-Susceptibility Mapping in the Three Gorges Area, China. Pedosphere 2009, 19, 14–20. [Google Scholar] [CrossRef]
- Peng, L.; Niu, R.; Huang, B.; Wu, X.; Zhao, Y.; Ye, R. Landslide Susceptibility Mapping Based on Rough Set Theory and Support Vector Machines: A Case of the Three Gorges Area, China. Geomorphology 2014, 204, 287–301. [Google Scholar] [CrossRef]
- Zhou, C.; Yin, K.; Cao, Y.; Ahmed, B.; Li, Y.; Catani, F.; Pourghasemi, H.R. Landslide Susceptibility Modeling Applying Machine Learning Methods: A Case Study from Longju in the Three Gorges Reservoir Area, China. Comput. Geosci. 2018, 112, 23–37. [Google Scholar] [CrossRef]
- Kuncheva, I.L.; Rodríguez, J.J. An Experimental Study on Rotation Forest Ensembles. In Proceedings of the International Workshop on Multiple Classifier Systems, Prague, Czech Republic, 23–25 May 2007. [Google Scholar]
- Borrelli, L.; Ciurleo, M.; Gullà, G. Shallow Landslide Susceptibility Assessment in Granitic Rocks Using Gis-Based Statistical Methods: The Contribution of the Weathering Grade Map. Landslides 2018, 15, 1127–1142. [Google Scholar] [CrossRef]
- Pham, B.T.; Shirzadi, A.; Bui, D.T.; Prakash, I.; Dholakia, M.B. A Hybrid Machine Learning Ensemble Approach Based on a Radial Basis Function Neural Network and Rotation Forest for Landslide Susceptibility Modeling: A Case Study in the Himalayan Area, India. Int. J. Sediment Res. 2018, 33, 157–170. [Google Scholar] [CrossRef]
- Zhou, C.; Yin, K.; Cao, Y.; Ahmed, B. Application of Time Series Analysis and Pso–Svm Model in Predicting the Bazimen Landslide in the Three Gorges Reservoir, China. Eng. Geol. 2016, 204, 108–120. [Google Scholar] [CrossRef]
- Tang, H.; Wasowski, J.; Juang, C.H. Geohazards in the Three Gorges Reservoir Area, China—Lessons Learned from Decades of Research. Eng. Geol. 2019, 261, 105267. [Google Scholar] [CrossRef]
- Wang, Q.; Wang, Y.; Niu, R.; Peng, L. Integration of Information Theory, K-Means Cluster Analysis and the Logistic Regression Model for Landslide Susceptibility Mapping in the Three Gorges Area, China. Remote Sens. 2017, 9, 938. [Google Scholar] [CrossRef]
- Tien, B.D.; Paraskevas, T.; Viet-Tien, N.; Van, L.N.; Trong, T.P. Comparing the Prediction Performance of a Deep Learning Neural Network Model with Conventional Machine Learning Models in Landslide Susceptibility Assessment. Catena 2020, 188, 104426. [Google Scholar]
- Pham, B.T.; Prakash, I.; Singh, S.K.; Shirzadi, A.; Shahabi, H.; Bui, D.T. Landslide Susceptibility Modeling Using Reduced Error Pruning Trees and Different Ensemble Techniques: Hybrid Machine Learning Approaches. Catena 2019, 175, 203–218. [Google Scholar] [CrossRef]
- Pawłuszek, K.; Marczak, S.; Borkowski, A.; Tarolli, P. Multi-Aspect Analysis of Object-Oriented Landslide Detection Based on an Extended Set of Lidar-Derived Terrain Features. ISPRS Int. J. Geo Inform. 2019, 8, 321. [Google Scholar] [CrossRef]
- Youssef, A.M.; Pourghasemi, H.R.; Pourtaghi, Z.S.; Al-Katheeri, M.M. Landslide Susceptibility Mapping Using Random Forest, Boosted Regression Tree, Classification and Regression Tree, and General Linear Models and Comparison of Their Performance at Wadi Tayyah Basin, Asir Region, Saudi Arabia. Landslides 2016, 13, 839–856. [Google Scholar] [CrossRef]
- Iwahashi, J.; Pike, R.J. Automated Classifications of Topography from Dems by an Unsupervised Nested-Means Algorithm and a Three-Part Geometric Signature. Geomorphology 2007, 86, 409–440. [Google Scholar] [CrossRef]
- Sörensen, R.; Zinko, U.; Seibert, J. On the Calculation of the Topographic Wetness Index: Evaluation of Different Methods Based on Field Observations. Hydrol. Earth Syst. Sci. Discuss. 2006, 10, 101–112. [Google Scholar] [CrossRef]
- Yu, X.; Wang, Y.; Niu, R.; Hu, Y. A Combination of Geographically Weighted Regression, Particle Swarm Optimization and Support Vector Machine for Landslide Susceptibility Mapping: A Case Study at Wanzhou in the Three Gorges Area, China. Int. J. Environ. Res. Public Health 2016, 13, 487. [Google Scholar] [CrossRef]
- Huang, F.; Zhang, J.; Zhou, C.; Wang, Y.; Huang, J.; Zhu, L. A Deep Learning Algorithm Using a Fully Connected Sparse Autoencoder Neural Network for Landslide Susceptibility Prediction. Landslides 2019, 17, 1–13. [Google Scholar] [CrossRef]
- Dash, M.; Liu, H. Feature Selection for Classification. Intell. Data Anal. 1997, 1, 131–156. [Google Scholar] [CrossRef]
- Micheletti, N.; Foresti, L.; Robert, S.; Leuenberger, M.; Pedrazzini, A.; Jaboyedoff, M.; Kanevski, M. Machine Learning Feature Selection Methods for Landslide Susceptibility Mapping. Math. Geosci. 2014, 46, 33–57. [Google Scholar] [CrossRef]
- Freund, Y.; Mason, L. The Alternating Decision Tree Learning Algorithm. In Proceedings of the 16th International Conference on Machine Learning ICML, Bled, Slovenia, 27–30 June 1999. [Google Scholar]
- Adnan, M.N.; Islam, M.Z. Forest Pa: Constructing a Decision Forest by Penalizing Attributes Used in Previous Trees. Expert Syst. Appl. 2017, 89, 389–403. [Google Scholar] [CrossRef]
- Gama, J. Functional Trees. Mach. Learn. 2004, 55, 219–250. [Google Scholar] [CrossRef]
- Landwehr, N.; Hall, M.; Frank, E. Logistic Model Trees. Mach. Learn. 2005, 59, 161–205. [Google Scholar] [CrossRef]
- Hulten, G.; Spencer, L.; Domingos, P. Mining Time-Changing Data Streams. In Proceedings of the Seventh ACM SIGKDD International Conference on Knowledge Discovery and Data Mining, San Francisco, CA, USA, 26–29 August 2001. [Google Scholar]
- Nguyen, Q.-K.; Bui, D.T.; Hoang, N.; Trinh, P.T.; Nguyen, V.; Yilmaz, I. A Novel Hybrid Approach Based on Instance Based Learning Classifier and Rotation Forest Ensemble for Spatial Prediction of Rainfall-Induced Shallow Landslides Using Gis. Sustainability 2017, 9, 813. [Google Scholar] [CrossRef]
- Youssef, A.M.; Pourghasemi, H.R.; El-Haddad, B.A.; Dhahry, B.K. Landslide Susceptibility Maps Using Different Probabilistic and Bivariate Statistical Models and Comparison of Their Performance at Wadi Itwad Basin, Asir Region, Saudi Arabia. Bull. Eng. Geol. Environ. 2016, 75, 63–87. [Google Scholar] [CrossRef]
- Sandric, I.; Ionita, C.; Chitu, Z.; Dardala, M.; Irimia, R.; Furtuna, F.T. Using Cuda to Accelerate Uncertainty Propagation Modelling for Landslide Susceptibility Assessment. Environ. Model. Softw. 2019, 115, 176–186. [Google Scholar] [CrossRef]
- Basu, T.; Pal, S. Rs-Gis Based Morphometrical and Geological Multi-Criteria Approach to the Landslide Susceptibility Mapping in Gish River Basin, West Bengal, India. Adv. Space Res. 2018, 63, 1253–1269. [Google Scholar] [CrossRef]
- Pham, B.T.; Prakash, I. Machine Learning Methods of Kernel Logistic Regression and Classification and Regression Trees for Landslide Susceptibility Assessment at Part of Himalayan Area, India. Indian J. Sci. Technol. 2018, 11, 1–10. [Google Scholar] [CrossRef]
- Mandal, S.; Mandal, K. Modeling and Mapping Landslide Susceptibility Zones Using Gis Based Multivariate Binary Logistic Regression (Lr) Model in the Rorachu River Basin of Eastern Sikkim Himalaya, India. Model. Earth Syst. Environ. 2018, 4, 69–88. [Google Scholar] [CrossRef]
- Wang, Y.; Fang, Z.; Wang, M.; Peng, L.; Hong, H. Comparative Study of Landslide Susceptibility Mapping with Different Recurrent Neural Networks. Comput. Geosci. 2020, 138, 104445. [Google Scholar] [CrossRef]
- Hong, H.; Pradhan, B.; Jebur, M.N.; Bui, D.T.; Xu, C.; Akgun, A. Spatial Prediction of Landslide Hazard at the Luxi Area (China) Using Support Vector Machines. Environ. Earth Sci. 2016, 75, 40. [Google Scholar] [CrossRef]
- Lombardo, L.; Mai, P.M. Presenting logistic regression-based landslide susceptibility results. Eng. Geol. 2018, 244, 14–24. [Google Scholar] [CrossRef]
- Kuncheva, L.I. Combining Pattern Classifiers: Methods and Algorithms; John Wiley & Sons: Hoboken, NJ, USA, 2004. [Google Scholar]
- Shirzadi, A.; Soliamani, K.; Habibnejhad, M.; Kavian, A.; Chapi, K.; Shahabi, H.; Chen, W.; Khosravi, K.; Pham, B.T.; Pradhan, B. Novel Gis Based Machine Learning Algorithms for Shallow Landslide Susceptibility Mapping. Sensors 2018, 18, 3777. [Google Scholar] [CrossRef] [PubMed]
- Pradhan, B. Application of an Advanced Fuzzy Logic Model for Landslide Susceptibility Analysis. Int. J. Comput. Intel. Syst. 2010, 3, 370–381. [Google Scholar] [CrossRef]
- Arabameri, A.; Saha, S.; Roy, J.; Chen, W.; Blaschke, T.; Bui, D.T. Landslide Susceptibility Evaluation and Management Using Different Machine Learning Methods in the Gallicash River Watershed, Iran. Remote Sens. 2020, 12, 475. [Google Scholar] [CrossRef]
- Crozier, M.J. A Proposed Cell Model for Multiple-Occurrence Regional Landslide Events: Implications for Landslide Susceptibility Mapping. Geomorphology 2017, 295, 480–488. [Google Scholar] [CrossRef]
- Chen, W.; Pourghasemi, H.R.; Naghibi, S.A. A Comparative Study of Landslide Susceptibility Maps Produced Using Support Vector Machine with Different Kernel Functions and Entropy Data Mining Models in China. Bull. Eng. Geol. Environ. 2018, 77, 647–664. [Google Scholar] [CrossRef]
- Soma, A.S.; Kubota, T.; Mizuno, H. Optimization of Causative Factors Using Logistic Regression and Artificial Neural Network Models for Landslide Susceptibility Assessment in Ujung Loe Watershed, South Sulawesi Indonesia. J. Mountain Sci. 2019, 16, 383–401. [Google Scholar] [CrossRef]
- Bai, S.-B.; Wang, J.; Lü, G.; Zhou, P.; Hou, S.; Xu, S. Gis-Based Logistic Regression for Landslide Susceptibility Mapping of the Zhongxian Segment in the Three Gorges Area, China. Geomorphology 2010, 115, 23–31. [Google Scholar] [CrossRef]
- Büechi, B.; Jan, K.; Holger, F.; Christain, H.; Tazio, S.; Alejo, C. Regional-Scale Landslide Susceptibility Modelling in the Cordillera Blanca, Peru—A Comparison of Different Approaches. Landslides 2019, 16, 395–407. [Google Scholar] [CrossRef]


Publisher’s Note: MDPI stays neutral with regard to jurisdictional claims in published maps and institutional affiliations. |
© 2021 by the authors. Licensee MDPI, Basel, Switzerland. This article is an open access article distributed under the terms and conditions of the Creative Commons Attribution (CC BY) license (http://creativecommons.org/licenses/by/4.0/).