Abstract
Availability of precipitation data at high spatial and temporal resolution is crucial for the understanding of precipitation behaviors that are determinant for environmental aspects such as hydrology, ecology, and social aspects like agriculture, food security, or health issues. This study evaluates the performance of 3B42-V7 satellite-based precipitation product on extreme precipitation estimates in China, by using the Fuzzy C-Means algorithm and L-moment-based regional frequency analysis method. The China Gauge-based Daily Precipitation Analysis (CGDPA) product is employed to measure the estimation biases of 3B42-V7. Results show that: (1) for most regions of China, the Generalized Extreme Value and Generalized Normal distributions are preferable for extreme precipitation estimates; (2) the extreme precipitation estimations of 3B42-V7 for different return periods have a high correlation with those of CGDPA, with biases within 25% for a majority of China on extreme precipitation estimates.
1. Introduction
The knowledge and estimation of extreme precipitation are essential for many applications such as water resources management, flood forecasting, transportation, early warning, and disaster mitigation [1,2,3,4]. Observing the physical quantity of Earth’s atmosphere through satellites and using algorithms to combine multi-source remote sensing data is an effective way of estimating precipitation [5,6,7]. This kind of quantitative precipitation estimation product overcomes the shortcomings of gauge station-based observations such as limited coverage, uneven distribution, and poor consistency. Among the satellite-based precipitation estimation products, the Tropical rainfall measurement mission Multi-satellite Precipitation Analysis (TMPA) 3B42-V7 has received much attention [8,9]. Many studies have indicated that 3B42 has higher precision among similar products [10,11,12]. At present, several studies have been carried out based on the precipitation data provided by TMPA and have achieved reliable results. Due to the high quality and wide spatial coverage, Jung et al. [13] obtained the global soil evaporation trend from 1998 to 2008. In terms of runoff simulation, 3B42-V7 also performs well. Wang et al. [14] obtained a Nash–Sutcliffe coefficient of 0.83 for daily runoff in the southern humid regions of China. Even under the adverse condition of terrain and lacking data for calibration, the 3B42-V7 still has good hydrological applicability [15]. The accurate recording of no rain and light rain events also allows 3B42-V7 to be widely used in drought researches. Zhong et al. [16] compared three kinds of satellite-based precipitation products, and showed that 3B42-V7 has the best performance with the smallest deviation, and it can accurately capture the center and range of drought events. However, there are very few studies focusing on extreme precipitation estimation using 3B42-V7. Motivated by this need, the purpose of this study is to evaluate the accuracy of estimating precipitation extremes in different return periods based on 3B42-V7.
The index flood method [17] is one of the procedures to estimate precipitation extremes. The main idea of this method is to assume that the flood distributions at each location in a homogeneous region have the same coefficient of variation and skewness, thereby estimating the quantile of any return period at any location within the region. On this basis, Hosking and Wallis [18] used the L-moments method to improve the index flooding method, and proposed the L-moments-based regional frequency analysis method. This method has been widely used in the frequency analysis of regional floods, precipitation and drought [19,20,21,22,23,24]. However, using L-moments-based regional frequency analysis to estimate precipitation extremes places higher demands on the representativeness, consistency, accuracy and sequence length of precipitation data. In regions with complex terrains, such as gorge, the vertical variation of precipitation is obvious, and the data representative of rain gauge stations tends to be poor. Limited by factors such as the level of economic development, many countries and regions in the world have problems such as sparse meteorological station network, poor data consistency, high error rate, and short data accumulation, which brings difficulties for the development of infrastructure and the study of extreme weather [25,26,27,28]. In this regard, the combination of the 3B42-V7 and L-moments method is a preferable way to explore extreme precipitation characteristics.
This study will take China as an example to explore the potential of 3B42-V7 in estimating precipitation extremes by using the L-moments-based regional frequency analysis method. The main objectives are to: (1) reveal extreme precipitation under different return periods using the 3B42-V7 data and the L-moments method together with the Fuzzy C-Means algorithm (FCM, a clustering algorithm), and (2) compare 3B42-V7 with the China Gauge-based Daily Precipitation Analysis (CGDPA) product to evaluate the performance of 3B42-V7 on extreme precipitation estimates. The study can provide a reference for the application of 3B42-V7 in extreme precipitation characterization and estimation, which potentially provides an alternative but effective way for estimating extreme precipitation particularly for regions with poor station networks or lack of long-record, consistent observed data.
2. Study Area and Data
2.1. Study Area
As shown in Figure 1, China is selected as the study area (73.375°E~135.125°E, 18.125°N~49.875°N). On one hand, China has relatively complete precipitation data, which can provide reference data for the accuracy evaluation of 3B42-V7. On the other hand, China has a variety of terrains (plateaus, mountains, canyons, plains, hills, etc.) and multiple climate zones (The boreal, the temperate, the warm temperate, the subtropical, the tropical, and the highland climate) [29,30]. Elevation and rainfall intensity are the two main factors affecting the accuracy of the 3B42-V7 product [31,32].
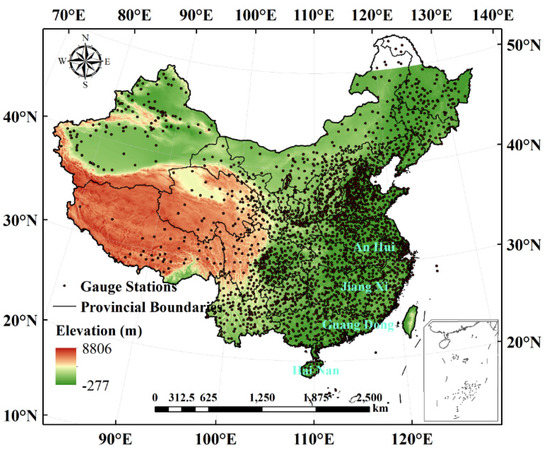
Figure 1.
The geography survey of the study area.
2.2. Data
3B42-V7 multi-satellite precipitation product can provide precipitation data covering 50°N~50°S with a spatial resolution of 0.25° × 0.25°. It is the post-process product of TMPA and is calibrated by the monthly meteorological data from the Global Precipitation Climatology Centre. The calibration enhanced the accuracy of 3B42-V7 significantly comparing with the near-real-time product (3B42RT) [11,33]. Compared with the previous algorithm, the seventh version (V7) of the algorithm is considered to provide higher quality precipitation data and has better hydrological utility [34,35]. The dataset is available for download from https://pmm.nasa.gov/data-access/downloads/trmm.
In this study, CGDPA is used as a reference product. The raw precipitation data of CGDPA were collected from 2419 meteorological stations in mainland China and interpolated into raster data with a resolution of 0.25° × 0.25° by the National Meteorological Information Center using the climatology-based Optimal Interpolation method. The stations used in CGDPA are not used in 3B42-V7 and therefore CGDPA is regarded to be independent of 3B42-V7 [36]. According to the study, the results obtained based on this interpolation method can better reflect the influence of terrain on precipitation [37]. According to Shen and Xiong [38], CGDPA products have high accuracy and can capture heavy rainfall events. Currently, this dataset is widely used in the accuracy assessment of satellite precipitation products [36,39,40]. It can be downloaded from http://data.cma.cn.
The daily precipitation data of both CGDPA and 3B42-V7 were selected from 1st January 1998 to 31st December 2017. From these data, we further extracted the annual maximum consecutive 1-day, 3-day, and 5-day precipitation (RX1DAY, RX3DAY, and RX5DAY, respectively) as the extreme precipitation indices. On one hand, these three indices can reflect the characteristics of extremes. On the other hand, these are the concerns of designers when applying such as designing infrastructure, strength designing and checking. In addition, the 90 m resolution elevation data are used in this study, which comes from the Shuttle Radar Topography Mission (SRTM) [41] that is in Geotiff format and can be extracted by means of ArcGIS software.
3. Methodology
3.1. Fuzzy C-Means Algorithm
Given that the spatial distribution pattern of extreme precipitation is not solely related to terrain or climate, it is not advisable to use traditional methods such as basin, climate or administrative boundaries to divide homogeneous regions. Therefore, five factors are considered, including latitude, longitude, elevation, and average annual rainfall, to divide the homogeneous region in this study by using the FCM method. The FCM is a fuzzy clustering algorithm derived from the K-means method [42,43]. At present, several studies have effectively applied it to regional frequency analysis [44,45]. This method allows one data point to belong to multiple clusters, and each data point has a corresponding membership degree to each cluster. The sum of all memberships of a data point is 1. According to the principle of “the smallest square of the weighted error in the same cluster”, each cluster center is iterated and adjusted until the center is not changed. Finally, according to the value of the membership degree, which clusters the data point belongs to is determined. The above principle can be expressed by the following formula
where N is the group number of measured data, M is the sum of clusters, m is any real number greater than 1, is the membership degree of in the cluster j, is the th n-dimensional measured data, is the n-dimension center of cluster , ||*|| is any norm, and represents the iteration steps.
3.2. L-Moments-Based Region Frequency Analysis
Describing the characteristics of precipitation can be carried out by using the frequency distribution curve, and a curve is described by several statistical parameters. The L-moments is a method for estimating the parameters of the frequency distribution curve [18,46,47]. Compared with the conventional methods, the L-moments method has small estimation bias, good unbiasedness and robustness [48].
Ordering a n independent samples of variable X, which are arranged in ascending to obtain {X1:n, X2:n, …, Xn:n}, and the subscript i and n represent the ith minimum number in the sample of length n. The r-order L-moment () is defined as follows:
To better describe the statistical characteristics of the distribution curve, Hosking proposed L-Moment ratios are used defined as follows:
where is the L-coefficients of variation (L-CV) reflecting the scale characteristics, is the L-skewness of the reflecting skewness characteristics, and is the L-kurtosis reflecting the kurtosis characteristics.
To perform L-moments-based regional frequency analysis, several steps are required, including region division with the same precipitation characteristics, checking the discordancy of data from the same region, region homogeneity test, and selection of appropriate distributions and estimation of precipitation quantile. Among them, the division of regions can be initially obtained by the FCM algorithm. If the homogeneity test is not passed, the corresponding region needs to be adjusted or subdivided.
In order to prevent outliers in the region that are obviously wrong or that differ greatly from other sites, it is necessary to check the data discordancy. It is generally measured in and is defined as follows:
where N represents the total number of sites in the same region, T represents the transpose of a matrix, and , respectively. When the number of sites in the region is greater than 15, Hosking and Wallis suggest treating > 3 as discordant [18].
In order to ensure that sites in the same region have the same precipitation frequency distribution curve theoretically, it is necessary to use H for homogeneity testing. The formula is as follows:
where is the length of the historical precipitation data from the site ; and are the mean and standard deviation of the V values calculated from 1000 Monte Carlo simulations, respectively. A region can be regarded as “acceptably homogeneous” if H < 1, “possibly heterogeneous” if 1 < H < 2, and “definitely heterogeneous” if H > 2.
Six alternative distributions were selected for this study: Generalized Extreme Value (GEV), Generalized Logistic (GLO), Generalized Normal (GNO), Generalized Pareto (GPA), Pearson type III (PE3), and Wakeby (WAK). Using a goodness-of-fit measurement (Z) to judge the feasibility of the hypothesized distribution:
where is the L-kurtosis of the candidate distribution function; and are the deviation and standard deviation of the regional average L-kurtosis (computed from 1000 Monte Carlo simulations and measured samples), respectively. When , it indicates that the hypothesized distribution has a 90% confidence level, and the closer is to 0, the hypothesized distribution is more suitable. When , it recommends selecting the more robust WAK distribution [18].
The precipitation extremes under different return periods can be calculated by the following formula:
where is the average of the samples from site j in region i; is the regional growth curve, the value of which depends on the distribution function selected for region i and the return period T.
3.3. Evaluation Metrics
In order to quantitatively describe the difference between the precipitation extremes estimating by different precipitation data, the correlation coefficient (R), root mean square error (RMSE) and relative error (BIAS) are used (Li et al., 2020c):
where X is the reference sequence and Y is the sequence to be evaluated. The precipitation extremes estimation results of 3B42-V7 and CGDPA are organized according to the same extreme precipitation index and return period. R and RMSE are calculated using the organized sequence. Its purpose is to reflect the overall performance of 3B42-V7 (correlation and error with CGDPA results). The spatial distribution of the error is obtained by calculating the BIAS of each grid.
4. Results
4.1. Region Division
Using 3B42-V7 as the precipitation input, China was divided into 60 regions with similar precipitation conditions based on the FCM algorithm. Since there may be a slight error in the clustering result, it is possible that several grids inside the region belong to another region. Therefore, manual inspections should also be carried out to properly adjust the interior and boundaries of each region.
The division results are shown in Figure 2, from which it can be seen that each sub-region is spatially continuous, without fleck or stripe. This somewhat implies that the division is reasonable. Moreover, according to the climate zones over China, it is found that many of the sub-region boundaries are along the boundaries between different climate zones (Figure S1 in the Supplementary Material). A distinctive example can be seen for the Middle Temperate zone in which the boundary coincides with the boundaries of some sub-regions. Therefore, from the climatic viewpoint, the region division conducted by FCM is meaningful and rational. When looking into RX1Day, RX3Day, and RX5Day, it is found that they all showed similar results. The discordancy measurement results show that the proportion of grids that fails the test in the same region is less than 5.44%. It indicates that 3B42-V7 has good data quality assurance, and only a few grids are statistically considered to be “obviously wrong or differ greatly from other sites “ in the same region. The proportion in the east is generally low, while that in the west is higher. This may be related to the fact that the terrain in western China is complex and the meteorological station network is sparse. These two are the main factors affecting the quality of 3B42-V7. Complex terrain affects the observation accuracy of satellites, and the sparse meteorological station network implies the lacking of sufficient data for calibration. It should be noted that for the next generation of multi-satellite precipitation products, GPM performs better in complex terrain and is hopeful of providing higher quality precipitation products, but the impact of a sparse station network on product calibration still exists. In any case, from the current results, even under extremely unfavorable conditions, only a very few grids in a region fail the test, which is quite satisfactory. The homogeneity measurement was performed after removing all grids that failed (The proportion of the total grids is less than 3%). The results show that the regions obtained by FCM clustering and adjustment are homogeneous regions, and most of them belong to “acceptably homogeneous”. This shows that it is feasible to estimate the precipitation quantile using the same distribution curve in the same region according to the division result. See Table S1 in the Supplementary Material for more details.
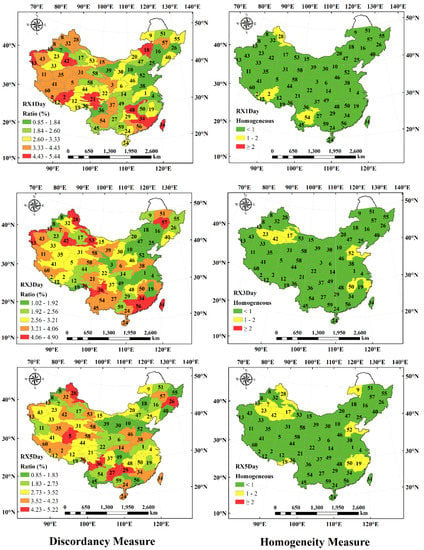
Figure 2.
Spatial distribution of discordancy measure and homogeneity measure results based on 3B42-V7.
Table S2 in the Supplementary Material lists the goodness-of-fit measurement results for each region using six alternative distributions, as well as the recommended distribution. The spatial distribution is shown in Figure 3. The results show that the type of selected distribution for each region has a certain spatial continuity. Adjacent regions have a higher probability of selecting the same distribution. Most regions can use a distribution curve with only three parameters (GEV, GLO, GNO, and PE3). GEV and GNO distributions are suitable for most regions in China, followed by PE3, and GPA is not suitable for China. This conclusion is consistent with the results obtained by Wang et al. based on the rain gauge dataset [14]. In RX1Day, GEV is suitable for the southwest, central and northeast, GNO for northwest, and PE3 for the southeast. RX3Day is similar to RX5Day, GNO is more applicable in the north and GEV is more suitable in the south.
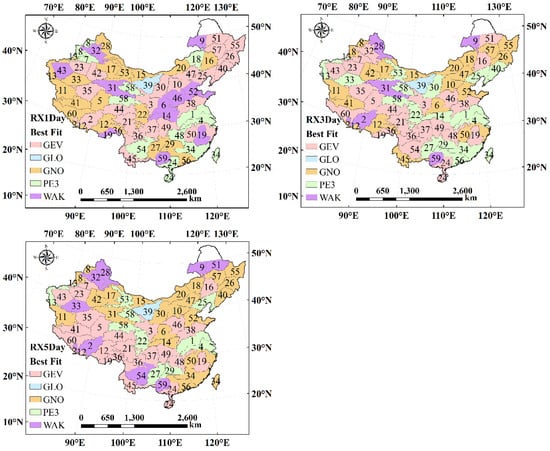
Figure 3.
Spatial distribution of best-fit distribution for 60 regions across China.
4.2. Estimation Accuracy
Before comparing extreme precipitation return levels between 3B42-V7 and CGDPA, the steps of region division with FCM, discordancy measurement, homogeneity measurement, and distribution selection on CGDPA are conducted again. This procedure is useful to compare region division results between the two datasets. It is found that the region division results based on CGDPA are similar to those displayed in Figure 2 with a slight difference. The results based on the two products in different return periods (20, 50, 100 years) are shown in Figure 4 (RX1Day), Figure 5 (RX3Day), and Figure 6 (RX5Day). Since CGDPA data have significant errors in western China, we only use the data east of 97.5°E for comparison. No reference data are available west of 97.5°E to compare with the estimation results of 3b42-v7. However, we can still judge whether the results of the western region have reference value by observing the spatial distribution trend and a typical case of the quantile estimation results based on 3B42-V7. The estimation results based on 3B42-V7 show that the precipitation extremes show a decreasing trend from southeast to northwest, which is consistent with the actual spatial distribution of precipitation in China. In the estimation results based on 3B42-V7, there is a region with significantly higher precipitation than the surrounding area in the southwestern part of the Himalayas. It is consistent with the fact that the southwest monsoon from the Indian Ocean is blocked by the Himalayas, and a large amount of water vapor condenses into raindrops here. When the return period becomes longer, the area with less precipitation in the northwest shrinks, while the precipitation in the southeast increases significantly.
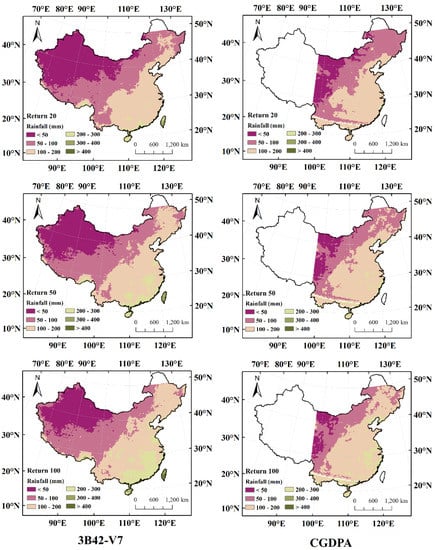
Figure 4.
Spatial distribution of 1-day precipitation (RX1DAY) estimated by 3B42-V7 and China Gauge-based Daily Precipitation Analysis (CGDPA) under different return periods.
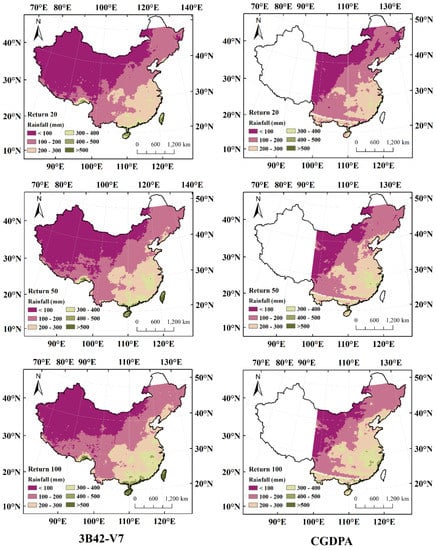
Figure 5.
Spatial distribution of RX3DAY estimated by 3B42-V7 and CGDPA under different return periods.
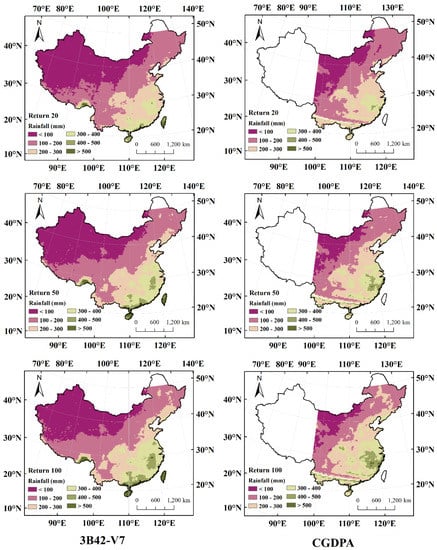
Figure 6.
Spatial distribution of RX5DAY estimated by 3B42-V7 and CGDPA under different return periods.
Compared with the estimation results based on CGDPA, both of them have a similar spatial distribution pattern of precipitation extremes. In general, when the return period is 20 years, the results of 3B42-V7 are almost the same as those of CGDPA. When using different extreme precipitation indices, 3B42-V7 tends to overestimate the quantile of parts of the southern coast. As the return period becomes longer, there are some differences in the estimation results based on different precipitation inputs. The results of RX1Day show that when the return period is 20 years, 3B42-V7 will overestimate the quantile of parts of the northeast; when the return period is 50 years, the overestimated grids in the northeast is decreased, but the southeast is overestimated; when the return period is 100 years, the results in the northeast are basically the same, and the areas that are mainly overestimated are in the south and southeast. The results of RX3Day and RX5Day indicate that the northeast is not overestimated, and both believe that the southeast has high precipitation extremes. The only divergence is that 3B42-V7 believes that there is a large quantile in the south. In summary, using 3B42-V7 as the precipitation input to estimate precipitation extremes in most regions of China will lead to a similar conclusion with that of using CGDPA, only a few regions are overestimated.
The statistical evaluation results are shown in Table 1. In different return periods, 3B42-V7 and CGDPA estimated RX1Day, RX3Day and RX5Day had high correlations (R > 0.85), of which RX5Day had the strongest correlation. This again shows that the estimation results of 3B42-V7 have a high spatial similarity with that of CGDPA. RMSE measures the deviation between the 3B42-V7 estimate and the CGDPA estimate. As Table 1 shows, RMSE increases slightly with the increase in the return period. It should be noted that RMSE is a dimensioned index, so it is normal to increase with the total rainfall increase. Figure 7 shows the spatial distribution of BIAS. In most areas, the value of BIAS is positive, indicating that the results based on 3B42-V7 tend to overestimate precipitation extremes. The error range of most areas is controlled within ±25%. The results of RX1Day show that precipitation extremes are mainly grossly overestimated in three regions (BIAS >0.5), which are northeast, south, and southwest of China. Among them, the gross overestimation in northeastern China will be alleviated as the return period becomes longer. The results of RX3Day show that the spatial extent of the gross overestimation of extreme precipitation in northeastern and southwestern China is significantly reduced compared with RX1Day. The results of RX5Day indicate that there is only a small portion of the northeastern and southwestern regions that are overestimated (BIAS ranges from 0.25 to 0.5). In summary, using 3B42-V7 to estimate China’s precipitation extremes, good results can be achieved in most areas with small errors. When using in southern China, it needs to pay attention to the problem of gross overestimation. When using in the northeast and southwest, it needs to judge the severity of the overestimation according to the selected extreme precipitation index and the return period.

Table 1.
Accuracy assessment results of extreme precipitation indicators under different return periods.
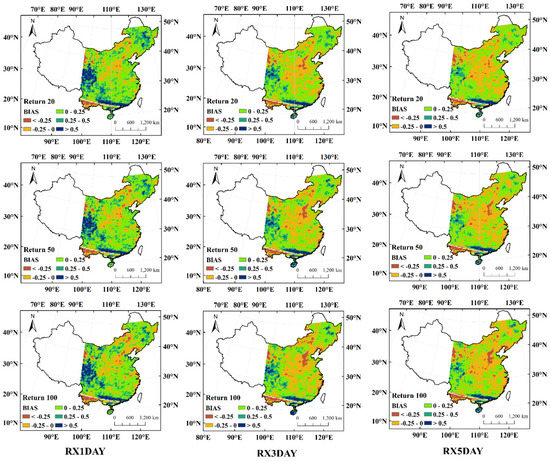
Figure 7.
Spatial distribution of relative error (BIAS) under different return periods.
Overall, the estimation of precipitation extremes based on 3B42-V7 can achieve similar results with that based on gauge-based precipitation data. Certainly, it is better to combine, if possible, with gauge-based data to further reduce the error for some regions where 3B42-V7 performs relatively poorly.
5. Discussion
In the precipitation quantile estimation results based on CGDPA, we found some obvious errors in the west. Therefore, only the data east of 97.5°E was used, so as not to affect the final conclusion. This situation may be due to errors in the data recording process, and the sparse rain gauge network makes the impact of a single station larger. This is often difficult to avoid, even if the quality of the data is strictly controlled. For example, for the Historical Climatology Network from the National Climatic Data Center, although its raw data have been checked and preprocessed, 38% of the stations have experienced at least one serious error [49]. In comparison, the advantages of multi-satellite precipitation products are more obvious. On one hand, precision sensors on satellites are less likely to fail than rain gauges. On the other hand, even if one sensor fails, it is possible to minimize the impact by using the data from other sources. This is good news for many developing countries and underdeveloped regions.
In fact, using CGDPA for regional frequency analysis has encountered more problems in practical operations than using 3B42-V7, such as the division of homogeneous regions. In the case of only using longitude, latitude, elevation and annual average rainfall, the FCM algorithm can be used to effectively cluster homogeneous regions based on 3B42-V7 precipitation data. Usually, only a few regional boundaries need to be fine-tuned to pass the homogeneity measurement. However, clustering results based on CGDPA require adjustments to most regions, and some regions need to be subdivided into two regions. Adjustment work is time-consuming and may be an inevitable process if using measured precipitation data. Because regional frequency analysis works on a “regional” scale, and rain gauge station data are “point” scale data, errors will inevitably occur when interpolation. The effects of these errors continue in subsequent clustering (due to the use of annual average rainfall) and homogeneity measurement (extracting RX1Day, RX3Day, and RX5Day from the data). Therefore, it is easy to see that the clustering result does not pass the homogeneity test. Considering the convenience of operation, it is recommended to use 3B42-V7 for regional frequency analysis.
The results of this study were also compared with the results of Wang et al. [14]. Among them, the spatial distribution pattern of precipitation extremes is consistent, the precipitation is basically at the same level, and no abnormal regions are observed. In addition, since the TRMM satellite has only accumulated nearly 20 years of data from the launch, the error is inevitable when using the 3B42-V7 for quantile estimation. However, the dataset is indeed important for areas that lack data, and given the current results, it tends to give an overestimated result, which is not a bad thing to ensure the security of infrastructure design. Additionally, one may consider combining 3B42-V7 with gauge-based precipitation data. In summary, it is possible to use 3B42-V7 providing rainstorm design data for the data-deficient regions.
Extreme precipitation estimation based on 3B42-V7 provides the extreme precipitation spatial distribution under different return periods, which is an important reference when the governments or stakeholders make flood defenses and adaptations. In particular, as our results show, the southeast coastal areas have higher return levels of extreme precipitation, suggesting potential higher flood risk than inland. Additionally, in the southwestern part of the Himalayas (around 25–30°N, 95–100°E), the estimation results based on 3B42-V7 point to potential high flood risk. Therefore, local agencies should pay more attention and make more preparedness regarding flood-related disasters such as flash floods, landslides, and debris flows.
6. Conclusions
In this study, the 3B42-V7 precipitation product was used in combination with the L-moments-based regional frequency analysis to estimate extreme precipitation in China, and the accuracy of the estimation based on 3B42-V7 was evaluated. The main conclusions are summarized below:
The data quality of 3B42-V7 meets the requirements of the L-moments-based regional frequency analysis method, and continuously, China can be divided into 60 homogeneous regions based on the FCM algorithm. For most regions, the GEV and GNO distributions are preferable, followed by PE3 and GLO. In terms of RX1DAY fitting, GEV is suitable for southwest, central and northeast China, while GNO and PE3 are preferable for northwest China and southeast China, respectively. For RX3Day and RX5Day, GNO and GEV are more applicable over north China and south China, respectively.
The estimation results of 3B42-V7 have a high correlation (R > 0.85) with those of the CGDPA results, with similar spatial distribution patterns of precipitation extremes, and the BIAS of 3B42-V7 is ~25% for most regions of China. In addition, 3B42-V7 tends to overestimate in south China. Overall, however, using the L-moment-based regional frequency analysis method and 3B42-V7, the estimation of extreme precipitation over China is accurate, indicating that the 3B42-V7 product is a reliable way to achieve extreme precipitation estimates.
Supplementary Materials
The following are available online at https://www.mdpi.com/2072-4292/13/2/209/s1.
Author Contributions
Writing—original Draft Preparation, J.C.; Methodology, Z.W.; Supervision, X.W.; Investigation, C.L.; Data Curation, X.C. All authors have read and agreed to the published version of the manuscript.
Funding
This research was funded by the Guangdong Basic and Applied Basic Research Foundation (2019A1515111144), the National Natural Science Foundation of China (51879107, 51709117), the China Postdoctoral Science Foundation (2019M662919), and the Water Resource Science and Technology Innovation Program of Guangdong Province (2020-29).
Acknowledgments
The authors wish to express their gratitude to all authors of the numerous technical reports used for this paper.
Conflicts of Interest
The authors declare no conflict of interest.
References
- Prakash, S.; Mitra, A.K.; Pai, D.S.; AghaKouchak, A. From TRMM to GPM: How well can heavy rainfall be detected from space? Adv. Water. Resour. 2016, 88, 1–7. [Google Scholar] [CrossRef]
- Pfahl, S.; O’Gorman, A.P.; Fischer, M.E. Understanding the regional pattern of projected future changes in extreme precipitation. Nat. Clim. Chang. 2017, 7, 423–427. [Google Scholar] [CrossRef]
- Swain, L.D.; Langenbrunner, B.; Neelin, D.J.; Hall, A. Increasing precipitation volatility in twenty-first-century California. Nat. Clim. Chang. 2018, 8, 427–433. [Google Scholar] [CrossRef]
- Wu, X.; Guo, S.; Yin, J.; Yang, G.; Zhong, Y.; Liu, D. On the event-based extreme precipitation across China: Time distribution patterns, trends, and return levels. J. Hydrol. 2018, 562, 305–317. [Google Scholar] [CrossRef]
- Hong, Y.; Hsu, K.L.; Sorooshian, S.; Gao, X.G. Improved representation of diurnal variability of rainfall retrieved from the Tropical Rainfall Measurement Mission Microwave Imager adjusted Precipitation Estimation From Remotely Sensed Information Using Artificial Neural Networks (PERSIANN) system. J. Geophys. Res. Atmos. 2005, 110. [Google Scholar] [CrossRef]
- Huffman, G.J.; Adler, R.F.; Bolvin, D.T.; Gu, G.J.; Nelkin, E.J.; Bowman, K.P.; Hong, Y.; Stocker, E.F.; Wolff, D.B. The TRMM multisatellite precipitation analysis (TMPA): Quasi-global, multiyear, combined-sensor precipitation estimates at fine scales. J. Hydrometeorol. 2007, 8, 38–55. [Google Scholar] [CrossRef]
- Joyce, R.J.; Janowiak, J.E.; Arkin, P.A.; Xie, P.P. CMORPH: A method that produces global precipitation estimates from passive microwave and infrared data at high spatial and temporal resolution. J. Hydrometeorol. 2004, 5, 487–503. [Google Scholar] [CrossRef]
- Huffman, G.J.; Adler, R.F.; Bolvin, D.T.; Nelkin, E.J. The TRMM Multi-Satellite Precipitation Analysis (TMPA). In Satellite Rainfall Applications for Surface Hydrology; Gebremichael, M., Hossain, F., Eds.; Springer: Dordrecht, The Netherlands, 2010. [Google Scholar]
- Kummerow, C.; Barnes, W.; Kozu, T.; Shiue, J.; Simpson, J. The Tropical Rainfall Measuring Mission (TRMM) sensor package. J. Atmos. Ocean. Tech. 1998, 15, 809–817. [Google Scholar] [CrossRef]
- Liu, J.Z.; Duan, Z.; Jiang, J.C.; Zhu, A.X. Evaluation of Three Satellite Precipitation Products TRMM 3B42, CMORPH, and PERSIANN over a Subtropical Watershed in China. Adv. Meteorol. 2015, 2015, 2731–2738. [Google Scholar] [CrossRef]
- Prakash, S.; Mitra, A.K.; Rajagopal, E.N.; Pai, D.S. Assessment of TRMM-based TMPA-3B42 and GSMaP precipitation products over India for the peak southwest monsoon season. Int. J. Climatol. 2016, 36, 1614–1631. [Google Scholar] [CrossRef]
- Worqlul, A.W.; Maathuis, B.; Adem, A.A.; Demissie, S.S.; Langan, S.; Steenhuis, T.S. Comparison of rainfall estimations by TRMM 3B42, MPEG and CFSR with ground-observed data for the Lake Tana basin in Ethiopia. Hydrol. Earth Syst. Sc. 2014, 18, 4871–4881. [Google Scholar] [CrossRef]
- Jung, M.; Reichstein, M.; Ciais, P.; Seneviratne, S.I.; Sheffield, J.; Goulden, M.L.; Bonan, G.; Cescatti, A.; Chen, J.Q.; de Jeu, R.; et al. Recent decline in the global land evapotranspiration trend due to limited moisture supply. Nature 2010, 467, 951–954. [Google Scholar] [CrossRef] [PubMed]
- Wang, Z.L.; Zhong, R.D.; Lai, C.G. Evaluation and hydrologic validation of TMPA satellite precipitation product downstream of the Pearl River Basin, China. Hydrol. Process. 2017, 31, 4169–4182. [Google Scholar] [CrossRef]
- Wang, Z.L.; Chen, J.C.; Lai, C.G.; Zhong, R.D.; Chen, X.H.; Yu, H.J. Hydrologic assessment of the TMPA 3B42-V7 product in a typical alpine and gorge region: The Lancang River basin, China. Hydrol. Res. 2018, 49, 2002–2015. [Google Scholar] [CrossRef]
- Zhong, R.D.; Chen, X.H.; Lai, C.G.; Wang, Z.L.; Lian, Y.Q.; Yu, H.J.; Wu, X.Q. Drought monitoring utility of satellite-based precipitation products across mainland China. J. Hydrol. 2019, 568, 343–359. [Google Scholar] [CrossRef]
- Dalrymple, T. Water Supply Paper. In Flood-Frequency Analyses, Manual of Hydrology: Part 3; USGPO: Washington, DC, USA, 1960. [Google Scholar]
- Hosking, J.R.M.; Wallis, J.R. Regional Frequency Analysis: An Approach Based on L-Moments; Cambridge University Press: Cambridge, UK, 1997. [Google Scholar]
- Bharath, R.; Srinivas, V.V. Regionalization of extreme rainfall in India. Int. J. Climatol. 2015, 35, 1142–1156. [Google Scholar] [CrossRef]
- Bhuyan, A.; Borah, M.; Kumar, R. Regional Flood Frequency Analysis of North-Bank of the River Brahmaputra by Using LH-Moments. Water Resour. Manag. 2010, 24, 1779–1790. [Google Scholar] [CrossRef]
- Chen, Y.D.; Zhang, Q.; Xiao, M.Z.; Singh, V.P.; Leung, Y.; Jiang, L.G. Precipitation extremes in the Yangtze River Basin, China: Regional frequency and spatial-temporal patterns. Theor. Appl. Climatol. 2014, 116, 447–461. [Google Scholar] [CrossRef]
- Feng, J.; Yan, D.H.; Li, C.Z.; Gao, Y.; Liu, J. Regional Frequency Analysis of Extreme Precipitation after Drought Events in the Heihe River Basin, Northwest China. J. Hydrol. Eng. 2014, 19, 1101–1112. [Google Scholar] [CrossRef]
- Hussain, Z. Application of the Regional Flood Frequency Analysis to the Upper and Lower Basins of the Indus River, Pakistan. Water Resour. Manag. 2011, 25, 2797–2822. [Google Scholar]
- Nam, W.; Shin, H.; Jung, Y.; Joo, K.; Heo, J.H. Delineation of the climatic rainfall regions of South Korea based on a multivariate analysis and regional rainfall frequency analyses. Int. J. Climatol. 2015, 35, 777–793. [Google Scholar] [CrossRef]
- Smithers, J.C.; Schulze, R.E. A methodology for the estimation of short duration design storms in South Africa using a regional approach based on L-moments. J. Hydrol. 2001, 241, 42–52. [Google Scholar] [CrossRef]
- Wu, X.; Wang, Z.; Zhou, X.; Lai, C.; Lin, W.; Chen, X. Observed changes in precipitation extremes across 11 basins in China during 1961–2013. Int. J. Climatol. 2016, 36, 2866–2885. [Google Scholar] [CrossRef]
- Li, J.; Wang, Z.; Wu, X.; Xu, C.-Y.; Guo, S.; Chen, X. Toward monitoring short-term droughts using a novel daily scale, standardized antecedent precipitation evapotranspiration index. J. Hydrometeorol. 2020, 21, 891–908. [Google Scholar] [CrossRef]
- Li, J.; Wang, Z.; Wu, X.; Chen, J.; Guo, S.; Zhang, Z. A new framework for tracking flash drought events in space and time. Catena 2020, 194, 104763. [Google Scholar] [CrossRef]
- Wang, J.A.; Xiao, H.; Hartmann, R.; Yue, Y. Physical Geography of China and the U.S. In A Comparative Geography of China and the U.S.; Hartmann, R., Wang, J.A., Ye, T., Eds.; Springer: Dordrecht, The Netherlands, 2014; pp. 23–81. [Google Scholar]
- Wu, X.; Wang, Z.; Guo, S.; Liao, W.; Zeng, Z.; Chen, X. Scenario-based projections of future urban inundation within a coupled hydrodynamic model framework: A case study in Dongguan City. China. J. Hydrol. 2017, 547, 428–442. [Google Scholar] [CrossRef]
- Salio, P.; Hobouchian, M.P.; Skabar, Y.G.; Vila, D. Evaluation of high-resolution satellite precipitation estimates over southern South America using a dense rain gauge network. Atmos. Res. 2015, 163, 146–161. [Google Scholar] [CrossRef]
- Yang, Y.; Cheng, G.; Fan, J.; Sun, J.; Weipeng, L.I. Representativeness and reliability of satellite rainfall dataset in alpine and gorge region. Adv. Water Sci. 2013, 24, 24–33. [Google Scholar]
- Shen, Y.; Xiong, A.Y.; Wang, Y.; Xie, P.P. Performance of high-resolution satellite precipitation products over China. J. Geophys. Res. Atmos 2010, 115. [Google Scholar] [CrossRef]
- Prakash, S.; Mitra, A.K.; Momin, I.M.; Pai, D.S.; Rajagopal, E.N.; Basu, S. Comparison of TMPA-3B42 Versions 6 and 7 Precipitation Products with Gauge-Based Data over India for the Southwest Monsoon Period. J. Hydrometeorol. 2015, 16, 346–362. [Google Scholar] [CrossRef]
- Xue, X.W.; Hong, Y.; Limaye, A.S.; Gourley, J.J.; Huffman, G.J.; Khan, S.I.; Dorji, C.; Chen, S. Statistical and hydrological evaluation of TRMM-based Multi-satellite Precipitation Analysis over the Wangchu Basin of Bhutan: Are the latest satellite precipitation products 3B42V7 ready for use in ungauged basins? J. Hydrol. 2013, 499, 91–99. [Google Scholar] [CrossRef]
- Li, C.M.; Tang, G.Q.; Hong, Y. Cross-evaluation of ground-based, multi-satellite and reanalysis precipitation products: Applicability of the Triple Collocation method across Mainland China. J. Hydrol. 2018, 562, 71–83. [Google Scholar] [CrossRef]
- Xie, P.P.; Yatagai, A.; Chen, M.Y.; Hayasaka, T.; Fukushima, Y.; Liu, C.M.; Yang, S. A Gauge-based analysis of daily precipitation over East Asia. J. Hydrometeorol. 2007, 8, 607–626. [Google Scholar] [CrossRef]
- Shen, Y.; Xiong, A.Y. Validation and comparison of a new gauge-based precipitation analysis over mainland China. Int. J. Climatol. 2016, 36, 252–265. [Google Scholar] [CrossRef]
- Ma, J.; Sun, W.W.; Yang, G.; Zhang, D.F. Hydrological Analysis Using Satellite Remote Sensing Big Data and CREST Model. IEEE Access 2018, 6, 9006–9016. [Google Scholar] [CrossRef]
- Sun, R.C.; Yuan, H.L.; Liu, X.L.; Jiang, X.M. Evaluation of the latest satellite-gauge precipitation products and their hydrologic applications over the Huaihe River basin. J. Hydrol. 2016, 536, 302–319. [Google Scholar] [CrossRef]
- Jarvis, A.; Reuter, H.I.; Nelson, A.; Guevara, E. Hole-Filled Seamless SRTM Data V4; Technical Report No.; International Centre for Tropical Agriculture (CIAT): Bogota, Colombia, 2008; Available online: https://srtm.csi.cgiar.org (accessed on 28 November 2020).
- Bezdek, J.C. Pattern Recognition with Fuzzy Objective Function Algorithms; Springer: Boston, MA, USA, 1981; p. 256. [Google Scholar]
- Dunn, J.C. A Fuzzy Relative of the ISODATA Process and Its Use in Detecting Compact Well-Separated Clusters. J. Cybern. 1973, 3, 32–57. [Google Scholar] [CrossRef]
- Dikbas, F.; Firat, M.; Koc, A.C.; Gungor, M. Classification of precipitation series using fuzzy cluster method. Int. J. Climatol. 2012, 32, 1596–1603. [Google Scholar] [CrossRef]
- Shu, C.; Burn, D.H. Homogeneous pooling group delineation for flood frequency analysis using a fuzzy expert system with genetic enhancement. J. Hydrol. 2004, 291, 132–149. [Google Scholar] [CrossRef]
- Guttman, N.B. The Use of L-Moments in the Determination of Regional Precipitation Climates. J. Clim. 1993, 6, 2309–2325. [Google Scholar] [CrossRef]
- Hosking, J.R.M.; Wallis, J.R. Some statistics useful in regional frequency analysis. Water Resour. Res. 1993, 29, 271–281. [Google Scholar] [CrossRef]
- Gubareva, T.S.; Gartsman, B.I. Estimating distribution parameters of extreme hydrometeorological characteristics by L-moments method. Water Resour. 2010, 37, 437–445. [Google Scholar] [CrossRef]
- Wallis, J.R.; Lettenmaier, D.P.; Wood, E.F. A daily hydroclimatological data set for the continental United States. Water Resour. Res. 1991, 27, 1657–1663. [Google Scholar] [CrossRef]
Publisher’s Note: MDPI stays neutral with regard to jurisdictional claims in published maps and institutional affiliations. |
© 2021 by the authors. Licensee MDPI, Basel, Switzerland. This article is an open access article distributed under the terms and conditions of the Creative Commons Attribution (CC BY) license (http://creativecommons.org/licenses/by/4.0/).