Abstract
The study of lithological features and tectonic evolution related to mineralization in the eastern Tian Shan is crucial for understanding the ore-controlling mechanism. In this paper, the lithological features and ore-controlling structure of the Huangshan Ni–Cu ore belt in the eastern Tian Shan are documented using advanced spaceborne thermal emission and reflection radiometer (ASTER) multispectral data based on spectral image processing algorithms, mineral indices and directional filter technology. Our results show that the algorithms of b2/b1, b6/b7 and b4/b8 from ASTER visible and near-infrared (VNIR)- shortwave infrared (SWIR) bands and of mafic index (MI), carbonate index (CI) and silica index (SI) from thermal infrared (TIR) bands are helpful to extract regional pyroxenite, external foliated gabbro bearing Ni–Cu ore bodies as well as the country rocks in the study area. The detailed interpretations and analyses of the geometrical feature of fault system and intrusive facies suggest that the Ni–Cu metallogenic belts are related to Carboniferous arc intrusive rocks and Permian wrench tectonics locating at the intersection of EW- and NEE-striking dextral strike-slip fault system, and the emplacement at the releasing bends in the southern margin of Kanggur Fault obviously controlled by secondary faults orthogonal or oblique to the Kanggur Fault in the post-collision extensional environment. Therefore, the ASTER data-based approach to map lithological features and ore-controlling structures related to the Ni–Cu mineralization are well performed. Moreover, a 3D geodynamic sketch map proposes that the strike-slip movement of Kanggur Fault in Huangshan-Kanggur Shear Zone (HKSZ) during early Permian controlled the migration and emplacement of three mafic/ultramafic intrusions bearing Ni–Cu derived from partial mantle melting and also favored CO2-rich fluids leaking to the participation of metallogenic processes.
1. Introduction
The exploration and assessment of mineral resources are one of the primary tasks of remote sensing applications. As an important part of the central Asian orogenic belt (CAOB), the Tian Shan is a metallogenic belt with large areas, high-grade and good prospects because of the multi-stage metallogenic processes in the Proterozoic, Paleozoic and Mesozoic periods [1,2,3,4]. The eastern Tian Shan is located in the easternmost margin of the Tian Shan orogenic belt and contains a series of mineralized zones and lodes (e.g., Au, Fe, Cu, Ni) [2,5,6,7,8,9]. The complex and diverse metallogenic types and mechanisms are one of the hot issues in geological research [10,11,12,13,14,15,16]. At present, the lithological features and regional tectonics related to regional mineralization is still a principal problem to understand the ore-controlling mechanism. Previous studies have reported the application of multispectral data from the Landsat thematic mapper/enhanced thematic mapper (TM/ETM+) and the advanced spaceborne thermal emission and reflection radiometer (ASTER) for lithological, mineralized alteration and structural identification related to ore and petroleum resources in Tian Shan [17,18,19,20,21].
ASTER has a good spatial, spectral and radiometric resolution multispectral remote sensing sensor [22], which provide observation in three different spectral regions, including the visible and near-infrared (VNIR, 0.52~0.86 μm), the shortwave infrared (SWIR, 1.6~2.43 μm) and the thermal infrared (TIR, 8.125~11.65 μm). Moreover, the VNIR and SWIR subsystems have three and six bands with spatial resolutions of 15 m and 30 m. Both spectral regions have great potential for regional in mineral exploration and lithological mapping because of diagnostic absorption features of mineral constituents [22,23,24,25,26,27,28]. In particular, igneous rock identification and alteration mineral mapping in polymetallic deposits is an important field of ASTER applications. By extracting and interpreting ASTER-band information of intrusive and altered rocks, the mineralization types can be classified so as to establish the spatial correlation with the ore deposits and indicate the potential mineralization area [29,30,31,32,33,34,35].
It is worth noting that reported studies, including the application of remote sensing technology, have indicated structural interpretation [36,37] and ore-controlling effects of strike-slip fault [38,39,40,41]. However, the unclear spatial relationship between the emplacement of intrusive and altered rocks and ore-controlling structures, and the lack of space-ground verification of lithology and tectonic information, is not conducive to the popularization of remote sensing application of prospecting in Tian Shan and the understanding of mineralization mechanism. Thus, in this study, we focus on lithological and tectonic analyses of the Huangshan Ni–Cu sulfides ore belt in the eastern Tian Shan (Figure 1) using ASTER multispectral data for indicating spatial correlation related to regional mineralization. The principal purpose was to detect the lithological distribution of Huangshan intrusions based on ASTER data and interpret regional ore-controlling fault for indicating the spatial correlation of lithology, tectonics and ore deposit in Huangshan-Kanggur shear zone, eastern Tian Shan. Furthermore, mineralogical morphology and component analyses of surface samples using a polarized light microscope (PLM) of thin section and X-ray diffraction (XRD) were also conducted to validate results of ASTER lithological mapping and fault geometric interpretation.
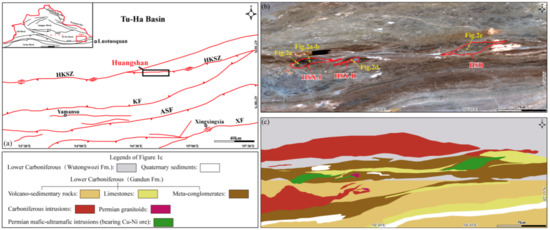
Figure 1.
The tectonics map in the eastern Tian Shan and the surrounding area (a), a GF-1 true color image showing the locations of field photographs in Figure 2, (b) and the geological map of Huangshan ore belt (c) [42,43]. ASF: Aqikkuduk-Shanquanzi Fault; HKSZ: Huangshan-Kanggur Shear Zone; KF: Kushui Fault; MTSZ: Main Tian Shan Shear Zone; NF: Nalati Fault; NTF: North Tian Shan Fault; QF: Qingbulake Fault; XF: Xingxingxia Fault.
2. Geological Setting
In the eastern Tian Shan, the mafic/ultramafic intrusions that bear the Ni–Cu ore are principally distributed within the northern part of the eastern Tian Shan, where it is the key tectonic area of CAOB from west to east and the major tectonic boundary separating the North Tian Shan (NTS) from the South Tian Shan terranes [3,5,7,42]. The NTS is composed of Carboniferous arc-related volcano-sedimentary and plutonic rocks crosscut by younger and smaller Permian intrusions. Carboniferous intrusions are generally highly deformed, whereas Permian intrusions from 298 Ma to 270 Ma show syn-or post-tectonic features relative to dextral wrenching [43,44,45,46]. The study area, the Huangshan Ni–Cu ore belt, is located on the piedmont of E–W trending Huangshan-Kanggur Shear Zone (HKSZ) belonging to the Main Tian Shan Shear Zone (MTSZ) in the eastern Tian Shan (Figure 1a,b) under typical inland arid to semi-arid climate and with sparse vegetation. The Tian Shan belts formed through a southward-plunging sequence of subduction-collision welding the Junggar plate to the north and the Tarim plate to the south from Ordovician to Late Carboniferous [47]. The Permian period is marked by important intracontinental wrenching that accommodates the eastward movement of Junggar and Yili blocks. Hence, the Huangshan Ni–Cu-bearing mafic/ultramafic complexes within the Kanggurtag ore belt are emplaced by injection of several mafic/ultramafic magma batches within kilometer-scale tension gashes generated by Permian dextral shearing and probably be considered as synkinematic sheeted intrusions [42,44,48].
The Huangshan Ni–Cu district in the eastern Tian Shan contains two intrusions: the Huangshanxi (HSX) intrusion in the west and the Huangshandong (HSD) intrusion in the east (Figure 1b and Figure 2). In addition, HSX intrusion is separated into two small complex outcrops, named HSX-I (Figure 2a) and HSX-II (Figure 2d). These Permian mafic-ultramafic (bearing Cu–Ni ore) intrusions are principally composed of pyroxenite, peridotite and external foliated diorite/gabbro, and the country rocks belong to volcano-sedimentary rocks (i.e., limestones, dark schists and meta-conglomerates) of the Lower Carboniferous Gandun Formation (Figure 1c) [44,45,48,49]. There are some Permian granitoids in HSX-II only. The whole outcrop is more broken due to strong weathering (Figure 2b). The Huangshan intrusions present oval and/or rhomb map shapes in a GF-1 true-color image because the major E–W trending HKSZ lineament limits on the north-south border (Figure 1b). The detailed investigations show that HKSZ and its secondary fault system are the ore-controlling structures of Huangshan deposits. As with the major deep fault-Kanggur Fault, HKSZ developed and experienced the alternating deformation process of shear and extrusion from the Devonian [4,39]. Especially, late dextral strike-slip shearing of HKSZ in extension period of post-collision is considered to have a more important effect on controlling and hosting regional ore (Figure 2c) [6,7,16,42].
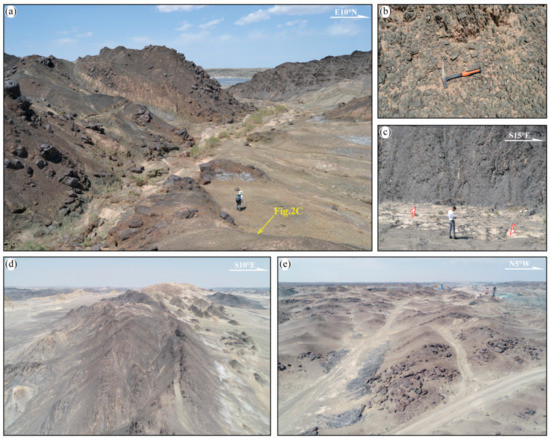
Figure 2.
Field photographs showing surface rocks and faults in Huangshan mineragenetic region. Partial outcrops (a) and strong surface’s weathering (b) in the middle of HSX-I intrusion. The dextral strike-slip shearing fault in the eastern of HSX-I intrusion (c). Partial outcrops of HSX-II intrusion (d) and of Hangshandong (HSD) intrusion (e). Photo locations are showing in Figure 1b.
3. Spectral Measurements and Image Processing
3.1. Spectral Measurements
Spectral reflectances of rock samples collected from the land surface were measured using an analytical spectral device (ASD) spectrometer with 2151 bands (0.35–2.5 μm) in the field. All spectral measurements were acquired under sunny and dry weather conditions for ensuring the influence of water vapor as little as possible. A radiometric correction was made again before each measurement at a new location. These field spectra were also resampled to the ASTER VNIR-SWIR bands. Measured samples include named X1-X3 in HSX-I, X4 and X5 in HSX-II, D1 and D2 in HSD, and S1 in the middle of Kanggur shear zone. Meanwhile, we selected some laboratory spectra of related minerals from USGS spectral library to compare and analyze the spectral characteristics of our rock samples. Reflectance curves of rock samples are shown in Figure 3. Locations of these samples are shown in Figure 4d.
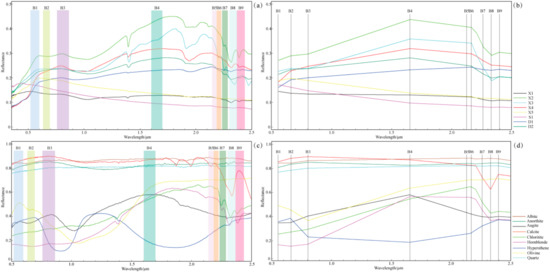
Figure 3.
Reflectance curves of typical samples collected from Huangshan intrusions (a) and the spectra curves resampled to the advanced spaceborne thermal emission and reflection radiometer (ASTER) visible and near-infrared (VNIR)- shortwave infrared (SWIR) bands (b). Reflectance curves of related minerals from United States Geological Survey (USGS) mineral spectral library (c) and the spectra curves resampled to the ASTER VNIR-SWIR bands (d). Location of the samples is shown in Figure 4d.
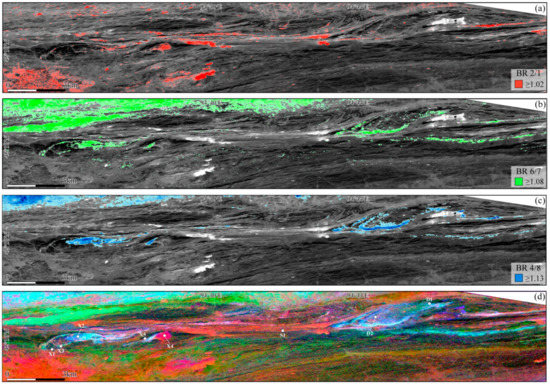
Figure 4.
The lithological information extracted from the ASTER b2/b1 (a), b6/b7 (b), b4/b8 (c) superimposed on ASTER band 1 image and the false-color composite image of b2/b1 (R), b6/b7 (G) and b4/b8 (B) (d) in study area. White circles represent the location of the samples.
The principal features apparent in the ASD spectra are associated with electronic and vibrational processes of iron ion, hydroxyl ion and water molecule in related minerals. No matter in HSX-I or in HSD intrusion, host rock samples show the similar and intense absorption characteristic from VNIR to SWIR bands (X2, X3 and D2 spectra in Figure 3a). In VNIR, absorption peaks of these samples appear near 0.65 μm and 1.0 μm. They are principally derived from the energy transition action of ferrous and ferric ion of pyroxene minerals within diorite and/or gabbro rocks [50,51]. Similar spectral features are shown in experimental spectra of augite and chloritite from the USGS spectral library (Figure 3c). In SWIR, a strong absorption band in X2, X3 and D2 samples appears first, near 1.4 μm and 1.9 μm (Figure 3a) as a result of a water molecule from the altered mineral of plagioclase (chloritite in Figure 3c). Strong surface weathering and alteration, such as chloritization, carbonatization and/or sericitization, importantly produce continuous and strong spectral absorptions from 2.0 μm to 2.5 μm caused by the vibrational process of hydroxyl ion (e.g., Al-OH, Mg-OH) and a water molecule (chloritite and hornblende in Figure 3a,c). However, the reflectance of the X1 sample in HSX-I intrusion is obviously low due to higher compositions of hypersthene and unaltered plagioclase (Figure 3a,c). Although the reflectance spectra of X4 named as a granitoids is similar with X2 and X3 in absorption bands of a water molecule at 1.4 μm and 1.9 μm, the weaker absorption of hydroxyl ion only concentrates at 2.35 μm due to partially altered plagioclase (Figure 3a) because of no spectral characteristic contribution from quartz and unaltered plagioclase minerals in VNIR and SWIR (Figure 3c). It is worth noting that multiple absorption bands between 1.8 μm and 2.2 μm are usually interpreted to be related to carbonation (CO32−) of hosting rocks [50,51,52]. However, S1 located in the Kanggur shear zone in Huangshan Ni–Cu ore belt shows the smooth and depressed spectral curve from VNIR to SWIR (Figure 3a), also as same as X5. We consider that micrite calcite composed in this foliated limestone probably conceal absorption bands of carbonate ion. Compared to D2, the reflectance of D1 samples is lower than D2. Some weak absorption bands are generated by the vibrations of water molecules, and a band of hydroxyl ions at 2.35 μm is added (Figure 3a).
The reflectance curves resampled to ASTER bands almost show the main fluctuations from VNIR to SWIR (Figure 3b). First, X2, X3, X4, D1 and D2 have the diagnostic feature as lower reflectance at ASTER band1 but higher at band2. Meanwhile, the absorption depth of ASTER band 8 is much more in these samples than in others (Figure 3b). Altered minerals and mineral assemblages could give rise to the ASTER band characteristic above (Figure 3d). Especially, declining reflectance slopes at shoulders of ASTER band 4 and from band 6 to band 7 are different obviously from each rock sample (Figure 3b). Therefore, variations in reflectance of absorption bands and reflectance slope can be used as the basis of the extraction method of lithological information in the Huangshan ore district, although ASTER band-setting expresses impossibly all characteristic absorption bands.
3.2. Image Processing
The raw ASTER images were crosstalk corrected L1B data from ERSDAC GDS. In ASTER VNIR-SWIR bands, image preprocessing including radiometric calibration, FLAASH atmospheric correction, pixel resampling and mosaicking. Moreover, then the image processing algorithms, band ratio (BR), were tested to extract exposed lithological information using an ASTER image based on the above spectral characteristics of related host rocks and minerals in the field and USGS spectral library. Previous studies have fully proved the effectiveness of ASTER TIR data for mafic/ultramafic rocks identification and proposed several universal extraction algorithms as minerals indices [26,27]. Thus, existing minerals indexes and BR of ASTER TIR were also used for distinguishing lithological units in this study area after TIR image processing of thermal atmospheric correction, temperature separation and emissivity normalization.
Based on the analyses of the spectral characteristic of rock samples above, it is reasonable to distinguish the distribution information of pyroxenite and granitoids by BR of band 2 to band 1 (b2/b1). Second, BR of band 4 to band 8 (b4/b8) were calculated to identify diorite and/or gabbro information because of the relatively different absorption depth of samples spectra at ASTER band8. Then, BR of band 6 to band 7 (b6/b7) was further used to highlight external foliated diorite and/or gabbro units related to Ni–Cu bodies. False-color composites of b2/b1 (R), 6/7 (G) and b4/b8 (B) were finally used to show the lithological distribution in the Huangshan Ni–Cu ore belt.
On the other hand, the existing mafic index (MI) and carbonate index (CI) [26,27] based on ASTER TIR bands were also applied to map the Huangshan intrusions and the country rocks in HKSZ. Moreover, various Si–O/O–Si–O vibration modes from pyroxene, quartz and feldspar cause absorption spectra fluctuation in mid-infrared bands and usually low emissivity located at 10–312 μm [27,52]. In addition, the high peak of emissivity can be moved to the longer wavelength, corresponding ASTER band10 to band 12 moving to ASTER band 13 to band 14, with the increase of quartz and feldspar content and the decrease of pyroxene content [50,51,52]. Therefore, we also add silica index (SI) to further enhance the optical features of Huangshan intrusions [26]. Here, MI, CI and SI are calculated by using the following formulas:
4. Results
4.1. Lithological Mapping
4.1.1. VNIR-SWIR
The grayscale image of ASTER BR b2/b1 shows that area in the vicinity of HKSZ and western intrusion of HSX-II display BR value higher than 1.0 (yellow in Figure 4a) because partial limestone, granitoids and Quaternary sediments have an abundance of ferric oxide minerals corresponding to the stronger absorption at ASTER band 1, while principal mafic/ultramafic intrusions including pyroxenite (mainly norite) show low values of ASTER BR b2/b1. Figure 4b illustrates that external foliated gabbro and/or diorite presents the higher reflectance slopes of ASTER BR b6/b7 covering regions of HSX-I rim and reniform tail, eastern HSX-II and the boundary around HSD. Compared to the grayscale image of ASTER BR b6/b7, it displays relatively higher values (more than 1.13) of ASTER b4/b8 in eastern HSX-I and the boundary around HSD (Figure 4c). Moreover, the higher values of ASTER b6/b7 and b4/b8 are also located in the western HSX-II, which possibly illustrates that both HSX-I and HSX-II intrusions are separated from an earlier intrusion by faulting action. Consequently, external foliated diorite/gabbro in the margin between hosting intrusions and country rocks appear light cyan on the false-color image of b2/b1 (R), b6/b7 (G) and b4/b8 (B) (Figure 4d). However, the interior of HSX-I and HSD shows variegated color tones, which indicates a more complicated mineral composition within principal rocks (pyroxenite). Meanwhile, orange and red image strip display obviously along the HKSZ Fault where is the primary region of country rocks containing limestone and partial schist. In addition, a magenta area with a rounded shaped pattern of HSX-II is unique because Permian granitoids have the same higher values of b2/b1 (Figure 4d).
To compare the differences in extracted lithologic information of three intrusions by using BR b2/b1, b6/b7 and b4/b8, reflectance values of pixels in the ASTER b2/b1, b6/b7 and b4/b8 images are extracted from the regions of HSX-I, HSX-II and HSD intrusions and their country rocks in the 200 m buffer area with intrusion boundary and quartiles for each subset are calculated (Figure 5). First, the overall values of BR b2/b1, b6/b7 and b4/b8 in intrusions are higher than in their country rocks, which proves the effective separation of the intrusive rock from the country rock in this study area. HSX-II shows up as the highest median (0.995) and interquartile range (IQR, 0.078) of the b2/b1 (Figure 5a), while as the lowest level of BR b6/b7 and b4/b8 (Figure 5b,c). Second, both of BR b6/b7 and b4/b8 in HSX-I and HSD intrusions show higher values and IQRs (Figure 5b,c), and especially higher the upper quartiles (Q3) of BR b6/b7 and b4/b8 in HSX-I intrusion. Moreover, the longer IQRs of BR b6/b7 and b4/b8, more than 1.0, are significant in HSX-I and HSD intrusions comparing with in the country rocks. It indicates that BR b2/b1, b6/b7 and b4/b8 of ASTER VNIR-SWIR images are useful to distinguish Huangshan intrusions with their country rocks.
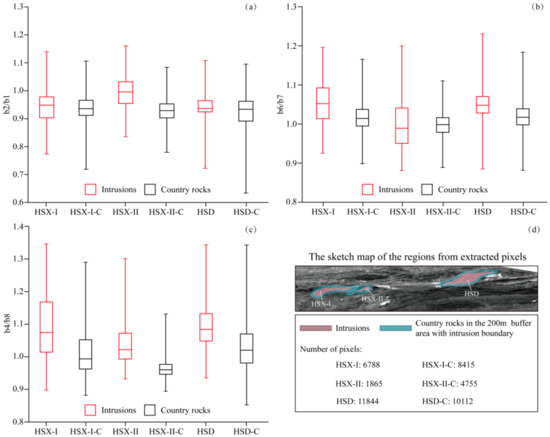
Figure 5.
The quartile boxes of extracted pixels from the regions of HSX-I, HSX-II and HSD intrusions and their country rocks in the 200 m buffer area with intrusion boundary in the ASTER b2/b1 (a), b6/b7 (b), b4/b8 (c) images. The regions from extracted pixels in detail are shown in the sketch map, and number of pixels also are given (d).
4.1.2. TIR
Figure 6 shows ASTER TIR images of MI, CI and SI. The results of lithological mapping are not better than ASTER VNIR-SWIR images limited by the relatively lower spatial resolution of ASTER TIR, but Huangshan intrusions can be identified clearly. The grayscale image of MI accurately expresses HSX-I and HSD intrusions (MI more than 0.98 represented by red in Figure 6a). However, partial area of Quaternary sediments, for example in the north of HSX-I, is falsely mapped due to stronger absorption of ASTER band13 from silicate and clay minerals. As the country rocks of Huangshan intrusions, the Lower Carboniferous limestone and schists are effectually identified by the grayscale image of CI and basically distribute along E–W trending HKSZ in the study area (green in Figure 6b). Although SI image displays no lithological information in HSX-I and HSD intrusions comparing with MI image, the former covers the wide area with high values in HSX-II (Figure 6c). It indicates the distinct difference of basic and acidic igneous rocks between HSX-II intrusion and HSX-I and HSD intrusions because of the increase of pyroxene and the decrease of quartz and feldspar for marginal facies of HSX-I and HSD intrusions. Finally, HSX-I and HSD intrusions are highlighted as red and yellow in the false color image of MI (R), CI (G) and SI (B) (Figure 6d). It can be explained as the contribution of MI and CI. Moreover, blue of HSX-II intrusion also show the differentiation of lithology, as same as the result of ASTER VNIR-SWIR algorithms.
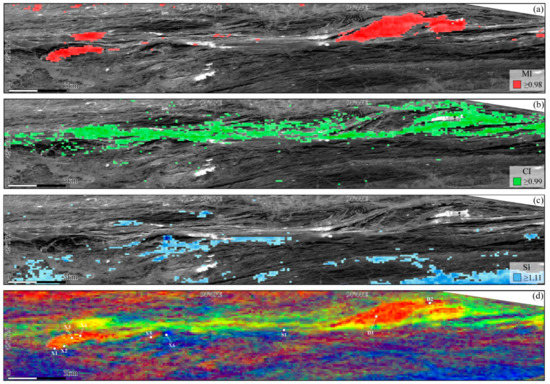
Figure 6.
The lithological information extracted from the ASTER MI (a), CI (b), SI (c) superimposed on ASTER band 1 image and the false-color composite image of MI (R), CI (G), and SI (B) (d) in the study area. White circles represent the location of the samples.
Figure 7 shows quartile boxes of emissivity values of pixels in the ASTER MI, CI and SI images are extracted from the regions of HSX-I, HSX-II and HSD intrusions and their country rocks in the 200 m buffer area with intrusion boundary. Comparing to the country rocks, all values of MI in HSX-I and HSD intrusions are more than 0.9 obviously (Figure 7a). However, the lowest median and the lower quartile of MI are in HSX-II intrusion due to main acidic-intermediate acidic igneous rock formation (Figure 7a). On the contrary, SI in HSX-II intrusion shows the longest IQR (0.08) and the highest median (1.11) (Figure 7c). It indicates that MI and SI of ASTER TIR image are favorable to the separation of different lithology of igneous rocks in Huangshan intrusions. In addition, the quartile of CI shows the higher level in the country rocks rather than in each intrusion (Figure 7b) because of widespread the country rocks belong to the Lower Carboniferous limestones. Therefore, MI, CI and SI of ASTER TIR images are effective for extracting lithological information in HSX-I and HSD intrusions bearing Ni–Cu deposits in this study area.
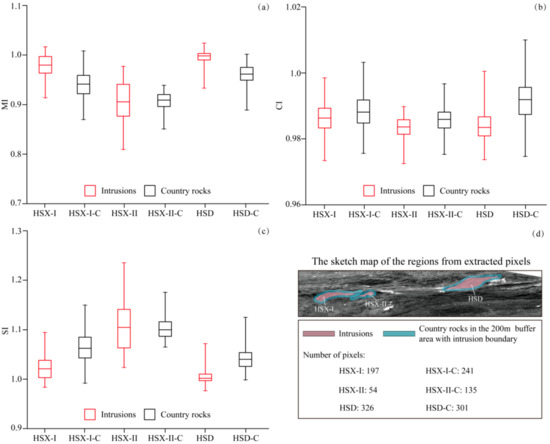
Figure 7.
The quartile boxes of extracted pixels from the regions of HSX-I, HSX-II and HSD intrusions and their country rocks in the 200 m buffer area with intrusion boundary in the ASTER mafic index (MI) (a), carbonate index (CI) (b), silica index (SI) (c) images. The regions from extracted pixels in detail are shown in the sketch map, and number of pixels also are given (d).
4.2. Ore-Controlling Fault Interpretation
In this work, the EW-trending (90°) directional filter processing and hill-shade enhancement are employed for extracting and interpreting the geometrical characteristics of field fault (principally strike-slip fault) from ASTER GDEM data with a spatial resolution of 30 m. Moreover, then the base map of fault interpretation is overlapped with known ore bodies and interpretation of lithological mapping for beneficially analyzing their spatial correlation (Figure 8). ASTER GDEM images clearly display two groups of lineaments: one trending EW representing HKSZ and the other trending NE or SW oblique to the shear zone measured on the field. These Ni–Cu sulfide-bearing mafic-ultramafic intrusions of the Huangshan mining district obviously distribute along principal dextral strike-slip faults with the nearly EW-trending in HKSZ. Along the contact rim, external foliated gabbro/diorite forms a nearly continuous boundary around both HSX-I and HSD intrusions. The dextral movements on the contact zone show an irregular anastomosing network affecting internal mafic-ultramafic rocks at some place. Almost without exception, known ore bodies of Ni–Cu sulfides are potentially controlled by tectonic structures (active or inherited) in the contact rim, especially related to emplacement of pyroxenite (norite) and external foliated diorite/gabbro (Figure 8). In addition, HSX-II is intensely deformed with right-lateral shearing, while not the metallogenetic position in the study area. Within the host rocks, the secondary SE and NW trending faults separated or cut across the smaller intrusions and generated regional rock deformation, such as external foliated diorite/gabbro of HSX-II stretched by a left-lateral shearing fault. It is noteworthy that the secondary fault cut off or near ore bodies, such as in the southern margin of HSX-I and western area of HSD. Nevertheless, lithological mapping shows that either host rocks or ore bodies are parallel to the EW-trending shear zone at some place, not contemporaneous between stretching deformation and intrusion emplacement. Hence, our interpretation presents the spatial pattern of the ore-controlling fault and shallow emplacement of mineralization and indicates the stretched structural controls and multi-stage intrusive emplacement of Huangshan Ni–Cu sulfides deposits hosted by small mafic-ultramafic intrusions.

Figure 8.
Structural interpretation of ASTER GDEM overlapping ore bodies and interpretation of lithological mapping in the study area [53]. The thick red line shows the Kanggur Fault. The thin red lines show the secondary faults. Red dashed lines show the ductile shear zone. White stars represent observation sites of Unmanned Aerial Vehicle (UAV) images and detailed photographs of the Huangshan shear zone.
4.3. Analyses of Intrusions Bearing Ni–Cu Ore
4.3.1. HSX Intrusions
The detailed interpretation of HSX-I intrusion shows that the lithofacies are well-differentiated in the plane and section space (Figure 9). Although mixed colors in ASTER false-color composite image, external foliated diorite-pyroxenite-diorite/gabbro sequence can be basically identified from southwest to east. In Figure 9a, pyroxenite (norite) as the main host rock displays dark violet with high b2/b1 and b4/b8 in the southwest of intrusion, while diorite/gabbro as light cyan with a higher b6/b7 ratio in the middle of intrusion. Due to the contribution of all band ratios (b2/b1, b6/b7 and b4/b8), external foliated diorite is mixed violet and cyan along the northern boundary of intrusion. Our results also indicate the regular facies belt characterized by multi-stage intrusions and the intrusion outcrop of the tadpole shape controlled by regional stretching structure. We infer that the HSX-I complex was emplaced as a long strip shape in EW-trending HKSZ in earlier times and then developed SW-lateral deformation because of secondary strike-slip fault (F1, oblique to Kanggur Fault) in the southern boundary of the intrusion. Moreover, inner F2 and F3 directly generated a clear facies interface between norite and diorite/gabbro and eastward stretching deformation of the intrusion tail. According to existing exploration achievements of geological cross-section (Figure 9b), strata of HSX-I mafic-ultramafic intrusion obviously has the vertical differentiation. Ni–Cu ore bodies enriched in the contact zone between olivine-websterite and norite in the deeper crust and located at the hanging wall of F2 with a funnel shape. F2, almost orthogonal to Kanggur Fault, actually is a secondary thrust fault. Combined with the spatial distribution of ore bodies on the surface (see yellow patterns in Figure 8), it reflects that secondary faults formed by late dextral strike-slip movement in the southern margin of Kanggur Fault promote the rapid emplacement of the parent magma along contact rim and ore-hosting of the upper crust. The superposition of Huangshan-Kanggur ductile shearing and late magmatism mineralization in Permian times possibly facilitate the redistribution and enrichment of Ni–Cu sulfide and other useful elements in Huangshan deposits.
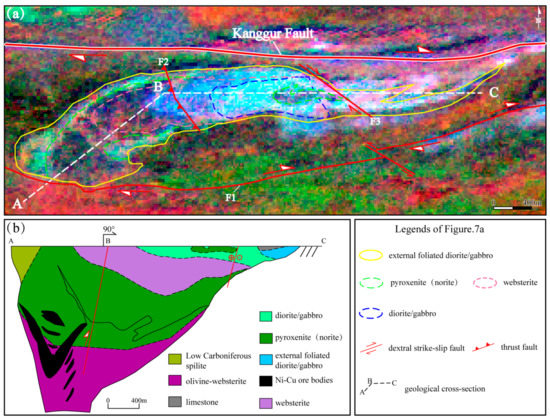
Figure 9.
Enlarged ASTER false color composite image of b2/b1 (R), b6/b7 (G) and b4/b8 (B) of HSX-I intrusion (a), geological cross-section (b) [54].
4.3.2. HSD Intrusion
The detailed interpretation of HSD intrusion in Figure 10a shows the rhombic geometric shape with NNE-trending and clear facies change (external foliated diorite -pyroxenite- diorite/gabbro) as ring-band from the boundary to the core of the intrusion. External foliated diorite is highlighted as similar cyan distributed in the contact rim of the northwest and southern intrusion. Mixed pixels with colors of violet and blue represent pyroxenite (norite) with high b2/b1 and b4/b8, and lighter tones indicate higher reflectance of ASTER band2 and lower depth of ASTER band8 compared with an HSX-I. It is worth noting that fuchsia norite also can be identified in the hinterland of HSD exposed as dikes and pillars. Diorite/gabbro, primary intrusive facies of HSD, widely displays as mixed colors of blue and cyan because of higher values of b6/b7 and b4/b8 (Figure 10a). The distribution of underground intrusive strata is located in the E–W syncline core where is the funnel shape along the geological cross-section (Figure 10b) and Ni–Cu bearing ore bodies enriched at contact belt of hosting pyroxenite. In tectonics, HSD intrusion emplaced in the bending region of the stretching structure where Kanggur strike-slip fault turned from EW-trending to NE- and NEE-trending. All of the ore bodies are located at the southwestern side of F4 and close to the bending area in the eastern margin of HSD; the space distribution on the surface is seen in Figure 8. It illustrates that also the metallogenic process of HSD also could be controlled by secondary fault generated by strike-slip deformation in the special geometrical position of the main fault in the post-collisional extensional environment.
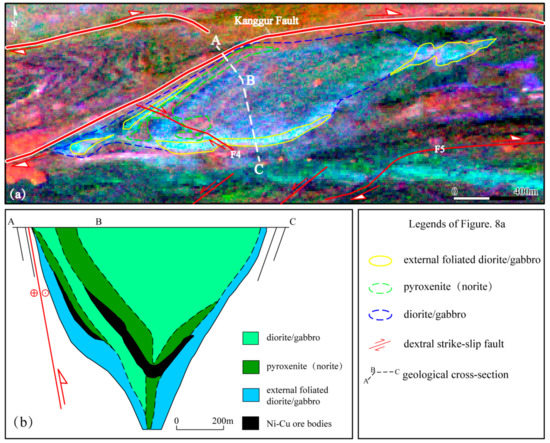
Figure 10.
Enlarged ASTER false color composite image of b2/b1 (R), b6/b7 (G) and b4/b8 (B) of HSD intrusion (a), geological cross-section (b) [42].
5. Validation and Discussion
5.1. Validation
5.1.1. PLM and XRD
For accurately validating and analyzing rocks and minerals information in the study area, a universal PLM equipped with a DP270 digital camera (BX53, Olympus Co., Tokyo, Japan) was used to observe the morphology and distribution of minerals in rock samples. The photomicrographs were taken using white-light illumination, crossed Nichols, and an antiflex objective (1/4 λ plate). First, X1 is coarse-grained norite with weak alteration, which is mainly composed of coarse-grained hypersthene (about 45%) and medium-grained altered plagioclase (about 50%) and containing a small amount of olivine (about 3%) and accessory minerals (2%) (Figure 11a). Minerals of X2 are mainly composed of coarse altered augite (about 35%) and altered plagioclase (about 60%) (Figure 11b). A few minerals have been eroded into fine-grained clay minerals such as sericite and chlorite. Thus, this sample belongs to a strongly altered gabbro. Then, the photomicrograph of X3 called hematite- foliated gabbro shows that minerals are generally distributed in the same direction, mainly cryptocrystalline and vitreous hematite (about 35%), fine-grained altered augite (about 25%) (Figure 11c). X4 is a weathering crust of granitoids, quartz is about 65%, while some pyroxene and plagioclase are weathered into cryptocrystalline bodies (about 35%) (Figure 11d). Different from the others, S1, a foliated limestone, is mainly composed of micrite calcite, which recrystallizes locally to form fine microcrystalline particles (Figure 11e). Especially, these particles have two sets of joints arranged in a directional pattern along the crack, and the typical L-C structure can be shown locally. Finally, D2 is a strongly altered diorite, containing mainly altered hornblende (about 38%), plagioclase (about 35%) and altered fine-grained minerals (about 23%) (Figure 11f).
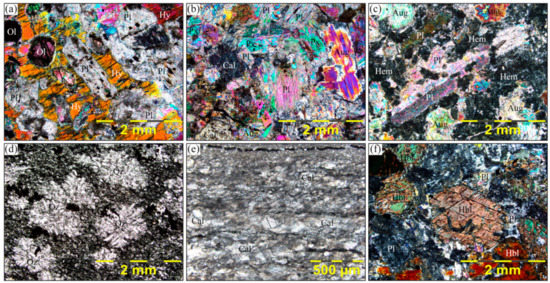
Figure 11.
Photomicrographs under orthogonal polarization of typical samples collected from Huangshan intrusions (a): X1; (b): X2; (c): X3; (d): X4; (e): S1; (f): D2. Location of the samples is shown in Figure 4d. Aug: augite; Cal: calcite; Hbl: hornblende; Hem: hematite; Hy: hypersthene; Ol: olivine; Pl: plagioclase.
Mineral compositions of the powdered pyrite samples were measured with a Rigaku SmartLab X-ray powder diffractometer (XRD) at the Modern Experimental Technology Center, Anhui University. The X-ray generator comprises a 9 kW rotating anode, which was operated at 40 kV, 100 mA, and equipped with a single-crystal graphite monochromator. The results are shown in Figure 12. Diffraction peaks of plagioclase (27.9) and orthopyroxene (28.5) were mainly developed in X1 (norite), while the weak peak of chlorite (12.5) indicates slight rock alteration. X2, an altered gabbro, contains mainly monoclinic pyroxene (28.6) and plagioclase (27.2), and diffraction peaks of a small amount of chlorite (12.5) are also given. Diffraction peaks of X3 (external foliated gabbro) were dominated by monoclinic pyroxene (28.6), then chlorite (12.6) and plagioclase (27.5) were also developed. X4 is the quartz-containing granitoid because strong diffraction peak of quartz (26.6), followed by chlorite and pyroxene. In S1, the diffraction peak of calcite (29.5) is more developed, and there is no other diffraction nearly, so S1 should be the calcite-dominated limestone. D2 (external foliated diorite) not only developed diffraction peaks of hornblende (10.5), plagioclase (27.8) and quartz (26.6) but also strongly developed diffraction peaks of altered minerals such as chlorite (12.5).
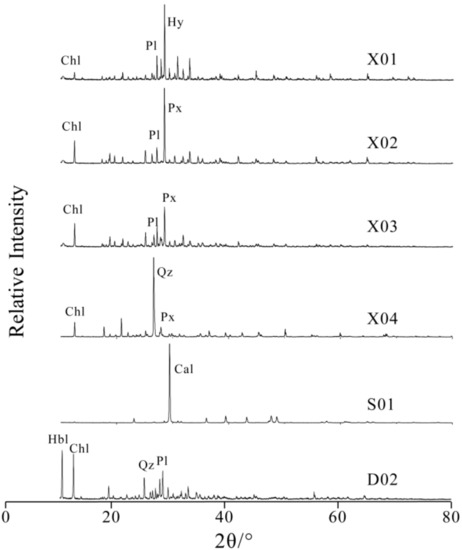
Figure 12.
XRD pattern of samples of typical samples collected from Huangshan intrusions. Cal: calcite; Chl: chlorite; Hbl: hornblende; Hy: hypersthene; Pl: plagioclase; Px: pyroxene; Qz: quartz.
5.1.2. Field Observation of Faults
To validate the interpretation of the ore-controlling faults in the study area, detailed works in the field were performed (Figure 13). In addition, the location of each observation site is shown in Figure 6. Obviously, both HSX-I and HSX-II intrusions are limited by regional dextral strike-slip shearing with NEE or SEE strike in the north (e.g., UAV images of SZ1 showing in Figure 13a). In this brittle-ductile to ductile shear zone, the strata are characterized by surface fragmentation zone (Figure 13b) and steep foliation structure of SSE-dipping located at SZ2 observation site (Figure 13c). Moreover, the eastern section of HKSZ around HSD intrusion is marked by the narrower outcrop of the limestone complex, SZ4 place as an example (Figure 13d). These limestone complexes had undergone a strong, ductile shear movement, in that strong mylonitic foliation was developed. Especially, the centimeter-sized S-C foliation structure, which is a kind of structure assemblage style generally developed in the ductile shear zone, is widely developed in these limestone layers (Figure 13e). The internal calcite veins are arranged parallel to the planes of foliation, and a series of σ-type calcite porphyroclast with ocular globular and rhombic shapes indicate dextral shear movement (Figure 13f). Furthermore, horizontal stretching of the principal shear zone also generated the secondary strike-slip faulting, where further split HSX-II and HSD plutons after emplacement of the principal intrusions (Figure 13g). For example, the secondary westward movement of the left-lateral shearing fault observed in SZ3 place separated into a banded outcrop and possibly applied the intrusive gap for later granitoids of HSX-II (Figure 13h).
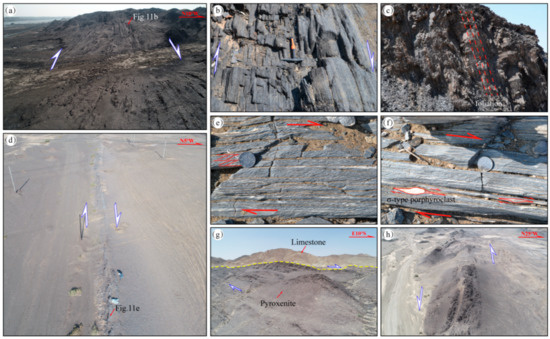
Figure 13.
UAV images and detailed photographs of Huangshan shear zone and strike-slip faults in the field. UAV image and photograph (a,b) show regional dextral strike-slip shearing in the site of SZ1. A photograph at the site of SZ2 (c) shows a foliation structure with SSE-dipping. UAV images (d,g) and photographs (e,f) show spatial geometry and structural features in the site of SZ4 and surroundings. A UAV image (h) also shows a secondary left-lateral shearing fault in the site of SZ3. The location of all observation sites is shown in Figure 8.
5.2. Discussion
Based on lithological identification and extraction by ASTER VNIR-SWIR images, minerals and rocks of Huangshan intrusions have been remarkably well separated in grayscale images and false-color composite images (Figure 4 and Figure 6). Limestone and Quaternary sediments along HKSZ and granitoids in HSX-II show up as high values in b2/b1 (Figure 4a), while external foliated gabbro in HSX-I and HSD show relatively higher b6/b7 responses (Figure 4b). Although b4/b8 appears variation in spectral curves of rocks samples, no single rock unit show a significant high response in b4/b8 image (Figure 4c) because minerals in the intrusive complex contain various pyroxene group, altered and accessory minerals (Figure 10 and Figure 11). However, reported websterite face (pink dotted line range in Figure 9a) in norite unit is not effectively identified by the used band ratios and mineral indexes selected ASTER band algorithms because the main difference between them is that norite contains a certain amount of feldspar group, but the spectral characteristics of feldspar are weak in VNIR-SWIR (Figure 3c,d). Moreover, MI, CI and SI from ASTER TIR images can effectively discriminate Huangshan intrusions and their country rocks (Figure 6). The PLM and XRD results illustrate clearly that our lithological mapping of ASTER VNIR-SWIR data is very effective for the identification of external foliated diorite/gabbro with chloritization bearing Ni–Cu ore in Huangshan ore belt and limestone along HKSZ (Figure 11 and Figure 12). On the other hand, fault interpretation from ASTER GDEM illustrates that the spatial pattern of Huangshan intrusions is controlled by linear structures of HKSZ and the secondary fault and also proves that ASTER GDEM has useful data for medium-small scale region (Figure 8).
Previous studies have indicated mafic/ultramafic intrusions, and Ni–Cu sulfide ores in the eastern Tian Shan were in 298–270 Ma (Early Permian) [43,44,45] when is the important intracontinental wrenching period to accommodate the eastward motion of Junggar and Yili blocks (Figure 1a). In fact, lithological distributions from remote sensing have clearly expressed younger Permian intrusions, such as Huangshan intrusions in this study, wedge into Carboniferous country rocks (e.g., limestone) (Figure 4 and Figure 6). Meanwhile, geochemistry studies indicate the Huangshan ore belt belongs to a magmatic Ni–Cu±PGE sulfide deposit from mantle-derived magmas marked by small mafic/ultramafic complexes, high MgO content, in the vicinity of a major crustal fault or suture and so on [4,6,46,55,56,57]. Indeed, small and variegated color patterns in images also proved the limited scale and complicated minerals content of Huangshan intrusions. Moreover, the spatial pattern of the three intrusions basically conforms to L-C structure, and known ore bodies located in the contact rim of the east and west ends of HSX-I and HSD, where is a compressive deformation region of dextral shearing and close to the secondary faults (Figure 8). Thus, we infer that post-collisional stretching in the Tian Shan and internal major dextral shear zones (e.g., HKSZ) strongly controlled mafic/ultramafic magma injection into shallower crust and emplacement of Permian intrusions and ore deposits. Taking HSD intrusion as an example, the F4 in Figure 10a, including inherited tension gashes, focuses on helping uprising magmas to the upper crust in Permian regional scale dextral inhomogeneous shearing after partial melting of the metasomatized mantle. Moreover, then tensile strike-slip movement further provides ore-holding space in the shallow crust in order to placement of Ni–Cu sulfide melting. We also consider that Kanggur Fault and their secondary fault system, as a result of oblique subduction that gave rise to strike-slip extensional faults during the Permian, provided good conduits for the transport of ore materials and the ore-forming space in the Huangshan Ni–Cu deposit. The small mafic/ultramafic intrusive complex containing ore bodies, external foliated diorite/gabbro especially, has a direct spatial relationship with strike-slip faulting in Huangshan ore belt even in the whole eastern Tian Shan based on our work. Finally, based on analysis of some studies referring to tectonic evolution in eastern Tian Shan [3,4,5,6,42,43,44,49,54,58,59,60], we propose an ASTER three-dimensional (3D) geodynamic sketch map to interpret possible metallogenic and ore-controlling mechanism of Huangshan Ni–Cu deposits at Early Permian time in Figure 14. During Early Permian, the major dextral strike-slip movement of Kanggur Fault in HKSZ was developed caused by post-orogenic extension in the closure of the ancient Tian Shan Ocean and then led to emplacement of the three mafic/ultramafic intrusions bearing Ni–Cu of Huangshan along the bending deformation part of Kanggur Fault especially [3,4,5,6,43,59,61,62,63]. Meanwhile, the formation of these intrusions in the crust is mainly derived from partial melting of metasomatized lithospheric mantle after the asthenospheric bulging and slab break-off [54,58,62]. Moreover, a large number of crustal cracks and/or magma conduit resulted in strike-slip tensioning of Kanggur Fault played a key role in the migration and emplacement of intrusions to the upper surface from the lower crust. Moreover, hot convective fluids beneath the Kanggur arc may provide a CO2 mantellic origin source for intrusion parental magmas [42,44]. These CO2− rich fluids leaked along HKSZ up to the surface and also favored the metallogenic process of the Huangshan Ni–Cu ore belt.
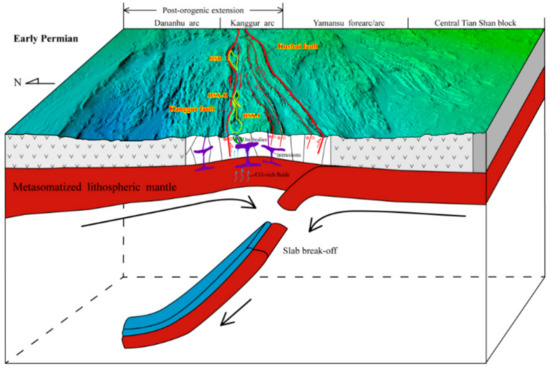
Figure 14.
The three-dimensional (3D) geodynamic sketch map showing possible metallogenic and ore-controlling mechanism of Huangshan Ni–Cu deposits during Early Permian [42,54,59,60].
6. Conclusions
The ASTER multispectral data-based approach to map lithological features related to the Huangshan Ni–Cu mineralization is well performed in the eastern Tian Shan. It can be comprehensively applied to further mineral exploration and target optimization of polymetallic resources throughout the Tian Shan. In this study, Image processing algorithms such as b2/b1, b6/b7, b4/b8 for ASTER VNIR-SWIR images and MI, CI and SI for ASTER TIR images are helpful to extract external foliated gabbro and norite bearing Ni–Cu ore bodies.
Furthermore, the detailed interpretations and analyses of the geometrical feature of the fault system and intrusive facies from ASTER data suggest that the Ni–Cu metallogenic belt is related to Carboniferous arc intrusive rocks and Permian wrench tectonics located at the intersection of the EW- and NEE-striking dextral strike-slip fault system, and the emplacement at the releasing bends in the southern margin of Kanggur Fault obviously controlled by secondary faults orthogonal or oblique to Kanggur Fault in the post-collisional extensional environment. It obviously displayed the ore-controlling effect of regional EW- and NWW-trending dextral strike-slip fault systems in HKSZ.
Although most of the lithological units can be successfully identified in this study, it is still difficult to map more detailed lithological information for all rock types due to relatively less spectral diagnostic features such as feldspar in ASTER bands. However, synergistic analyses of lithology and stretching tectonic in contact rim along the strike-slip fault of the main shear zone will apply a scientific basis for further exploration and target optimization of middle to large-scale ore and existing deposits throughout the Tian Shan in central Asia.
Author Contributions
Conceptualization, methodology, writing, funding acquisition and visualization, S.Z.; investigation and validation, Y.A. and T.Z.; programming and data curation, P.S.; All authors have read and agreed to the published version of the manuscript.
Funding
This work was supported by the Natural Science Foundation of China (Grant No. 41802244).
Informed Consent Statement
Informed consent was obtained from all subjects involved in the study.
Data Availability Statement
Data available in a publicly accessible repository that does not issue DOIs. Publicly available datasets were analyzed in this study. This data can be found here: http://asterweb.jpl.nasa.gov/index.asp.
Conflicts of Interest
The authors declare no conflict of interests.
References
- Chen, Y.J.; Pirajno, F.; Wu, G. Epithermal deposits in North Xinjiang, NW China. Int. J. Earth Sci. 2012, 101, 889–917. [Google Scholar] [CrossRef]
- Deng, J.; Wang, Q.F.; Li, G.J. Cenozoic tectono-magmatic and metallogenic processes in the Sanjiang region, southwestern China. Earth-Sci. Rev. 2014, 138, 268–299. [Google Scholar] [CrossRef]
- Qin, K.; Fang, T.; Wang, S.; Zhu, B.; Feng, Y.; Yu, H.; Xiu, Q. Plate tectonics division, evolution and metallogenic settings in eastern Tianshan mountains, NW-China. Xinjiang Geol. 2002, 20, 302–308. (In Chinese) [Google Scholar]
- Qin, K.; Peng, X.; San, J.; Xu, X.; Fang, T.; Wang, S.; Yu, H. Types of major ore deposits, division of metallogenic belts in east-ern Tianshan, and discrimination of potential prospects of Cu, Au, Ni mineralization. Xinjiang Geol. 2003, 21, 143–150. (In Chinese) [Google Scholar]
- Mao, J.; Goldfarb, R.J.; Wang, Y.; Hart, C.J.; Wang, Z.; Yang, J. Late Paleozoic base and precious metal deposits, East Tianshan, Xinjiang, China: Characteristics and geodynamic setting. Episodes 2005, 28, 23–36. [Google Scholar] [CrossRef]
- Qin, K.; Zhang, L.; Xiao, W.; Xu, X.; Yan, Z.; Mao, J. Overview of major Au, Cu, Ni and Fe deposits and metallogenic evolution of theastern Tianshan Mountains, northwestern China. In Tectonic Evolution and Metallogeny of the Chinese Altay and Tianshan; IAGOD Guidebook Series; Natural History Museum of Landon: London, UK, 2003; Volume 10, pp. 227–249. [Google Scholar]
- Xiao, W.; Kroner, A.; Windley, B. Geodynamic evolution of Central Asia in the Paleozoic and Mesozoic. Int. J. Earth Sci. 2009, 98, 1185–1188. [Google Scholar] [CrossRef]
- Xiao, W.; Kusky, T.; Safonova, I.; Seltmann, R.; Sun, M. Tectonics of the Central Asian Orogenic Belt and its Pacific analogues (Editorial). J. Asian Earth Sci. 2015, 113, 1–6. [Google Scholar] [CrossRef]
- Xu, B.; Charvet, J.; Chen, Y.; Zhao, P.; Shi, G. Middle Paleozoic convergent orogenic belts in western Inner Mongolia (China): Framework, kinematics, geochronology and implications for tectonic evolution of the Central Asian Orogenic Belt. Gondwana Res. 2013, 23, 1342–1364. [Google Scholar] [CrossRef]
- Borisenko, A.S.; Sotnikov, V.I.; Izokh, A.E.; Polyakov, G.V.; Obolensky, A.A. Permo-Triassic mineralization in Asia and its relation to plume magmatism. Russ. Geol. Geophys. 2006, 47, 166–182. [Google Scholar]
- Han, C.; Xiao, W.; Zhao, G.; Ao, S.; Zhang, J.; Qu, W.; Du, A. In-situ U-Pb, Hf and Re-Os isotopic analyses of the Xiangshan Ni-Cu-Co deposit in Eastern Tianshan (Xinjiang), Central Asia Orogenic Belt: Constraints on the timing and genesis of the mineralization. Lithos 2010, 120, 547–562. [Google Scholar] [CrossRef]
- Li, D.; Zhang, L.; Chen, H.; Hollings, P.; Cao, M.; Fang, J.; Wang, C.; Lu, W. Geochronology and geochemistry of the high Mg dioritic dikes in Eastern Tianshan, NW China: Geochemical features, petrogenesis and tectonic implications. J. Asian Earth Sci. 2016, 115, 442–454. [Google Scholar] [CrossRef]
- Pirajno, F.; Seltmann, R.; Yang, Y. A review of mineral systems and associated tectonic settings of northern Xinjiang, NW China. Geosci. Front. 2011, 2, 157–185. [Google Scholar] [CrossRef]
- Qin, K.; Su, B.; Sakyi, P.A.; Tang, D.; Li, X.; Sun, H.; Xiao, Q.; Liu, P. SIMS zircon U-Pb geochronology and Sr-Nd isotopes of Ni-Cu-Bearing Mafic-Ultramafic Intrusions in Eastern Tianshan and Beishan in correlation with flood basalts in Tarim Basin (NW China): Constraints on a ca.280 Ma mantle plume. Am. J. Sci. 2011, 311, 237–260. [Google Scholar] [CrossRef]
- Zhang, Z.; Hong, W.; Jiang, Z.; Duan, S.; Li, F.; Shi, F. Geological characteristics and metallogenesis of iron deposits in west-ern Tianshan, China. Ore Geol. Rev. 2014, 57, 425–440. [Google Scholar] [CrossRef]
- Zheng, J.; Mao, J.; Yang, F.; Liu, F.; Zhu, Y. The post-collisional Cihai iron skarn deposit, eastern Tianshan, Xinjiang, China. Ore Geol. Rev. 2015, 67, 244–254. [Google Scholar] [CrossRef]
- Fu, B.; Zheng, G.; Ninomiya, Y.; Wang, C.; Sun, G. Mapping hydrocarbon-induced mineralogical alteration in the northern Tian Shan using ASTER multispectral data. Terra Nova 2007, 19, 225–231. [Google Scholar] [CrossRef]
- Liu, L.; Zhou, J.; Han, L.; Xu, X. Mineral mapping and ore prospecting using Landsat TM and Hyperion data, Wushitala, Xinjiang, northwestern China. Ore Geol. Rev. 2017, 81, 280–295. [Google Scholar] [CrossRef]
- Liu, L.; Zhou, J.; Jiang, D.; Zhuang, D.; Mansaray, L.R.; Hu, Z.; Ji, Z. Mineral resources prospecting by synthetic appli-cation of TM/ETM+, Quickbird and Hyperion data in the Hatu area, West Junggar, Xinjiang, China. Sci. Rep. 2016, 6, 21851. [Google Scholar] [CrossRef]
- Shi, P.; Fu, B.; Ninomiya, Y.; Sun, J.; Li, Y. Multispectral remote sensing mapping for hydrocarbon seepage-induced lithologic anomalies in the Kuqa foreland basin, south Tian Shan. J. Asian Earth Sci. 2012, 46, 70–77. [Google Scholar] [CrossRef]
- Zheng, S.; Fu, B.H. Lithological mapping of granitoids in the western Junggar from ASTER SWIR-TIR multispectral data: Case study in Karamay pluton, Xinjiang. Acta Petrol. Sin. 2013, 29, 2936–2948. (In Chinese) [Google Scholar]
- Abrams, M. The Advanced Space borne Thermal Emission and Reflection Radiometer (ASTER): Data products for the high spatial resolution imager on NASA’s Terra platform. Int. J. Remote Sens. 2000, 21, 847–859. [Google Scholar] [CrossRef]
- Yamaguchi, Y.; Fujisada, H.; Kudoh, M.; Kawakami, T.; Tsu, H.; Kahle, A.B.; Pniel, M. ASTER instrument characterization and operation scenario. Adv. Space Res. 1999, 23, 1415–1424. [Google Scholar] [CrossRef]
- Yamaguchi, Y.; Fujisada, H.; Kahle, A.B.; Tsu, H.; Kato, M.; Watanabe, H.; Sato, I.; Kudoh, M. ASTER instrument perfor-mance, operation status and application to Earth sciences. In Proceedings of the IEEE International Geosciences and Remote Sensing Symposium, Sydney, Australia, 9–13 July 2001; Volume 3, pp. 1215–1216. [Google Scholar]
- Fu, H.; Fu, B.; Ninomiya, Y.; Shi, P. New Insights of Geomorphologic and Lithologic Features on Wudalianchi Volcanoes in the Northeastern China from the ASTER Multispectral Data. Remote Sens. 2019, 11, 2663. [Google Scholar] [CrossRef]
- Ninomiya, Y. Mapping quartz, carbonate minerals, and mafic-ultramafic rocks using remotely sensed multispectral thermal infrared ASTER data. Proc. SPIE 2002, 4710, 191–202. [Google Scholar]
- Ninomiya, Y.; Fu, B.; Cudahy, T.J. Detecting lithology with Advanced Spaceborne Thermal Emission and Reflection Radi-ometer (ASTER) multispectral thermal infrared “radiance-at-sensor” data. Remote Sens. Environ. 2005, 99, 127–139. [Google Scholar] [CrossRef]
- Emam, B.; Zoheir, B.; Johnson, P. ASTER-based mapping of ophiolitic rocks: Examples from the Allaqi-Heiani suture, SE Egypt. Int. Geol. Rev. 2015, 58, 525–539. [Google Scholar] [CrossRef]
- Abrams, M.; Yamaguchi, Y. Twenty Years of ASTER Contributions to Lithologic Mapping and Mineral Exploration. Remote Sens. 2019, 11, 1394. [Google Scholar] [CrossRef]
- Amer, R.; Mezayen, A.E.; Hasanein, M. ASTER spectral analysis for alteration minerals associated with gold mineralization. Ore Geol. Rev. 2016, 75, 239–251. [Google Scholar] [CrossRef]
- Dehnavi, A.G.; Sarikhani, R.; Nagaraju, D. Image processing and analysis of mapping alteration zones in environmental re-search, East of Kurdistan, Iran. World Appl. Sci. J. 2010, 11, 278–283. [Google Scholar]
- Gabr, S.; Ghulam, A.; Kusky, T. Detecting areas of high-potential gold mineralization using ASTER data. Ore Geol. Rev. 2010, 38, 59–69. [Google Scholar] [CrossRef]
- Pour, A.B.; Hashim, M. The application of ASTER remote sensing data to porphyry copper and epithermal gold deposits. Ore Geol. Rev. 2012, 44, 1–9. [Google Scholar] [CrossRef]
- Son, Y.S.; Kang, M.K.; Yoon, W.J. Lithological and mineralogical survey of the Oyu Tolgoi region, Southeastern Gobi, Mongolia using ASTER reflectance and emissivity data. Int. J. Appl. Earth Obs. Geoinf. 2014, 26, 205–216. [Google Scholar] [CrossRef]
- Rowan, L.C.; Mars, J.C.; Simpson, C.J. Lithologic mapping of the Mordor, NT, Australia ultramafic complex by using the Advanced Spaceborne Thermal Emission and Reflection Radiometer (ASTER). Remote Sens. Environ. 2005, 99, 105–126. [Google Scholar] [CrossRef]
- Kumar, P.S. An alternative kinematic interpretation of Thetis Boundary Shear Zone, Venus: Evidence for strike-slip ductile duplexes. J. Geophys. Res. 2005, 110, e07001. [Google Scholar] [CrossRef]
- Corsini, M.; Vauchez, A.; Caby, R. Ductile duplexing at a bend of a continental-scale strike-slip shear zone: Example from NE Brazil. J. Struct. Geol. 1996, 18, 385–394. [Google Scholar] [CrossRef]
- Wan, B.; Xiao, W.; Zhang, L.; Han, C. Iron mineralization associated with a major strike-slip shear zone: Radiometric and oxygen isotope evidence from the Mengku deposit, NW China. Ore Geol. Rev. 2012, 44, 136–147. [Google Scholar] [CrossRef]
- Spacapan, J.B.; Galland, O.; Leanza, H.A.; Planke, S. Control of strike-slip fault on dyke emplacement and morphology. J. Geol. Soc. 2015, 173, 573–576. [Google Scholar] [CrossRef]
- Lopez Moro, F.J.; Romer, R.L.; Rhede, D.; Fernandez, A.; Timon-Sanchez, S.M.; Moro, M.C. Early uranium mobilization in late Variscan strike slip shear zones affecting leucogranites of central western Spain. J. Iber. Geol. 2018, 45, 223–243. [Google Scholar] [CrossRef]
- Sylvester, A.G. Strike-slip faults. Geol. Soc. Am. Bull. 1988, 100, 1666–1703. [Google Scholar] [CrossRef]
- Yannick, B.; Gumiaux, C.; Sizaret, S.; Barbanson, L.; Wang, B.; Cluzel, D.; Li, G.; Delaunay, A. Synkinematic mafic/ultramafic sheeted intrusions: Emplacement mechanism and strain restoration of the Permian Huangshan Ni-Cu ore belt (Eastern Tianshan, NW China). J. Asian Earth Sci. 2012, 56, 240–257. [Google Scholar] [CrossRef]
- Zhang, L.; Qin, K.; Xiao, W. Multiple mineralization events in the eastern Tianshan district, NW China: Isotopic geochronology and geological significance. J. Asian Earth Sci. 2008, 32, 236–246. [Google Scholar] [CrossRef]
- Zhou, M.F.; Michael, L.C.; Yang, Z.; Li, J.; Sun, M. Geochemistry and petrogenesis of 270 Ma Ni-Cu-(PGE) sulfide-bearing mafic intrusions in the Huangshan district, Eastern Xinjiang, Northwest China: Implications for the tectonic evolution of the Central Asian orogenic belt. Chem. Geol. 2004, 209, 233–257. [Google Scholar] [CrossRef]
- Mao, J.; Pirajno, F.; Zhang, Z.; Chai, F.; Wu, H.; Chen, S.; Cheng, L.; Yang, J.; Zhang, C. A review of the Cu-Ni sulphide de-posits in the Chinese Tianshan and Altay orogens (Xinjiang Autonomous Region, NW China): Principal characteristics and ore-forming processes. J. Asian Earth Sci. 2008, 32, 184–203. [Google Scholar] [CrossRef]
- Wang, Y.; Li, J.; Sun, G. Postcollisional Eastward Extrusion and Tectonic Exhumation along the Eastern Tianshan Orogen, Central Asia: Constraints from Dextral Strike-Slip Motion and 40Ar=39Ar Geochronological Evidence. J. Geol. 2008, 116, 599–618. [Google Scholar] [CrossRef]
- Charvet, J.; Shu, L.S.; Laurent, C.S. Palaeozoic structural and geodynamic evolution of eastern Tianshan (NW China): Welding of the Tarim and Junggar plates. Episodes 2007, 30, 162–186. [Google Scholar]
- Wang, B.; Dominique, C.; Jahn, B.; Shu, L.; Chen, Y.; Zhai, Y.; Branquet, Y.; Barbanson, L.; Sizaret, S. Late Paleozoic pre- and syn-kinematic plutons of the Kanggur–Huangshan shear zone; inference on the tectonic evolution of the eastern Chinese north Tianshan. Am. J. Sci. 2014, 314, 1–37. [Google Scholar] [CrossRef]
- Wang, B.; Chen, Y.; Zhan, S.; Shu, L.; Faure, M.; Cluzel, D.; Charvet, J. Primary Carboniferous and Permian paleomagnetic results from the Yili Block (NW China) and their implications on the geodynamic evolution of Chinese Tianshan Belt. Earth Planet. Sci. Lett. 2007, 263, 288–308. [Google Scholar] [CrossRef]
- Hunt, G.R. Spectral signatures of particulate minerals in the visible and near infrared. Geophysics 1977, 42, 501–513. [Google Scholar] [CrossRef]
- Hunt, G.R.; Ashley, R.P. Spectra of altered rocks in the visible and near infrared. Econ. Geol. 1979, 74, 1613–1629. [Google Scholar] [CrossRef]
- Clark, R.N. Spectroscopy of rocks and minerals, and principles of spectroscopy. In Remote Sensing for the Earth Sciences: Manual of Remote Sensing; Rencz, A.N., Ed.; John Wiley & Sons, Inc.: Hoboken, NJ, USA, 1999; Volume 3. [Google Scholar]
- Xinjiang Bureau of Geology and Mineral Resources. Geological Map of Xinjiang Uygur Autonomous Region, Scale 1:2,000,000; Geological Publishing House: Beijing, China, 1992. [Google Scholar]
- Deng, Y.F.; Song, X.Y.; Hollings, P.; Zhou, T.; Yuan, F.; Chen, L.M.; Zhang, D. Role of asthenosphere and lithosphere in the genesis of the Early Permian Huangshan mafic–ultramafic intrusion in the Northern Tianshan, NW China. Lithos 2015, 227, 241–254. [Google Scholar] [CrossRef]
- Groves, D.I.; Bierlein, F.P. Geodynamic settings of mineral deposit systems. J. Geol. Soc. 2007, 164, 19–30. [Google Scholar] [CrossRef]
- Naldrett, A.J. World-class Ni-Cu-PGE deposits: Key factors in their genesis. Miner. Depos. 1999, 34, 227–240. [Google Scholar] [CrossRef]
- Wang, B.; Cluzel, D.; Shu, L.S.; Faure, M.; Charvet, J.; Chen, Y.; Meffre, S.; De Jong, K. Evolution of calc-alkaline to alkaline magmatism through Carboniferous convergence to Permian transcurrent tectonics, western Chinese Tianshan. Int. J. Earth Sci. 2009, 98, 1275–1298. [Google Scholar] [CrossRef]
- Zhang, L.; Xiao, W.; Qin, K.; Sun, S.; Ji, J.; Yang, X. Types, geological features and geodynamic significances of gold-copper deposits in the Kanggurtag metallogenic belt, eastern Tianshan, NW China. Int. J. Earth Sci. 2004, 93, 224–240. [Google Scholar] [CrossRef]
- Han, C.; Xiao, W.; Zhao, G.; Mao, J.; Li, S.; Yan, Z.; Mao, Q. Major types, characteristics and geodynamic mechanism of Up-per Paleozoic copper deposits in northern Xinjiang, northwestern China. Ore Geol. Rev. 2006, 28, 308–328. [Google Scholar] [CrossRef]
- Xiao, W.; Zhang, L.; Qin, K.; Sun, S.; Li, J. Paleozoic accretionary and collisional tectonics of the eastern Tianshan (China): Implications for the continental growth of central Asia. Am. J. Sci. 2004, 304, 370–395. [Google Scholar] [CrossRef]
- Zhu, X.; He, J.; Xiao, J.; Wang, X. Uniform slip rates of the Altyn Tagh and the Kunlun faults likely reflect lateral variation of frictional strength of the faults. Terra Nova 2020, 32, 381–389. [Google Scholar] [CrossRef]
- Trifonov, V.G.; Korzhenkov, A.M.; Omar, K.M. Recent geodynamics of major strike-slip zones. Geod. Geodyn. 2015, 6, 361–383. [Google Scholar] [CrossRef]
- Xu, Z.; Wang, Q.; Cai, Z.; Dong, H.; Li, H.; Chen, X.; Duan, X.; Cao, H.; Li, J.; Burg, J.P. Kinematics of the Tengchong Ter-rane in SE Tibet from the late Eocene to early Miocene: Insights from coeval mid-crustal detachments and strike-slip shear zones. Tectonophysics 2015, 665, 127–148. [Google Scholar] [CrossRef]
Publisher’s Note: MDPI stays neutral with regard to jurisdictional claims in published maps and institutional affiliations. |
© 2021 by the authors. Licensee MDPI, Basel, Switzerland. This article is an open access article distributed under the terms and conditions of the Creative Commons Attribution (CC BY) license (http://creativecommons.org/licenses/by/4.0/).