Abstract
Many remote sensing studies do not distinguish between natural and planted forests. We combine C-Band Synthetic Aperture Radar (Sentinel-1, S-1) and optical satellite imagery (Sentinel-2, S-2) and examine Random Forest (RF) classification of acacia plantations and natural forest in North-Central Vietnam. We demonstrate an ability to distinguish plantation from natural forest, with overall classification accuracies of 87% for S-1, and 92.5% and 92.3% for S-2 and for S-1 and S-2 combined respectively. We found that the ratio of the Short-Wave Infrared Band to the Red Band proved most effective in distinguishing acacia from natural forest. We used RF on S-2 imagery to classify acacia plantations into 6 age classes with an overall accuracy of 70%, with young plantation consistently separated from older. However, accuracy was lower at distinguishing between the older age classes. For both distinguishing plantation and natural forest, and determining plantation age, a combination of radar and optical imagery did nothing to improve classification accuracy.
1. Introduction
The global area of forest plantations increased from 167 Mha in 1990 to 278 Mha in 2015 [1]. Forest plantations can reduce logging pressure on natural forests through providing an alternative source of timber. However, conversion of natural forest to plantation is a major driver of forest loss [2]. Assessments [3] of forest cover often make no distinction between natural forest and planted forest, so that countries can report increased forest area despite the ongoing loss of natural forest and conversion of natural forest to plantation. Natural forests and plantation forests differ in their ability to store and sequester carbon [4], and to support biodiversity [5,6,7], and local livelihoods [8]. An ability to distinguish plantation and natural forests using remote sensing would be of great value by allowing the accurate monitoring of natural forest loss and plantation expansion.
In Vietnam, while forest cover has increased since 1993, most of the increased area consists of plantation forests, with natural forests suffering further conversion, degradation and fragmentation [9]. In particular, acacia plantations, consisting principally of Acacia mangium and clonal A. mangium x A. auriculiformis hybrid, have expanded in recent decades, from 66,000 ha in 1992 to > 1,000,000 ha by 2013 [10].
Remote sensing of forest changes using visual, near-infrared (NIR) and short wave infrared (SWIR) parts of the spectrum has a long-established history. Sentinel-2 images with 13 visible, near infrared and short wave infrared bands, and a revisit time of 5 days, have become a popular choice for forest monitoring [11]. However, cloud cover is a major drawback of optical sensors, with both cloud and cloud shadows leading to gaps in time series data, and affecting monitoring activity. This is especially problematic in humid tropical and sub-tropical regions.
Sentinel-1 was launched in 2014, and now consists of 2 polar-orbiting satellites with a C-Band Synthetic Aperture Radar (SAR) imaging system. In Vietnam ascending and descending orbits have a repeat time of 12 days, giving an overall 6 day repeat time that, unlike optical sensors, is largely unaffected by weather conditions. The SAR backscatter varies with the wavelength, polarization and incidence angle of the SAR signal. In addition, SAR imagery from forest areas is dependent on the electrical properties and internal and external moisture content of the vegetation. The forest’s 3-dimensional structure, such as the roughness, size and orientation of the leaves and branches also affects the SAR backscatter. In the dense humid tropical canopies of Vietnam, the 5.5 cm wavelength signal of Sentinel-1 will have limited penetration of the canopy [12,13].
The dependence of S-1 backscatter on vegetation’s physical properties contrasts with a greater dependence on biochemical traits from optical sensors like S-2. Therefore, these two sensors can usefully complement each other. A number of studies have used satellite imagery both optical [14,15] and radar [16,17,18] and combined optical and radar [19,20,21,22,23] to identify plantation areas, chiefly in Malaysia, Indonesia, and China and largely focused on palm oil, acacia and rubber plantations. Classifying acacia plantations has proved problematic in another study due to their short life-cycle [18].
In the tropics, acacia plantations are often managed on very short (less than 5 year) rotations. However, there has been a recent push by the Vietnamese government [24,25] and certification bodies to switch to longer-term rotations, in an attempt to convert acacia plantation from woodchip to sawlog markets. Plantation age has important impacts on carbon storage [26] and species richness [27]. For example, 2 studies in Malaysia [28,29] found the number of bird species significantly increasing with age for 2, 5 and 7 years old acacia plantations. The 2 years old plantations were dominated by open-habitat and scrubland species, but mature acacia contained about 50% of the primary forest species, albeit lacking the more specialized and uncommon taxa. Determination of plantation age could therefore be useful to conservationists, landowners and for land-use planning purposes by allowing for an effective accounting of resource availability.
Here we explore the use of radar and optical imagery to distinguish between natural and plantation forests throughout the plantation lifecycle. Our overall method of approach was to initially produce S-1 and S-2 time-series for natural forest and plantation for the period mid-2015 to mid-2020. These time-series would then be used to make a more informed judgement about what features to include in our classification model. Our study focuses on North-Central Vietnam, where there has been a large increase in plantation forests. We address the following questions:
- What is the classification accuracy of Sentinel-1 (SAR), Sentinel-2 (optical) and S-1 and S-2 combined for distinguishing natural forest and acacia plantation?
- Can acacia plantation age be accurately classified?
2. Materials and Methods
2.1. Study Site
The study area (E106°17′ to 106°56′–N16°43′ to 17°32′) covers about 2100 km2 in the southern part of the province of Quang Binh and the northern section of Quang Tri province in North-Central Vietnam (see Figure 1). This site lies in the WWF ecological zone and the Reduced Emissions from Deforestation and Degradation (REDD) sub-region “West mountain Range of Binh Tri Thien” [30]. The altitude varies from 20 m in the east to 1000 m along the border with Laos in the west, with a maximum of 1770 m. There is a tropical monsoon climate, with a rainy season for the last six months of the year, and a short dry season from March to June [31].
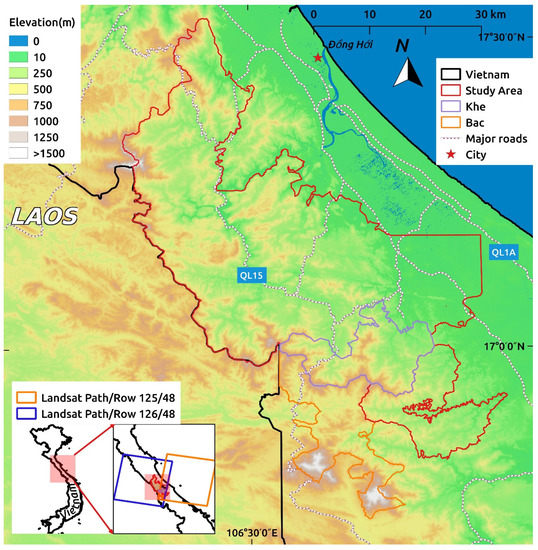
Figure 1.
Map of study area. Khe and Bac indicate boundaries of the Khe Nuoc Trong and Bac Huong Hoa Nature Reserves respectively, both within the study area. Elevation (sourced from Shuttle Radar Topography Mission data) is indicated as shading from dark green (just above sea level) to white (1500 m).
The natural forest consists of tropical lowland evergreen broadleaved rain forest below 1000 m, and tropical evergreen mid-montane rain forest above. There is no virgin forest left within the study area, with all the natural forest affected to a varying degree by war, resource extraction and logging for high value timber. In many areas the natural forest is secondary forest, developing after cessation of agriculture. A Birdlife Report [32] gives a detailed overview of the remaining natural forest.
The area includes the Bac Huong Hoa and Khe Nuoc Trong Nature Reserves. The Key Biodiversity Area of Truong Son covers most of the study area.
2.2. Data Sources
2.2.1. Sentinel-1 Data
The Sentinel-1 data used was the Level-1 Ground Range Detected (GRD) Interferometric Wide Swath (IW) product downloaded from https://scihub.copernicus.eu/. These GRD images consist of VV (vertical send and vertical receive) and VH (vertical send and horizontal receive) polarisations, both with a resolution of 10 m (see Figure 2).
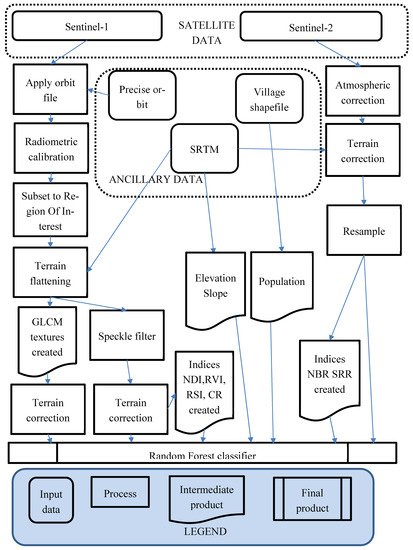
Figure 2.
Flowchart of pre-processing carried out on Sentinel images. Abbreviations: GLCM: Grey–Level Co-Occurrence Matrix, SRTM: Shuttle Radar Topography Mission, NDI: Normalised Difference Index, RVI: Radar Vegetation Index, RSI: Radar Squared Index, CR: Cross-Ratio, NBR: Normalised Burn Ratio, SRR: Short-wave Infrared-Red Ratio.
For the Random Forest classification we used one descending image from 11 February 2018 in the study. This date was chosen to correspond closely as possible with a clear Sentinel-2 image. Orbital correction, calibration, speckle filtering (Lee-Sigma filter), terrain flattening and terrain correction were applied to all S-1 images (see Figure 2). Both terrain flattening and correction was carried out using 1 arcsecond Shuttle Radar Topography Mission (SRTM) data. This results in 2 features: the VV and VH polarized backscatter values (in decibels, dB). Over the study area incidence angle for a descending orbit ranged from 39.8 to 44.2°. Relative orbit number was 18.
2.2.2. Sentinel-2 Data
All the forest, both natural and plantation, in the study region is evergreen, and variation in the vegetation over the year should be minimal. Nonetheless, we decided to test if the use of multiple images could improve classification accuracy. Accordingly in our S-2 classification we tested accuracy in the winter period, shortly after the end of the wet season, and accuracy in the summer period, towards the end of the study area’s dry period.
Our study area was covered by two S-2 granules (QXD and QXE). Therefore for the Random Forest classification we downloaded a total of 6 images as Level-1C Top-of-Atmosphere reflectance products: the ‘winter’ QXD and QXE S-2 image from 15 February 2018 (https://scihub.copernicus.eu/): (“S2A_MSIL1C_20180215TO31821_NO206_R118_T448QXD_20180215TO83955.SAFE” and S2A_MSIL1C_20180215T031821_N0206_R118_T48QXE_20200228T115658.SAFE”), a QXD and QXE ‘summer’ image from 16th May, and a QXD and QXE ‘summer’ image from 30 June 2018. Persistent cloud cover over the study area in summer 2018 meant that we needed images from 2 different dates to create a single cloud-free image. The 16th May images were largely cloud-free and therefore classed as the ‘master’ images, with the June images used only to fill in any areas that were cloud-covered in the May image.
The ten bands with 10 m (Bands 2, 3, 4 and 8) and 20 m (Bands 5, 6, 7, 8A, 11 and 12) resolution were used in the study. First we applied atmospheric and terrain correction using ESA’s Sen2Cor software [33]. Secondly we resampled all bands to 10 m resolution using bicubic interpolation (see Figure 2).
2.2.3. Ancillary Data
Other studies [34,35,36] have successfully used ancillary data to boost classification accuracies. Ancillary data used in this study was: elevation (from 1 arc-second SRTM), slope (derived from 1 arc-second SRTM) and distance to population. A 10 m resolution raster map was produced using Quantum GIS (QGIS) [37] from shapefiles of village location provided by the Ministry of Agriculture and Rural Development (MARD), with distance to population for each shapefile defined as the linear distance from the centre of the village to the centre of the forest shapefile.
Across the study area plantation covered 44,000 ha across 11809 shapefiles. Natural forest covered 170,000 ha across 9365 shapefiles. Natural forest is typically found on higher, steeper, more remote terrain (mean elevation, mean slope and distance to nearest village were 310 m, 18° and 2930 m respectively) compared to plantation forest (80 m, 8° and 1620 m).
2.3. Methodology
2.3.1. Time-Series
It was important to get a better idea of what vegetation indices would be most helpful in distinguishing plantation and natural forest. We were also interested in how the age of the plantation affects radar backscatter, spectral bands and classification accuracy. We therefore produced a time series of the S-1 and S-2 imagery of the study area, ranging in date from 27 February 2015 to 24 June 2020 for S-1 and from 10 August 2015 to 24 June 2020 for S-2. For the S-1 time-series we used 34 descending images, and for the S-2 time-series we used 22 S-2 images.
We used S-2 RGB (Red-Green-Blue, comprising S-2 bands B4, B3 and B2) imagery to select 10 plantation areas that were harvested between 6 April 2016 and 6 May 2016 and for these areas computed mean band values for all the S-1 and S-2 images. Acacia harvesting is obvious and unmistakable in the visible wavelengths. To act as a control, we also computed mean band values for 10 nearby natural forest areas. To act as a further control we selected 5 areas of natural forest and 5 areas of nearby acacia plantation that were not harvested in our study period of March 2015–June 2020: these acacia areas were rare examples of long-rotation (10 year) acacia plantation, having been last harvested in 2010.
In total, therefore, we have 4 time-series: an S-1 time-series and its control, and an S-2 time-series and its control. From these S-1 and S-2 time-series we can see how band values change in the years following harvesting, and which bands vary most between plantation and natural forest.
2.3.2. Sentinel-1 Processing
SAR imagery differs not only in intensity but also in texture (spatial variation). Texture is a quantative measurement of the relationships of pixels with neighbouring pixels, often used to improve the accuracy of land-use classification studies. We might expect the texture of a planted forest of regularly spaced trees of the same age to differ from that of natural forest. Accordingly, we chose the most frequently used of the texture measures: the Grey-Level Co-Occurance Matrix (GLCM) [38], which describes the frequency with which different pixel intensity values occur in an image. The following GLCM textural features were computed: Contrast, Dissimilarity, Homogeneity, Angular Second Moment, Energy, Maximum Probability, Entropy, GLCM Mean, GLCM Variance and GLCM Correlation. These textural features are useful in improving classification accuracies by extracting intensity variations using the values of neighbouring pixels. These features were calculated for all images and both polarisations (VV and VH) for all angles, with a window size of 9 × 9, 32 quantization levels and a pixel displacement of 1. Choice of window size can be important in producing the most useful texture measure. Two forest classification studies [39,40] found larger window sizes gave the best classification performance. Further, it has been suggested [41] that while small window sizes are better-suited to heterogeneous environments with high local variance, larger window sizes are appropriate for more homogenous areas. Given our study area consists largely of thick and uniform canopy cover we therefore decided a large (9 × 9) window size was the most appropriate choice. All Sentinel pre-processing was carried out using the European Space Agency (ESA) SNAP software [42].
Four radar indices were also computed: the normalised difference of the bands (NDI)
And the Cross ratio (CR) of co- and cross-polarised backscatter
These indices have been proved to be effective in earlier work classifying plantation and natural forest [23,43,44]. Further, we used a form of the radar vegetation index (RVI) [45] modified for use with vertically polarised Sentinel-1 data
Here higher values indicate higher vegetation presence.
Based on the results of the S-1 time-series produced (see Section 2.3.1 above), we also formulated a Radar Squared Index (RSI) to maximise the difference between plantation and natural forest:
2.3.3. S-2 Processing
We used the results from the time-series (see Section 2.3.1 above) to select 2 vegetation indices: first, the Normalised Burn Ratio (NBR) vegetation index:
and second, we formulated an index which should maximise the difference between plantation and natural forest throughout the lifecycle: the simple ratio of the Short-Wave Infra-Red (SWIR) band to the red band (SWIR-Red ratio or SRR) [46]:
We also computed the ratio of the 10 bands of the summer and winter image. This gave us 10 ratios that we refer to as seasonal ratios: so that, for example, the seasonal ratio for Band 2 (Blue) is:
2.3.4. Random Forest
Random forest (RF) [47] is a popular and powerful machine learning technique that has been widely used for forest classification studies [48,49,50,51]. Advantages include its insensitivity to noise, and the ability to handle large numbers of input features, and to estimate the importance of these features. These qualities make it a good choice for multi-source input data, and its accuracy at land-use classification has generally been found to be roughly comparable [52,53,54,55] to competitors such as Support Vector Machine (SVM) [56] and Convolutional Neural Networks (CNN) [57]. Additionally, RF is relatively insensitive to the values of its free parameters, as opposed to CNN and SVM which require considerable fine-tuning, therefore making RF quick and easy-to-use.
We used an object-based approach (as opposed to a pixel-based classification), with the mean and standard deviation of the bands and their associated indices and textural measures within a forest polygon used for the analysis. We used RF to analyse the separability of two different land cover types, so that shapefiles were classified as either plantation, or natural forest. RF classification was carried out using scikit-learn package in Python [58].
The training set was composed of 15868 shapefiles, or 70% of total shapefile number, with the testing carried out on the remaining 30% (5306 shapefiles), as recommended by [59]. The number of trees built was set at 500 and the maximum number of features used in an individual tree was the square root of the total feature number. Feature importance was calculated by mean decrease impurity. The analysis was run in three separate cases: for S-1 on its own, for S-2 on its own and for S-1 and S-2 combined.
We report User’s Accuracy (how reliable is the map i.e. how often forest identified as, for example, plantation in our model is actually present on the ground), Producer’s Accuracy (how well is the situation on the ground mapped i.e. how often is say, plantation, on the ground correctly identified as such by our model) and Overall Accuracy (how often all our forests were identified correctly). We use a 2-proportion Z-test [60] to compare the proportions of correctly classified shapefiles between the pairs of interest: for example, comparing classification results using S-1 imagery and classification results using S-2 imagery. This tests the null hypothesis of no difference between the proportion of correctly classified shapefiles of each pair. Furthermore, we use McNemar’s test [61] for marginal homogeneity of the contingency table—in other words if the disagreements in classification between the 2 cases match. For both tests we report the χ2 value and associated p value, with a statistically significant difference defined at the 5% level.
2.3.5. Plantation Age
Landsat data was used to calculate the age of plantation stands in the study area. We downloaded all the Landsat 5, 7 and 8 images with cloud cover less than 70% for Path/Row 125/48 and 126/48 from January 2009 to February 2018: 72 Landsat-8, 136 Landsat 7 and 34 Landsat 5 images. For this portion of the paper, we selected the plantations in the mid-east of our study area, to the North and east of the KNT reserve, as they lie underneath the overlap of the Landsat image swaths, effectively doubling the coverage, as we get an image of the area from Path/Row 125/48, and then the following day an image from Path/Row 126/48. The inset map of Figure 1 shows the Landsat overlap where the plantation subset used for this section of the paper was located.
The ‘pixel-qa’ layer was used to remove cloud and cloud-shadow pixels. Since this layer frequently misses cloud, especially small isolated clouds, broken clouds and the edges of cloud banks, we also manually inspected the RGB bands of all these images and removed any clouds that were still present. The weak spot in our time-series was from mid-2011 to mid-2013, the period when Landsat-5 had finished and Landsat-8 was still not operational, leaving only imagery from the partially functional Landsat-7. The Normalised burn ratio (NBR) is the difference between NIR and SWIR reflectance divided by their sum (Equation (5)). A threshold value of NBR of below 0.25 was used to indicate plantation harvesting [62,63]. Landsat processing was carried out using Python.
Adjacent Landsat pixels that were classed as being harvested in the same year were grouped together into patches, and the patch boundaries converted into shapefiles, with the time since the most recent harvest used as the age of each shapefile. The shapefiles were classified into 6 groups: <6 Months, 6 Months-1 Year, 1–2 Years, 2–3 Years, 3–5 Years and 5–9 Years. The median band and derived indices were calculated using the 15th February 2018 Sentinel-2 image and the 11th February 2018 Sentinel-1 image for all shapefiles over 250 m2 in area. The Random Forest classification was then carried out for S-1, S-2 and S-1 and S-2 combined.
3. Results
3.1. Time-Series
3.1.1. Time-Series–Sentinel-1
Harvest causes a significant reduction in backscatter, with mean ± standard deviation values for the VH band falling from −12.1 ± 0.6 dB pre-harvest to −14.5 ± 1.2 dB immediately after harvest (see Figure 3). Similarly, for the VV band, values fell from −6.9 ± 0.7 dB to −8.6 ± 1.2 dB. For both bands the value immediately post-harvest is about a third of the value in the natural forest areas. In distinguishing plantation from natural forest the VV band should be more important than the VH throughout the lifecycle, with the exception of immediately following harvest, when both VH and VV backscatter is significantly lower than for natural forest.
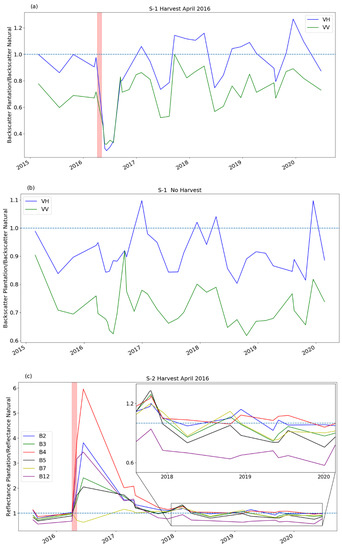
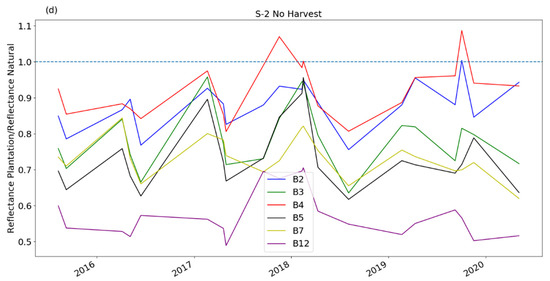
Figure 3.
A time series from 2015 to 2020 showing the ratio of the mean plantation band values to the mean natural forest band values for a group of plantations harvested in April 2016 (a,c) and a control group that was not harvested in the study period (b,d), for both Sentinel-1 (a,b) and Sentinel-2 (c,d). Shaded red vertical column shows period in which the selected plantations were harvested. For clarity we do not show all the S-2 bands: only the visual bands (blue (B2), green (B3) and red (B4)), two Near Infra-red (NIR) bands (B5 and B7) and a short-wave infrared (SWIR) band (B12) are shown. The other NIR bands (B6, B8, B8A) behave similarly to B7. The other SWIR band (B11) behaves similarly to B12.
3.1.2. Time-Series—Sentinel-2
Harvest causes an increase in visual and SWIR bands, which slowly declines as the plantation darkens as it gets older (Figure 3). The larger difference in the visual band ratio between the summer months (0.65 to 0.75) compared to the winter months (0.85 to 0.95) (Figure 3d), suggest that plantations are more distinct from natural forest in the summer months. This suggests a higher classification accuracy will be achieved from summer images compared to winter images in the Random Forest analysis. The shift in the ratio between summer and winter is driven by a greater increase in the reflectance of the natural forest band values than plantation forest in the summer.
3.2. Natural Forest and Plantation Classification Accuracy
The confusion matrices for selected pre-processing and classification steps can be seen in Table 1. Figure 4 shows the top 10 features for selected images and pre-processing steps. Figure 5 gives a map of the RF classified shapefiles.

Table 1.
Confusion matrices for (a) Sentinel-1 only (b) Sentinel 2 only and (c) Sentinel 1 and 2 combined Random Forest classifications of natural and plantation forest. The bold text denotes correct classifications and the overall accuracy.
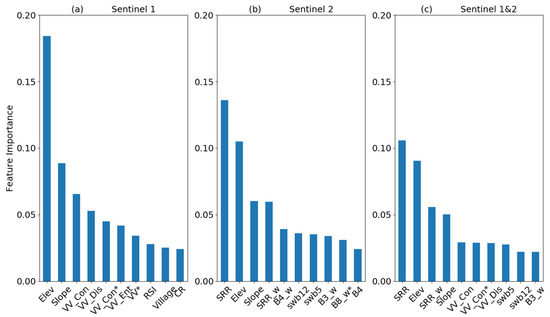
Figure 4.
Bands contribution for Random Forest classification (top 10 features shown) for (a) Sentinel-1 only, (b) Sentinel-2 only (c) Sentinel-1 and 2 combined. Abbreviations as follows: Elev—Elevation, Dis—Dissimilarity, Con—Contrast, Homo—Homogeneity, Ent—Entropy, Corr—Correlation, Var—Variance, NDI—Normalised Difference Index, CR—Cross Ratio., wsb is ratio of winter and summer bands. Underscore indicates GLCM feature for S-1 or winter image for S-2. For both S-1 and S-2 asterix * indicates standard deviation of given feature.
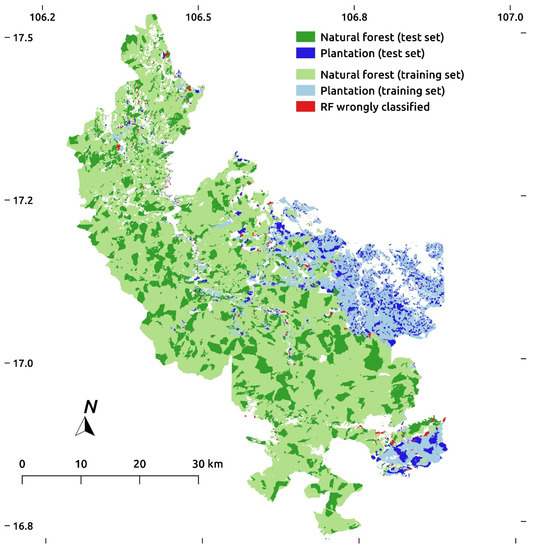
Figure 5.
Random Forest (RF) classification using Sentinel-2 images and ancillary data of 5306 acacia plantation and natural forest shapefiles across the study area: these shapefiles comprise the test set, with the remaining 15868 shapefiles used for training. Red shapefiles indicate misclassification.
3.2.1. Natural Forest and Plantation Classification Accuracy: Sentinel-1
Backscatter intensity of both VH and VV bands (mean ± standard deviation) was lower for acacia plantation (−12.6 ± 1.1 dB and −7.22 ± 1.1 dB) than for natural forest (−12.2 ± 0.8 dB and −6.22 ± 0.93 dB). Random forest classification was largely successful in distinguishing plantation from natural forest, with user’s and producer’s accuracies of greater than 84% (Table 1(a)). Use of GLCM features, ancillary data and derived radar band indices was essential, as using just the VV and VH bands on their own gave an overall accuracy of just 77%. For comparison, the use of ancillary data (elevation, slope and distance to village) on its own gave an overall accuracy of 84.4%. This heavy reliance on ancillary data, with elevation and slope the most important features (Figure 4), meant that removal of ancillary data from the full S-1 RF model resulted in a significant fall in overall accuracy to about 80% (2-proportion z-test and McNemar’s test with χ2 = 82 and χ2 = 166 respectively; both p < 1 × 10⁻¹⁹). The worst performing features were overwhelmingly the GLCM textures of the VH band, with 14 of the 15 worst performing features belonging to this category.
3.2.2. Random Forest: Sentinel-2
Sentinel-2 had greater accuracy than S-1, with both user’s and producer’s accuracies greater than 90% (Table 1(b)). A 2-proportion z-test and McNemar’s test found the difference in accuracy between S-1 and S-2 classifications to be highly significant (χ2 = 87 and χ2 = 136 respectively; both p < 1×10⁻²⁰). Accuracy for the winter image and ancillary data was 91%, while accuracy for the summer image and ancillary data was 91.2% (no significant difference for 2-proportion z-test and McNemar’s test). The combined accuracy for winter, summer and ancillary data was 92.5%. This is significantly higher than for the summer image on its own (2 proportion z-test χ2 = 7.8, p = 0.005; McNemar’s test χ2 = 18.9, p = 1 × 10⁻⁵).
The SWIR-red ratio (SRR) was the most highly rated feature, followed by elevation and slope (Figure 4). Accuracy for the combined winter and summer images without ancillary data was 91.7%. This reduction was not significant in the 2 proportion z-test (χ2 = 2.7, p = 0.1) but was significant with the McNemar’s test (χ2 = 18, p = 1 × 10⁻⁵). The significant result for McNemar’s test results from the number of cases of natural forest wrongly classified as plantation rising more than the number of cases with plantation wrongly classified as natural forest. Overall, Sentinel-2’s reliance on ancillary data is considerably lower than for S-1. Of the bands, the red band (B4) performed best: presumably because the very fast turnover of acacia plantation means that a large fraction of acacia plantation area was just harvested, a time when the red band could be up to 6 times brighter than natural forest.
RF classification of both S-1 and S-2 imagery slightly reduced accuracies by 0.2% compared to the S-2 images on their own (Table 1). However, there was no significant difference between the accuracies (2-proportion z-test and McNemar’s test). There was a long ‘tail’ of very poorly performing S-1 features, with the worst 24 performing features all being S-1, almost all derived GLCM textures of the VH band. Removal of the 40 worst performing features gave a small increase in classification accuracy, though this accuracy of 92.6% was only minutely above that achieved for S-2 imagery alone, and we have to conclude that the joint use of S-1 and S-2 data does at best little to improve accuracies. This accords with a previous study [64].
Wrongly classified shapefiles overwhelmingly occurred on the interface between natural forest and plantation, with large blocks of plantation or natural forest being classified correctly (Figure 5). S-2 imagery and ancillary data classified 41247.7 ha and 9231.1 ha as natural forest and plantation respectively, with the reference MARD data giving 41084.8 ha and 9394 ha as natural forest and plantation respectively.
3.3. Plantation Age
The plantation area of 13,000 ha was being principally managed on short rotation lengths (Figure 6). Consequently, a third of the area was less than a year old. A quarter was 4–9 years old and the remaining 40% was between 1–4 years old. A small area (3.5%) was 8 years old and 4.8% was 9 years old—these areas in fact began to be harvested just after the end of our study period (June 2020). The mean and median plantation stand ages were 2.9 and 2.5 years respectively.
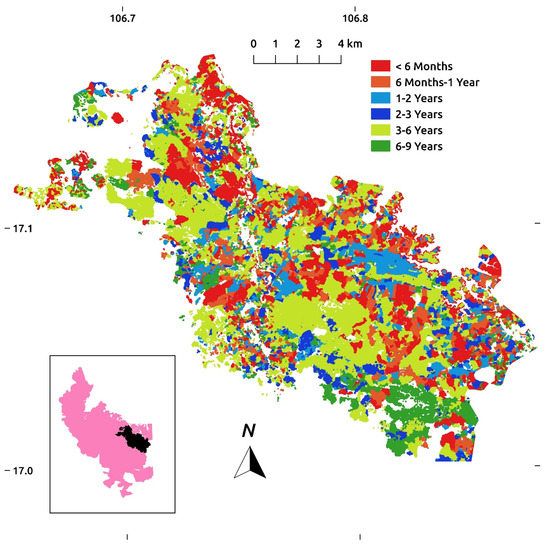
Figure 6.
Map of acacia plantation ages for February 2018 derived from Landsat time-series for a subset (see inset map) of our study area.
We found an overall accuracy of 69.9% in distinguishing between the 6 age classes of acacia plantation using the S-2 imagery (Table 2). S-1 imagery on its own was largely ineffective, with an overall accuracy of 48.8%, and was only able to distinguish recently harvested plantation (<1 year old) from older plantation, and was unable to distinguish between the different categories of older plantation. The combined use of S-1 and S-2 imagery together resulted in an overall accuracy of 66.8% (the 2 proportion z-test and McNemar’s test found no significant difference in accuracy with the S-2 classification).
Table 2.
Confusion matrix for Sentinel-2 classification of various ages of acacia plantation. Abbreviations: Mon. indicates Months and Yr indicates Year. The bold text denotes correct classifications and the overall accuracy.
The RF classification performed best on the younger age classes, and struggled with distinguishing the 3 oldest age classes (2–3 years, 3–5 years and 5–9 years) from each other: In particular 2–3 Year plantation and 5–9 Year was misattributed as 3–5 Year. In the combined S-1 and S-2 classification, S-2 bands and derived indices performed much better than S-1, comprising all 12 top performing features, with NBR, green band (B3) and red band (B4) in descending order of importance.
4. Discussion
4.1. Plantation and Natural Forest Classification
After harvest the cross-polarised signal (VH) increased within a year to rough parity with natural forest. The co-polarised signal (VV) also rapidly increases after harvest but to a backscatter intensity lower than natural forest. Given the thick canopy and minimal forest clearings in both adult acacia and natural forest, we expect the backscatter to be dominated by canopy return, with minimal surface scattering. Natural forest may possess a higher degree of structural variation at S-1 resolution scale, which would result in a higher backscatter than the smoother acacia plantation canopy. Alternatively, the large, oblong leaves (about 4 cm × 20 cm) [65] of acacia may result in greater attenuation of the signal compared with the more diverse leaf sizes of the natural forest (such as tree species from the families Litsea, Machilus, Lauraceae and Euphorbiaceae) [32].
We found an overall accuracy of 87% in distinguishing natural and plantation forest using Sentinel-1 imagery. This compares with a Malaysian study [17] that found an overall accuracy of 90% in distinguishing oil palm, acacia and rubber plantation from natural forest using S-1. Similarly a study in Indonesia [18] found accuracies of 86% using C-band SAR in distinguishing oil palm and acacia plantation from natural forest. Similarly, for S-2 our overall accuracy of 92.5% is similar to previous studies, with 90% accuracy achieved in mapping acacia plantations in Indonesia [66] using optical SPOT satellite (10–20 m resolution) imagery, and 86–88% in Vietnam [23] distinguishing natural forest and plantation (acacia, rubber and eucalyptus combined) using optical and radar data.
Mature plantation is darker than natural forest in the SWIR band, and most similar in the red band, a difference that led us to suggest as a vegetation index the simple ratio of the SWIR band to the red band (SRR index, see Section 2.2.2 above), with plantation having low values of this index compared to natural forest. Usefully, this difference between the two bands occurs throughout the harvest cycle, with both the red and the SWIR bands increasing markedly in value after harvest, so that recently harvested acacia areas should also appear as dark in a SRR image. SRR values should therefore be lower in plantation forest than natural forest throughout the harvest lifecycle. Commonly used NIR-SWIR vegetation indices such as NBR are less useful in this regard, showing up as dark in recently harvested areas and bright in mature plantation, and having a crossover period when plantation and natural forest are indistinguishable. However, NBR was the most important feature for distinguishing plantation age. Therefore, the SRR and NBR vegetation indices complement each other.
Our time series (Figure 3c,d) showed a greater difference in S-2 bands between plantation and natural forest in the summer than the winter months, but we found no significant difference between the S-2 classification accuracies for a summer image, taken towards the end of the dry season, and a winter image, taken shortly after the end of the monsoon. However, using both these images for classification did significantly raise accuracy. Therefore even for evergreen forests such as is found in our study area the use of multiple images can prove useful.
In the study area, on most of the flatter, lower-elevation sites close to villages, the natural forest has been overwhelmingly replaced by acacia plantation, while natural forest still dominates the steeper, higher elevation and more remote land. This meant that the classification accuracy using only ancillary data was extremely high at 84.4%, though the addition of S-1 or S-2 features did raise accuracy significantly by 3% and 8% respectively. Further, we note that without the ancillary features S-2 classification accuracy was reduced only slightly to 91.7%. Despite this, we note the possibility that slope and elevation may be being indirectly measured in the image values, and the applicability of our results to other areas where natural and plantation forest are more intermingled, and lie on similar terrain, should be tested further.
4.2. Plantation Age Classification
Our overall accuracy of 70% using S-2 compares favourably to an accuracy of 82.7% using Landsat on acacia plantations in Indonesia [67], as this study only classified into 2 categories of less than 5 years and greater than 5 years old. Similarly, a MODIS satellite study of rubber plantation age [68] found an accuracy of over 97%, but this was again classifying into only two categories (<4 years and ≥4 years old). A SAR and Landsat study of rubber plantation age [22] used 3 groups (<5, 6–10, and >10 years old) and found accuracies of between 80 and 90%.
A noted issue was the use of Landsat imagery to produce the plantation age shapefiles, and the use of higher resolution S-1 and S-2 imagery to classify these shapefiles. The coarser resolution of the Landsat imagery (30 m resolution) meant that the Sentinel pixels on the fringes of the shapefiles could belong to a different age class, or to a non-plantation land-use, a particularly serious problem for smaller plantation stands. To deal with this issue we excluded any shapefiles under 25 S-2 pixels (0.25 ha) in area from the classification, and we used the median value of the shapefile rather than the mean to reduce any distortion caused by these edge effects. Nonetheless, it seems very likely that the accuracy could be raised through the use of S-2 imagery to determine age, which will be increasingly possible as the Sentinel image archive becomes longer.
There is a possibility of using acacia’s short life-cycle to map plantation areas by using pixel time-series to track areas of harvesting, though this method would face two drawbacks. Firstly, it would be difficult to identify the small fraction of our study area that is managed on longer-length rotations. Secondly, while harvesting causes an obvious signal in both the optical and SAR bands, it is short-lived. This means that a dense time-series would be necessary, and for optical data it would be easy to miss an acacia harvest due to the endemic cloudiness of the study area, particularly during the monsoon season.
The Vietnamese government is encouraging plantation managers to increase the rotation length of plantations to increase the supply of higher quality timber for construction and furniture industries [69]. An improved supply of large diameter timber from forest plantations may also reduce illegal logging and degradation of natural forests [8,70]. Perceived risk from diseases, pests and storm damage are a barrier preventing land managers increasing rotation length and previous attempts to increase rotation length have had limited success [71]. Our analysis could be exploited to monitor and evaluate the success of policies aimed at increasing rotation length.
5. Conclusions
The conversion of natural forest to plantation is widespread across much of the tropics. Most remote sensed products of forest cover only report canopy cover, and can’t distinguish between natural forest and plantation. We explored whether Sentinel images could be used to distinguish plantation forests from natural forests in North-Central Vietnam.
For Sentinel-2, we found Random Forest classification accuracies of over 90%, with the ratio of the Short Wave Infra-Red band to the Red Band the most important feature. Similarly, for Sentinel-1, acacia plantations had a weak VV and a strong VH backscatter compared to natural forest for all the plantation’s lifecycle excepting the first six months following harvesting. At 87%, the classification accuracy using S-1 was significantly poorer than for S-2, though it still satisfactorily distinguished plantation from natural forest, and could be used in the absence of optical images. Elevation and slope were consistently highly rated features, and on their own obtained classification accuracies of 84%, reflecting the predominance of acacia plantation on the low-lying, flat terrain.
We found Random Forest classification of S-2 imagery was effective at distinguishing acacia plantation under 2 years old from older plantation, but struggled to distinguish between the older plantation stands. For both classifying plantation age, and distinguishing between natural forest and plantation, integration of Sentinel-1 and 2 did nothing to improve classification accuracy, with the result close to the S-2 classification.
Author Contributions
Conceptualization, B.S. and D.V.S.; Methodology, B.S.; Software, B.S.; Validation, B.S. and D.V.S.; Formal Analysis, B.S.; Investigation, B.S.; Resources, D.V.S.; Data Curation, B.S.; Writing—Original Draft Preparation, B.S., Writing—Review & Editing D.V.S.; Visualization, B.S.; Supervision, D.V.S.; Project Administration, D.V.S.; Funding Acquisition, D.V.S. All authors have read and agreed to the published version of the manuscript.
Funding
This work was supported by an Institutional Links grant, ID 216372155, under the Newton-Vietnam partnership. This grant is funded by the UK Department of Business, Energy and Industrial Strategy (BEIS) and delivered by the British Council. DVS acknowledges support from the Natural Environment Research Council (NERC) (Grant Numbers NE/M003574/1), a Philip Leverhulme Prize, and from the United Bank of Carbon (UBoC). This work received funding from the European Research Council (ERC) under the European Union’s Horizon 2020 research and innovation programme (Grant agreement No. 771492).
Institutional Review Board Statement
Not applicable.
Informed Consent Statement
Not applicable.
Data Availability Statement
Publicly available datasets were analyzed in this study. Sentinel data can be found here: https://scihub.copernicus.eu/ and Landsat data here: https://earthexplorer.usgs.gov/.
Conflicts of Interest
The authors declare no conflict of interest.
References
- Keenan, R.J.; Reams, G.A.; Achard, F.; de Freitas, J.V.; Grainger, A.; Lindquist, E. Dynamics of global forest area: Results from the FAO Global Forest Resources Assessment 2015. For. Ecol. Manag. 2015, 352, 9–20. [Google Scholar] [CrossRef]
- Meyfroidt, P.; Lambin, E.F. Forest transition in vietnam and displacement of deforestation abroad. Proc. Natl. Acad. Sci. USA 2009, 106, 16139–16144. [Google Scholar] [CrossRef] [PubMed]
- Hansen, M.C.; Potapov, P.V.; Moore, R.; Hancher, M.; Turubanova, S.A.; Tyukavina, A.; Thau, D.; Stehman, S.V.; Goetz, S.J.; Loveland, T.R.; et al. High-Resolution global maps of 21st-century forest cover change. Science 2013, 342, 850–853. [Google Scholar] [PubMed]
- Lewis, S.L.; Wheeler, C.E.; Mitchard, E.T.; Koch, A. Restoring Natural Forests is the Best Way to Remove Atmospheric Carbon. Nature 2019, 568, 25–28. [Google Scholar] [CrossRef]
- Horák, J.; Brestovanská, T.; Mladenović, S.; Kout, J.; Bogusch, P.; Halda, J.P.; Zasadil, P. Green Desert? Biodiversity patterns in forest plantations. For. Ecol. Manag. 2019, 433, 343–348. [Google Scholar] [CrossRef]
- Phillips, H.R.; Newbold, T.; Purvis, A. Land-Use effects on local biodiversity in tropical forests vary between continents. Biodivers. Conserv. 2017, 26, 2251–2270. [Google Scholar] [CrossRef]
- Barlow, J.; Gardner, T.A.; Araujo, I.S.; Ávila-Pires, T.C.; Bonaldo, A.B.; Costa, J.E.; Esposito, M.C.; Ferreira, L.V.; Hawes, J.; Hernandez, M.I. Quantifying the biodiversity value of tropical primary, secondary, and plantation forests. Proc. Natl. Acad. Sci. USA 2007, 104, 18555–18560. [Google Scholar]
- Ngo, D.T.; Van Le, A.; Le, H.T.; Stas, S.; Le, T.; Tran, H.; Pham, T.; Le, T.; Spracklen, B.; Langan, C. The potential for REDD+ to reduce forest degradation in vietnam. Environ. Res. Lett. 2020, 15, 07402. [Google Scholar] [CrossRef]
- Meyfroidt, P.; Lambin, E.F. Forest transition in vietnam and its environmental impacts. Glob. Chang. Biol. 2008, 14, 1319–1336. [Google Scholar] [CrossRef]
- Nambiar, E.S.; Harwood, C.E.; Kien, N.D. Acacia plantations in vietnam: Research and knowledge application to secure a sustainable future. South. For. A J. For. Sci. 2015, 77, 1–10. [Google Scholar]
- Spracklen, B.D.; Spracklen, D.V. Old-Growth forest disturbance in the ukrainian carpathians. Forests 2020, 11, 151. [Google Scholar] [CrossRef]
- Omar, H.; Misman, M.A.; Kassim, A.R. Synergetic of PALSAR-2 and Sentinel-1A SAR polarimetry for retrieving aboveground biomass in dipterocarp forest of Malaysia. Appl. Sci. 2017, 7, 675. [Google Scholar] [CrossRef]
- Huang, X.; Ziniti, B.; Torbick, N.; Ducey, M.J. Assessment of Forest above Ground Biomass Estimation Using Multi-Temporal C-Band Sentinel-1 and Polarimetric L-Band PALSAR-2 Data. Remote Sens. 2018, 10, 1424. [Google Scholar] [CrossRef]
- Li, Z.; Fox, J.M. Rubber tree distribution mapping in Northeast Thailand. Int. J. Geosci. 2011, 2, 573. [Google Scholar] [CrossRef]
- Zhai, D.; Dong, J.; Cadisch, G.; Wang, M.; Kou, W.; Xu, J.; Xiao, X.; Abbas, S. Comparison of Pixel-and Object-Based approaches in phenology-based rubber plantation mapping in Fragmented Landscapes. Remote Sens. 2018, 10, 44. [Google Scholar] [CrossRef]
- Lazecky, M.; Lhota, S.; Penaz, T.; Klushina, D. Application of sentinel-1 satellite to identify oil palm plantations in balikpapan bay. In IOP Conference Series: Earth and Environmental Science; IOP Publishing: Bristol, UK, 2018; Volume 169, p. 012064. [Google Scholar]
- Miettinen, J.; Liew, S.C.; Kwoh, L.K. Usability of Sentinel-1 Dual Polarization C-Band Data for Plantation Detection in Insular Southeast Asia. In Proceedings of the 36th Asian Conference on Remote Sensing (ACRS2015), Quezon City, Philippines, 19–23 October 2015; Citeseer: Princeton, NJ, USA, 2015; pp. 19–23. [Google Scholar]
- Dong, X.; Quegan, S.; Uryu, Y.; Zeng, T. Classifying Indonesian Plantation and Natural Forest Cover and Measuring Changes with C-and L-Band SAR Data. In Proceedings of the ESA’s Living Planet Symposium, Edinburgh, UK, 9–13 September 2013. [Google Scholar]
- Carolita, I.; Darmawan, S.; Permana, R.; Dirgahayu, D.; Wiratmoko, D.; Kartika, T.; Arifin, S. Comparison of Optic Landsat-8 and SAR Sentinel-1 in Oil Palm Monitoring, Case Study: Asahan, North Sumatera, Indonesia. In IOP Conference Series: Earth and Environmental Science; IOP Publishing: Bristol, UK, 2019; Volume 280, p. 012015. [Google Scholar]
- Poortinga, A.; Tenneson, K.; Shapiro, A.; Nquyen, Q.; San Aung, K.; Chishtie, F.; Saah, D. Mapping Plantations in Myanmar by Fusing Landsat-8, Sentinel-2 and Sentinel-1 Data along with Systematic Error Quantification. Remote Sens. 2019, 11, 831. [Google Scholar]
- Dong, J.; Xiao, X.; Chen, B.; Torbick, N.; Jin, C.; Zhang, G.; Biradar, C. Mapping Deciduous Rubber Plantations through Integration of PALSAR and Multi-Temporal Landsat Imagery. Remote Sens. Environ. 2013, 134, 392–402. [Google Scholar] [CrossRef]
- Kou, W.; Xiao, X.; Dong, J.; Gan, S.; Zhai, D.; Zhang, G.; Qin, Y.; Li, L. Mapping deciduous rubber plantation areas and stand ages with PALSAR and landsat images. Remote Sens. 2015, 7, 1048–1073. [Google Scholar]
- Hoang, T.T.; Truong, V.T.; Hayashi, M.; Tadono, T.; Nasahara, K.N. New JAXA High-Resolution Land Use/Land cover map for vietnam aiming for natural forest and plantation forest monitoring. Remote Sens. 2020, 12, 2707. [Google Scholar]
- Huong, V.D.; Nambiar, E.K.; Hai, N.X.; Ha, K.M.; Dang, N.V. Sustainable management of acacia auriculiformis plantations for wood production over four successive rotations in South Vietnam. Forests 2020, 11, 550. [Google Scholar] [CrossRef]
- Ministry of Agriculture and Rural development (MARD). Approval of a Wood Production Management Plan for the Period 2014–2020; Ministry of Agriculture and Rural development (MARD): Hanoi, Vietnam, 2014.
- Dewar, R.C.; Cannell, M.G. Carbon Sequestration in the Trees, Products and Soils of Forest Plantations: An Analysis Using UK Examples. Tree Physiol. 1992, 11, 49–71. [Google Scholar] [CrossRef] [PubMed]
- Lugo, A.E. Comparison of tropical tree plantations with secondary forests of similar age: Ecological archives M062-001. Ecol. Monogr. 1992, 62, 1–41. [Google Scholar] [CrossRef]
- Sheldon, F.H.; Styring, A.; Hosner, P.A. Bird species richness in a bornean exotic tree plantation: A long-term perspective. Biol. Conserv. 2010, 143, 399–407. [Google Scholar] [CrossRef]
- Styring, A.R.; Ragai, R.; Unggang, J.; Stuebing, R.; Hosner, P.A.; Sheldon, F.H. Bird community assembly in bornean industrial tree plantations: Effects of forest age and structure. For. Ecol. Manag. 2011, 261, 531–544. [Google Scholar]
- Lung, N.N.; Quat, N.X.; Lien, A.P.D.T.V.; Que, A.P.D.N.D.; Van Con, A.P.D.T.; Ky, A.P.D.N.D.; Cam, L.V. Final Report on Forest Ecological Stratification in Vietnam; UN-REDD Program Vietnam: Hanoi, Vietnam, 2011. [Google Scholar]
- Ngo-Duc, T. Climate change in the coastal regions of Vietnam. In Coastal Disasters and Climate Change in Vietnam; Elsevier: Amsterdam, The Netherlands, 2014; pp. 175–198. [Google Scholar]
- Mahood, S.; Van Trần, H. The Biodiversity of Bac Huong Hoa Nature Reserve, Quang Tri Province, Vietnam; BirdLife International Vietnam Programme: Hanoi, Vietnam, 2008. [Google Scholar]
- Louis, J.; Debaecker, V.; Pflug, B.; Main-Knorn, M.; Bieniarz, J.; Mueller-Wilm, U.; Cadau, E.; Gascon, F. Sentinel-2 Sen2Cor: L2A Processor for Users. In Living Planet Symposium 2016; Spacebooks Online: Prague, Czech Republic, 2016; pp. 1–8. [Google Scholar]
- Rodriguez-Galiano, V.F.; Ghimire, B.; Rogan, J.; Chica-Olmo, M.; Rigol-Sanchez, J.P. An Assessment of the Effectiveness of a Random Forest Classifier for Land-Cover Classification. ISPRS J. Photogramm. Remote Sens. 2012, 67, 93–104. [Google Scholar] [CrossRef]
- Zimmermann, N.E.; Edwards, T.C.; Moisen, G.G.; Frescino, T.S.; Blackard, J.A. Remote sensing-based predictors improve distribution models of rare, early successional and broadleaf tree species in Utah. J. Appl. Ecol. 2007, 44, 1057–1067. [Google Scholar]
- Spracklen, B.D.; Spracklen, D.V. Identifying european old-growth forests using remote sensing: A study in the Ukrainian Carpathians. Forests 2019, 10, 127. [Google Scholar]
- QGIS. QGIS Geographic Information System; QGIS Association: Fribourg, Switzerland, 2021. [Google Scholar]
- Haralick, R.M. Statistical and structural approaches to texture. Proc. IEEE 1979, 67, 786–804. [Google Scholar]
- Coburn, C.A.; Roberts, A.C. A multiscale texture analysis procedure for improved forest stand classification. Int. J. Remote Sens. 2004, 25, 4287–4308. [Google Scholar] [CrossRef]
- Wang, H.; Zhao, Y.; Pu, R.; Zhang, Z. Mapping robinia pseudoacacia forest health conditions by using combined spectral, spatial, and textural information extracted from ikonos imagery and random forest classifier. Remote Sens. 2015, 7, 9020–9044. [Google Scholar]
- Rodriguez-Galiano, V.F.; Chica-Olmo, M.; Abarca-Hernandez, F.; Atkinson, P.M.; Jeganathan, C. Random forest classification of mediterranean land cover using multi-seasonal imagery and multi-seasonal texture. Remote Sens. Environ. 2012, 121, 93–107. [Google Scholar] [CrossRef]
- SNAP. ESA Sentinel Application Platform V6; European Space Agency (ESA): Paris, France, 2021. [Google Scholar]
- De Alban, J.D.T.; Connette, G.M.; Oswald, P.; Webb, E.L. Combined landsat and l-band sar data improves land cover classification and change detection in dynamic tropical landscapes. Remote Sens. 2018, 10, 306. [Google Scholar] [CrossRef]
- Sarzynski, T.; Giam, X.; Carrasco, L.; Lee, J.S.H. Combining radar and optical imagery to map oil palm plantations in Sumatra, Indonesia, using the google earth engine. Remote Sens. 2020, 12, 1220. [Google Scholar]
- Nasirzadehdizaji, R.; Balik Sanli, F.; Abdikan, S.; Cakir, Z.; Sekertekin, A.; Ustuner, M. Sensitivity analysis of multi-temporal sentinel-1 sar parameters to crop height and canopy coverage. Appl. Sci. 2019, 9, 655. [Google Scholar]
- Tonolli, S.; Dalponte, M.; Neteler, M.; Rodeghiero, M.; Vescovo, L.; Gianelle, D. Fusion of airborne LiDAR and satellite Multispectral data for the estimation of Timber Volume in the Southern Alps. Remote Sens. Environ. 2011, 115, 2486–2498. [Google Scholar] [CrossRef]
- Breiman, L. Random forests. Mach. Learn. 2001, 45, 5–32. [Google Scholar] [CrossRef]
- Immitzer, M.; Atzberger, C.; Koukal, T. Tree species classification with random forest using very high spatial resolution 8-band Worldview-2 Satellite data. Remote Sens. 2012, 4, 2661–2693. [Google Scholar]
- Nelson, M. Evaluating Multitemporal Sentinel-2 Data for Forest Mapping Using Random Forest; Stockholm University: Stockholm, Switzerland, 2017. [Google Scholar]
- Puletti, N.; Chianucci, F.; Castaldi, C. Use of Sentinel-2 for forest classification in mediterranean environments. Ann. Silvic. Res. 2017. [Google Scholar]
- Sheeren, D.; Fauvel, M.; Josipović, V.; Lopes, M.; Planque, C.; Willm, J.; Dejoux, J.-F. Tree species classification in temperate forests using formosat-2 satellite image time series. Remote Sens. 2016, 8, 734. [Google Scholar]
- Thanh Noi, P.; Kappas, M. Comparison of random forest, k-Nearest neighbor, and support vector machine classifiers for land cover classification using Sentinel-2 imagery. Sensors 2018, 18, 18. [Google Scholar]
- Abdi, A.M. Land cover and land use classification performance of machine learning algorithms in a boreal landscape using Sentinel-2 data. Giscience Remote Sens. 2020, 57, 1–20. [Google Scholar] [CrossRef]
- Mansaray, L.R.; Wang, F.; Huang, J.; Yang, L.; Kanu, A.S. Accuracies of support vector machine and random forest in rice mapping with Sentinel-1a, Landsat-8 and Sentinel-2a datasets. Geocarto Int. 2020, 35, 1088–1108. [Google Scholar] [CrossRef]
- Adam, E.; Mutanga, O.; Odindi, J.; Abdel-Rahman, E.M. Land-Use/Cover classification in a heterogeneous coastal landscape using rapideye imagery: Evaluating the performance of random forest and support vector machines classifiers. Int. J. Remote Sens. 2014, 35, 3440–3458. [Google Scholar] [CrossRef]
- Foody, G.M.; Mathur, A. A Relative evaluation of multiclass image classification by support vector machines. IEEE Trans. Geosci. Remote Sens. 2004, 42, 1335–1343. [Google Scholar] [CrossRef]
- Krizhevsky, A.; Sutskever, I.; Hinton, G.E. Imagenet classification with deep convolutional neural networks. Commun. ACM 2017, 60, 84–90. [Google Scholar]
- Pedregosa, F.; Varoquaux, G.; Gramfort, A.; Michel, V.; Thirion, B.; Grisel, O.; Blondel, M.; Prettenhofer, P.; Weiss, R.; Dubourg, V. Scikit-Learn: Machine learning in Python. J. Mach. Learn. Res. 2011, 12, 2825–2830. [Google Scholar]
- Adelabu, S.; Mutanga, O.; Adam, E. Testing the reliability and stability of the internal accuracy assessment of random forest for classifying tree defoliation levels using different validation methods. Geocarto Int. 2015, 30, 810–821. [Google Scholar] [CrossRef]
- Lachin, J.M. Introduction to sample size determination and power analysis for clinical trials. Control. Clin. Trials 1981, 2, 93–113. [Google Scholar]
- Dietterich, T.G. Approximate statistical tests for comparing supervised classification learning Algorithms. Neural Comput. 1998, 10, 1895–1923. [Google Scholar]
- White, J.C.; Saarinen, N.; Wulder, M.A.; Kankare, V.; Hermosilla, T.; Coops, N.C.; Holopainen, M.; Hyyppä, J.; Vastaranta, M. Assessing spectral measures of post-harvest forest recovery with field plot data. Int. J. Appl. Earth Obs. Geoinf. 2019, 80, 102–114. [Google Scholar]
- Haywood, A.; Verbesselt, J.; Baker, P.J. Mapping disturbance dynamics in wet sclerophyll forests using time series landsat. Int. Arch. Photogramm. Remote Sens. Spat. Inf. Sci. 2016, 41, 633–639. [Google Scholar]
- Attarchi, S.; Gloaguen, R. Classifying Complex Mountainous Forests with L-Band SAR and Landsat Data Integration: A Comparison among Different Machine Learning Methods in the Hyrcanian Forest. Remote Sens. 2014, 6, 3624–3647. [Google Scholar] [CrossRef]
- Sein, C.C.; Mitlöhner, R. Acacia Hybrid: Ecology and Silviculture in Vietnam; CIFOR: Bogor, Indonesia, 2011. [Google Scholar]
- Miettinen, J.; Hooijer, A.; Shi, C.; Tollenaar, D.; Vernimmen, R.; Liew, S.C.; Malins, C.; Page, S.E. Extent of Industrial Plantations on S Outheast A Sian Peatlands in 2010 with Analysis of Historical Expansion and Future Projections. GCB Bioenergy 2012, 4, 908–918. [Google Scholar] [CrossRef]
- Anuar, A.N.; Jusoh, I.; Suhaili, A.; Munir, M.B. Mapping vegetation cover of acacia mangium plantation by age. Trans. Sci. Technol. 2017, 4, 482–488. [Google Scholar]
- Li, Z.; Fox, J.M. Mapping rubber tree growth in mainland southeast asia using time-series MODIS 250 m NDVI and statistical data. Appl. Geogr. 2012, 32, 420–432. [Google Scholar]
- Maraseni, T.N.; Son, H.L.; Cockfield, G.; Duy, H.V.; Dai Nghia, T. Comparing the financial returns from acacia plantations with different plantation densities and rotation ages in vietnam. For. Policy Econ. 2017, 83, 80–87. [Google Scholar]
- Stas, S.M.; Le, T.C.; Tran, H.D.; Hoang, T.T.H.; van Kuijk, M.; Van Le, A.; Ngo, D.T.; van Oostrum, A.; Phillips, O.L.; Rutishauser, E. Logging intensity drives variability in carbon stocks in lowland forests in vietnam. For. Ecol. Manag. 2020, 460, 117863. [Google Scholar]
- Zhunusova, E.; Sen, L.T.H.; Schröder, J.-M.; Ziegler, S.; Dieter, M.; Günter, S. Smallholder decision-making on sawlog production: The case of acacia plantation owners in central vietnam. Forests 2019, 10, 969. [Google Scholar]


Publisher’s Note: MDPI stays neutral with regard to jurisdictional claims in published maps and institutional affiliations. |
© 2021 by the authors. Licensee MDPI, Basel, Switzerland. This article is an open access article distributed under the terms and conditions of the Creative Commons Attribution (CC BY) license (http://creativecommons.org/licenses/by/4.0/).