Mapping the Coastal Upwelling East of Taiwan Using Geostationary Satellite Data
Abstract
1. Introduction
2. Data and Methods
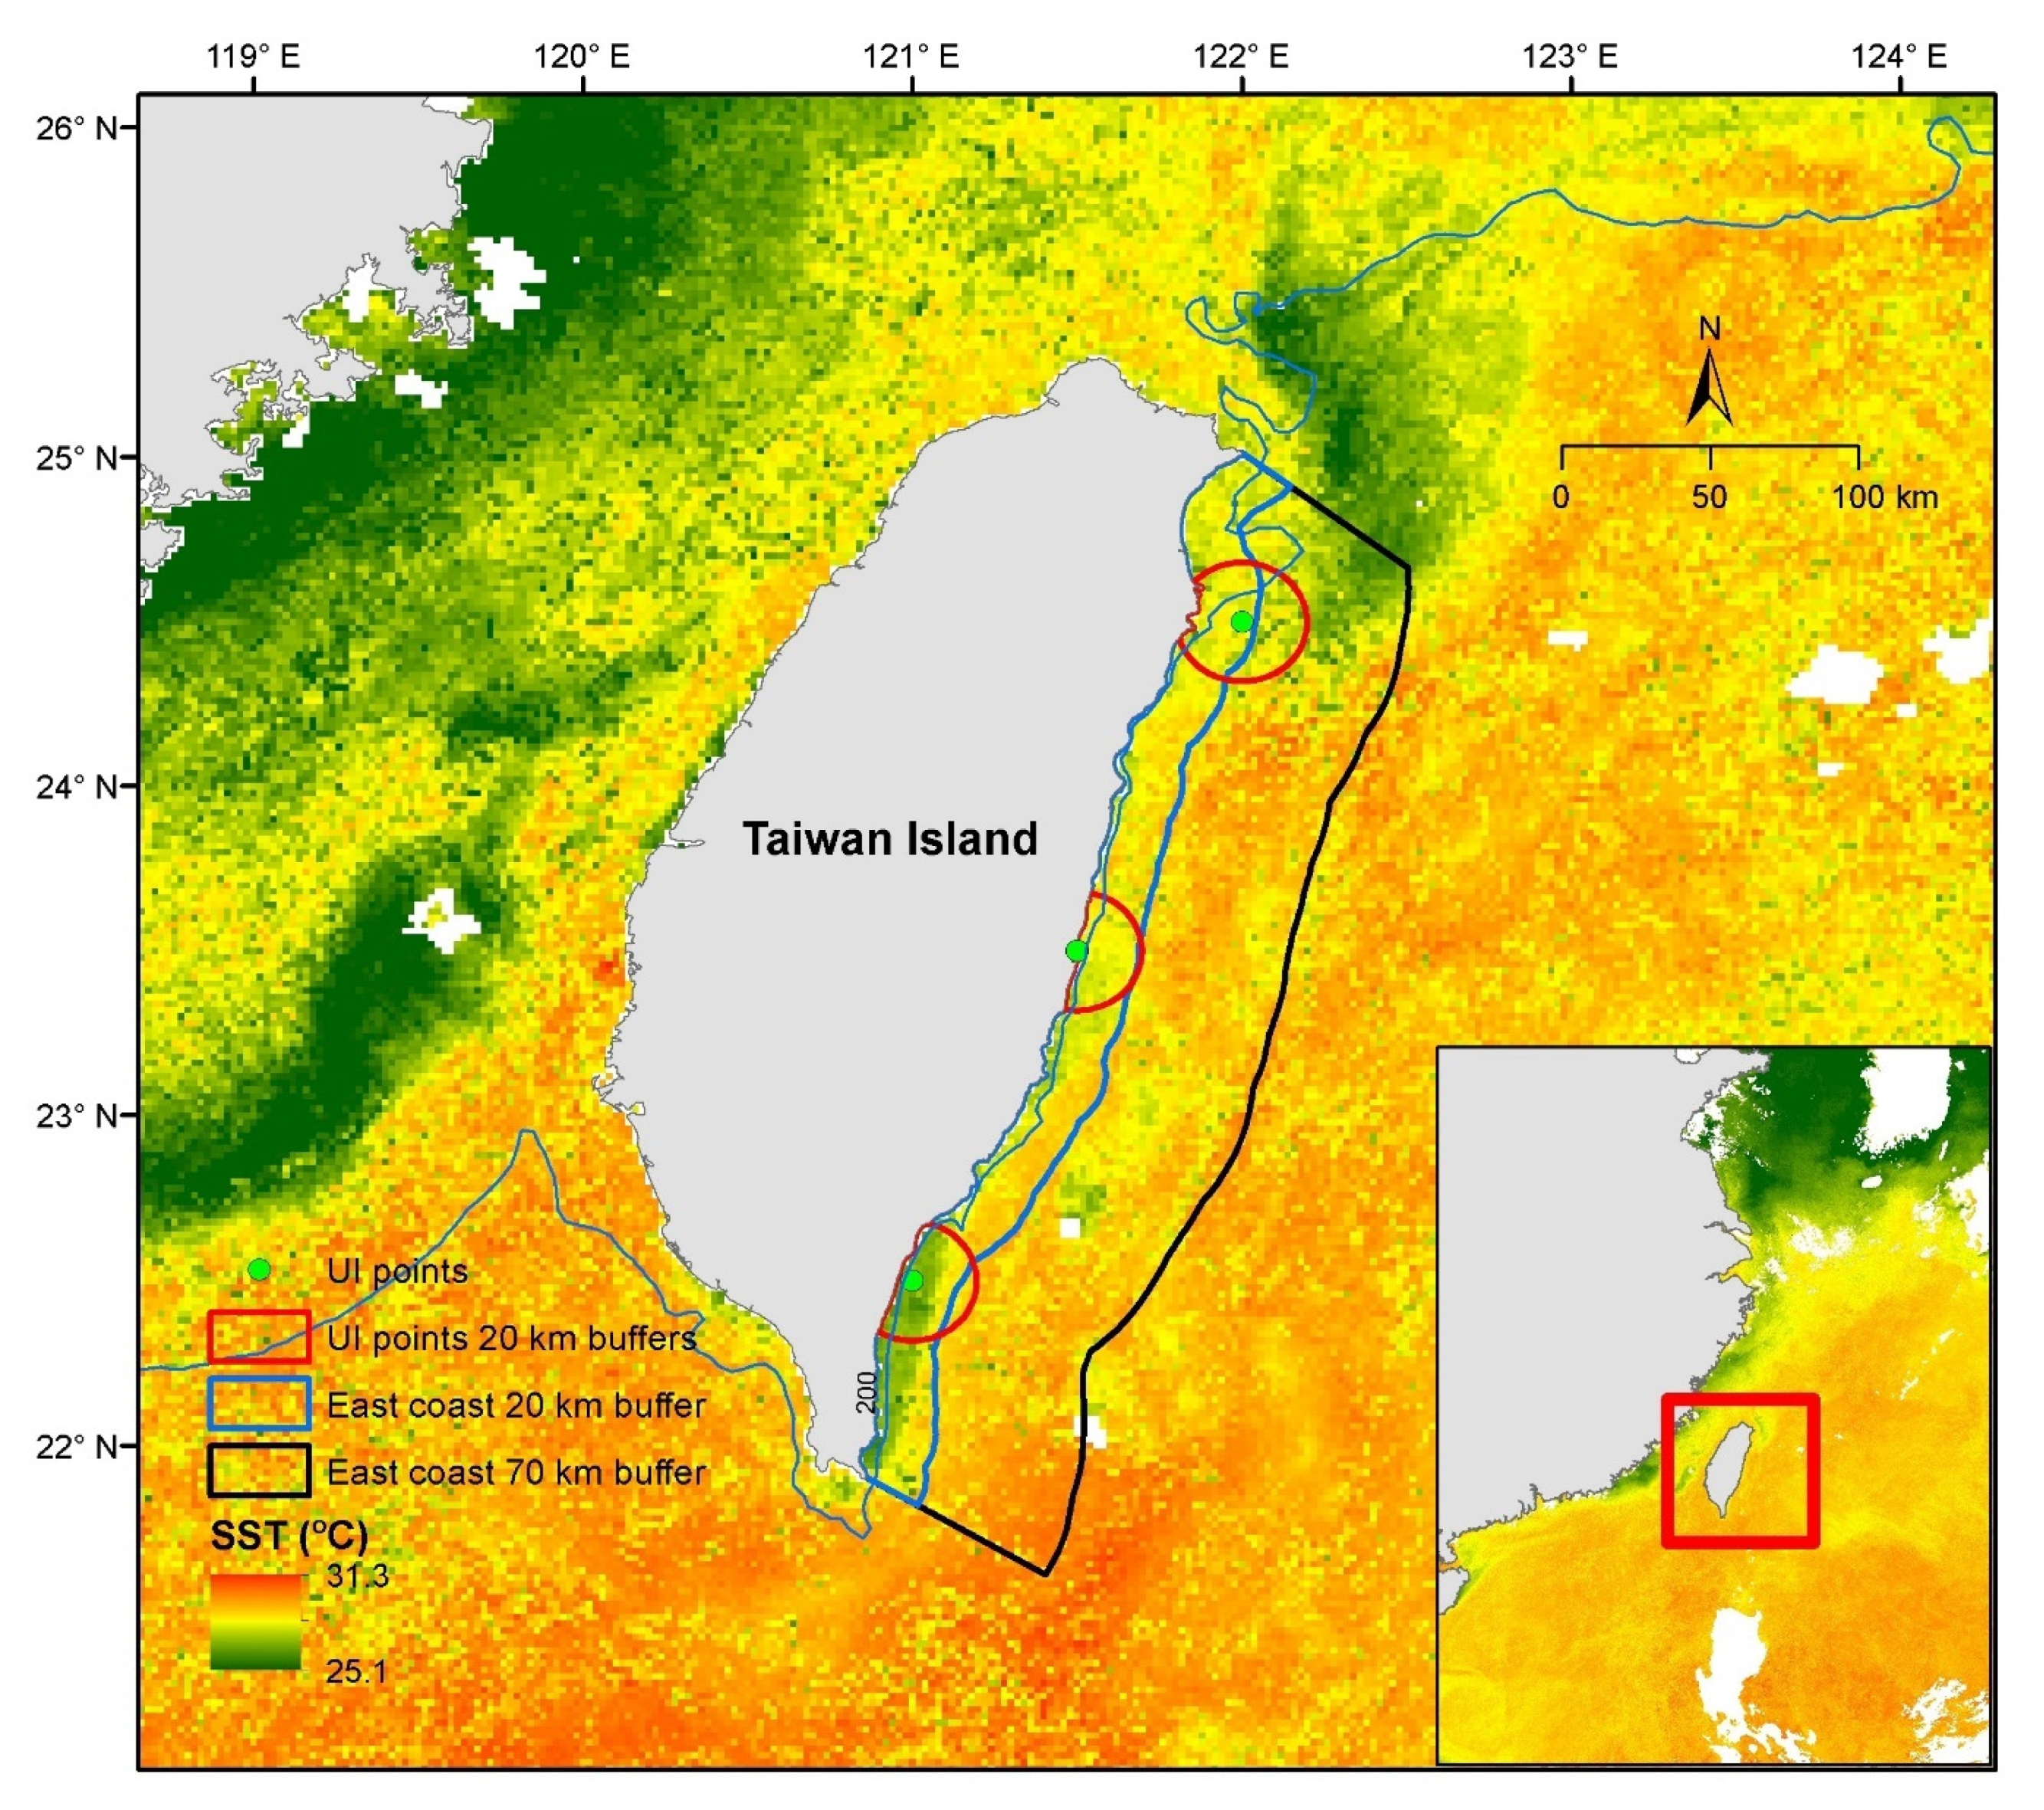
2.1. Study Area, Study Period, and Its Climate
2.2. Wind Data, Upwelling Index and Significant Upwelling-favorable Wind Events
- ≥5 days of positive UI, satisfying one of the following conditions:
- ≥5 days of consecutive positive UI;
- ≥3 days of consecutive positive UI, followed by 1 day of negative UI, then followed by ≥2 days of consecutive positive UI;
- ≥4 days of consecutive positive UI, followed by 2 days of negative UI, then followed by ≥3 days of consecutive positive UI;
- ≥5 days of consecutive positive UI, followed by 3 days of negative UI, then followed by ≥5 days of consecutive positive UI.
- The cumulative UI for the first five days ≥2.0 m2 s−1
2.3. Himawari-8 SST Data and Upwelling Mapping
2.4. Analyzing Upwelling Characteristics
3. Results
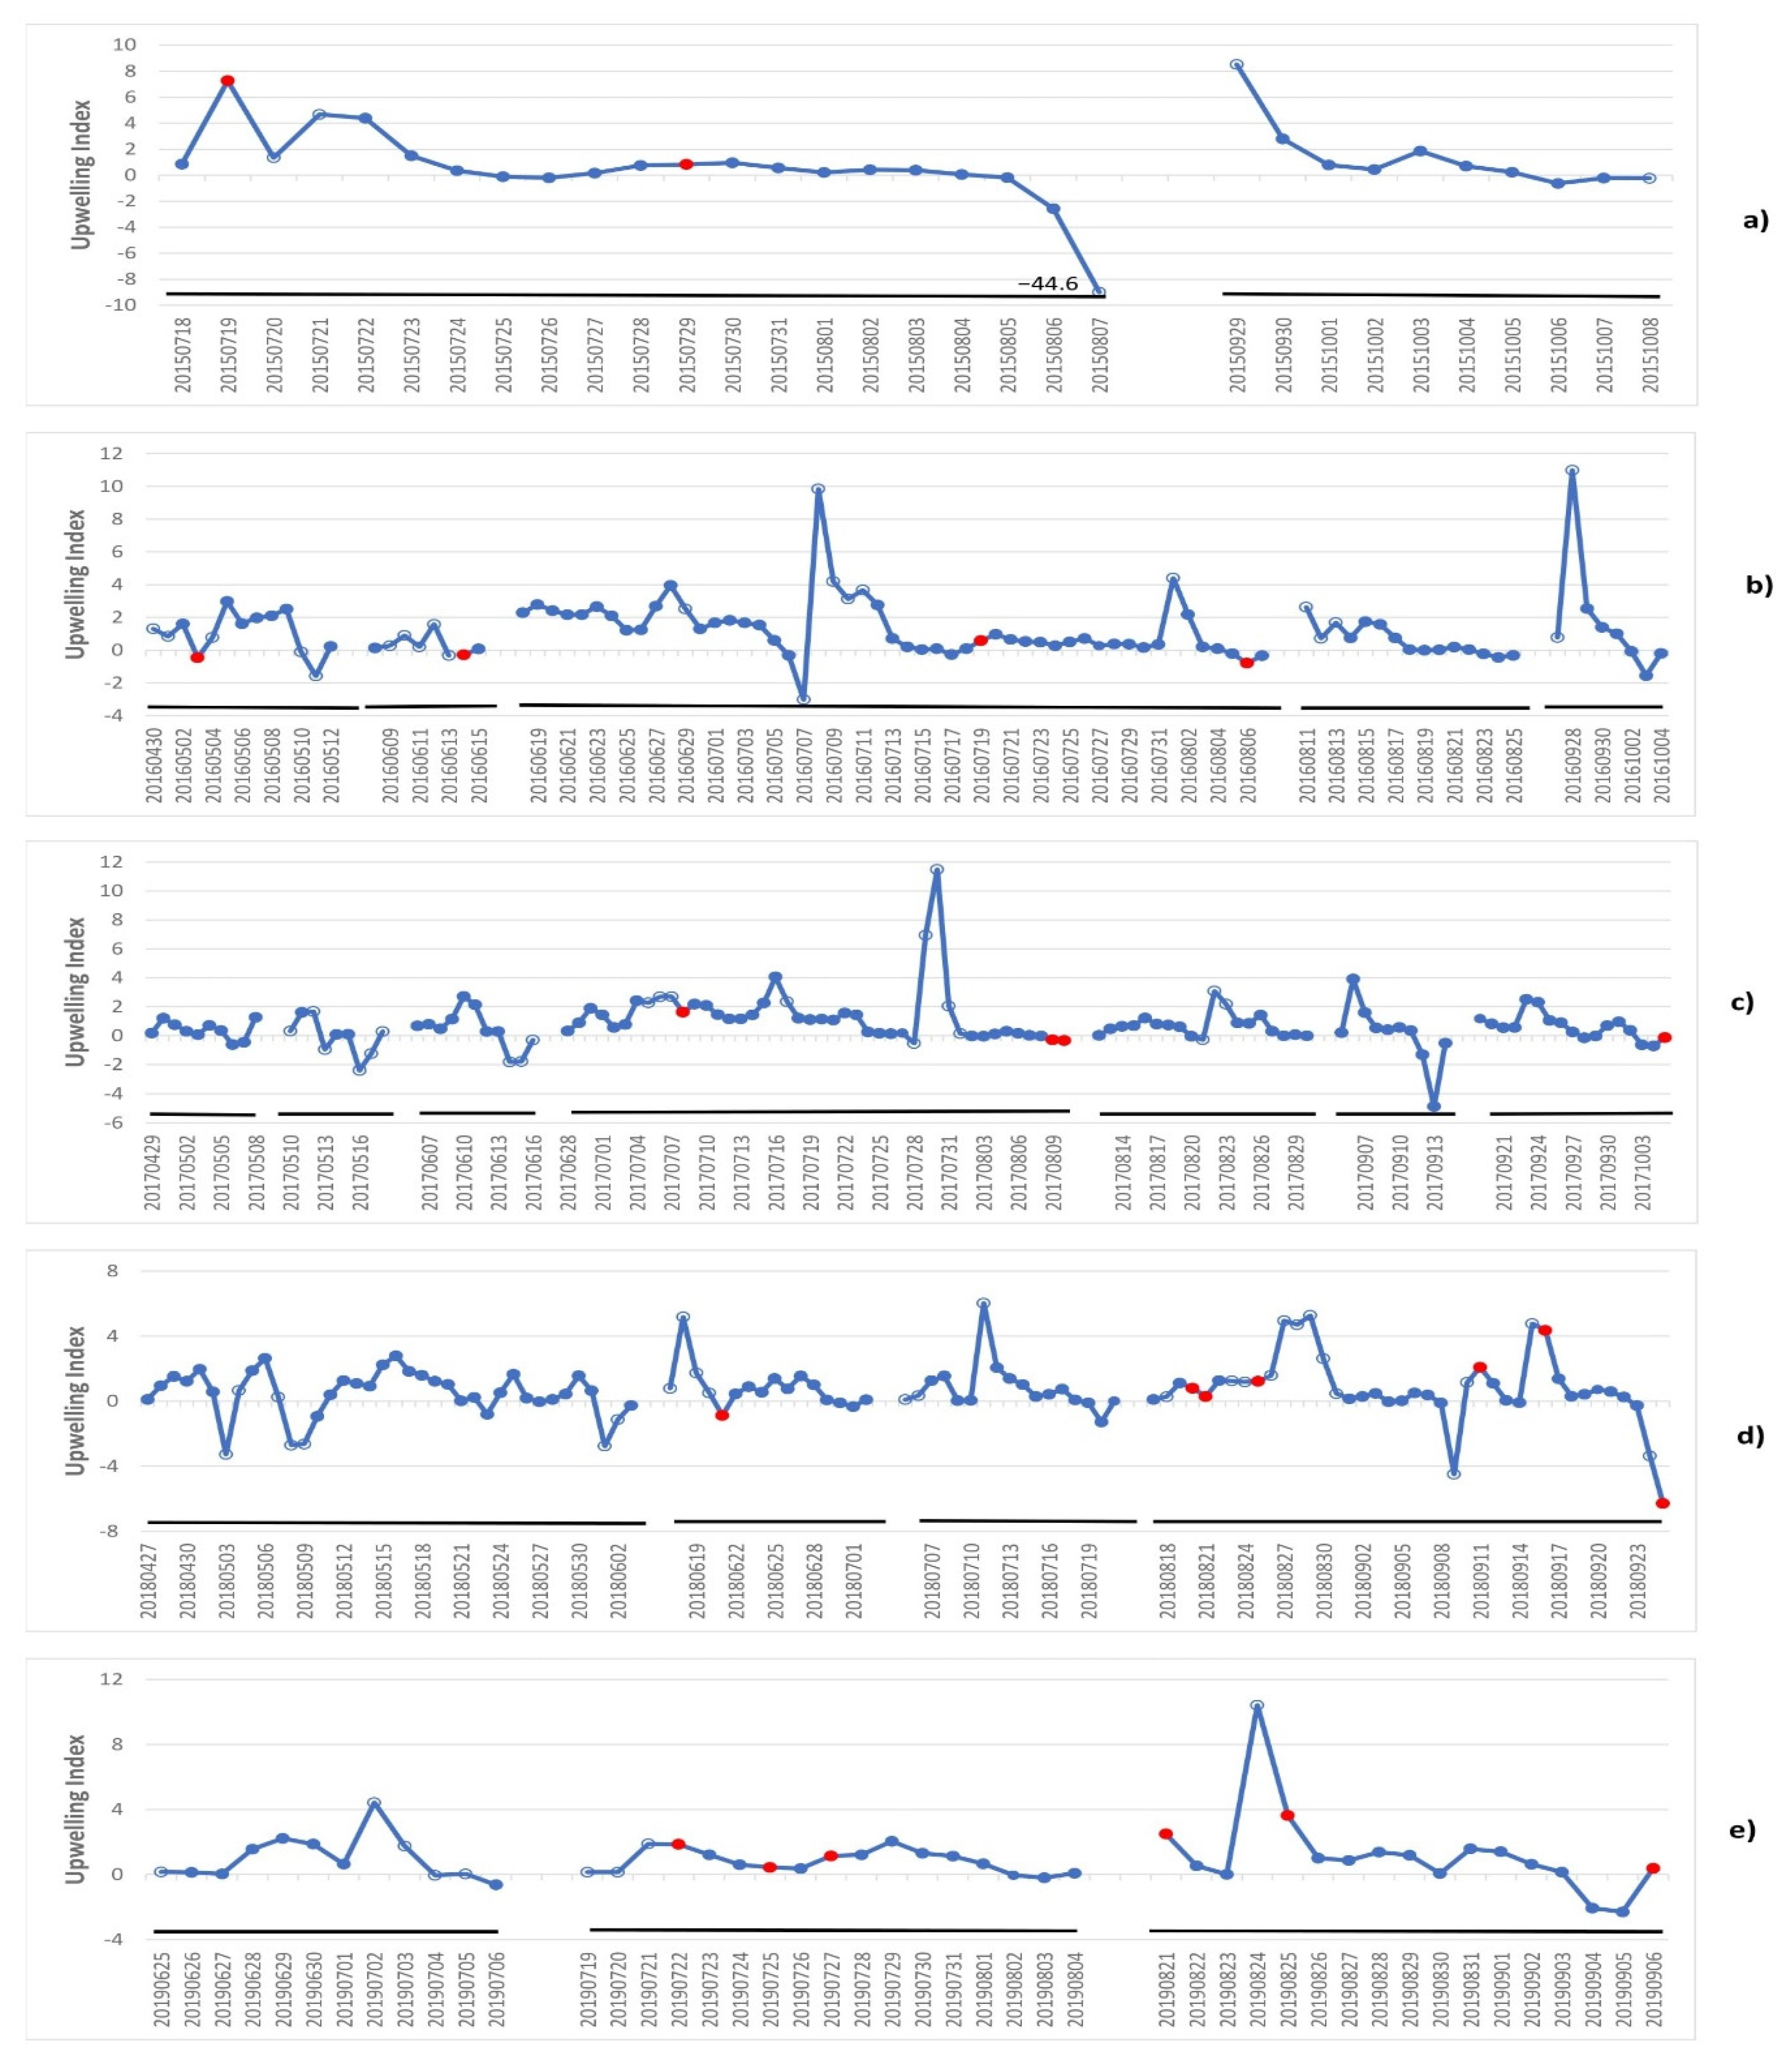
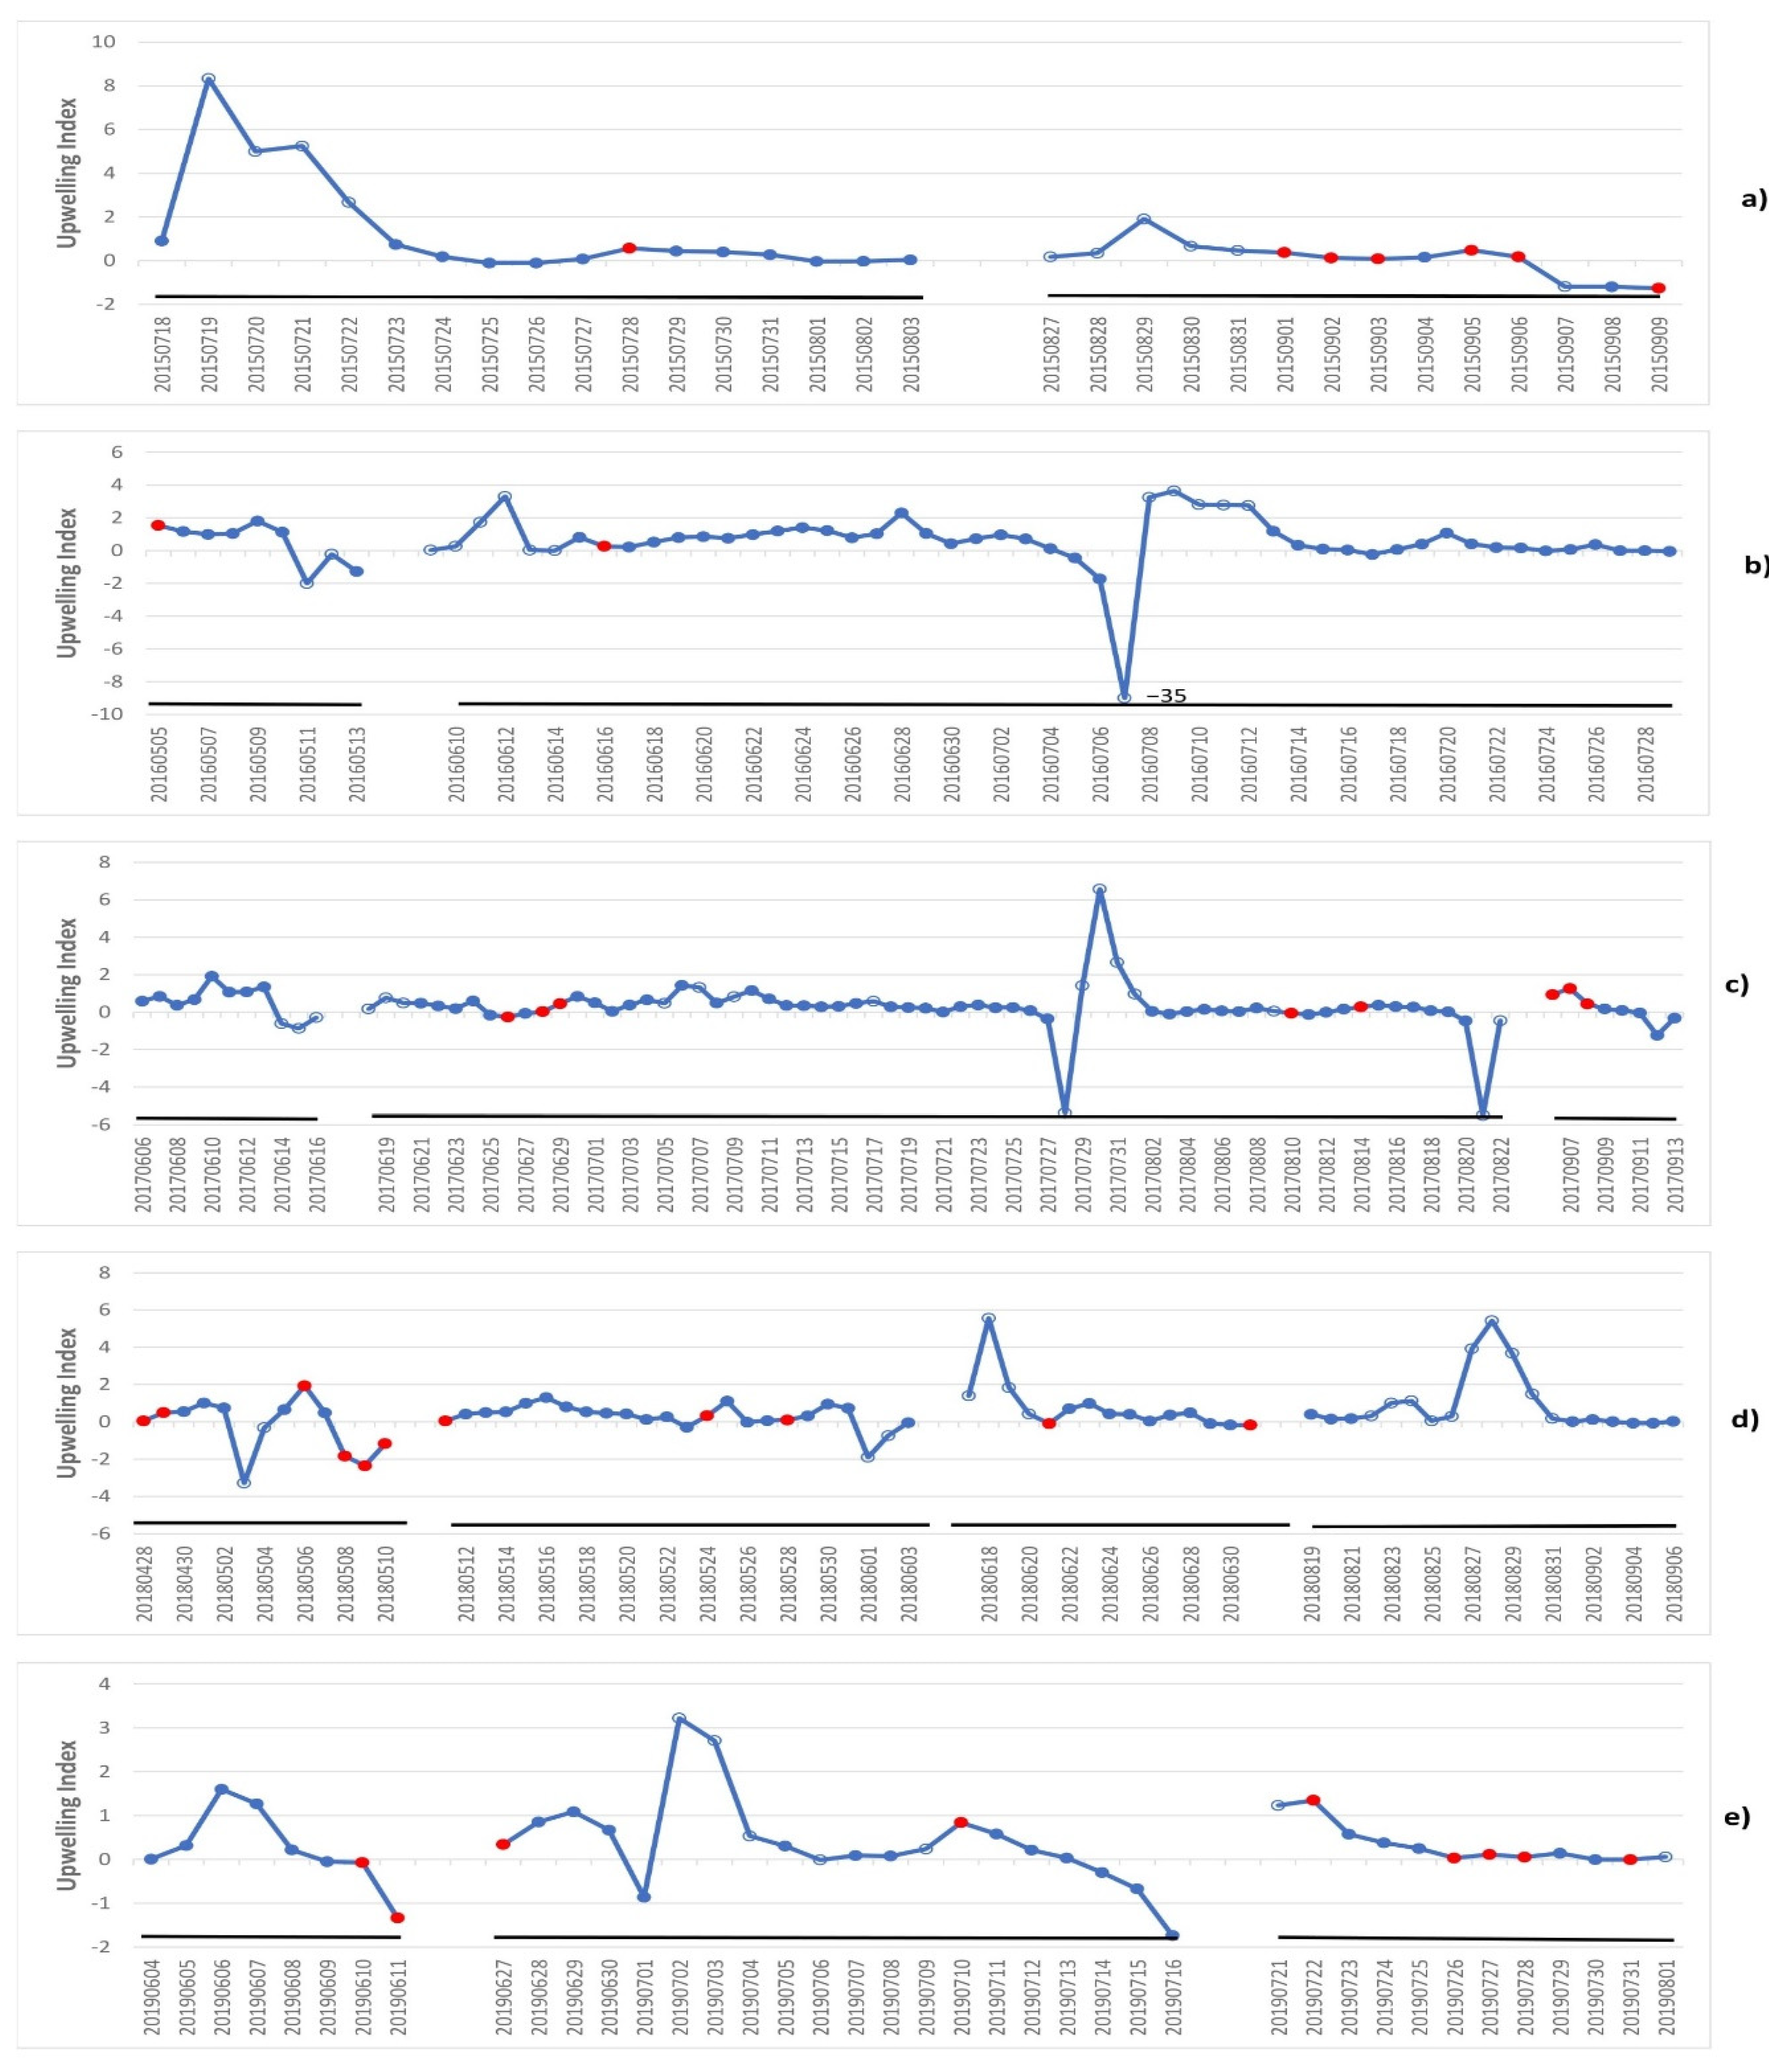
3.1. Coastal Upwelling with Significant Upwelling-Favorable Wind Events
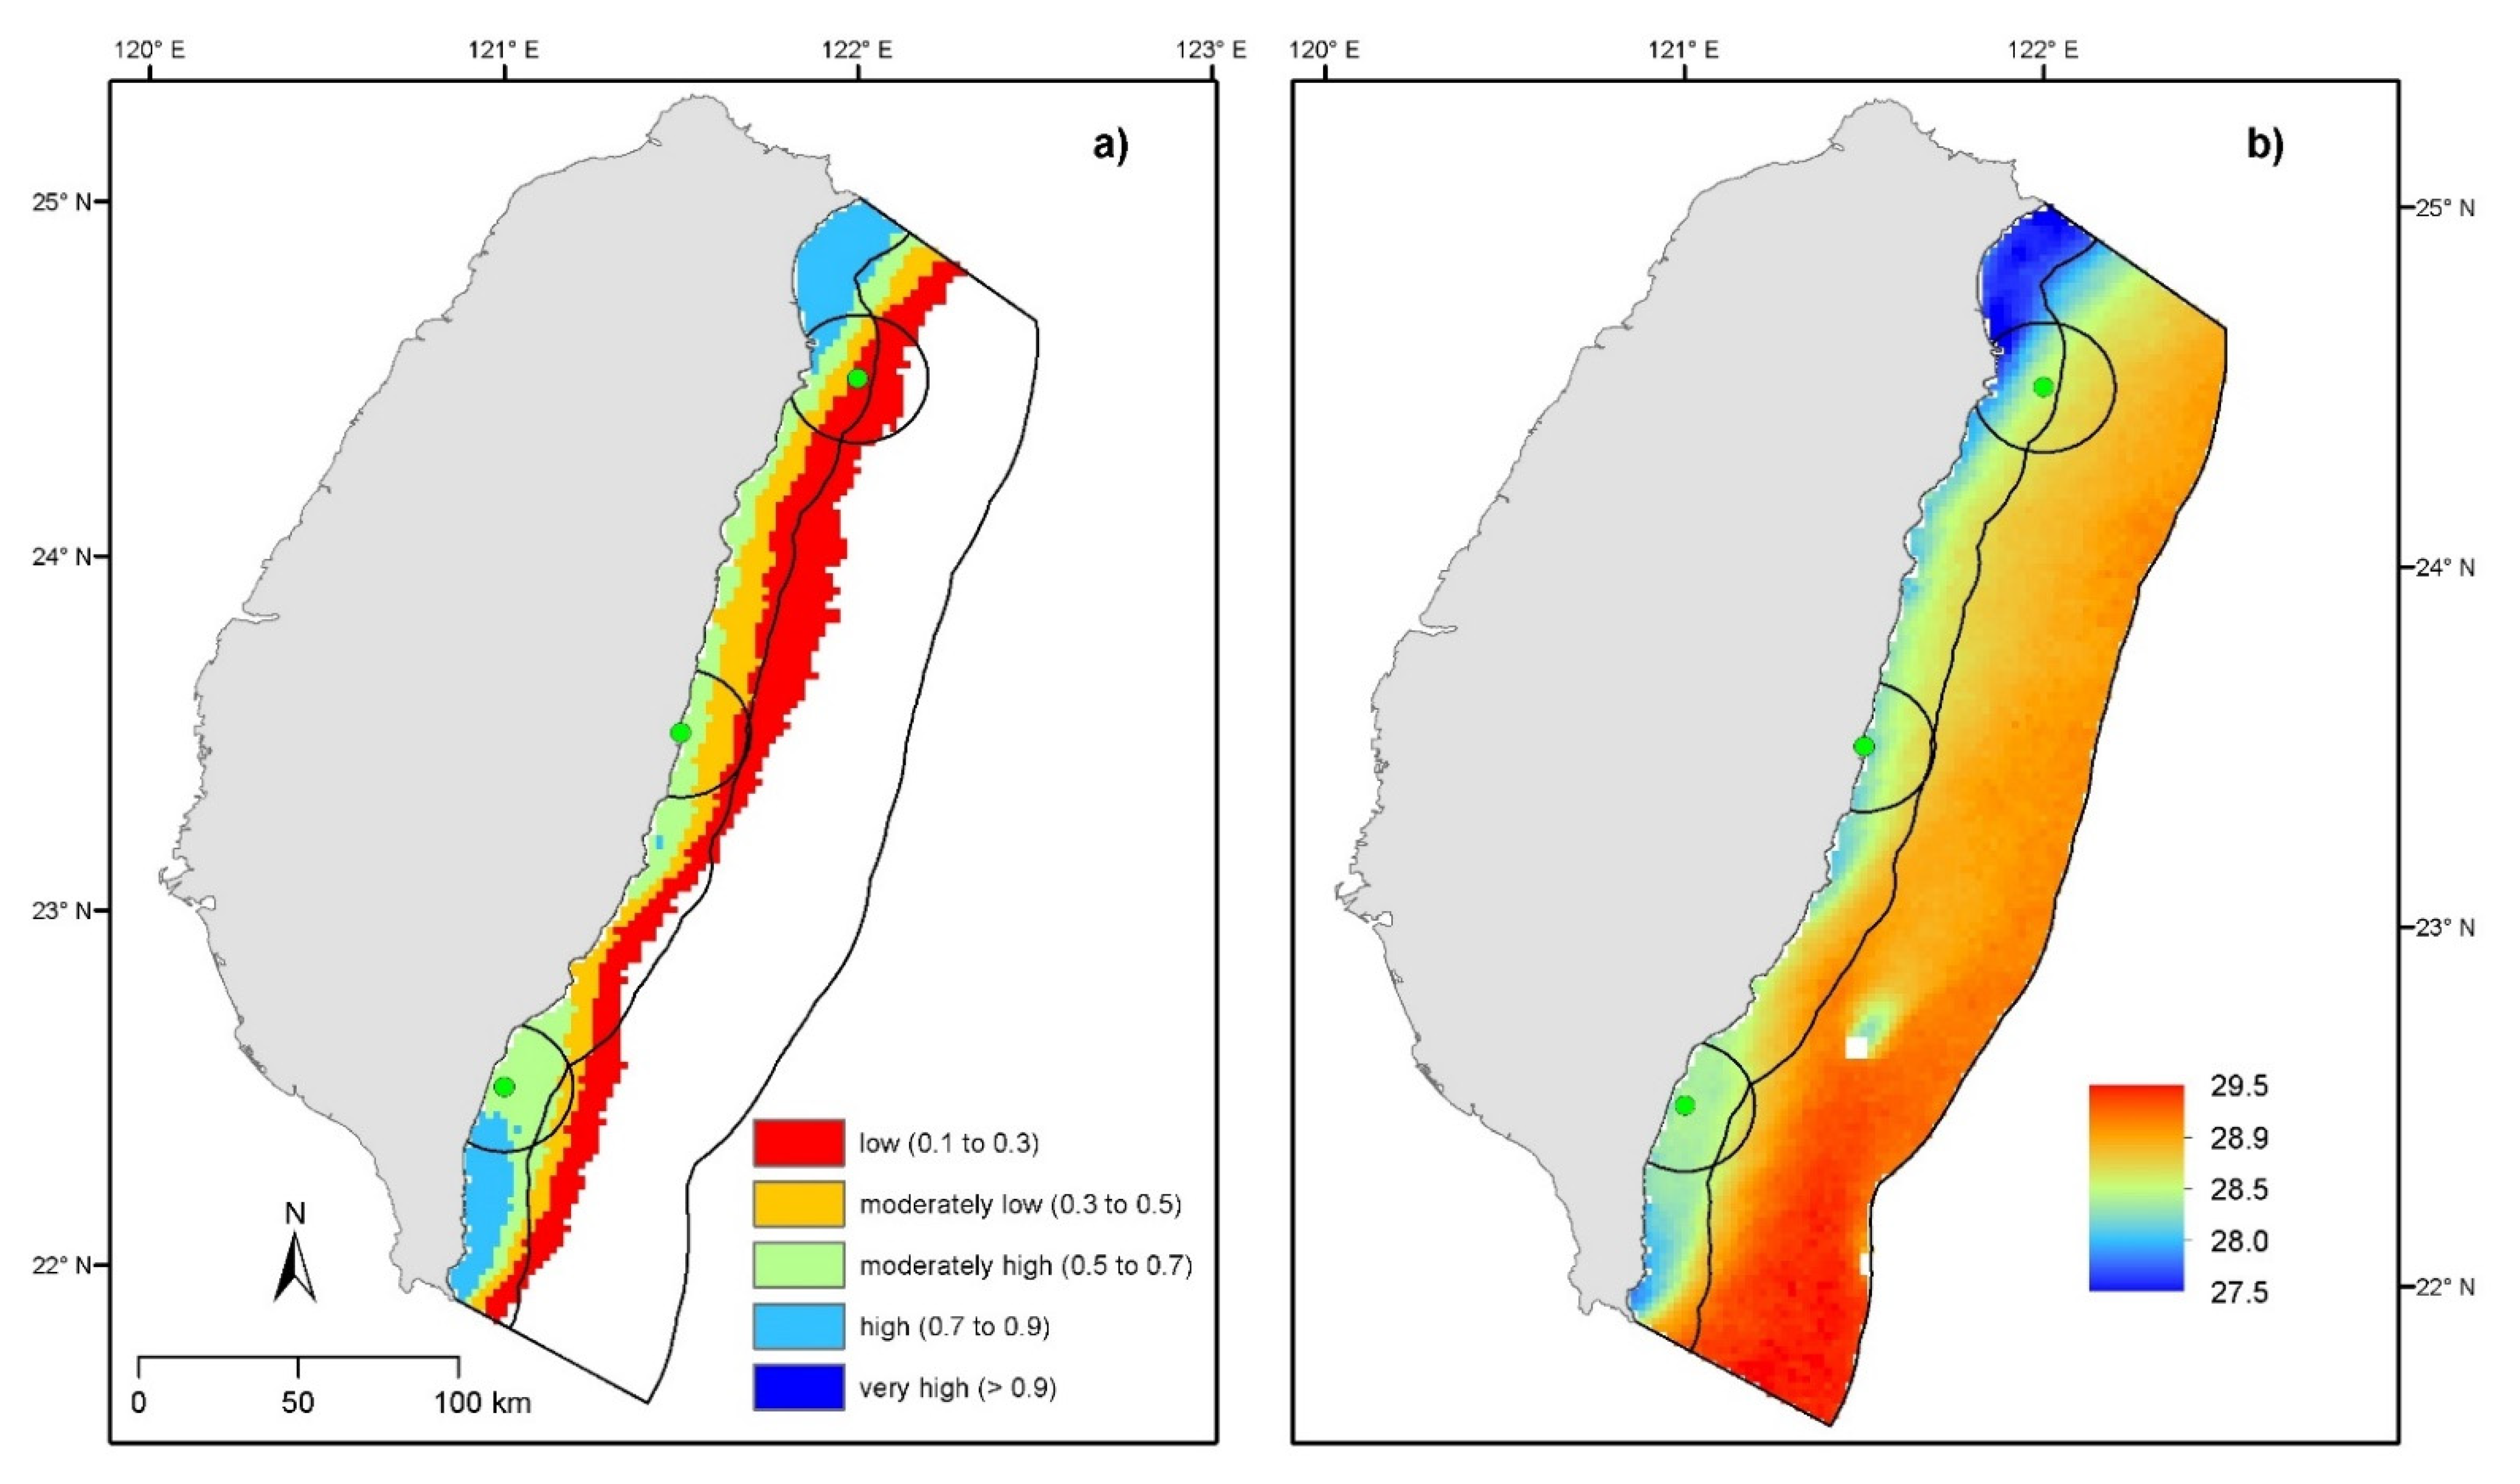
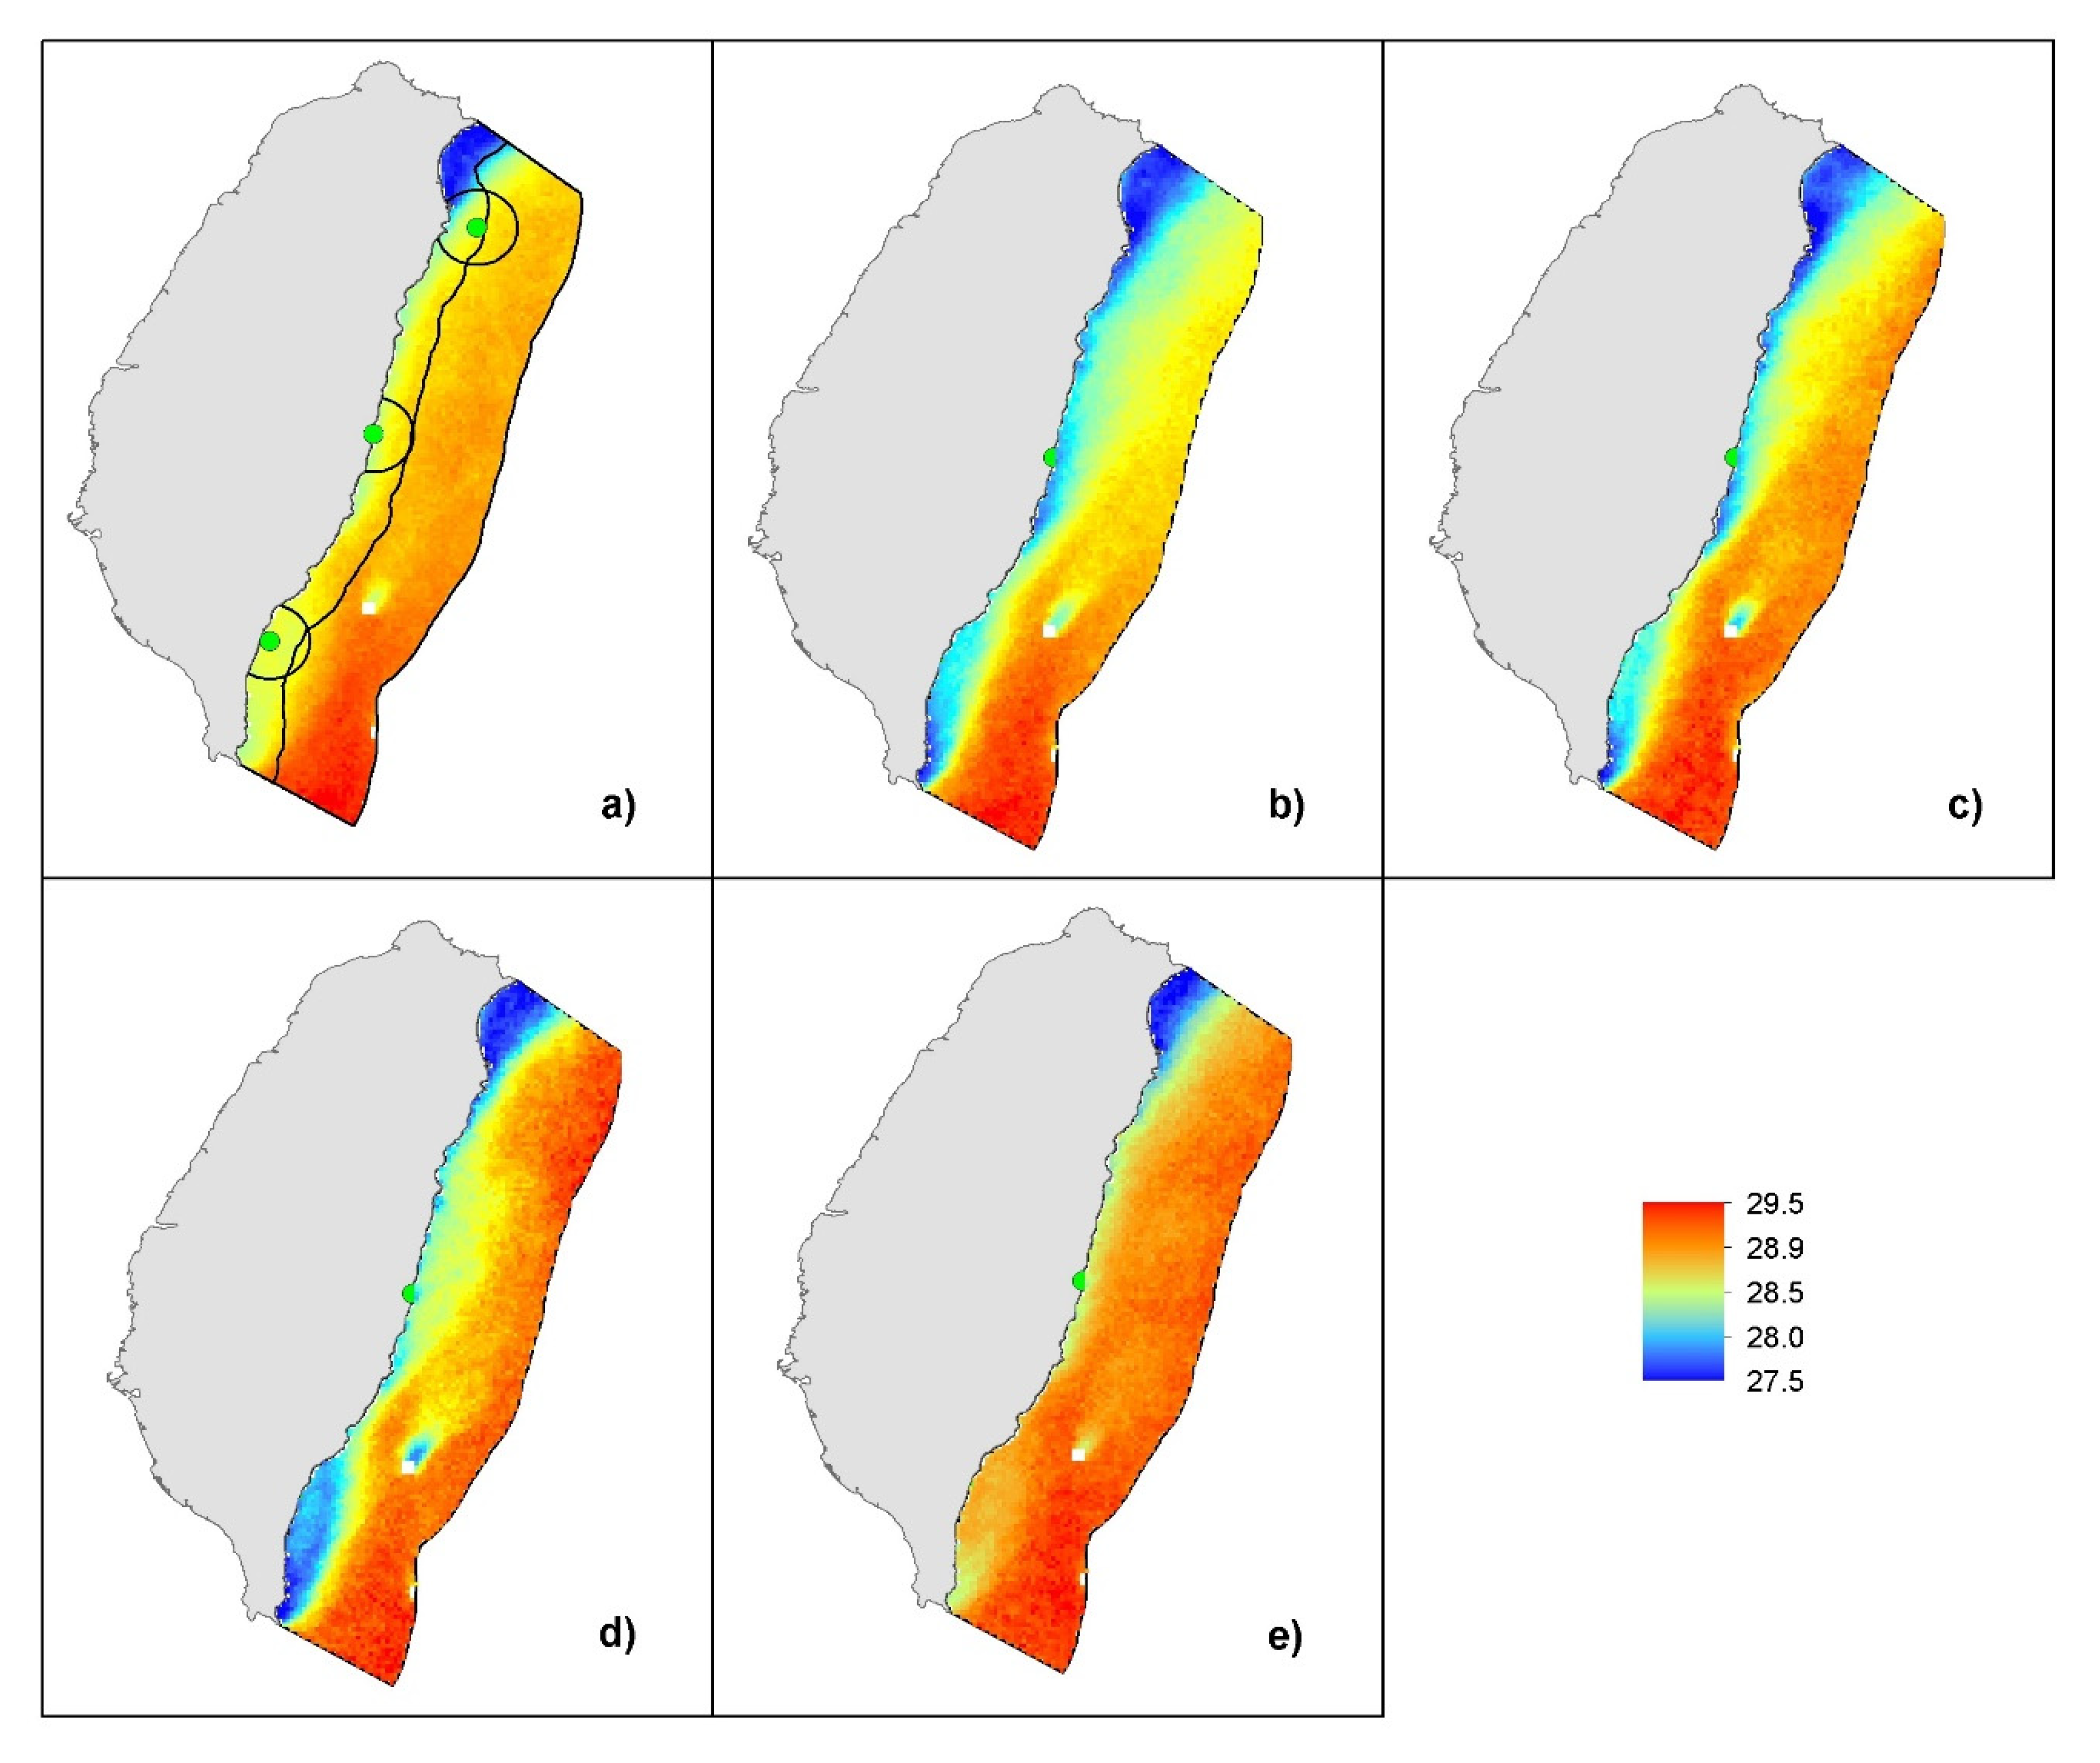
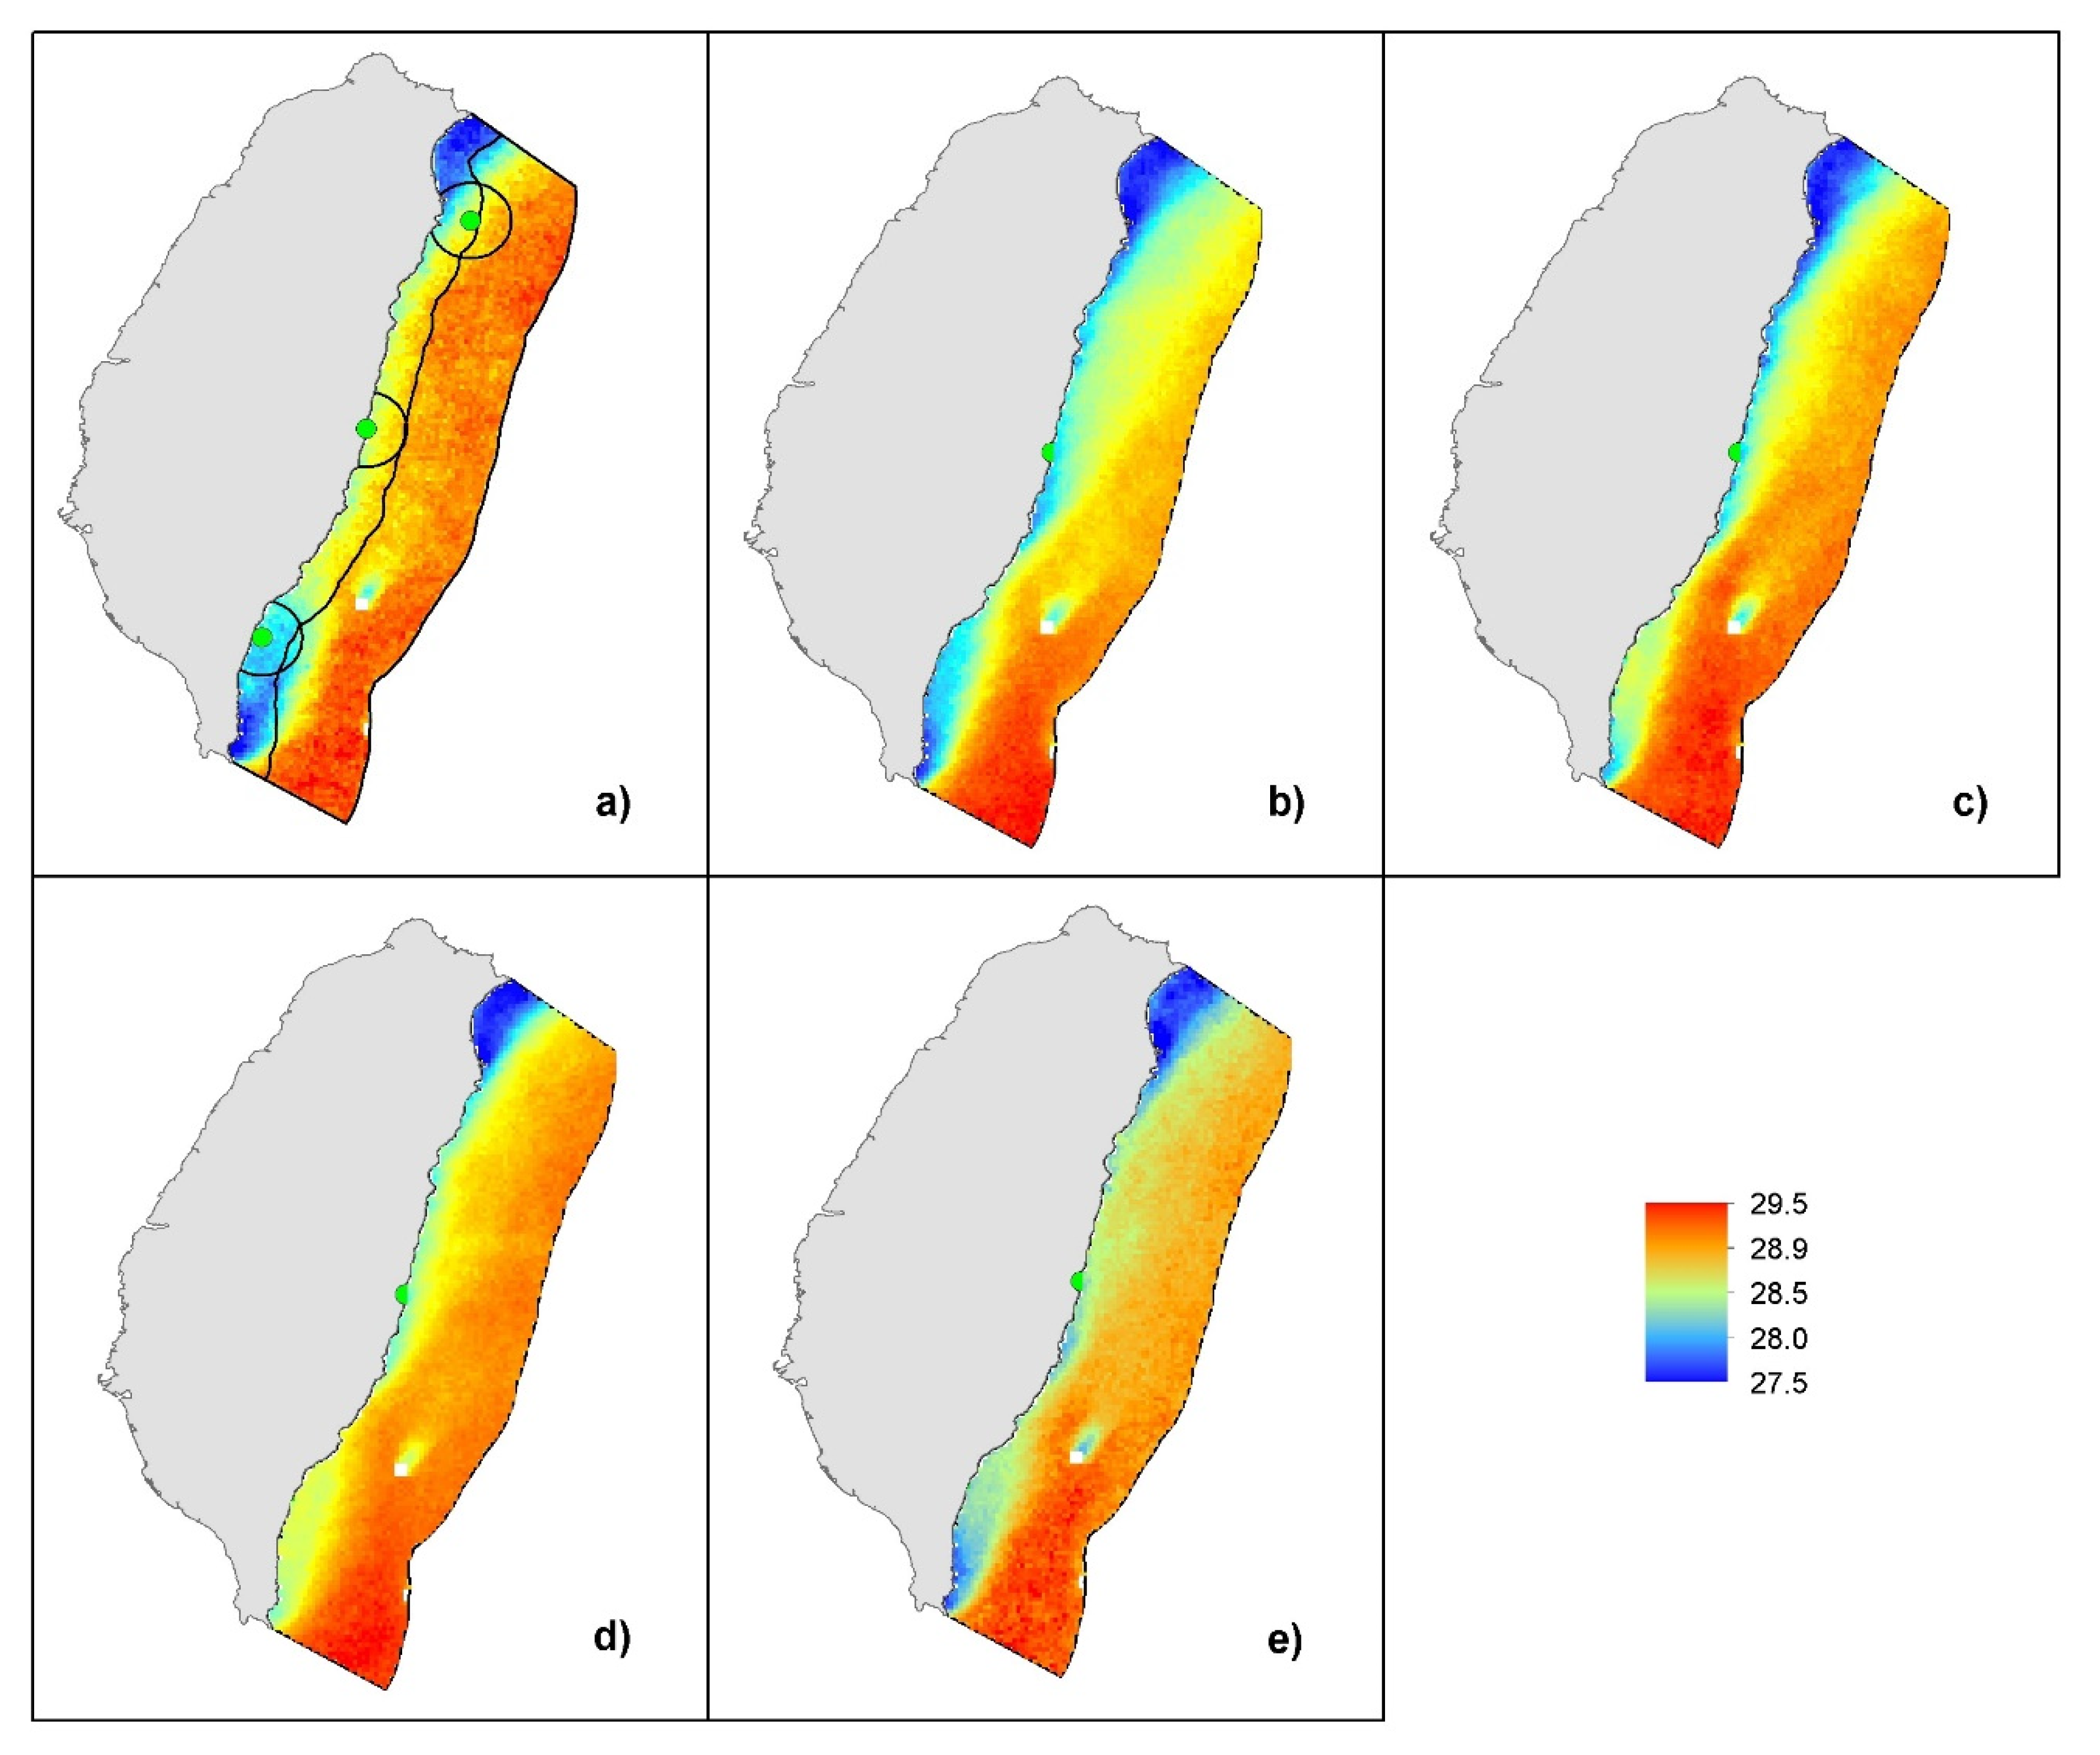
3.2. Upwelling Maps
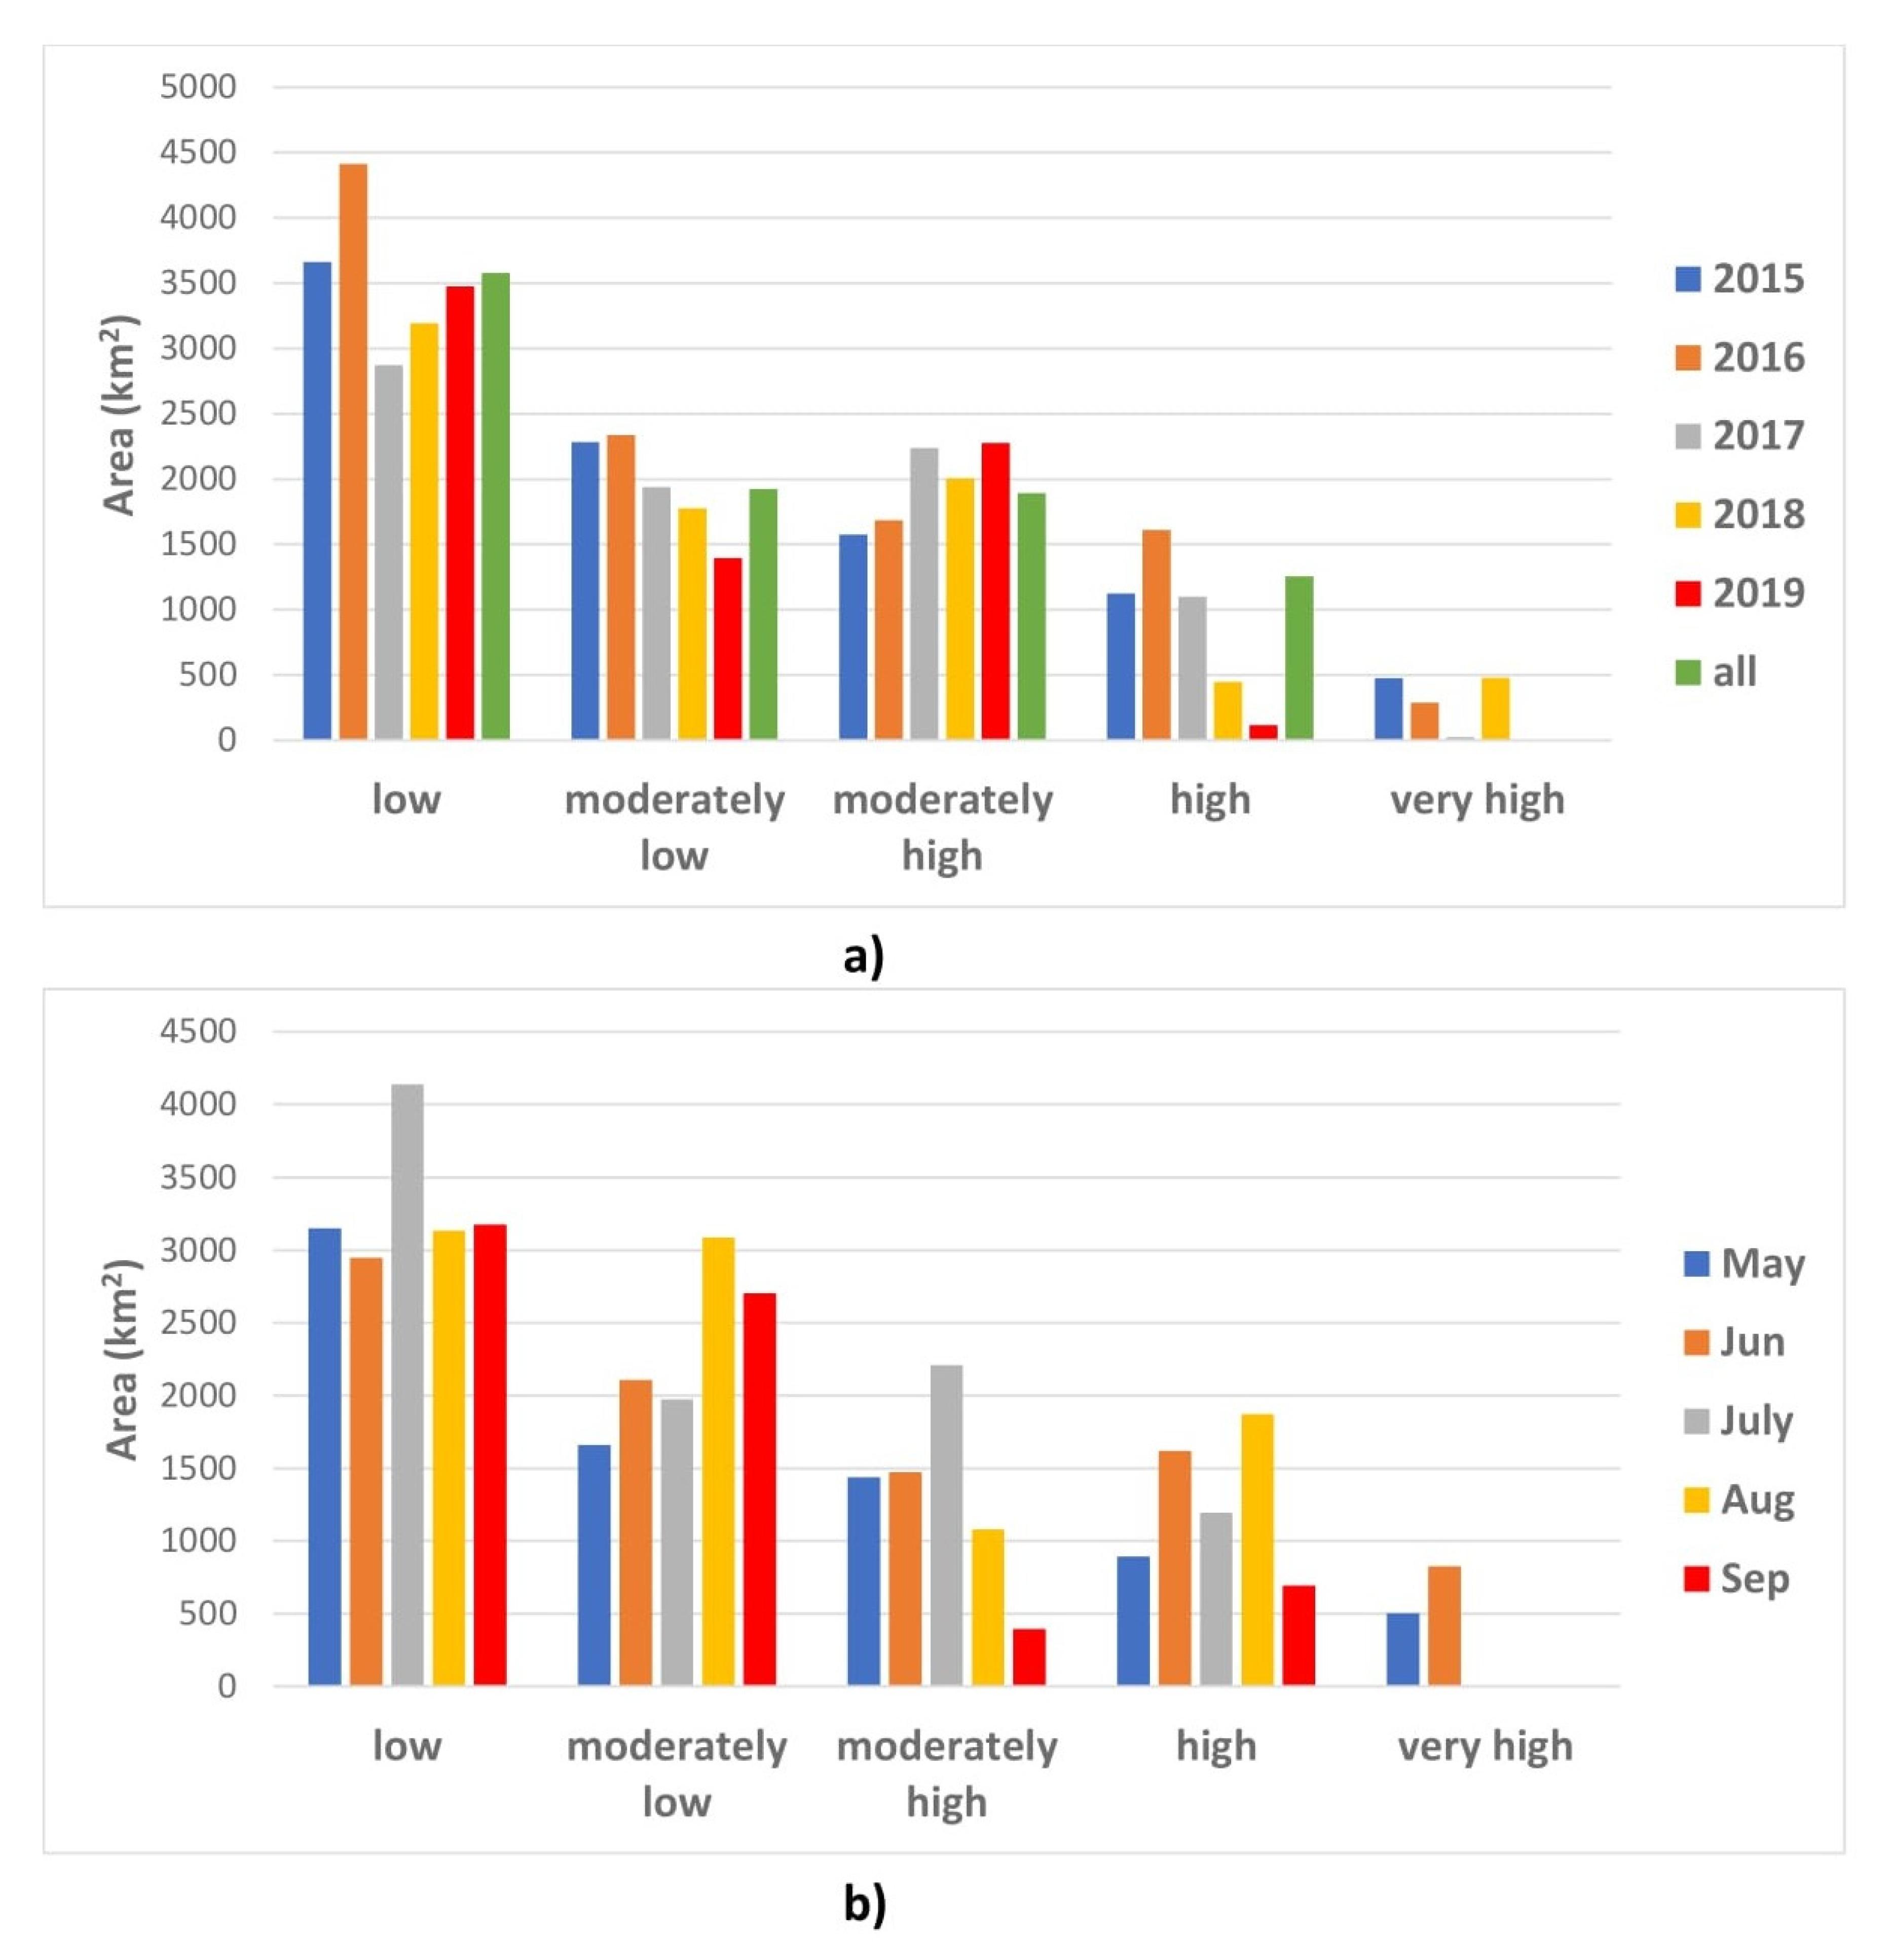
3.3. Upwelling Characteristics
4. Discussion
5. Conclusions
- Wind-driven upwelling occurs along the entire Taiwan east coast during the summer monsoon season;
- There are three board upwelling centers along the Taiwan east coast: north, central, and south;
- The upwelling around the northern center has the longest upwelling season, lasting from May to September;
- The upwelling extents are larger between June and August during the height of the summer monsoon.
Author Contributions
Funding
Data Availability Statement
Acknowledgments
Conflicts of Interest
References
- McGregor, H.V.; Dima, M.; Fischer, H.W.; Mulitza, S. Rapid 20th-century increase in coastal upwelling off Northwest Africa. Science 2007, 315, 637–639. [Google Scholar] [CrossRef] [PubMed]
- Wang, D.; Gouhier, T.C.; Menge, B.A.; Ganguly, A.R. Intensification and spatial homogenization of coastal upwelling under climate change. Nature 2015, 518, 390–394. [Google Scholar] [CrossRef] [PubMed]
- Hu, J.; Wang, X.H. Progress on upwelling studies in the China seas. Rev. Geophys. 2016, 54, 653–673. [Google Scholar] [CrossRef]
- Huang, Z.; Wang, X.H. Mapping the spatial and temporal variability of the upwelling systems of the Australian southeastern coast using 14-year of MODIS data. Remote Sens. Environ. 2019, 227, 90–109. [Google Scholar] [CrossRef]
- Kampf, J.; Doubell, M.; Griffin, D.; Matthews, R.L.; Ward, T.M. Evidence of a large seasonal coastal upwelling system along the southern shelf of Australia. Geophys. Res. Lett. 2004, 31, L09310. [Google Scholar] [CrossRef]
- Varela, R.; Alvarez, I.; Santos, F.; de Castro, M.; Gomez-Gesteira, M. Has upwelling strengthened along worldwide coasts over 1982–2010? Sci. Rep. 2015, 5, 10016. [Google Scholar] [CrossRef]
- Chang, Y.L.; Wu, C.R.; Oey, L.Y. Bimodal behavior of the seasonal upwelling off the northeastern coast of Taiwan. J. Geophys. Res. Ocean. 2009, 114, C03027. [Google Scholar] [CrossRef]
- Chang, Y.L.; Oey, L.Y.; Wu, C.R.; Lu, H.F. Why are there upwelling on the northern shelf of Taiwan under northeasterly winds? J. Phys. Oceanogr. 2010, 40, 1405–1417. [Google Scholar] [CrossRef]
- Chung, H.W.; Liu, C.C. Spatiotemporal variation of cold eddies in the upwelling zone off Northeastern Taiwan revealed by the Geostationary satellite imagery of ocean color and sea surface temperature. Sustainability 2019, 11, 6979. [Google Scholar] [CrossRef]
- Yin, W.; Huang, D. Short-term variations in the surface upwelling off Northeastern Taiwan observed via satellite data. J. Geophys. Res. Ocean. 2019, 124, 939–954. [Google Scholar] [CrossRef]
- Lyu, K.W.; Hu, J.Y.; Yang, X.Y. Spatial patterns in seasonal variability of sea surface wind over the South China Sea and its adjacent ocean. J. Trop. Oceanogr. 2012, 31, 41–47, (In Chinese with English Abstract). [Google Scholar]
- Hu, J.; Kawamura, H.; Hong, H.; Pan, W. A review of research on the upwelling in the Taiwan Strait. Bull. Mar. Sci. 2003, 73, 605–628. [Google Scholar]
- Jiang, Y.; Chai, F.; Wan, Z.; Zhang, X.; Hong, H. Characteristics and mechanisms of the upwelling in the southern Taiwan Strait: A three-dimensional numerical model study. J. Oceanogr. 2011, 67, 699–708. [Google Scholar] [CrossRef]
- Chao, S.Y. Circulation of the East China Sea, a numerical study. J. Oceanogr. 1991, 42, 273–295. [Google Scholar]
- McClatchie, S.; Middleton, J.F.; Ward, T.M. Water mass analysis and alongshore variation in upwelling intensity in the eastern Great Australian Bight. J. Geophys. Res. Ocean. 2006, 111, C08007. [Google Scholar] [CrossRef]
- Roughan, M.; Middleton, J.H. A comparison of observed upwelling mechanisms off the east coast of Australia. Cont. Shelf Res. 2002, 22, 2551–2572. [Google Scholar] [CrossRef]
- Bessho, K.; Date, K.; Hayashi, M.; Ikeda, A.; Imai, T.; Inoue, H.; Kumagai, Y.; Miyakawa, T.; Murata, H.; Ohno, T.; et al. An introduction to Himawari-8/9—Japan’s new-generation geostationary meteorological satellites. J. Meteorol. Soc. Jpn. Ser. II 2016, 94, 151–183. [Google Scholar]
- Kurihara, Y.; Murakami, H.; Kachi, M. Sea surface temperature from the new Japanese geostationary meteorological Himawari-8 satellite. Geophys. Res. Lett. 2016, 43, 1234–1240. [Google Scholar] [CrossRef]
- Hu, J.; Kawamura, H.; Li, C.; Hong, H.; Jiang, Y. Review on current and seawater volume transport through the Taiwan Strait. J. Oceanogr. 2010, 66, 591–610. [Google Scholar] [CrossRef]
- Li, G.; Wan, R.; Li, B.; Wei, X.; Tang, J. Using remote sensing for study of temperature and salinity of surface sea water surrounding Taiwan. Mar. Geol. Front. 2017, 33, 41–46, (In Chinese with English Abstract). [Google Scholar]
- Saha, S.; Moorthi, S.; Wu, X.; Wang, J.; Nadiga, S.; Tripp, P.; Behringer, D.; Hou, Y.T.; Chuang, H.Y.; Iredell, M.; et al. The NCEP Climate Forecast System Version 2. J. Clim. 2014, 27, 2185–2208. [Google Scholar] [CrossRef]
- Toba, Y.; Iida, N.; Kawamura, H.; Ebuchi, N.; Jones, I.S.F. Wave dependence of sea surface wind stress. J. Phys. Oceanogr. 1990, 20, 705–721. [Google Scholar] [CrossRef]
- Dabuleviciene, T.; Kozlov, I.; Vaiciute, D.; Dailidiene, I. Remote sensing of coastal upwelling in the south-eastern Baltic Sea: Statistical properties and implications for the coastal environment. Remote Sens. 2018, 10, 1752. [Google Scholar] [CrossRef]
- Gill, P.C.; Morrice, M.G.; Page, B.; Pirzl, R.; Levings, A.H.; Coyne, M. Blue whale habitat selection and within-season distribution in a regional upwelling system off southern Australia. Mar. Ecol. Prog. Ser. 2011, 421, 243–263. [Google Scholar] [CrossRef]
- Oke, P.R.; Griffin, D. The cold-core eddy and strong upwelling off the coast of New South Wales in early 2007. Deep-Sea Res. II 2011, 58, 574–591. [Google Scholar] [CrossRef]
- Oke, P.R.; Middleton, J.H. Nutrient enrichment off Port Stephens: The role of the East Australian Current. Cont. Shelf Res. 2001, 21, 587–606. [Google Scholar] [CrossRef]
- Roughan, M.; Oke, P.R.; Middleton, J.F. A modelling study of the climatological current field and the trajectories of upwelled particles in the east Australian current. J. Phys. Oceanogr. 2003, 33, 2551–2564. [Google Scholar] [CrossRef]
- Willis, J.; Hobday, A.J. Influence of upwelling on movement of southern bluefin tuna (Thunnus maccoyii) in the Great Australian Bight. Mar. Freshw. Res. 2007, 58, 699–708. [Google Scholar] [CrossRef]
- Weiss, A.D. Topographic Position and Landforms Analysis. In Proceedings of the ESRI International User Conference, San Diego, CA, USA, 9–13 July 2001. [Google Scholar]
- Huang, Z.; Feng, M. Remotely sensed spatial and temporal variability of the Leeuwin Current using MODIS data. Remote Sens. Environ. 2015, 166, 214–232. [Google Scholar] [CrossRef]
- Xie, S.; Huang, Z.; Wang, X. Quantitative mapping of the East Australian Current encroachment using time series Himawari-8 sea surface temperature data. J. Geophys. Res. Ocean. 2020, 125, e2019JC015647. [Google Scholar] [CrossRef]
- Murakami, H. Ocean color estimation by Himawari-8/AHI. In Proceedings of the SPIE 9878, Remote Sensing of the Oceans and Inland Waters: Techniques, Applications, and Challenges, New Delhi, India, 4–7 April 2016; Curran Associates, Inc.: Red Hook, NY, USA, 2016; p. 987810. [Google Scholar]
- Zhang, W.Z.; Wang, H.; Chai, F.; Qiu, G. Physical drivers of chlorophyll variability in the open South China Sea. J. Geophys. Res. Ocean. 2016, 121, 7123–7140. [Google Scholar] [CrossRef]
- Caruso, M.J.; Gawarkiewicz, G.G.; Beardsley, R.C. Interannual variability of the Kuroshio intrusion in the South China Sea. J. Oceanogr. 2006, 62, 559–575. [Google Scholar] [CrossRef]
- Hu, J.; Kawamura, H.; Hong, H.; Qi, Y. A review on the currents in the South China Sea: Seasonal circulation, South China Sea Warm Current and Kuroshio intrusion. J. Oceanogr. 2000, 56, 607–624. [Google Scholar] [CrossRef]
- Nan, F.; Xue, H.; Yu, F. Kuroshio intrusion into the South China Sea: A review. Prog. Oceanogr. 2015, 137, 314–333. [Google Scholar] [CrossRef]
- Xue, H.; Chai, F.; Pettigrew, N.; Xu, D.; Shi, M.; Xu, J. Kuroshio intrusion and the circulation in the South China Sea. J. Geophys. Res. Ocean. 2004, 109, C02017. [Google Scholar] [CrossRef]





| Location | ID | Year | Number of Wind-Event Days | Upwelling Days | Non-Upwelling Days | UI5 1 (m2 s−1) | Mean UI (m2 s−1) | Detection Rate2 |
|---|---|---|---|---|---|---|---|---|
| North | 1 | 2015 | 18 | 16 | 2 | 18.54 | 1.36 | 88.89 |
| 2 | 7 | 8 | 0 | 14.42 | 2.19 | 100.00 | ||
| 3 | 2016 | 10 | 7 | 1 | 4.08 | 1.53 | 87.50 | |
| 4 | 5 | 2 | 1 | 3.07 | 0.61 | 66.67 | ||
| 5 | 48 | 42 | 2 | 11.82 | 1.48 | 95.45 | ||
| 6 | 12 | 12 | 0 | 7.53 | 0.85 | 100.00 | ||
| 7 | 5 | 6 | 0 | 16.68 | 3.34 | 100.00 | ||
| 8 | 2017 | 7 | 10 | 0 | 2.52 | 0.51 | 100.00 | |
| 9 | 6 | 3 | 0 | 2.71 | 0.47 | 100.00 | ||
| 10 | 8 | 8 | 0 | 5.80 | 1.06 | 100.00 | ||
| 11 | 41 | 32 | 3 | 5.12 | 1.58 | 91.43 | ||
| 12 | 16 | 16 | 0 | 3.06 | 0.85 | 100.00 | ||
| 13 | 7 | 9 | 0 | 6.68 | 1.08 | 100.00 | ||
| 14 | 14 | 14 | 1 | 5.62 | 0.86 | 93.33 | ||
| 15 | 2018 | 35 | 31 | 0 | 5.76 | 0.60 | 100.00 | |
| 16 | 13 | 11 | 1 | 7.31 | 1.08 | 91.67 | ||
| 17 | 14 | 14 | 0 | 3.27 | 1.10 | 100.00 | ||
| 18 | 37 | 21 | 6 | 2.58 | 1.12 | 77.78 | ||
| 19 | 2019 | 9 | 7 | 0 | 4.12 | 1.42 | 100.00 | |
| 20 | 14 | 11 | 3 | 5.26 | 1.01 | 78.57 | ||
| 21 | 14 | 11 | 3 | 17.08 | 1.81 | 78.57 | ||
| Centre | 1 | 2015 | 14 | 12 | 1 | 22.16 | 1.76 | 92.31 |
| 2 | 11 | 2 | 6 | 3.56 | 0.45 | 25.00 | ||
| 3 | 2016 | 6 | 6 | 1 | 6.55 | 1.28 | 85.71 | |
| 4 | 48 | 38 | 1 | 5.35 | 0.09 | 97.44 | ||
| 5 | 2017 | 8 | 8 | 0 | 4.38 | 0.98 | 100.00 | |
| 6 | 63 | 46 | 5 | 2.24 | 0.38 | 90.20 | ||
| 7 | 5 | 5 | 3 | 2.89 | 0.58 | 62.50 | ||
| 8 | 2018 | 10 | 5 | 6 | 2.83 | 0.23 | 45.45 | |
| 9 | 21 | 19 | 3 | 2.47 | 0.46 | 86.36 | ||
| 10 | 12 | 9 | 2 | 9.10 | 1.04 | 81.82 | ||
| 11 | 16 | 9 | 0 | 2.02 | 1.14 | 100.00 | ||
| 12 | 2019 | 5 | 6 | 2 | 3.40 | 0.68 | 75.00 | |
| 13 | 17 | 13 | 2 | 2.08 | 0.64 | 86.67 | ||
| 14 | 9 | 5 | 5 | 3.78 | 0.46 | 50.00 | ||
| South | 1 | 2015 | 21 | 14 | 1 | 10.02 | 1.34 | 93.33 |
| 2 | 11 | 7 | 0 | 27.78 | 3.15 | 100.00 | ||
| 3 | 10 | 5 | 1 | 5.98 | 1.41 | 83.33 | ||
| 4 | 2016 | 34 | 25 | 6 | 3.53 | 0.94 | 80.65 | |
| 5 | 16 | 15 | 0 | 22.17 | 1.87 | 100.00 | ||
| 6 | 6 | 6 | 0 | 8.58 | 1.44 | 100.00 | ||
| 7 | 2017 | 27 | 20 | 2 | 9.26 | 1.30 | 90.91 | |
| 8 | 19 | 17 | 0 | 22.61 | 1.84 | 100.00 | ||
| 9 | 2018 | 8 | 7 | 0 | 14.60 | 2.22 | 100.00 | |
| 10 | 7 | 4 | 0 | 11.51 | 2.06 | 100.00 | ||
| 11 | 26 | 11 | 3 | 2.91 | 1.21 | 78.57 | ||
| 12 | 2019 | 6 | 4 | 3 | 2.46 | 0.50 | 57.14 | |
| 13 | 58 | 42 | 3 | 4.23 | 0.92 | 93.33 | ||
| 14 | 11 | 4 | 2 | 14.78 | 2.07 | 66.67 | ||
| 15 | 5 | 4 | 3 | 2.88 | 0.58 | 57.14 |
| Location | Number of Wind Events | Number of Wind-Event Days | Mean (Median) UI (m2 s−1) | Upwelling Days | Non-Upwelling Days | Uncertainty Days |
|---|---|---|---|---|---|---|
| North | 21 | 340 | 1.21 (0.80) | 291 | 23 | 89 |
| Central | 14 | 245 | 0.56 (0.40) | 183 | 37 | 67 |
| South | 15 | 265 | 1.37 (0.99) | 185 | 24 | 101 |
Publisher’s Note: MDPI stays neutral with regard to jurisdictional claims in published maps and institutional affiliations. |
© 2021 by the authors. Licensee MDPI, Basel, Switzerland. This article is an open access article distributed under the terms and conditions of the Creative Commons Attribution (CC BY) license (http://creativecommons.org/licenses/by/4.0/).
Share and Cite
Huang, Z.; Hu, J.; Shi, W. Mapping the Coastal Upwelling East of Taiwan Using Geostationary Satellite Data. Remote Sens. 2021, 13, 170. https://doi.org/10.3390/rs13020170
Huang Z, Hu J, Shi W. Mapping the Coastal Upwelling East of Taiwan Using Geostationary Satellite Data. Remote Sensing. 2021; 13(2):170. https://doi.org/10.3390/rs13020170
Chicago/Turabian StyleHuang, Zhi, Jianyu Hu, and Weian Shi. 2021. "Mapping the Coastal Upwelling East of Taiwan Using Geostationary Satellite Data" Remote Sensing 13, no. 2: 170. https://doi.org/10.3390/rs13020170
APA StyleHuang, Z., Hu, J., & Shi, W. (2021). Mapping the Coastal Upwelling East of Taiwan Using Geostationary Satellite Data. Remote Sensing, 13(2), 170. https://doi.org/10.3390/rs13020170


